Abstract
Global warming and urban heat island effects negatively impact the development of urban thermal environments, making them very uncomfortable to live in. Green space plays an essential role in controlling and improving air pollution, regulating the microclimate, and enforcing compliance with public health requirements. Therefore, this study explored the relationship between green space and thermal comfort in the historical neighborhood of Dazhalan in Beijing through questionnaires, observational interviews, and numerical simulations. The current situation of the microclimate environment in the green space of the block was observed first. Then, the microclimate environment was simulated by the ENVI-met 5.6 software. The thermal comfort of the three types of space, such as enclosed space, strip space, and corner space, was also evaluated to explore the coupling relationship between different green space elements and microclimate evaluation factors. It was found that the thermal comfort PET had a positive correlation with the sky openness SVF. The green space morphology was quantitatively measured, and it was found that the thermal comfort PET had a negative correlation with the three-dimensional green quantity of green space. The paper developed managing strategies for optimizing the layout and construction mode of the green space. The ultimate goal was to rationally match the greening planting, improve the pavement of the underlying surface of the block, and optimize the design of the internal space topography.
1. Introduction
The development requirements of “continuously improving environmental quality and actively responding to climate change” were raised in the 14th Five-Year Plan of the People’s Republic of China. Since then, the construction of climate-friendly cities to improve residents’ quality of life has become an important goal of urban construction. Moreover, the impact of urban built environments on human health has become a heated issue in the current research [1]. Recently, the urban thermal environment has been impacted by global warming and the heat island effect. In particular, during summer, the high heat and hot weather have a significant impact on people’s lives and work, and people living in the historical blocks of the old city are impacted the most. The City of Beijing, as a historical and cultural district, is an important component of urban space in China. However, it also encounters many environmental issues, such as less public space, low landscape quality, insufficient per capita green area, and small and scattered green areas [2]. Therefore, with people’s living conditions in consideration, it is important to investigate the influence of different green space environments on microclimate comfort. In this study, the Dashilar block was studied as a case study to improve the quality of green space environment and improve microclimate comfort [3].
The microclimate and comfort have been studied by many researchers worldwide [4]. The research focused on the exploration of the integrity of space inside and outside [5]. Moreover, the research includes urban heat island effect, microclimate numerical simulation, climate adaptability design, outdoor thermal comfort, ecological service system, etc. [6,7,8,9,10]. Recently, researchers in China have started to pay close attention to microclimate and comfort as well. The researcher started on large-scale urban spatial forms, urban green space systems, and building monomers and building groups [11].
Much work on urban green space and microclimate adaptability has been conducted [12], and green spaces have been found to have a positive impact on improving the microclimate and optimizing the living environment. Field measurement or numerical models have been used often [13].
Middel employed a combination of fixed measurements and questionnaires to compare the shading effects of photovoltaic panels and plants in green spaces and to conduct a crowd thermal sensation survey [14]. Klemm utilized a mobile observation method to conduct microclimate measurements and to analyze the coupling relationship between different greening coverage in street spaces and crowd thermal comfort [15]. Liu Binyi employed fixed measurements to gather data on microclimate factors within the landscape space of a residential area in Shanghai and collected subjects’ comfort indicators of the surrounding landscape environment through a questionnaire, with the aim of exploring the relationship between the microclimate physical environment of the landscape space, users’ physiological indicators, and psychological perceptions [16].
The primary software utilized for the simulation of outdoor microclimate environments includes RayMan, ENVI-met, Fluent, and PHOENICS, among others [17]. Morakinyo et al. employed the ENVI-met software to simulate the impact of diverse tree configurations, planting styles, and wind directions on the microclimate and thermal comfort in a street canyon [18]. Yang Yang employed the ENVI-met software to simulate and analyze the microclimate of the neighborhood space. The results demonstrated that the four distinct types of areas, namely, alley space, courtyard space, shaded space, and paved open space, exert varying influences on the neighborhood microclimate environment [19]. Xiong Yao measured meteorological factors and sky view factors in different spaces and calculated the physiologically equivalent temperature (PET) using the RayMan model to explore the correlation between microclimate factors and human thermal comfort [20]. With the advancement and improvement of numerical simulation technology, an increasing number of researchers have begun to integrate field measurements with numerical simulation for research purposes.
The current research covers three aspects: (a) Exploring the main influencing factors of outdoor thermal comfort [21], Cohen et al. investigated the microclimatic comfort conditions in an urban park in Tel Aviv, Israel, under varying degrees of greenery during both summer and winter. The findings indicated that the mean radiant temperature was the primary meteorological factor influencing outdoor thermal comfort [22]. (b) The improvement measures of the green space environment on outdoor thermal comfort [23]. LIM HUIMIN VANESSA investigated methods to enhance outdoor thermal comfort through empirical observations and simulations, focusing on outdoor public spaces in Singaporean settlements as case studies [24]. Wu Renwu conducted an analysis of the microclimate change characteristics of different bamboo plant communities, employing the discomfort index to evaluate the impact of these communities on human thermal comfort. The findings revealed that tree-like bamboo plant communities play a more pronounced role in cooling and humidifying than other reference points [25]. (c) Constructing outdoor thermal comfort evaluation standards [10]. With the help of the RayMan model for the calculation of physiological equivalent temperature PET values, Yi-Qiang Xiao established the correlation between human thermal sensation and thermal environment indicators in the outdoor space of Lingnan Garden [26]. Most of the existing research results were based on large-scale space [27,28], and most of them focused on analyzing influencing factors at a single level. It resulted in a lack of in-depth research and multi-perspective evaluation of small-scale green space environments in historical blocks.
Therefore, this paper case studied the green space of the Beijing Dashilar Historic District. Firstly, the current condition of the microclimate environment of the green space in the block was observed. Secondly, the microclimate environment simulation and thermal comfort evaluation were conducted using the three types of space through ENVI-met software being: enclosed, banded, and corner space. The coupling relationship between different green space elements and microclimate evaluation factors was then investigated and discussed, and the correlation between green space evaluation factors and thermal comfort was explored. Finally, the optimization and promotion strategy of green space in the Dashilar Historic District based on microclimate adaptability was proposed based on the results of the microclimate comfort of green space in the district.
2. Materials and Methods
2.1. Research Area
The city of Beijing is located in the northern part of the North China Plain. It is bordered by the west of the Xishan Mountains, the north of the Yanshan Mountains, and the vast plains facing the Bohai Bay to the east and south. Overall, the terrain slopes from high in the northwest to low in the southeast. It has special natural characteristics and geographical environment with a typical warm, humid zone. Moreover, it has semi-humid and semi-arid continental monsoons in the cold regions [29]. The seasonal variation of Beijing is obvious. It is windy in springs, and the temperature difference between daytime and nighttime is large. The temperature rises rapidly during daytime. Weather in summer is muggy and rainy. In particular, the rain in summer accounts for 70% of the annual precipitation. The autumn climate is pleasant, and the air quality is high. Finally, it is cold and dry in winter, with limited sunshine [30]. The hot season usually lasts from mid-May to mid-to-late September, with daily average temperatures exceeding 25 °C [31].
The Dashilan Historic District is located on the southern side of the Qianmen Gate in Beijing’s Xicheng District. It is adjacent to Qi’anmen Street in the east, South Xinhua Street in the west, Zhushikou West Street in the south, and Qi’anmen West Street in the north. The total land area is 1.26 square kilometers, and it has a geographically advantageous location. It is not only the intersection of capital culture but also retains the traditional historical features and the texture of streets and alleys. The green space of the Dashilar Historic District includes the space in front of the door, on the street, the community micro garden, and the open space with public communication and transportation functions (see Figure 1). The green space distribution is more dispersed, and the patch area is smaller. The community micro-parks, such as Moon Bay Park in the northeast corner, Jingyun Park near the street in the southwest corner, and Baihua Garden in Cherry Alley, are slightly larger. The other forms of green space are in various micro scales, such as roadside trees, streetside greenery, front yard greenery, and courtyard greenery. However, the connectivity of green space patches in the Dashilar block is low, and the green space in the block cannot be planned as a whole. This study focuses on analyzing the spatial location and layout pattern of the block in which the research site is located; therefore, based on the analysis of the relative spatial relationship and layout pattern of the block buildings, public green spaces, and urban roads on the base of the map, the characteristics of the green space type of the Dazhalan Historic Block are roughly summarized into three types, namely, the enclosed green space, the ribbon green space, and the street corner green space.

Figure 1.
Status classification of green space in Dashilar Historic District.
This study used a professional instrument designed and developed by Beijing University of Technology aligned with Beijing Meteorological Bureau requirements. The portable instrument has been used for meteorological monitoring. It has a small size and is easy to be carried around. Moreover, it provides good level of stability and reliability. The instrument measured and recorded air temperatures, levels of humidity, wind speed, and solar radiation intensity of the two following types of space from the end of August to the beginning of September 2021. The two types of green space (strip type and enclosed type) were selected based on the analysis of the current situation of mesoscale green space in Dashilar Historic District (see Figure 2). They were labeled as A and B. In order to study the effect of different influencing factors on microclimate in these green spaces, it was essential to select representative measuring points for microclimate observation according to the actual situation of internal space. Therefore, four measuring points were arranged in each measuring area (A-1, A-2, A-3, A-4; B-1, B-2, B-3, B-4). The measuring points were verified with the later microclimate simulation results as well to investigate the correlations between different green space evaluation factors and microclimate comfort levels.

Figure 2.
Spatial information summary of on-site measuring points.
Mobile observation was used as a specific measurement method. There were two researchers involved, each with a group. The mobile bracket was used to fix the measuring instrument. The measurement height was set perpendicular to 1.5 m from the ground. The researchers waited for two minutes to record for minimum of five minutes after data were stable. The data recording time interval was set to 1 min. Three groups of stable data were recorded for each measuring point. The observation period was from 8:00 to 18:00, and the observation was performed every hour. Finally, Microsoft Excel 2016 data statistics software was used to sort the on-site microclimate data measured at different measuring points to draw a line chart of air temperature change.
2.2. Questionnaire Survey
Through questionnaires and on-site investigations, the thermal sensation information of the population was directly obtained. The questionnaire survey was conducted at the same time as the fieldwork. The questionnaire included three sections. The first section was the demographic information, including the participant’s gender, age, height, weight, dress, activity type, and residence time. The second section was the participant’s subjective thermal comfort feelings, including Thermal Sensation Vote (TSV), Thermal Comfort Vote (TCV), and meteorological preference vote [31]. The final section was the thermal adaptation and landscape preference, including the improvement of the microclimate environment, the adaptive behavior in the face of thermal discomfort, and the preference for different green space types.
2.3. Envi-Met Numerical Simulation
The ENVI-met project comprehensively explored various environmental factors and simulated the physical surface–plant–air interaction in the urban environment with a spatial resolution of 0.5–10 m and a time accuracy of 10 s. It is consistent with the need for small-scale green space and microclimate studies on historical blocks [32]. The microclimate-related data obtained in this study included air temperature, relative humidity, and wind speed. According to the meteorological station data and the measured microclimate point data, the ENVI-met modeling of site A and site B was carried out using the satellite map and CAD topographic map. The grid-scale and grid resolution were set according to the size of different green space research areas. In order to ensure the accuracy of the model, the grid resolution was controlled between 1 and 3 m. The height, building material, and underlying surface material were also set in this model. Moreover, the simulation date was set the same as the actual measured date of microclimate (26 August 2021). In order to reduce the error of computer simulation, the simulation start time was set one hour earlier (from 7 a.m.). Thus, the total simulation time was normally 11 h, including the 10 h measured time period (8 a.m. to 6 p.m.). The meteorological parameters such as initial air temperature, initial relative humidity, initial wind speed, and direction were collected using the measured data of the day and the data of the official website of the meteorological bureau. Because the weather selected for the measurement date was sunny, cloudless, or less cloudy, this modeling did not consider the influence of cloudiness. All other parameters were set using the default settings of the software. The simulation modeling of this study was mainly based on the topographic map of the site and the green space drawing of the field measurement. In order to make up for the lack of field observation of the microclimate environment of the corner green space, the software simulation method was used to supplement the microclimate environment simulation of Moon Bay Park, and the site was labeled C (see Figure 3).

Figure 3.
Summary of modeling information for the survey area.
3. Results
3.1. Microclimate Measured Results
3.1.1. Temperature Measurement
The air temperature variation law of each measuring point in site A was found to be very similar to each other. The temperature rose from 8 a.m. and reached its highest at 2 p.m. After 2 p.m., it began to decrease gradually. The air temperature of each measuring point varied greatly between 12 noon and 3 p.m. It was found that the temperature difference between measuring points A-1 and A-2 was the largest. This may be because the tall trees at this point had a large three-dimensional green volume with only a small area to be exposed to the sky. The plants had a significant shading effect and reduced the influence of direct sunlight on this site space. Compared with other measuring points, measuring point A-1 fluctuated greatly when the temperature rose. It was found the heat emitted by motor vehicles in traffic flow was higher, resulting in a high peak temperature of 30.96 °C. Throughout the day, it was found that the daily average temperature of the measuring points A-2 and A-4 was smaller than that of the measuring points A-1 and A-3. The vegetation canopy density at A-2 and A-4 was found to be higher than the others, and the three-dimensional green space was significantly larger than the other measuring points, resulting in a better spatial shading effect.
The change trend of air temperature at the measuring point of B site was very similar. The temperature also increased from 9 a.m. and reached the maximum temperature at 2 p.m. The high temperature period was between 12 noon and 2 p.m. The temperatures of the four measuring points were compared, and it was found that B-4 > B-1 > B-2 > B-3 (highest to lowest). Due to the similarities among building environments around each measuring point, the green quantity of vegetation and the difference in openness (to the sky) have different microclimate environments. The temperature of site B-3 was significantly lower than that of site B-2 in the period of high solar radiation intensity after noon. This may be due to the fact that the space of site B-3 was a shaded space jointly created by trees, shrubs, and grassland, with large green coverage, high vegetation richness, and canopy density. The two three-dimensional green spaces of measuring points B-1 and B-4 were compared. It was found they did not have many differences in the open space of the sky, and the temperature of B-1 was marginally lower than that of B-4 during the measurement period. The reason for this minor difference may be that the area of the hard pavement of the main square of space B-4 was larger than B-1, resulting in B-4 having higher temperatures reflected from more sun exposure.
3.1.2. Anemometry
The wind speed effect is the most complex and most variable meteorological factor in the microclimate. The line chart of wind speed changed, as the wind speed change trend of the four measuring points was very different. The diurnal variation of wind speed at the measuring point A-1 fluctuated greatly, and the maximum value (0.89 m/s) was found between 1 and 2 p.m. It may be because A-1 was located at the entrance of the inclined street, and the space is relatively open. Moreover, the building height was low, so the airflow entered the space with a high wind speed. The wind speed of the B-4 main square space and B-1 secondary square space was significantly higher than that of the other two measuring points. The difference in green space structure might also have a greater impact on the wind environment of the site. In detail, the wind speed of the measuring point with open and wide space was significantly higher than that of other measuring points covered by vegetation. The spatial structure can accelerate or hinder the wind speed, which affects the thermal comfort of the human body to a certain extent.
3.1.3. Relative Humidity Measurement
The relative humidity change trend of each measuring point in site A was opposite to the change in air temperature, and the overall distribution is U-shaped. The relative humidity was higher in the morning and evening and lower at noon. The maximum humidity level of each measuring point was around 8 a.m., and the maximum value was between 50% RH and 65% RH. The minimum relative humidity time was between 1 and 2 p.m., and the minimum value was between 30% RH and 50% RH. After 2 p.m., the overall humidity showed a rising trend. The humidity of measuring point A-2 was the highest (52.28% RH). The humidity of measuring point A-3 was the lowest (31.20% RH). The current situations of green space at these two points were compared, and it was found that the three-dimensional green amount of vegetation at the measuring point A-2 was greater than that of A-3, and the SVF value of sky openness was significantly smaller than that of A-3. It indicated that the space where the point was located had a high degree of green coverage, and vegetation played a critical role in improving the humidification of green space.
The relative humidity variation of each measuring point in site B was found to be similar, showing a U-shaped distribution trend as well. It was low at noon in the morning and evening. The maximum peak of humidity also appeared at 8 a.m., and the minimum humidity time appeared at 2 p.m. In the high temperature period between 12 noon and 2 p.m., it was found that the humidity of the measuring points B-2 and B-3 was significantly higher than that of B-1 and B-4. It was because the vegetation enclosure degree of B-2 and B-3 was high, and the three-dimensional green quantity of vegetation was greater than that of the other two. The hard pavement area of the two squares of B-1 and B-4 is large, and the evaporation of water in the air slows down. There was no shade space formed by vegetation or buildings, which accelerated water evaporation and led to low relative humidity.
3.2. Questionnaire Survey
A total of 363 questionnaires were administered in the study, and 357 (152 males and 205 females) valid questionnaires were collected. The thermal sensation feedback of the respondents to eight sub-measuring points in two different types of research areas was also received. The green space of the Dashilar historical block was mainly used by local residents and/or tourists. The participants included mainly middle-aged and elderly people because they had a high demand for green space. It was found that most participants felt warmer on Sites A and B. Compared with the thermal sensation self-reported results of different green space measuring points, the three-dimensional green volume of A-2, A-4, B-2, and B-3 was found to be higher, and the green space with large vegetation coverage had a larger proportion of respondents with moderate thermal sensation. Participants in the A-1, B-1, and B-4 spaces of the site indicated that their bodies felt hot. The underlying surface was the main cause, and excessive hard pavement absorbed a large amount of solar radiation, resulting in a decrease in human comfort. The feedback was consistent with the microclimate fieldwork measured results. It was also found that under the same high-temperature conditions, the overall comfort of the space population with rich vegetation structure, large three-dimensional green quantity, and small sky openness was better than that of the space without vegetation or landscape structure coverage. Moreover, the results of thermal acceptability showed many participants did not enjoy the thermal environment of site A, which was significantly greater than that of site B. The Hot Expectations poll also showed that 87% of the participants preferred a cooler environment. Sites with wide green coverage areas, large three-dimensional green volumes, and high vegetation richness with higher humidity were found to be more desirable. The participants paid much attention to greening and shading in improving the thermal environment of green space.
3.3. Thermal Comfort PET Simulation
3.3.1. Thermal Comfort Evaluation of Site A
It was found that the PET values at 8 a.m. and 6 p.m. were significantly smaller than other time periods in the day, indicating that the comfort of site A in the morning and evening was better than at other times. The internal space, however, had many hot areas, with some extremely hot areas. According to the simulation results, the value of thermal comfort index PET began to show an upward trend at 10 a.m., and the PET value reached the maximum value during the day at about 2 p.m. During this period, people’s physiological stress levels also reached strong heat stress. When the spatial thermal comfort status of Site A during the simulation period was analyzed, it was found that during the daytime, activities were less in summer, and the overall spatial thermal comfort of the site was poor. The thermal comfort values of different spatial points were different. The position with a lower PET value had smaller space openness and higher three-dimensional green volume. The shadow areas formed by buildings and vegetation can reduce the solar radiation intensity and improve the thermal comfort of the space. It was found the planting of shrubs, flower pools, and other vegetation in Street A did not play a role in regulating microclimate comfort (see Figure 4).

Figure 4.
Diagrams of thermal comfort simulation results.
3.3.2. Thermal Comfort Evaluation of Site B
It was found that during the simulation period, the PET values in the morning and evening were smaller than in other periods of the day. There was a comfortable green space inside site B only at 8 a.m. and 6 p.m. During the other time, it was in a warm and/or hot thermal comfort state. There are fences around the site, which is not conducive to ventilation. In summer, the internal space was sultry, resulting in a large PET value. Using the thermal comfort analysis at 2 p.m., the PET values of the four measuring points were in the order of B-4 > B-1 > B-2 > B-3, indicating that spaces B-2 and B-3 were more suitable for outdoor activities in high-temperature weather conditions. It was noted that B-2 was a “rest avenue” covered with green plants at the top and less open to the sky. Therefore, space structures and vegetation can be used to improve thermal comfort. The high PET values of B-4 and B-1 were caused by solar thermal radiation. Both B-4 and B-1 had a large open sky, and the underlying surface was made of hard concrete pavement. They did not help reduce the solar radiation intensity for thermal comfort.
3.3.3. Thermal Comfort Evaluation of Site C
It was found that the value of the thermal comfort index PET began to show an upward trend after 10 a.m., and the PET value reached the maximum daytime value at 2 p.m. The overall thermal comfort level was warm and/or hot thermal sensation. Using the relevant information from the previous field investigation, the thermal comfort analysis was carried out at 2 p.m. It was found that the PET differences among different spaces in site C were 2~5 °C. The influencing factors on the microclimate comfort of the space included buildings and vegetation. The PET value of the shaded space formed by the building shadow area and the tall trees was smaller than that of other spaces. It indicates vegetation in the area improved the thermal comfort of the site to a certain extent.
3.4. Coupling Analysis of Green Space Factor and Thermal Comfort
It was found there was a correlation between green space form elements and microclimate factors. This paper thus took thermal comfort as the comprehensive influence factor of the microclimate environment to obtain the PET value of microclimate thermal comfort at any point in the green space site through model numerical simulation. The quantitative factors of green space form were levels of sky openness and vegetation.
3.4.1. The Coupling Relationship between Sky OPENNESS SVF and Thermal Comfort PET
It was found there was a positive correlation between the SVF and the thermal comfort PET. It means the larger the SVF value was, the greater the openness of the green space was. A certain degree of occlusion was found, and in summer, the high-temperature weather is subject to strong solar radiation, resulting in a higher thermal comfort PET value and the human body’s thermal discomfort.
3.4.2. Coupling Relationship between Three-Dimensional Green Quantity and Thermal Comfort PET
The three-dimensional green quantity of green space was found to have a negative correlation with the thermal comfort PET. The three-dimensional green quantity represents the green quantity on the vertical structure of green vegetation. A high green quantity means that the green vegetation forms an effective shading result, and its transpiration becomes stronger. It could also adjust the radiation to the sun to reduce the surface temperature, and consequently, the thermal comfort PET value was reduced as well to improve the thermal comfort of the space and create a comfortable and pleasant green space environment. Therefore, different from the previous emphasis on the greening rate, this study found the three-dimensional greening of vegetation can be focused on improving the ecological benefits of green space in historical blocks.
3.5. Summary of Influencing Factors of Thermal Comfort in Green Space
3.5.1. Three-Dimensional Green Space Green Quantity
The three-dimensional green volume of the green space in the Dashilar historical block has a significant impact on the thermal comfort of its microclimate environment. Through the field investigation and comparison of different green spaces in the big fence, it is concluded that the group form, canopy shape, and plant height of green space plants are the factors that can directly affect the three-dimensional green volume and consequently influence the microclimate comfort in the site. Different plant combinations in the green space create different three-dimensional green quantities and different microclimate environments [33]. In the green space, the plant community combination types are divided into four types, being (1) shrub + grassland, (2) tree + grassland, (3) tree + shrub, and (4) tree + shrub + grassland (see Figure 5). A large number of green plants create an effect of cooling. Moreover, the humidification caused by trees in the green space was found to be significantly greater than that of shrubs. The effect of ground-covering plants on the three-dimensional green quantity of grassland was small and only played a role in regulating the local microclimate environment. The order of the ability of the vertical structure group type of plants to regulate the microclimate thermal environment was found to be 4 > 3 > 2 > 1 [34]. The richer the plant community level is, the higher the three-dimensional green quantity per unit area is, the better the effect of adjusting the thermal comfort PET value is, the faster the growth rate of green quantity is, and finally, the greater the potential of ecological benefits is.
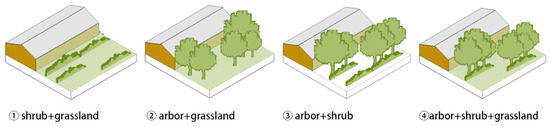
Figure 5.
Types of plant community assemblages.
Plant canopy usually refers to the part above the trunk of the tree with aggregated branches and leaves. In the early stage of the plant measurement in the green space of the Dashilar historical block, it was found that the richer the canopy structure of the plant was, the greater the three-dimensional green volume of the space was. It formed a high-density space top interface to achieve the effect of summer shading and winter windproof [35]. The influence of plant canopy on the thermal comfort of the microclimate environment was reflected in the change in air temperature and relative humidity.
Plant height was a morphological characteristic of plants [36]. In summer, the sunshine on the plant canopy produces a shadowing area. The higher the plant canopy is, the greater the three-dimensional green space is, the greater the shadow area is, and the stronger the cooling and humidifying effect is. The microclimate thermal comfort could be adjusted accordingly.
3.5.2. Green Space Sky Openness
The sky openness of the green space was found to be another key factor affecting the thermal comfort of its microclimate environment. The sky’s openness reflects the perception of the human body in the green space. All the vegetation, buildings, structures, and other factors in the green space affected the sky’s openness. This is because the shading and enclosure of vegetation, buildings, and structures in the green space can directly affect solar radiation. When the shading area and the building shadow area were enlarged, the enclosure degree would be improved to reduce the air temperature during the day and improve environmental comfort. It becomes an important factor that may affect the urban heat island effect to provide outdoor recreation space for residents in high-temperature weather in summer.
3.5.3. Underlying Surface of Green Space
Currently, hard concrete pavement is commonly used in the public space of the historic district of the old city. The hard surface includes square pavement, street pavement, etc. However, the large area of hard pavement with high compactness destroys the ecological balance in the neighborhood environment and lacks good water permeability. A large area of hard surface also has a severe impact on soil ventilation, air permeability, and heat dissipation and absorbs a large amount of solar radiation heat. Consequently, the surface temperature rises, affecting the thermal comfort of outdoor leisure activities in high-temperature weather in summer. Based on the microclimate field observation results of the green space of the large fence, it was found that the air temperature in the hard pavement area was significantly higher than that in the space covered with ground cover. To sum up, the larger the area of the hard pavement is, the higher the temperature is.
4. Discussion
The paper used a small-scale space study to analyze the microclimate thermal comfort among the specific green spaces in the Dashilar district. Taking the typical green space of the Dashilan historical block as the research object, the microclimate data such as temperature, relative humidity, and wind speed were measured on-site. Moreover, the microclimate thermal comfort was simulated by ENVI-met numerical simulation software. The correlation analysis between the evaluation factors of different green spaces and the simulation results of thermal comfort was conducted. The results show that the thermal comfort PET was positively correlated with the sky openness SVF (the quantitative index of green space form) and negatively correlated with the three-dimensional green volume of green space. Compared with the existing studies, this paper focuses more on small-scale space and analyzes the microclimate thermal comfort with the specific green space in the Dazhalan neighborhood. The conclusions have some reference for the improvement of thermal comfort in green spaces in the Dazhalan neighborhood in the future. However, due to the limitations of experimental conditions, this study still has some deficiencies:
- (1)
- Due to the lack of manpower and material resources, this paper only evaluates the microclimate thermal comfort evaluation study of three typical green spaces in the Dazhalan neighborhood, which is somewhat insufficient in the number of samples. Meanwhile, due to the limitation of the number of experimental equipment, this paper adopts the method of mobile observation, ignoring the time difference in collecting data, and there is still a lack of precision.
- (2)
- The season chosen for this study is summer, mainly because the thermal environment problem is more prominent in Beijing in summer, so the study is more targeted. It is hoped that the study of microclimate comfort in the spring, autumn, and winter seasons can be added to future studies so that green space optimization strategies can be comprehensively formulated.
- (3)
- In this study, only the basic microclimate parameters were measured, and in the future, PM2.5 and PM10, which are related to air quality, can be introduced into the study of green space in Dazhalan so as to explore the coupling relationship between green space and air quality.
- (4)
- This study analyzes the thermal comfort effect of green space from the perspective of the three green amounts of plants and does not consider the influence of plant types separately, so the conclusion is not comprehensive enough. The types of trees in Dazhalan are relatively homogeneous, so they were not categorized in detail. Future studies should take this into account.
5. Conclusions
Studying the microclimate of green space in the historical district of the old city in summer plays an important role in improving the quality of public space and enhancing the comfort of the microclimate. Combining the microclimate adaptive design methodology, this paper combines qualitative research with quantitative research, using research methods such as literature research, field observation, data analysis, numerical simulation analysis, and other research methods through microclimate environment monitoring, model construction, numerical simulation, and other technical means, to establish the conclusion and design mechanism on the basis of data, so as to make the results of the study more scientific and objective, which is an important feature of this study. Aiming at the problem of imbalance in the research area, this study expands the microclimate research object from the urban area to the level of historic districts and expands the research content of the green renewal of historic districts from the cultural value to the linkage between the green space and the microclimate environment, in order to guide the optimization and enhancement of the green space of historic districts and to help create a sustainable neighborhood habitat, which is innovative to a certain extent.
The optimizing strategies, such as optimizing the green space layout and construction mode, were proposed to plan green planting and the underlying surface pavement of the block and design the internal space landscape.
5.1. Optimize the Layout and Construction Mode of Green Space
The current layout of green space in the historical block of Dashilan was found to be unbalanced, and the distribution was scattered. It was also found the spatial connection was low, and the green quantity was insufficient. Thus, it was difficult to have a healthy and comfortable microclimate environment in the district. In order to improve the thermal comfort of green space in summer and meet the needs of more people’s outdoor leisure and entertainment activities, the potential available public space in the block should be fully explored from multiple dimensions in future renovation and transformation plans. For example, a centralized green space can be made, the distribution of green space can be optimized, and the green volume of the block can be increased. The correlation between the existing green space and the new green space can be smartly used to develop a green space network with high connectivity. Meanwhile, the green space construction mode can be optimized [37], and the three-dimensional green space can be increased to adjust the thermal comfort of the human body by inserting greens, removing greens, removing the wall, and hanging greens on the facade and the roof (see Figure 6).
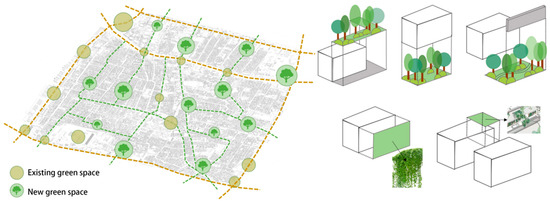
Figure 6.
Green space creation model.
5.2. Reasonable Collocation of Green Planting
The role of green plants in regulating and improving the microclimate environment can be maximized. Moreover, the planting strategy of a tree–shrub–grass multi-layer plant structure can be implemented to form a canopy shadow area and a rich spatial atmosphere [38]. In detail, in the narrow public space of historical blocks, vertical space should be fully utilized for planning and design. For example, shrubs and ground cover should be replanted in the lower layer of the original tree layer space to form a composite planting mode of tree + shrub + ground cover. It will improve the three-dimensional green quantity and better enhance the thermal comfort of the microclimate. Plants can be planned to influence solar radiation and wind direction through vertical design (see Figure 7). Different tree forms can impact the microclimate environment differently. Therefore, when trees are planted, the crown type with the best microclimate improvement effect should be selected as far as possible. The shape of upper large and lower small trees is more obvious than other types of cooling and humidifying effects, and it can also create more comfortable shading space.
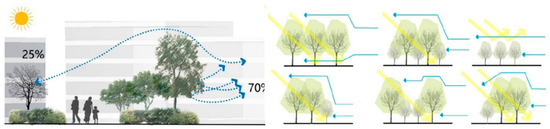
Figure 7.
Effect of ensemble vegetation on solar radiation and wind direction.
5.3. Improve the Underlying Surface Pavement of the Block
The pavement has a certain effect on the improvement of thermal comfort in three aspects. Firstly, it comes from the pavement material, style, and specific heat capacity on temperature. Secondly, the pavement reflectivity and absorption rate on solar radiation can be significant influences. The third aspect is the influence of pavement permeability on humidity balance. Beijing is hot and humid in summer. However, most of the existing green space pavements in the Dashilar Historic District are pavement materials with poor water permeability. Therefore, pavements with strong water permeability and small single areas shall be selected to ensure rainwater infiltration and water replacement between air and soil and effectively prevent summer glare in the future. New permeable materials, such as new climate bricks and permeable antique bricks, can also be used to maintain the balance of groundwater, and therefore they have become an important means to solve the space microclimate environment and adjust the thermal comfort of the human body at the pavement level.
Author Contributions
Conceptualization, L.Q. and T.L.; Methodology, L.Q. and B.C.; Software, B.C.; Validation, T.L. and B.C.; Formal analysis, L.Q.; Investigation, T.L.; Resources, W.X.; Data curation, W.X.; Writing—original draft, T.L.; Writing—review & editing, L.Q.; Visualization, B.C.; Supervision, W.X. All authors have read and agreed to the published version of the manuscript.
Funding
This research received no external funding.
Data Availability Statement
Data are contained within the article.
Conflicts of Interest
The authors declare no conflict of interest.
References
- Xie, B.; Wang, X.; Wu, L. Exploring the effect of urban greenspace on residents’ mental health using aquasi-natural experiment: Taking Wuhan East Lake Greenway as an example. Prog. Geogr. 2021, 40, 1141–1153. [Google Scholar] [CrossRef]
- Xiong, W.; Zhu, J.; Yan, J.; Guo, Y.; Sun, H. A preliminary discussion on the humanistic governance of Dashilar Street for safety and health. Beijing Plan. Rev. 2020, 7, 153–159. [Google Scholar]
- Yang, X.; He, S.; Lu, X. Research on thermal comfort valuation of Public space in Beuing old city based on software simulation: A case study of six alleys in Baite temple area. Urban. Archit. 2018, 51–56. [Google Scholar] [CrossRef]
- Thompson, C.W. Urban Open space in the 21st century. Landsc. Urban Plan. 2002, 60, 59–72. [Google Scholar] [CrossRef]
- Mahyar, M.; Puay, Y. Multi-year comparison of the effects of spatial pattern of urban green spaces on urban land surface temperature. Landsc. Urban Plan. 2019, 184, 44–58. [Google Scholar]
- Widayati, A.; Louman, B.; Mulyoutami, E.; Purwanto, E.; Kusters, K.; Zagt, R. Communities’ Adaptation and Vulnerability to Climate Change: Implications for Achieving a Climate-Smart Landscape. Land 2021, 10, 816. [Google Scholar] [CrossRef]
- Reza, R.; Esmaeil, Z.; Margaret, B. Spatio-temporal planning of urban neighborhoods in the context of global climate change: Lessons for urban form design in Tehran, Iran. Sustain. Cities Soc. 2019, 51, 101554. [Google Scholar]
- Alcazar, S.S.; Olivieri, F.; Neila, J. Green Roofs: Experimental and Analytical Study of Its Potential for Urban Microclimate Regulation in Mediterranean–continental Climates. Urban Clim. 2016, 17, 304–317. [Google Scholar] [CrossRef]
- Shashua-Bar, L.; Pearlmutter, D.; Erell, E. The influence of trees and grass on outdoor thermal comfort in a hot-arid environment. Int. J. Climatol. J. R. Meteorol. Soc. 2011, 31, 1498–1506. [Google Scholar] [CrossRef]
- Huttner, S.; Bruse, M.; Dostal, P. Using ENVI-met to simulate the impact of global warming on the mi-croclimate in central European cities. Ber. Meteorol. Inst. Univ. Freiburg. 2008, 18, 97–103. [Google Scholar]
- Fu, F.; Zhao, C.; Sun, Y.; Liu, D.; Li, Y. Study on the Relationship between Temperature, Humidity and Particular Matters in Green Spaces inAutumn: A Case Study of Yuyuantan Park, Beijing. Chin. Landsc. Archit. 2018, 34, 36–40. [Google Scholar]
- Dai, F.; Bi, S.; Chen, M. Analysis of frontier research on urban green space based on general program of the national natural science fund of china: Hot spots and methods. Landsc. Archit. 2021, 28, 10–15. [Google Scholar]
- Chen, M.; Dai, F. The influence of urban green spaces on thermal environment based on morphological spatial pattern analysis. Ecol. Environ. Sci. 2021, 30, 125–134. [Google Scholar]
- Wu, S. Microclimate Effect of Urban Green Space and Its Influence on Human Comfort. Master’s Thesis, Beijing Forestry University, Beijing, China, 2019. [Google Scholar]
- Middel, A.; Selover, N.; Hagen, B.; Chhetri, N. Impact of shade on outdoor thermal comfort—A seasonal field study in Tempe, Arizona. Int. J. Biometeorol. 2016, 60, 1849–1861. [Google Scholar] [CrossRef]
- Klemm, W.; Heusinkveld, B.; Lenzholzer, S.; Hove, B. Street greenery and its physical and psychological impact on thermal comfort. Landsc. Urban Plan. 2015, 138, 87–98. [Google Scholar] [CrossRef]
- Liu, B.; Li, C. Evaluation of Microclimate Suitability of Landscape Space in Shihua Jincheng, Shanghai. Landscape gardening and microclimate. In Proceedings of the Second International Symposium on Landscape Gardening and Microclimate in China, Chongqing, China, 17 January 2020; pp. 112–118. [Google Scholar]
- Morakinyo, T.; Yun, F. Simulation study on the impact of tree-configuration, planting pattern and wind condition on street-canyon’s micro-climate and thermal comfort. Build. Environ. 2016, 103, 262–275. [Google Scholar] [CrossRef]
- Yang, Y.; Tang, X.; Ji, Q.; Sun, M. Numerical simulation of the microclimate environment in typical historic blocks of Nanjing based on ENVl-met. J. Suzhou Univ. Sci. Technol. Eng. Technol. Ed. 2018, 31, 33–40. [Google Scholar]
- Xiong, Y.; Yan, Y. Effects of spatial design and microclimate on human thermal comfort in the region south of the Yangtze River: A case study of old street in Gaochun Nanjing. J. Nanjing For. Univ. 2021, 45, 219–226. [Google Scholar]
- Qi, L.; Ma, Z.; Guo, Y.; Liu, J.; Song, Z. Study on the mountain-water patterns of Xijingyu Village in Jizhou District, Tianjin Based on the comprehensive analysis of micro-climate adaptability and design mechanism. Chin. Landsc. Archit. 2018, 34, 34–41. [Google Scholar]
- Cohen, P.; Potchter, O.; Matzarakis, A. Daily and seasonal climatic conditions of green urban open spaces in the Mediterranean climate and their impact on human comfort. Build. Environ. 2012, 51, 285–295. [Google Scholar] [CrossRef]
- Lim, H. Measuring and Modelling Spatial Variation of Temperature and Thermal Comfort in a Low-Density Neighbourhood in Singapore. Master’s Thesis, National University of Singapore, Singapore, 2014. [Google Scholar]
- Wu, R.; Yan, H.; Shu, Y.; Shi, Y.; Bao, Z. Microclimatic Characteristics and Human ComfortConditions of Bamboo Plant Communities in Summer. Chin. Landsc. Archit. 2019, 35, 112–117. [Google Scholar]
- Xiao, Y.; Xue, S. Outdoor Thermal Comfort Threshold of Lingnan Gardenin Summer. Build. Sci. 2016, 32, 1–9+17. [Google Scholar]
- Qi, L.; Liu, R.; Cui, Y.; Zhou, M.; Song, Z. Study of the landscape pattern of Shuiyu village in Beijing, China: A comprehensive analysis of adaptation to local microclimate. Sustainability 2021, 14, 375. [Google Scholar] [CrossRef]
- Chen, L.; Wen, Y.; Zhang, L.; Xiang, W. Studies of thermal comfort and space use in an urban park square in cool and cold seasons in Shanghai. Build. Environ. 2015, 94, 644–653. [Google Scholar] [CrossRef]
- Liu, B.; Wei, D. Review and prospect of thermal comfort in green space. Planners 2017, 33, 102–107. [Google Scholar]
- Xiong, W.; Yan, W.; Liu, X.; Ma, R. The Improvement of spatial quality on Beuing historical streets based on people-oriented observation. Urban. Archit. 2018, 6, 57–61. [Google Scholar]
- Lai, H. Study on Microclimate Effects of Urban Green Space Plant Communities in Hot and Humid Regions: A Case Study of Guangzhou Campus Green Space. Master’s Thesis, South China University of Technology, Guangzhou, China, 2019. [Google Scholar]
- He, S. Research on Current Situation and Optimization Strategy of Street Thermal Comfort in Beijing Old Town Historic Block. Master’s Thesis, North China University of Technology, Beijing, China, 2019. [Google Scholar]
- Dong, Y.; Zhang, Z.; Sun, S.; Wang, Q.; Liu, X. Thermal comfort evaluation of activity space in urban comprehensive parks based on microclimate simulation: A case study of Wanliutang Park in Shenyang City. J. Hum. Settl. West China 2023, 38, 15–21. [Google Scholar]
- Yan, Y.; Yue, S.; Liu, X.; Wang, D.; Chen, H. Advances in Assessment of Bioclimatic ComfortConditions at Home and Abroad. Adv. Earth Sci. 2013, 28, 1119–1125. [Google Scholar]
- Tao, Y. Evaluation and Optimization of Thermal Comfort in Micro Green Space at High Temperature: A Case Study of Yuzhong District, Chongqing. Master’s Thesis, Chongqing University, Chongqing, China, 2019. [Google Scholar]
- Xu, H.; Zhu, J.; Li, H. Optimization design of summer microclimate adaptability of urban campus green space based on ENVl-met Simulation. Mod. Urban Res. 2023, 38, 101–106+114. [Google Scholar]
- Hou, X. Research and practice on green micro-renewal of micro-garden in Beijing Old City. Beijing Plan. Rev. 2019, 161–169. [Google Scholar]
- Wei, X.; Hao, R.; Zhang, M.; Shen, H.; Qiu, Y.; Geng, H. Microclimate changes with simulated canopy spatial structures. J. Zhejiang A F Univ. 2019, 36, 783–792. [Google Scholar]
- Wu, Y. The Research on Microclimate Effect of the Three-Dimensional Morphology on Urban Waterfront Green Space Vegetation. Master’s Thesis, East China Normal University, Shanghai, China, 2020. [Google Scholar]
Disclaimer/Publisher’s Note: The statements, opinions and data contained in all publications are solely those of the individual author(s) and contributor(s) and not of MDPI and/or the editor(s). MDPI and/or the editor(s) disclaim responsibility for any injury to people or property resulting from any ideas, methods, instructions or products referred to in the content. |
© 2024 by the authors. Licensee MDPI, Basel, Switzerland. This article is an open access article distributed under the terms and conditions of the Creative Commons Attribution (CC BY) license (https://creativecommons.org/licenses/by/4.0/).