Article

Multi-Objective Optimization and Sensitivity Analysis of Building Envelopes and Solar Panels Using Intelligent Algorithms

1
College of Civil Engineering, Inner Mongolia University of Science and Technology, Baotou 014010, China
2
Intelligent Construction and Operation Engineering Research Center at Universities of Inner Mongolia Autonomous Region, Inner Mongolia University of Science and Technology, Baotou 014010, China
3
Engineering Research Center of Urban Underground Engineering at Universities of Inner Mongolia Autonomous Region, Inner Mongolia University of Science and Technology, Baotou 014010, China
*
Author to whom correspondence should be addressed.
Buildings 2024, 14(10), 3134; https://doi.org/10.3390/buildings14103134
Submission received: 14 July 2024 / Revised: 2 August 2024 / Accepted: 7 August 2024 / Published: 1 October 2024

Abstract

:
The global drive for sustainable development and carbon neutrality has heightened the need for energy-efficient buildings. Photovoltaic buildings, which aim to reduce energy consumption and carbon emissions, play a crucial role in this effort. However, the potential of the building envelope for electricity generation is often underutilized. This study introduces an efficient hybrid method that integrates Particle Swarm Optimization (PSO), Support Vector Machine (SVM), Non-dominated Sorting Genetic Algorithm II (NSGA-II), and the weighted Technique for Order Preference by Similarity to an Ideal Solution (TOPSIS) method. This integrated approach was used to optimize the external envelope structure and photovoltaic components, leading to significant reductions: overall energy consumption decreased by 41% (from 105 kWh/m2 to 63 kWh/m2), carbon emissions by 34% (from 13,307 tCO2eq to 8817 tCO2eq), and retrofit and operating costs by 20% (from CNY 13.12 million to CNY 10.53 million) over a 25-year period. Sensitivity analysis further revealed that the window-to-wall ratio and photovoltaic windows play crucial roles in these outcomes, highlighting their potential to enhance building energy performance. These results confirm the feasibility of achieving substantial energy savings and emission reductions through this optimized design approach.

1. Introduction

1.1. Background

Energy conservation and carbon reduction have become a global consensus, with countries taking significant actions to combat climate change and reduce emissions. This trend is driven by international agreements like the Paris Agreement, which require nations to limit global warming and reduce greenhouse gas emissions. Policies such as the European Union’s Green Deal, China’s carbon-neutrality goal, and the United States’ Clean Energy Plan promote renewable energy, improve efficiency standards, and reduce fossil fuel use. Additionally, technological innovations in renewable energy, smart grids, energy storage, and efficiency improvements have made these goals more feasible and economical, significantly reducing carbon emissions. About 30% of the world’s energy consumption and 37% of CO2 emissions are attributed to buildings, making them significant contributors to global warming [1]. According to data from the China Building Energy Consumption Research Report (2020) [2], in 2018, energy consumption per unit area of public buildings in China exceeded that of urban and rural buildings by 58% and 66%, respectively, highlighting the substantial potential for consumption and emission reduction in public buildings.

1.2. The Key Factor Influencing Energy Consumption

Optimizing key factors influencing energy consumption in public buildings is crucial for achieving reductions. The building envelope structure, responsible for over 70% of a building’s life cycle energy consumption, mainly due to heat loss, sees air conditioning and heating systems as the main contributors [3,4]. Scholars have addressed building energy consumption by incorporating thermal insulation materials. Compared with no insulation material, this approach can save 21.52% of heat load, 3.78% of total load, and 25.34% of total cost per unit area [5]. Optimal phase-change material thickness can achieve energy savings of up to 41.61% [6]. The application of infrared reflective wall paint can reduce heat losses by 18% to 22% [7]. Compared to regular glass, thermochromic windows have the potential to save 5% to 84.7% in heating and cooling energy demand [8,9]. Compared to ordinary insulating glass (OIG), the energy-saving rates of triple silver low-e insulating glass (TSIG) range from 8.82% to 63.65% in five climate zones [10].

1.3. Application of Intelligent Algorithms in Building Energy Efficiency, as Well as Multi-Objective Optimization

In addition, during the design phase, numerical simulations can adjust and optimize variables to reduce energy consumption [11]. However, when there are many design factors, or when the building model is large, the simulation calculations can be time-consuming. Therefore, scholars combine a small number of simulations with algorithms such as Artificial Neural Networks (ANN), Random Forest (RF), and Bayesian Optimization XGBoost (BO-XGBoost) to establish datasets for optimizing design parameters and energy-consumption targets [12,13,14,15]. Integrating machine-learning optimization methods not only reduces simulation time but also predicts and analyzes building energy consumption [16]. With the development of multi-objective optimization techniques, optimization objectives involve building materials and operational phase carbon emissions, thermal comfort, and other factors. Chen et al. optimized the energy consumption, illumination, and thermal comfort of the atrium in a teaching building using NSGA-II and machine-learning methods [17]. Wang et al. used multi-objective optimization to improve the design of passive houses in Shandong Province, achieving overall improvements of 25.5% in annual energy demand and 21.6% in summer discomfort hours [18].

1.4. Application of Photovoltaic Technology in Building Energy Efficiency

Once the building envelope structures reach maximum optimization, scholars employ photovoltaic (PV) components to further reduce energy consumption. These components are integrated into architectural elements such as windows, curtain walls, and sunshades, utilizing the building’s exterior surfaces for photovoltaic power generation, thus supplying electricity to the building while mitigating solar radiation. Li et al. investigated bifacial photovoltaic sunshades (BIPV) in Shenzhen and found they have higher electrical conversion efficiency than traditional monofacial ones [19]. Risa Ito et al. studied a self-regulating photovoltaic louvre window system, demonstrating that an optimized angle of photovoltaic louvres significantly reduces a building’s heating and cooling loads [20]. Research by Alba Ramos et al. demonstrates that Btransparent BIPV reduced energy demand by 6.9% and improved energy balance by 21%, while opaque BIPV improved energy balance by 38.3% [21]. Gamal explored the effectiveness of implementing BIPV systems in Dubai, finding that high-rise office buildings with BIPV systems experience a reduction in heating and cooling energy consumption by 13.2% to 32.8% [22]. Luo et al. achieved near-zero energy consumption by considering factors such as energy consumption, thermal comfort, carbon emissions, and economy. Their model optimized the performance parameters of the building envelope [23]. Goia et al. optimized the design of exterior PV shading devices for Nordic office buildings, improving energy efficiency and daylight autonomy by adjusting the number of louvers, tilt angle, and position through multi-objective optimization [24]. Allouhi et al. employed genetic algorithms and TOPSIS for the economic and environmental optimization of photovoltaic capacity in commercial buildings in Morocco [25]. Katsaprakakis and Zidianakis demonstrate that a hybrid system with solar collectors, thermal storage, and a biomass heater can cover 100% of a school building’s annual heating load in Crete, with solar contributing over 45% and a production cost of EUR 0.15/kWhth [26]. These studies demonstrate that multi-objective optimization plays a crucial role in enhancing the performance of BIPV systems and achieving economic and environmental goals.
In summary, current research primarily focuses on optimizing building envelope structures or applying photovoltaic components to areas such as roofs and sunshades. However, these studies have not fully harnessed the electricity-generating potential of building envelope structures nor considered the combined impact of photovoltaic windows and panels on building energy consumption, overlooking the mutual influence between photovoltaic components and envelope structures.

1.5. Research Objectives and Main Contributions

Therefore, this paper proposes a multi-objective optimization method for a full building envelope photovoltaic system, employing an optimization approach based on PSO-SVM-NSGA-II. The optimization aims to minimize building costs, energy consumption, and carbon emissions while maximizing renewable energy generation. Additionally, the study utilizes the Sobol method for global sensitivity analysis of the envelope and photovoltaic component parameters. This analysis provides a detailed understanding of how optimization variables affect the optimization objectives. Variables with high sensitivity indices are further analyzed locally, offering valuable insights for the optimization of public building renovations. The proposed multi-objective optimization method has the potential to guide energy-efficient renovations in public buildings, assisting decision-makers in balancing costs, energy consumption, and carbon emissions to achieve optimal building efficiency. Furthermore, by employing global sensitivity analysis and local analysis, our research offers key parameters and effective strategies for optimizing the design of building envelope structures and photovoltaic components, ultimately enhancing the performance of photovoltaic systems across diverse building environments.
The subsequent structure of the paper is as follows: The second section explains the theoretical methods, the third section describes the case study, the fourth section presents the research results and analysis, the fifth section discusses the findings, and the sixth section concludes the study.

2. Theoretical Approach

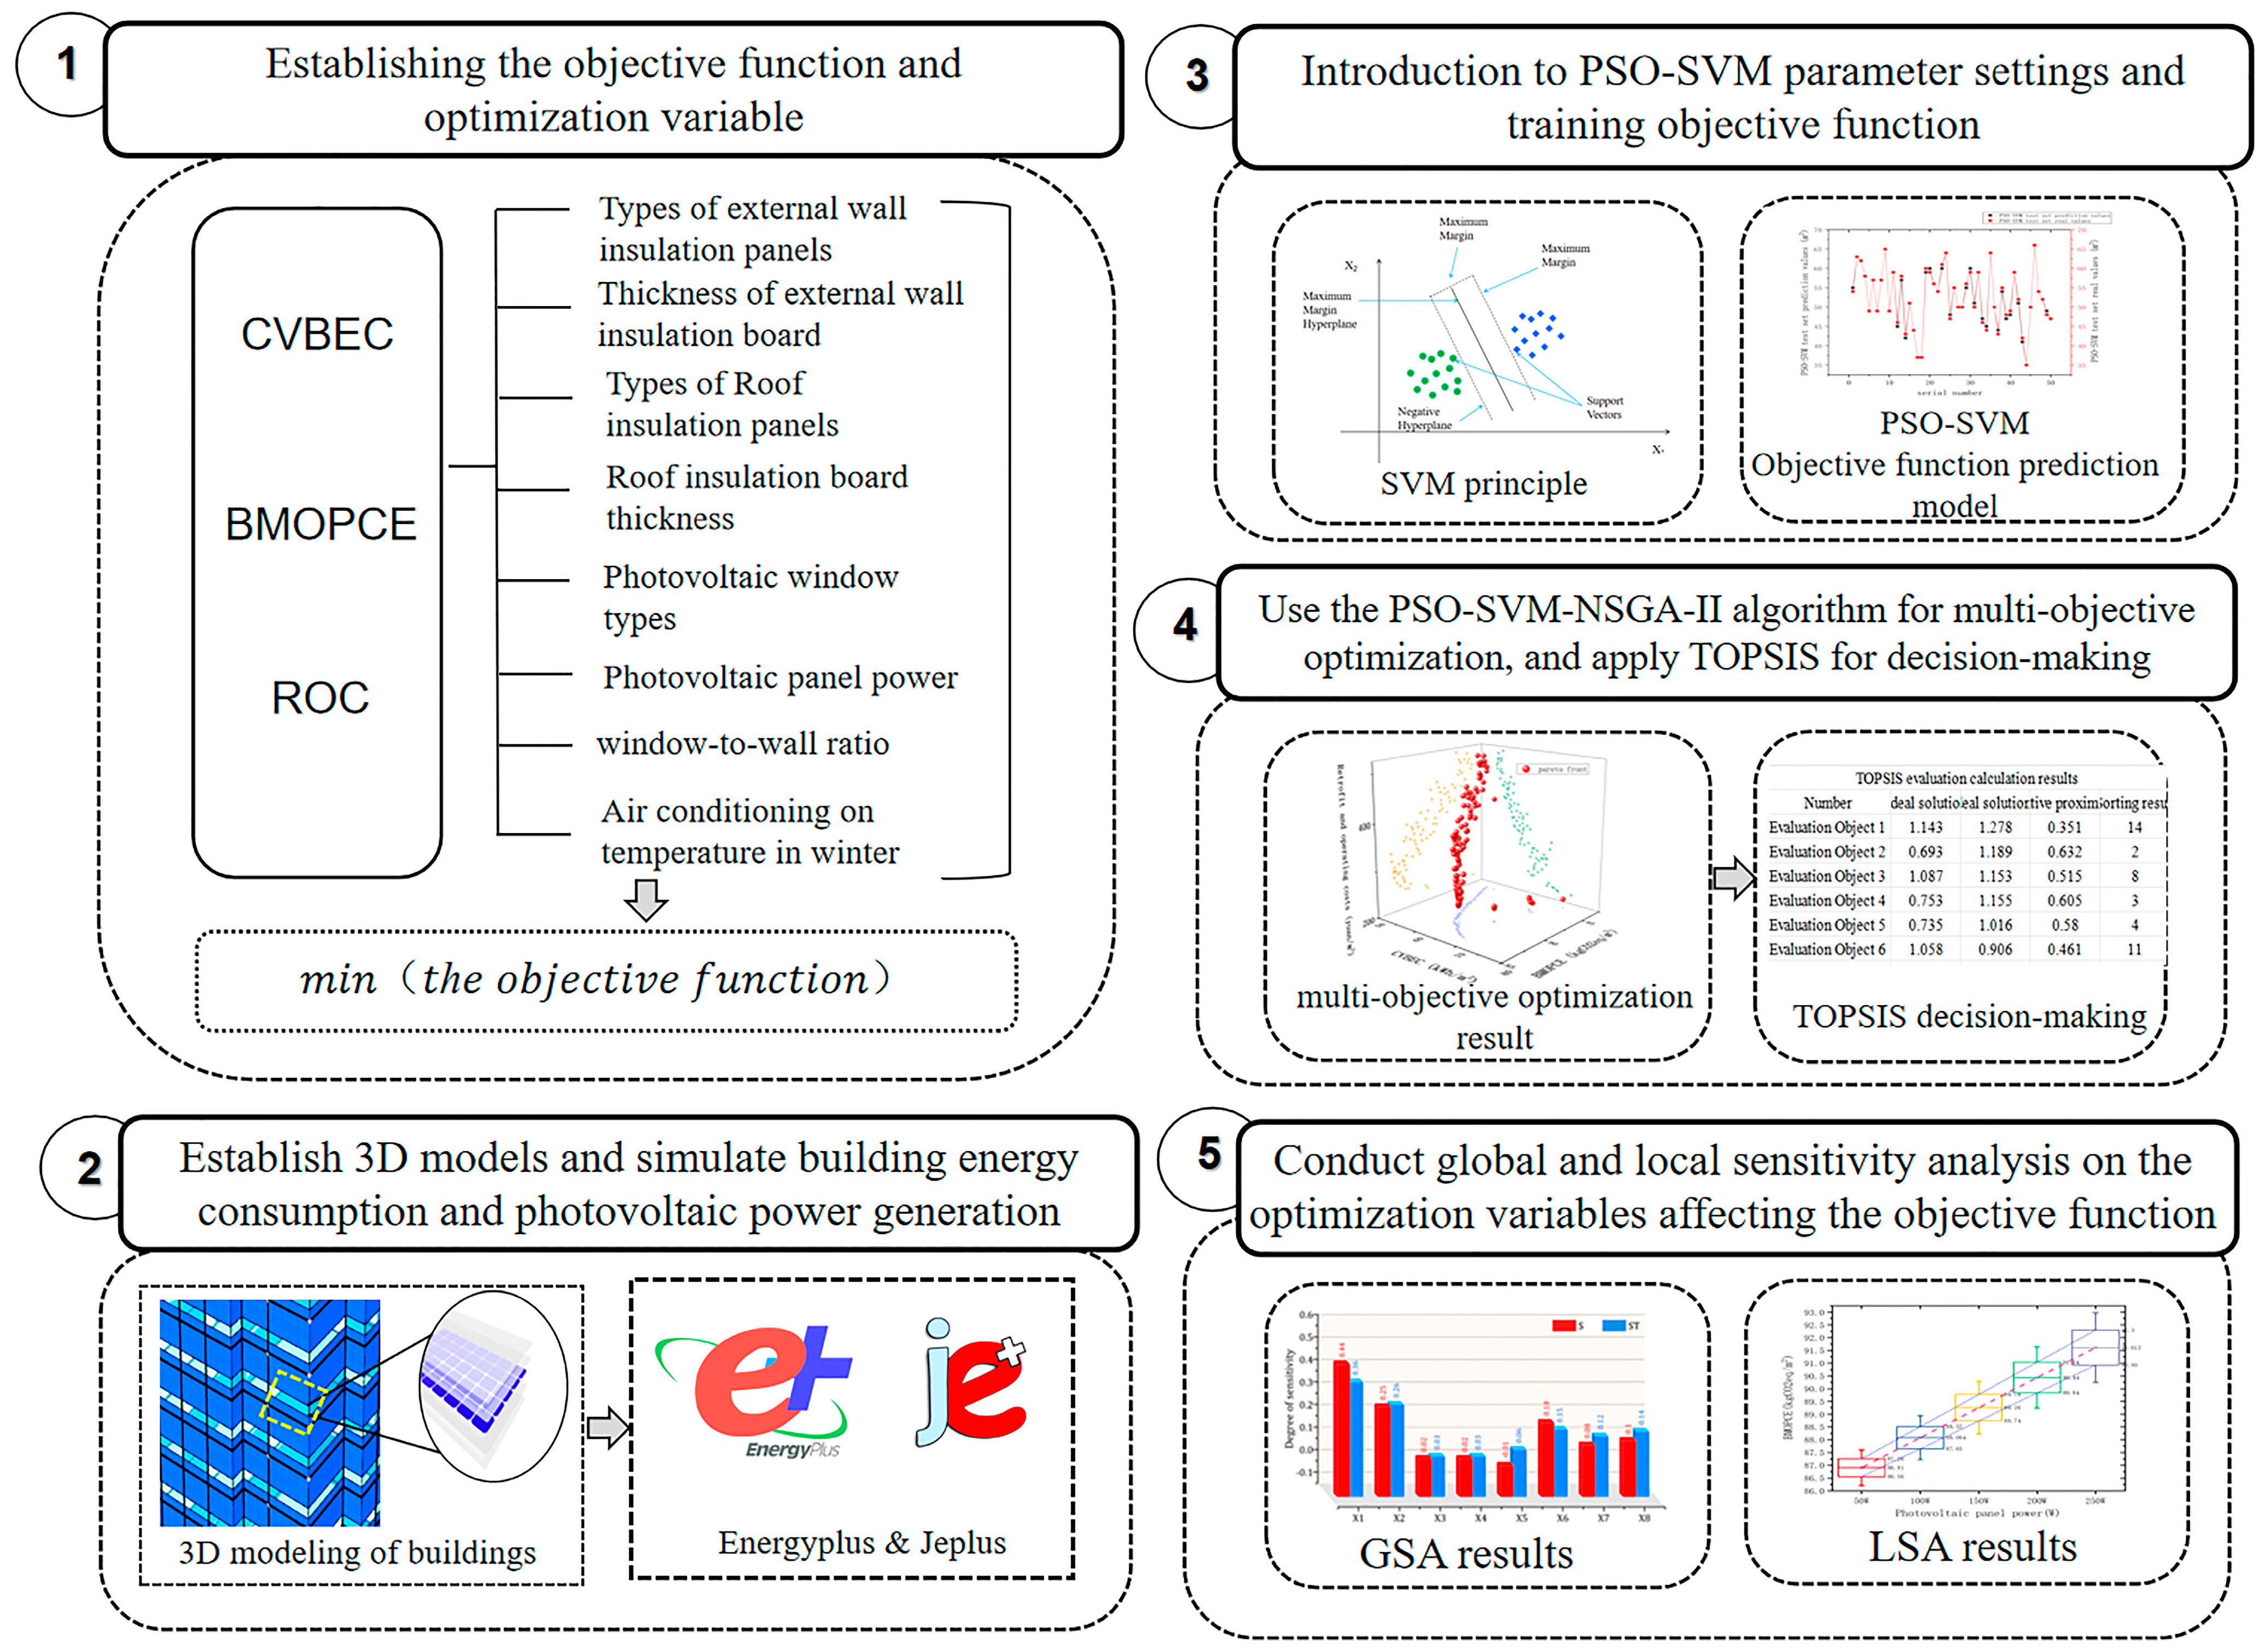
2.1. Research Framework

In practical problems, there are often multiple conflicting objectives or requirements, and single-objective optimization cannot meet all these demands. Multi-objective optimization not only considers the optimal solution for a single objective but also finds a balance between multiple objectives. This allows decision-makers to weigh different objectives according to specific situations. This paper uses the window-to-wall ratio, photovoltaic components, insulation materials and thickness, and air conditioning design temperature as optimization variables, with comprehensive building energy consumption, building materials and operational phase carbon emissions, and retrofit as objective functions. Based on the PSO-SVM-NSGA-II multi-objective optimization algorithm, the parameters of the envelope and photovoltaic components are optimized. The Pareto solutions, which are the sets of optimal variable values, are obtained, and the entropy-weighted TOPSIS method is used to select the optimal parameter values that minimize the objective functions.
The research framework is shown in Figure 1. CVBEC stands for combined building energy consumption, BMOPCE stands for building materials and operational phase carbon emissions, and ROC stands for retrofit and operating costs where the objective function is first established, and the objective function formulas are established for the combined value of building energy consumption, building materials and operational phase carbon emissions, and retrofit and operating costs, and the envelope and PV module variables are selected as the optimization variables. Then use SketchUp to create a 3D model of the building and import it into OpenStudio to define the thermal zone and PV settings. Subsequently, EnergyPlus is employed to incorporate the building’s fundamental operational data. To expedite the simulation process after establishing the input parameters, the robust parametric tool JEPlus is utilized to perform batch simulations of EnergyPlus input files. Using Latin Hypercube Sampling (LHS), 300 samples of optimized variables are generated. The resulting simulation data—comprising building energy consumption and renewable energy generation—serve as the dataset for the Particle Swarm Optimization-Support Vector Machine (PSO-SVM) algorithm.
The building carbon emission and building retrofit and operating costs were calculated according to the objective function formula in Section 1.3 and saved as a dataset together with the combined value of building energy consumption. After that, the dataset is imported into Matlab R2022a for PSO-SVM algorithm training and testing, and the obtained prediction model is verified with the original building energy consumption data, to verify that the available PSO-SVM is able to make fast and accurate predictions for the three objective functions. Finally, the verified PSO-SVM is used as the objective function of the multi-objective optimization problem, and the NSGA-II optimization algorithm is used to calculate the population crowding degree, and the optimal solution is obtained after continuous crossover and mutation.
Finally, the Pareto optimal solution is saved, reasonable weights are assigned to each objective according to the building design requirements, and finally the TOPSIS method is used to rank the optimal solutions based on the positive and negative ideal solution distances, and the optimal solutions are decided based on the ranking of the solutions.

2.1.1. Multi-Objective Optimization Approach

The current multi-objective optimization tools mainly fall into two categories: built-in optimization tools within simulation software and intelligent algorithms. Each has its advantages and disadvantages. Energy simulation software with built-in optimization tools, such as Transient System Simulation Tool (TRNSYS) with its optimization tool Generic Optimization (GenOpt), can perform parameter optimization and multi-objective optimization [27]. Hybrid Optimization Model for Electric Renewables (HOMER) comes with its optimization engine, supporting economic optimization, reliability analysis, and more [28]. While these software tools are relatively user-friendly and eliminate the need for coding, they require traversing all simulation processes, significantly increasing the simulation run time.
On the other hand, intelligent algorithms, such as Genetic Algorithm (GA), Multi-Objective Particle Swarm Optimization (MOPSO), and Grey Wolf Optimization (GWO) Algorithm, coupled with Artificial Neural Networks (ANN), Random Forest (RF), and Bayesian Optimization XGBoost (BO-XGBoost), utilize predictive models to find the optimal solution, thereby reducing the amount of simulation needed and speeding up the optimization process. These algorithms have distinct characteristics: GA, in global search, often requires a large number of iterations to converge to the optimal solution, leading to long computation times [29]. MOPSO is prone to getting trapped in local optima and exhibits unstable convergence speed [30]. GWO, using a single intelligent algorithm, may lack population diversity, leading to incomplete coverage of the search space and affecting global search capability [31].
The Particle Swarm Optimization-Support Vector Machine-Non-dominated Sorting Genetic Algorithm II (PSO-SVM-NSGA-II) combination leverages Particle Swarm Optimization (PSO) for global search capability, Support Vector Machine (SVM) for local search and classification, and non-dominated Sorting Genetic Algorithm II (NSGA-II) for multi-objective optimization. This combination enhances search efficiency and optimization capability. This method can effectively reduce computation time, especially in large-scale and complex problems, making it a standout choice. Therefore, this study selects PSO-SVM-NSGA-II as the algorithm for multi-objective optimization.

2.1.2. NSGA-II

NSGA-II (Non-dominated Sorting Genetic Algorithm II) is a multi-objective optimization algorithm that uses a genetic algorithm to find a set of Pareto optimal solutions for a particular problem [32,33,34]. This algorithm employs non-dominated sorting and crowding distance sorting methods to maintain diversity in the population and uses crossover and mutation operations to generate the next generation of individuals, ultimately producing a set of Pareto optimal solutions.
Viewing NSGA-II from the perspective of natural selection and ecosystems: in an ecosystem, various species occupy different niches and coexist through competition and cooperation. NSGA-II simulates this niche allocation mechanism by using non-dominated sorting and crowding distance calculation to ensure diversity and even distribution of solutions within the population. Natural selection is a core mechanism in ecosystems, where more adaptable species are selected to reproduce. NSGA-II employs a tournament-selection method, choosing stronger individuals for reproduction based on non-dominated sorting and crowding distance-sorting results. In biological evolution, genetic recombination and mutation are crucial mechanisms for species to adapt to environmental changes. NSGA-II simulates genetic recombination and mutation through crossover and mutation operations, generating new individuals and increasing population diversity. Through these steps, the NSGA-II algorithm effectively searches for solutions to multi-objective optimization problems, identifying a set of Pareto optimal solutions. This provides decision-makers with a range of options to achieve the best trade-off among different objectives.

2.1.3. PSO-SVM

Since it was first proposed by Vapnik and Chervonenkis in 1995, SVM algorithms have been widely used in various disciplines [35]. SVM is a powerful supervised machine-learning method that introduces a kernel function that can deal with nonlinear classification and regression problems and higher dimensional data and has better robustness in the case of large sample data spacing [36]. Particle Swarm Algorithm (PSO) can find the optimal hyperparameters for SVM by randomly generating a swarm of particles, where each particle represents a set of kernel function parameters and penalty parameters of the SVM model. The training set accuracy of these particles is compared, and the parameter values are optimally selected. The method of introducing a particle swarm can improve the SVM model’s precision and accuracy [37]. This study mainly utilizes the PSO-SVM method for the prediction of each target value, due to the characteristics of the principle of PSO-SVM itself, its requirements for the number of data samples are not high, only a small amount of data can achieve good results, reducing the time of simulation operations.

2.2. Objective Functions Construct

2.2.1. Comprehensive Value of Building Energy Consumption

The “GB/T 51350-2019 Technical Standard for Near-Zero Energy Buildings” of China recommends that the Comprehensive Value of Building Energy Consumption (CVBEC) be used as the measurement indicator for building energy consumption. This indicator reflects not only the energy consumption of equipment during the building’s usage period but also the impact of renewable energy generation on operational energy consumption [38]. Therefore, the CVBEC from this standard is selected as the metric for measuring energy consumption in this paper. The scope of the energy-consumption measurement defined in this paper includes heating energy consumption, lighting energy consumption, and the capacity of the building’s renewable energy system. The comprehensive value of building energy consumption is defined as the difference between the building’s total energy consumption and renewable energy generation. The CVBEC is calculated using Formulas (1)–(4).
C V B E C = E E E r × f i A
E E = E h × f i + + E i × f i + E e × f i + E c × f i A
E c = Q C C O P c
E h = Q h C O P h
where CVBEC is the combined value of building energy consumption; EE stands for the energy consumption of building lighting, heating, and cooling, while Er represents the annual renewable energy-generation capacity of the building; A is the building area; f i is the energy-conversion coefficient; Eh is the annual energy consumption of heating system; E i is the annual energy consumption of the lighting system;   C O P c is the comprehensive efficiency of the cooling system; C O P h is the combined efficiency of the heating system.

2.2.2. Building Materials and Operational Phase Carbon Emissions

The operation process is accounted for as the largest proportion of the building’s lifecycle, averaging 67%, followed by the production phase, which averages 31% [39]. The carbon emissions from the dismantling process are relatively low, averaging 2%. Therefore, only the carbon emissions from the production phase of insulation board materials and PV modules, as well as the carbon emissions from the building’s operation phase, are calculated as the optimization objectives to construct the carbon emission objective function. Referring to relevant standards and literature, the carbon emissions of building materials and the operation phase are shown in Equations (5) and (6):
C s c = i = 1 n M i E F i
C y x , e = ( i = 1 n E Y y x , i × E Y e , i i = 1 n E R Y y x , j × E Y e , i ) × L b
C s c is the carbon emission (kgCO2eq), the M i is the consumption of the first major building material, and E F i is the carbon emission factor of the first major building material (kgCO2eq/unit of building material used). The carbon emission in the operation stage mainly involves the carbon emission from energy consumption. C y x , e is the carbon emission in the operation stage (kgCO2eq), and E Y y x , i is the annual consumption of Energy Type i (kg/year or kWh/year or J/year) during the operation phase. E Y e , i is the carbon-emission factor of Energy Class i. The carbon-emission factor for electricity, derived from the average carbon emission factor of the national grid, is 0.5839 [40]. Additionally, the annual electricity generation of Class j renewable energy E R Y y x , j in the operation stage, along with the lifetime of the PV module L b , further affects these emissions.

2.2.3. Retrofit and Operating Costs

The process of building retrofitting incurs retrofitting costs by improving the performance of the envelope and laying technologies such as photovoltaics, and the high cost of building retrofitting affects the implementability of the program, so the retrofitting cost is used as one of the objective functions. The cost-calculation method of the retrofit program is shown in Equations (7)–(9):
R C = C c o n + n = 1 25 ( C o p ) k × ( i + 1 ) k
C c o n = ( A l × d l × P l , i ) + ( A r × d r × P r , j ) + ( A w × P p v , w ) + ( A p v , n × P p v , n )
( C o p ) k = E C y × P × ( 1 + e ) k
where RC represents renovation costs, encompassing external wall insulation costs, roof insulation costs, and photovoltaic component costs. These costs include material expenses, labor costs, and transportation fees. C c o n is the cost of building materials, while the A l , A r , and A w denote the areas of external walls, roofs, and windows respectively, and A p v , n denotes the laying area of different PV modules, all in m2. d l and d r denote the thickness of the insulation layer of the roof and the external wall, respectively, and the unit is m. The thickness of the insulation layer of the roof and the external wall, respectively, is P l , i , and P r , j , and P p v , n denote the unit price of insulation for different exterior walls, roofs, PV exterior windows, and PV modules, respectively, in units of yuan/m2, yuan/m2, yuan/block, and yuan/block, respectively. ( C o p ) k is the 1st-year operating cost, E C y is the energy consumption of the air conditioner in 1 year, P is the unit price of electricity, e is the growth rate of energy cost, i is the real interest rate, i = ( 1 + i k ) / ( 1 + f ) 1 , and i k is the nominal interest rate for the k-th year.

2.2.4. Multi-Objective Decision-Making Methods

Multi-objective optimization methods generate multiple solutions, requiring decision-making methods to select the most optimal solution among them. TOPSIS is used to comprehensively consider multiple decision criteria, rank alternative solutions by comparing their similarity with ideal and negative ideal solutions, and obtain the unique optimal solution. Therefore, this article uses TOPSIS as the decision method. Its basic principles include the following steps: constructing a decision matrix, normalizing, determining weights, calculating positive and negative ideal solutions, calculating similarity, and ranking. Using the TOPSIS method involves assigning weights and ranking optimization objectives. The specific steps are as follows: first, normalize and reverse the performance indicators based on their positive and negative directions, and then assign a weight coefficient of 0–1 to the objective function according to the characteristics and actual needs of the case [41].

2.2.5. Sobol Sensitivity-Analysis Method

The objective function in this paper is a complex nonlinear model, which is more applicable using the Sobol method, which determines the sensitivity of a mathematical model by determining how much the input variables affect the output variables through the principle of variance. In this paper, the Sobol analysis selects a first-order index and a total-order index [42,43].
The formula for the Sobol sensitivity index:
First-order sensitivity index
S i = V i V
Total-order sensitivity index
S T i = 1 V ( V i + j i n V i j + + V 1 , 2 , , n . )
where first-order sensitivity index S i represents the contribution of the change in the parameter Xi to the change in the variance of the whole model, which is used to quantitatively describe the parameters. S T i is the sum of the sensitivity indices of each order.

3. Case Analysis

3.1. Parameter Settings for Building Simulation

3.1.1. Case-Building Prototypes

The Ordos Maternal and Child Health Hospital in Ordos City, Inner Mongolia Autonomous Region, is selected as the simulation object, with a building area of 10,713 m2 and a floor height of 51 m. Ordos City is located in the severe cold climate zone C. The hospital is a combined outpatient and inpatient building, with outpatient clinics and medical technology rooms on Floors 1–6, and wards on Floors 7–12. Based on research findings, building design data and energy-consumption information were obtained, including building-energy consumption and equipment operation schedules. The building is heated in the winter by multi-unit air conditioners. The original building’s exterior walls consist of 250 mm-thick hollow block walls and 70 mm exterior phenolic foam boards, with an exterior wall-heat transfer coefficient of 0.46. The roof is made of reinforced concrete roof panels, with a 12 mm cement mortar, 100 mm phenolic foam board, and 6 mm waterproof material, with a roof heat-transfer coefficient of 0.46. The external windows feature broken bridge aluminum alloy window frames and insulating glass 6+12A+6, with a heat transfer coefficient 2.9 . According to relevant regulations for hospital building design and research, the building simulation is configured with the foundation settings as shown in Table 1.

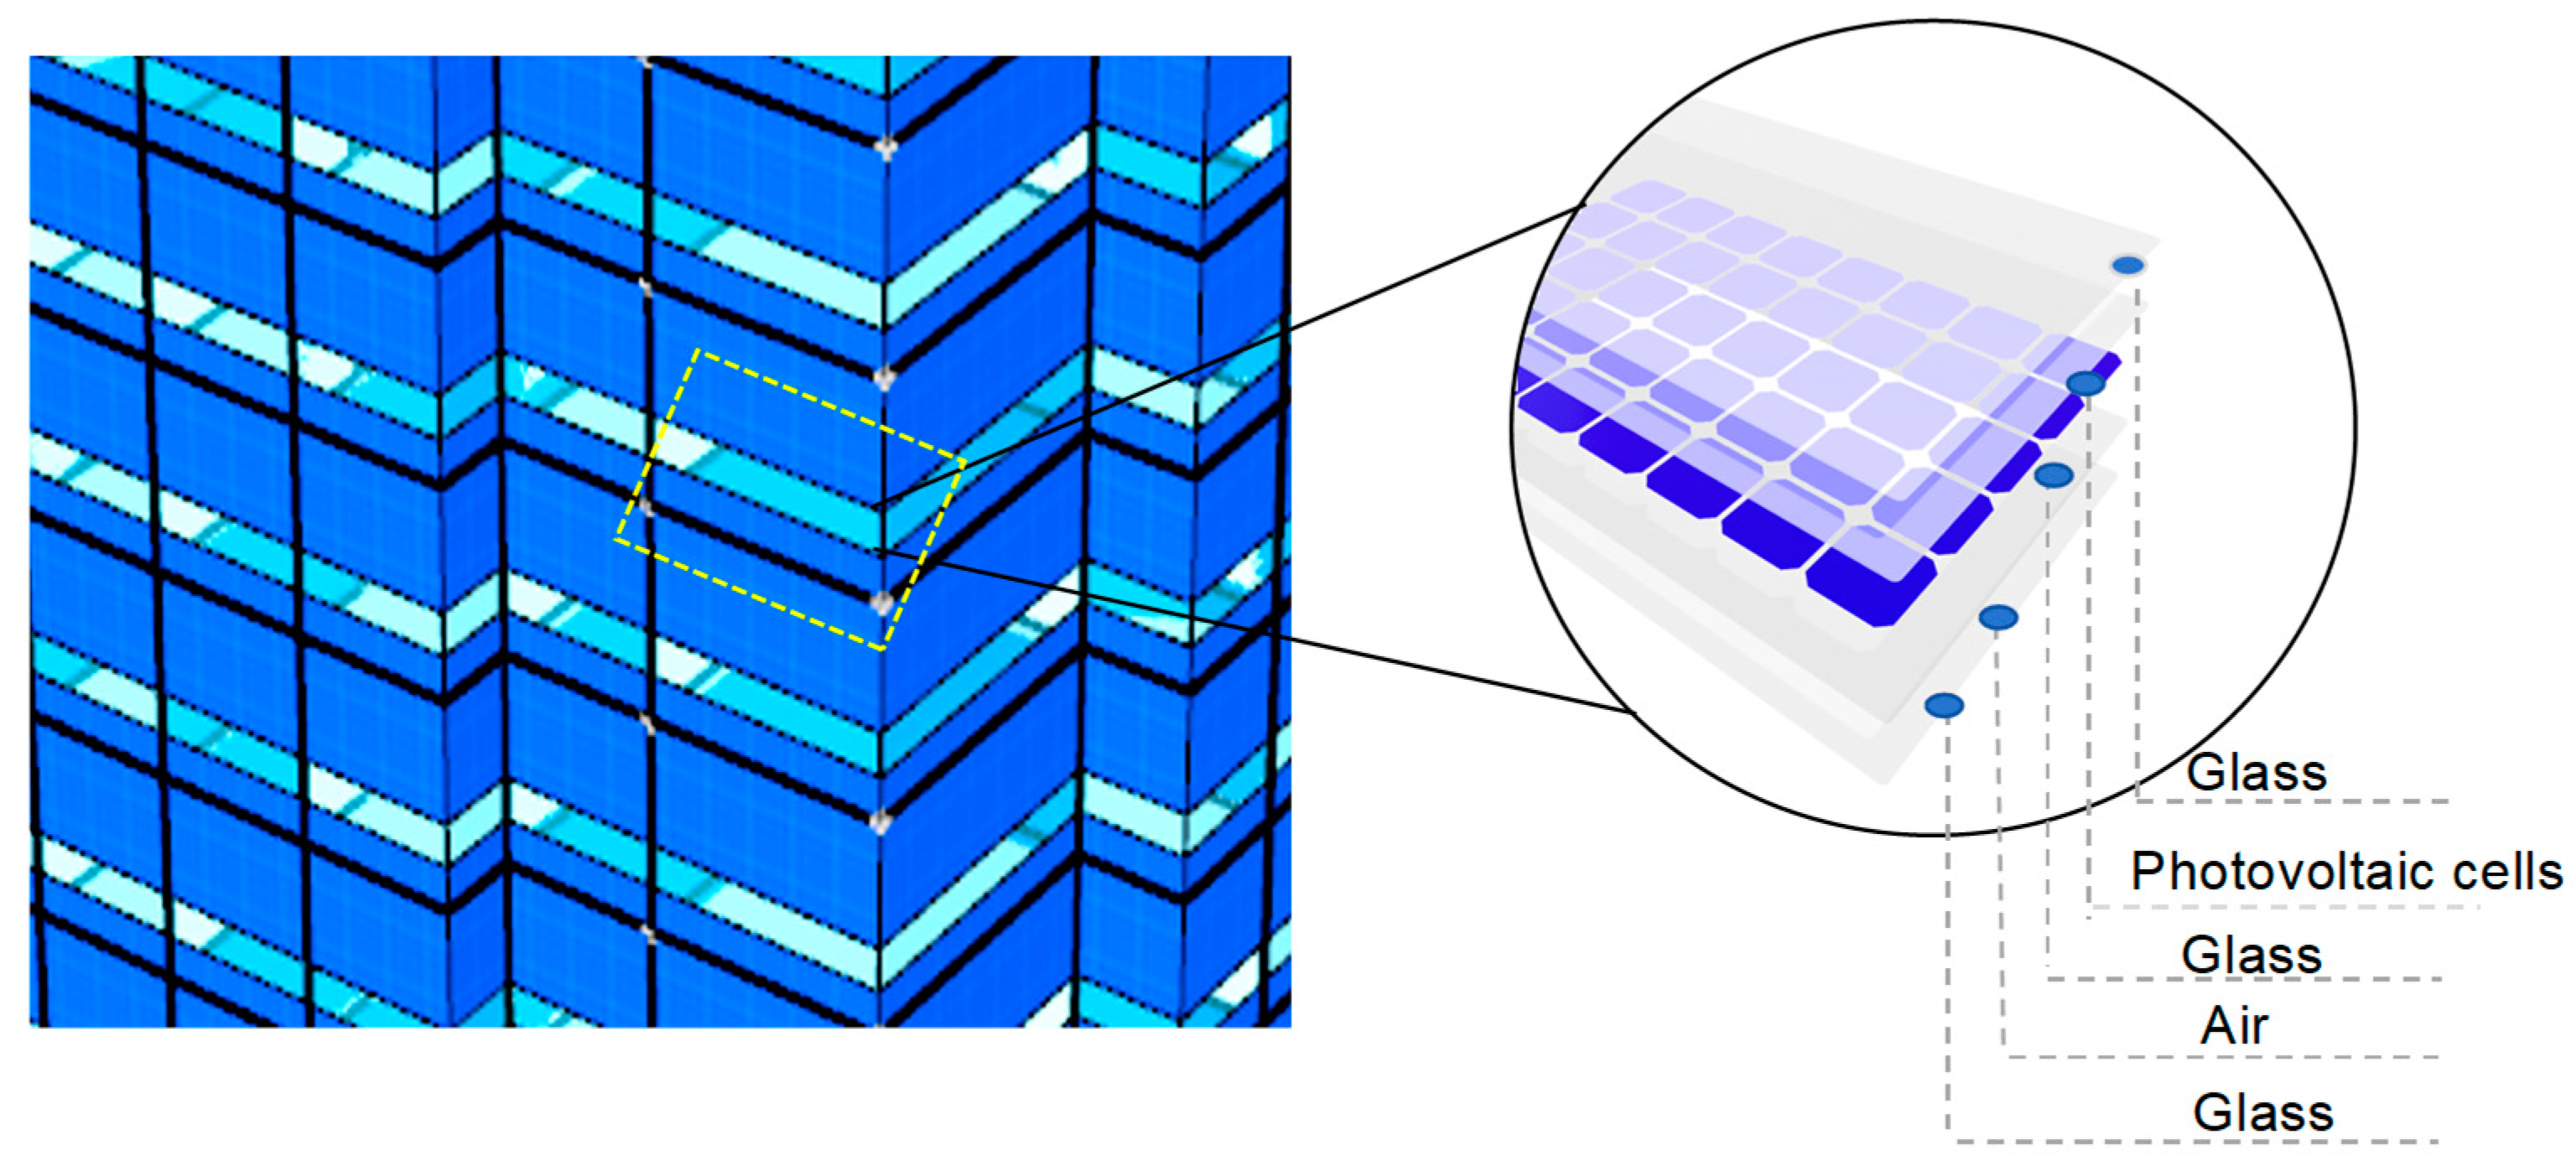
3.1.2. Energy-Plus Modeling

Create a 3D model of the building using SketchUp2017 software, define the thermal zones, and integrate PV modules using OpenStudio. Utilize EnergyPlus to simulate the building’s energy consumption and PV capacity characteristics, adhering to the guidelines outlined in the “Energy Saving Design Standards for Public Buildings” (GB50189) of China [44]. The optimization variables are selected as shown in Table 2. Detailed parameters for monocrystalline silicon PV panels were configured in EnergyPlus using Photovoltaic Performance: Equivalent One-Diode. Parameters for CdTe PV windows were set using the Sandia performance model to predict PV power generation, with a photovoltaic conversion efficiency of 18% for the photovoltaic windows and 19% for the PV panels. According to the Energy-Saving Design Standard for Public Buildings (GB50189-2015) of China, the optimization variables are defined as presented in Table 3. The variation in the heat-transfer coefficient among different types of photovoltaic windows depends on the thickness of the glass, where a higher heat-transfer coefficient corresponds to thicker glass. The PV installation covers 90% of the exterior wall and roof area. Through the research, six types of translucent photovoltaic glass and six types of photovoltaic panels commonly used in the market are selected, and combined with the supplier’s offer and product description, the information of photovoltaic simulation is obtained specifically as shown in Table 2 and Table 4. Figure 2 is a schematic diagram of a photovoltaic window. The semi-transparent cadmium telluride photovoltaic window consists of amorphous silicon thin-film cells made of cadmium telluride material, glass, and a junction box. The building simulation IDF file includes the envelope structure details, operational conditions, and PV module specifications, configured and accessed via JEPlus—a parametric simulation software built upon EnergyPlus. JEPlus enables robust parameterization of optimization variables, allowing for the generation of 300 simulation datasets by utilizing Latin Hypercube Sampling (LHS) methods to sample the optimization variables. These datasets serve as inputs for the PSO-SVM prediction model.

3.2. Lighting Intelligent Control Parameters

To explore the impact of photovoltaic windows on lighting energy consumption, the continuous dimming control mode is employed in EnergyPlus V8.7. According to the “Standard for Architectural Lighting Design”, GB50034-2013 [45], the illuminance at the center of the room at a height of 0.75 m is used as a control point. The illuminance at this control point determines whether artificial lighting needs to be turned on. If the illuminance exceeds 300 lux, the lamps and lanterns remain off. When the illuminance falls below 300 lux, the output power of the lamps and lanterns gradually increases until the ratio of the maximum power output reaches 1. The control principle of continuous dimming is illustrated in Figure 3.

3.3. Optimization of Variable Constraints and Objective Function Establishment

3.3.1. Optimization Variables

The constraints of the multi-objective optimization model are based on the values taken within the requirements for the design of the external envelope in GB50189-2015 Design Standard for Energy Efficiency of Public Buildings of China and GB 50176-2016 Thermal Code for Civil Buildings [44,46]. It is specifically expressed as:
s . t 0.2 x 1 0.4 50 x 2 300 1 x 3 4 1 x 4 6 1 x 5 4 18 x 6 20 0.07 x 7 0.15 0.07 x 8 0.15
x 1 is the window-to-wall ratio,   x 2 is the power of photovoltaic panels, and   x 3 is the four types of roof insulation board type-specific parameters are shown in Table 2 and Table 3, the   x 4 is the six types of PV window types with specific parameters shown in Table 2 and Table 3, the x 5 is the four types of external wall insulation boards, and x 6 for different design heating temperatures. x 7 is the thickness of the roof insulation board, and x 8 is the thickness of the external wall insulation board.

3.3.2. Objective Function

In order to explicitly study the nonlinear relationship between the building envelope and PV system and the comprehensive value of building-energy consumption, building materials and operational phase carbon emissions, and building retrofit and operating costs, the PSO-SVM algorithm is used in this study as a prediction model for the objective function of the genetic algorithm. Comprehensive Value of Building Energy Consumption (G1), building materials and operational-phase carbon emissions (G2), and retrofit and operating costs (G3) are shown in Equation:
f 1 = m i n G 1 p s o s v m r e g r e s s i o n X 1 X n f 2 = m i n G 2 p s o s v m r e g r e s s i o n X 1 X n f 3 = m i n G 3 p s o s v m r e g r e s s i o n X 1 X n

3.4. Benchmark Model Validation

Based on the monitoring data of the property center for 2022–2023 (1 year), the comparison between the original building and the simulation results is shown in Table 5. The discrepancies between the simulation results and the actual results for the combined values of the building’s energy consumption, carbon emissions from construction materials and operational phases, and economic costs are 0.5%, 0.4%, and 0.4%, respectively. Therefore, the results of the construction simulation using the simulated building are accurate and reliable.

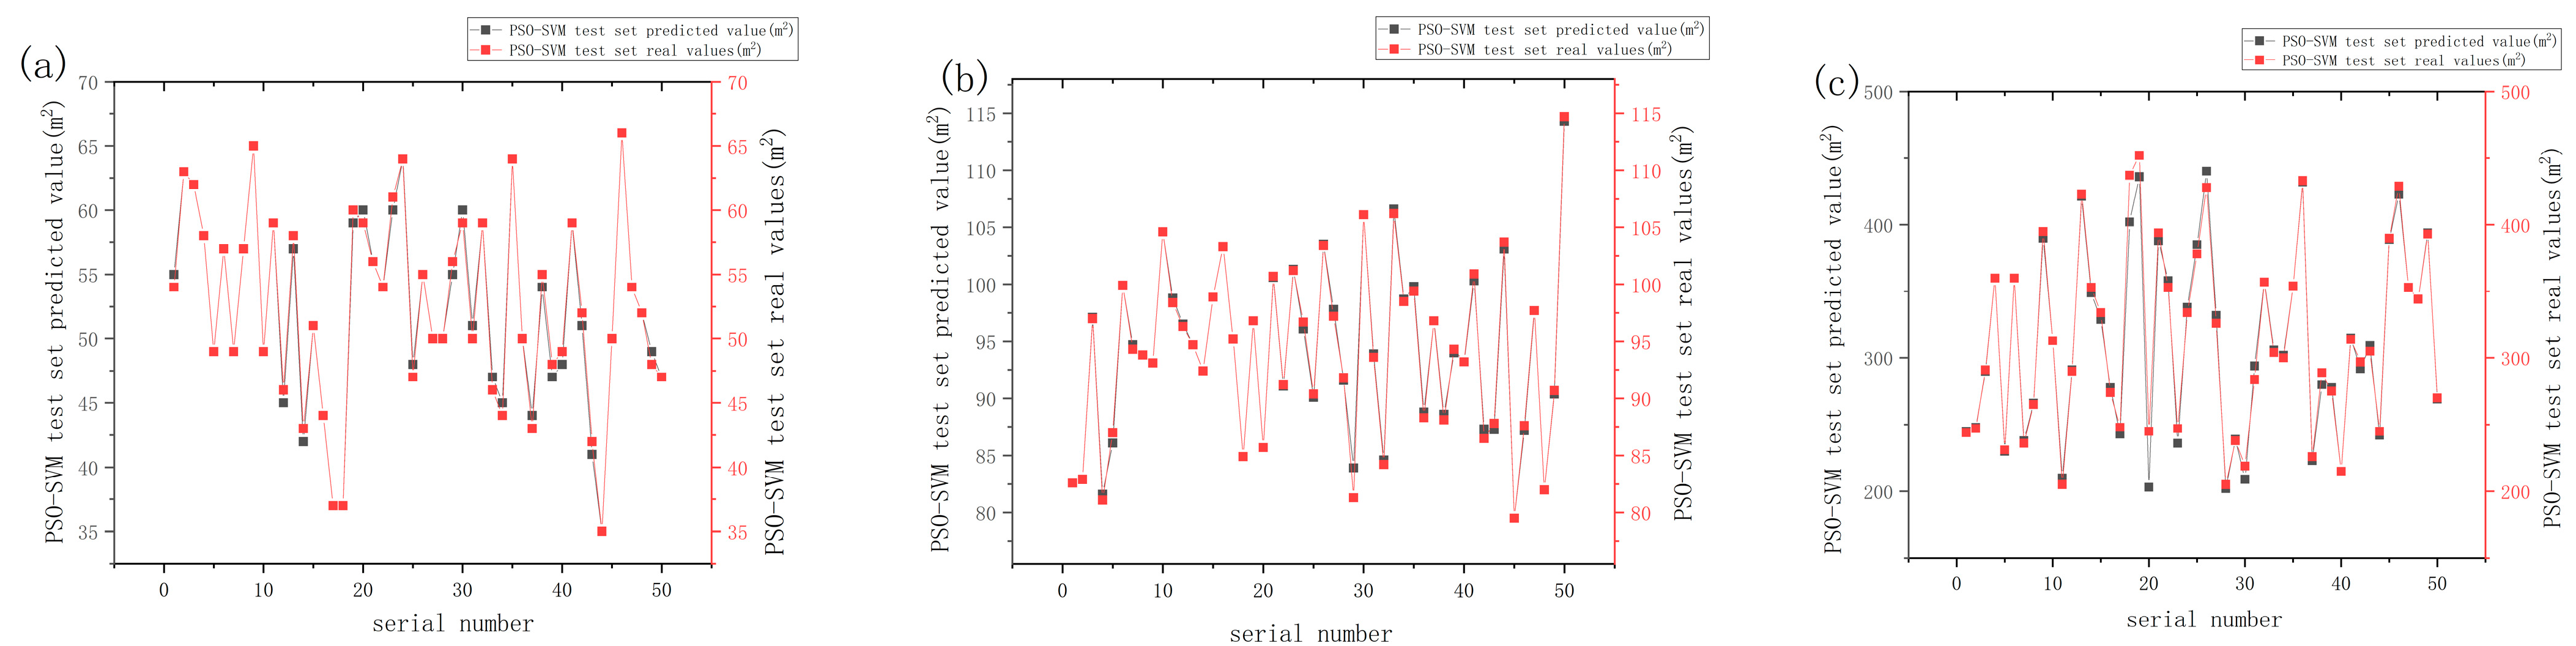
3.5. PSO-SVM Function-Prediction Modeling

The 300 sets of simulation data generated by JEPlus V2.1 were divided into training and testing sets, with 80% allocated to the training set and 20% to the testing set. As shown in Figure 4, the R2 values of the test set, predicted using PSO-SVM for comprehensive building energy consumption, building materials and operational phase carbon emissions, and retrofits, are 0.978, 0.987, and 0.986, respectively. The RMSE values for the test set are 0.012, 0.038, and 0.043, respectively. With all R2 values exceeding 0.97 and all RMSE values below 0.09, the PSO-SVM model demonstrates robust predictive capability for comprehensive building values, carbon emissions from building materials and the operational phase, and renovation costs. This substantiates the feasibility of constructing PSO-SVM models for multi-objective optimization.

3.6. Implementation of the PSO-SVM-NSGA-II Algorithm

First, a population of 100 solutions is randomly generated, with each individual containing the SVM parameters. During the iterative optimization process, Particle Swarm Optimization (PSO) is used to update the SVM hyperparameters of the individuals. The SVM model is trained to evaluate the objective function values, and non-dominated sorting is performed based on these values. New generations are created through selection, crossover, and mutation using crowding distance comparison.
In this optimization setup, there are three objective functions ( n o b j = 3), the initial population size is set to 100 ( n p o p ), and the maximum number of iterations is set to 100. The crossover probability is 0.8 ( p c ), with 80% of the individuals undergoing crossover, and the mutation probability is set to 0.05 ( μ ). The lower bounds for the constraint variables are varmin = [0.2, 50, 7, 1, 7, 18, 0.07, 0.07], and the upper bounds are varmax = [0.4, 300, 10, 6, 10, 20, 0.15, 0.15], with the step size derived from these bounds. The PSO parameters include a local search coefficient c 1 set to 1.5, a global search coefficient c 2 set to 1.7, the maximum number of generations maxgen set to 100, the population size sizepop set to 10, an acceleration coefficient k set to 0.6, and inertia weights w V and w P both set to 1. The SVM cross-validation parameter v is set to 5, with the SVM parameters c and g ranging from 0.1 to 100.
Therefore, this study selects PSO-SVM-NSGA-II as the algorithm for multi-objective optimization due to its effective combination of global search, local search, and multi-objective optimization capabilities, which significantly enhance search efficiency and optimization performance, especially for large-scale and complex problems.

4. Findings and Analysis

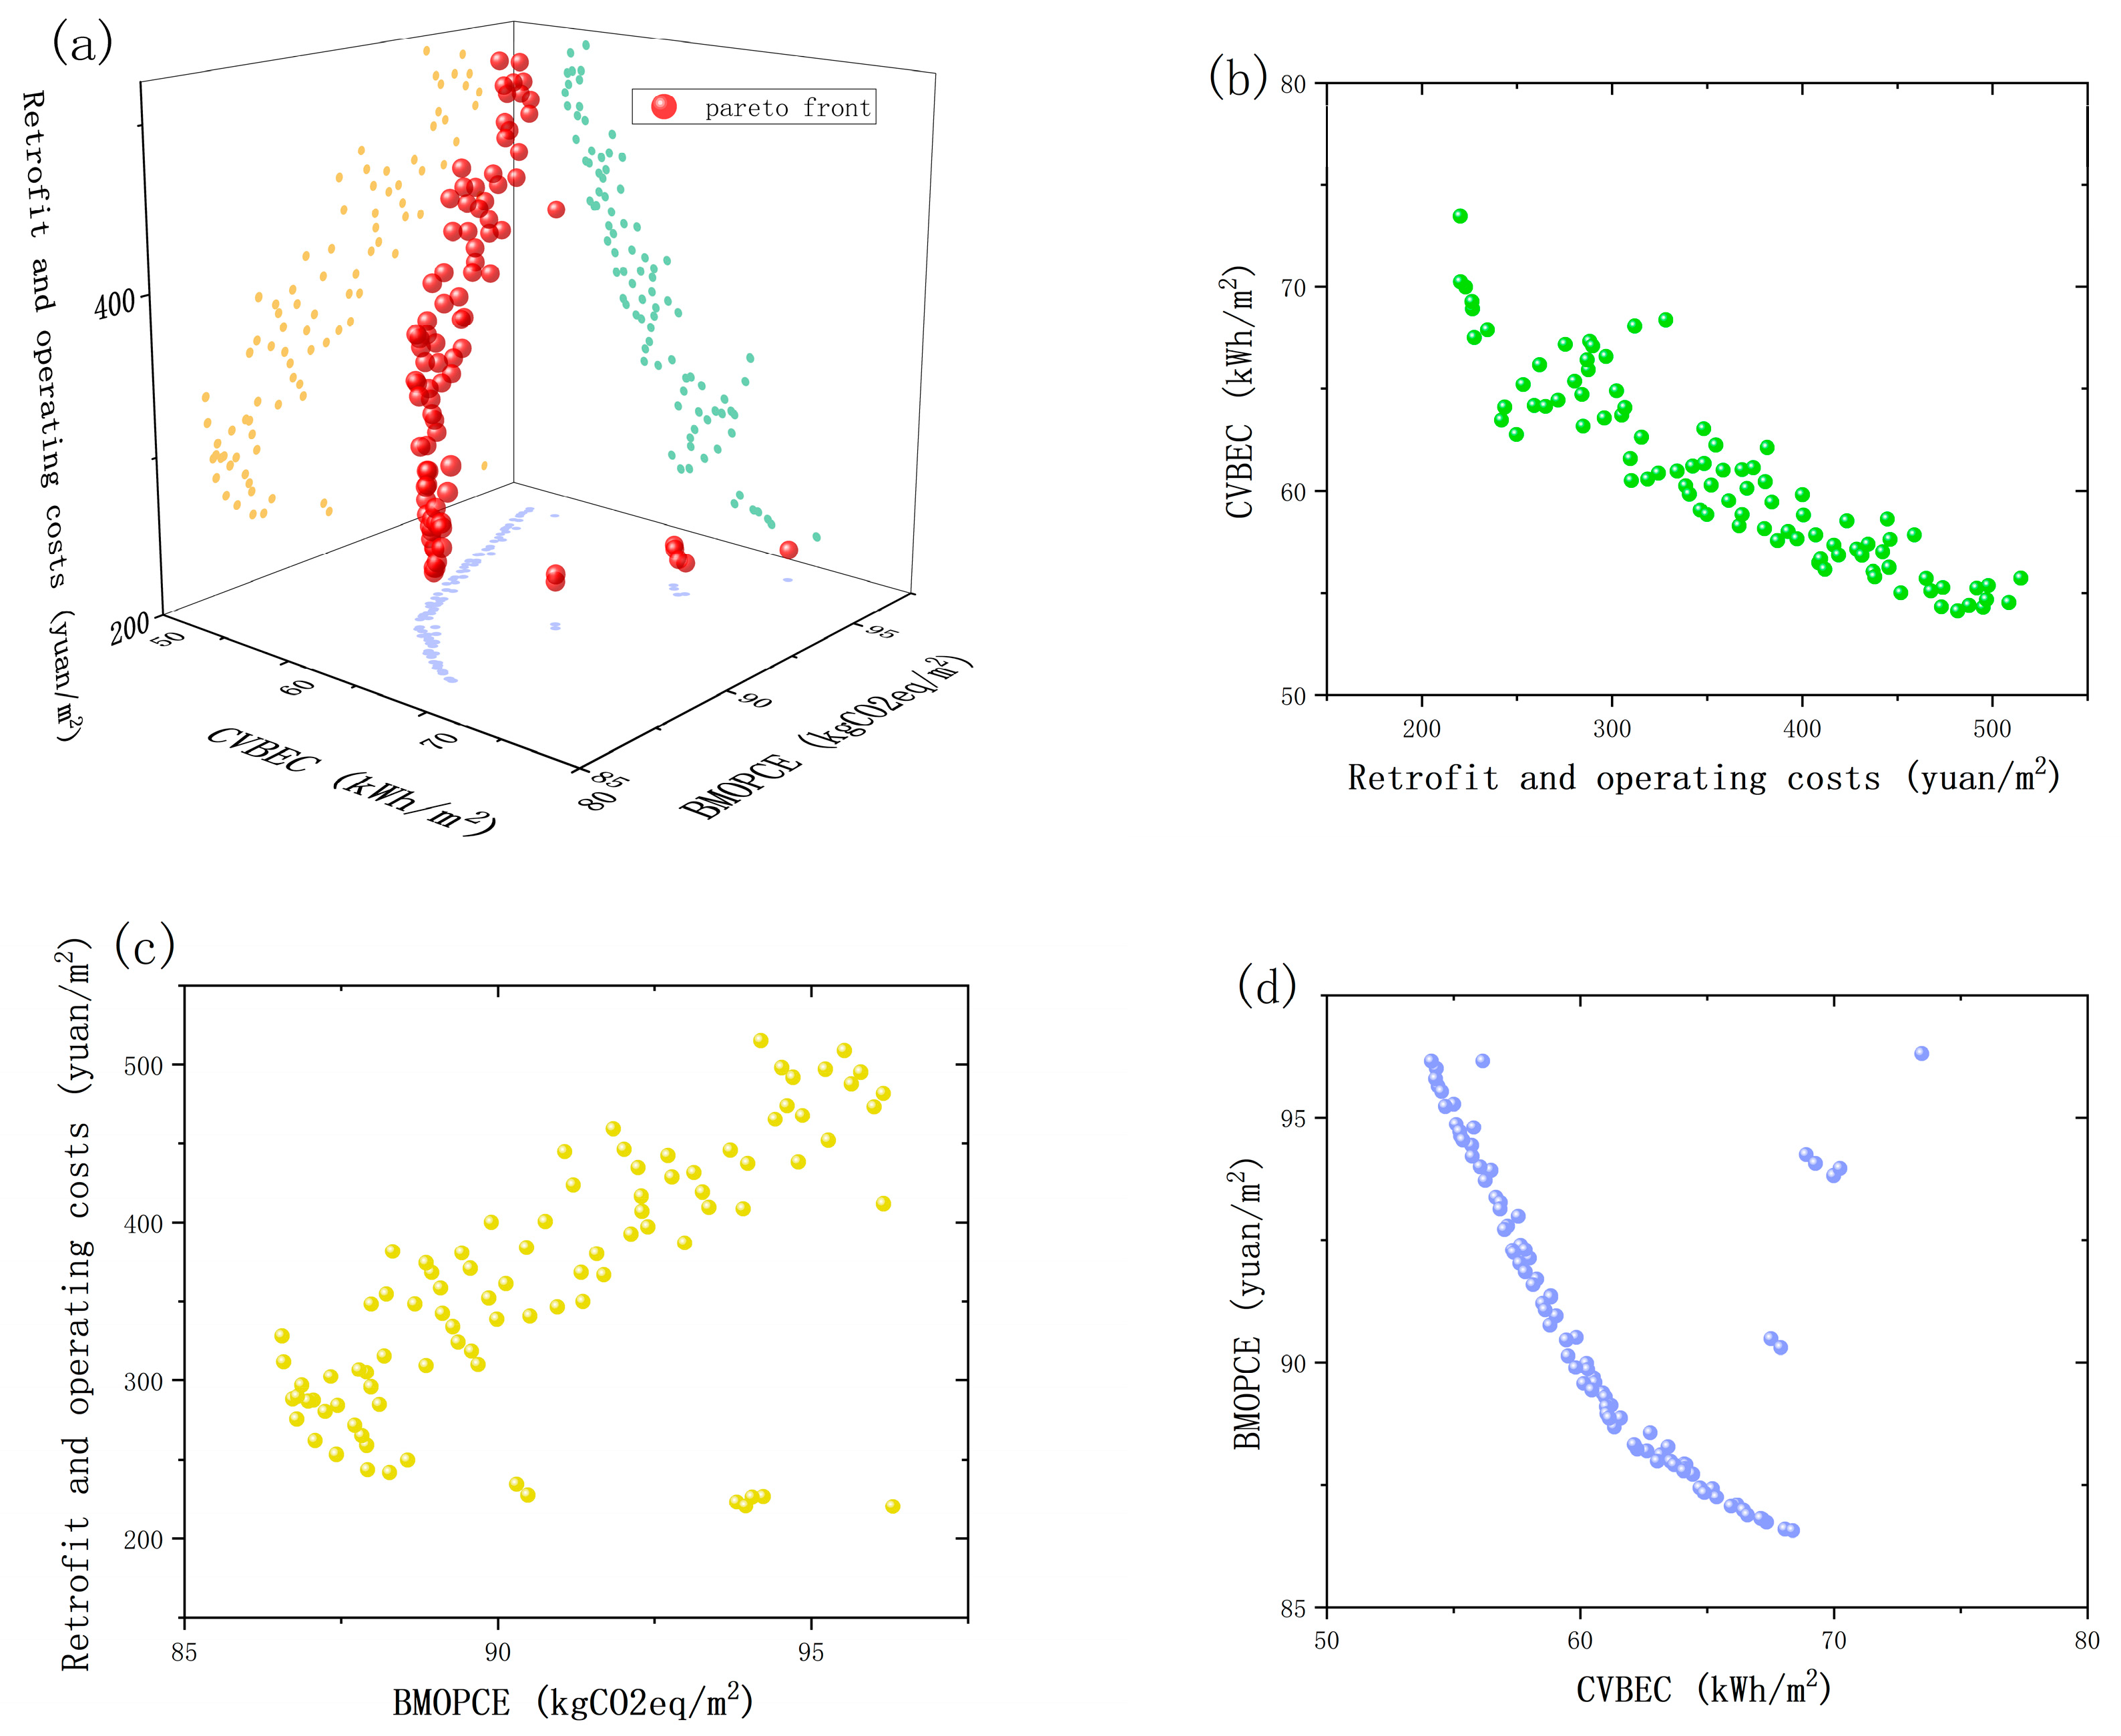
4.1. Multi-Objective Optimization Results and Analysis

After 100 iterations, the NSGA-II algorithm converged and ultimately obtained 100 sets of Pareto optimal solutions. Use the weighted TOPSIS method to assign weights and rank the optimization objectives based on the obtained Pareto solution set. After comprehensive consideration, the weight allocation is as follows: the comprehensive value of the building is 1/3, the cost of the building renovation is 1/3, and the building materials and operational phase carbon emissions of the building are 1/3.
The Pareto solution set from the final generation is illustrated in Figure 5a, with scatter plots for building energy consumption versus renovation cost, energy consumption versus carbon emissions, and carbon emissions versus renovation cost depicted in Figure 5b–d, respectively. In the three-dimensional scatter plot 5(a), the comprehensive building energy consumption values in the Pareto solution range from 53–73 kWh/m2, building materials and operational phase carbon emissions span from 83–93 kgCO2eq/m2, and renovation costs vary between 220–514 yuan/m2.
Based on the distance and comprehensive score between each evaluation indicator and the positive and negative ideal solutions, Scheme 62 achieved the highest comprehensive score of 0.6739. The final values for the optimization variables are as follows: a window-to-wall ratio of 0.2, a photovoltaic panel power of 50 W, a double-layer photovoltaic Glass 2 for the photovoltaic window, a winter heating control temperature of 18.4 degrees Celsius, a 70 mm-thick XPS board for roof insulation, and a 90 mm-thick PU board for external wall insulation. This scheme results in a comprehensive energy consumption value of 63 kWh/m2, building materials and operational phase carbon emissions of 88 kgCO2eq/m2, and a retrofit of 228 yuan/m2.
Based on the results of the optimal solution, the annual energy consumption for air conditioning and lighting is reduced to 63 kWh/m2, which is 41% lower compared to the original building of 105 kWh/m2. The standard calculation for the PV life cycle is 25 years. The carbon emissions for 25 years of operation are calculated based on the annual operational energy consumption and the carbon emission factor of the Inner Mongolia power grid. The carbon emissions from the production phase of the retrofit materials are determined using the carbon emission factors of monocrystalline silicon PV modules and cadmium telluride PV modules, as referenced in the relevant literature [47,48]. The initial investment for the retrofit is CNY 2.27 million, and the use of photovoltaic modules saves about CNY 210,000 of operating costs per year, with a payback period of about 11 years, as shown in Table 6.

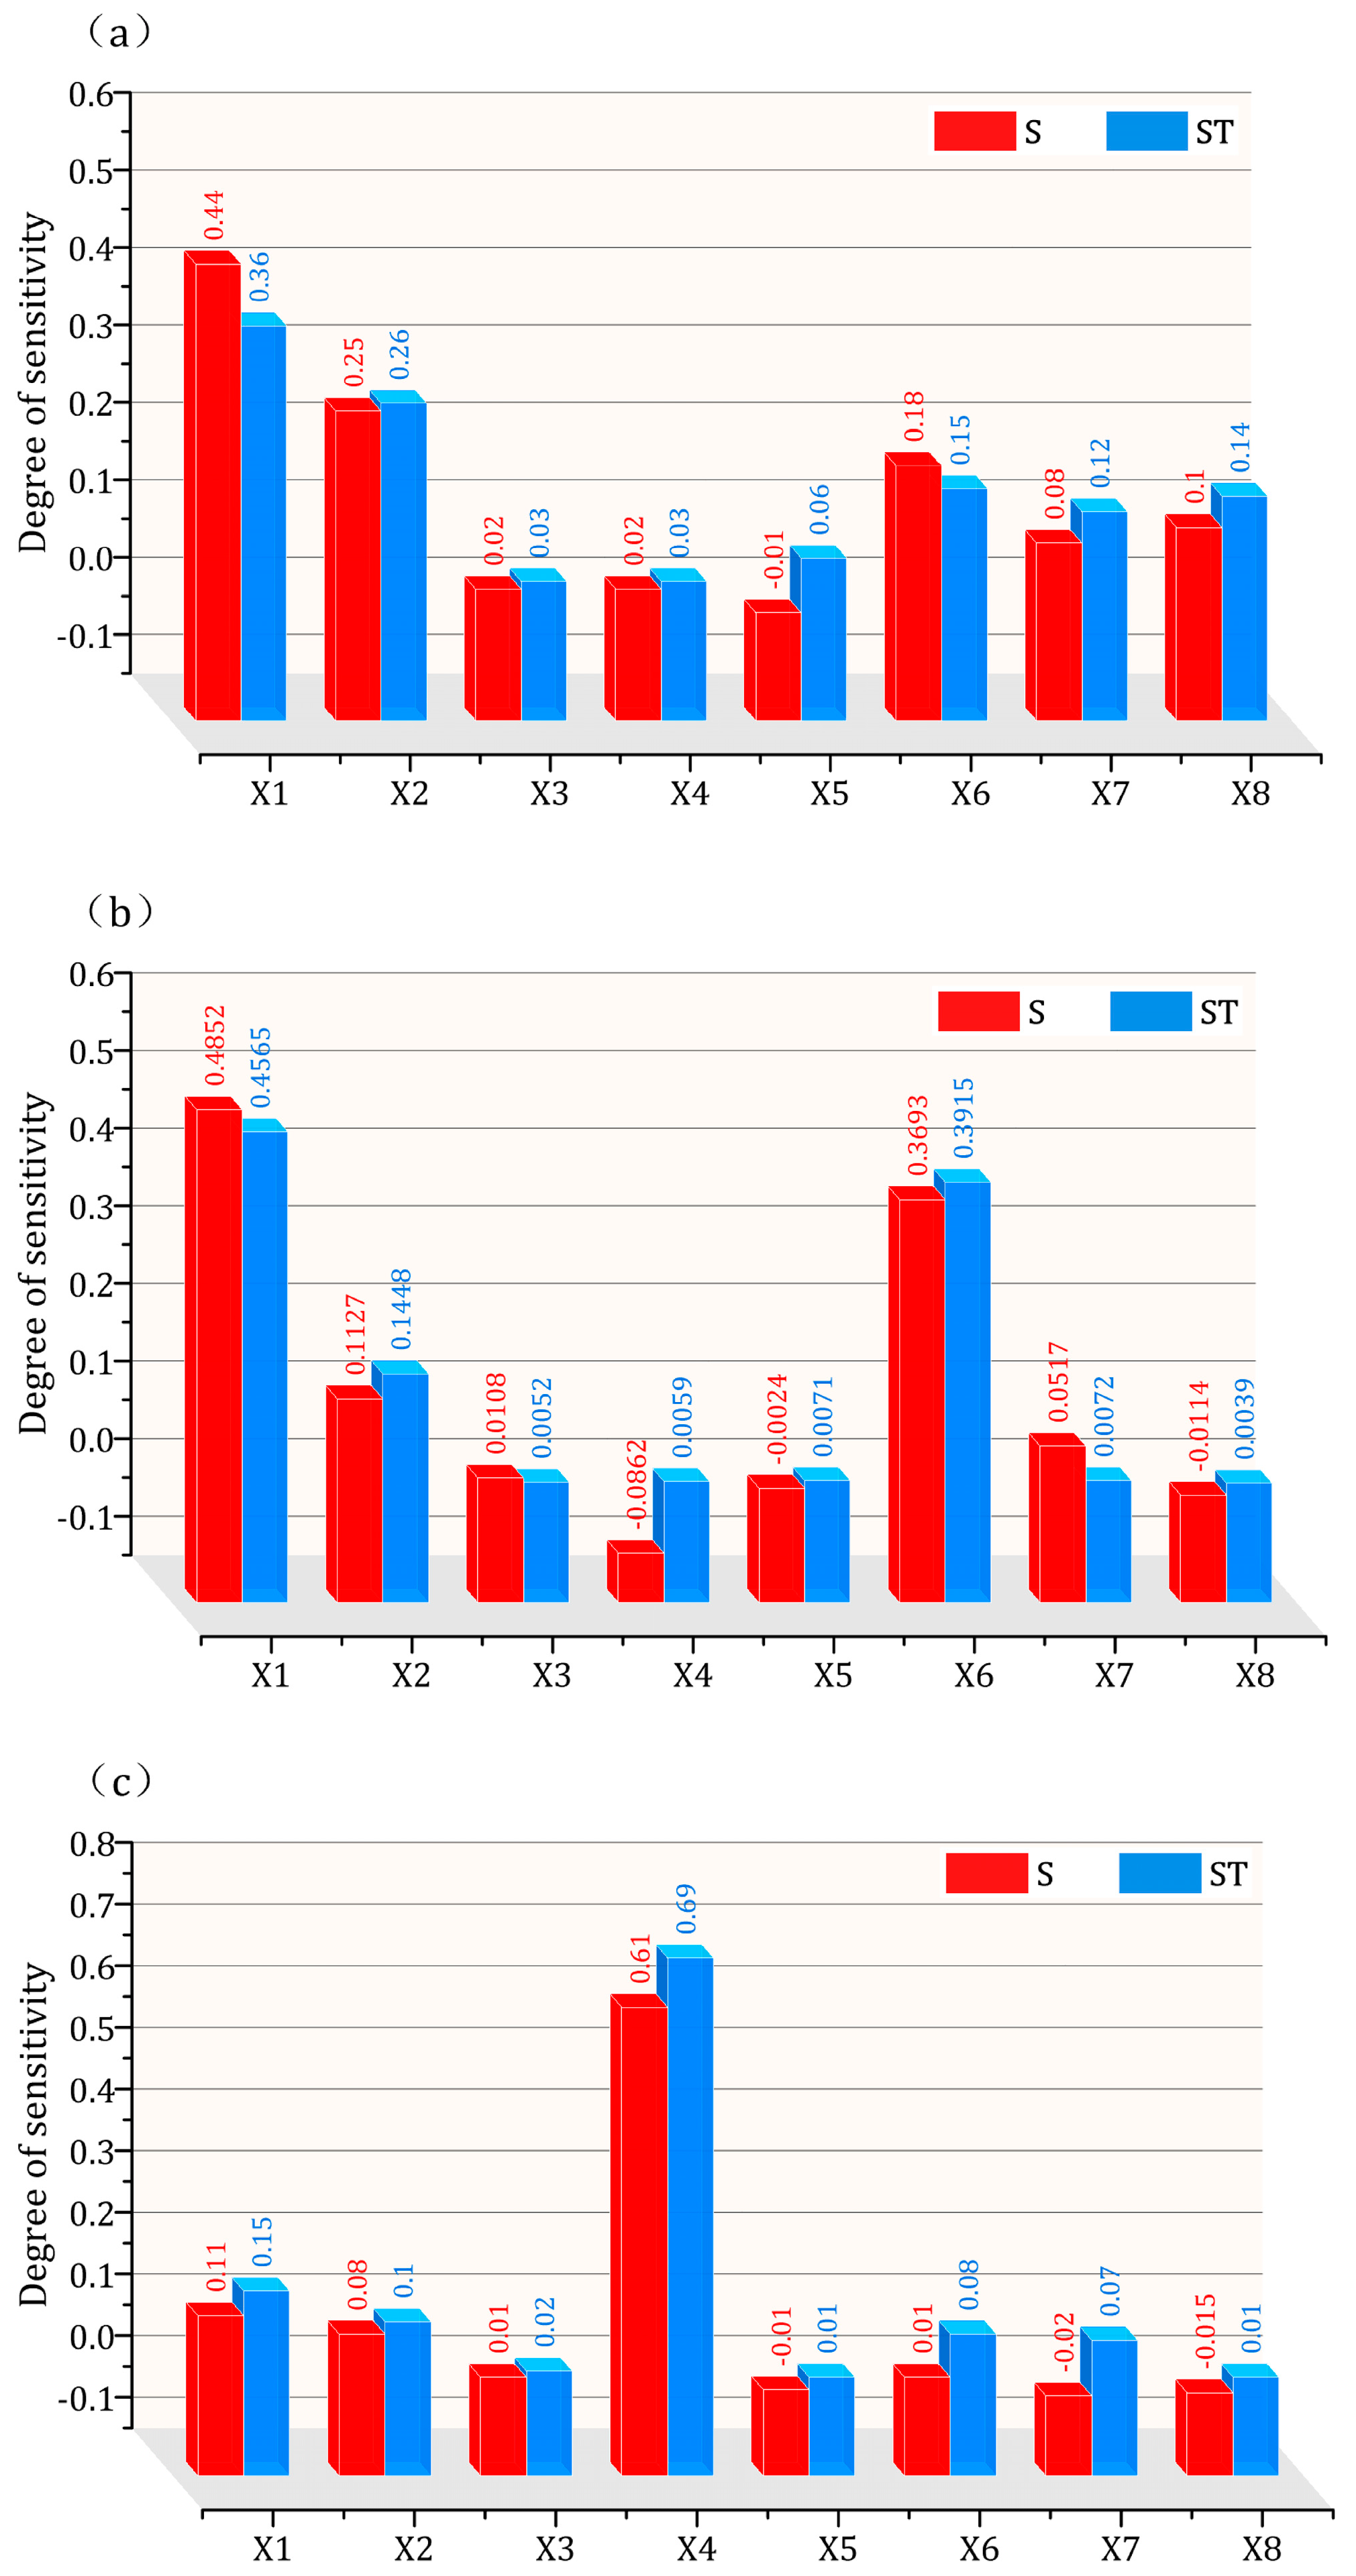
4.2. Global Sensitivity

In this study, the PSO-SVM algorithm was employed as a surrogate model to predict three objectives in MATLAB, with the prediction results illustrated in Figure 6. The Sobol method was utilized for the global sensitivity analysis of the predictive model. In Figure 2 and Figure 3, blue bars indicate the first-order indices (S), while red bars represent the total-order indices (ST). The first-order indices, or main effects, and the total-order indices, or total effects, reveal the impact of variable interactions. The influencing factors, denoted as X1, X2, X3, X4, X5, X6, X7, and X8, correspond to the window-to-wall ratio, photovoltaic panel power, roof insulation type, photovoltaic window type, external wall insulation board type, winter indoor air conditioning temperature, roof insulation thickness, and external wall insulation thickness, respectively.
Overall, the first-order index reveals that the window-to-wall ratio has the most substantial impact on comprehensive building energy consumption, whereas photovoltaic panel power significantly influences building materials and operational-phase carbon emissions. Regarding retrofits, the type of photovoltaic window has the greatest total impact, followed by the window-to-wall ratio and photovoltaic panel power. The least significant factors are the winter air conditioning temperature and the thickness and type of wall and roof insulation layers.
According to Figure 6a, the main effect of the window-to-wall ratio on comprehensive building energy consumption reaches as high as 0.45. This high-impact value underscores the pivotal role of the window-to-wall ratio in the building energy system. A high window-to-wall ratio results in a smaller area for photovoltaic panels, thereby increasing thermal loads and, consequently, the overall building energy consumption. Conversely, the type of photovoltaic window, as well as the thickness of the wall and roof insulation, is inversely related to comprehensive building energy consumption. An increase in the thermal transmittance coefficient of photovoltaic windows and the thickness of wall and roof insulation layers leads to a reduction in comprehensive building energy consumption.
Regarding building materials and operational-phase carbon emissions, as shown in Figure 6b, the window-to-wall ratio and winter heating design temperature are the two most influential factors, with influence values of 0.45 and 0.39, respectively. Increased design temperatures lead to higher carbon emissions from electricity. The next most significant factor is the photovoltaic panel power; every 50 W increase in photovoltaic panel power increases the panel thickness by 2 mm, resulting in higher carbon emissions from the panels.
For retrofits, as shown in Figure 6c, different photovoltaic window types have varying effects on transparency and thermal transmittance. Higher transparency and lower thermal transmittance photovoltaic windows are more expensive, making them the main factor affecting retrofits, with an influence as high as 0.61. The thickness and type of wall and roof insulation layers are inversely related to building costs; as thickness increases, insulation costs also rise, but the overall impact on costs is minimal, less than 0.1.
The total-order indices indicate that the ranking of the eight variables in terms of their first-order and total-order indices for the comprehensive value of building energy consumption, building materials and retrofit stage carbon emissions, and retrofit and operating costs are consistent. This consistency suggests that the ranking of variables in terms of their primary and overall influence is aligned. The overall influence of a variable primarily stems from its interactions with other variables rather than from its individual main effect, indicating that its impact is moderated or enhanced by other variables. In the context of overall building energy consumption, the main effect of photovoltaic panel power is 20% higher than its total effect, indicating that the influence of photovoltaic panel power is primarily direct. This means that when other variables remain constant, the impact of this variable on the output is substantial and is less affected by other variables.

4.3. Localized Sensitivity

The primary determinants influencing comprehensive building energy consumption, costs, and carbon emissions are revealed by the first-order and total-order indices of global sensitivity. These determinants include the window-to-wall ratio, type of photovoltaic window, and power of photovoltaic panels. The objective function is impacted by the interaction of these factors. To thoroughly analyze the relationship between the optimization variables and the objective function, further investigation is necessary. Additionally, it is crucial to examine in detail the relationship between the transmittance of photovoltaic windows and lighting energy consumption. Indoor lighting conditions are directly affected by the transmittance of photovoltaic windows, thereby impacting the usage of the lighting system. Conducting a detailed analysis of the relationship between transmittance and lighting energy consumption allows for a more comprehensive evaluation of the role of photovoltaic windows in overall building energy consumption.

4.3.1. Impact of PV Panels with Different Power Generation and Window-to-Wall Ratio on the Comprehensive Value of Building Energy Consumption

To more intuitively illustrate the characteristics of the influence of PV panel power on the comprehensive value of building energy consumption, the PV panel power and window-wall ratio are used to classify the range of values. The results of the calculations are then plotted in a point-line diagram, as shown in Figure 7. The laying area of photovoltaic panels is affected by the panel’s power. For instance, a 300 W photovoltaic panel requires a larger monolithic area. Consequently, in buildings with the same area, larger power generation leads to relatively reduced panel laying. Overall, the renewable power generation of PV panels exhibits an inverse relationship with the window-to-wall ratio. In the window-to-wall ratio range of 0.2–0.4, the annual renewable power generation of PV panels ranging from 50–300 W is approximately reduced by 16%. Additionally, within this same window-to-wall ratio range, PV panels with power ratings between 50 W and 300 W lead to a reduction in carbon emissions by approximately 2% to 4%.

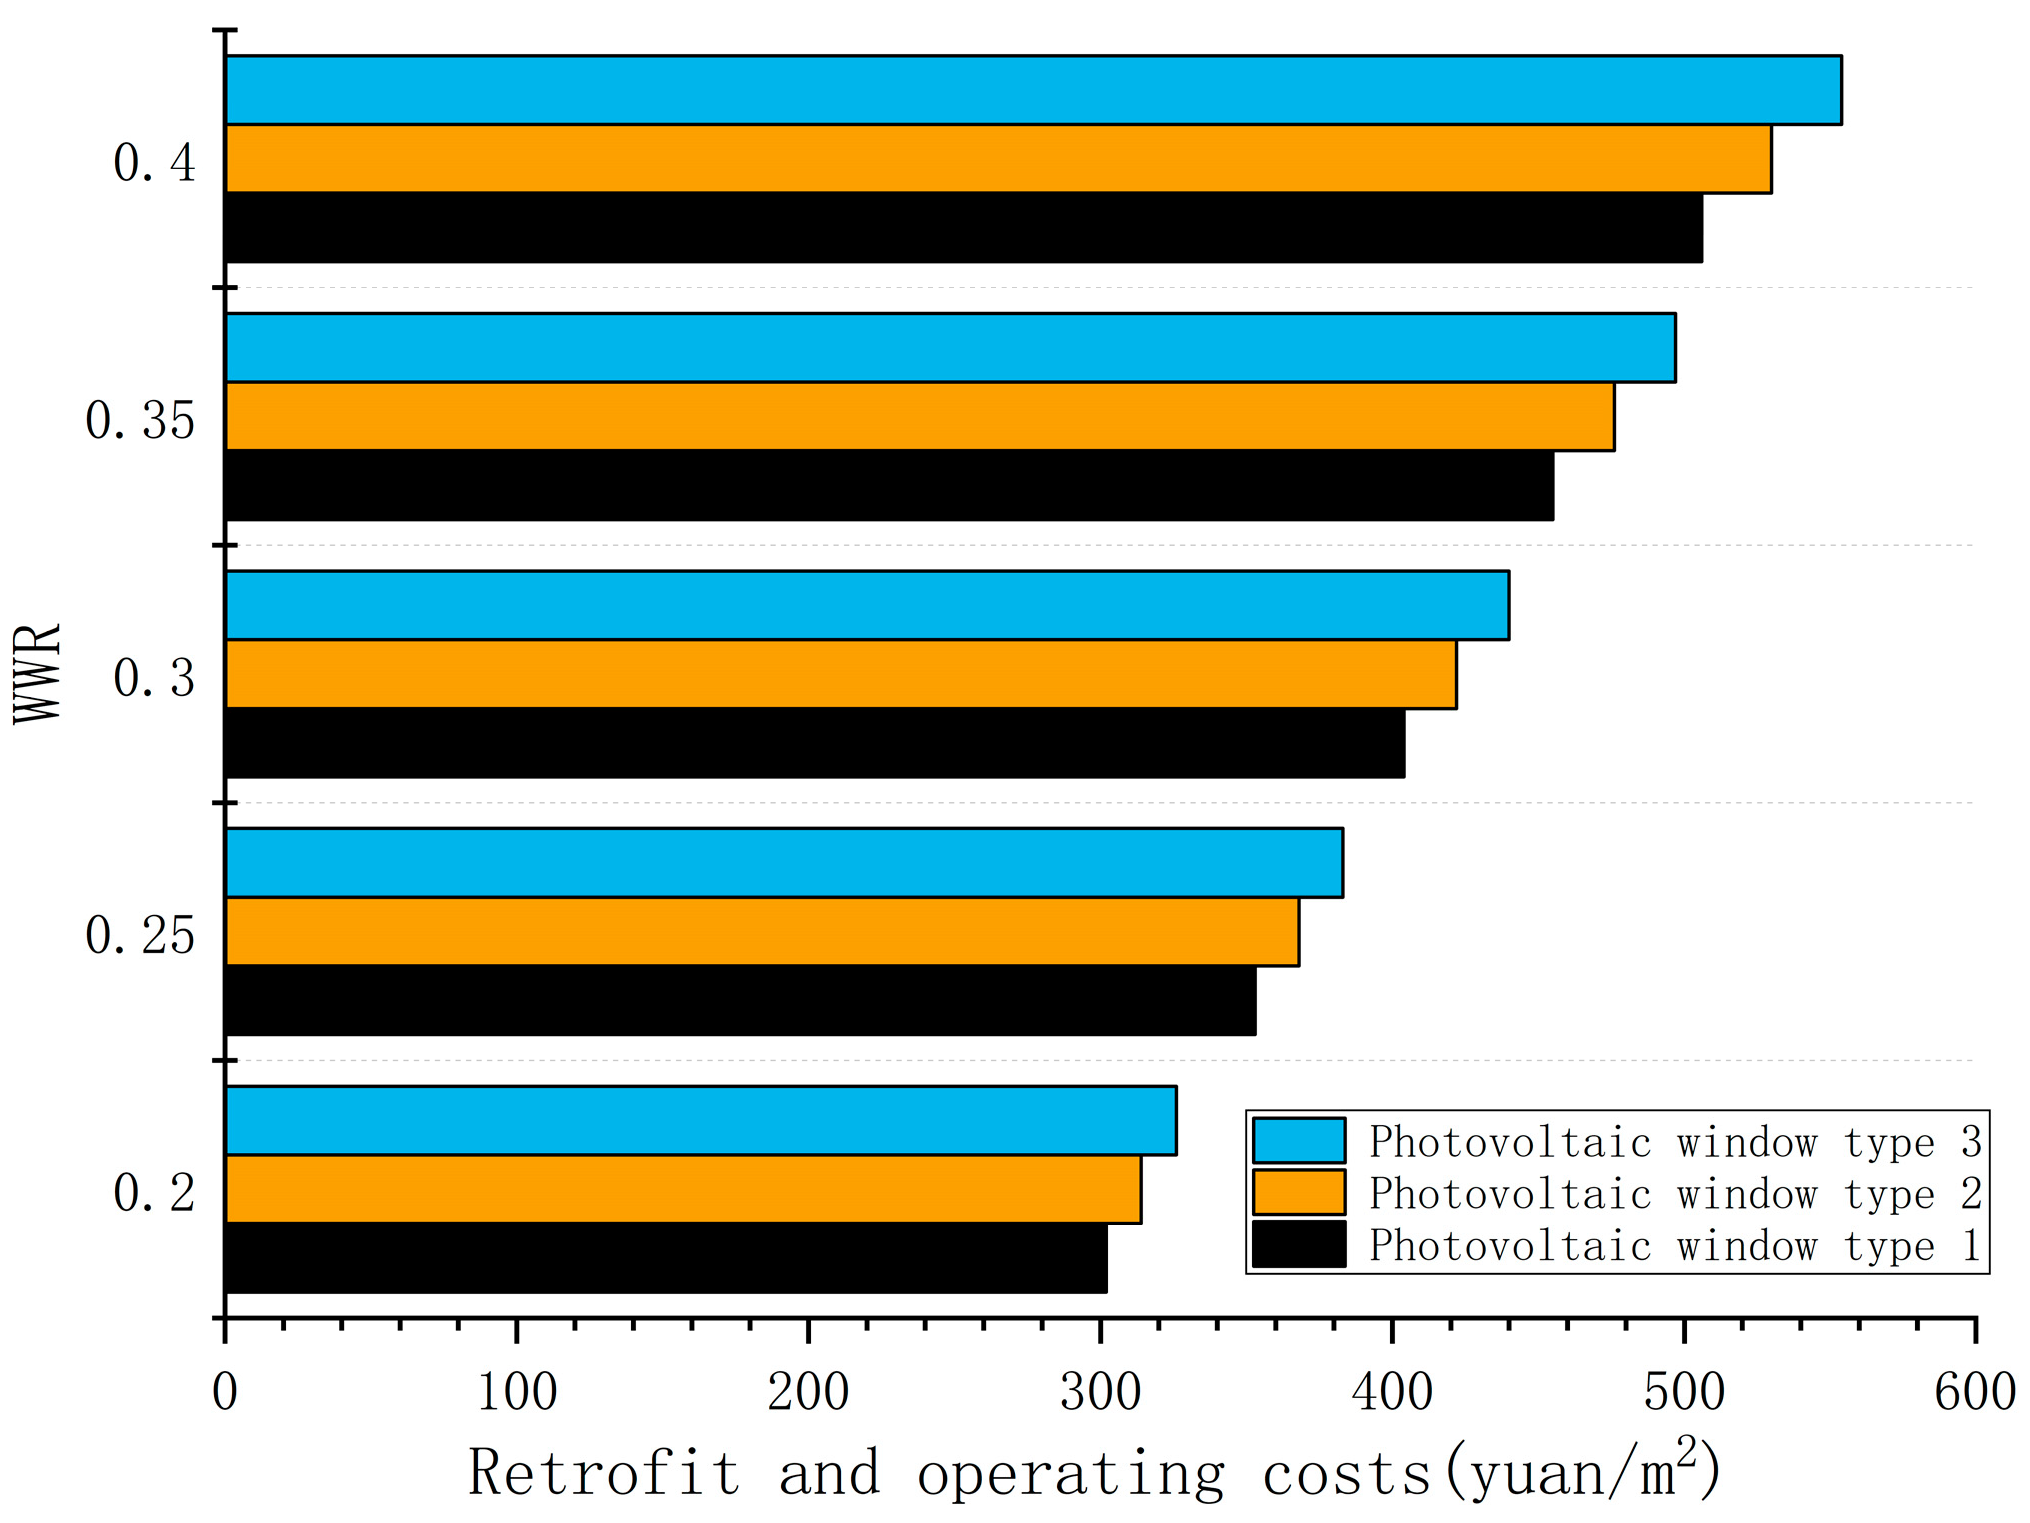
4.3.2. Impact of Different PV Window-to-Wall Ratios on Retrofit and Operating Costs

Photovoltaic windows are typically more expensive than traditional windows due to their photovoltaic conversion function. A higher window-to-wall ratio increases the window area in a building, thus increasing the overall cost of the building. It can be observed from the cost prices that Photovoltaic Windows 1 and 2 have the same unit price but different light transmittance, and the same applies to Photovoltaic Windows 3, 4, 5, and 6. Therefore, the six types of photovoltaic windows are divided into three categories. As shown in Figure 8, the cost of photovoltaic windows is directly proportional to the window-to-wall ratio. In the window-to-wall ratio range of 0.2 to 0.4, the cost of using Photovoltaic Windows 1 and 2 ranges from CNY 204 to 408/m2, while the cost of using Photovoltaic Windows 3 and 4 ranges from CNY 216 to 432/m2, and the cost of using Photovoltaic Windows 5 and 6 ranges from CNY 228 to 456/m2. The retrofit increases as the thermal transmittance of the photovoltaic windows decreases.

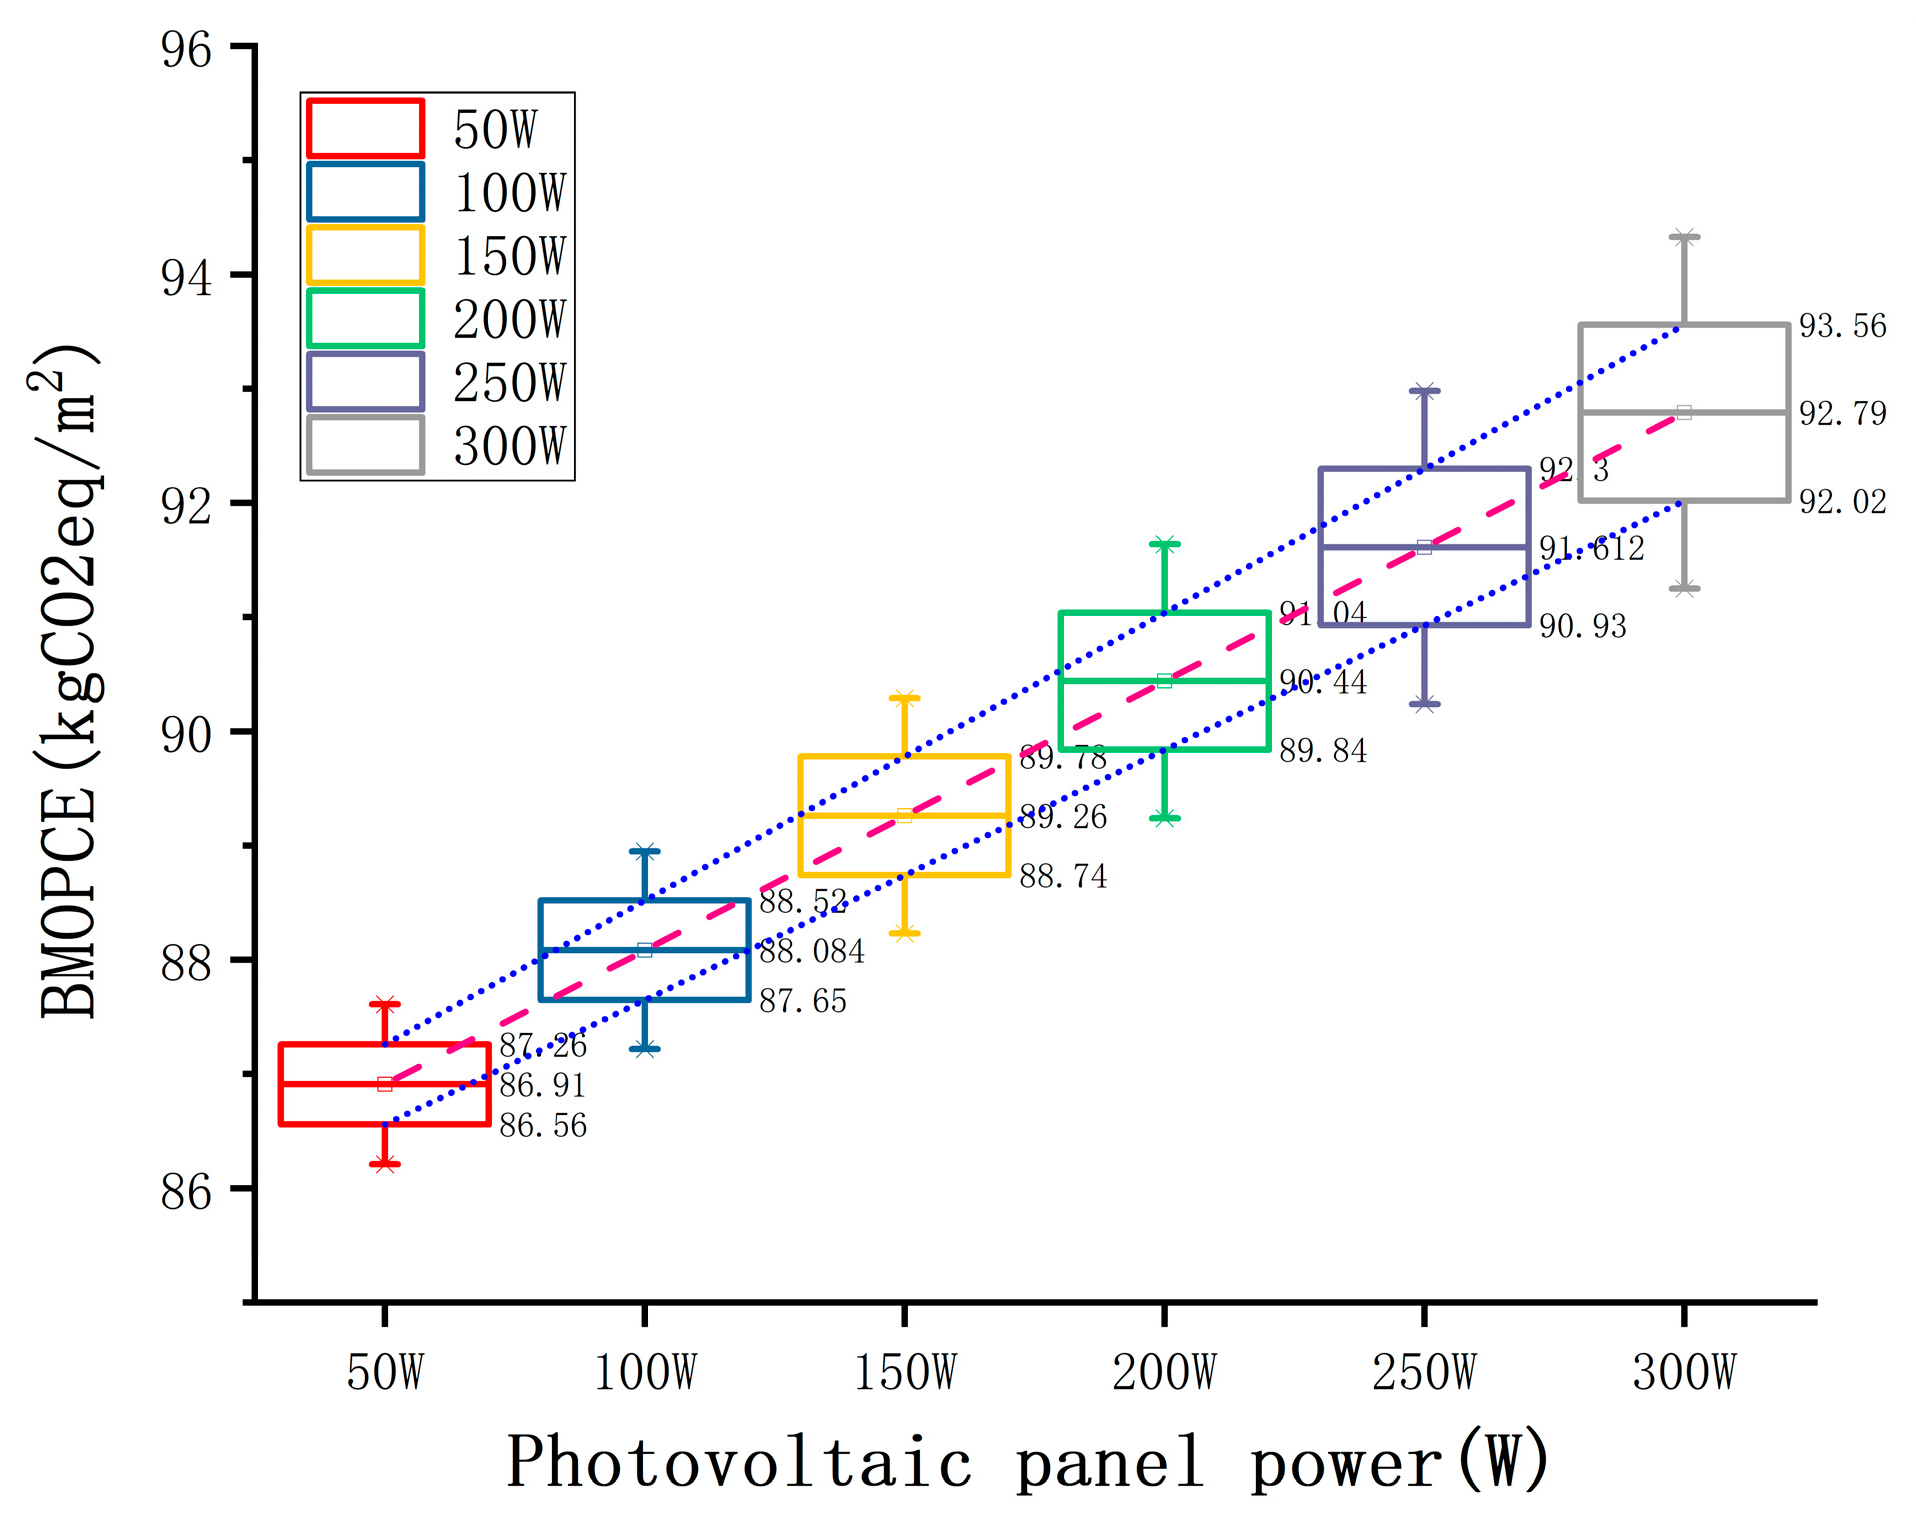
4.3.3. Effect of Different Power PV Panels to Window-to-Wall Ratio on BMOPCE

Figure 9 demonstrates that the power-generation capacity of photovoltaic panels has a pronounced positive effect on reducing carbon emissions. The manufacturing process of cadmium telluride photovoltaic panels is relatively streamlined and energy-efficient, involving fewer steps and lower energy consumption. In contrast, the production process of monocrystalline silicon photovoltaic panels is more complex, involving high-temperature treatment and multiple production steps, resulting in nearly twice the carbon emissions per square meter compared to cadmium telluride. Due to the low cost of monocrystalline silicon, many buildings use monocrystalline silicon photovoltaic panels. For every additional 50 W of monocrystalline silicon photovoltaic panels, the thickness of the panels increases by 2 mm, and carbon emissions increase by 1.48 kgCO2eq/m2.

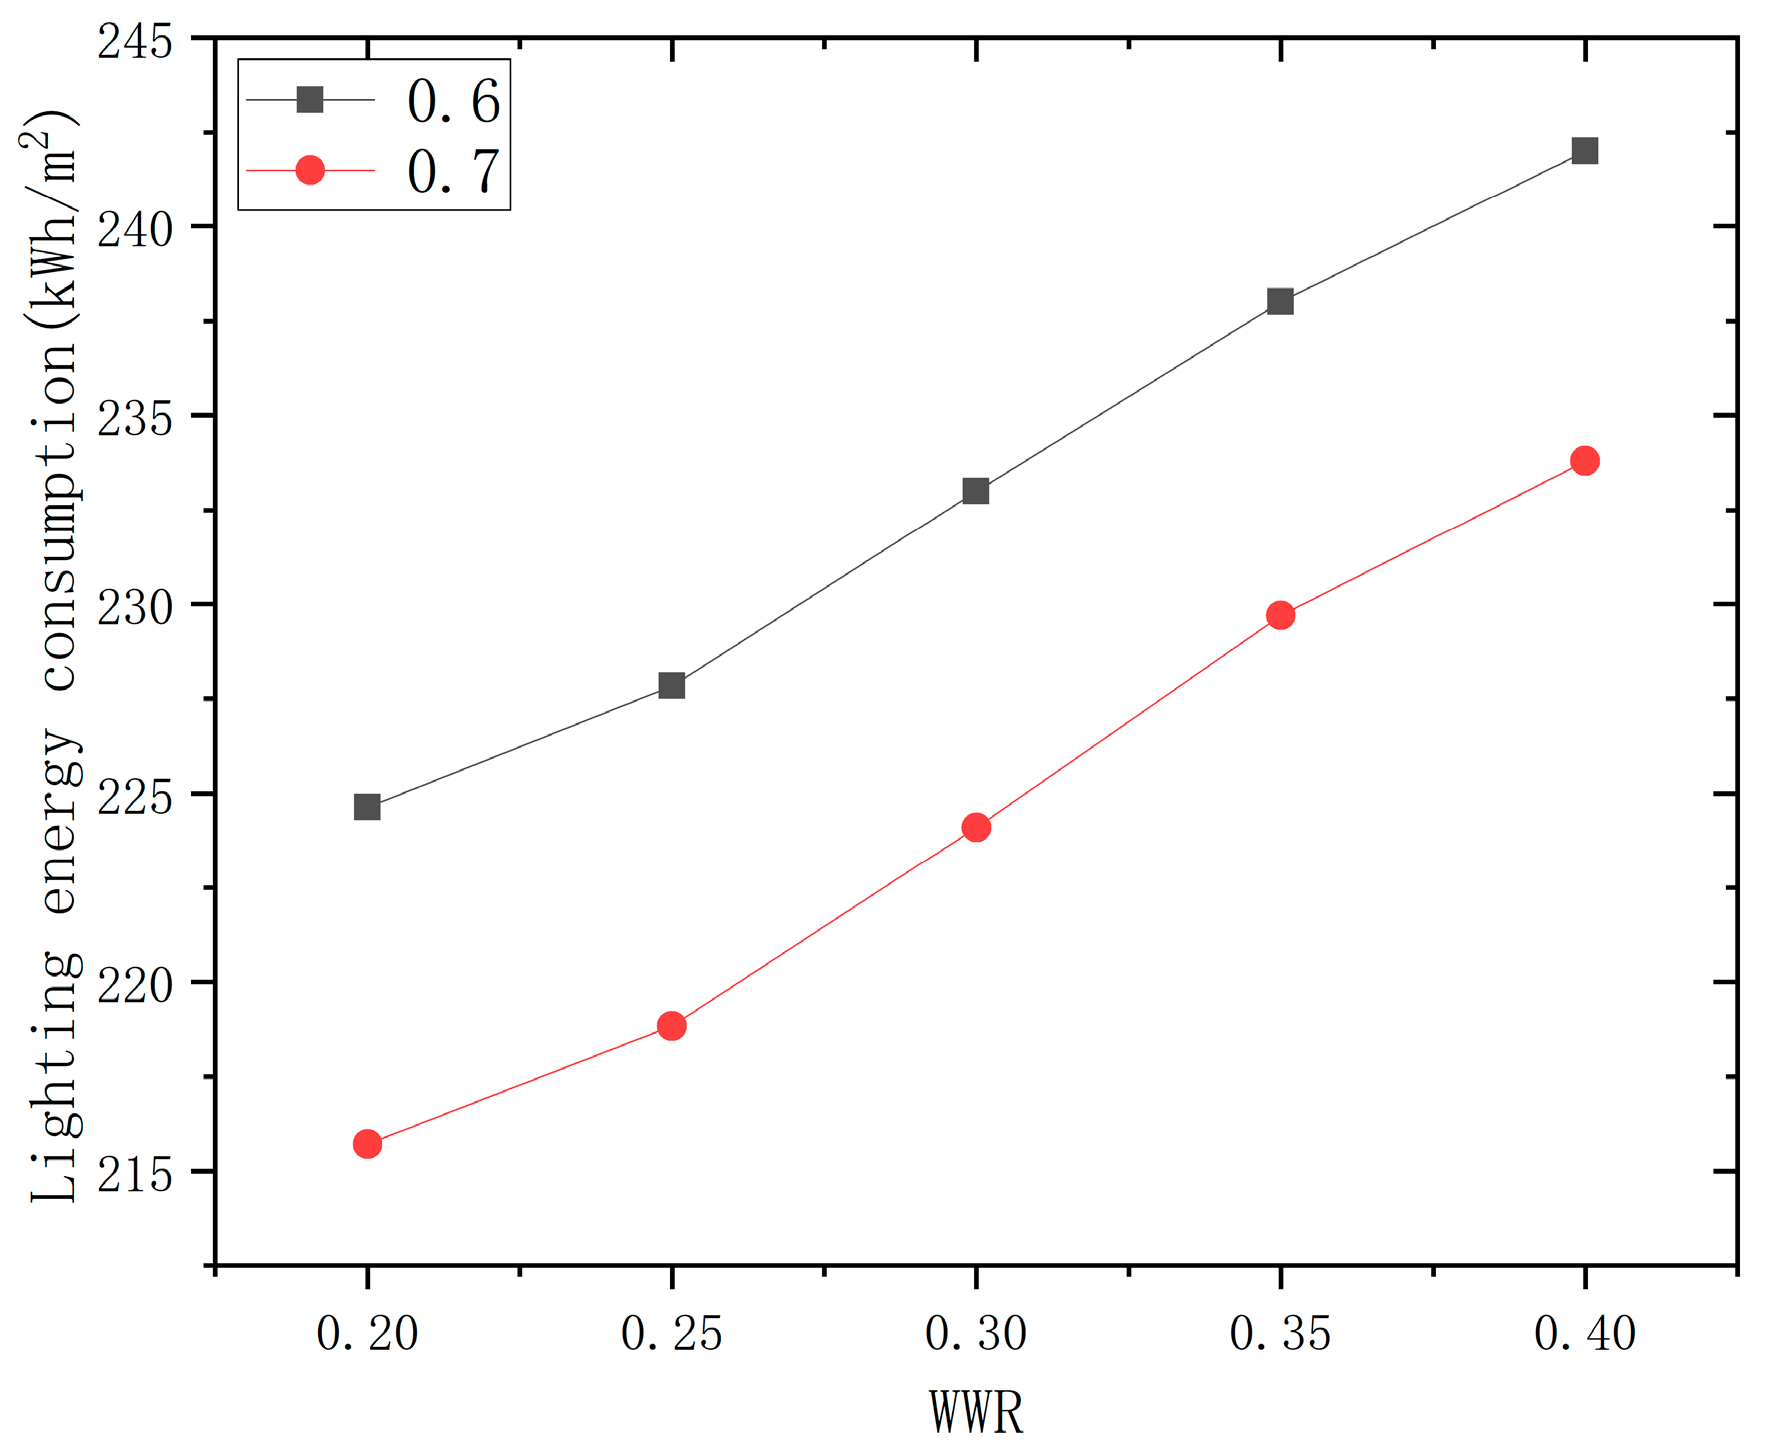
4.3.4. Impact of PV Window Transmittance and Window-to-Wall Ratio on Lighting Energy Consumption

In the context of using photovoltaic windows, this study analyzes the comparison of two types of light transmittance according to the transmittance limit specified in China’s Energy-Saving Design Standard for Public Buildings (GB50189-2015). As shown in Figure 10, the transmittance of photovoltaic windows affects lighting energy consumption, although the impact is generally small. For a window-to-wall ratio between 0.2 and 0.4, a photovoltaic window with a transmittance of 0.7 reduces lighting energy consumption by approximately 2% compared to a window with a transmittance of 0.6. Additionally, regardless of the PV window transmittance, a window-to-wall ratio of 0.4 reduces lighting energy consumption by about 7% overall compared to a ratio of 0.2.

4.4. Summary of This Section

In the previous sections, the results and analysis of multi-objective optimization, global sensitivity, and local sensitivity were presented. Table 7 briefly summarizes these results. In the local sensitivity analysis, the significant impact of photovoltaic (PV) panel power and window-to-wall ratio on building energy consumption and carbon emissions was highlighted. The findings shown in Figure 7 indicate that as the window-to-wall ratio decreases (from 0.4 to 0.2), the annual renewable power generation of PV panels (ranging from 50 W to 300 W) decreases by approximately 16%. This study supports the conclusions of Reffat et al. on the optimization of photovoltaic building design, who found that increasing the areas of PV on buildings by using facades due to limited roof areas can enhance power generation [49]. Our findings extend this by showing that adjusting the window-to-wall ratio can also increase PV area and consequently impact renewable power generation.
Additionally, the cost analysis of different types of photovoltaic windows (see Figure 8) indicates that due to the higher cost of photovoltaic windows compared to conventional ones, a higher window-to-wall ratio leads to an increase in overall building costs. Md Muin Uddin et al. concluded in their study on the optimization of photovoltaic building design that CdTe combined BIPV windows can save approximately 30–61% of electricity consumption compared to conventional window systems [50]. However, they emphasized that their analysis of cadmium telluride’s photovoltaic power generation did not include an economic analysis. Our study expands on this aspect, providing designers with more comprehensive reference data. Additionally, Dong et al. has demonstrated that PV systems can effectively reduce carbon emissions, positively contributing to the environment. However, they did not consider the carbon emissions during the production stage of photovoltaic modules, which this paper investigates in depth [51].

5. Discussion

The study demonstrates significant energy, carbon, and cost reductions through building envelope optimization and PV integration for a specific case. However, the applicability of these findings to other building types, locations, and climates is uncertain, and the potential for generalization and limitations should be discussed.
(1)
Applicability and limitations for different building types
The optimization methods and PV integration strategies used in this study can be applied to residential buildings. However, the energy consumption patterns and PV system performance may differ due to variations in occupancy, usage patterns, and building design. Commercial buildings often have larger energy demands and different operational schedules compared to residential buildings. The potential for energy savings and carbon emission reductions might vary, necessitating customized optimization strategies.
(2)
Geographic and Climatic Considerations
The effectiveness of PV systems is highly dependent on geographic location. Regions with higher solar irradiance will benefit more from PV integration. Conversely, areas with lower solar exposure might see diminished returns, requiring additional energy-saving measures. Climate significantly impacts building energy consumption. In colder climates, the heating demand is higher, while in hotter climates, cooling demand dominates. The optimization strategies must account for these differences to ensure effective energy performance across various climates. Seasonal changes in sunlight and temperature can affect the performance of PV systems and building energy needs. The study’s findings should be evaluated for their seasonal adaptability to ensure year-round efficiency.
(3)
Case Studies and Simulations for Different Scenarios
To enhance the generalizability of the results, it is important to conduct additional case studies and simulations across varied scenarios. This includes testing optimization strategies on buildings with different architectural styles and materials, simulating in regions with diverse solar irradiance and climates to evaluate PV performance, and performing seasonal simulations to ensure consistent benefits throughout the year.
The study shows potential for energy savings and carbon reduction through optimized building envelopes and PV integration. However, validating these findings across various building types, locations, and climates is needed. Further case studies and simulations will improve the generalizability and support broader applications in sustainable building designs.

6. Conclusions

(1)
Using the PSO-SVM-NSGA-II multi-objective optimization algorithm, which combines Particle Swarm Optimization (PSO) for tuning SVM hyperparameters based on social behavior patterns, and Support Vector Machine (SVM) for training data samples obtained from EnergyPlus simulations. Non-dominated Sorting Genetic Algorithm II (NSGA-II) is used for identifying the best trade-offs between multiple objectives. This integrated approach effectively optimizes the building envelope and photovoltaic components to reduce energy consumption and carbon emissions. Technique for Order Preference by Similarity to Ideal Solution (TOPSIS) method to select the final solution. This integrated approach was used to optimize the external envelope structure and photovoltaic components, leading to significant reductions: overall energy consumption decreased by 41% (from 105 kWh/m2 to 63 kWh/m2), carbon emissions by 34% (from 13,307 tCO2eq to 8817 tCO2eq), and retrofit and operating costs by 20% (from CNY 13.12 million to CNY 10.53 million) over a 25-year period.
(2)
The Global-sensitivity analysis was conducted using PSO-SVM as a surrogate model. The window-to-wall ratio (X1) has the most substantial impact on the comprehensive value of building energy consumption, with a main effect value of 0.45. A higher window-to-wall ratio increases thermal loads and overall energy consumption due to a smaller area available for photovoltaic panels. Photovoltaic panel power (X2) significantly influences building materials and operational phase-carbon emissions during the building’s materials and operational phases, primarily due to increased panel thickness with higher power ratings. For retrofit and operating costs, the type of photovoltaic window (X4) is the most influential factor, with an impact value of 0.61. Higher transparency and lower thermal transmittance photovoltaic windows, although more expensive, reduce thermal loads and energy consumption.
(3)
Local sensitivity analysis was conducted for variables with higher sensitivity to each objective. As the window-to-wall ratio decreases (from 0.4 to 0.2), the annual renewable power generation of PV panels (ranging from 50 W to 300 W) decreases by approximately 16%. Photovoltaic windows are typically more expensive than traditional windows, and their cost is directly proportional to the window-to-wall ratio. In the window-to-wall ratio range of 0.2 to 0.4, the cost of photovoltaic windows ranges from CNY 204 to 456/m2. Photovoltaic windows are categorized into three types based on unit price and light transmittance, with higher transmittance and lower thermal transmittance resulting in higher costs. Photovoltaic power had a significant positive impact on building material carbon emissions. Cadmium telluride photovoltaic panels emit less carbon than monocrystalline silicon panels, despite the latter being cheaper. Each additional 50 W of monocrystalline silicon panels increases thickness by 2 mm and carbon emissions by 1.48 kgCO2eq/m2; and between a window-wall ratio of 0.2 and 0.4, using a photovoltaic window with 0.7 light transmittance reduced lighting energy consumption by about 2% compared to a photovoltaic window with 0.6 light transmittance.
The findings of this study contribute to achieving energy savings and carbon reduction in building design and retrofitting. Based on the optimization results, architects and engineers can adopt efficient building envelopes and photovoltaic window configurations to minimize energy consumption and carbon emissions. This approach is applicable not only to new constructions but also to renovation projects, ensuring long-term energy savings and cost reductions. Governments should provide financial incentives and subsidies, such as tax breaks and grants, to promote the adoption of photovoltaic technology and optimized building envelopes.
Future research should conduct multi-scenario simulations in different geographic locations and climate conditions to validate the general applicability of the optimization solutions, and continuously monitor advancements in photovoltaic technology and building materials to assess their impact on the optimization results. In practice, optimized strategies based on research findings should be implemented, with field tests conducted to verify their effectiveness. By collaborating with policymakers and industry organizations, supportive policies can be developed, and challenges encountered during implementation can be addressed, ultimately promoting sustainable development in the building industry.

Author Contributions

N.Z.: Supervision, Resources, Writing—review and editing. J.Z.: Conceptualization, Methodology, Project administration, Software, Writing—original draft, Funding acquisition, Investigation. Y.D.: Visualization, Conceptualization, Software. C.D.: Supervision, Resources, Writing—review and editing. All authors have read and agreed to the published version of the manuscript.

Funding

This work was supported by the Fundamental Research Funds for Inner Mongolia University of Science and Technology, grant number No. 2024YXXS019. This work was supported by the Fundamental Research Funds for Inner Mongolia University of Science and Technology, grant number No. 2022139.

Data Availability Statement

The original contributions presented in the study are included in the article, further inquiries can be directed to the corresponding author.

Conflicts of Interest

The authors declare no conflicts of interest.

Nomenclature

CVBECComprehensive value of building energy consumption
BMOPCEBuilding materials and operational phase carbon emissions
ROCRetrofit and operating costs
PSO-SVMParticle Swarm Optimization-Support Vector Machine
NSGA-IINon-dominated Sorting Genetic Algorithm II
TOPSISTechnique for Order Preference by Similarity to Ideal Solution
PSO-SVM-NSGA-IIParticle Swarm Optimization-Support Vector Machine-Non-dominated Sorting Genetic Algorithm II
tCO2eqTonnes of CO2 equivalent
CO2Carbon Dioxide
XPSExtruded Polystyrene
EPSExpanded Polystyrene
PUPolyurethane
RWRock Wool
PVPhotovoltaic
BIPVBuilding integrated photovoltaic

References

  1. International Energy Agency (IEA). Global Status Report for Buildings and Construction 2019. 2019. Available online: https://www.iea.org/reports/global-status-report-for-buildings-and-construction-2019 (accessed on 6 August 2024).
  2. China Building Energy Conservation Association. China Building Energy Consumption Research Report 2020; Architecture & Building Press: Beijing, China, 2020. (In Chinese) [Google Scholar]
  3. Liu, Y.; Zhang, Y.; Sun, Y.; Gong, X. Materials selection for green building based on life cycle assessment. Mater. China 2016, 10, 769–775. (In Chinese) [Google Scholar]
  4. Jin, Y.U.; Yang, Z.; Wang, C.; Kuibo, L.I. Simulation analysis of office building energy consumption based on DeST-C. J. Shenyang Jianzhu Univ. China 2015, 4, 689–697. (In Chinese) [Google Scholar]
  5. Zhang, L.; Liu, Z.; Hou, C.; Hou, J.; Wei, D.; Hou, Y. Optimization analysis of thermal insulation layer attributes of building envelope exterior wall based on DeST and life cycle economic evaluation. Case Stud. Therm. Eng. 2019, 14, 100410. [Google Scholar] [CrossRef]
  6. Jeong, S.-G.; Wi, S.; Chang, S.J.; Lee, J.; Kim, S. An experimental study on applying organic PCMs to gypsum-cement board for improving thermal performance of buildings in different climates. Energy Build. 2019, 190, 183–194. [Google Scholar] [CrossRef]
  7. Malz, S.; Krenkel, W.; Steffens, O. Infrared reflective wall paint in buildings: Energy saving potentials and thermal comfort. Energy Build. 2020, 224, 110212. [Google Scholar] [CrossRef]
  8. Aburas, M.; Soebarto, V.; Williamson, T.; Liang, R.; Ebendorff-Heidepriem, H.; Wu, Y. Thermochromic smart window technologies for building application: A review. Appl. Energy 2019, 255, 113522. [Google Scholar] [CrossRef]
  9. Arnaoutakis, G.E.; Katsaprakakis, D.A. Energy performance of buildings with thermochromic windows in Mediterranean climates. Energies 2021, 14, 6977. [Google Scholar] [CrossRef]
  10. Liao, W.; Wen, C.; Luo, Y.; Peng, J.; Li, N. Influence of different building transparent envelopes on energy consumption and thermal environment of radiant ceiling heating and cooling systems. Energy Build. 2022, 255, 111702. [Google Scholar] [CrossRef]
  11. Zhu, J.; Chew, D.A.S.; Lv, S.; Wu, W. Optimization method for building envelope design to minimize carbon emissions of building operational energy consumption using orthogonal experimental design (OED). Habitat Int. 2013, 37, 148–154. [Google Scholar] [CrossRef]
  12. Long, L.D. An AI-driven model for predicting and optimizing energy-efficient building envelopes. Alex. Eng. J. 2023, 79, 480–501. [Google Scholar] [CrossRef]
  13. Liu, X.; Wu, J.; Zhang, Y. Multi-objective optimization of building lifecycle carbon emissions, retrofit, and thermal comfort using RF-NSGA-II. J. Clean. Prod. 2021, 278, 123456. [Google Scholar] [CrossRef]
  14. Liu, Y.; Li, T.; Xu, W.; Wang, Q.; Huang, H.; He, B.-J. Building information modelling-enabled multi-objective optimization for energy consumption parametric analysis in green buildings design using hybrid machine learning algorithms. Energy Build. 2023, 300, 113665. [Google Scholar] [CrossRef]
  15. Wu, C.; Pan, H.; Luo, Z.; Liu, C.; Huang, H. Multi-objective optimization of residential building energy consumption, daylighting, and thermal comfort based on BO-XGBoost-NSGA-II. Build. Environ. 2024, 254, 111386. [Google Scholar] [CrossRef]
  16. Yang, S.; Wan, M.P.; Chen, W.; Ng, B.F.; Dubey, S. Model predictive control with adaptive machine-learning-based model for building energy efficiency and comfort optimization. Appl. Energy 2020, 271, 115147. [Google Scholar] [CrossRef]
  17. Liu, Y.; Chen, K.; Ni, E.; Deng, Q. Optimizing classroom modularity and combinations to enhance daylighting performance and outdoor platform through ANN acceleration in the post-epidemic era. Heliyon 2023, 9, e21598. [Google Scholar] [CrossRef] [PubMed]
  18. Wang, Y.; Hu, L.; Hou, L.; Cai, W.; He, Y. Study on energy consumption, thermal comfort and economy of passive buildings based on multi-objective optimization algorithm. J. Clean. Prod. 2023, 425, 138760. [Google Scholar] [CrossRef]
  19. Li, C.; Zhang, W.; Tan, J.; Liu, W.; Lyu, Y.; Tang, H. Energy performance of an innovative bifacial photovoltaic sunshade (BiPVS) under hot summer and warm winter climate. Heliyon 2023, 9, e18700. [Google Scholar] [CrossRef] [PubMed]
  20. Ito, R.; Lee, S. Development of adjustable solar photovoltaic system for integration with solar shading louvers on building façades. Appl. Energy 2024, 359, 122711. [Google Scholar] [CrossRef]
  21. Ramos, A.; Romaní, J.; Salom, J. Impact of building integrated photovoltaics on high rise office building in the Mediterranean. Energy Build. 2023, 10, 3197–3210. [Google Scholar] [CrossRef]
  22. El Samanoudy, G.; Abdelaziz Mahmoud, N.S.; Jung, C. Analyzing the effectiveness of building integrated Photovoltaics (BIPV) to reduce the energy consumption in Dubai. Ain Shams Eng. J. 2024, 15, 102682. [Google Scholar] [CrossRef]
  23. Luo, X.; Zhang, L.; Lu, J.; Ge, J. Multi-objective optimization of the office park building envelope with the goal of nearly zero energy consumption. J. Build. Eng. 2024, 84, 108552. [Google Scholar] [CrossRef]
  24. Goia, F.; Taveres-Cachat, E.; Lobaccaro, G.; Chaudhary, G.; Aelenei, L. Economic analysis of BIPV systems as a building envelope material for building skins in Europe. Appl. Energy 2019, 247, 731–744. [Google Scholar] [CrossRef]
  25. Allouhi, A.; Jamil, A.; Benhamou, B.; Saidur, R.; Rahmoune, M. Evaluation of industrial carbon capture policies and their efficiency in reducing CO2 emissions. J. Clean. Prod. 2020, 270, 122375. [Google Scholar] [CrossRef]
  26. Katsaprakakis, D.A.; Zidianakis, G. Optimized Dimensioning and Operation Automation for a Solar-Combi System for Indoor Space Heating. A Case Study for a School Building in Crete. Energies 2019, 12, 177. [Google Scholar] [CrossRef]
  27. Asadi, E.; Gameiro da Silva, M.; Henggeler Antunes, C.; Dias, L. A multi-objective optimization model for building retrofit strategies using TRNSYS simulations, GenOpt and MATLAB. Build. Environ. 2012, 56, 370–378. [Google Scholar] [CrossRef]
  28. Razfar, S.; Ahmadi Danesh Ashtiani, H.; Khoshgard, A. Simulation of electrical energy supply required by Maad Koush pelletizing complex using renewable energy sources and simulation with HOMER energy software. Results Eng. 2024, 21, 101845. [Google Scholar] [CrossRef]
  29. Huo, H.; Deng, X.; Wei, Y.; Liu, Z.; Liu, M.; Tang, L. Optimization of energy-saving renovation technology for existing buildings in a hot summer and cold winter area. J. Build. Eng. 2024, 86, 108597. [Google Scholar] [CrossRef]
  30. Zhang, X.; Wang, J.; Zhou, Y.; Wang, H.; Xie, N.; Chen, D. A multi-objective optimization method for enclosed-space lighting design based on MOPSO. Build. Environ. 2024, 250, 111185. [Google Scholar] [CrossRef]
  31. Ghalambaz, M.; Jalilzadeh Yengejeh, R.; Davami, A.H. Building energy optimization using Grey Wolf Optimizer (GWO). Case Stud. Therm. Eng. 2021, 27, 101250. [Google Scholar] [CrossRef]
  32. Vapnik, V.; Chervonenkis, A. The Nature of Statistical Learning Theory; Springer: New York, NY, USA, 1995. [Google Scholar]
  33. Pang-Ning, T.; Michael, S.; Vipin, K. Introduction to Data Mining; Pearson Addison Wesley: Boston, MA, USA, 2005. [Google Scholar]
  34. Eberhart, R.; Kennedy, J. A New Optimizer Using Particle Swarm Theory. In Proceedings of the Sixth International Symposium on Micro Machine and Human Science, Nagoya, Japan, 4–6 October 1995; pp. 39–43. [Google Scholar] [CrossRef]
  35. Deb, K.; Pratap, A.; Agarwal, S.; Meyarivan, T. A fast and elitist multiobjective genetic algorithm: NSGA-II. IEEE Trans. Evol. Comput. 2002, 6, 182–197. [Google Scholar] [CrossRef]
  36. Coello, C.A.C.; Pulido, G.T.; Lechuga, M.S. Handling multiple objectives with particle swarm optimization. IEEE Trans. Evol. Comput. 2004, 8, 256–279. [Google Scholar] [CrossRef]
  37. Deb, K. Multi-Objective Optimization Using Evolutionary Algorithms; John Wiley & Sons Ltd.: New York, NY, USA, 2001. [Google Scholar]
  38. GB/T 51350-2019; Ministry of Housing and Urban-Rural Development of the People’s Republic of China. Technical Standard for Nearly Zero Energy Buildings. China Architecture & Building Press: Beijing, China, 2019. (In Chinese)
  39. Liang, Y.; Shen, L.; Zhang, Z.; Zhong, L. Environmental performance of building construction based on life cycle assessment: A case study of a building in China. J. Clean. Prod. 2017, 161, 110–117. [Google Scholar] [CrossRef]
  40. Ministry of Ecology and Environment. Guidelines for Accounting and Reporting of Greenhouse Gas Emissions from Enterprises: Power Generation Facilities (Revised Edition 2021); Ministry of Ecology and Environment: Beijing, China, 2021. (In Chinese)
  41. Yue, Y.; Zheng, J.; Cheng, L.; Zhu, Y.; Wu, H. Comprehensive Evaluation of Distributed PV Grid-Connected Based on Combined Weighting Weights and TOPSIS-RSR Method. Energy Eng. 2024, 121, 703–728. [Google Scholar] [CrossRef]
  42. Saltelli, A.; Tarantola, S.; Campolongo, F.; Ratto, M. Sensitivity Analysis in Practice: A Guide to Assessing Scientific Models; John Wiley & Sons: New York, NY, USA, 2004. [Google Scholar]
  43. Sobol’, I.M. Global sensitivity indices for nonlinear mathematical models and their Monte Carlo estimates. Math. Comput. Simul. 2001, 55, 271–280. [Google Scholar] [CrossRef]
  44. GB 50189-2015; Ministry of Housing and Urban-Rural Development of the People’s Republic of China. Design Standard for Energy Efficiency of Public Buildings. China Architecture & Building Press: Beijing, China, 2015. (In Chinese)
  45. GB 50034-2013; China National Standard. Standard for Lighting Design of Buildings. China Standards Press: Beijing, China, 2013. (In Chinese)
  46. GB 50176-2016; China National Standard. Thermal Design Code for Civil Buildings. China Standards Press: Beijing, China, 2016. (In Chinese)
  47. World Resources Institute (WRI); World Business Council for Sustainable Development (WBCSD). The Greenhouse Gas Protocol: A Corporate Accounting and Reporting Standard. 2004. Available online: https://ghgprotocol.org/corporate-standard (accessed on 6 August 2024).
  48. Wang, Z.Y. Life Cycle Energy Efficiency Evaluation and Application Planning of Photovoltaic Systems. Ph.D. Thesis, Shandong University, Jinan, China, 2023. (In Chinese). [Google Scholar]
  49. Reffat, R.M.; Ezzat, R. Impacts of design configurations and movements of PV attached to building facades on increasing generated renewable energy. Sol. Energy 2023, 252, 50–71. [Google Scholar] [CrossRef]
  50. Uddin, M.M.; Ji, J.; Wang, C.; Zhang, C. Building energy conservation potentials of semi-transparent CdTe integrated photovoltaic window systems in Bangladesh context. Renew. Energy 2023, 207, 512–530. [Google Scholar] [CrossRef]
  51. Dong, L.; Gu, Y.; Cai, K.; He, X.; Song, Q.; Yuan, W.; Duan, H. Unveiling lifecycle carbon emissions and its mitigation potentials of distributed photovoltaic power through two typical case systems. Sol. Energy 2024, 269, 112360. [Google Scholar] [CrossRef]
Figure 1. Research framework diagram.
Buildings 14 03134 g001
Figure 2. Schematic diagram of a photovoltaic window.
Buildings 14 03134 g002
Figure 3. Control principle diagram of continuous dimming.
Buildings 14 03134 g003
Figure 4. Comparison of predicted and real value data. (a) Comprehensive value of building energy consumption; (b) Building materials and operational phase carbon emissions; (c) Retrofit and operating costs.
Buildings 14 03134 g004
Figure 5. The three-objective-function Pareto solution set: (a) General diagram of the Pareto solution set (b) Scatter plot of retrofit and operating costs and CVBEC (c) Scatter plot of building materials and operational phase carbon emissions and retrofit and operating costs (d) Scatter plot of CVBEC and building materials and operational phase carbon emissions.
Buildings 14 03134 g005
Figure 6. Sensitivity Analysis of Parameter Variables. (a) Comprehensive value of building energy consumption; (b) Building materials and operational phase carbon emissions; (c) Retrofit and operating costs.
Buildings 14 03134 g006
Figure 7. Impact of PV panel power on the comprehensive value of building energy consumption.
Buildings 14 03134 g007
Figure 8. Effect of PV window type on retrofit and operating costs.
Buildings 14 03134 g008
Figure 9. Impact of PV panel power on building materials and operational phase carbon emissions.
Buildings 14 03134 g009
Figure 10. Effect of solar spectrum-averaged transmittance on lighting energy consumption.
Buildings 14 03134 g010
Table 1. Basic settings.
ParametersValue
Density of personnel 8   m 2 / p e r s o n
Number of times ventilated 2 / h
Lighting power 8   W / m 2
Heat dissipation by personnel 134   W / p e r s o n
Table 2. Optimization variables.
Optimization VariablesRange of Values
Types of external wall insulation panels1–4 (see Table 2 and Table 3)
Thickness of external wall insulation board0.07; 0.08; 0.09; 0.1; 0.11; 0.12; 0.13; 0.4; 0.15
Types of roof insulation panels1–4 (see Table 2 and Table 3)
Roof insulation board thickness0.07; 0.08; 0.09; 0.1; 0.11; 0.12; 0.13; 0.4; 0.15
Photovoltaic window types1–6 (see Table 2 and Table 3)
Photovoltaic panel power50; 100; 150; 200; 250; 300
Window-to-wall ratio 0.2 ; 0.25 ; 0.3 ; 0.35 ; 0.4
Air conditioning on temperature in winter18;19;20
Table 3. Enclosure and PV module details.
CategorizationPrice of ItemCarbon FootprintHeat Transfer CoefficientGenerated Electrical EnergyTransmittance
y u a n / m 2 k g C O 2 / m 2 W / m 2 K W %
EPS board 187239550.033//
XPS board 259860270.030//
PU board 3125651410.024//
RW board 438078000.044//
Photovoltaic glass 11500779.362.7 / 0.6
Photovoltaic glass 21500779.362.7 / 0.7
Photovoltaic glass 3 1700 779.362.5 / 0.6
Photovoltaic glass 41700 779.36 2.5 / 0.7
Photovoltaic glass 51900 779.362.3 / 0.6
Photovoltaic glass 61900 779.362.3 / 0.7
Photovoltaic panel 1 83 1400 / 5   W /
Photovoltaic panel 2 143 1400 / 100   W /
Photovoltaic panels 3 198 1400 / 150   W /
Photovoltaic panels 4 255 1400 / 200   W /
Photovoltaic panels 5 318 1400 / 250   W /
Photovoltaic panels 6 375 1400 / 300   W /
Table 4. PV simulation information.
Relevant ParametersMaximum Output Power
P/W
Cell Conversion Efficiency
n/%
Open Circuit Voltage
U/V
Short-Circuit Current
I/A
Optimum Operating Current
Im/A
Optimum Operating Voltage
Vm/V
Sizes
mm × mm
Translucent Photovoltaic Glass 1, 3, 54218%122.70.480.4398.71200 × 750
Translucent photovoltaic glass 2, 4, 64018%121.10.460.4297.91200 × 750
Photovoltaic panel 15019%22.023.022.717.82670 × 530
Photovoltaic panel 210019%23.056.445.2917.981200 × 550
Photovoltaic panels 315019%20.529.538.25181320 × 670
Photovoltaic panels 420019%21.510.939.79181580 × 808
Photovoltaic panels 525019%22.512.7311.88181380 × 990
Photovoltaic panels 630019%22.515.814.7318.51640 × 992
Table 5. Model validation.
GoalHeating Energy Consumption (kWh)Cooling Energy Consumption (kWh)Lighting Energy Consumption (kWh)
Analog value678,940154,179224,460
Actual value676,034153,265223,458
Inaccuracies0.5%0.4%0.4%
Table 6. Comparison between the optimized target and the original target.
GoalsOriginal TargetOptimized TargetOverall Trends
Comprehensive value of building energy Consumption105 kWh/m263 kWh/m2−41%
Building materials and operational phase carbon emissionsBuilding materials carbon emissions182 tCO2eq297 tCO2eq−115 tCO2eq−34%
Operational phase carbon emissions13,125 tCO2eq8520 tCO2eq4605 tCO2eq
Retrofit and operating costsRetrofit costs02.27 million yuan−2.27 million yuan−20%
operating costs13.12 million yuan8.25 million yuan4,870,000 yuan
Table 7. Summary of findings.
Objective FunctionMulti-Objective Optimisation ResultsGlobal Sensitivity Level (ST)Key Findings on Local Sensitivity
Original TargetOptimized Target
CVBEC105 kWh/m263 kWh/m2X1 > X2 > X6 > X8 > X7 > X5 > X3 = X4As the window-to-wall ratio decreases (from 0.4 to 0.2), the annual renewable power generation of PV panels (ranging from 50 W to 300 W) decreases by approximately 16%.
BMOPCE13,307 tCO2eq8547 tCO2eqX1 > X6 > X2 > X7 > X5 > X4 > X3 > X8In the window-to-wall ratio range of 0.2 to 0.4, the cost of photovoltaic windows ranges from 204 to 456 yuan/m2.
ROC13.12 million yuan10.52 million yuanX4 > X1 > X2 > X6 > X7 > X3 > X8 = X5Each additional 50 W of monocrystalline silicon panels increases thickness by 2 mm and carbon emissions by 1.48 kgCO2eq/m2
Disclaimer/Publisher’s Note: The statements, opinions and data contained in all publications are solely those of the individual author(s) and contributor(s) and not of MDPI and/or the editor(s). MDPI and/or the editor(s) disclaim responsibility for any injury to people or property resulting from any ideas, methods, instructions or products referred to in the content.

