Article

Progressive Failure of Water-Resistant Stratum in Karst Tunnel Construction Using an Improved Meshfree Method Considering Fluid–Solid Interaction

1
College of Transportation Engineering, Nanjing Tech University, Nanjing 211816, China
2
College of Civil Engineering, Tongji University, Shanghai 200092, China
3
Department of Sustainable Development, Environmental Science and Engineering, Royal Institute of Technology, 10044 Stockholm, Sweden
4
School of Geoscience and Info-Physics, Central South University, Changsha 410083, China
5
State Key Laboratory of Geomechanics and Geotechnical Engineering, Institute of Rock and Soil Mechanics, Chinese Academy of Sciences, Wuhan 430071, China
*
Author to whom correspondence should be addressed.
Buildings 2024, 14(10), 3140; https://doi.org/10.3390/buildings14103140
Submission received: 28 August 2024 / Revised: 19 September 2024 / Accepted: 23 September 2024 / Published: 1 October 2024
(This article belongs to the Section Building Structures)

Abstract

:
An improved meshfree method that considers cracking, contact behaviour and fluid–solid interaction (FSI) was developed and employed to shed light on the progressive failure of the water-resistant stratum and inrush process in a karst tunnel construction. Hydraulic fracturing tests considering different scenarios and inrush events of the field-scale Jigongling karst tunnel in three scenarios verify the feasibility of the improved meshfree method. The results indicate that the brittle fracture characteristics of the rock mass are captured accurately without grid re-meshing by improving the kernel function of the meshfree method. The complex contact behaviour of rock along the fracture surface during inrush is correctly captured through the introduction of Newton’s law-based block contact algorithms. FSI processing during inrush is accurately modelled by an improved two-phase adaptive adjacent method considering the discontinuous particles without coupling other solvers and additional artificial boundaries, which improves computational efficiency. Furthermore, the improved meshfree method simultaneously captures the fast inrush and rock failure in the Jigongling karst tunnel under varying thicknesses and strengths of water-resistant rocks and sizes of karst caves. As the thickness and strength of water-resistant rock increase, the possibility of an inrush disaster in the tunnel decreases, and a drop in the water level and an increase in the maximum flow velocity have significant delayed effects during the local inrush stage.

1. Introduction

Karst caves with high water pressure and low visibility around tunnels can be dangerous when they induce the sudden and unpredictable inrush of water in tunnel construction. Under the joint action of karst water pressure and the weak strength of the water-resistant stratum, the water-resistant rock between the tunnel and high-water pressure-hidden cavity cannot withstand the absence of pre-support and pre-reinforcement. Subsequently, cracks in water-resistant rock initiate, expand and coalesce, possibly resulting in water inrush disasters (Figure 1), severe economic losses and casualties. Therefore, understanding the internal mechanisms of progressive rock failure during water/mud inrush disasters will undoubtedly provide a critical guiding effect during the design and construction of karst tunnel structures.
The approaches used to study progressive rock failure and water/mud inrush disasters of karst tunnels are mainly divided into laboratory tests and numerical simulations. In terms of laboratory tests, Zhou et al. [1] discovered disastrous characteristics of inrush during the filling of a karst tunnel by carrying out a three-dimensional filling karst tunnel model. Then, Pan et al. [2] used the indoor FSI model to study the influence of hidden karst caves on the stability of surrounding rock under different water pressure conditions during filling. However, laboratory tests were conducted on laboratory scales and cannot replace tests of field-scale tunnels. Therefore, numerical simulation methods to investigate the progressive failure of field-scale karst tunnels were developed. Li et al. [3] employed the finite element method (FEM) to investigate the pattern of change in the stress and defamation of rock under different water pressures in karst caves. For modelling rock damage, Huang et al. [4] used a realistic failure process analytical method to study the progressive failure of water-resistant rock under karst caves with different water pressures. However, the grid method cannot reproduce a larger deformation (i.e., fictional sliding and toppling failure) of water-resistant rock. Moreover, the inrushing fluids were not physically modelled in the above studies. Comparatively, discontinuous methods, such as the discrete element method (DEM) [5] and discontinuous deformation analysis (DDA) [6], are more suitable for analysing the complex motion and contact behaviour of rock blocks during inrush disasters. Moreover, inrush mechanics in karst tunnels have been studied over the last decade with the development of computational fluid dynamics (CFD) methods [7,8] and the lattice Boltzmann method (LBM) [9,10], which made simulating progressive rock failure and inrush in tunnels feasible. Although coupled multiple solvers can reproduce the complete failure and inrush flow process in rocks, it requires additional and artificial treatment, such as the static and moving immersed boundary methods in CFD [11], which increases the complexity of the FSI programming and reduces the computational efficiency. In addition, the DEM and DDA have relatively low computational efficiency due to complex contact search algorithms and bond models, which hinders their application in field-scale karst tunnels. Among the existing methods for two-phase fluid-structure interaction, including DDA-SPH [12,13,14], DEM-SPH [15,16], MPM-SPH [17,18], DEM-CFD [19,20], MPM-CFD [21] and DEM-LBM [22,23] and other methods. In the FSI strategy, it is observed that the use of particle methods for both fluid and solid phases allows for a more natural conversion of speed and energy. In contrast, when particle methods and grid methods are used for the fluid and solid phases respectively, numerous artificial assumptions are introduced at the boundaries of particles and grids. This results in reduced robustness of the algorithm and increased complexity.
Smoothed particle hydrodynamics (SPH) [24] is a pure Lagrangian meshfree method and is then applied to reproduce the free-surface fluid [25,26,27] and solve the FSI process problem [28,29]. Based on this, coupled SPH methods to reproduce the progressive failure of rock and the inrush of the tunnel have been developed in recent years. Wang et al. [30] used coupled FEM and SPH methods to simulate the barrier wall damage and the water inrush under artificial excavation disturbance, in which FEM and SPH models represented rock wall and inrushing fluid, respectively. Peng et al. [31] adopted a coupled DDA and SPH method to simulate the water inrush process in tunnel construction, in which DDA and SPH models represent water-resistant rock and inrushing fluid, respectively. However, the coupled method requires the introduction of artificial assumptions, and the interface of two computational domains introduces additional computational errors and nonconvergence issues [32]. Additionally, it increases the programming complexity and expensive computational time. To fill the gaps mentioned above, SPH has been improved to model material behaviour and subsequent fractures by employing various local cracking strategies in recent years. For example, Chakraborty and Shaw [33] developed a pseudo-spring method for crack treatment, which successfully realised crack initiation in rocks. Yu et al. [34] used an improved kernel SPH (IKSPH) method and investigated the cracking processes in rock cells. Mu et al. [35] developed an improved SPH method to reproduce the fracture process of a rock mass. The above studies have demonstrated that by incorporating reasonable failure criteria, SPH can independently simulate the progressive failure of rocks. Meanwhile, the problem of coupled fracture and contact in SPH has been solved, making it applicable to the field of rock landslides [36]. However, complex fluid–solid interactions during inrush by the SPH method need to be rigorously defined. There has been no case study demonstrating the typical and critical processes of rock failure and water inrush in karst tunnels using the SPH framework.
This paper aims to propose an improved meshfree method that considers cracking, contact behaviour and FSI to reproduce the progressive rock failure and water inrush of a karst tunnel. This method combines the kernel broken cracking strategy and failure criterion to simulate the brittle fracturing of rock. Damaged and intact particles form new contacts, upon which frictional slip, compression/separation, and rotation of blocks occur after rock damage. δ-Weakly compressible SPH (δ-WCSPH) is employed to model the fluid domain. Moreover, a two-phase adaptive adjacent method considering the discontinuous particles is developed to rigorously define FSI processing during inrush. A verified hydraulic fracturing test considering the different initial flaws, water pressure, initial particle spacing and smoothing kernel length is conducted. The progressive rock failure and water inrush of the Jigongling karst tunnel are calculated and analysed by considering the influence of karst cave radii, the thickness and strength of water-resistant rock, and corresponding physical vulnerabilities are investigated. Finally, the advantages and disadvantages of the improved SPH are discussed.

2. Method

2.1. Constitutive Model of Rock

Cauchy stress tensor of rock σ consists of two parts: isotropic pressure P and deviatory stress τ, which is calculated as follows [37]:
σ α β = P δ α β + τ α β ,
The isotropic pressure P = K b ( ρ ρ 0 1 ) of the material obeys Hooke’s law; τ ˙ denotes the stress rate; under small deformation conditions, the stress rate is proportional to the strain rate,
τ ˙ = G ε ¯ α β = G ( ε ˙ α β 1 3 δ α β ε ˙ γ γ ) ,
where ε ¯ α β denotes the shear deformation, G denotes the shear modulus, and ε ˙ α β denotes the strain rate tensor, which is formulated as follows:
ε α β = 1 2 ( ν α x β + ν β x α ) ,
By introducing the SPH kernel approximation, the equations of mass and momentum conservation can be obtained as follows:
d ρ i d t = j = 1 N m j ( v i α v j α ) W i j x i α d v i α d t = j = 1 N m j ( σ i α β ρ i 2 + σ j α β ρ j 2 + Π i j T i j ) W i j x i α d x i α d t = v i α + f i α m i
where v i α and v j α is the velocity of base particles i and adjacent particles j, respectively. Πij is the artificial viscosity, which is unutilised to balance nonphysical vibrations [38]. The B-spline kernel W i j is used [39] in this study. m and ρ represents mass and density, respectively; x α and v α is the coordinate position and velocity component, respectively; t is calculation time; f α is an external force.

2.2. Constitutive Model of Fluid

For a fluid like water, a weak compression SPH method is adopted to model free-surface flow. The discretisation governing equations, which consist of the mass and momentum conservation equations for fluid, are calculated as follows [40]:
d ρ a d t = b = 1 N m b ( v a α v b α ) W a b x a α d v a α d t = b = 1 N m b ( P a ρ a 2 + P b ρ b 2 + Π a b ) W a b x a α d x a α d t = v a α + f a α m a
where a and b denote the base and adjacent fluid particles, respectively, P a and P b are the pressure of fluid particles a and b, respectively. Additionally, the pressure P = c 0 2 ρ 0 γ [ ( ρ ρ 0 ) γ 1 ] is determined by the equation of state [41]. To reduce the susceptibility of the pressure field to numerical noise, a density diffusion term is incorporated into the continuity density equation and is calculated as follows:
d ρ a d t = b = 1 N m b ( v a α v b α ) W a b x a α + 0.2 h c 0 b = 1 N ( ρ a ρ b 1 ) 1 ( x a α x b α ) + 0.01 h 2 m j ( x a α x b α ) W a b x a α

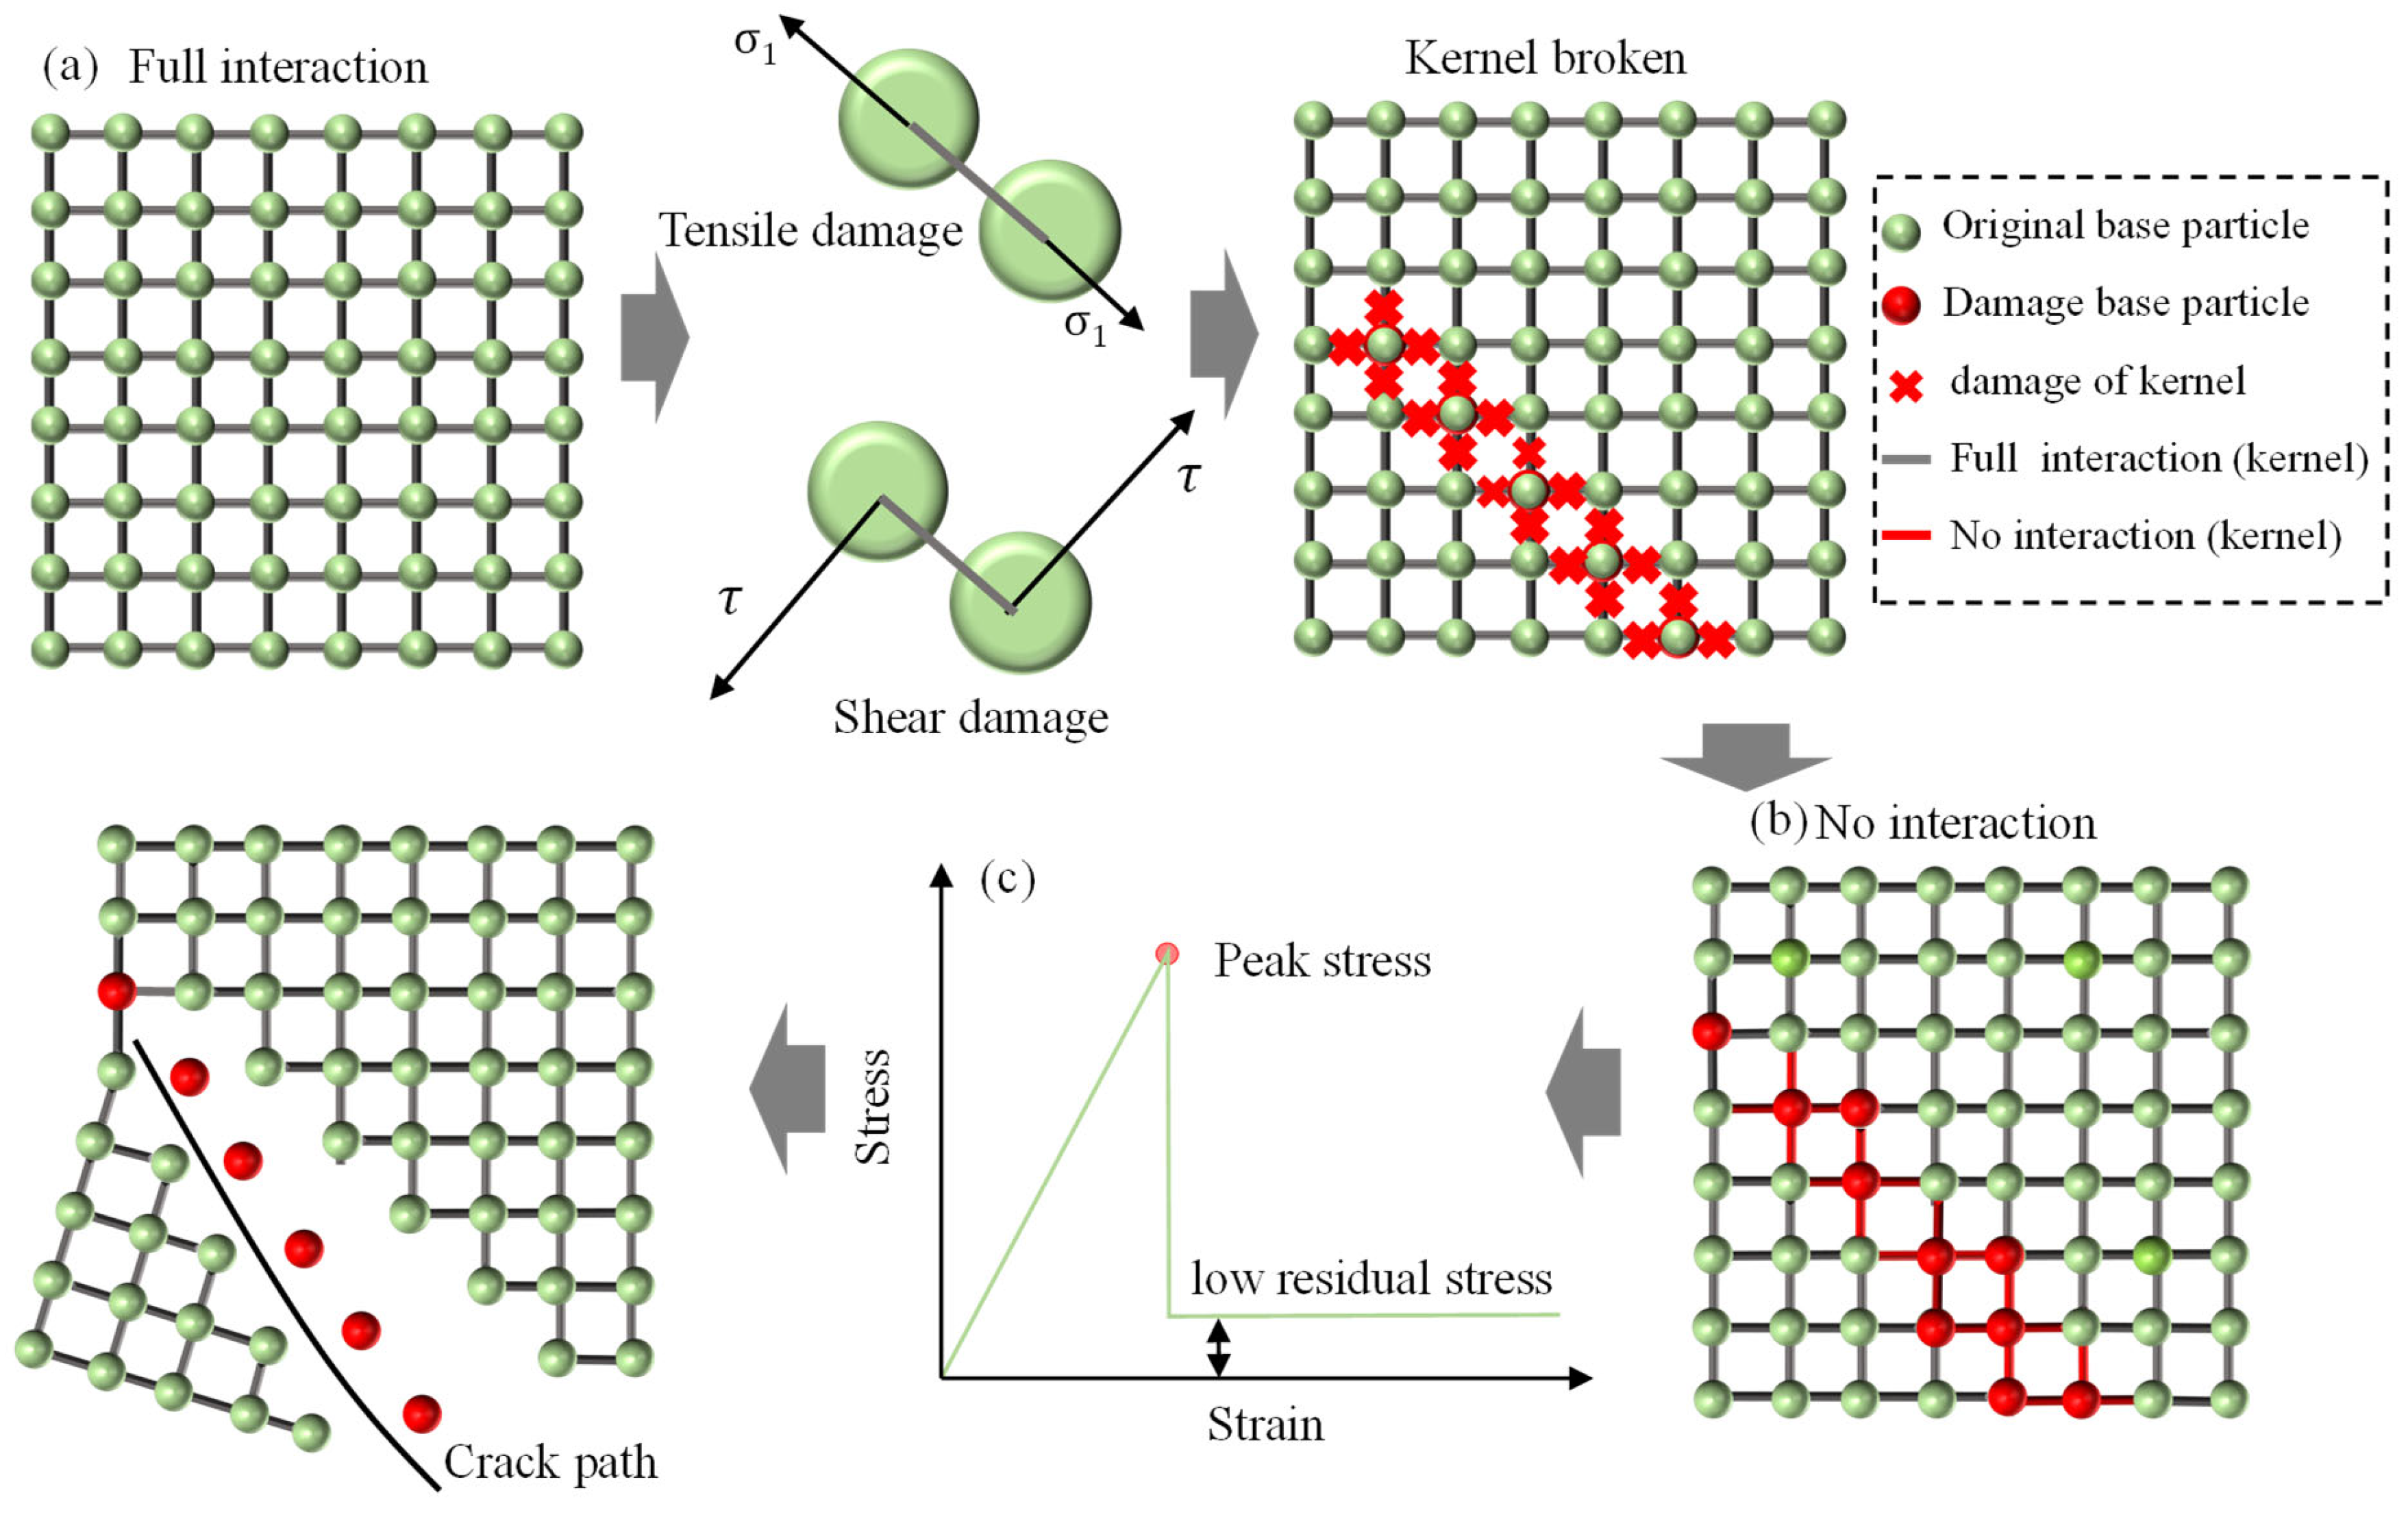
2.3. Cracking Strategy of Rock

To determine crack initiation in solids like rock, the Mohr–Coulomb criterion with tensile truncation is applied, yielding reasonable results. In intact rocks, two adjacent particles are initially connected by a virtual bridge (kernel), as defined by the kernel function of base particles, indicating ‘full interaction’ (Figure 2a). Based on this, once the rock particle reaches a failure state, the kernel function does not control the particle (i.e., kernel broken) [42,43,44,45,46]. ‘No interaction’ is formed between the damaged and intact base particles (Figure 2b). To model damage growth and crack propagation, a linear elastic brittle law is employed, as illustrated in Figure 2c. A parameter ψ is introduced to enhance the kernel function. When the failure criterion is met by the rock particle, ψ is set to 0; otherwise, ψ equals 1. This approach defines the path for crack propagation.
i j x i = ψ W i j x i
d ρ i d t = j U m j ( v i α v j α ) W i j x i α + j m j ( v i α v j α ) i j x i α d v i α d t = j U m j ( σ i α β ρ i 2 + σ j α β ρ j 2 + Π i j T i j ) W i j x i α + j m j ( σ i α β ρ i 2 + σ j α β ρ j 2 + Π i j T i j ) i j x i α d x i α d t = v i α + f i α m i
where U and represents damage and intact particles, respectively.

2.4. Contact Algorithm of Rock

In this section, a contact algorithm for rocks is described: when rock particles are damaged, they automatically become discontinuous particles with cracks (Figure 3a). A block contact based on Newton’s law is established between intact particles (IP) i and discontinuous particles (DP) j. Once penetration between two rock particles is detected, the contact will be activated immediately (Figure 3b). The penetration between IP i and DP j is determined as follows (Figure 3c):
U n = R i + R j d i j U s = v i v i n ,
where Ri and Rj are the diameters of the two particles, and the tangential contact force F i C s acting on the intact particle is calculated by F i C s = F i C s update + k s Λ U s . Once the fraction limit is exceeded (i.e., F i C s u F i C n ), sliding is permitted. To address this, the tangential contact force can be finally derived as follows:
F i C s ¯ = u F i C n F i C s F i C s     F i C s u F i C n F i C s           F i C s < u F i C n ,
where the frictional coefficient, μ, is incorporated into the force, which is then added to the momentum Equation (8) to update the particle’s velocity and position. As a result, the governing equations for both intact and discontinuous particles can be reformulated as follows:
d ρ i d t = j U m j v i j α W i j x i β d v i α d t = j U m j ( σ i α β ρ i 2 + σ j α β ρ j 2 + Π i j T i j ) W i j x i β + F i E m i + F i C n m i + F i C s ¯ m i d x i α d t = v i α
d ρ d d t = 0 d v d α d t = F d E m d + F d C n m d + F d C s ¯ m d d x d α d t = v d α
where F i E and F d E denote the external force of intact and discontinuous particles, respectively. Therefore, Equation (12) is used to describe the mass and the governing equation for the motion of DP particles [47].

2.5. Fluid–Solid Interaction Scheme

An SPH method incorporates a two-phase adaptive adjacent algorithm that accounts for DPs, allowing for the simulation of FSI processes like hydraulic fracturing during inrush. When fluid particles get into the kernel support of solid particles, the solid particles are regarded as the deformable boundary to impose velocity and displacement boundary conditions on the fluid particles. Consequently, the force f i S exerted on the solid particle i by the neighbouring fluid particles can be derived as follows:
f i S = m i a m a ( P i ρ i 2 + P a ρ a 2 + Π i a ) i W ( x i a ) ,
According to Newton’s third law, the equal and opposite reaction due to neighbouring solid particles exerted on the solid particle is obtained from the following:
f a F = m a i m i ( P a ρ a 2 + P i ρ i 2 + Π a i ) a W ( x a i ) ,
When hydraulic fracturing of rock occurs, referring to the DEM–SPH coupling treatment [15], the discontinuous particles d are regarded as repulsive particles [48]. In addition, interaction forces f d F and f a S are treated as the external force (i.e., pressure), which are an equal and opposite reaction from the interacting discontinuous and water particles and are described using the following formula:
f a S = f d F = χ ( r 0 / r a d ) q 1 ( r 0 / r a d ) q 2 ( x a d / r a d ) ,   if   r 0 / r a d < 1 0 ,   if   r 0 / r a d 1
These interaction forces are then incorporated into both the fluid and solid momentum equations. Consequently, the momentum equations for intact rock particles, discontinuous particles, and fluid particles can be rewritten as follows:
d v i α d t = j U m j ( σ i α β ρ i 2 + σ j α β ρ j 2 + Π i j T i j ) W i j x i α + F i E m i + F d C n m i + F i C s ¯ m i m i a m a ( P i ρ i 2 + P a ρ a 2 + Π i a ) i W ( x i a ) d v a α d t = b = 1 N m b ( P a ρ a 2 + P b ρ b 2 + Π a b ) W a b x a α + f a α m a m a i m i ( P a ρ a 2 + P i ρ i 2 + Π a i ) a W ( x a i ) + χ ( r 0 / r a d ) q 1 ( r 0 / r a d ) q 2 ( x a d / r a d ) d v d α d t = F d E m d + F d C n m d + F d C s ¯ m d χ ( r 0 / r a d ) q 1 ( r 0 / r a d ) q 2 ( x a d / r a d )
where d v i α d t , d v a α d t and d v d α d t denote the momentum of intact rock i, fluid a and discontinuous d particles, respectively. An appropriate minimum time step and the XSPH method [49] were employed to prevent mutual penetration between fluid particles and solid particles.

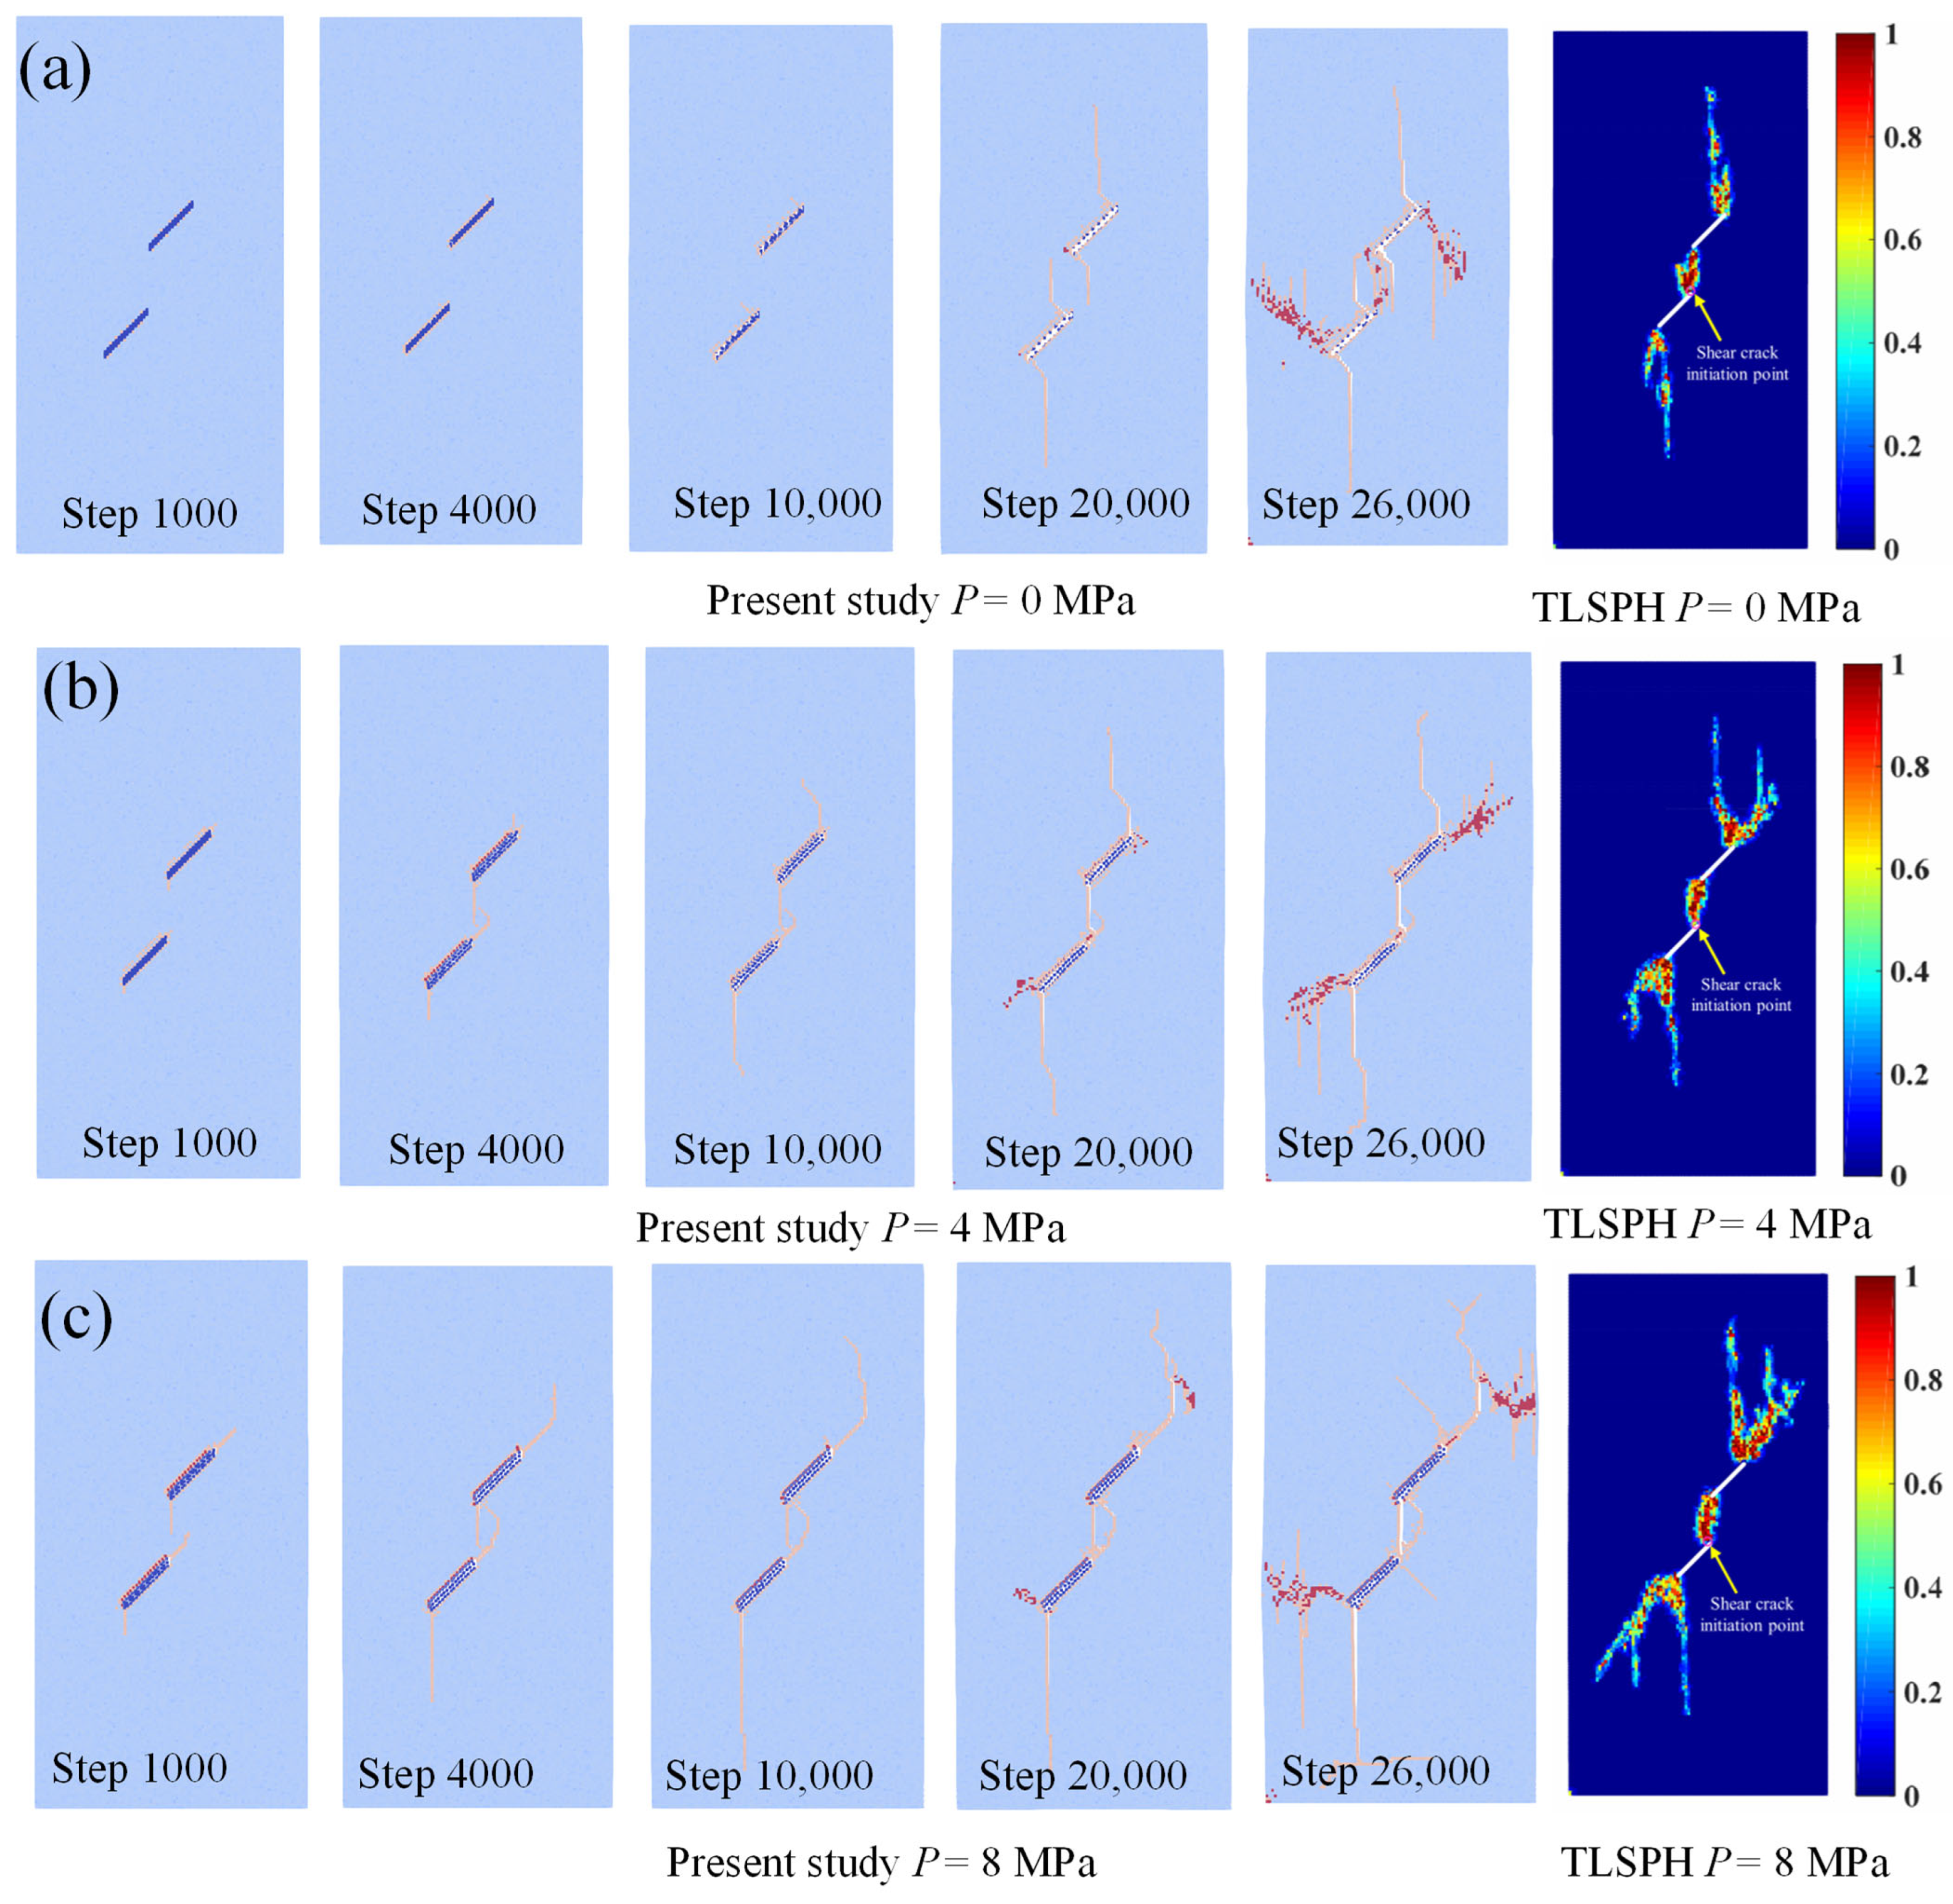
3. Validation Example

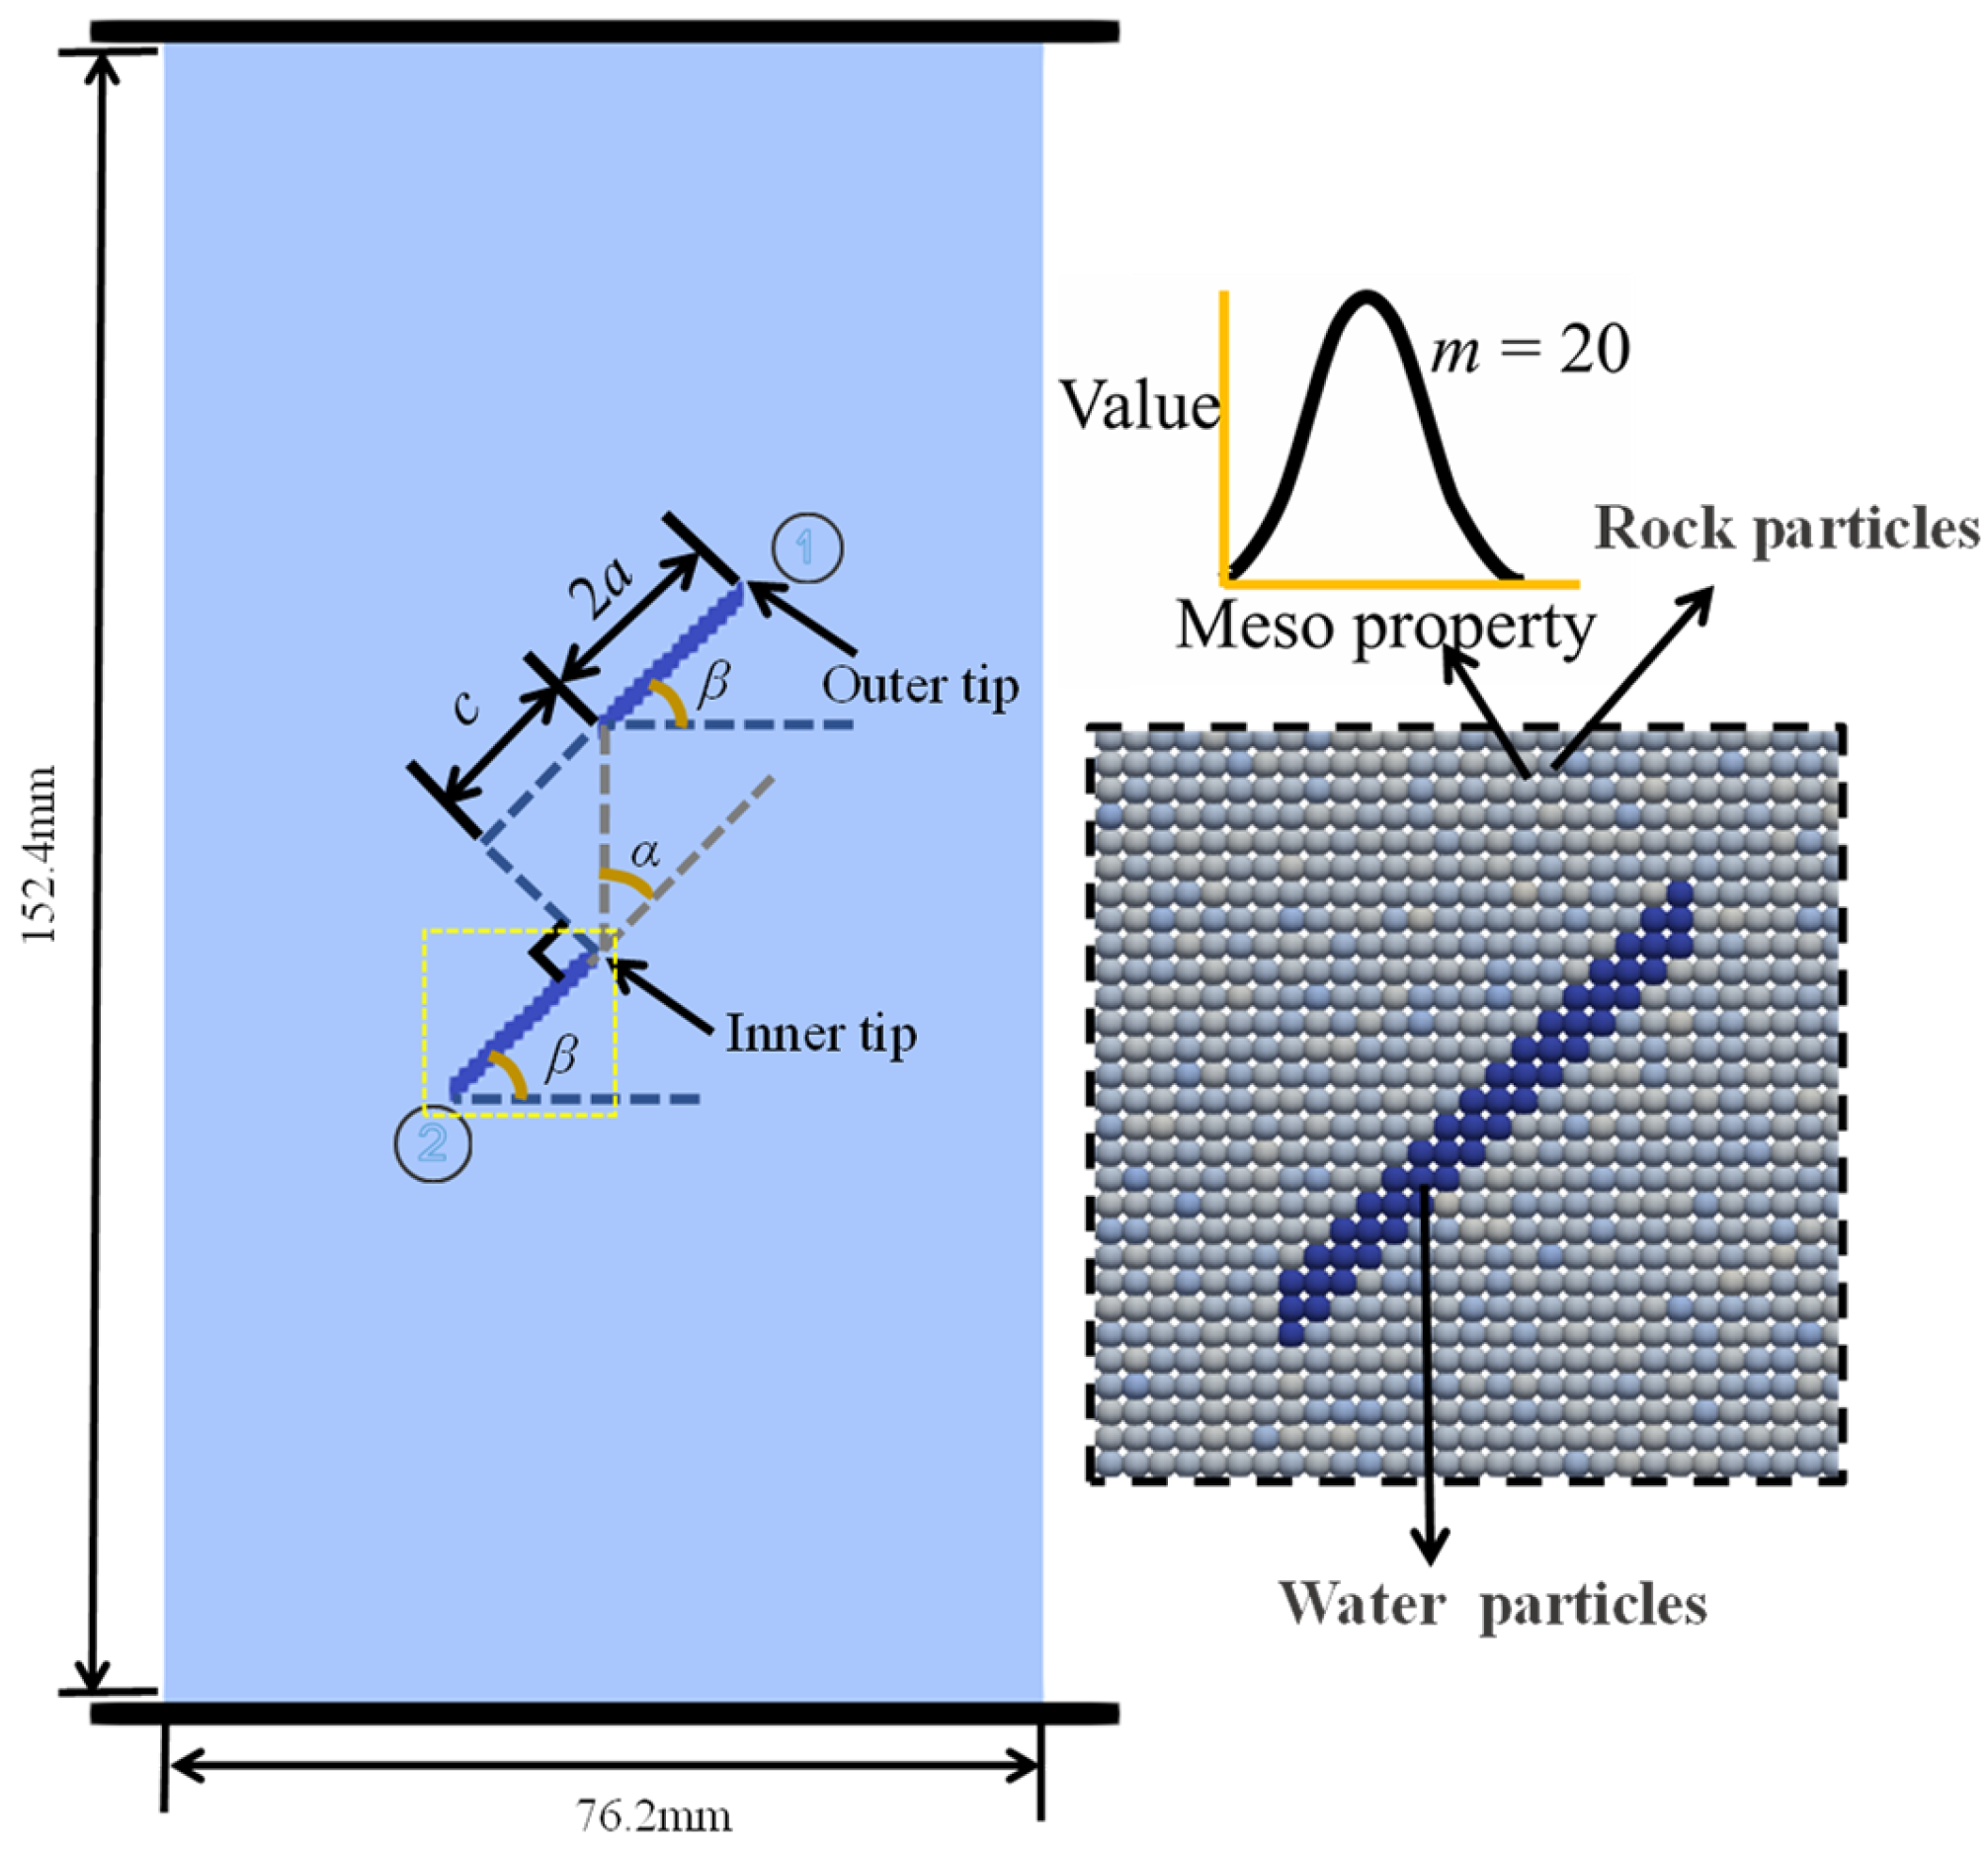
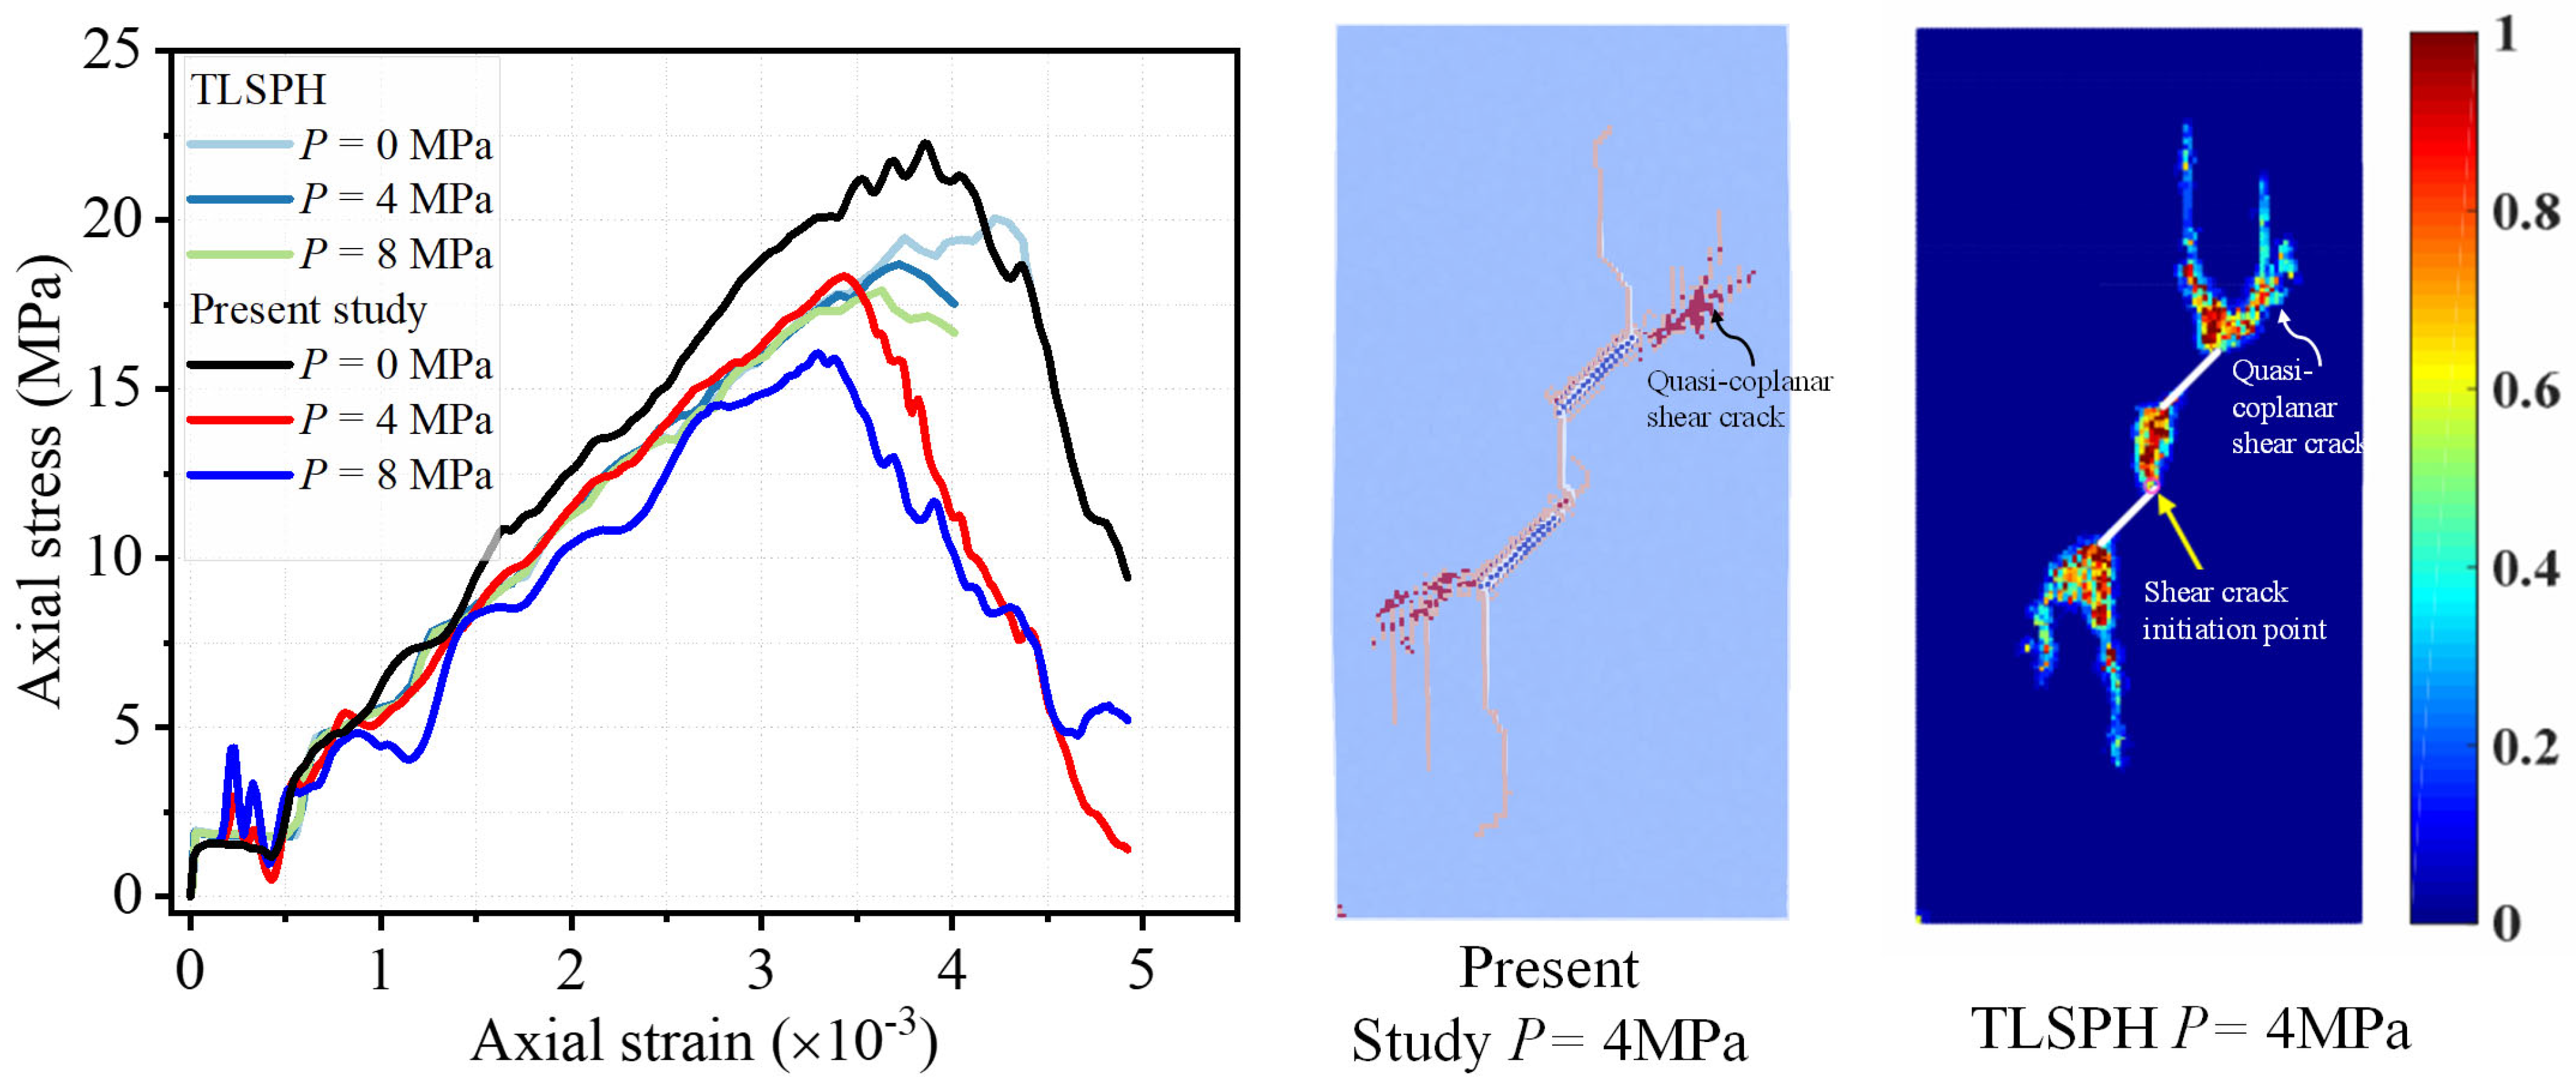
Hydraulic Fracturing of Two Pre-Existing Flawed Rocks

To verify the feasibility of the improved SPH framework for simulating FSI and cracking behaviour, a numerical simulation was performed, following the work of Mu et al. [50], to analyse how flaw water pressure affects crack propagation and coalescence in rock samples with two parallel prefabricated flaws. Three samples, each subjected to different flaw water pressures (P = 0, 4, 8 MPa), were selected for the simulation. The rock sample, as shown in Figure 4, has dimensions of 76.2 mm in length and 152.4 mm in width and is composed of 18,000 particles. Prefabricated flaw 1 has an inclination angle of β = 45°, while the angle between the line connecting the inner tips of prefabricated flaws 1 and 2 and the extension line of flaw 2 is α = 45°. The initial particle spacing ΔP is set to 0.8 mm, with a smoothing kernel length of h = 0.7 mm to prevent SPH kernel interaction between particles across the DPs. A loading rate of 0.5 m/s was applied to the upper and lower boundary particles, with a time step of ∆t = 5 × 10⁻⁸ s. The mechanical parameters for this test are listed in Table 1. While the density, elastic modulus, Poisson’s ratio, and internal friction angle represent the actual physical properties of the material, the cohesion and tensile strength values reflect the bond strength between particles.
The failure modes with initial flaw water pressures of 4 MPa calculated by the improved SPH method are depicted in Figure 5. The apparent elastic modulus (6.12 GPa) and uniaxial compressive strength (UCS) (17.6 MPa) obtained from the stress–strain curve of the improved SPH model in this paper are highly consistent with the results of Total Lagrangian SPH (TLSPH) with an initial flaw water pressure of 4 MPa, and the error is within 1%. Moreover, the coalescence and failure modes of double cracks are highly consistent with those calculated by the TLSPH method. In summary, the results proved the accuracy and feasibility of the improved SPH method for simulating fracture and FSI processes.
Compared with TLSPH based on the implicit seepage control equation [50], in improved SPH, the actual fluid particle is directly modelled based on δ-WCSPH and can flow based on the water pressure along cracks, which leads to a larger variation in the final UCS, with initial different water pressures. For example, when the water pressure in fractures reaches 0 MPa and 8 MPa, the UCS value (6.5 MPa) calculated by the improved SPH method is greater than that (2.8 MPa) of TLSPH [50].
The crack propagation and coalescence modes with initial flaw water pressures of 4 MPa are depicted in Figure 6. The tensile wing crack outside the tip and anti-plane crack calculated by the improved SPH method is verified by TLSPH [50], indicating that the improved SPH method can effectively simulate the generation and propagation of hydraulic cracks. This is an important basis for the subsequent simulation of hydraulic fracturing in karst tunnels.
Figure 7 presents a direct comparison of crack distributions and stress-strain curves for SPH models with varying initial particle spacings (ΔP), demonstrating the robustness of the approach. The results show that particle spacing has a minor impact on the final cracking pattern. As seen in Figure 7b, the peak stress for ΔP = 1 × 10⁻³ m is noticeably lower than the TLSPH result, primarily due to reduced accuracy [50]. As ΔP decreases, the simulated crack paths become more accurate, improving the precision of the stress-strain curves. However, while reducing particle spacing enhances the computational accuracy of SPH models, it also substantially increases the computational cost [42]. To balance precision and computational efficiency, ΔP of 8 × 10⁻⁴ m was chosen for this case. This principle was applied to determine the particle spacing in all SPH models.
In Figure 8, a direct comparison of crack distributions and stress–strain curves are presented for SPH models with different smoothing kernel lengths (h). In fluid and soil simulations, larger kernel length could very likely induce high accuracy in SPH [51]. However, if the kernel length becomes overly large, it can lead to some abnormal phenomena or instability in computation. For instance, in the case of a rock crack, assuming that there are two groups of IPs separated by a layer of DPs, it is crucial to prevent the SPH kernel interaction of the IPs on the two sides of DPs. This is because there is no physical link between the intact parts on each side of the crack. To address this issue, a small support domain approach inspired by previous studies was employed to avoid such complications [52,53]. Through our comparative analysis in Figure 8, it is observed that when the kernel length h is overly large in the cases of h = 7.5 × 10⁻⁴ m and 8 × 10⁻⁴ m, they lead to abnormal crack distributions, especially in the bottom section. Conversely, if the kernel length is overly small, the accuracy of the computational results is compromised, as evidenced by the case of h = 0.65 mm, which failed to accurately reproduce the quasicoplanar shear crack. In terms of stress–strain curves, increasing the kernel length results in higher peak stress values. This phenomenon is primarily caused by the interaction between the IPs on either side of the DPs, leading to a false cohesive force effect. Therefore, a kernel length of h = 7 × 10⁻⁴ m provides the most accurate results, with a difference of only 1% compared to the TLSPH result [50]. Through this investigation, we have highlighted the importance of selecting an appropriate kernel length in simulating rock fracture to ensure both accuracy and stability in the computational results. The chosen kernel length strikes a balance between capturing the discontinuous nature of rock fractures and maintaining the desired level of accuracy in stress distribution. The smoothing kernel lengths employed in all SPH models were selected following this principle.

4. Numerical Simulation of the Karst Tunnel

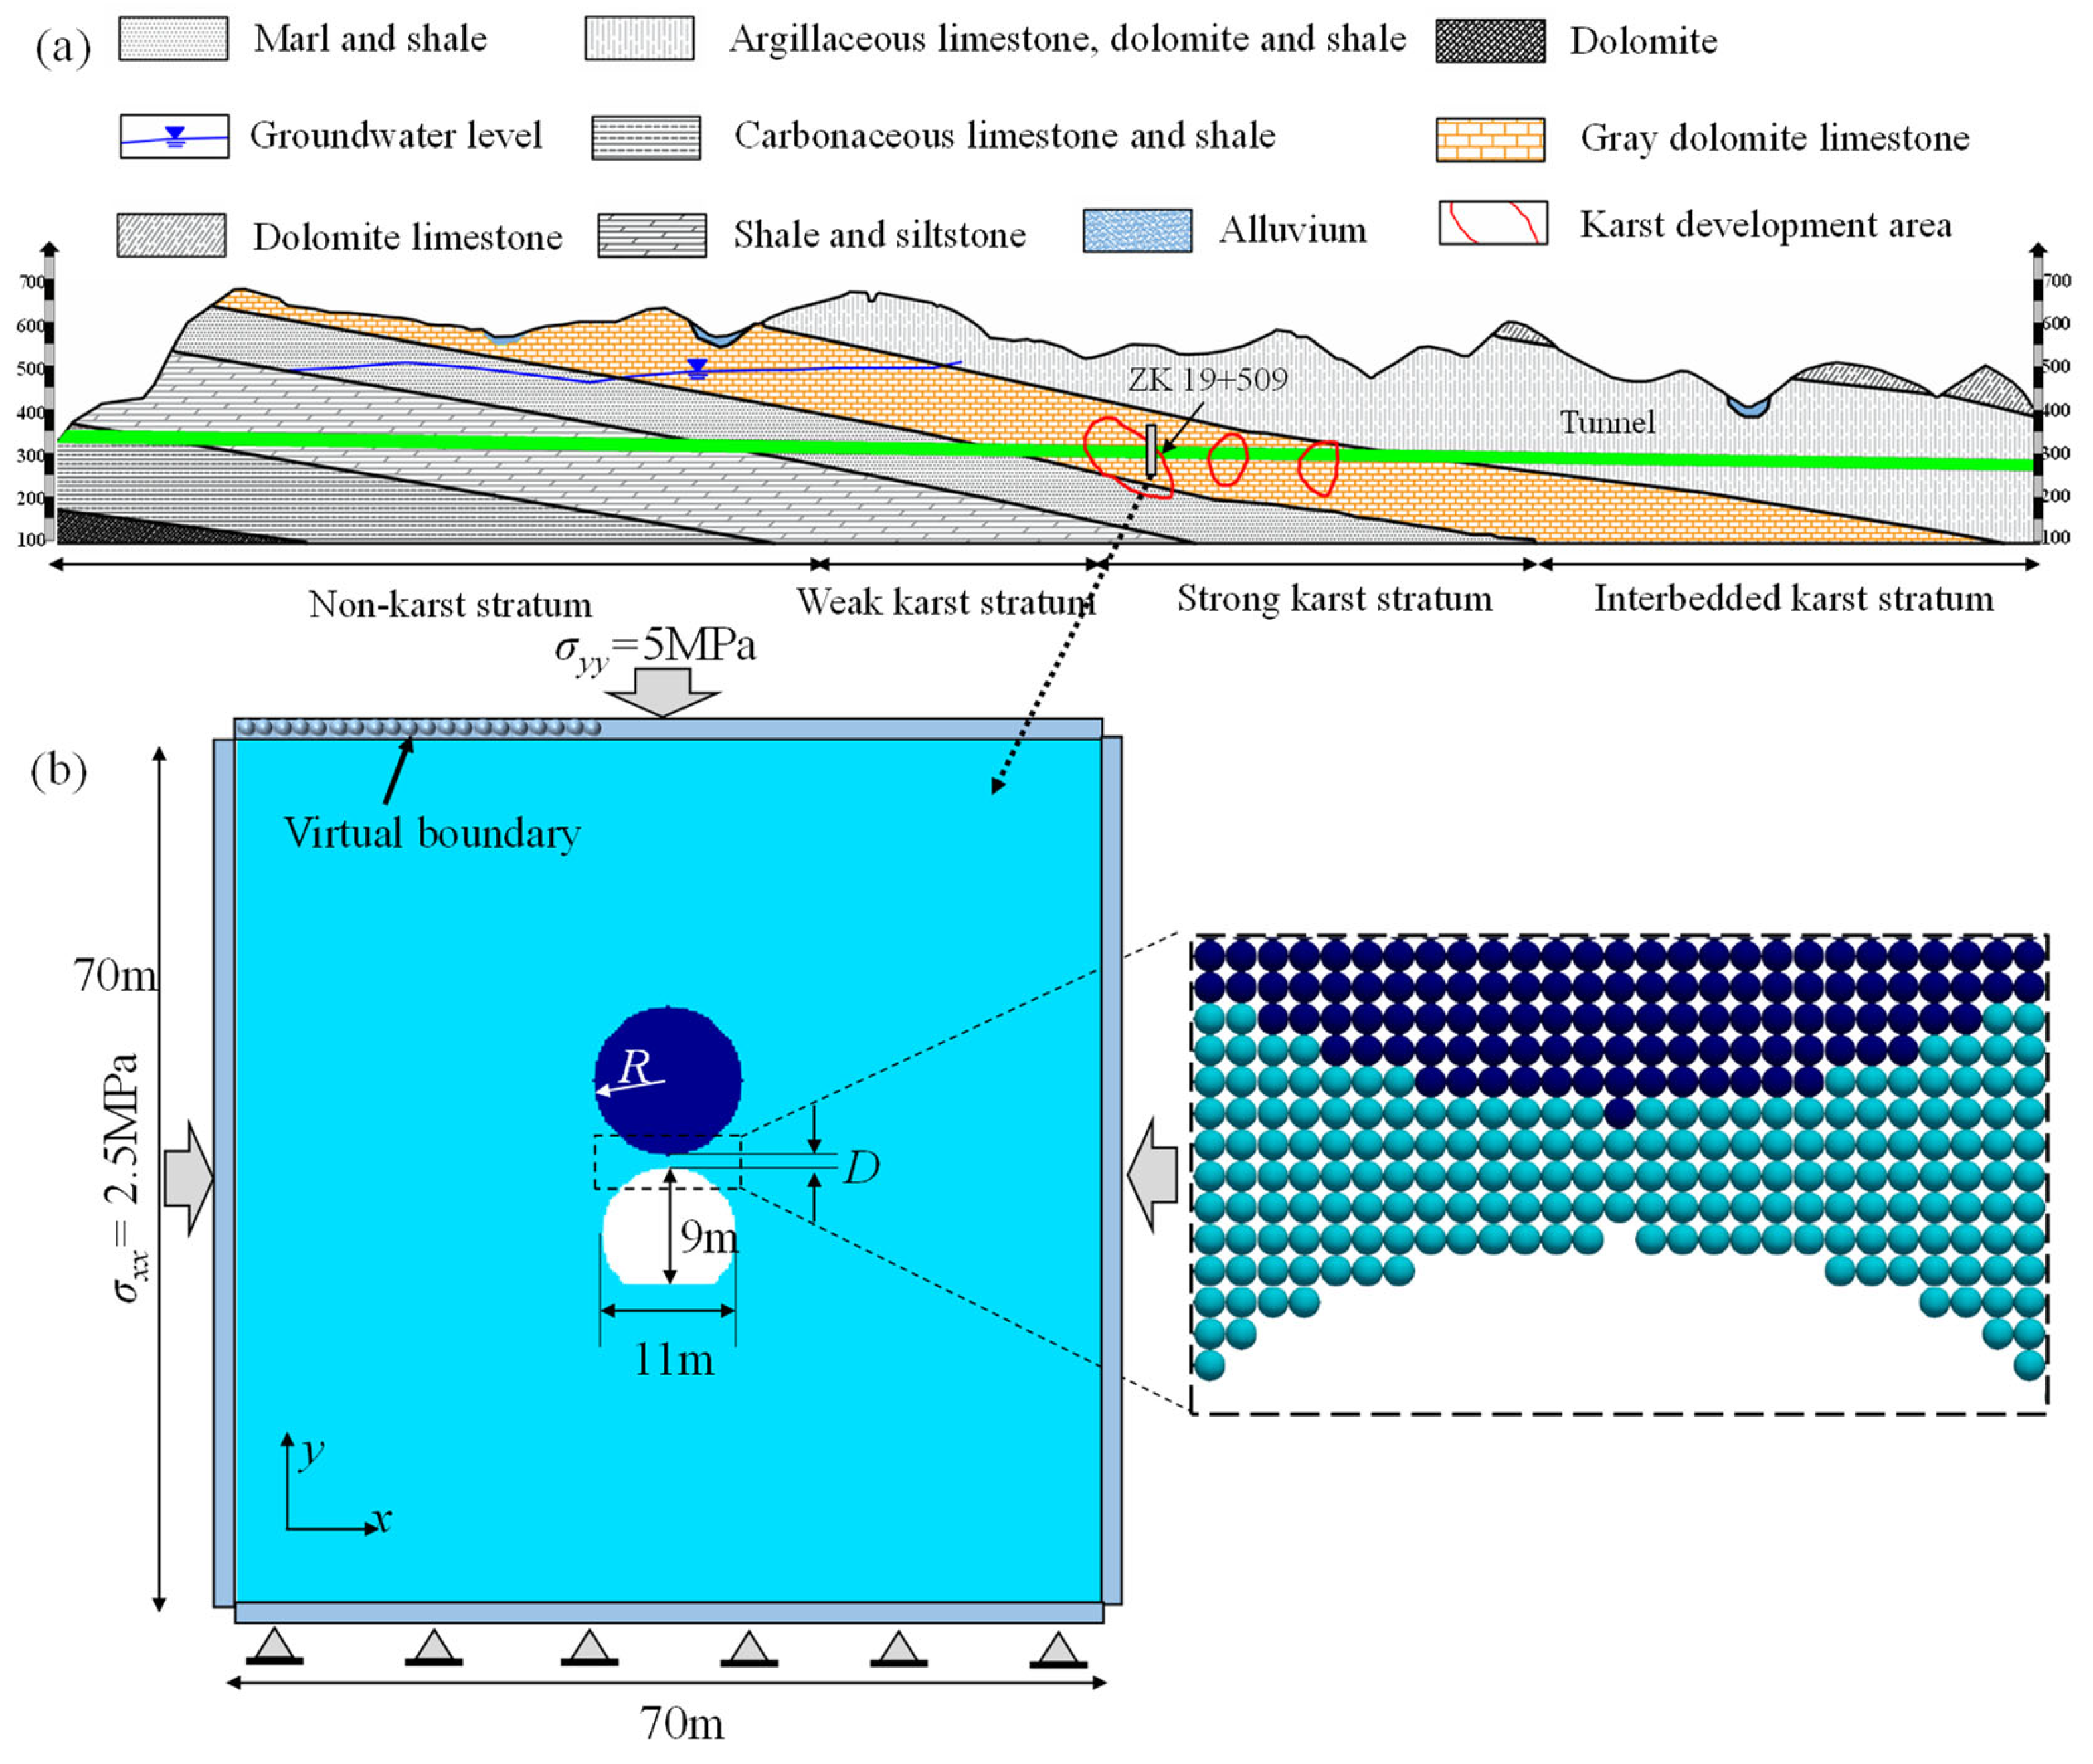
4.1. Engineering Background

To evaluate the improved SPH method’s capability in simulating cracking, contacts, and fluid–structure interaction (FSI) performance, numerical simulations were carried out using the Jigongling karst tunnel in Hubei, China, as a case study (Figure 9a). This tunnel, which is approximately 4500 m in length, has a strike of about 126° and is buried to a depth of up to 338.5 m. The surrounding rock, comprised of water-soluble limestone and shale, along with numerous karst features such as depressions and valleys, makes the tunnel susceptible to water inrush and instability. A significant event, as reported by Gao et al. [54], involved an inrush at the ZK 19+509 drill hole section (Figure 9a) with a water pressure of 0.2 MPa and a flow rate of 35–45 L/s, which continued for over 10 days and caused severe flooding, halting construction.

4.2. Computation Model and Parameters

Karst caves under water-filling conditions greatly influence the stability of the tunnel, which is prone to water/mud inrushes [4]. In this regard, the assumption of the tunnel passing through a homogeneous stratum is set, and a water-bearing karst cave is located above the tunnel face [55]. A two-dimensional tunnel model with dimensions of 70 m by 70 m was established, given that the radius of the stress influence from the excavation is roughly three times the tunnel face width. The model features a tunnel face with a height of approximately 9 m and a maximum width of 10 m (Figure 9b). Additionally, a karst cave with a radius D of 6 m is located on the tunnel face, positioned about R = 1 m from the top of the tunnel face.
The SPH mechanical parameters are directly derived from partial differential equations (PDEs), providing clear physical significance and eliminating the need for complex parameter calibration. For instance, macro-mechanical parameters such as the elastic modulus (E = 3 GPa), density (ρ = 2500 kg/m3), Poisson’s ratio (ν = 0.3), and the internal friction angle (ϕ = 35°) are directly obtained from these equations [54]. However, similar to the DEM, the cohesion and tensile strength of SPH particles do not have direct macroscopic physical significance and are typically set higher than their actual values [56]. These parameters are calibrated through a trial-and-error process by fitting the simulated stress-strain curve to the experimental data from unconfined compression tests on the rock. After calibration, the cohesion and tensile strength of SPH particles were set to c = 25 MPa and Rt = 12.5 MPa, respectively, as per [54,55]. The final parameters used for SPH particles for the QYS karst tunnel simulation are listed in Table 2. To accurately simulate free-surface water flow and rock falls, gravity acceleration (g = 9.8 m/s2) was applied. The influence of factors such as the size of the karst cave, the thickness of water-resistant rock, and the rock mass strength was studied in the Jigongling tunnel, with different calculation scenarios detailed in Table 3.

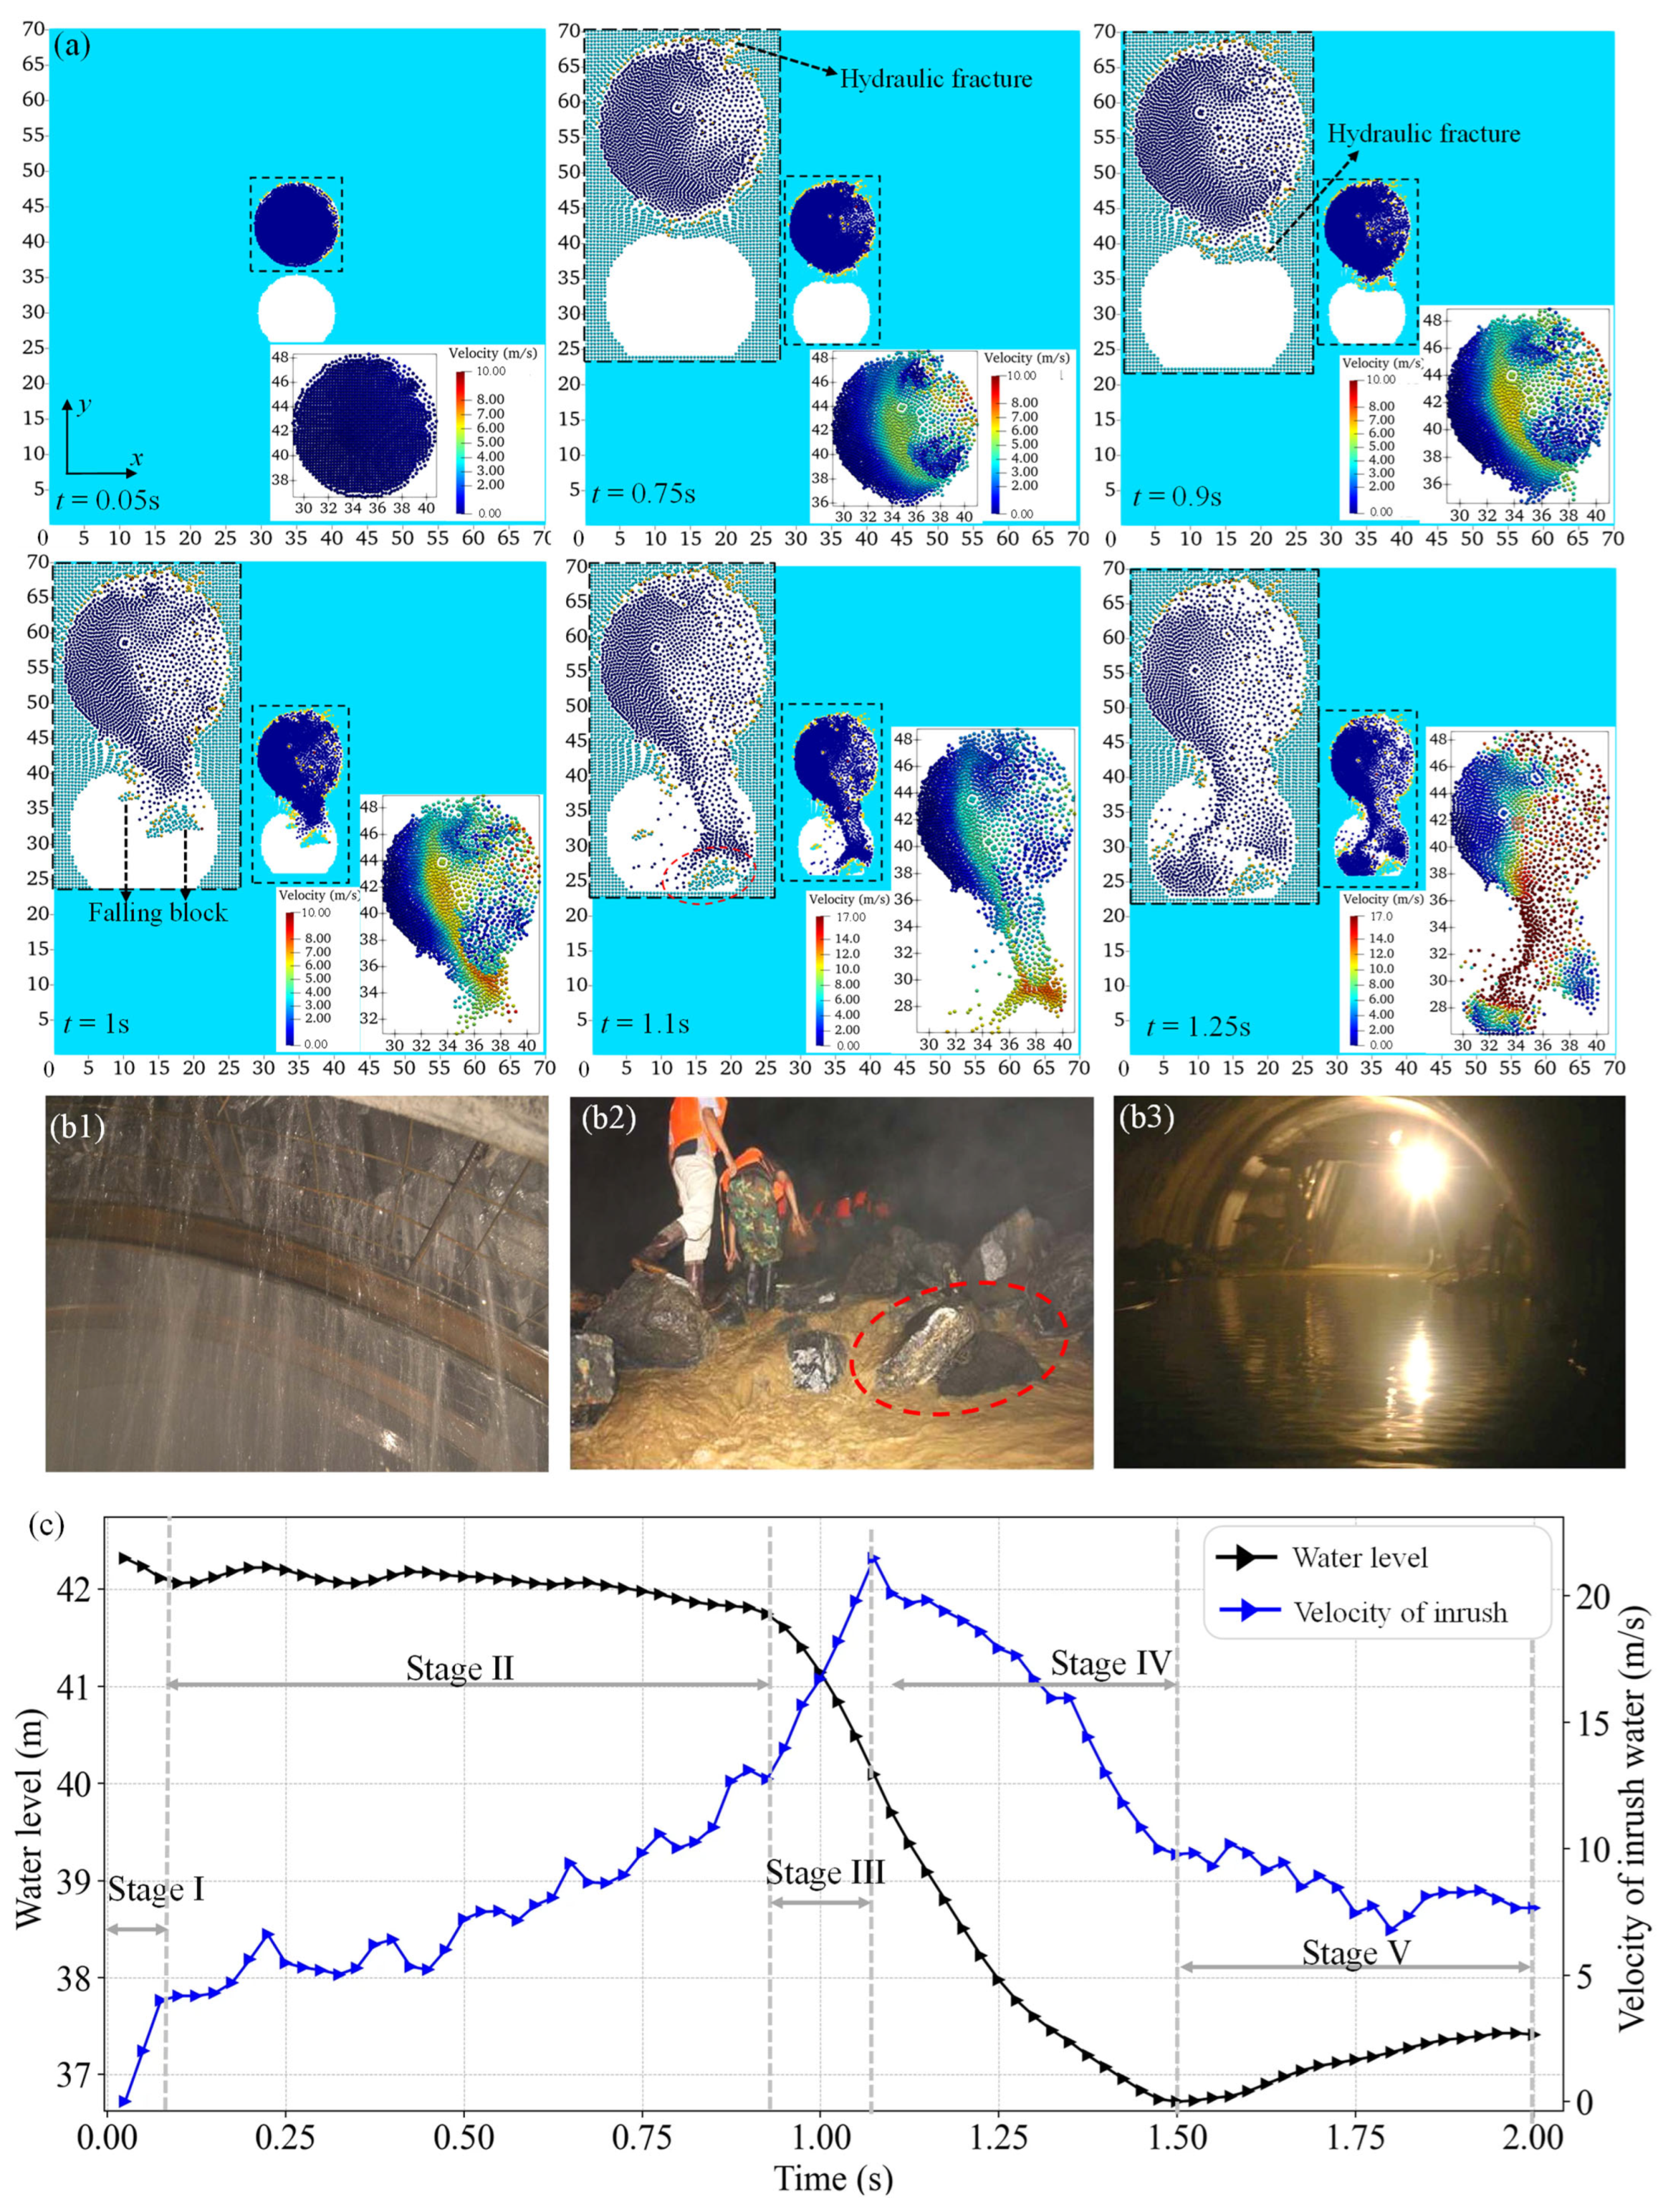
4.3. Calculation Results and Analysis

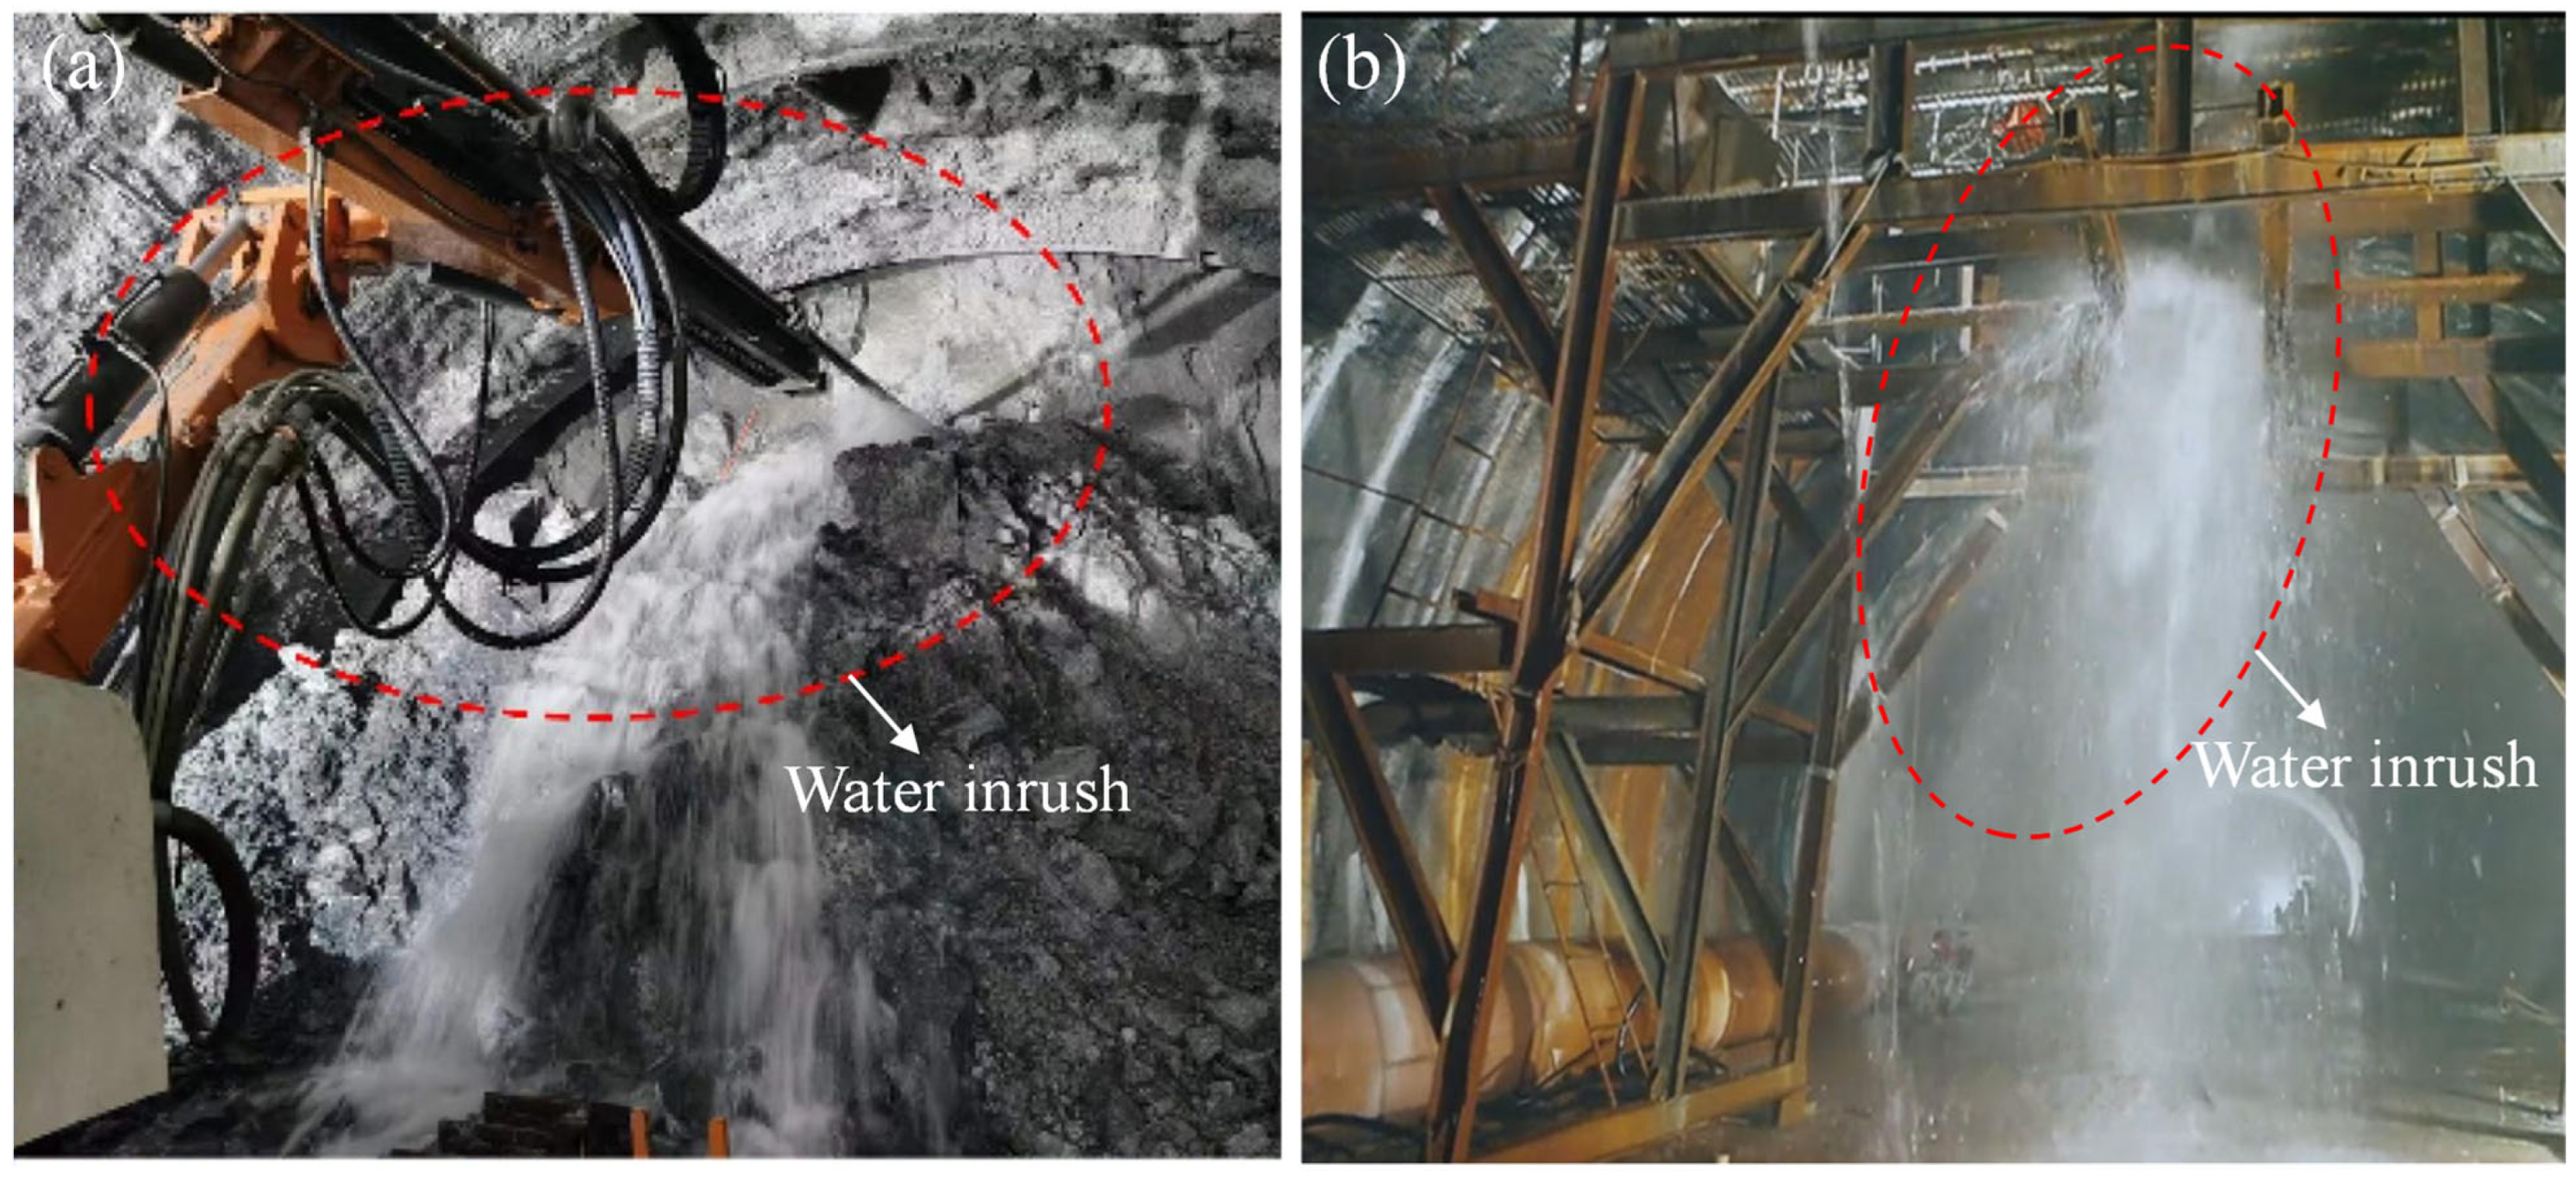
General Inrush Behaviour

To illustrate the simulated inrush process, the case study involving the karst tunnel (with R = 6 m, D = 1 m, and K = 1) was selected to show the evolution of rock damage and water inrush, as depicted in Figure 10a. The detailed brittle failure in the rock wall is highlighted within the rectangular area outlined by the dashed line. Before 0.05 s, the cave and the tunnel remain relatively stable in the elastic stage. During 0.05–0.75 s, hydraulic cracks initiate at the top of the tunnel near the cave due to stress concentration. At 0.5 s, hydraulic cracks expand at the tunnel vault near the cave with the joint action of water pressure and the gravity of the overlying rock mass. The increase in the velocity of inrush flow enhances the width of the hydraulic crack pathway. At 1.0 s, the rock blocks slide along the crack pathway under the joint effect of friction resistance, hydrodynamic pressure and self-gravity. Subsequently, rock blocks drop from the tunnel roof with local inrush flow, which is verified by the field observation (Figure 10(b1,b2)). Meanwhile, fluid from the water-bearing structure continuously flows into the tunnel. The local water inrush channel is further expanded and gradually turns into an overall water inrush. Subsequently, the inrush water fills the tunnel face at t = 1.25 s, which is consistent with the field observation [57] (Figure 10(b3)). The distribution of the inrush water velocity is depicted in Figure 10a. It demonstrates that the improved SPH method accurately captures the free-surface flow.
Additionally, Figure 10c shows the evolution of the maximum velocity of the inrush water and the water level. The inrush process can be categorised into five distinct stages. Stage I is mainly the equilibrium stage of fluid in the karst cave after FSI activation. The maximum flow velocities in the karst cave increase sharply and simultaneously to a threshold. Following stage II, a slow rise in the inrush velocity is observed, and the hydraulic fracturing of the water-blocking rock is responsible for this maximum velocity increase. Moreover, bending and cracking lead to an increase in the volume of the local karst cave and eventually slow the water level decline in the karst cave. Subsequently, water and mud surge into the tunnel, causing a rapid increase in flow velocity and a drop in the water level (stage III), which is accompanied by the complete failure of the water-resistant wall (Figure 10a). The surge reaches its maximum velocity as the fluid flow’s suddenly released energy dissipates. Then, overall water/mud inrush is achieved at stage IV, and the maximum inrush velocity gradually decreases due to energy release. Both the water levels and maximum velocities are stable in stage V.

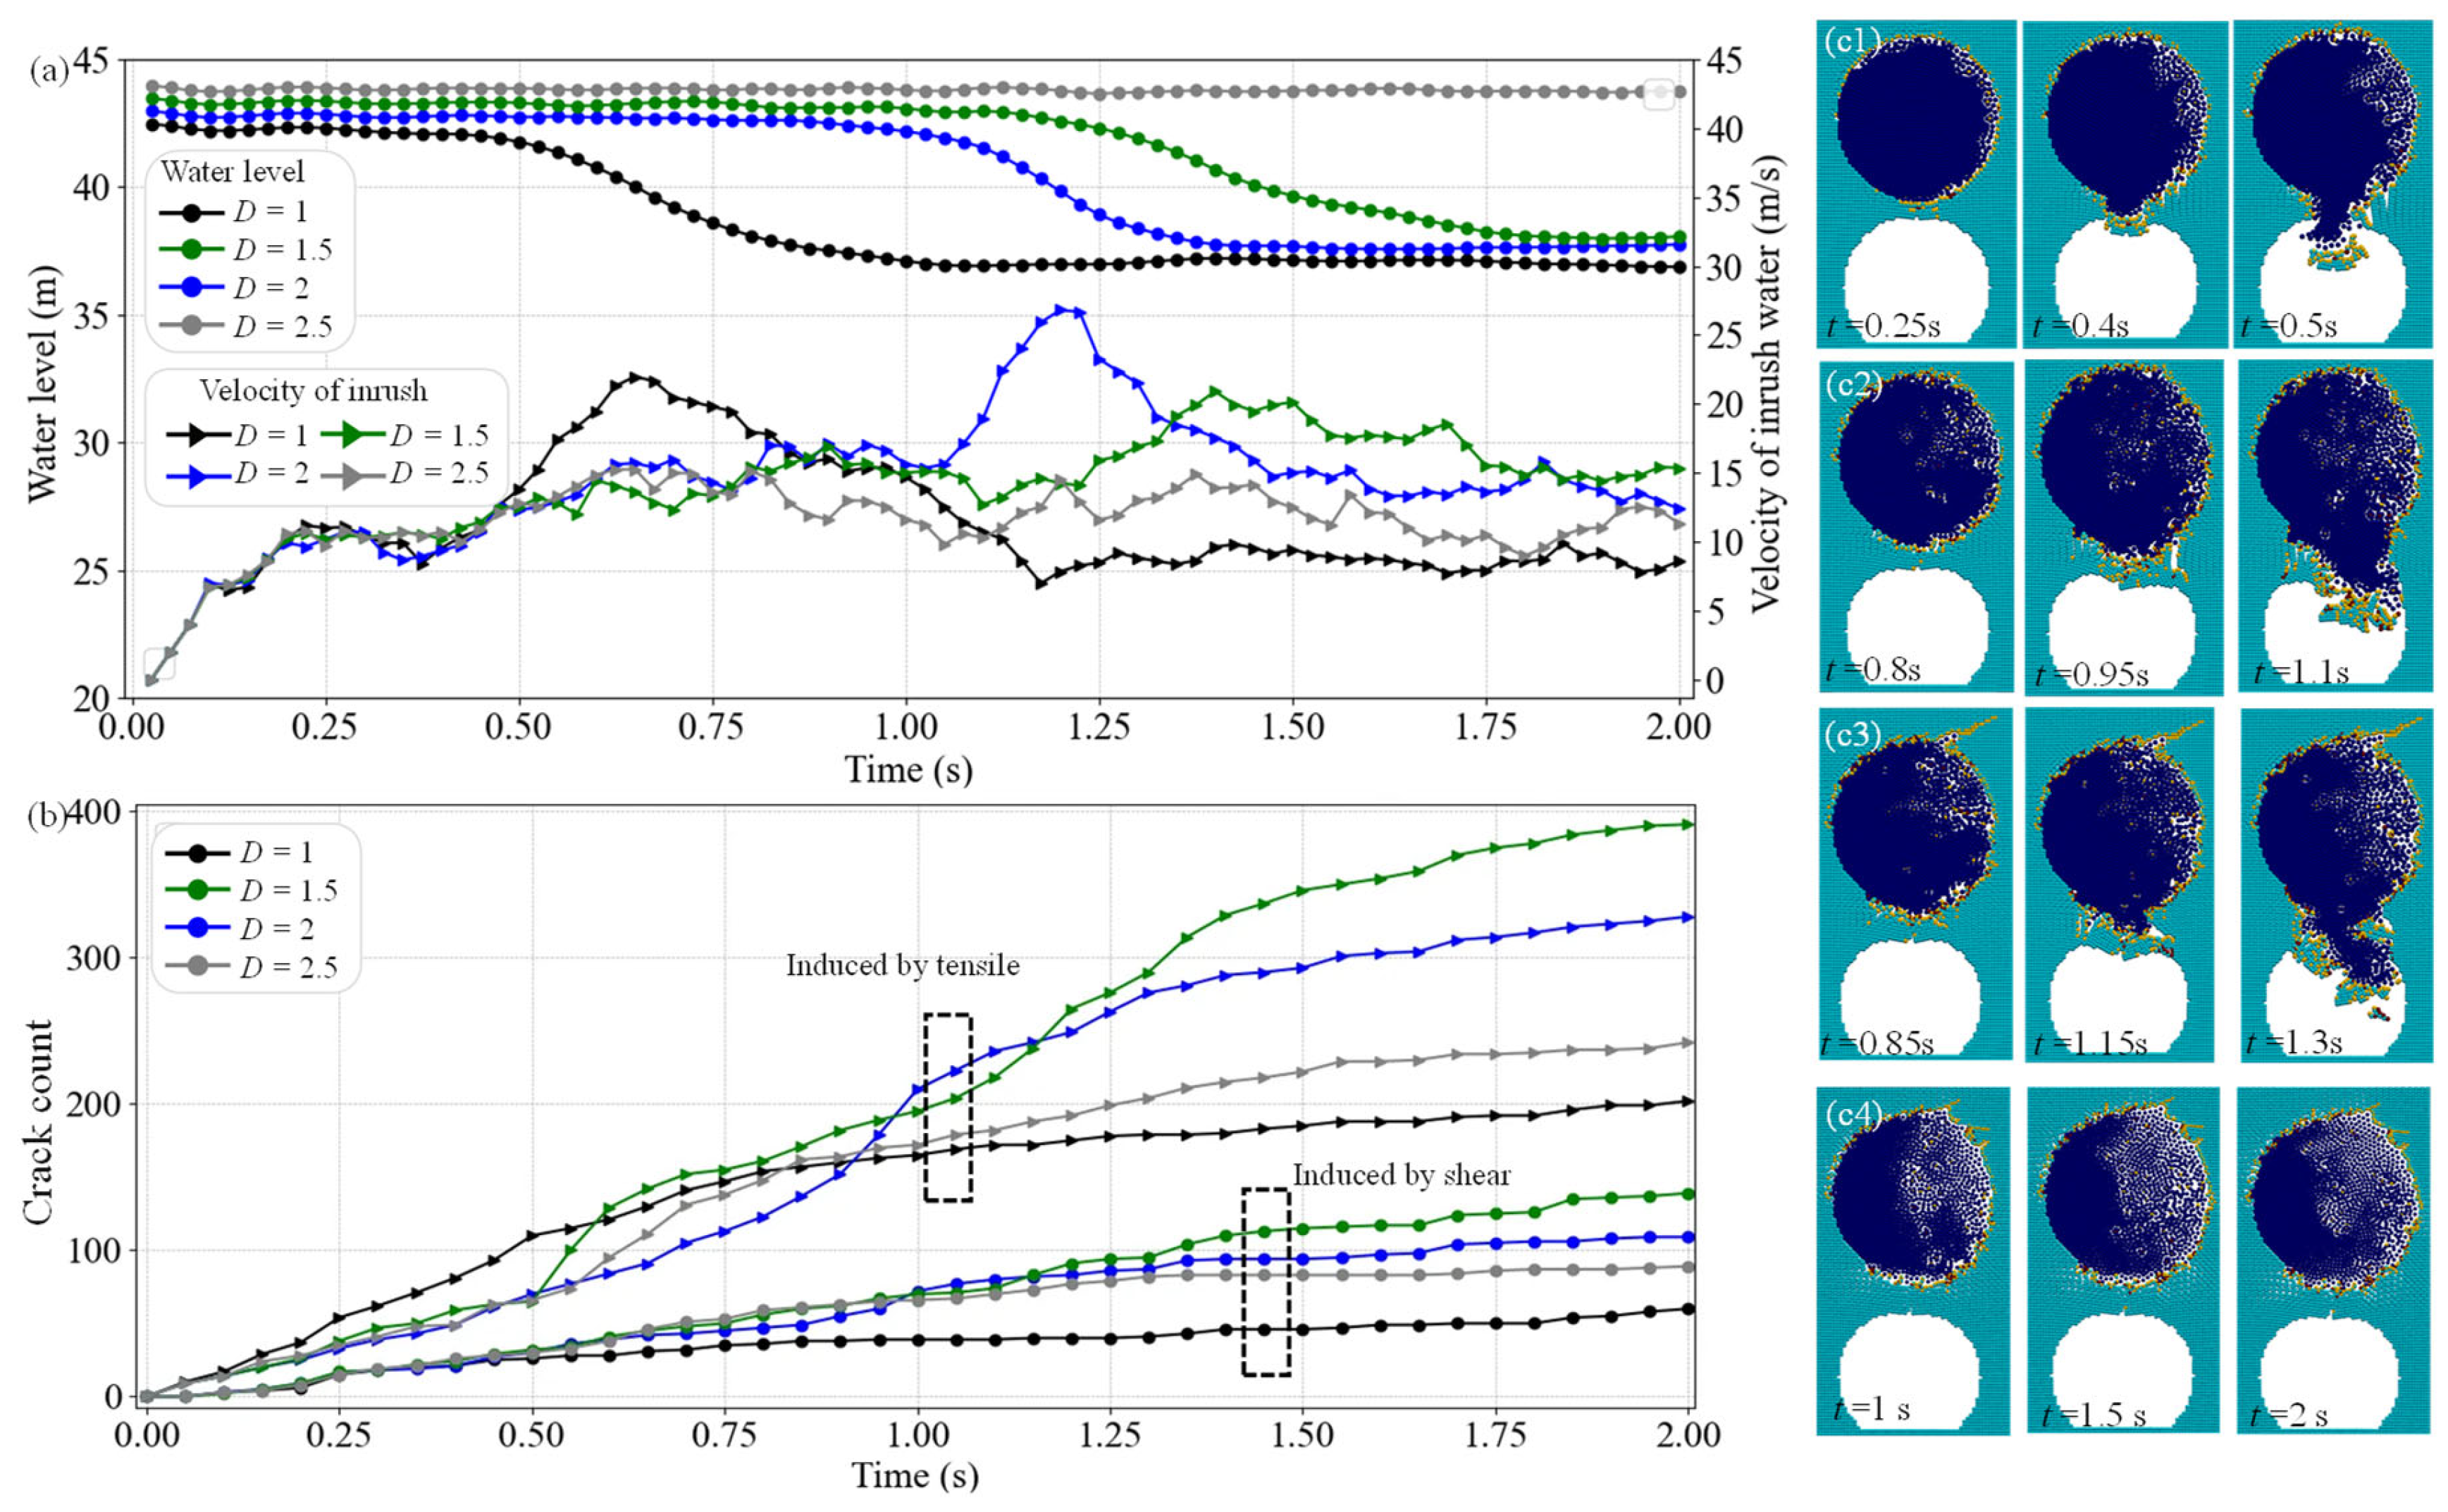
4.4. Influence of the Thickness of Water-Resistant Rock

Figure 11a,b illustrates the evolution of water level, maximum flow velocity, and crack count induced by shear and tensile stresses for different thicknesses of the water-resistant rock (D = 1, 1.5, 2, 2.5 m). The improved SPH results show that the thickness of the water-resistant rock has a significant impact on the inrush process. A greater thickness improves rock mass stability and reduces the risk of water inrush. For example, with a thickness of D = 2.5 m, the rock remains stable, resulting in a steady water level and flow velocity. As the thickness of the water-resistant wall increases, the water level decreases while the increase in flow velocity is delayed. Additionally, the duration of stages II–III of the inrush varies with thicknesses, reflecting the rock wall’s failure process. Thinner walls exhibit more pronounced jet-like flows due to the failure process affecting the flow channel.
Cracks, primarily caused by tensile stress when the major principal stress exceeds the tensile strength, align with the observed bending and breaking failure patterns (Figure 11(c1–c4)). During stages II–III, the number of cracks increases significantly and stabilises in later stages. With a thickness of D = 2.5 m, tensile damage is characterised by a greater number of radial cracks as the major principal stress exceeds the tensile strength.

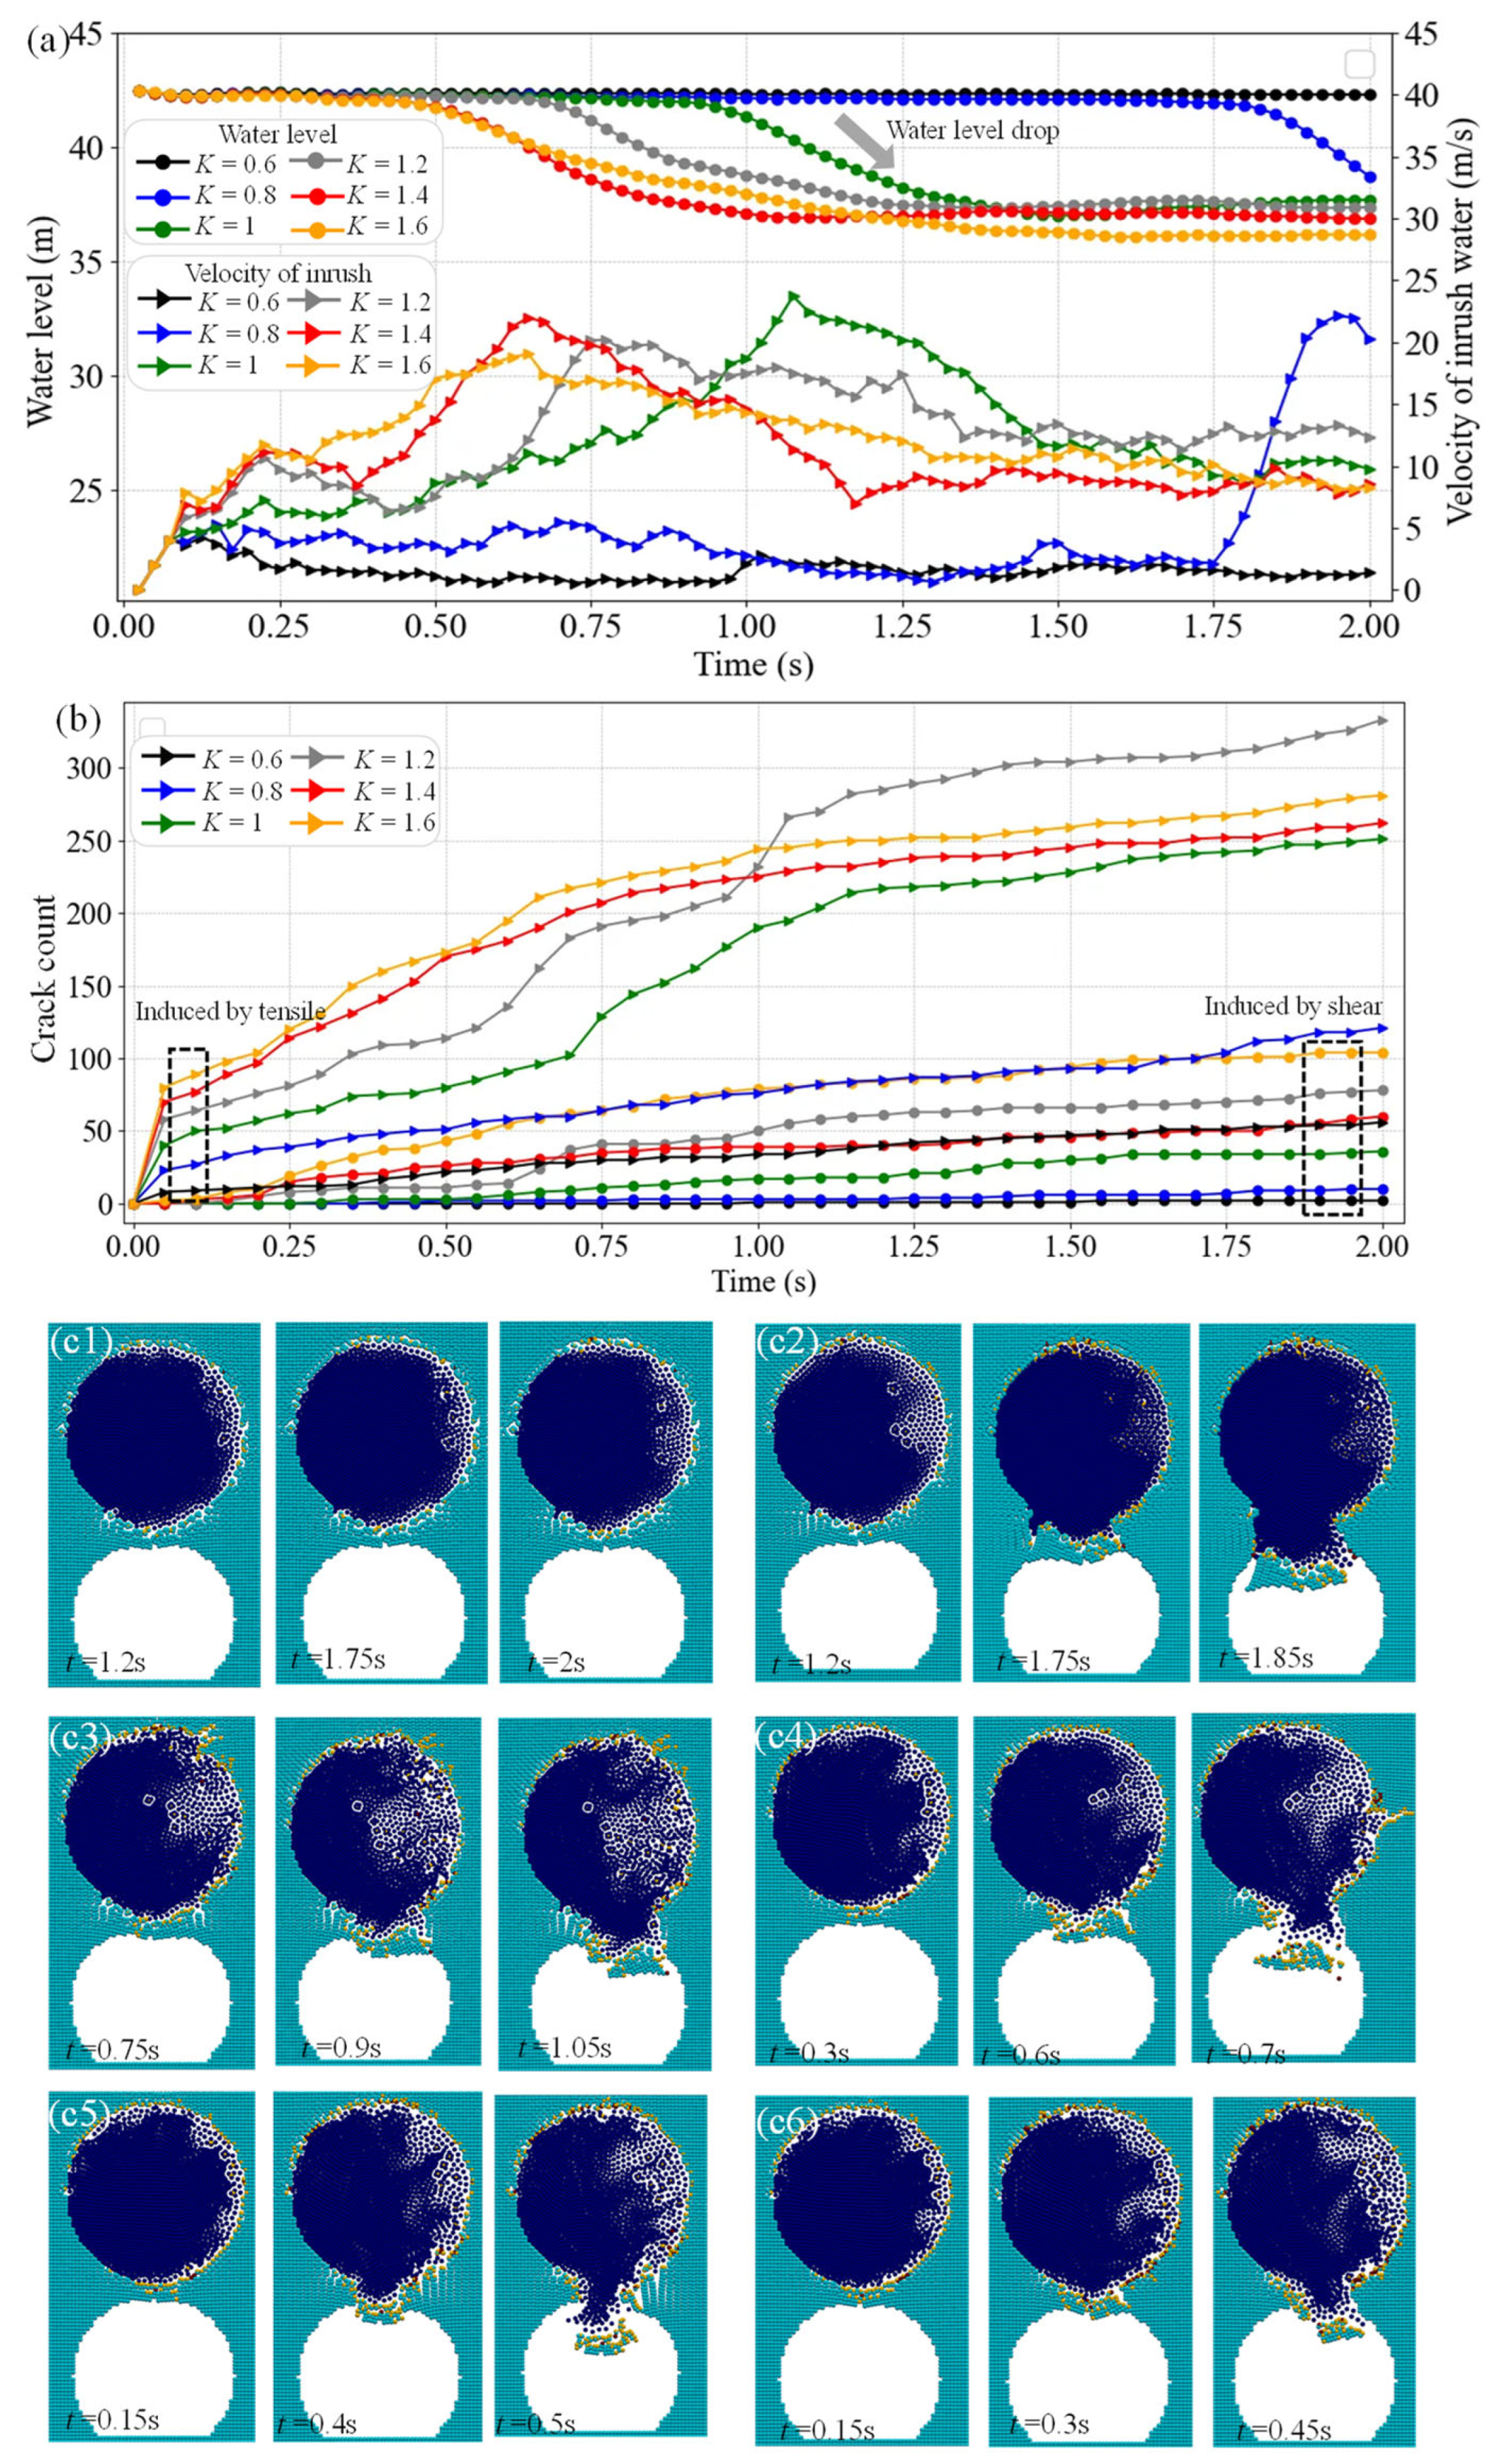
4.5. Influence of the Different Strengths of the Rock Mass

In this section, the effect of the strength of water-resistant rock (K = 0.6, 0.8, 1, 1.2, 1.4, 1.6) on the water level, inrush flow and crack count are investigated quantitatively in Figure 12a,b. With increasing shear and tensile strength of water-resistant rock (K < 1), the water level drops significantly, the drop in the water level and increase in the flow velocity occur earlier, and the corresponding stability of water-resistant rock increases during stages III–IV. With decreasing shear and tensile strength (K > 1), intuitively, crack initiation occurs earlier, and the time from fracturing to the complete failure of water-resistant rock is shorter. As the strength of the rock decreases, the peak water velocity increases in stage II due to hydraulic fracturing. Furthermore, the volume of failed rock blocks is smaller during stage III. For example, Figure 12c reveals that the volume of the failed rock block is the largest at K = 0.8 and the smallest at K = 1.6. We infer that a lower strength of water-resistant rocks favours hydraulic pressure release. In contrast, a higher strength of rock maintains a higher hydraulic pressure in the karst cave, which can push forward larger individual rock blocks. Tensile cracks dominate and exhibit a significant increase as the strength of rocks decreases.

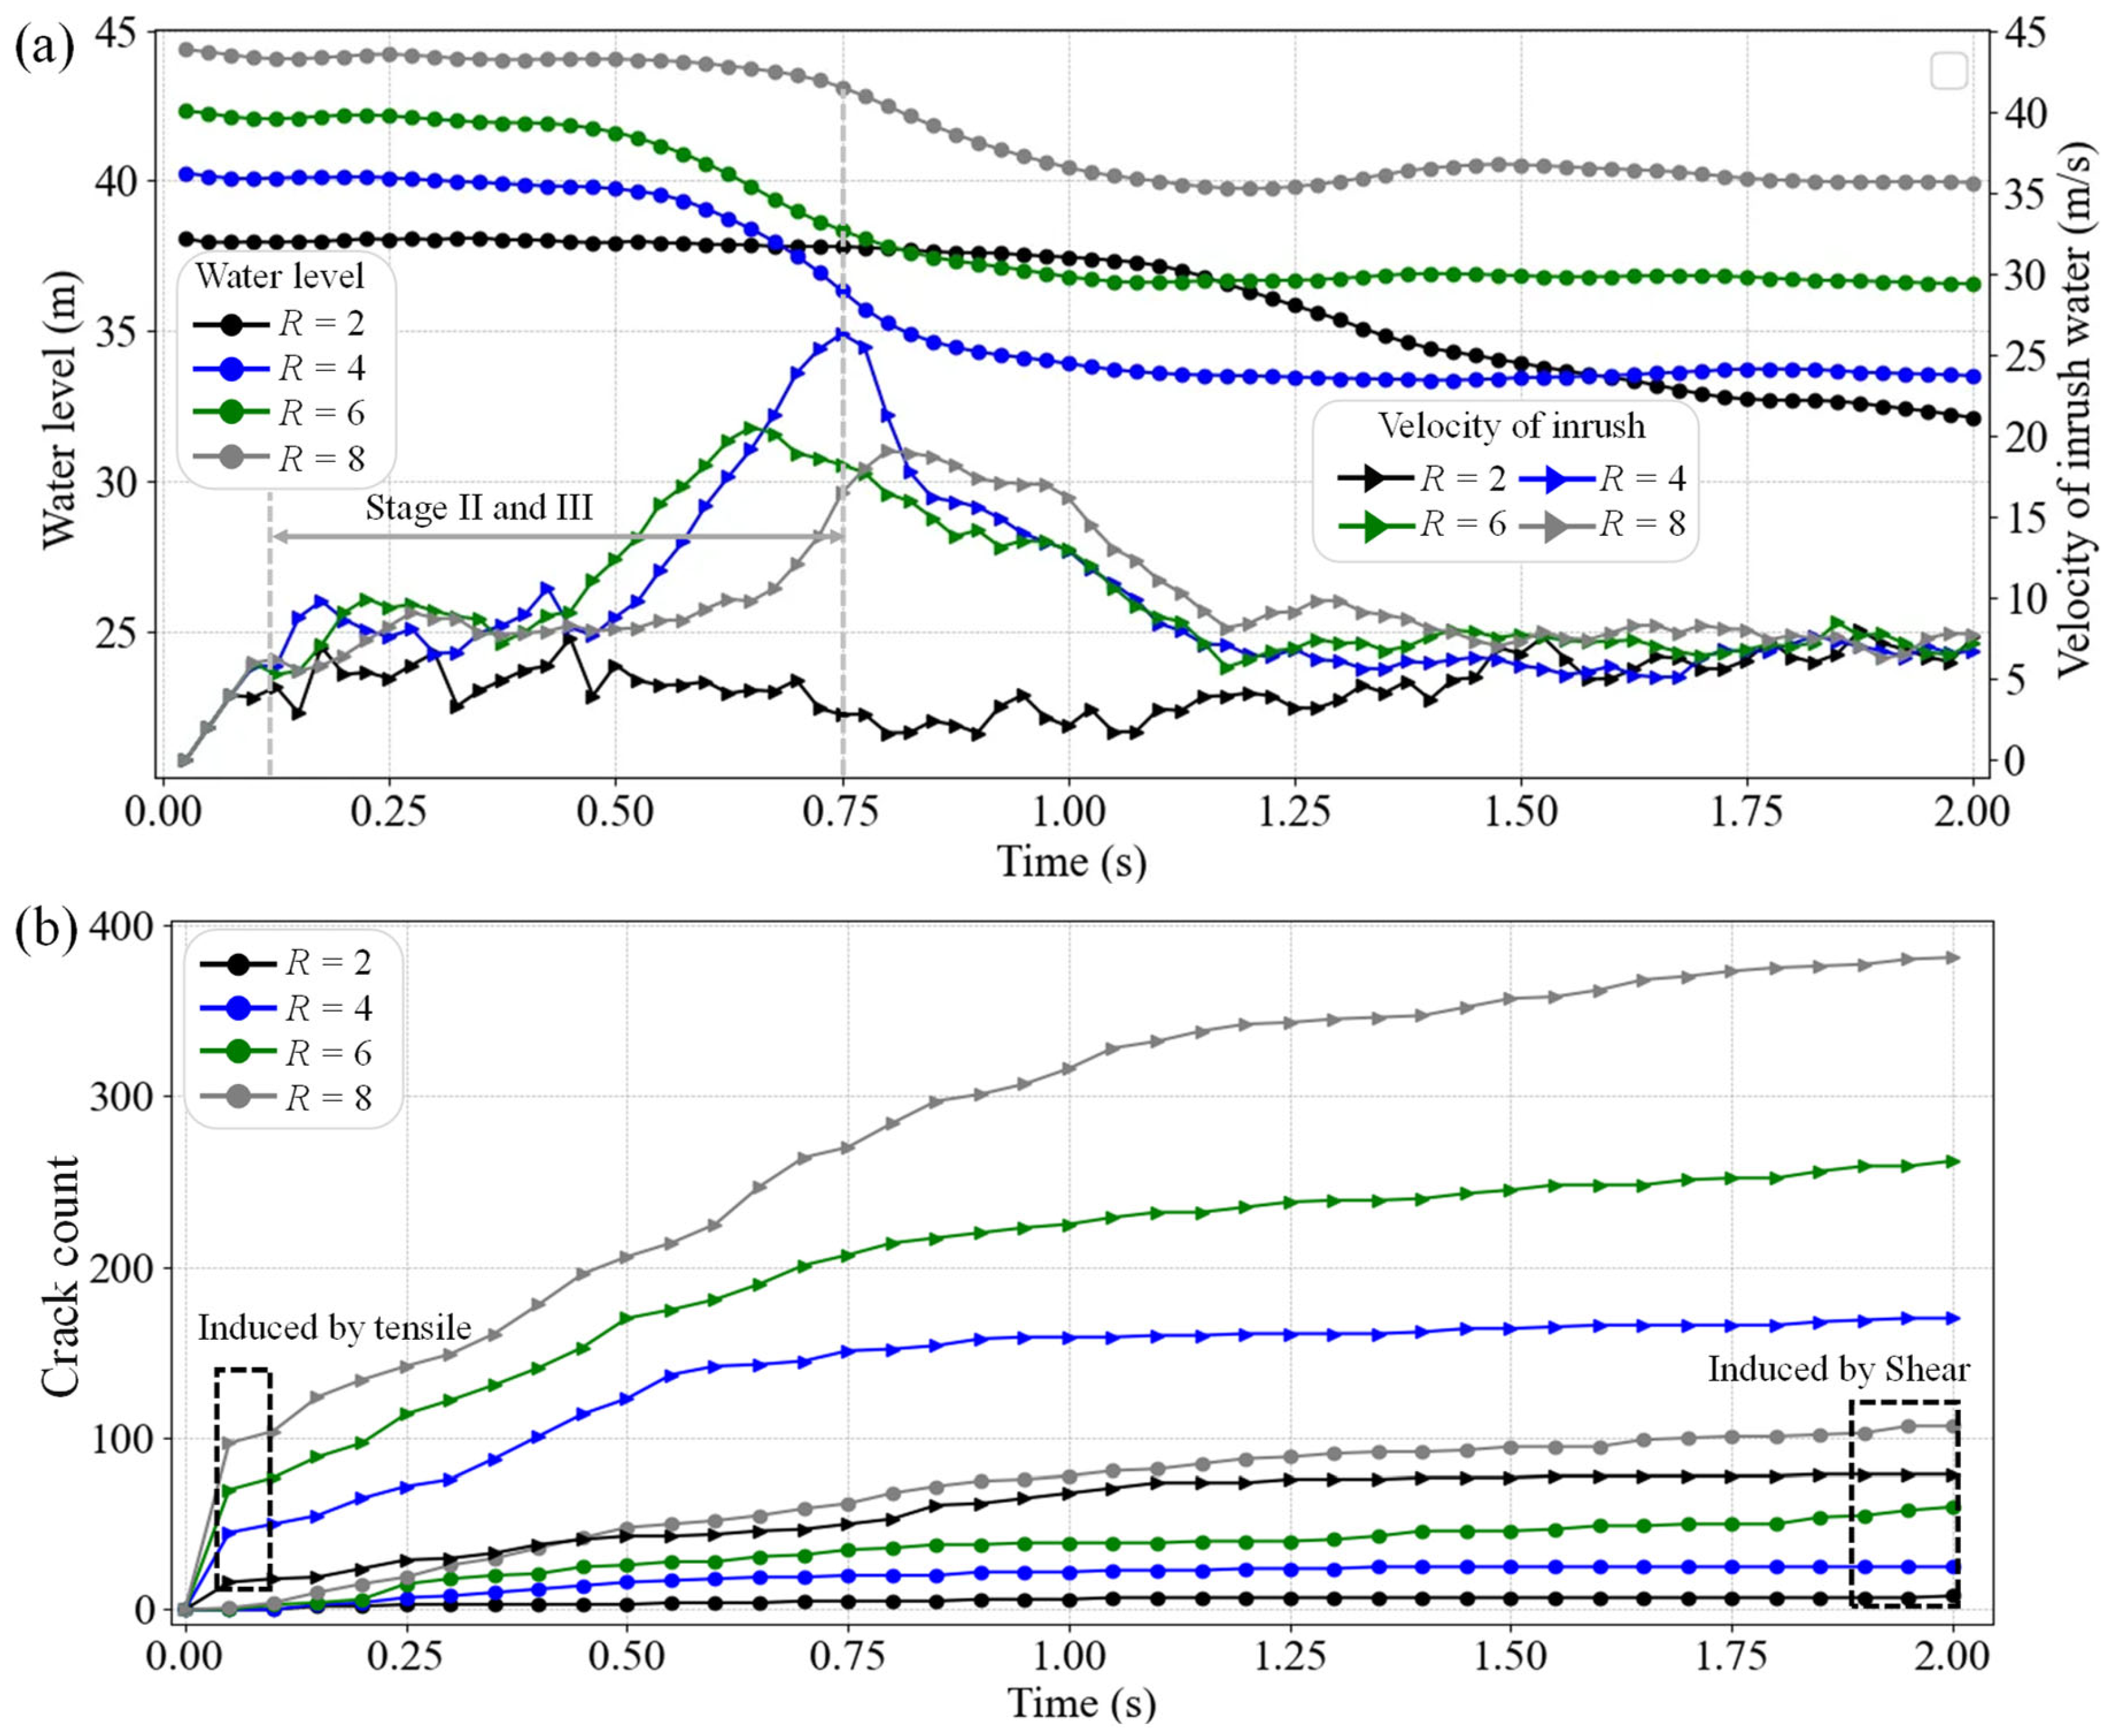
4.6. Influence of Different Radii of Karst Caves

In this section, the influence of the different radii of karst caves (R = 2, 4, 6, 8) is investigated quantitatively in Figure 13. Obviously, most maximum velocity curves increase significantly, and the corresponding water level decreases in stages II–III. However, the peak flow velocity decreases as the karst cave radii increase in all stages. As R = 2, although the water level drops, the maximum water velocity is basically stable. This result indicates that the phase characteristics of inrush weaken as the karst cave radii are smaller than a certain threshold. As R increases, the same arrival time of the peak flow velocity is calculated by SPH for different cases. Therefore, compared with the thickness and strength of the rock, the final time and arrival time of stages II–III are less affected by karst cave radii. Moreover, it is evident that as R increases, tensile and shear cracks significantly increase. The main reason is that the longer FSI coupling boundary of large-scale caves leads to severe hydraulic fracturing.

5. Discussion

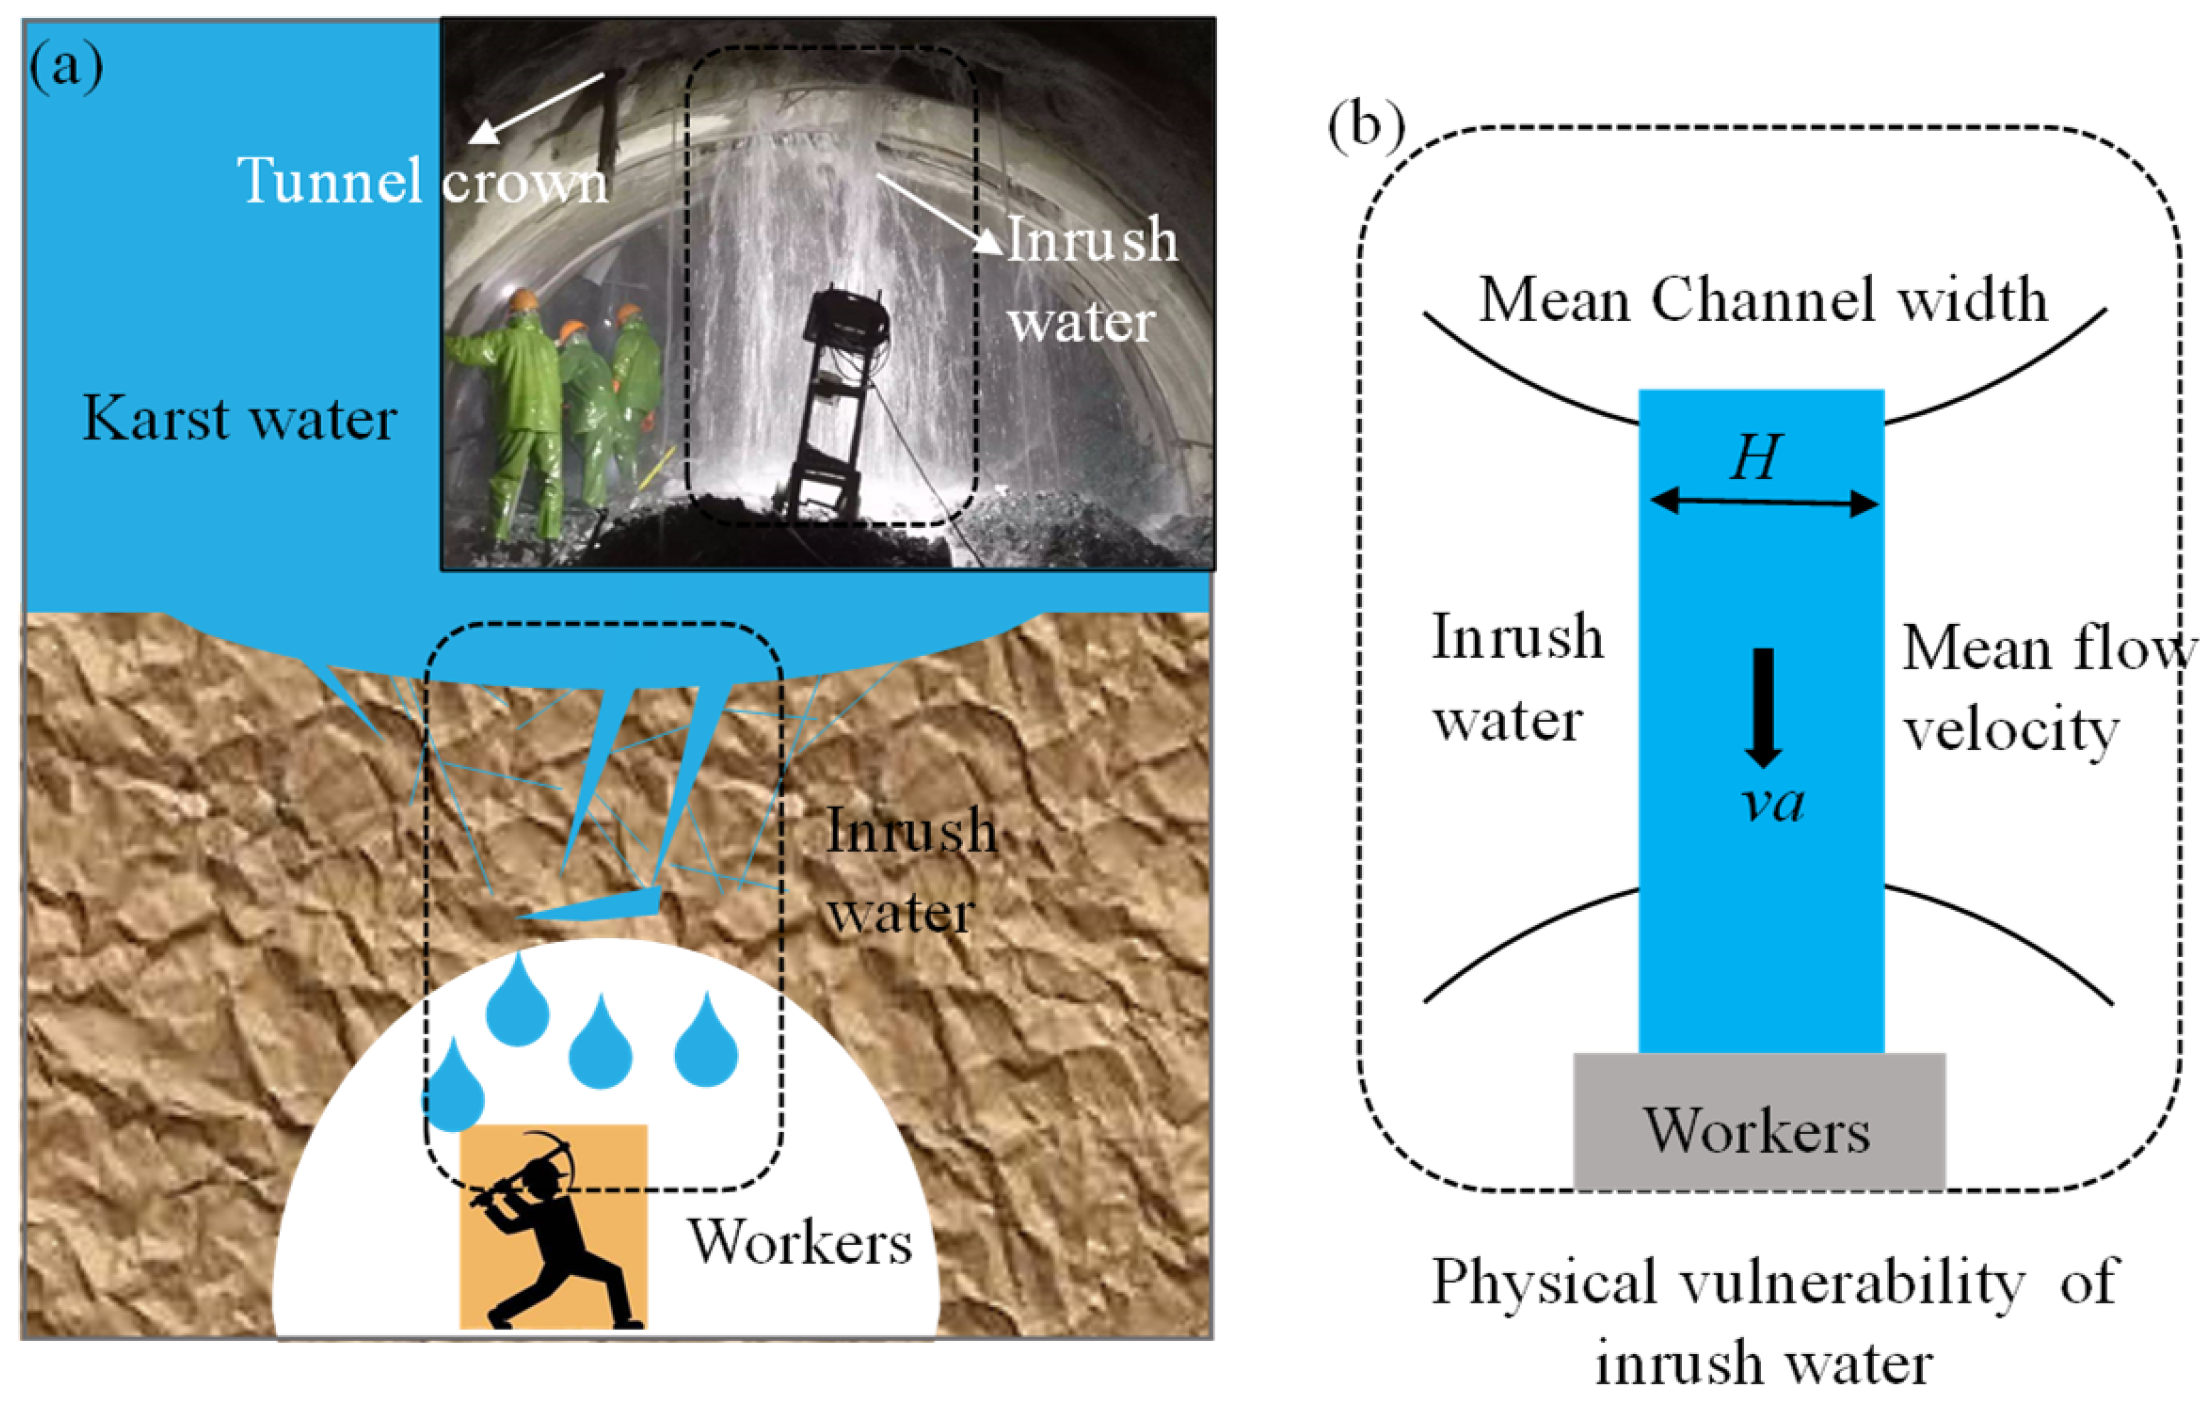
5.1. Physical Vulnerability Induced by Inrush in Karst Areas

Before a water or mud inrush event, it is crucial to quantitatively assess the extent of damage and associated risks to operations below the tunnel crown (Figure 14a). The impact pressure, Pt, is commonly used to evaluate physical vulnerability and potential harm to individuals exposed to flooding [58,59]. Based on field observations indicating that water or mud inrush typically flows vertically [60], the maximum impact pressure Pt affecting individuals can be determined as follows [59]:
P t = 1 2 ρ a g H + ρ a ν a 2
where ρ a is the density of inrush water. H is the average width of the water/mud flow channel. Assuming that water/mud inrush continuously flows in a vertical direction according to field observations [60], a schematic illustration is shown in Figure 14b. Due to the vertical flow, the static water pressure equals gravity, and Equation (17) is modified as follows:
P t = ρ a g H + ρ a ν a 2
The average inrush velocity can be determined using the improved SPH method, and g denotes the gravity acceleration (9.8 m/s²). The calculated flow width of all scenarios is H = 1.5 m–6 m. Therefore, the average impact pressure Pt is calculated, and the influence of three different scenarios on the impact pressure is depicted in Figure 14. It is evident that under all scenarios without water inrush, the value of Pt remains below the upper limit (100 kPa) for human safety [59,61]. For instance, D = 2.5 in scenario I and K = 0.6 in scenario II in Figure 15. Once water/mud inrush occurs, Pt during stages II–IV significantly exceeds the upper limit for human safety during stages III–IV, and Pt reaches its peak within 1 s, indicating that the inrush hazards are instantaneous. In stage V, after the inrush flow stabilises, Pt may decrease and then be below the upper limit for stability, as observed at R = 4 m in scenario III, D = 1 m in scenario I and K = 1, 1.4–1.6 in scenario II. In addition, as R decreases, the peak Pt increases. However, at R = 2 m, although inrush occurs, the value of Pt remains below the loading limit that the human body can withstand. Notably, the influence of falling rock impacts during inrush is not considered, which may lead to an underestimation of the assessment of damage and risk.

5.2. Advantages and Limitations of Method

Compared with previous SPH damage frameworks, such as the “pseudo-spring” method [52], general particle dynamics (GPD) [62], the improved kernel of SPH (IKSPH) method [63], and improved bond-based SPH (IBB–SPH) [64], which have made great contributions in simulating material behaviour and subsequent fractures, the improved SPH framework in this paper has an advantage in rigorously modelling the contact behaviour after a fracture. More importantly, coupling the fracture model and δ-WCSPH model in a single SPH framework based on an improved two-phase adaptive adjacent integral coupling algorithm basically realises the complete failure process of the inrush disaster chain in karst tunnels.
To celebrate SPH mechanical parameters, which are strictly derived from PDEs, the physical meaning is definitive without complex parameter calibration. However, similar to the DEM, the cohesion and tensile strength of particles do not have macroscopic physical significance and are typically more significant than the actual values, which need to be calibrated by a trial–and–error process by fitting the simulated stress–strain curve to that of the unconfined compression experiment of the studied rock. The previous SPH damage framework also has a similar advantage. In addition, the contact and slip after crack propagation can be captured by the improved SPH method, which is an effective supplement to the discontinuous methods (DDA and DEM) to solve the contact problem of the rock mass. For the calculated time of the improved SPH method, due to the linked list search method [65] and leapfrog time integration algorithm [66], the time of the inrush disaster chain calculated by improved SPH is less than that of discontinuous methods, such as DDA and DEM. As an example, we performed a water and mud inrush simulation for the Jigongling Tunnel using an R9000P computer equipped with an AMD Ryzen 7 5800H CPU, with a base frequency of 3.2 GHz and an overclocked speed of 3.8 GHz. The proposed SPH method was employed to simulate the full 2 s process of water and mud inrush. The single-threaded runtime was 0.4 h, indicating high computational efficiency and strong engineering applicability.
Both the improved meshless method and FDEM can handle the continuous and discrete behaviours of materials and are very suitable for simulating the cracking and fragmentation of continuous materials. FDEM has a more powerful elastic–brittle constitutive model, while the improved meshless method has a more natural transformation from continuity to discontinuity. The accuracy of FDEM depends on the quality of the mesh and may not be as natural as the improved meshless method under large deformation conditions. In addition, the simulation time of FDEM is longer than that of the improved meshless method. However, the improved meshless method has the problems of tensile instability and boundary truncation that occur when SPH simulates solids. These problems will reduce the solution accuracy of the improved meshless method.
The scope and conditions of the improved SPH method are respectively applicable to rock mechanics problems that consider both fluid and solid phases at the same time. The solution is based on the explicit equation. It has a weak solution ability for the seepage process and a strong ability for solving non-free surface flow.
Since this study mainly focuses on dynamic simulation, the transient seepage of fluid in the rock mass before cracking is not considered. Therefore, to realise a more realistic water inrush process, the seepage equation of porous media and the fracture surface are introduced into the improved SPH model to restore the water seepage when cracks develop [50]. The three-dimensional karst tunnel SPH model and the corresponding parallel algorithm will be developed in our future works. In addition, many other factors affect the process of water/mud inrush, such as the lateral pressure coefficient of the tunnel and the location and shape of karst caves. Furthermore, discontinuous properties (such as joints and bedding) of water-resistant rock should be considered in future studies. In addition, regarding the processing of acoustic wave detection in tunnel sites [67,68], SPH needs further development of the wave equation to simulate the response of elastic waves in rock formations.

6. Conclusions

A meshfree method that considers cracking, contact and fluid–solid interaction (FSI) is improved to simulate the progressive failure of a water-resistant stratum and the inrush process in a karst tunnel. After being validated, the progressive failure and physical vulnerability of a karst tunnel in three scenarios were investigated. The main conclusions are as follows:
(1)
The improved SPH method explicitly simulates progressive failure involving the loss of material continuity and brittle fracture characteristics without re-meshing. Moreover, a two-phase adaptive adjacent algorithm considering the DPs can faithfully capture the FSI and hydraulic fracturing;
(2)
The evolution of water inrush in the Jigongling karst tunnel calculated by the SPH method is divided into the equilibrium stage, hydraulic fracturing, local inrush accompanied by the complete failure of the water-resistant wall, overall inrush and stable inrush stages;
(3)
With increasing thickness and strength of the water-resistant wall, the possibility of water/mud inrush in the tunnel decreases, and a drop in the water level and increase in the flow velocity have a delayed effect during stages III–IV; however, such a delayed effect is less affected by karst cave radii. As the strength of the rock decreases, the peak inrush velocity increases in stage II due to hydraulic fracturing. In addition, as karst cave radii increase and the thickness and strength of rock decrease, tensile and shear cracks in rock significantly increase in stages II–III;
(4)
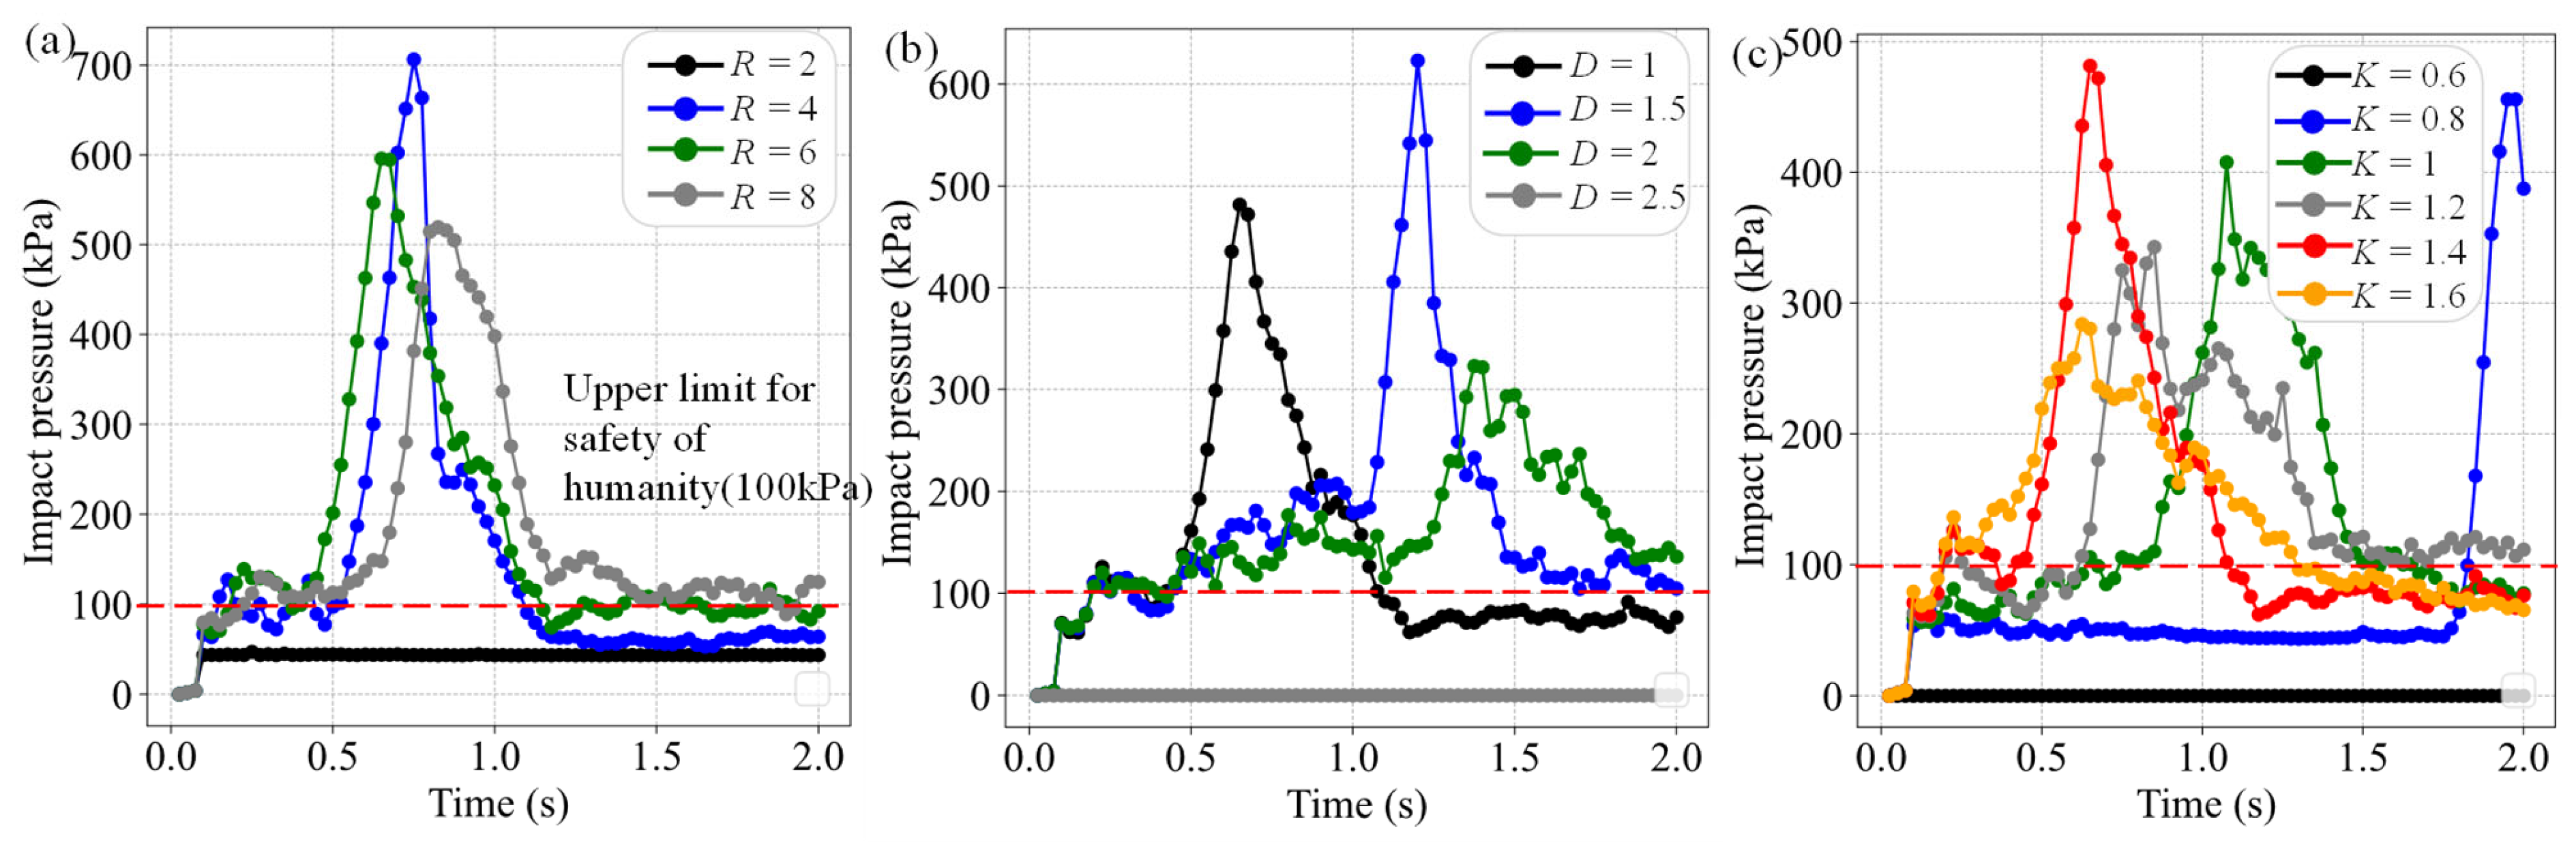
Once inrush occurs in the Jigongling karst tunnel, the impact pressure during stages III–IV significantly exceeds the upper limit for human safety. In stage V (i.e., stable inrush), the impact pressure significantly decreases and then may be below the upper limit for human safety, which is consistent with the field observations.

Author Contributions

Conceptualization, Y.Z., C.X. and Z.S.; Methodology, Y.Z. and C.X.; Software, C.X.; Validation, Y.Z. and L.L.; Formal analysis, C.X. and M.L.; Investigation, L.L. and M.L.; Resources, Z.S. and G.L.; Data curation, L.L. and M.L.; Writing—original draft, Y.Z. and C.X.; Writing—review & editing, Y.Z., C.X. and G.L.; Supervision, Z.S.; Funding acquisition, Y.Z., Z.S. and G.L. All authors have read and agreed to the published version of the manuscript.

Funding

This research was supported by the National Natural Science Foundation of China (Grants. 42307199, 42172296, 41974148), the National Key Research and Development Program of China (Grant. 2023YFC3008300), the Natural Science Foundation of Jiangsu Province, China (Grant. BK20230333).

Data Availability Statement

The original contributions presented in the study are included in the article, further inquiries can be directed to the corresponding author.

Conflicts of Interest

The authors declare that they have no known competing financial interests or personal relationships that could have appeared to influence the work reported in this study.

References

  1. Zhou, Y.; Li, S.C.; Li, L.P.; Zhang, Q.Q.; Shi, S.S.; Song, S.G.; Wang, K.; Chen, D.Y.; Sun, S.Q. New technology for fluid-solid coupling tests of underground engineering and its application in experimental simulation of water inrush in filled-type karst conduit. Chin. J. Geotech. Eng. 2015, 37, 1232–1240. [Google Scholar]
  2. Pan, D.D.; Li, S.C.; Xu, Z.H.; Li, L.P.; Lu, W.; Lin, P.; Huang, X.; Sun, S.Q.; Gao, C.L. Model tests and numerical analysis for water inrush caused by karst caves filled with confined water in tunnels. Chin. J. Geotech. Eng. 2018, 40, 828–836. [Google Scholar]
  3. Li, H.; Xu, H.; Li, Z.; Zhang, H.; Zhang, Y.; Chang, T. Study on treatment of fault water gushing in deep roadway. J. Min. Saf. Eng. 2018, 35, 635–641. [Google Scholar]
  4. Huang, M.L.; Wang, F.; Lu, W.; Tan, Z.S. Numerical study on the process of water inrush in karst caves with hydraulic pressure caused by tunnel excavation. Strateg. Study CAE 2009, 11, 93–96. [Google Scholar]
  5. Xie, Q.; Cao, Z.L.; Sun, W.C.; Fumagalli, A.; Fu, X.; Wu, Z.H.; Wu, K. Numerical simulation of the fluid-solid coupling mechanism of water and mud inrush in a water-rich fault tunnel. Tunn. Undergr. Space Technol. 2023, 131, 104796. [Google Scholar] [CrossRef]
  6. Gao, J.Y.; Peng, S.Y.; Chen, G.Q.; Mitani, Y.; Fan, H.Y. Coupled hydro-mechanical analysis for water inrush of fractured rock masses using the discontinuous deformation analysis. Comput. Geotech. 2023, 156, 105247. [Google Scholar] [CrossRef]
  7. Cui, W.; Tang, Q.W.; Song, H.F. Washout resistance evaluation of fast-setting cement-based grouts considering time-varying viscosity using CFD simulation. Constr. Build. Mater. 2020, 242, 117959. [Google Scholar] [CrossRef]
  8. Zhang, T.; Gan, Q.; Zhao, Y.X.; Zhu, G.P.; Nie, X.D.; Yang, K.; Li, J.Z. Investigations into mining-induced stress–fracture–seepage field coupling effect considering the response of key stratum and composite aquifer. Rock Mech. Rock Eng. 2019, 52, 4017–4031. [Google Scholar] [CrossRef]
  9. Pu, H.; Ni, H.Y. Characteristics of water sediment two phase flows in weakly cemented fractured rock mass based on Lattice Boltzmann Method. In Proceedings of the 51st U.S. Rock Mechanics/Geomechanics Symposium, San Francisco, CA, USA, 25–28 June 2017; pp. 1921–1929. [Google Scholar]
  10. Jin, L.; Zeng, Y.W.; Cheng, T.; Li, J.J. Numerical simulation of mud inrush of tunnels with coupled LBM-DEM. Chin. J. Geotech. Eng. 2021, 43, 1000–1009. [Google Scholar]
  11. Dave, H.; Herrmann, M.; Kasbaoui, M.H. The volume-filtering immersed boundary method. J. Comput. Phys. 2023, 487, 112136. [Google Scholar] [CrossRef]
  12. Peng, X.Y.; Liu, J.F.; Cheng, X.; Yu, P.C.; Zhang, Y.B.; Chen, G.Q. Dynamic modelling of soil-rock-mixture slopes using the coupled DDA-SPH method. Eng. Geol. 2022, 307, 106772. [Google Scholar] [CrossRef]
  13. Fan, H.Y.; Li, L.P.; Chen, G.Q.; Liu, H.L.; Gao, J.Y.; Li, C.Z.; Peng, X.Y.; Zhou, S. Analysis method of the water inrush and collapse in jointed rock mass tunnels: A case study. Eng. Anal. Bound. Elem. 2023, 146, 838–850. [Google Scholar]
  14. Gao, J.Y.; Fan, H.Y.; Chen, G.Q.; Wang, W.; Zhang, H. Verification of 3D DDA-SPH coupling method and its application in the analysis of geological disasters. Eng. Anal. Bound. Elem. 2024, 158, 68–84. [Google Scholar] [CrossRef]
  15. Xu, W.J.; Wang, Y.J.; Dong, X.Y. Influence of reservoir water level variations on slope stability and evaluation of landslide tsunami. Bull. Eng. Geol. Environ. 2021, 80, 4891–4907. [Google Scholar] [CrossRef]
  16. Sun, J.Z.; Zou, L.; Govender, N.; Martínez-Estévez, I.; Crespo, A.J.C.; Sun, Z.; Domínguez, G.M. A resolved SPH-DEM coupling method for analysing the interaction of polyhedral granular materials with fluid. Ocean. Eng. 2023, 287, 115938. [Google Scholar] [CrossRef]
  17. Nakamichi, Y.; Sugie, S.; Takeyama, T. A coupled MPM–SPH numerical simulation for fully saturated soil. Proc. Lect. Notes Civ. Eng. 2021, 125, 794–801. [Google Scholar]
  18. Nakamichi, Y.; Sugie, S.; Takeyama, T. Numerical analysis of rain-induced slope failure by using the MPM-SPH coupling method. In Proceedings of the International Conference of the International Association for Computer Methods and Advances in Geomechanics, Turin, Italy, 30 August–2 September 2022; pp. 237–244. [Google Scholar]
  19. Yang, W.D.; Lv, X.X.; Wang, L.G.; Peng, D.; Chen, X.Z. A DEM–CFD coupling method for modelling two-hole synchronous hydraulic fracturing. Geomech. Geophys. Geo-Energy Geo-Resour. 2023, 9, 6. [Google Scholar] [CrossRef]
  20. Hassan, E.B.E.; Hoffmann, J.E. Impact of flow direction on the isothermal pressure drop through a packed bed of crushed rock—A DEM-CFD approach. Powder Technol. 2024, 440, 119774. [Google Scholar] [CrossRef]
  21. Tran, Q.A.; Grimstad, G.; Ghoreishian Amiri, S.A. MPMICE: A hybrid MPM-CFD model for simulating coupled problems in porous media. Application to earthquake-induced submarine landslides. Int. J. Numer. Methods Eng. 2024, 125, e7383. [Google Scholar] [CrossRef]
  22. Younes, N.; Wautier, A.; Wan, R.; Millet, O.; Nicot, F.; Bouchard, R. DEM-LBM coupling for partially saturated granular assemblies. Comput. Geotech. 2023, 162, 105677. [Google Scholar] [CrossRef]
  23. Bouchard, R.; Younes, N.; Millet, O.; Wautier, A. Parameter optimization of phase-field-based LBM model for calculating capillary forces. Comput. Geotech. 2024, 172, 106391. [Google Scholar] [CrossRef]
  24. Gingold, R.A.; Monaghan, J.J. Smoothed particle hydrodynamics: Theory and application to non-spherical stars. Mon. Not. R. Astron. Soc. 1977, 181, 375–389. [Google Scholar] [CrossRef]
  25. Monaghan, J.J. Simulating Free Surface Flows with SPH. J. Comput. Phys. 1994, 110, 399–406. [Google Scholar] [CrossRef]
  26. Walhorn, E.; Kölke, A.; Hübner, B.; Dinkler, D. Fluid–structure coupling within a monolithic model involving free surface flows. Comput. Struct. 2005, 83, 2100–2111. [Google Scholar] [CrossRef]
  27. Fuchs, S.L.; Meier, C.; Wall, W.A.; Cyron, C.J. A novel smoothed particle hydrodynamics and finite element coupling scheme for fluid–structure interaction: The sliding boundary particle approach. Comput. Methods Appl. Mech. Eng. 2021, 383, 113922. [Google Scholar] [CrossRef]
  28. Hermange, C.; Oger, G.; Le Chenadec, Y.; Le Touzé, D. A 3D SPH–FE coupling for FSI problems and its application to tire hydroplaning simulations on rough ground. Comput. Methods Appl. Mech. Eng. 2019, 355, 558–590. [Google Scholar] [CrossRef]
  29. O’Connor, J.; Rogers, B.D. A fluid–structure interaction model for free-surface flows and flexible structures using smoothed particle hydrodynamics on a GPU. J. Fluids Struct. 2021, 104, 103312. [Google Scholar] [CrossRef]
  30. Wang, J.; Zhang, Y.; Qin, Z.; Song, S.G.; Lin, P. Analysis method of water inrush for tunnels with damaged water-resisting rock mass based on finite element method-smooth particle hydrodynamics coupling. Comput. Geotech. 2020, 126, 103725. [Google Scholar] [CrossRef]
  31. Peng, X.Y.; Yu, P.C.; Cheng, X.; Chen, G.Q.; Zhang, Y.B.; Zhang, H.; Li, C.Z. Dynamic simulation of the water inrush process in tunnel construction using a three-dimensional coupled discontinuous deformation analysis and smoothed particle hydrodynamics method. Tunn. Undergr. Space Technol. 2022, 127, 104612. [Google Scholar] [CrossRef]
  32. Ji, S.Y.; Chen, X.D.; Liu, L. Coupled DEM-SPH method for interaction between dilated polyhedral particles and fluid. Math. Probl. Eng. 2019, 1, 4987801. [Google Scholar] [CrossRef]
  33. Chakraborty, S.; Shaw, A. A pseudo-spring based fracture model for SPH simulation of impact dynamics. Int. J. Impact Eng. 2013, 58, 84–95. [Google Scholar] [CrossRef]
  34. Yu, S.Y.; Ren, X.H.; Zhang, J.X.; Wang, H.J.; Sun, Z.H. An improved form of smoothed particle hydrodynamics method for crack propagation simulation applied in rock mechanics. Int. J. Min. Sci. Technol. 2021, 31, 421–428. [Google Scholar] [CrossRef]
  35. Mu, D.R.; Zhang, D.Y.; Tang, A.P.; Qu, H.G.; Li, Z.M. Numerical simulation of rock thermal fracture considering friction effect in the framework of smooth particle hydrodynamics based on total Lagrangian formula. Rock Mech. Rock Eng. 2022, 55, 1663–1685. [Google Scholar] [CrossRef]
  36. Xia, C.Z.; Shi, Z.M.; Liu, M.M.; Li, B.; Yu, S.B.; Xue, J.F. Dynamic analysis of field-scale rockslides based on three-dimensional discontinuous smoothed particle hydrodynamics: A case study of Tangjiashan rockslide. Eng. Geol. 2024, 336, 107558. [Google Scholar] [CrossRef]
  37. Peng, C.; Wang, S.; Wu, W.; Yu, H.S.; Wang, C.; Chen, J.Y. LOQUAT: An open-source GPU-accelerated SPH solver for geotechnical modeling. Acta Geotech. 2019, 14, 1269–1287. [Google Scholar] [CrossRef]
  38. Gray, J.P.; Monaghan, J.J. Numerical modelling of stress fields and fracture around magma chambers. J. Volcanol. Geotherm. Res. 2004, 135, 259–283. [Google Scholar] [CrossRef]
  39. Gharehdash, S.; Barzegar, M.; Palymskiy, I.B.; Fomin, P.A. Blast induced fracture modelling using smoothed particle hydrodynamics. Int. J. Impact Eng. 2020, 135, 103235. [Google Scholar] [CrossRef]
  40. Abdelrazek, A.M.; Kimura, I.; Shimizu, Y. Simulation of the erosion and seepage failure around sheet pile using two-phase WC-SPH method. J. Jpn. Soc. Civ. Eng. 2016, 72, I_495–I_504. [Google Scholar] [CrossRef]
  41. Xia, C.Z.; Shi, Z.M.; Li, B. A modified SPH framework of for simulating progressive rock damage and water inrush disasters in tunnel constructions. Comput. Geotech. 2024, 167, 106042. [Google Scholar] [CrossRef]
  42. Zhou, X.P.; Zhao, Y.; Qian, Q.H. A novel meshless numerical method for modeling progressive failure processes of slopes. Eng. Geol. 2015, 192, 139–153. [Google Scholar] [CrossRef]
  43. Zhou, X.P.; Wang, Y.T.; Qian, Q.H. Numerical simulation of crack curving and branching in brittle materials under dynamic loads using the extended non-ordinary state-based peridynamics. Eur. J. Mech. A-Solids 2016, 60, 277–299. [Google Scholar] [CrossRef]
  44. Zhou, X.P.; Xiao, N. Analyzing fracture properties of the 3D reconstructed model of porous rocks. Eng. Fract. Mech. 2018, 189, 175–193. [Google Scholar] [CrossRef]
  45. Yu, S.Y.; Ren, X.H.; Zhang, J.X.; Wang, H.J.; Sun, Z.H.; Zhou, Y. Numerical simulation on the stability of rock slope based on an improved SPH Method. J. Mt. Sci. 2021, 18, 1937–1950. [Google Scholar] [CrossRef]
  46. Yu, S.Y.; Yu, J.; Sun, Z.H.; Zhu, C.H.; Yang, J. Numerical investigation and experimental study on fracture processes of central flawed sandstone Brazilian discs. Int. J. Solids Struct. 2023, 262–263, 112054. [Google Scholar] [CrossRef]
  47. Xia, C.Z.; Shi, Z.M.; Li, B. A revisit of disaster process of Vajont rockslide using a coupled discontinuous smooth particle hydrodynamics (CDSPH) method. Landslides 2024, 21, 197–216. [Google Scholar] [CrossRef]
  48. Sheikh, B.; Qiu, T.; Ahmadipur, A. Comparison of SPH boundary approaches in simulating frictional soil–structure interaction. Acta Geotech. 2021, 16, 2389–2408. [Google Scholar] [CrossRef]
  49. Ganesh, K.V.; Patra, P.K.; Travis, K.P. Multiscale modeling of impact through molecular dynamics and smooth particle hydrodynamics. Phys. A Stat. Mech. Its Appl. 2022, 593, 126903. [Google Scholar] [CrossRef]
  50. Mu, D.R.; Tang, A.P.; Qu, H.G.; Wang, J.J. An extended hydro-mechanical coupling model based on smoothed particle hydrodynamics for simulating crack propagation in rocks under hydraulic and compressive loads. Materials 2023, 16, 1572. [Google Scholar] [CrossRef]
  51. Zhu, C.W.; Peng, C.; Wu, W. Applications of micropolar SPH in geomechanics. Acta Geotech. 2021, 16, 2355–2369. [Google Scholar] [CrossRef]
  52. Chakraborty, S.; Islam, M.R.I.; Shaw, A.; Ramachandra, L.S.; Reid, S.R. A computational framework for modelling impact induced damage in ceramic and ceramic-metal composite structures. Compos. Struct. 2017, 164, 263–276. [Google Scholar] [CrossRef]
  53. Shaw, A.; Reid, S.R.; Roy, D.; Chakraborty, S. Beyond classical dynamic structural plasticity using mesh-free modelling techniques. Int. J. Impact Eng. 2015, 75, 268–278. [Google Scholar] [CrossRef]
  54. Gao, C.L.; Li, L.P.; Zhou, Z.Q.; Li, Z.H.; Cheng, S.; Wang, L.G.; Zhang, D.S. Peridynamics simulation of water inrush channels evolution process due to rock mass progressive failure in karst tunnels. Int. J. Geomech. 2021, 21, 04021028. [Google Scholar] [CrossRef]
  55. Xu, Z.H.; Lin, P.; Xing, H.L.; Pan, D.D.; Huang, X. Hydro-mechanical coupling response behaviors in tunnel subjected to a water-filled karst cave. Rock Mech. Rock Eng. 2021, 54, 3737–3756. [Google Scholar] [CrossRef]
  56. Kazerani, T.; Zhao, J. Micromechanical parameters in bonded particle method for modelling of brittle material failure. Int. J. Numer. Anal. Methods Geomech. 2010, 34, 1877–1895. [Google Scholar] [CrossRef]
  57. Li, S.C.; Bu, L.; Shi, S.S.; Li, L.P.; Zhou, Z.Q. Prediction for water inrush disaster source and CFD-based design of evacuation routes in karst tunnel. Int. J. Geomech. 2022, 22, 05022001. [Google Scholar] [CrossRef]
  58. Iverson, R.M. The physics of debris flows. Rev. Geophys. 1997, 35, 245–296. [Google Scholar] [CrossRef]
  59. Kang, H.S.; Kim, Y.T. The physical vulnerability of different types of building structure to debris flow events. Nat. Hazards 2016, 80, 1475–1493. [Google Scholar] [CrossRef]
  60. Zhang, J.; Wen, W. Construction technology for the Dazhushan tunnel in a high-pressure fault with abundant water. Mod. Tunn. Technol. 2018, 55, 160–166. [Google Scholar]
  61. Arrighi, C.; Oumeraci, H.; Castelli, F. Hydrodynamics of pedestrians’ instability in floodwaters. Hydrol. Earth Syst. Sci. 2017, 21, 515–531. [Google Scholar] [CrossRef]
  62. Bi, J.; Zhou, X.P. Numerical simulation of zonal disintegration of the surrounding rock masses around a deep circular tunnel under dynamic unloading. Int. J. Comput. Methods 2015, 12, 1550020. [Google Scholar] [CrossRef]
  63. Yu, S.Y.; Ren, X.H.; Zhang, J.X.; Wang, H.J.; Sun, Z.H. An improved smoothed particle hydrodynamics method and its application in rock hydraulic fracture modelling. Rock Mech. Rock Eng. 2021, 54, 6039–6055. [Google Scholar] [CrossRef]
  64. Mu, D.R.; Wen, A.H.; Zhu, D.Q.; Tang, A.P.; Nie, Z.; Wang, Z.Y. An improved smoothed particle hydrodynamics method for simulating crack propagation and coalescence in brittle fracture of rock materials. Theor. Appl. Fract. Mech. 2022, 119, 103355. [Google Scholar] [CrossRef]
  65. Xia, C.Z.; Shi, Z.M.; Zheng, H.C.; Wu, X.H. Kernel broken smooth particle hydrodynamics method for crack propagation simulation applied in layered rock cells and tunnels. Undergr. Space 2023, 10, 55–75. [Google Scholar] [CrossRef]
  66. Vacondio, R.; Mignosa, P.; Pagani, S. 3D SPH numerical simulation of the wave generated by the Vajont rockslide. Adv. Water Resour. 2013, 59, 146–156. [Google Scholar] [CrossRef]
  67. Liu, L.; Li, S.; Zheng, M.; Wang, D.; Chen, M.; Zhou, J.; Yan, T.; Shi, Z. Inverting the rock mass P-wave velocity field ahead of deep buried tunnel face while borehole drilling. Int. J. Min. Sci. Technol. 2024, 34, 681–697. [Google Scholar] [CrossRef]
  68. Liu, L.; Li, S.; Zheng, M.; Wang, Y.; Shen, J.; Shi, Z.; Xia, C.; Zhou, J. Identification of rock discontinuities by coda wave analysis while borehole drilling in deep buried tunnels. Tunn. Undergr. Space Technol. 2024, 153, 105969. [Google Scholar] [CrossRef]
Figure 1. Typical water inrush disasters in karst tunnel. (a) Tianshengqiao karst tunnel and (b) Xiema karst tunnel.
Buildings 14 03140 g001
Figure 2. Schematic illustration of cracking of rock. (a) Full interaction (b) No interaction (c) linear elastic brittle law.
Buildings 14 03140 g002
Figure 3. Schematic illustration of contact of fractured rock. (a) transform discontinuous particles (b) contact activation (c) penetration between IP i and DP j.
Buildings 14 03140 g003
Figure 4. Model configuration and base particle of the rock sample with two pre-existing cracks with internal water.
Buildings 14 03140 g004
Figure 5. Failure modes of a sample with two parallel prefabricated flaws (α = 45°, β = 45°) under uniaxial compression with different flaw water pressure and compared with TLSPH result [50] (The orange and red colours represent tensile and shear cracks in the improved SPH results, respectively).
Buildings 14 03140 g005
Figure 6. Crack propagation and coalescence modes of a sample with two parallel prefabricated flaws (α = 45°, β = 45°) under uniaxial compression with different flaw water pressure and compared with TLSPH results [50]:(a) P = 0 MPa; (b) P = 4 MPa; (c) P = 8 MPa.
Buildings 14 03140 g006
Figure 7. Sensitivity analysis of the simulation results to particle spacing ΔP: (a) crack distribution and (b) stress–strain curve.
Buildings 14 03140 g007
Figure 8. Sensitivity analysis of the simulation results to smoothing kernel length h: (a) crack distribution and (b) stress–strain curve.
Buildings 14 03140 g008
Figure 9. (a) Longitudinal geological section along the Jigongling tunnel and (b) model configuration and base particle of the selection tunnel face.
Buildings 14 03140 g009
Figure 10. (a) Water inrush process of the case of R = 6 m, D = 1 m, K = 1 and evolution process of rock damage at different times (the yellow and red colours represent tensile and shear cracks of the rock mass, respectively). (b1) Site observation of roof leakage of Jigongling tunnel [57]; (b2) large rock blocks [57] and (b3) water filling the tunnel [54]. (c) Evolution of the maximum velocities of inrush and water level.
Buildings 14 03140 g010
Figure 11. The evolution of (a) water level and maximum velocity water inrush and (b) crack count induced by shear and tensile with different thicknesses of water-resistant rock D and (c) rock damage and water inrush with different thicknesses of water-resistant rock at stage III: (c1) D = 1 m; (c2) D = 1.5 m; (c3) D = 2 m (c4) D = 2.5 m (the yellow and red colours represent tensile and shear cracks in the improved SPH result, respectively).
Buildings 14 03140 g011
Figure 12. The evolution of (a) water level and maximum velocity water inrush and (b) crack count induced by shear and tensile with different strengths of water-resistant rock K and (c) rock damage and water inrush with different thicknesses of water-resistant rock at stage III: (c1) K = 0.6; (c2) K = 0.8; (c3) K = 1; (c4) K = 1.2; (c5) K = 1.4; (c6) K = 1.6.
Buildings 14 03140 g012
Figure 13. The evolution of (a) water level and maximum velocity water inrush and (b) crack count induced by shear and tensile with different karst cave radii R (m).
Buildings 14 03140 g013
Figure 14. (a) Schematic illustration of the physical vulnerability of inrush water and the site observation (b) Physical vulnerability of inrush water.
Buildings 14 03140 g014
Figure 15. Impact pressure of water/mud inrush with different (a) cave radii R (m), (b) thickness of water-resistant rock D (m), and (c) strength of water-resistant rock.
Buildings 14 03140 g015
Table 1. Parameters of SPH particles for hydraulic fracturing of two pre-existing flawed rocks.
ParametersRock MatrixWater
Density (kg/m3)26501000
Normal stiffness (GPa/m)0.2
Friction coefficienttan (35°)
Particle spacing (m)8 × 10−38 × 10−3
Boundary particle spacing (m)8 × 10−38 × 10−3
Number of IPs18,00050
Kernel functionB-splineB-spline
Kernel smoothing length (m)0.7 × 10−30.7 × 10−3
DP radius (m)0.8 × 10⁻³
SPH time step (s)5 × 10−85 × 10−8
δ–SPH coefficient0.1
Shape parameter, mshape20
Artificial viscosity parameter β 1 22
Artificial viscosity parameter β 2 44
Artificial stress parameter e0.30.3
Artificial stress parameter n44
Table 2. Parameters of SPH particles used in Jigongling tunnel.
ParametersRock MatrixWater
Density (kg/m3)25001000
Normal stiffness (MPa/m)9.6
Friction coefficienttan (30°)
Particle spacing (m)0.20.2
Boundary particle spacing (m)0.20.2
Number of IPs70,5001512
Kernel functionB–splineB–spline
Kernel smoothing length (m)0.20.3
DP radius (m)0.2
SPH time step (s)1 × 10−41 × 10−4
δ–SPH coefficient0.1
Shape parameter, mshape20
Artificial viscosity parameter β 1 22
Artificial viscosity parameter β 2 44
Artificial stress parameter e0.30.3
Artificial stress parameter n44
Table 3. Design of calculated cases under different influential factors.
ScenarioThickness of Water-Resistant Rock D (m)Strength Reduction Factor of Water-Resistant Rock KKarst Cave Radius R (m)
I11.42/4/6/8
II1/1.5/2/2.51.46
III10.6/0.8/1/1.2/1.4/1.66
K = 1 indicates the actual strength of the rock surrounding the tunnel, and K >= 1 indicates the weakened strength of the characterised surrounding rock; otherwise, the strength of the characterised surrounding rock increases.
Disclaimer/Publisher’s Note: The statements, opinions and data contained in all publications are solely those of the individual author(s) and contributor(s) and not of MDPI and/or the editor(s). MDPI and/or the editor(s) disclaim responsibility for any injury to people or property resulting from any ideas, methods, instructions or products referred to in the content.

