Article

Numerical Simulation for Risk Assessment of Tunnel Construction through Fault Fracture Zones

1
Guangzhou Metro Design and Research Institute Co., Ltd., Guangzhou 510010, China
2
School of Civil Engineering, Guangzhou University, Guangzhou 510006, China
*
Author to whom correspondence should be addressed.
Buildings 2024, 14(10), 3161; https://doi.org/10.3390/buildings14103161
Submission received: 19 September 2024 / Revised: 25 September 2024 / Accepted: 26 September 2024 / Published: 4 October 2024

Abstract

:
This study explores the deformation characteristics of surrounding rock during tunnel construction through fault fracture zones. A numerical model is established using ABAQUS to analyze the interaction between the shield machine, support system, and geotechnical materials. The model incorporates key factors, including palm face support force, grouting pressure, and the friction between the shield shell and surrounding rock. The results show that the plastic zone of the surrounding rock is concentrated within the fault zone and at the junction with normal rock, propagating along the contact surface. In the loosening zone, stress and strength are significantly reduced, leading to crack expansion and plastic slip. Without adequate support, these conditions can result in tunnel destabilization. The displacement of the surrounding rock is most prominent during the detachment of the shield tail and the synchronized grouting phase. These findings provide valuable insights for improving tunnel construction safety and stability in fault fracture zones, where the integrity of the surrounding rock is compromised by fractures and fissures. However, the constructed models may restrict the ability to capture all complex material behaviors and interactions that could arise in actual field conditions.

1. Introduction

With the rapid growth of urbanization and infrastructure development, underground tunnel construction has become essential to accommodate increasing transportation demands [1,2,3]. As cities expand, the need for efficient and safe underground infrastructure has driven advancements in tunneling technology. However, in regions characterized by complex geological formations, particularly in China’s mountainous areas, tunnel construction frequently encounters fault fracture zones. These zones present significant engineering challenges due to their inherent instability and unpredictable behavior [4,5,6,7]. A fault is a structural discontinuity in the earth’s crust where rock masses have undergone relative displacement. The area surrounding a fault is often filled with fragmented rock and soil, creating a zone of weakened mechanical properties. These fault fracture zones, characterized by poor integrity and high susceptibility to deformation, make tunneling hazardous. Without careful consideration, the excavation process can lead to severe stability issues, jeopardizing the safety of both the tunnel and surrounding structures [7,8,9,10].
Tunneling through fault zones poses additional challenges due to the reduced strength and complex deformation patterns of the surrounding rock. The mechanical properties of these zones, including low cohesion, increased fracturing, and high permeability, can lead to excessive deformation, ground settlement, or even tunnel collapse if not adequately managed. Proper understanding and control of these deformations are crucial to ensure the long-term stability of underground structures [11,12,13,14,15,16,17].
Previous research on tunnel construction in fault fracture zones has primarily relied on theoretical models, physical experiments, and numerical simulations. For instance, Niaki et al. [18] evaluate the mechanical properties of reinforced polymer concrete with three resin systems, providing insights into material performance under stress conditions relevant to tunnel construction in fault zones. Neitzel et al. [19] analyze noise levels from New York City’s mass transit systems, offering a framework for assessing environmental risks during tunnel construction. The findings emphasize the importance of evaluating noise pollution as a potential risk factor affecting both workers and communities during tunneling activities. Mahdi et al. [20] investigate the flexural, shear, and bond strength of polymer concrete produced from recycled PET resin, relevant for tunnel construction applications. Lu et al. [21] examine the influence of the initial state of excavated soil and rock on cement stabilization, highlighting critical factors in risk assessment for tunnel construction.
Previous studies lack a comprehensive approach to addressing the dynamic interactions between the tunnel structure and the surrounding faulted rock. Additionally, few studies have adequately considered the complex factors influencing rock deformation during tunneling, such as support forces, grouting pressure, and the friction between the shield and surrounding rock [18,19,20,21]. This study employs a detailed numerical model using ABAQUS software that explicitly incorporates critical factors such as palm face support force, grouting pressure, and shield-shell interaction, allowing for a more accurate simulation of the deformation behavior of surrounding rock during shield tunneling through fault fracture zones. This comprehensive approach represents a significant advancement over the existing literature, as it provides an analysis of the interactions between structural and geological elements. By addressing these interrelated factors, this research not only fills a critical gap but also offers practical insights for risk assessment and management in complex geological environments. However, this study effectively utilizes ABAQUS to provide valuable insights into tunnel deformation through fault fracture zones, it is important to acknowledge the limitations inherent in this approach. The constructed models may restrict the ability to capture all complex material behaviors and interactions that could arise in actual field conditions. Future research could enhance these findings by exploring advanced material models or incorporating field data to validate and refine the numerical simulations.

2. Model Construction

2.1. Selection of Constitutive Model

The accurate simulation of the mechanical behavior of geotechnical materials under varying stress conditions is crucial for understanding the interactions between the tunnel structure and the surrounding rock during shield tunneling through fault fracture zones. To achieve this, the selection of a suitable constitutive model is of primary importance. In this study, two constitutive models were adopted based on the different material characteristics involved the Mohr–Coulomb model for soil and rock materials [2,21,22] and the Concrete Damaged Plasticity (CDP) model for concrete structures [23,24,25].

2.1.1. Mohr–Coulomb Model

The Mohr–Coulomb model was chosen to simulate the behavior of soil and rock in the fault fracture zone. This model provides a balance between simplicity and accuracy, making it widely applicable in geotechnical engineering. It characterizes the material’s failure criteria based on the shear strength parameters, cohesion, and internal friction angle, which are critical in analyzing the stability of the surrounding rock. While the Mohr-Coulomb model does not account for stress history or differences between loading and unloading phases, its practical applicability and computational efficiency make it an ideal choice for this study’s focus on large-scale deformation behavior in fault zones.

2.1.2. Concrete Damaged Plasticity (CDP) Model

For simulating the shield tunnel lining, which is typically composed of reinforced concrete, the Concrete Damaged Plasticity (CDP) model was employed. This model accounts for the non-linear behavior of concrete under tension and compression, including the damage processes such as tensile cracking and compressive crushing. The CDP model provides a realistic representation of the degradation of concrete strength and stiffness, which is essential for evaluating the performance of the tunnel lining under high-stress conditions encountered during construction in fault zones.

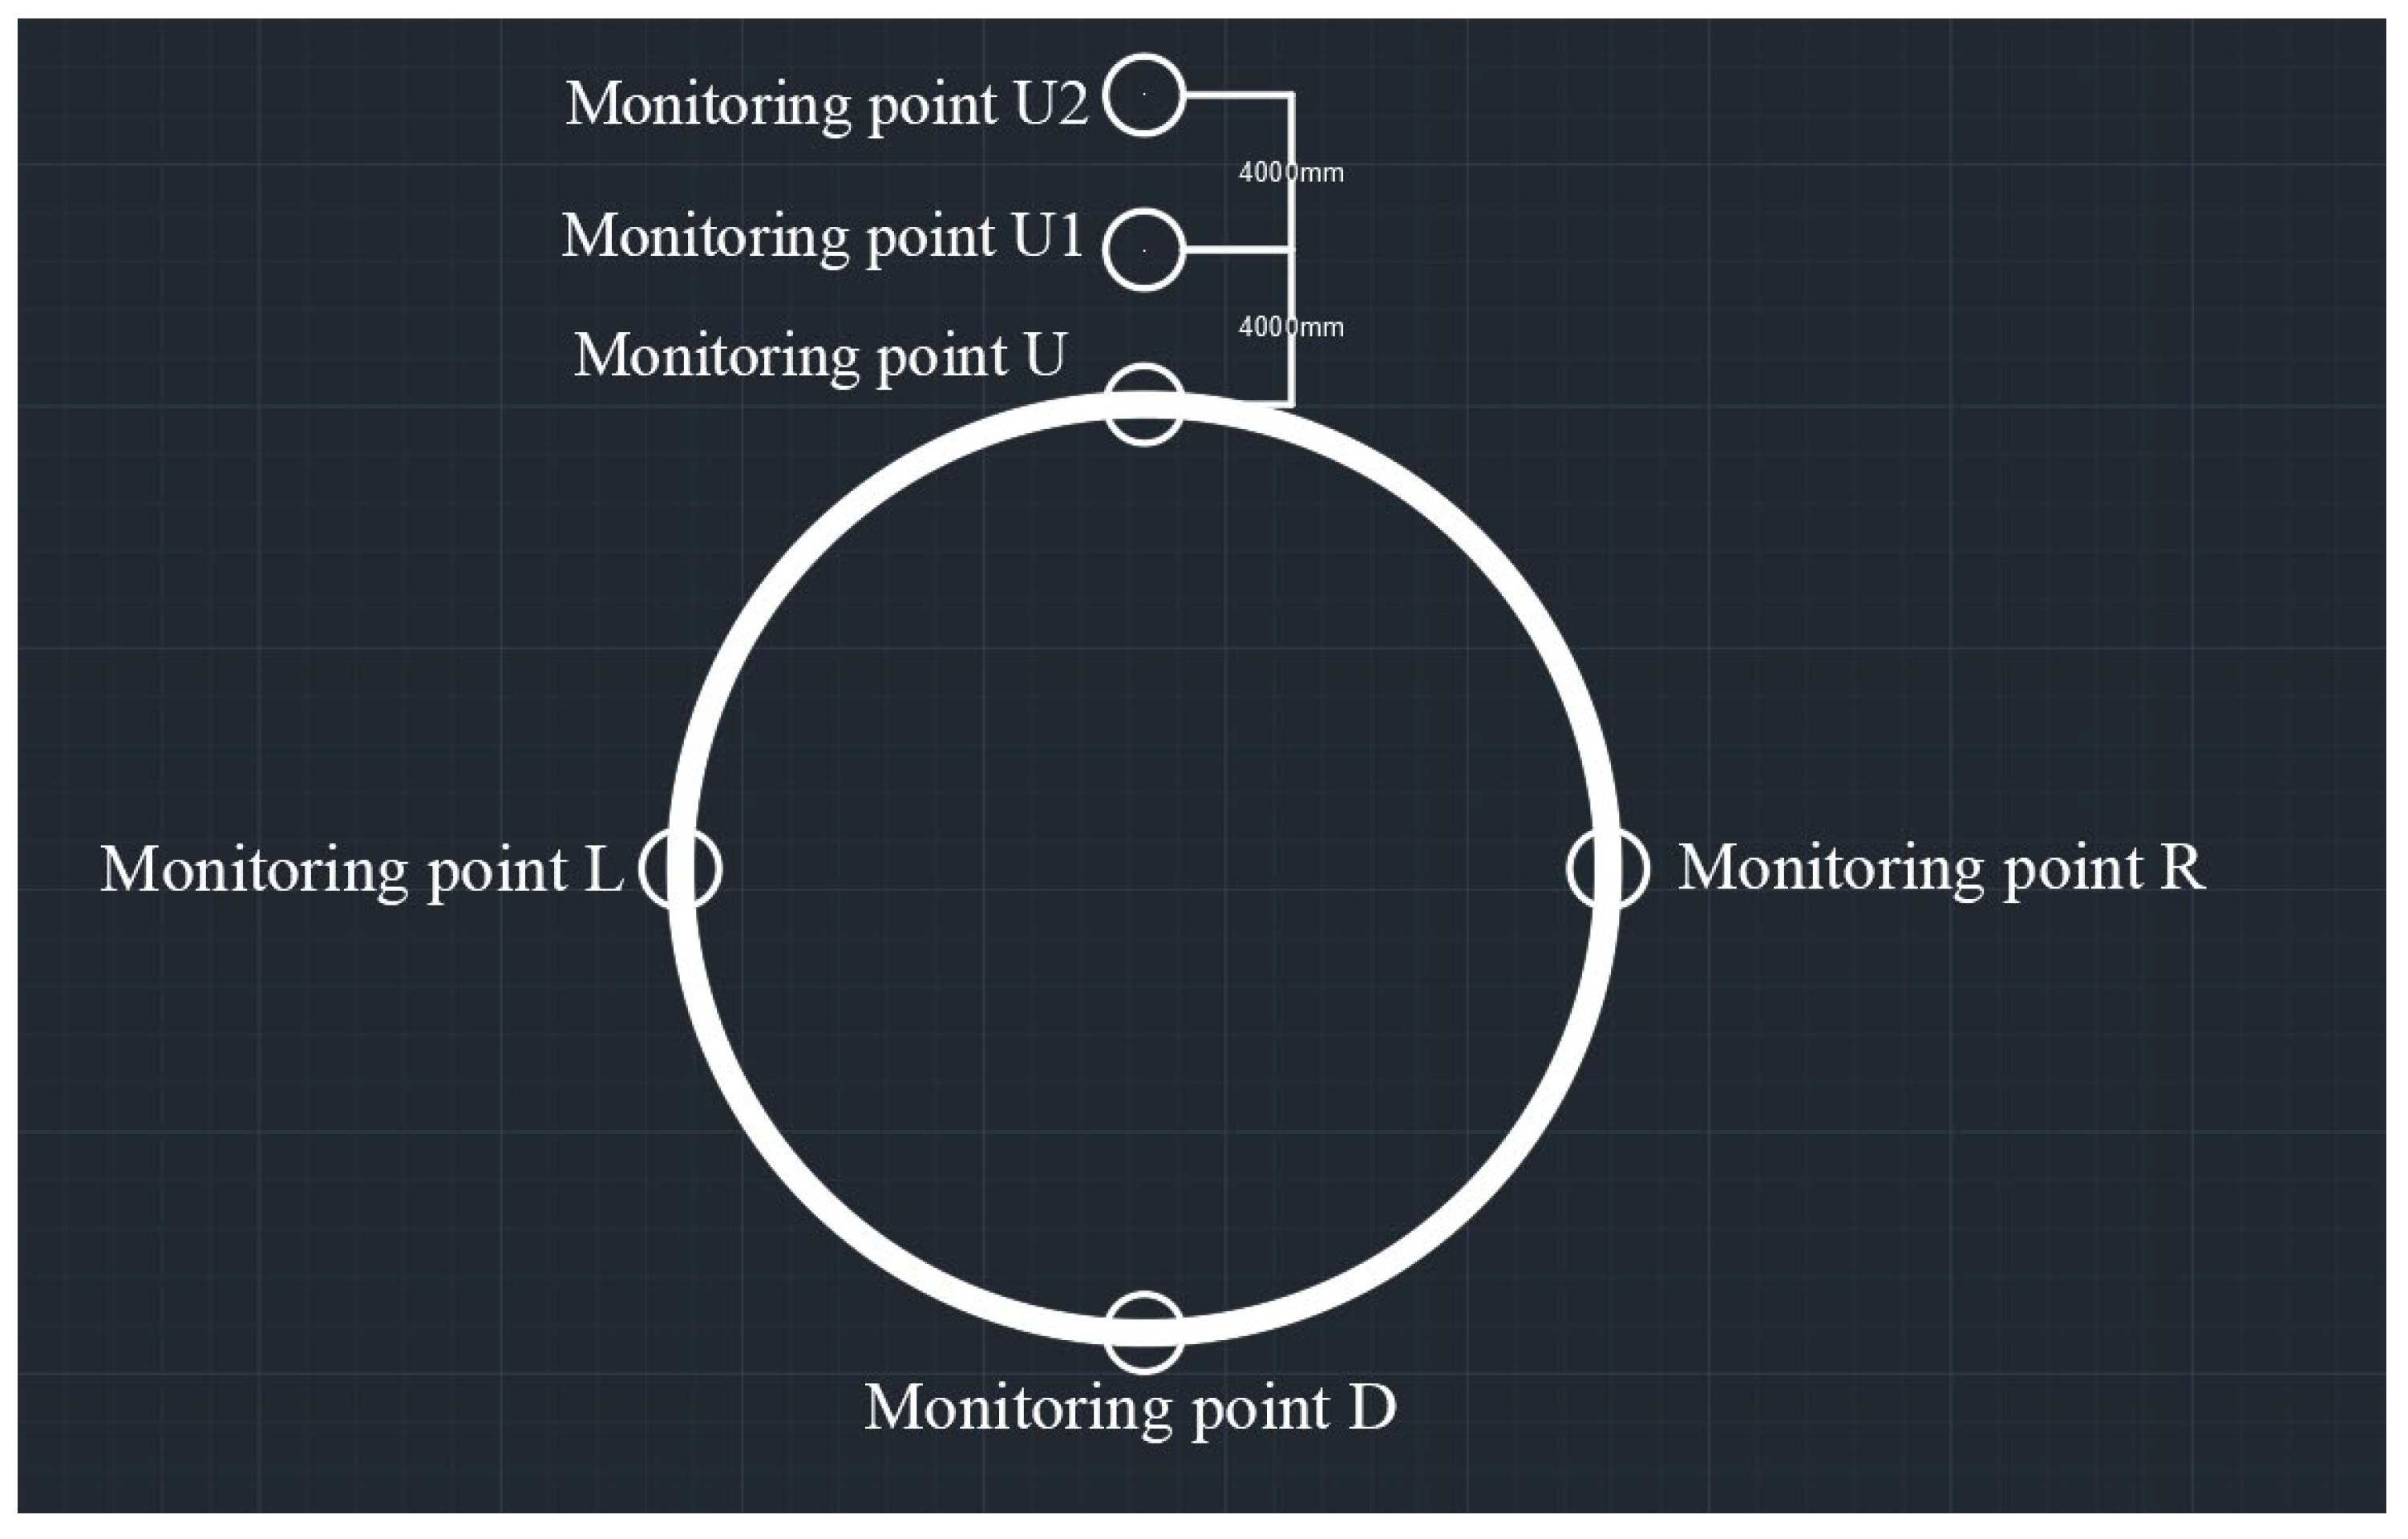
2.2. Model Setup and Assumptions

The following assumptions were made to simplify the model while maintaining accuracy:
  • Isotropic, homogeneous rock and soil: The surrounding rock and soil bodies were assumed to be isotropic and homogeneous. This assumption simplifies the complex geological conditions but still allows for an accurate representation of the general behavior of fractured rocks in fault zones.
  • Simplified shield–soil interaction: The interaction between the shield shell and the surrounding rock was modeled using a face-to-face frictional contact approach. The friction coefficient was calibrated to replicate the realistic friction between the shield and fault zone materials.
  • Grouting process assumptions: The grouting process, which fills the gap between the lining segments and the surrounding rock, was simplified as an elastic, isostatic layer. It was assumed that after the grouting material hardens; it forms a cohesive bond with the surrounding rock, providing adequate support to resist further deformation.
  • Support and grouting pressures: The support pressure at the tunnel’s palm face was assumed to be in equilibrium with the surrounding soil pressure, following established geotechnical principles. Grouting pressures were applied to the shield tail in phases and adjusted to reflect the decreasing pressure as the grout hardened.

2.3. Boundary Conditions and Load Application

The developed FE model employs an implicit formulation, which allows for better stability during simulations of the complex tunneling process. To ensure accuracy, a thorough mesh convergence study was conducted, indicating that the results stabilized with the chosen mesh size. This careful consideration of model parameters ensures reliable simulations of the deformation behavior in fault fracture zones during shield tunneling. The model was designed to minimize boundary effects while accurately replicating the stress and displacement fields in the surrounding rock during shield tunneling through fault fracture zones. To avoid boundary effects, the dimensions of the model were extended significantly beyond the tunnel boundaries. The height of the model was set as the tunnel depth plus four times the tunnel diameter, and the lateral width extended to three to five times the tunnel diameter. These dimensions ensured that the model boundaries did not constrain the rock mass, allowing the simulation to replicate realistic deformation behavior. Displacement constraints were applied to the sides and bottom of the model, fixing them in all directions to prevent unrealistic outward movement. The top boundary was left unconstrained to simulate free surface conditions, allowing for vertical displacement caused by tunneling (Figure 1).
Gravity loads were applied uniformly to all elements in the model, reflecting the real-world stress state of the surrounding rock and soil. The pressure at the palm face of the tunnel, applied by the shield machine, was assumed to be in equilibrium with the surrounding soil pressure, simulating the realistic support provided by the machine during excavation. Grouting pressure was applied at the shield tail as the lining segments were installed. Initially, the pressure was high but gradually decreased as the grout hardened, replicating the real process in shield tunneling, where grouting supports the tunnel lining by filling gaps between the shield and surrounding rock. The interaction between the shield shell and the surrounding rock was modeled using a frictional contact method, calibrated to replicate the real behavior of shear forces transferred between the shield and the fault zone materials. These boundary conditions and load applications enable the model to accurately simulate the mechanical response of the surrounding rock and tunnel structure during shield tunneling. By carefully setting these parameters, the model captures both the deformation and stress redistribution around the tunnel as excavation progresses.

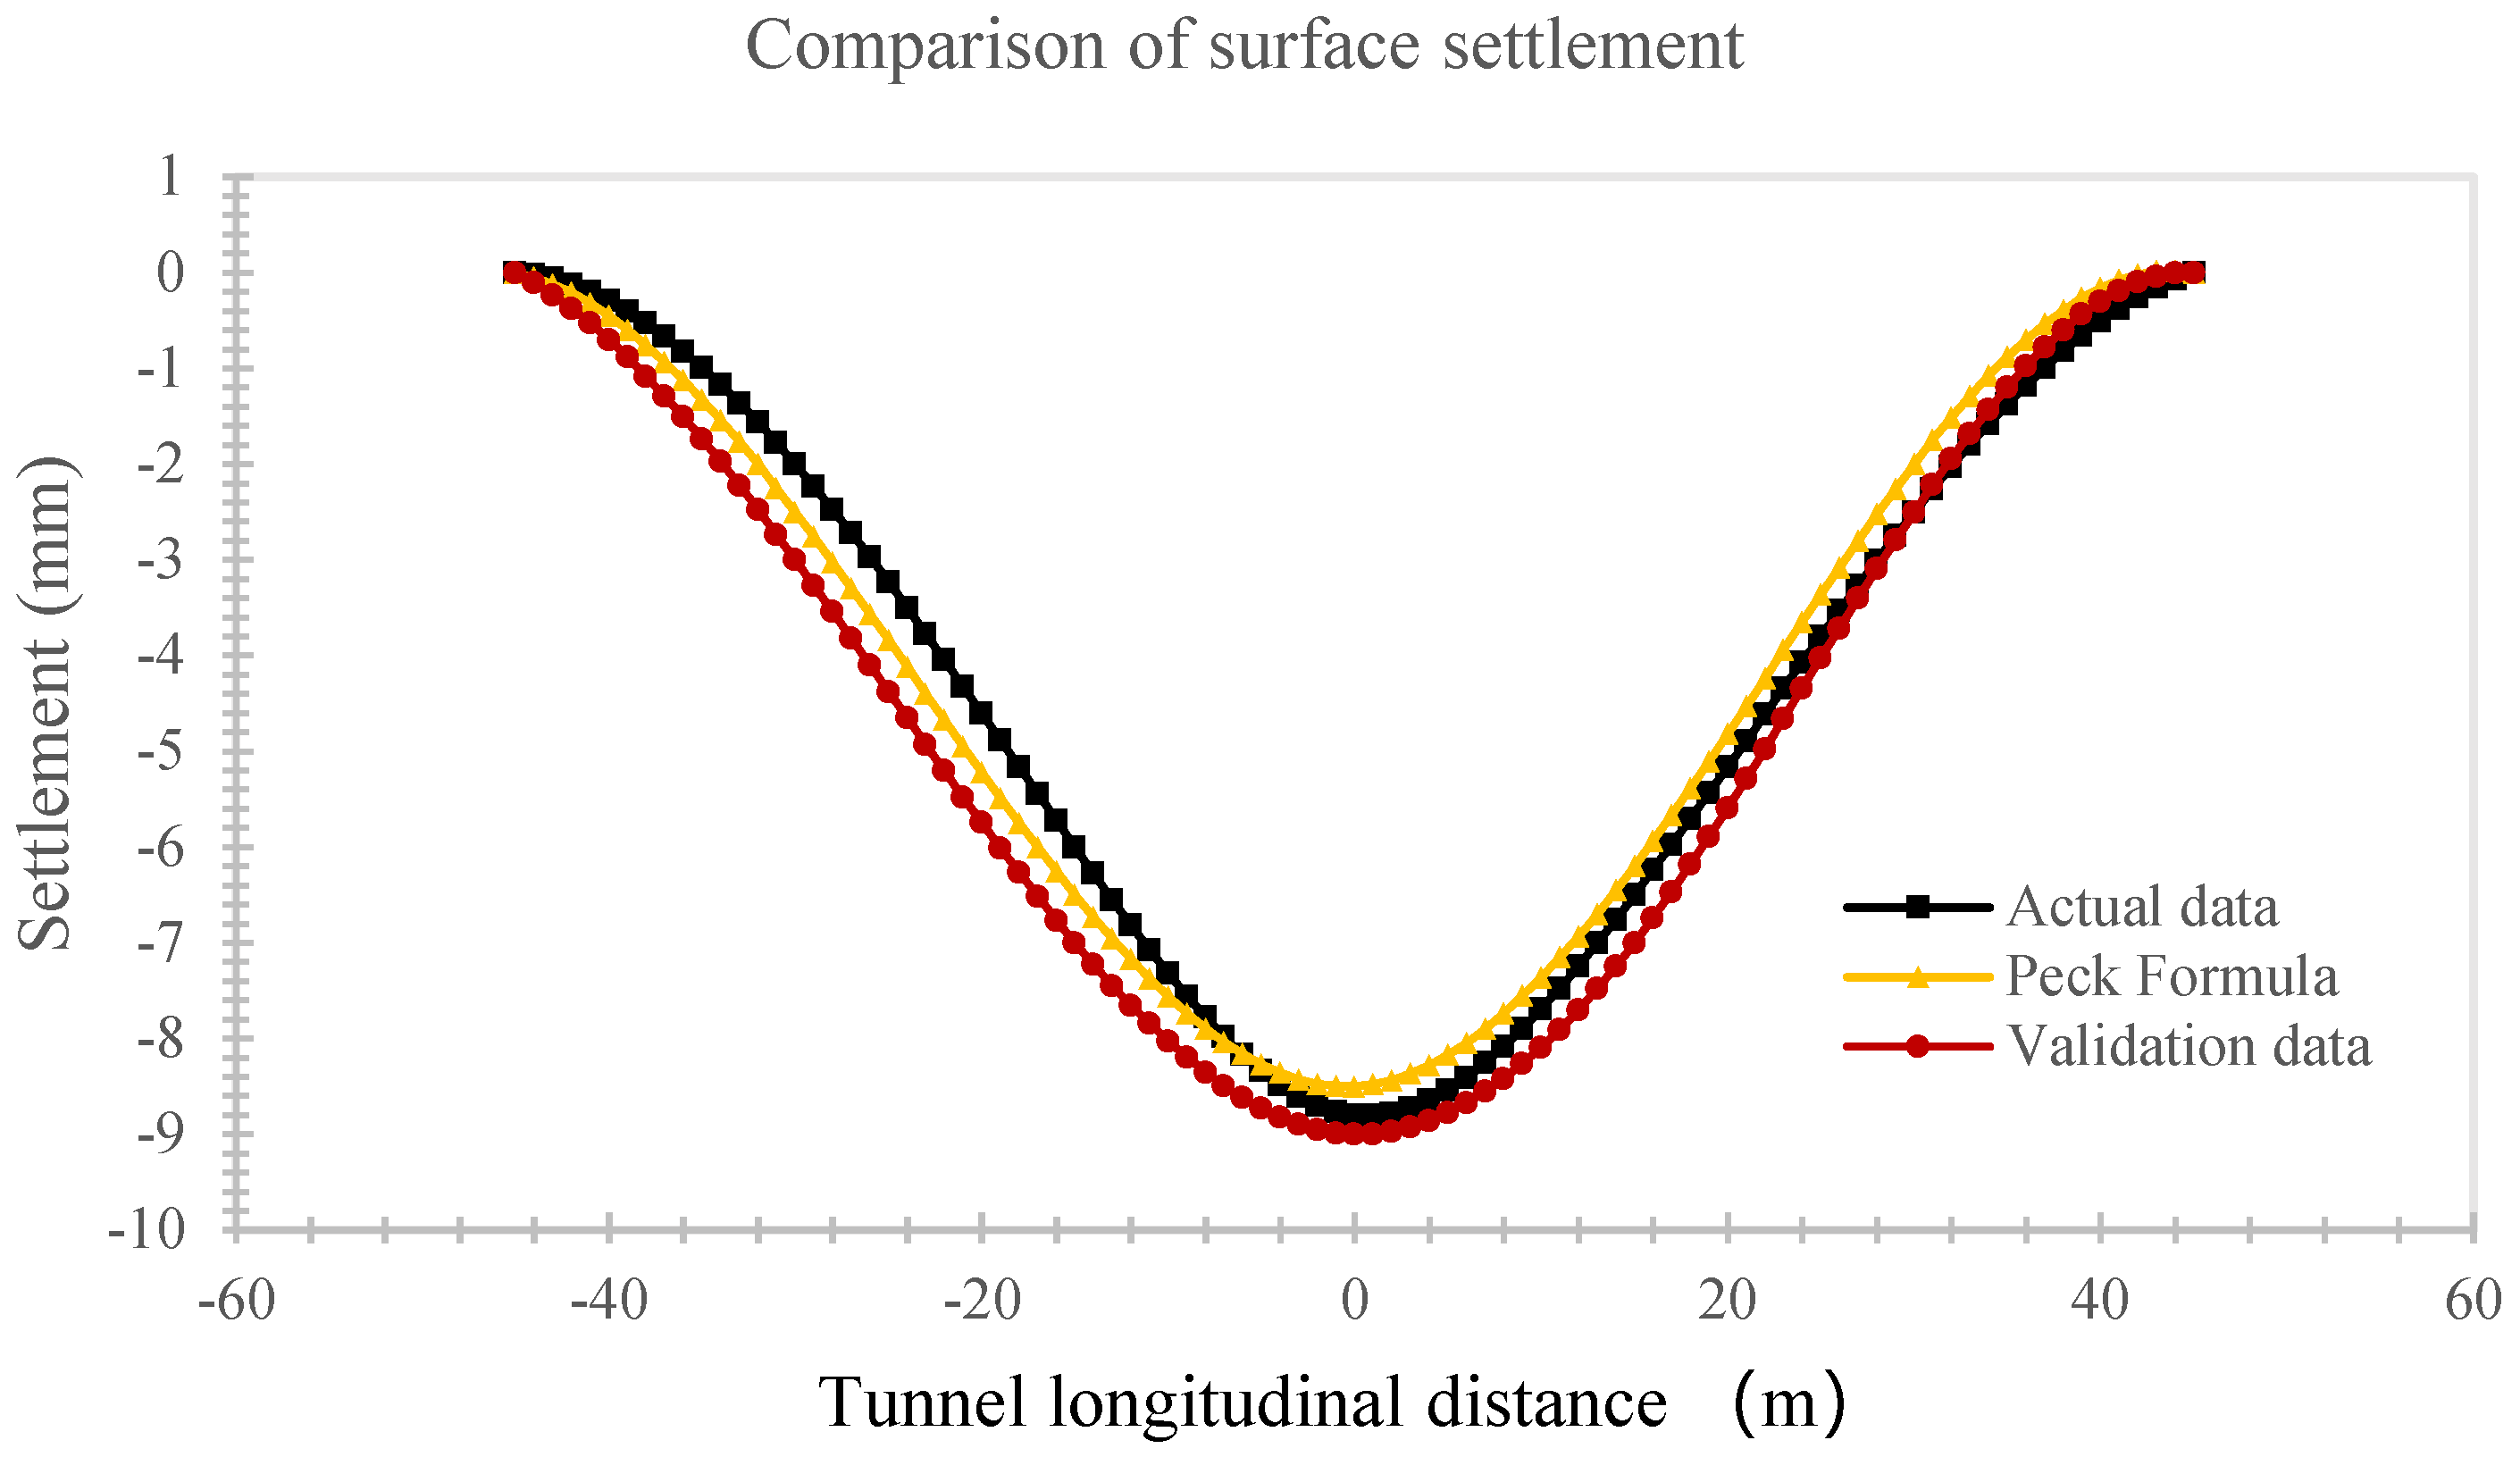
3. Validation of the Constructed Model

To verify the model’s accuracy, settlement and deformation patterns were compared with actual data from real tunnel projects and theoretical predictions using Peck’s formula, a widely accepted method for estimating ground settlement due to tunneling. The settlement curves derived from the simulation closely matched the observed data from real- cases, especially for tunnels passing through fault fracture zones. The parameters fitted to these settlement curves were consistent with the theoretical values predicted by Peck’s formula, further confirming the accuracy of the model (Figure 2). Additionally, monitoring points were established at key locations within the model to capture displacement and stress changes during the simulation (Figure 3). These monitoring points allowed for detailed tracking of deformation patterns in the surrounding rock, particularly in areas affected by the fault zone. The displacement and settlement data from these points aligned well with both theoretical expectations and data from field observations, reinforcing the model’s validity.
The close agreement between the simulated results, actual data, and theoretical predictions demonstrates that the numerical model reliably replicates the deformation behavior of the surrounding rock and tunnel structure during shield tunneling. This validation process ensures that the model can be used with confidence to predict the performance of similar tunnel projects in complex geological settings, such as fault fracture zones.

4. Modelling Program in This Study

The mechanical properties of the surrounding rock were key to determining the deformation behavior during tunneling. The fault fracture zone consists of fragmented and less cohesive rock, which significantly influences the tunnel’s stability. To account for this, parameters such as rock density, modulus of elasticity, Poisson’s ratio, cohesion, and internal friction angle were carefully selected based on geological surveys and field data. The density of the surrounding rock was varied between 1500 kg/m3 and 2200 kg/m3, capturing the typical range found in fault zones. The modulus of elasticity, which influences the stiffness of the rock, was selected from a range of 0.3 GPa to 0.8 GPa, representing the variability in rock rigidity within faulted areas (Table 1). The angle of internal friction and cohesion were also adjusted to reflect the weakening effect of faults on the surrounding rock’s shear strength. The grouting process plays a critical role in stabilizing the tunnel lining and preventing excessive deformation in the surrounding rock. The grouting pressure and the slurry’s mechanical properties were carefully selected. In the simulation, grouting pressures were varied from 0.2 MPa to 0.5 MPa, representing typical values used in practical tunneling operations. The pressure decreases as the grout hardens and consolidates, providing permanent support to the tunnel structure (Table 2). Additionally, the elastic modulus of the hardened slurry was set between 15 MPa and 50 MPa, depending on the composition and consolidation time of the grout. The initial grout strength was set at 4.8 MPa for all cases, and various values for the final grouting strength (15 MPa to 30 MPa) were tested to determine the most effective consolidation strategy for the fault zone environment (Table 3).

5. Results and Discussion

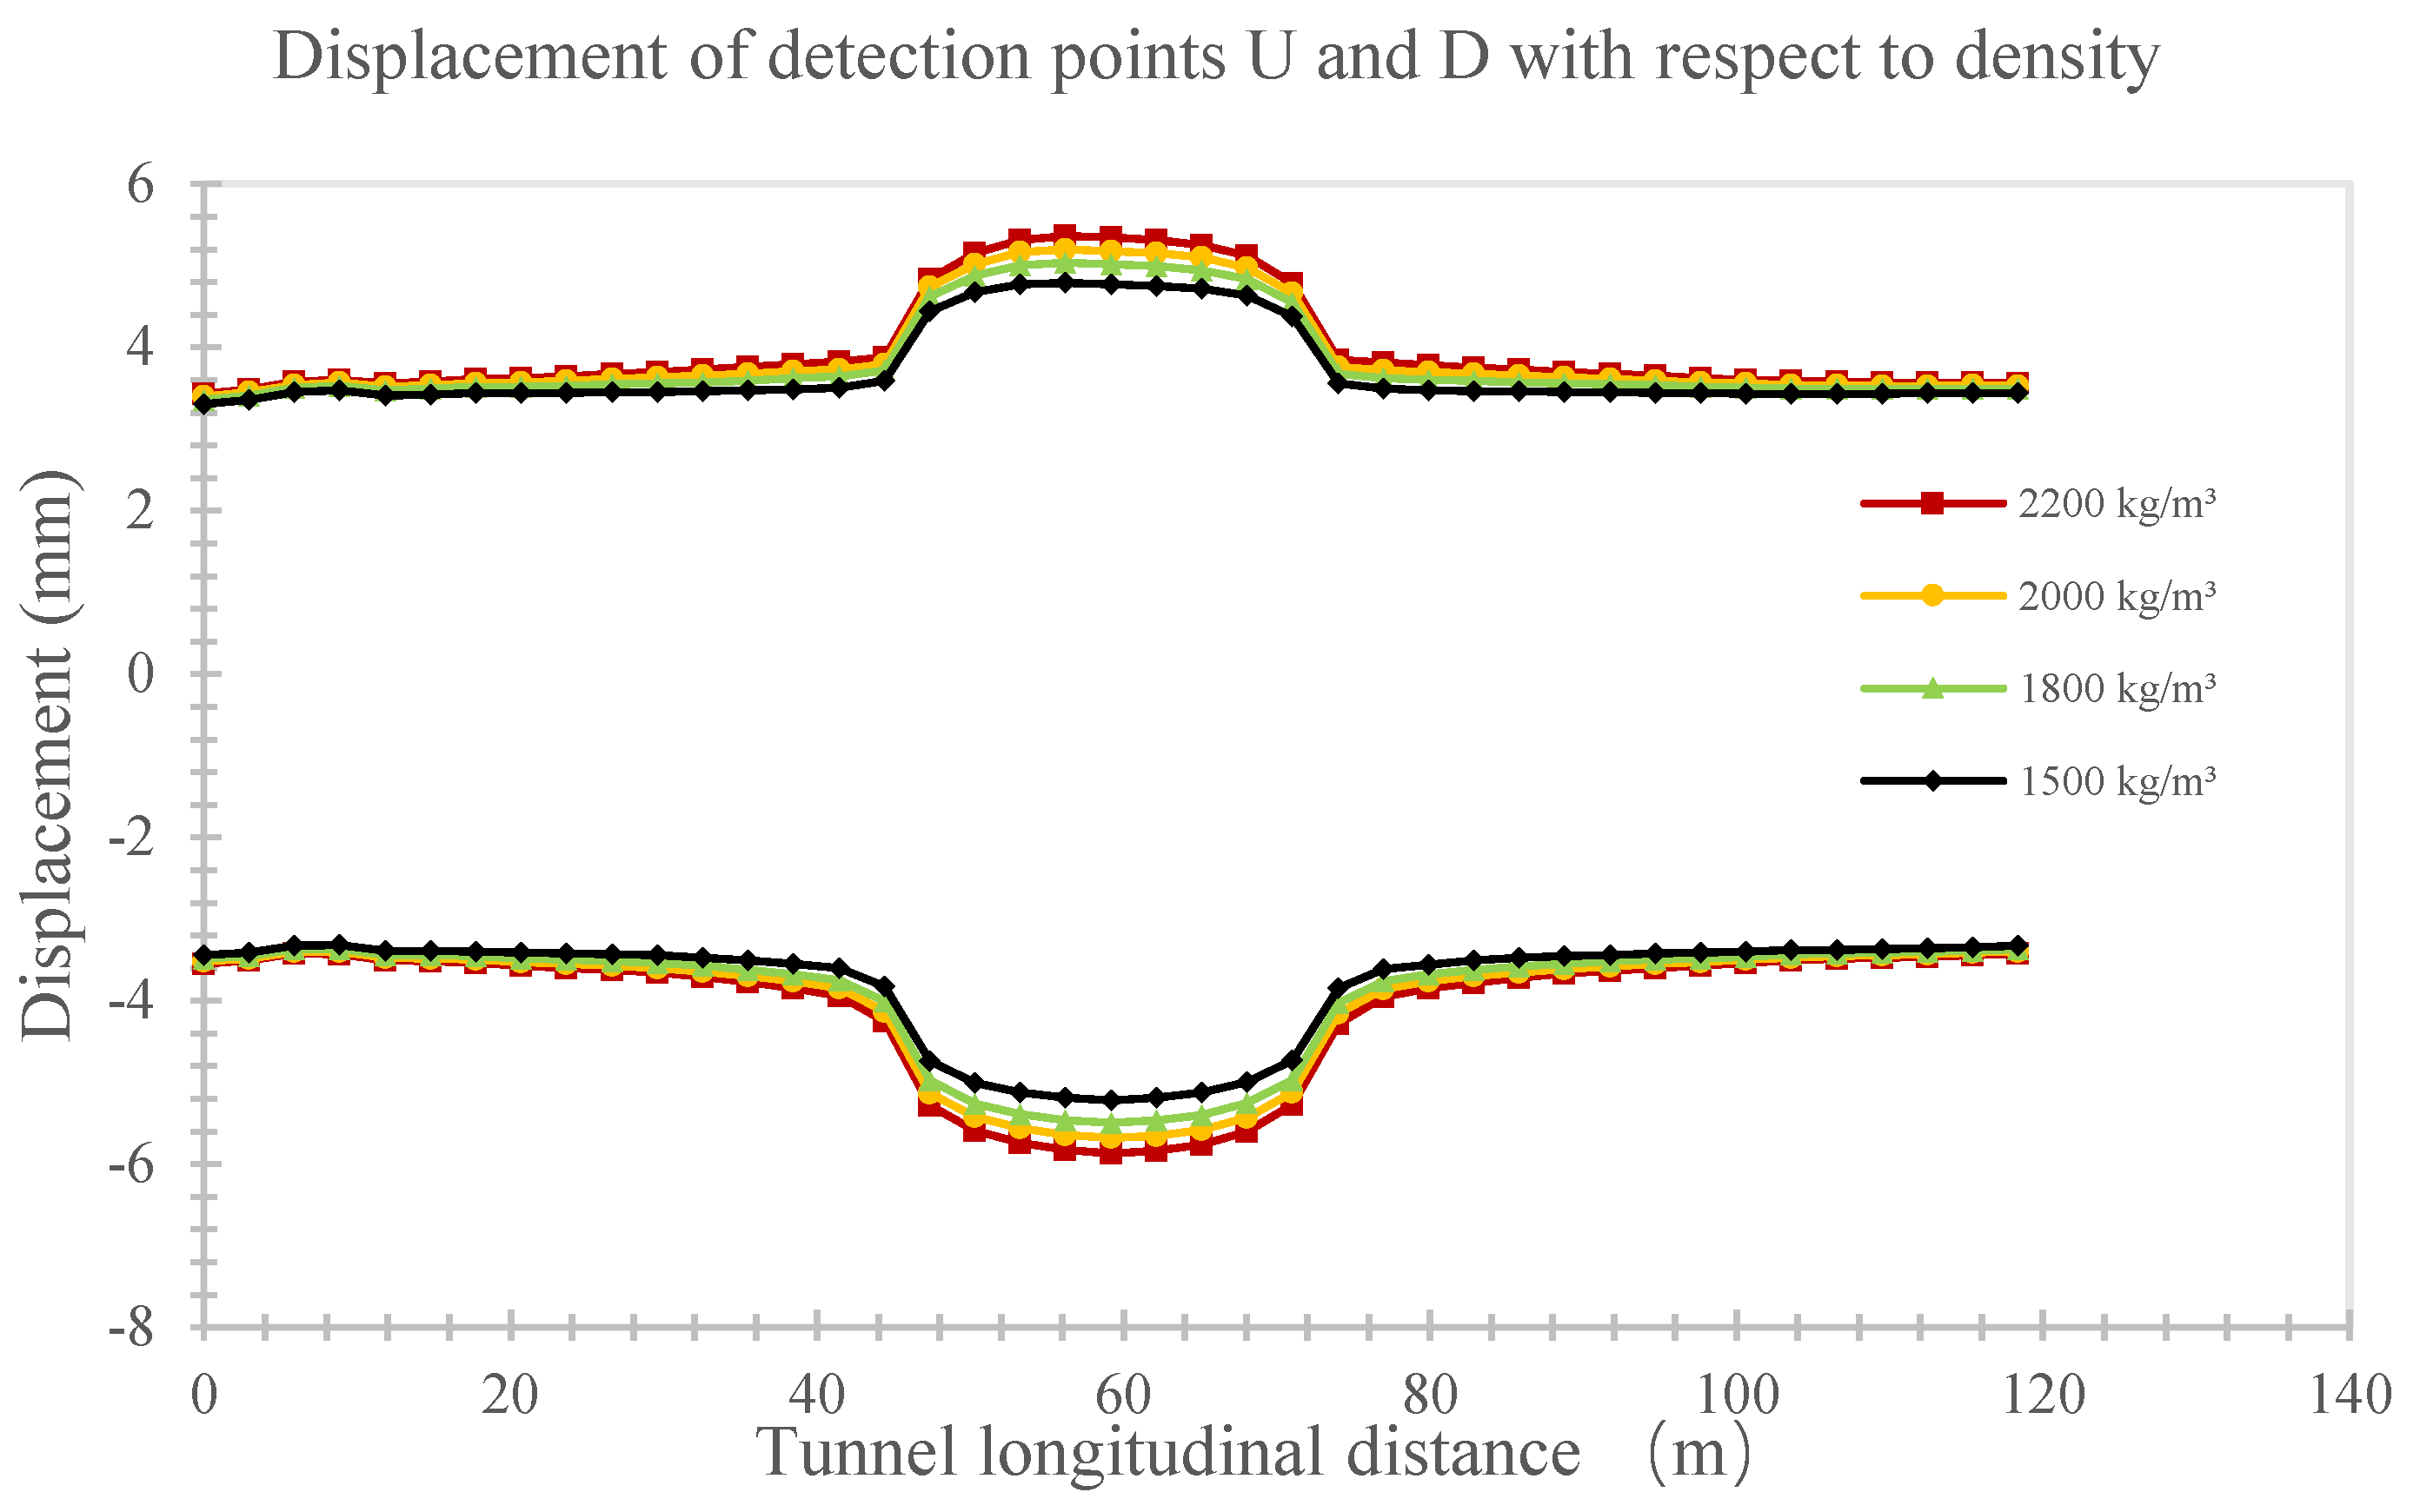
5.1. Effect of Density

The density of the surrounding rock in fault fracture zones plays a critical role in determining the deformation behavior of the tunnel during shield tunneling. In this study, rock density was varied between 1500 kg/m3 and 2200 kg/m3, representing typical fault zone conditions, and the results showed a clear correlation between higher density and increased tunnel deformation. As the density increased, the settlement of the tunnel crown rose significantly, with maximum settlement values ranging from −5.22 mm at 1500 kg/m3 to −5.87 mm at 2200 kg/m3 (Figure 4). This increase in settlement can be attributed to the greater gravitational forces exerted by denser rock, which apply higher loads to the tunnel structure, resulting in more pronounced vertical displacement. The widening of the settlement trough, as modeled using Peck’s formula, further highlighted the influence of density, showing that higher-density rock affects a broader area around the tunnel. This suggests that tunneling through denser rock not only amplifies vertical and horizontal deformations but also increases the extent of the affected ground, posing greater risks to nearby structures and surface infrastructure.

5.2. Effect of Poisson’s Ratio

The Poisson’s ratio of the surrounding rock significantly influences the deformation behavior of the tunnel during shield tunneling through fault fracture zones. In this study, Poisson’s ratio was varied between 0.35 and 0.50 to assess its impact on tunnel deformation. The results indicated that as Poisson’s ratio increased, the deformation of the tunnel also intensified. Specifically, when the Poisson’s ratio was 0.35, the maximum settlement at the tunnel crown was −5.58 mm, while at a higher Poisson’s ratio of 0.50, the settlement increased significantly to −9.85 mm. This can be attributed to the fact that higher Poisson’s ratios reflect materials that experience more lateral expansion under stress, resulting in greater vertical deformation when subjected to tunnel-induced stresses. Additionally, the uplift at the tunnel base also showed a marked increase, with the maximum uplift rising from 4.36 mm at a Poisson’s ratio of 0.35 to 10.67 mm at 0.50. Similarly, horizontal displacement at the tunnel sides increased as Poisson’s ratio rose, with the maximum displacement of the arch waist reaching 9.07 mm at 0.50 compared to just 1.74 mm at 0.35 (Figure 5). The widening of the settlement trough, as observed in the simulations, further illustrated the effect of Poisson’s ratio, with the broader settlement curve indicating a larger zone of influence as Poisson’s ratio increased. The increase in Poisson’s ratio led to greater vertical and horizontal deformation, emphasizing the importance of this parameter in assessing tunnel stability. In fault fracture zones, where Poisson’s ratio can vary significantly due to fractured and weak rock formations, considering these effects is essential for designing effective tunnel support systems. Higher Poisson’s ratios necessitate stronger reinforcements and grouting to manage the increased deformation and ensure tunnel safety, particularly in areas with compromised rock integrity.

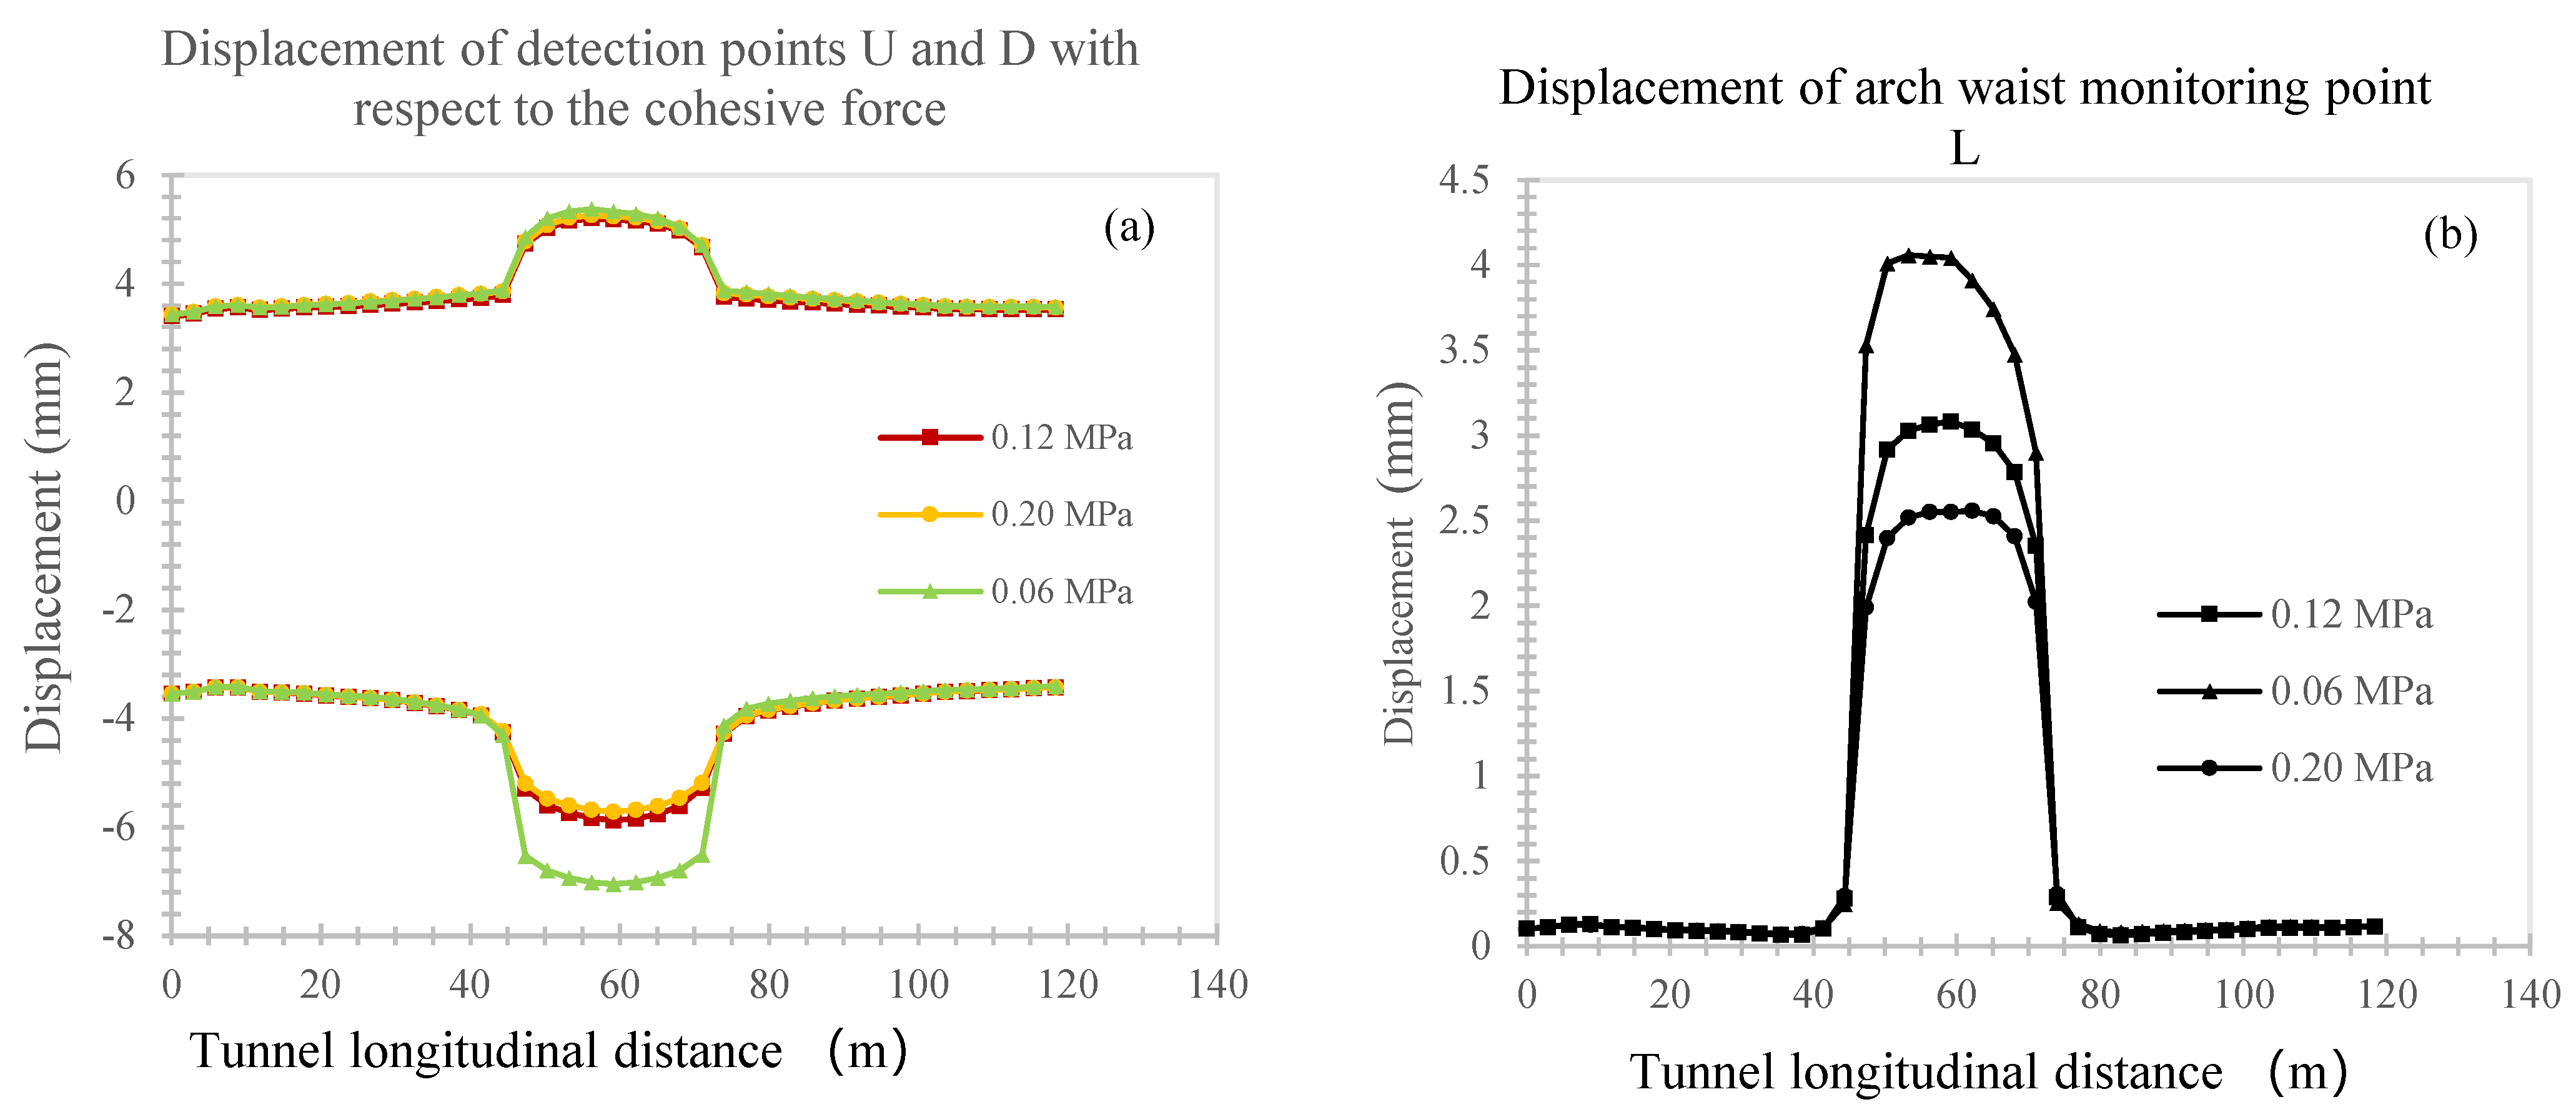
5.3. Effect of Crushing Belt Cohesion

The cohesion of the fault zone’s crushing belt has a substantial impact on the deformation behavior of the tunnel during shield tunneling. In this study, cohesion values were varied between 0.06 MPa and 0.20 MPa to assess their influence on tunnel deformation. The results showed that lower cohesion in the fault zone led to significantly greater deformation. When the cohesion was reduced to 0.06 MPa, the maximum settlement at the tunnel crown increased to −7.04 mm, compared to −5.87 mm at a cohesion of 0.12 MPa and −5.72 mm at 0.20 MPa. This inverse relationship is due to the fact that lower cohesion represents weaker bonding between particles in the fault zone, allowing for more substantial movement and deformation under stress. Similarly, the uplift at the base of the tunnel followed a similar pattern, with the maximum uplift reaching 5.38 mm at 0.06 MPa, compared to 5.36 mm and 5.26 mm at 0.12 MPa and 0.20 MPa, respectively. The horizontal displacement of the tunnel sides also increased with lower cohesion, as the arch waist displacement reached 4.06 mm at 0.06 MPa, compared to 3.08 mm at 0.12 MPa and 2.56 mm at 0.20 MPa (Figure 6). Furthermore, the settlement trough widened significantly with reduced cohesion, indicating that the loss of material stability in the fault zone affected a broader area around the tunnel. The larger settlement and displacement with lower cohesion emphasize the importance of this parameter in determining the overall stability of the tunnel. In fault fracture zones with low cohesion, such as areas with heavily fragmented and loose materials, proper support measures—including reinforced grouting and structural reinforcements—are necessary to prevent excessive deformation and ensure the safety of the tunnel. The findings suggest that low-cohesion fault zones require a more robust approach to tunnel design, with special attention to stabilizing the crushing belt to limit deformation and protect the integrity of the tunnel.

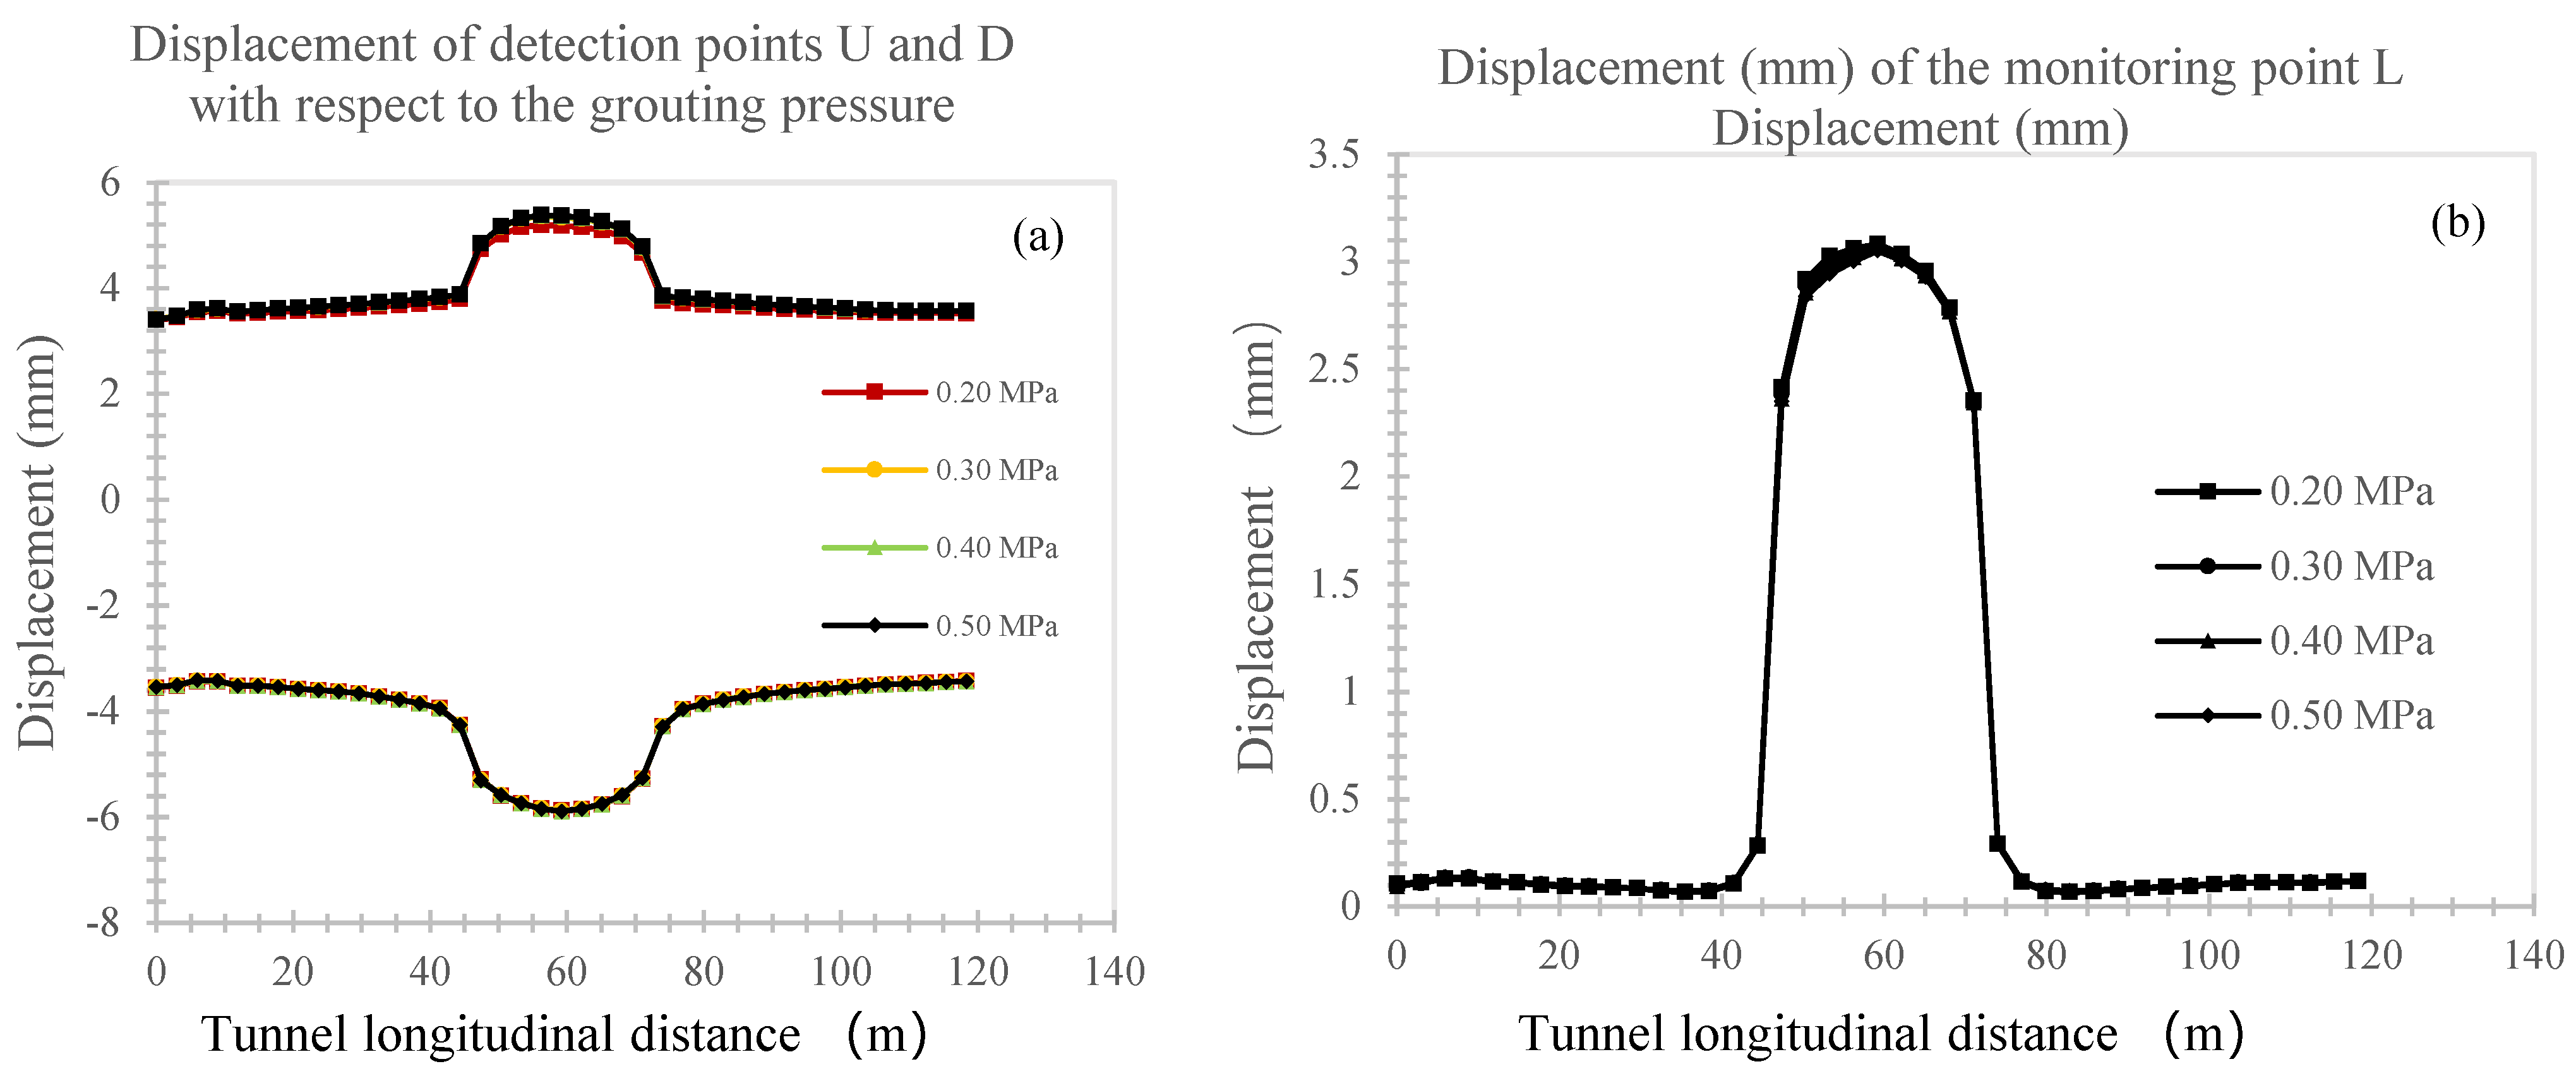
5.4. Effect of Grouting Pressure

The grouting pressure applied during shield tunneling has a critical effect on the deformation behavior of the tunnel and the surrounding rock, especially in fault fracture zones. In this study, grouting pressures were varied from 0.2 MPa to 0.5 MPa to evaluate their impact on tunnel stability and deformation control. The results indicated that as grouting pressure increased, the tunnel settlement decreased, but the changes were relatively modest. At a grouting pressure of 0.2 MPa, the maximum settlement at the tunnel crown was −5.87 mm, whereas at a pressure of 0.5 MPa, the settlement reduced slightly to −5.89 mm. Although the differences in settlement were minimal, the grouting pressure plays a vital role in controlling the distribution of stress and supporting the tunnel lining. Additionally, uplift at the base of the tunnel was similarly controlled by the grouting pressure, with the maximum uplift recorded at 5.36 mm for all pressure level, indicating a stabilizing effect. Horizontal displacement at the tunnel walls also showed minor variations with increasing pressure, where the maximum displacement at 0.2 MPa was 3.08 mm and decreased to 3.05 mm at 0.5 MPa (Figure 7). The small changes in both settlement and horizontal displacement suggest that while increasing grouting pressure provides stability, it has a limited direct impact on reducing deformation. However, the pressure ensures the consolidation of the surrounding rock and prevents further weakening of the tunnel structure. Additionally, the settlement trough did not change significantly with higher grouting pressure, which indicates that while it stabilizes the immediate area around the tunnel, it has little effect on the broader zone of influence. This highlights the importance of applying adequate grouting pressure during the tunneling process, particularly in fault zones where the rock is weakened and prone to displacement. The findings suggest that even though the effect on direct deformation is minor, maintaining optimal grouting pressure is essential to reinforcing the tunnel lining and ensuring long-term stability in fractured rock zones.

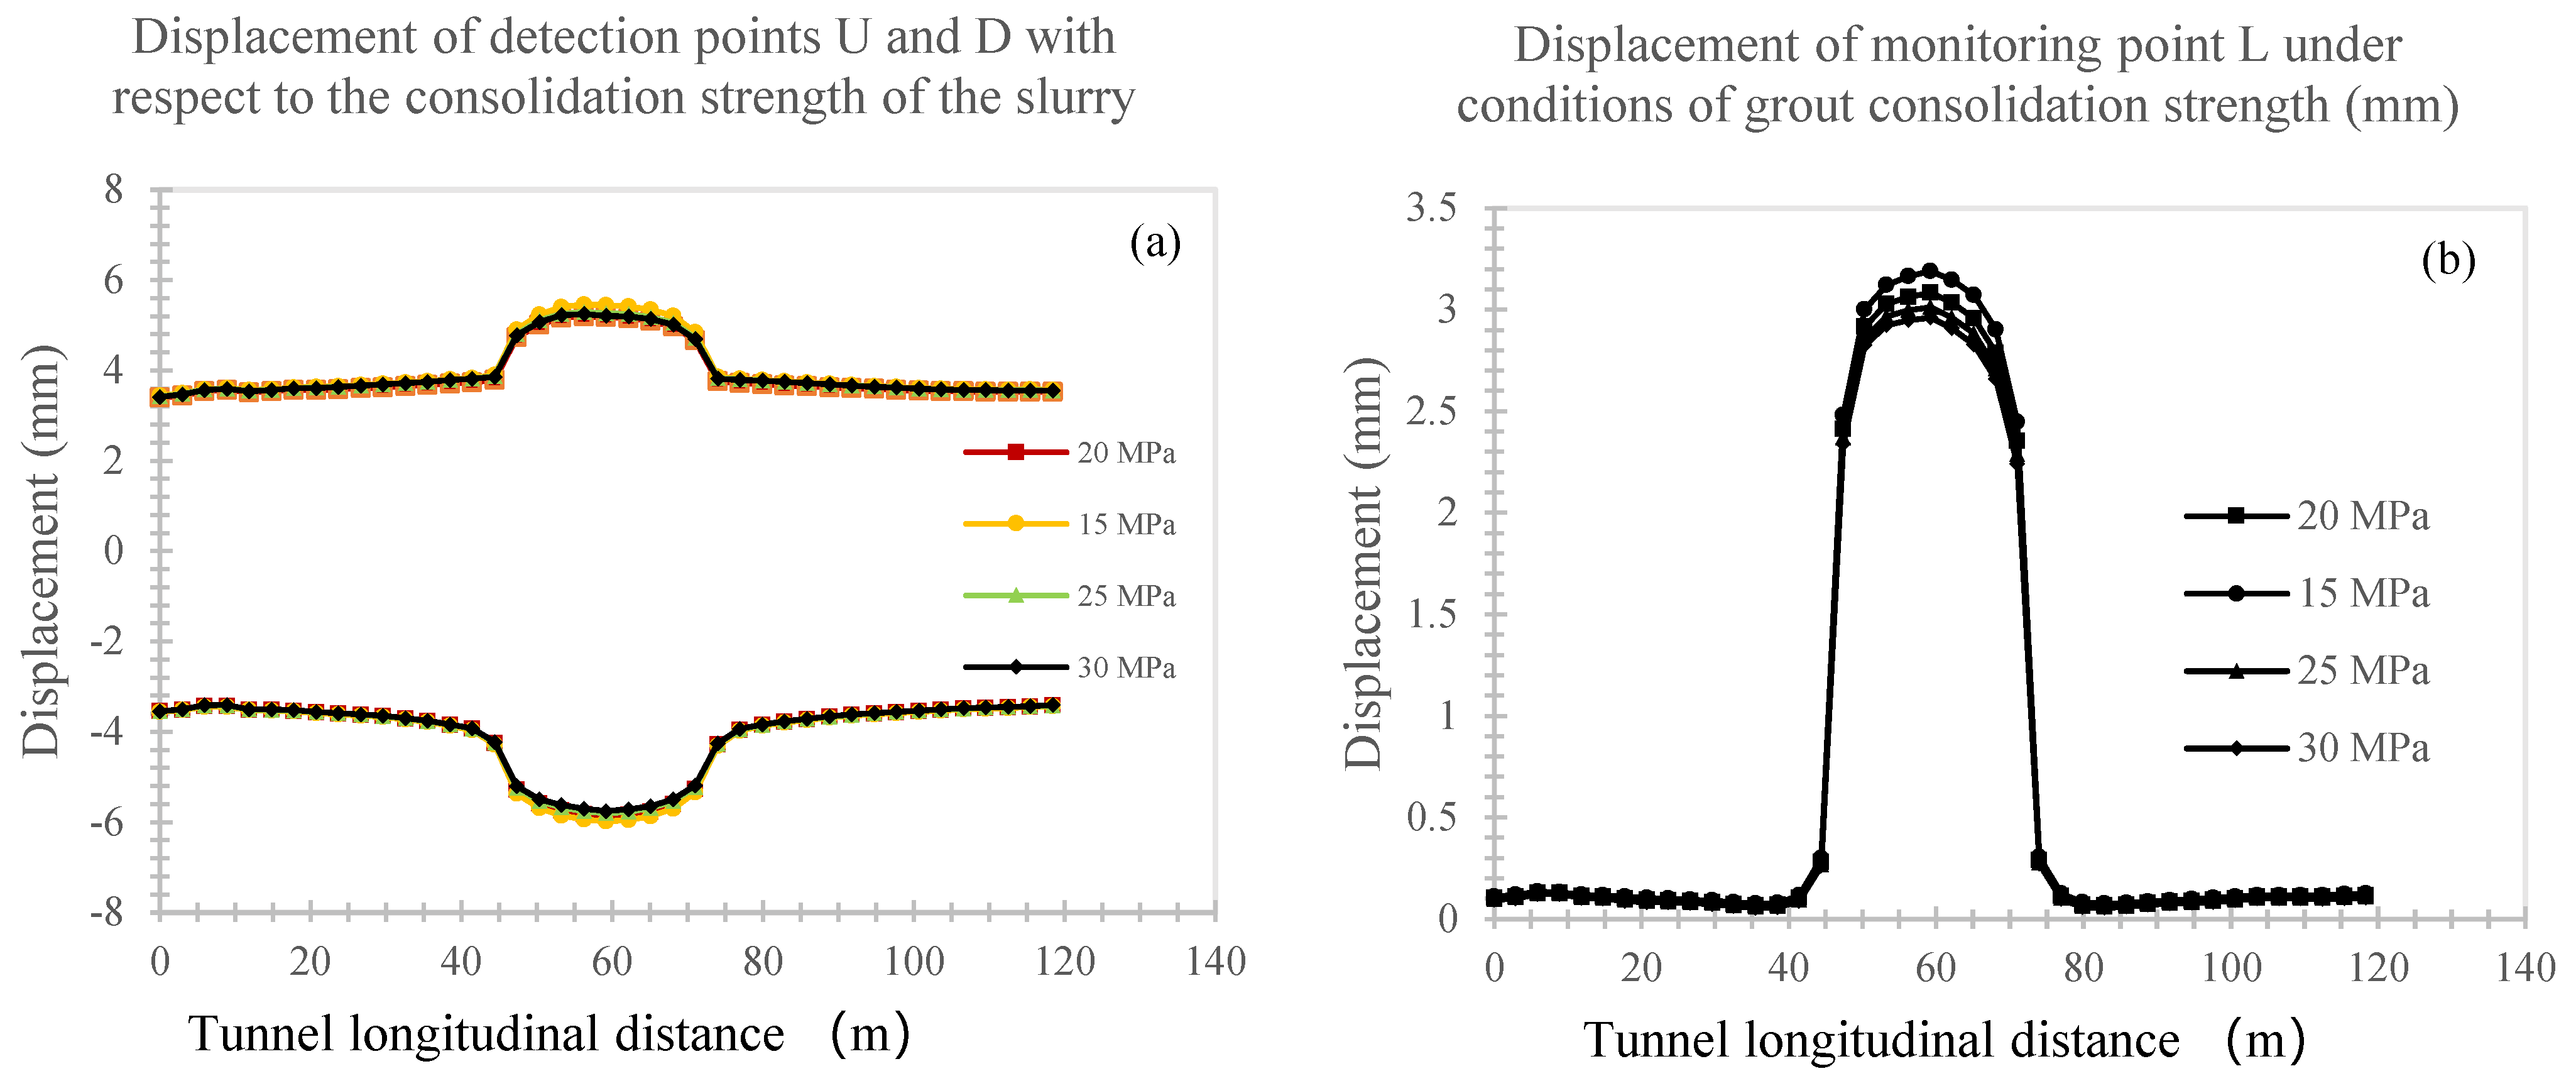
5.5. Effect of Slurry Strength

The strength of the slurry used in shield tunneling plays a crucial role in stabilizing the tunnel and controlling deformation, particularly in fault fracture zones where the surrounding rock is compromised. In this study, the slurry strength was varied between 15 MPa and 30 MPa to assess its impact on tunnel deformation. The results revealed that higher slurry strength led to reduced settlement and improved overall stability of the tunnel. At a lower slurry strength of 15 MPa, the maximum settlement at the tunnel crown was −5.98 mm, while increasing the strength to 30 MPa reduced the settlement to −5.75 mm. This indicates that stronger slurry provides better support by enhancing the bonding between the tunnel lining and the surrounding rock, effectively minimizing vertical displacement. Similarly, the uplift at the tunnel base decreased as the slurry strength increased, with maximum uplift dropping from 5.46 mm at 15 MPa to 5.25 mm at 30 MPa (Figure 8), demonstrating the importance of slurry strength in controlling base movement. Horizontal displacement at the tunnel sides also showed improvement with higher slurry strength, as the maximum horizontal displacement decreased from 3.19 mm at 15 MPa to 2.96 mm at 30 MPa. The settlement trough followed a similar pattern, with stronger slurry leading to a more localized and controlled deformation zone around the tunnel. This reduction in both vertical and horizontal deformation highlights the critical role of slurry strength in stabilizing tunnels, particularly in faulted zones where the surrounding rock may be fragmented and prone to displacement. Higher slurry strength allows for better load transfer and resistance to deformation, ensuring that the tunnel structure remains intact. These findings emphasize that selecting the appropriate slurry strength is essential in mitigating deformation and ensuring the long-term stability of tunnels passing through fault fracture zones. The use of high-strength slurry provides a more robust defense against the destabilizing effects of weak surrounding rock and fault-induced stresses.

6. Conclusions

This study investigates the deformation behavior of surrounding rock during shield tunneling through fault fracture zones using numerical simulations. The findings highlight the critical factors affecting tunnel stability and provide insights for optimizing tunnel design in complex geological settings:
  • Higher rock densities and Poisson’s ratios lead to increased vertical and horizontal displacements, indicating the necessity for stronger support systems in denser rock areas.
  • The cohesion of the fault zone significantly influences stability; lower cohesion results in greater settlement and lateral displacement, underscoring the importance of stabilizing weak zones.
  • While grouting pressure has a minimal direct impact on deformation, it is essential for stabilizing the tunnel lining, thereby enhancing overall structural integrity.
  • Increased slurry strength markedly reduces vertical and horizontal deformation, facilitating better load transfer and ensuring the structural integrity of the tunnel.
However, the constructed models may restrict the ability to capture all complex material behaviors and interactions that could arise in actual field conditions. Improvements of the model include integrating advanced material models to capture non-linear behavior and incorporating real-time field data to enhance predictive accuracy and applicability in diverse geological contexts.

Author Contributions

Conceptualization, Y.L.; data curation, W.B.; formal analysis, S.Y.; funding acquisition, X.N.; methodology, W.B., S.Y. and Y.L.; project administration, S.Y.; resources, X.N.; software, Z.L.; validation, W.B.; visualization, X.N.; writing—original draft, Z.L. and Y.L.; writing—review and editing, Z.L. and Y.L. All authors have read and agreed to the published version of the manuscript.

Funding

This research was funded by (1) Ministry of Housing and Urban-Rural Development of Research and Development Program the People’s Republic of China (2022-K-044); (2) Housing and Urban-Rural Development Department Research and Development Program of Guangdong Province (2022-K2-254693); (3) Guangzhou Science and Technology Plan Project (2023A03J0068).

Data Availability Statement

The data presented in this study are available on request from the corresponding author.

Conflicts of Interest

Authors Xingzhong Nong, Wenfeng Bai and Shixuan Yi were employed by the company Guangzhou Metro Design and Research Institute Co., Ltd. The remaining authors declare that the research was conducted in the absence of any commercial or financial relationships that could be construed as a potential conflict of interest.

References

  1. Xu, S.Y.; Jiang, C.; Huang, L. Public health impacts from subway noise: Case study Hong Kong. J. Acoust. Soc. Am. 2019, 145, 1867. [Google Scholar] [CrossRef]
  2. Zhang, S.; Wang, W.; Wu, Z.; Dai, Y.; Li, Y.; Dai, H. Effect of periodic pile row in subway vibration Isolation. Procedia Eng. 2017, 199, 302–309. [Google Scholar] [CrossRef]
  3. Wang, L.; Liu, P.; Jing, Q.; Liu, Y.; Wang, W.; Zhang, Y.; Li, Z. Strength properties and thermal conductivity of concrete with the addition of expanded perlite filled with aerogel. Constr. Build. Mater. 2018, 188, 747–757. [Google Scholar] [CrossRef]
  4. Vogiatzis, K. Protection of the Cultural Heritage from Underground Metro Vibration and Ground-Borne Noise in Athens Centre: The Case of the Kerameikos Archaeological Museum and Gazi Cultural Centre. Int. J. Acoust. Vib. 2012, 17, 59. [Google Scholar] [CrossRef]
  5. Topçu, İ.B.; Işıkdağ, B. Effect of expanded perlite aggregate on the properties of lightweight concrete. J. Mater. Process. Technol. 2008, 204, 34–38. [Google Scholar] [CrossRef]
  6. Song, J.; Xu, M.; Tan, C.; You, F.; Wang, X.; Zhou, S. Study on an epoxy resin system used to improve the elasticity of oil-well cement-based composites. Materials 2022, 15, 5258. [Google Scholar] [CrossRef] [PubMed]
  7. Sheng, T.; Bian, X.; Liu, G.; Xiao, C.; Chen, Y.; Li, Y. Experimental study on the sandbag isolator of buildings for subway-induced vertical vibration and secondary air-borne noise. Geotext. Geomembr. 2020, 48, 504–515. [Google Scholar] [CrossRef]
  8. Shahrour, I.; Khoshnoudian, F.; Sadek, M.; Mroueh, H. Elastoplastic analysis of the seismic response of tunnels in soft soils. Tunn. Undergr. Space Technol. 2010, 25, 478–482. [Google Scholar] [CrossRef]
  9. Sengul, O.; Azizi, S.; Karaosmanoglu, F.; Tasdemir, M.A. Effect of expanded perlite on the mechanical properties and thermal conductivity of lightweight concrete. Energy Build. 2011, 43, 671–676. [Google Scholar] [CrossRef]
  10. Reda Taha, M.M.; El-Dieb, A.S.; Abd El-Wahab, M.A.; Abdel-Hameed, M.E. Mechanical, Fracture, and Microstructural Investigations of Rubber Concrete. J. Mater. Civ. Eng. 2008, 20, 640–649. [Google Scholar] [CrossRef]
  11. Rashad, A.M. A synopsis about perlite as building material—A best practice guide for Civil Engineer. Constr. Build. Mater. 2016, 121, 338–353. [Google Scholar] [CrossRef]
  12. Raj, B.; Ganesan, N.; Shashikala, A. Engineering properties of self-compacting rubberized concrete. J. Reinf. Plast. Compos. 2011, 30, 1923–1930. [Google Scholar] [CrossRef]
  13. Pierce, C.; Williams, R. Sustainable Waste Management and Recycling: Challenges and Opportunities. Volume 3-Used/Post-Consumer Tyres. In Proceedings of the International Conference Organised by the Concrete and Masonry Research Group and held at Kingston University, London, UK, 14–15 September 2004; Volume 14, p. 15. [Google Scholar]
  14. Ohama, Y.; Demura, K. Relation between curing conditions and compressive strength of polyester resin concrete. Int. J. Cem. Compos. Lightweight Concr. 1982, 4, 241–244. [Google Scholar] [CrossRef]
  15. Yao, C.; Zhong, H.; Zhu, Z. Development of a Large Shaking Table Test for Sand Liquefaction Analysis. Lithosphere 2024, 2024. [Google Scholar] [CrossRef]
  16. Li, Q.; Zhu, Z. Calibration of an elastoplastic model of sand liquefaction using the swarm intelligence with a multi-objective function. J. Rock Mech. Geotech. Eng. 2023, 15, 789–802. [Google Scholar] [CrossRef]
  17. Zhao, J.; Zhu, Z.; Zhang, D.; Wang, H.; Li, X. Assessment of fabric characteristics with the development of sand liquefaction in cyclic triaxial tests: A DEM study. Soil Dyn. Earthq. Eng. 2024, 176, 108343. [Google Scholar] [CrossRef]
  18. Niaki, M.H.; Ahangari, M.G.; Fereidoon, A. Mechanical properties of reinforced polymer concrete with three types of resin systems. Proc. Inst. Civ. Eng.-Constr. Mater. 2022, 176, 233–241. [Google Scholar] [CrossRef]
  19. Neitzel, R.; Gershon, R.R.; Zeltser, M.; Canton, A.; Akram, M. Noise levels associated with New York City’s mass transit systems. Am. J. Public Health 2009, 99, 1393–1399. [Google Scholar] [CrossRef]
  20. Mahdi, F.; Abbas, H.; Khan, A.A. Flexural, shear and bond strength of polymer concrete utilizing recycled resin obtained from post consumer PET bottles. Constr. Build. Mater. 2013, 44, 798–811. [Google Scholar] [CrossRef]
  21. Lu, Y.; Xu, C.; Baghbani, A. Initial state of excavated soil and rock (ESR) to influence the stabilisation with cement. Constr. Build. Mater. 2023, 400, 132879. [Google Scholar] [CrossRef]
  22. Lu, Y.; Leong, E.-C.; Zeng, L.; Xu, C.; Li, B. Suitability charts to select stabilizer for excavated soils and rocks (ESR). Int. J. Geotech. Eng. 2023, 17, 108–123. [Google Scholar] [CrossRef]
  23. Baghbani, A.; Faradonbeh, R.S.; Lu, Y.; Soltani, A.; Kiany, K.; Baghbani, H.; Abuel-Naga, H.; Samui, P. Enhancing earth dam slope stability prediction with integrated AI and statistical models. Appl. Soft Comput. 2024, 164, 111999. [Google Scholar] [CrossRef]
  24. El-Hawary, M.M.; Abdel-Fattah, H. Temperature effect on the mechanical behavior of resin concrete. Constr. Build. Mater. 2000, 14, 317–323. [Google Scholar] [CrossRef]
  25. Fiala, P.; Degrande, G.; Augusztinovicz, F. Numerical modelling of ground-borne noise and vibration in buildings due to surface rail traffic. J. Sound Vib. 2007, 301, 718–738. [Google Scholar] [CrossRef]
  26. TB 10003-2016; Rail Road Tunnel Design Specification. China Railway Second Academy Engineering Group Limited Liability Company: Beijing, China, 2016.
  27. GB/T 50218-2014; Rock Classification. People’s Republic of China Industry Standard: Beijing, China, 2014.
  28. JTG/T D71-2004; Design Specification for Highway Tunnels. Industry standard of the People’s Republic of China: Beijing, China, 2004.
Figure 1. Enclosed rock boundary constraint model diagram.
Buildings 14 03161 g001
Figure 2. Model validation curve against actual data; Peck formula results.
Buildings 14 03161 g002
Figure 3. Illustration of monitoring point.
Buildings 14 03161 g003
Figure 4. Settlement of the vault and bulging of the base of the arch.
Buildings 14 03161 g004
Figure 5. (a) Settlement of the vault and bulging of the base of the arch (mm) and (b) horizontal displacement of arch girdle (mm).
Buildings 14 03161 g005
Figure 6. (a) Settlement of the vault and bulging of the base of the arch (mm) and (b) horizontal displacement of arch girdle (mm).
Buildings 14 03161 g006
Figure 7. (a) Settlement of the vault and bulging of the base of the arch (mm) and (b) Horizontal displacement of arch girdle (mm).
Buildings 14 03161 g007
Figure 8. (a) Settlement of the vault and bulging of the base of the arch (mm) and (b) horizontal displacement of arch girdle (mm).
Buildings 14 03161 g008
Table 1. Physical parameters working conditions [26,27,28].
Density (kg/m3)Poisson’s RatioModulus of Elasticity (GPa)Angle of Internal Friction (°)Cohesive Force (MPa)
Condition O22000.40.445250.12
Condition A120000.40.445250.12
Condition A218000.40.445250.12
Condition A315000.40.445250.12
Condition B122000.350.445250.12
Condition B222000.450.445250.12
Condition B322000.50.445250.12
Condition C122000.40.8250.12
Condition C222000.40.6250.12
Condition C322000.40.3250.12
Condition D122000.40.445200.12
Condition D222000.40.445150.12
Condition E122000.40.445250.2
Condition E222000.40.445250.06
Table 2. Selection of grouting pressure parameters [26,27,28].
Density (kg/m3)Poisson’s RatioModulus of Elasticity (GPa)Angle of Internal Friction (°)Cohesive Force (MPa)Slurry Strength (MPa)
Condition O22000.40.445250.120.2
Condition P122000.40.445250.120.3
Condition P222000.40.445250.120.4
Condition P322000.40.445250.120.5
Table 3. Parameters of slurry coagulation strength [26,27,28].
Density (kg/m3)Poisson’s RatioModulus of Elasticity (GPa)Angle of Internal Friction (°)Cohesive Force (MPa)Slurry Strength (MPa)
Condition O22000.40.445250.1220
Condition S122000.40.445250.1215
Condition S222000.40.445250.1225
Condition S322000.40.445250.1230
Disclaimer/Publisher’s Note: The statements, opinions and data contained in all publications are solely those of the individual author(s) and contributor(s) and not of MDPI and/or the editor(s). MDPI and/or the editor(s) disclaim responsibility for any injury to people or property resulting from any ideas, methods, instructions or products referred to in the content.

