Abstract
This paper examines the water-vapour diffusion resistance (Z-value) of vapour versus wind barriers by determining their Z-value ratio in exterior wood-frame walls thermally insulated with six different materials to prevent mould growth. Using WUFI Pro, the water-vapour diffusion resistance requirements were determined for thermal insulation using mineral wool and biogenic materials: wood fibre, straw, flax, grass, and hemp. Hygrothermal simulations determine the minimum Z-value ratio between these materials with vapour versus wind barriers in temperate and cold climates. Wind barriers with Z-values between 1 and 8 GPa s m2/kg were used in walls with U-values of 0.15 and 0.10 W/m2 K. The indoor moisture load was defined from classes of 1 to 5 with a U-value of 0.15 W/m2 K and classes of 2 and 3 were used for a U-value of 0.10 W/m2 K. The Z-value ratio depends on the Z-values of the wind barrier and thermal insulation material, moisture load class, and U-value. The required Z-value ratio declines with an increased wind-barrier Z-value. The vapour-barrier Z-value approaches a fixed threshold for wind-barrier Z-values approaching lower values (1 GPa s m2/kg) and those approaching higher values (8 GPa s m2/kg), depending on the thermal insulation material. This parameter study examines wind barriers with a Z-value ranging between 1 and 8 GPa s m2/kg, which characterises typical wind barriers used in Denmark For the water-vapour diffusion resistance requirement of the vapour barrier, the Z-value increases for increased moisture load classes and thermally insulated walls with lower U-values. The conversion between the Z-value, the Sd-value, and the water-vapour resistance factor µ can be found in DS/EN ISO 12572:2016.
1. Introduction
Vapour-barrier systems are used in temperate and cold climates to ensure the required airtightness and reduce water-vapour diffusion into the building envelope [1,2]. The temperate climate zones are between the tropic and polar regions and are characterised by relatively moderate mean annual temperatures, with average monthly temperatures above 10 °C during the warmest months and above −3 °C during the colder months [3]. Most regions with a temperate climate have four seasons, and temperatures can vary greatly between summer and winter [4]. In these climates, airtightness is also required to reduce energy consumption and is specified as a requirement in some building regulations (e.g., [5]). Reducing diffusion hinders high moisture levels in the thermally insulated building envelope [6]. Independently of whether an air or vapour barrier is required, the tightness of the joints between its components is crucial [2]. Furthermore, as an integrated part of the vapour barrier, the joints must remain tight throughout the service life of the building envelope including the exterior wall.
In temperate and cold climates, vapour barriers are mounted on the warm side of the thermally insulated exterior building envelope [7]. Knowledge and experience of vapour-barrier systems comprising membranes of polyethene mounted with taped joints have been acquired through years of use. However, documentation of the performance, particularly over the long term, has indicated that the lifetime of vapour-barrier systems comprising membranes of polyethene is limited concerning the lifetime of an exterior wall [8,9]. Alternative vapour barriers are necessary [10], which can comprise sheets or boards, depending on their use in the building. These vapour barriers could be of biogenic hardboard, which is interesting in the climate mitigation agenda because, in addition to storing embedded carbon, they can reduce greenhouse gas emissions and replace non-renewable building components [10]. Board materials can control the supply of water-vapour to the cold insulated parts of the building envelope and can also be included in stabilizing systems.
For this article, hygrothermal simulations of an exterior wood-frame wall have been performed to calculate the minimum requirements for the water-vapour resistance, the Z-value ratio between the vapour barrier on the warm side of the exterior wall construction, and the wind barrier mounted on the exterior side of the thermal wall insulation. A parameter study has been carried out, and the paper reveals the results examining wind barriers with a Z-value between 1 and 8 GPa s m2/kg to find the necessary Z-value for the vapour barrier. Guidelines in Denmark include an assumption that an exterior wall construction with a vapour-barrier Z-value that is 10 times higher than the wind-barrier Z-value has no to minimal risk of mould growth behind a wind barrier exposed to a moisture load class of 3. Exposure to a moisture load class of 1 and 2 for an exterior wall is not considered to be at risk of mould growth behind a wind barrier if the Z-value of the vapour barrier is five times higher than that of the wind barrier [11,12]. There are no such guidelines for moisture load class 4 and 5. These assumptions are also addressed in the paper. Other countries have different ratio instructions between the wind barrier and vapour barrier, e.g., Belgium has from 1:6 to 1:15 [13], and Finland has from 0 to 1:80 [14] etc.
The conversion between the Z-value, the Sd-value, and the water-vapour resistance factor µ is described in DS/EN ISO 12572:2016 using Equations (1) and (2):
Sd = µ ∙ d
Sd = δa ∙ Z
δa is the water-vapour diffusion coefficient for water-vapour in the air [kg/(m s Pa)], Sd is the water-vapour diffusion resistance in the air layer thickness [m], Z is the water-vapour diffusion resistance [(GPa s m2)/kg], and d is the thickness of the material [m]. δa = 1.95 ∙ 10−10 kg/(m s Pa) at a barometric pressure of 1000 hPa at 23 °C.
2. Method and Materials
An exterior wood-frame wall was assessed for moisture performance. On the exterior, a ventilated wooden cladding and wind barrier was installed, and on the interior a vapour barrier was installed. The following parameters were investigated: internal moisture loads, thermal insulation materials, wall thicknesses expressed by two U-values (thermal transmittance), exterior climate exposure, and combinations of the water-vapour resistance of the vapour- and wind-barrier Z-values defining the ratios between them for a wall with no mould growth risk.
2.1. Wall Construction
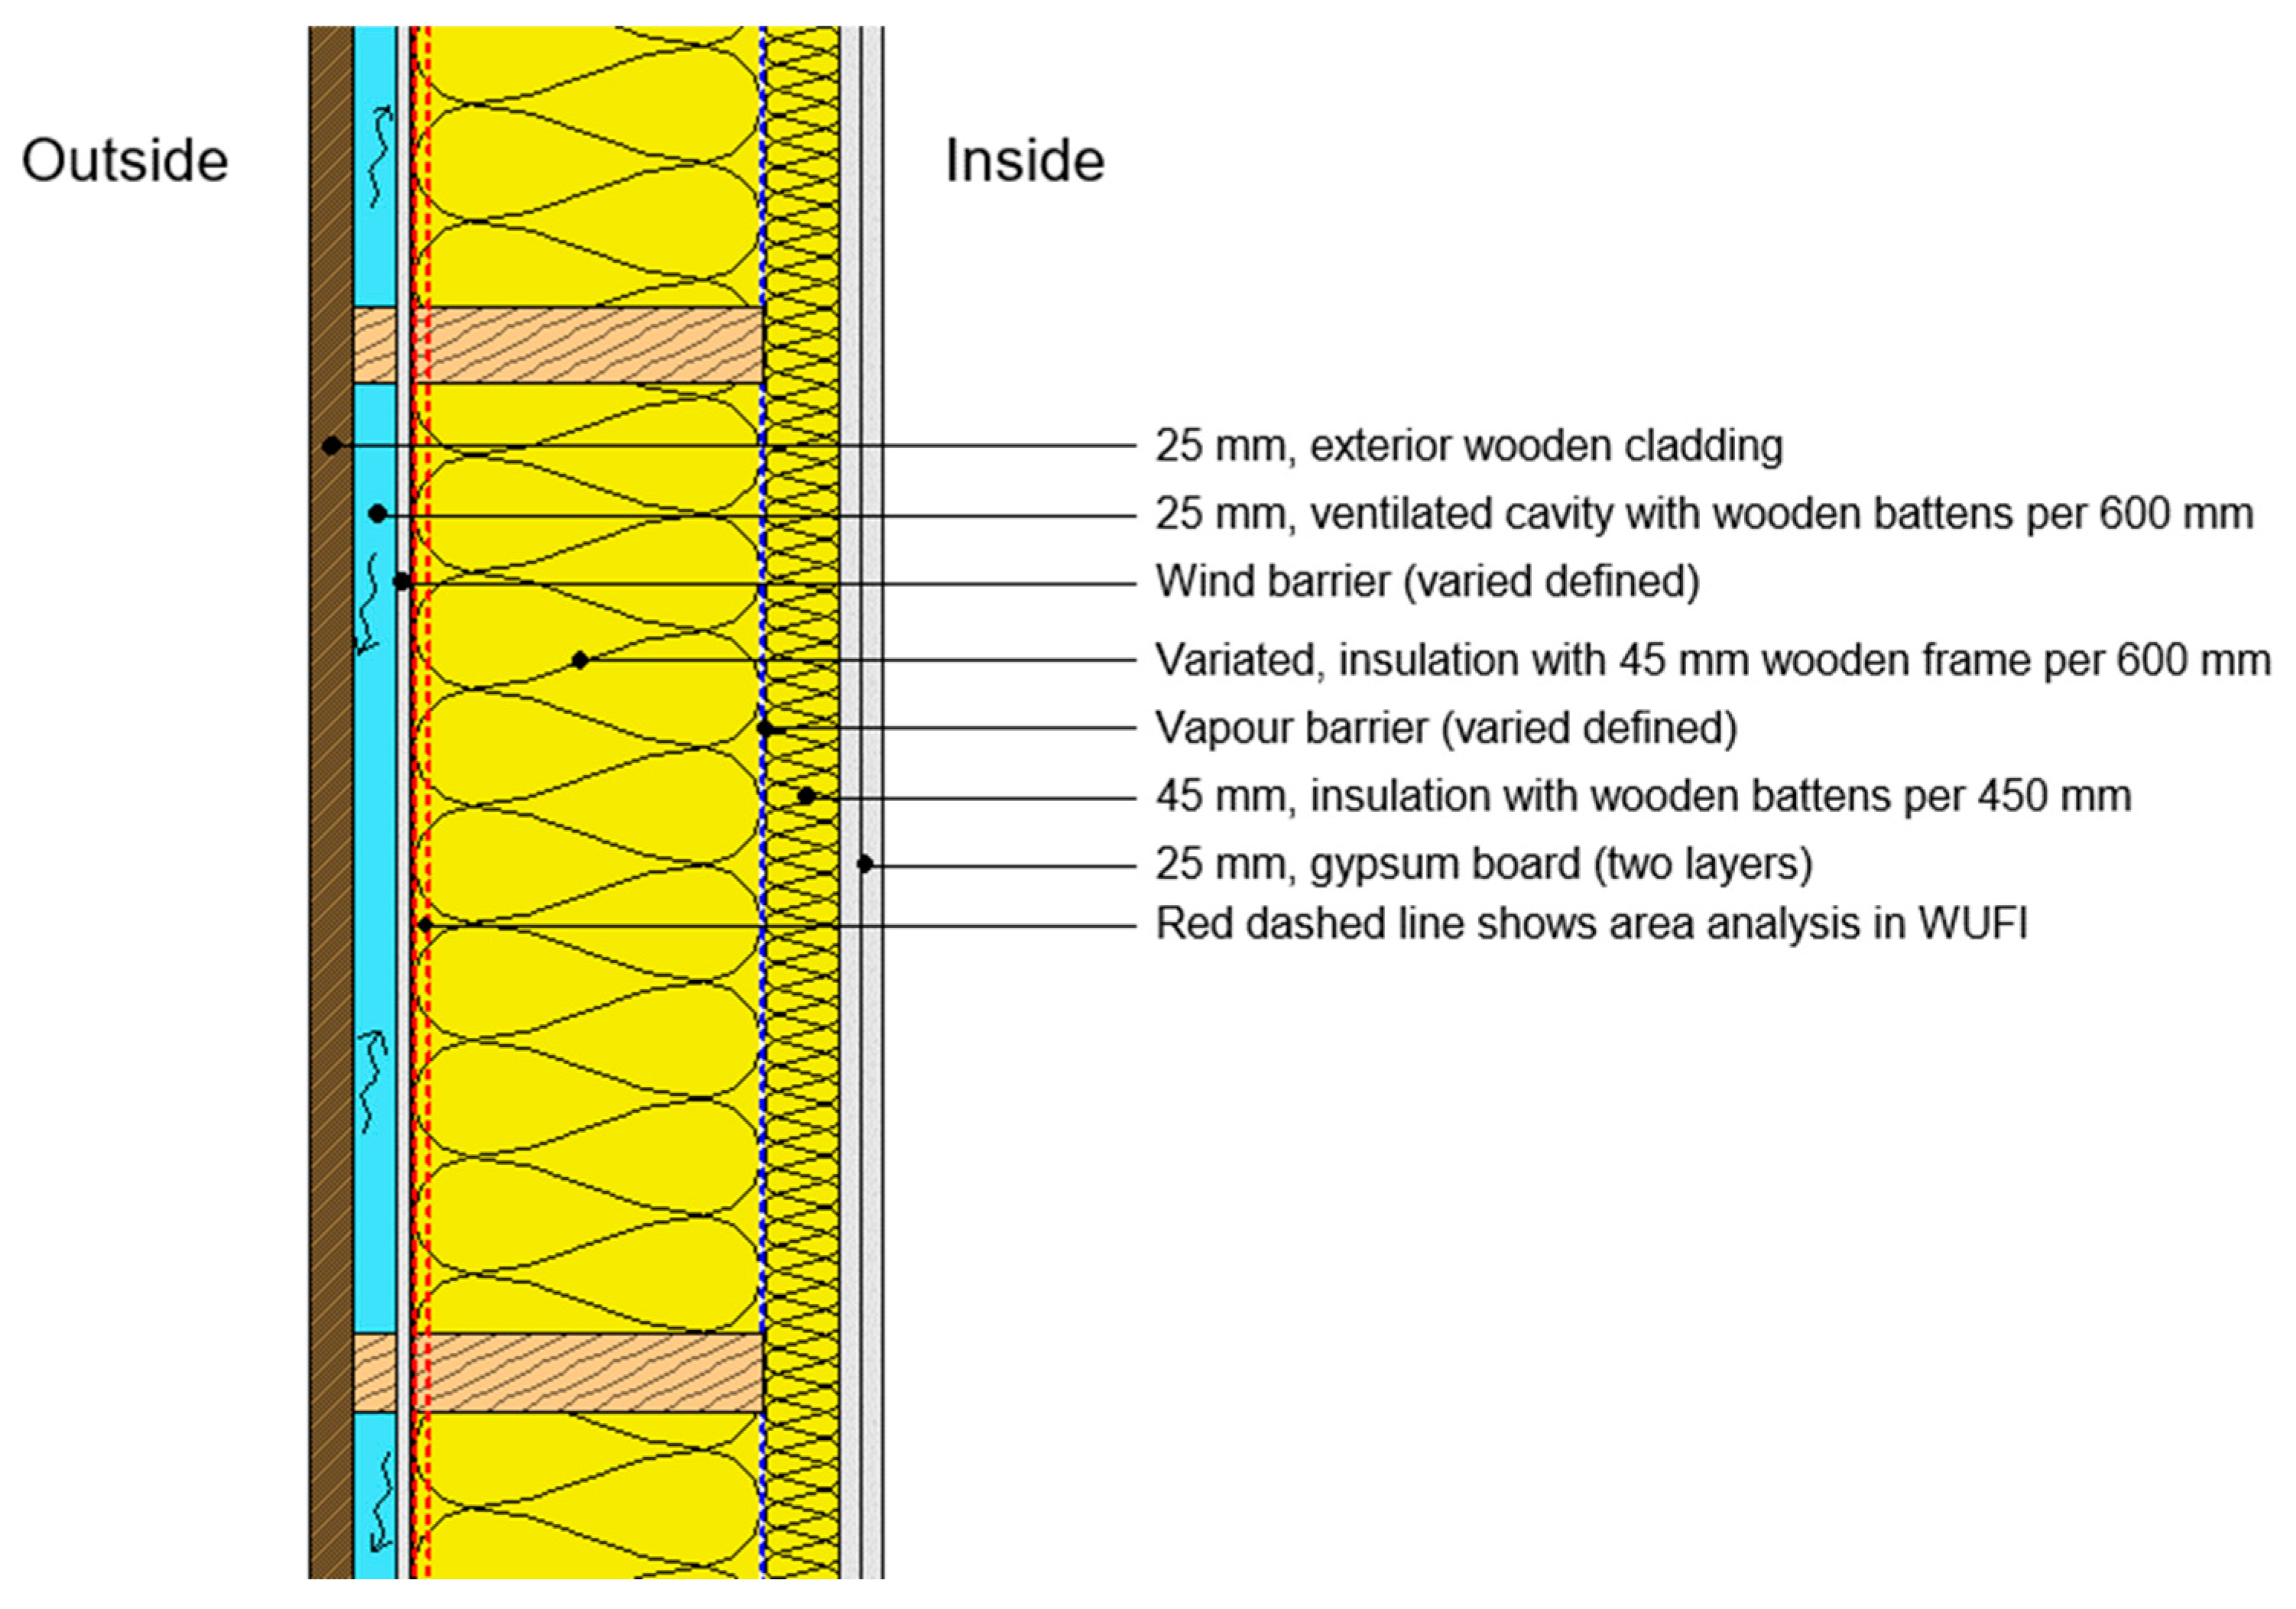
Figure 1 presents the investigated horizontal wall section, with the wind and vapour-barrier placements. From the exterior, the wall was constructed with 25 mm wooden cladding, a 25 mm ventilated cavity, a wind barrier, thermal insulation between the wooden stud frame c-c of 600 mm, a vapour barrier, 45 mm thermal insulation between the wooden studs, and 2 × 12.5 mm gypsum boards. In Denmark, this design is common for the construction of an exterior wood-frame wall with a thermal transmittance of approximately 0.10 to 0.15 W/m2 K.
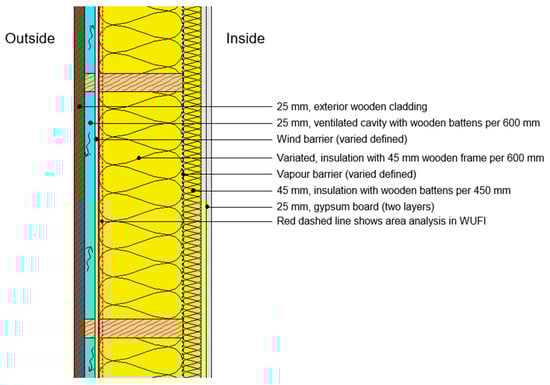
Figure 1.
Horizontal section of an exterior wood-frame wall, a common construction in Denmark.
The wood-frame walls were designed to meet U-values of 0.15 and 0.10 W/m2 K using mineral wool, hemp, flax, straw, grass, and wood fibre as thermal insulation. Table 1 lists the design parameters for walls with U-values of 0.15 and 0.10 W/m2 K. Table 2 presents the parameters for each thermal insulation material used for the calculations and analysis. The wood frame makes up 7.5% of the total construction and has a thermal conductivity of 12 W/m K, where the insulation makes up 92.5% of the wood frame.

Table 1.
Wood-frame wall design properties with U-values of 0.15 and 0.10 W/m2 K using mineral wool, hemp, flax, straw, grass, and wood fibre thermal insulation material.
Table 2.
Properties for materials used for the simulation in WUFI Pro.
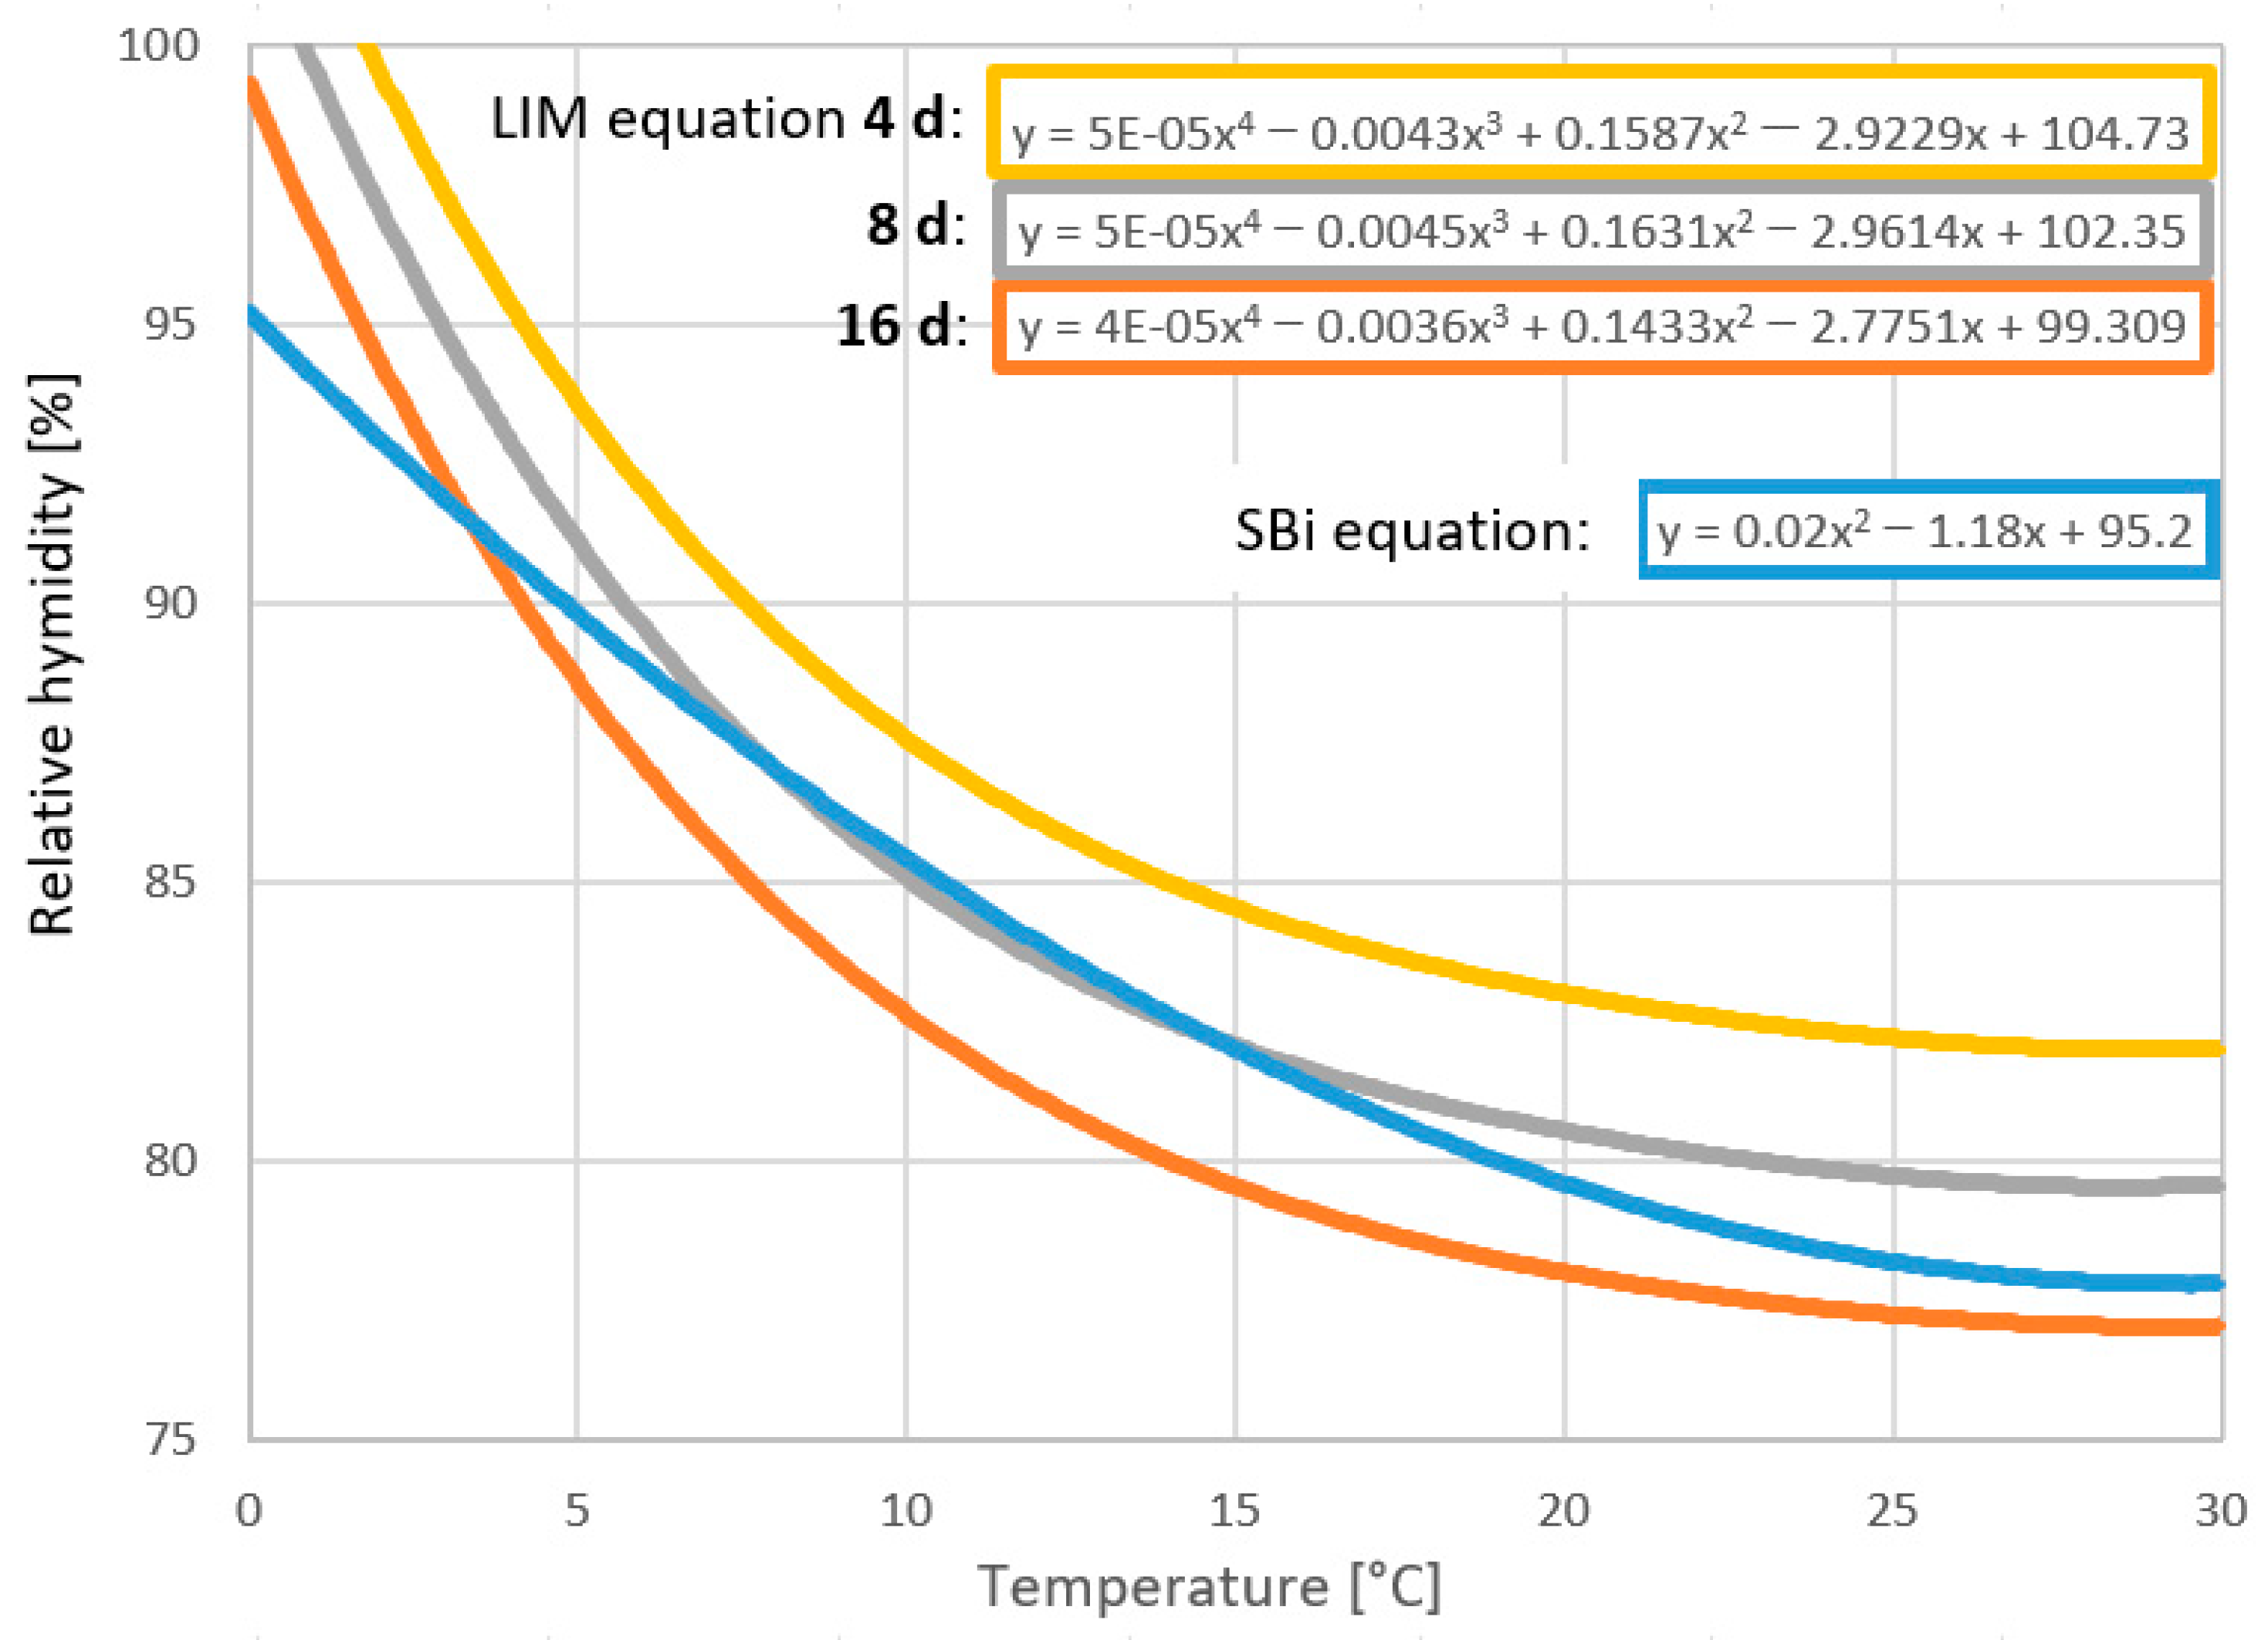
The analyses were conducted using the material descriptions in WUFI Pro for thermal insulation materials. The analyses included the lowest isopleth for mould growth (LIM) curves for 4, 8, and 16 days [15], and the SBi equation [12].
2.2. Material Properties
The calculation program WUFI Pro uses the water-vapour resistance factor for a material in the calculations. The parameter study is carried out by changing the μ-value in WUFI Pro prior to a calculation corresponding to the desired Z-value for a wind and vapour barrier.
2.3. Models for Mould Growth Risk Analysis
The risk of mould growth was assessed using the isopleth models described by Sedlbauer in 2001 [15] and the equation described in the SBi guidelines [12]. The isopleth system [15] was applied as one of the methods to assess and analyse the mould growth risk in external wall constructions. This model was selected because static models are often more reliable than dynamic mould growth models [16], and the mould growth model by Sedlbauer [15] is a conservative choice for the mould model [17,18].
Hygrothermal simulations were conducted using WUFI Pro to assess and analyse the exterior wall. The data were extracted and processed using equations from the isopleth system with LIM limits. For the calculations, the isopleth curve equations were formed from the isopleth curves shown in Figure 2.
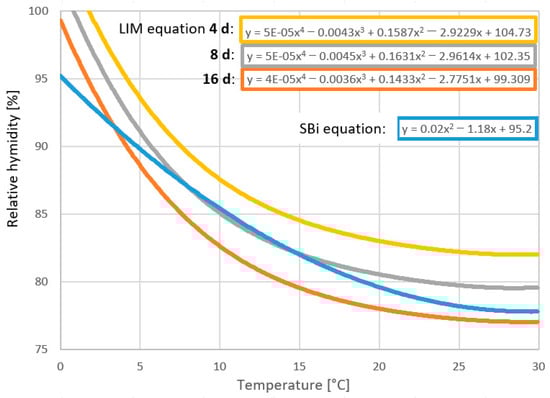
Figure 2.
Isopleth system based on lowest isopleth for mould (LIM) curves representing 4, 8, and 16 days and the SBi equation for the calculations determining the risk of mould growth.
This paper applies the descriptions for the isopleth described for substrate group I [15], including biologically recyclable and degradable building materials and raw materials, corresponding to the materials in the analysed wall constructions. In addition to the isopleth model described in [15], the analysis method from SBi [12], defined as an equation, was also applied as an analysis method to assess the risk of mould growth.
When analysing the calculated result limits for relative humidity that were over 100%, the results were interpreted as 100%. The SBi equation is described as follows:
where RFcrit denotes the critical relative humidity for mould growth for wood-based materials and θ represents the temperature in °C.
RFcrit = 0.02 × θ2 − 1.18 × θ + 95.2,
The limit value for the number of days with a risk of mould growth according to the formula from the SBi instructions regarding moisture, 8 days with a risk of mould growth are chosen on the basis of the comparison with the isopleth curve limits. Isopleth limit values for the 8-day curve agree well with the formula from the SBi instructions regarding humidity when comparing the calculated limit values for relative humidity.
Table 3 shows the results for all insulation materials, with a Z-value of 1 GPa s m2/kg for the wind barrier, in moisture load class 1–5, as well as the U-values 0.15 W/m2 K and 0.10 W/m2 K. Table 4 lists the required vapour-barrier Z-value tabulated using numerous calculations while varying the wind-barrier Z-value from 1 to 8 GPa s m2/kg, which are typical values for wind barriers according to SBi [12]. The required vapour-barrier Z-value was found through a series of calculations, creating a wall with no mould growth risk behind the wind barrier. The analyses applied LIM curves for 4, 8, and 16 days, and the SBi equation. The required vapour-barrier Z-value fulfils all four criteria, indicating no risk of mould growth behind the wind barrier.
Table 3.
Required Z-value ratio between wind and vapour barriers. Results that exceed the guidelines assuming no to minimal risk of mould growth behind a wind barrier exposed to a moisture load class 3 is marked pink and marked red for a moisture load class 1 and 2.
Table 4.
Required Z-value ratio of the wind and vapour barriers. Results that exceed the guidelines assuming no to minimal risk of mould growth behind a wind barrier exposed to a moisture load class 3 is marked pink.
2.4. Calculation Method and Boundary Conditions
Calculations were carried out using the program WUFI Pro, which performs one-dimensional hygrothermal calculations on the cross sections of building parts. Simulations in WUFI Pro were primarily conducted over a three-year period, where the construction became period-stable in the third year. The initial conditions for the simulations were a temperature of 20 °C and a relative humidity of 80%. The analyses were based on data extracted from WUFI Pro based on the outermost 10 mm of the thermal insulation layer, as marked in Figure 1 by the red-dotted area of the thermal insulation behind the wind barrier. The data extracted from WUFI Pro were based on hourly values, which were converted to 24 h average values to simplify the analysis and assess the mould growth risk. This processing method eliminated the calculated data peak values. The results represent the average value of the outermost 10 mm of the wall.
The location for simulations of outdoor conditions was Sjælsmark in Zealand, north of Copenhagen in Denmark. The weather data for the simulation in WUFI Pro were released in 2023 [19] and were used for the outdoor climate, simulating the moisture conditions for the individual walls.
3. Results
For the results in Table 3, a Z-value of 1 GPa s m2/kg was used for the wind barrier to calculate the necessary vapour-barrier Z-value. All thermal insulation materials were calculated individually as the thermal insulation in the wall construction with a U-value of 0.15 or 0.10 W/m2 K, respectively (Table 1). Calculations were conducted for an exterior wall facing north exposed to interior moisture load classes from 1 to 5 in [20]. The north orientation has the highest risk of humidification, although facades facing southwest have the greatest load from driving rain [21]. Moisture load classes of 1 to 5 were applied for calculations of a wall with a U-value of 0.15 W/m2 K. In comparison, the moisture load classes of 2 and 3 were used for calculations of a wall with a U-value of 0.10 W/m2 K.
Table 4 presents the results calculating the necessary vapour-barrier Z-value for a wind barrier with Z-values of 1, 2, 3, 4, 5, 6, 7, and 8 GPa s m2/kg. The analyses were conducted using mineral wool, wood fibre, and flax as the thermal insulation materials in the wall construction with a U-value of 0.15 W/m2 K and an internal moisture load class of 3.
Most of the results in Table 3 can be predicted from having a continuous course for the individual moisture load classes, except for a few. These results marked with a (*) are difficult to explain. When reviewing the results, it appears that there are shorter periods with a risk of mould growth, and in others there are longer continuous periods with a risk of mould growth. The results that exceed the guidelines that include the assumption that an exterior wall construction with a vapour-barrier Z-value that is 10 times higher than the wind-barrier Z-value has no to minimal risk of mould growth behind a wind barrier exposed to a moisture load class of 3 is marked pink. The results that exceed the guidelines that include exposure to a moisture load class of 1 and 2 for an exterior wall that is not considered to be at risk of mould growth behind a wind barrier if the Z-value of the vapour barrier is 5 times higher than that of the wind barrier is marked red [11,12].
Table 4 shows wood fibre and flax to have a parallel increase in the Z-value of the vapour barrier, where the wood fibre ranged from 6 to 18 GPa s m2/kg, and the flax ranged from 12 to 24 GPa s m2/kg. Mineral wool has an increase in the Z-value of the vapour barrier ranging from 10 to 16 GPa s m2/kg, creating the largest change in the Z-value ratio (from 1:10 to 1:2).
4. Discussion
This study was conducted as a pure simulation study, to investigate the relation between the wind and vapour barrier under different indoor climate conditions and thermal insulation materials, i.e., biogenic insulation materials. For several years, the vapour barrier of PE-foil has been the standard in common practice. Today, many practitioners challenge the PE-foil and opt out of the PE-foil in favour of other materials, e.g., vapour retarders of paper, intelligent vapour barriers, and wooden boards. One could argue that using PE-foil is the safe solution. This building practice is given in the publication on common building practices [11] and new knowledge is needed when the PE-foil is changed to another material. Therefore, this parameter study investigated the relation between the wind barrier and vapour barrier in regard to the vapour diffusion resistance. The aim of the study was not to investigate specific materials, thus contributing to the knowledge of the threshold values under different design considerations, which can be used when designing and choosing materials. The study assumed perfect wall designs with no air leakages from the inside or rain ingress from the outside. These two parameters are very difficult to determine; however, they are very relevant for the performance of the structure. In this study, rain ingress and air leakage were considered to result from failures in the structure, as walls with larger air leakage or rain penetration typically fail over time.
4.1. Properties of Biogenic Thermal Insulation Materials
All materials used for the calculations in the moisture analysis were described and included in the WUFI Pro material database. Material characteristics for hemp and flax were defined almost identically in WUFI Pro; however, better suggestions describing sorption curves were not found. Therefore, the results using hemp and flax demonstrate no significant difference when used as thermal insulation in a wood-frame wall. All material changes in WUFI Pro for this article are listed in the background report [22].
In contrast, the parameters of density and water-vapour diffusion resistance are crucial, aligning with the previous literature results in this area [23]. This study investigates the most critical material properties of biogenic thermal insulation materials that influence the moisture–robustness of exterior wood-frame walls constructed without a vapour barrier [23]. Determining the high diffusion resistance of the thermal insulation and the high moisture capacity of the thermal insulation material at a relative humidity between 60% and 90% is crucial. For these calculations, straw has the highest density of the studied thermal insulation materials, and wood fibre has the highest water-vapour diffusion resistance. Both of these materials were calculated to have the lowest required Z-value ratio out of all investigated thermal insulation materials.
Depending on the thermal insulation material, various mould prediction models indicate a mould growth risk. Hence, several models were applied to assess the wall performance. Mineral wool, hemp, and flax results are given based on the SBi moisture instructions, and on an assessment of an 8 day timeline [12]. The difference in the Z-value between the SBi and LIM models can reach 5 GPa s m2/kg. Wood fibre had the highest vapour diffusion resistance (µ = 4) of all thermal insulation materials in the study. Moisture was stored in the thermal insulation material, increasing the relative humidity; thus, it was close to the lower limit for mould growth and interacted with the 16-day limit curve sporadically.
The use of wood fibre insulation in the construction in previous experiments has revealed that wood fibre insulation without a vapour barrier has a lower relative humidity in the construction than a corresponding construction with mineral wool and polyethene foil as a vapour barrier [24].
4.2. Insulation Materials and Z-Value Ratio
In Denmark, the Z-value ratio between the wind and vapour barriers, as an instruction, is 1:10 and is valid for a moisture load class of 3. Detailed hygrothermal simulations must be conducted for moisture load classes of 4 and 5. In moisture load classes of 1 and 2, the instruction is 1:5. The instruction for a moisture load class of 3 has been challenged for biogenic thermal insulation materials. The results reveal that, with low wind-barrier Z-values, the ratio should be higher than for higher wind-barrier Z-values. However, the required vapour-barrier Z-value should be higher than the 1:10 ratio for wind barriers with a Z-value approaching 1 GPa s m2/kg (Table 3 and Table 4). For example, the ratio is 1:12 for flax, which requires a vapour barrier with a Z-value of 12 GPa s m2/kg (Table 4). In contrast, using a wind barrier with a Z-value of 8 GPa s m2/kg a Z-value and a vapour barrier with a Z-value of 24 GPa s m2/kg was sufficient, revealing a 1:3 ratio. The results were in line with normal considerations, and moisture that penetrates the construction must be able to leave the construction easily.
The six thermal insulation materials were divided into two groups in terms of the required Z-value ratio. Biogenic thermal insulation materials, such as straw and wood fibre, display similar trends. In addition, flax, grass, and hemp also have similar trends, whereas mineral wool falls into both groups, depending on the moisture load class and the Z-value of the wind barrier.
An increase in the wind-barrier Z-value lowered the required Z-value ratio between the wind and vapour barriers for an exterior wood-frame wall. Thermal insulation materials, such as wood fibre, mineral wool, and flax, in a wall with a U-value of 0.15 W/m2 K, reached a Z-value ratio between 1:2 and 1:3 for a wind barrier approaching a Z-value of 8 GPa s m2/kg (Table 4). By lowering the Z-value of the wind barrier to less than 2 GPa s m2/kg (approaching 1 GPa s m2/kg), the Z-value ratio between the wind and vapour barriers rises rapidly (Table 4).
New materials used as wind barriers (e.g., biogenic wind barriers) have Z-values below 1 GPa s m2/kg. Such wind barriers in exterior wood-frame walls thermally insulated with biogenic materials with a U-value of 0.15 W/m2 K or lower and a moisture load class of 3 do not apply to the instruction of 1:10 in the ratio between the wind and vapour barriers [12]. The ratio must be higher (Table 4).
4.3. Moisture Classes and U-Values
The predominant thermal insulation in Denmark in recent years has been mineral wool (i.e., glass and stone wool). Recently, biogenic thermal insulation materials have been used more often. The thermal transmittance of the exterior wood-frame wall depends on the insulation thickness and conductivity, which vary from 0.037 to 0.048 W/m K for biogenic thermal insulation materials (Table 2). Therefore, in the design phase of wood-frame walls, one insulation material cannot be assumed one-to-one substitutable because this variability influences the U-value. In Denmark, a Z-value ratio of 1:10 is applied to walls independent of the U-values. The results indicate that the U-value influences the ratio between the wind and vapour barriers. Lowering the U-value of the wall from 0.15 to 0.10 W/m2 K changes the performance of exterior wood-frame walls (Table 3 and Table 4).
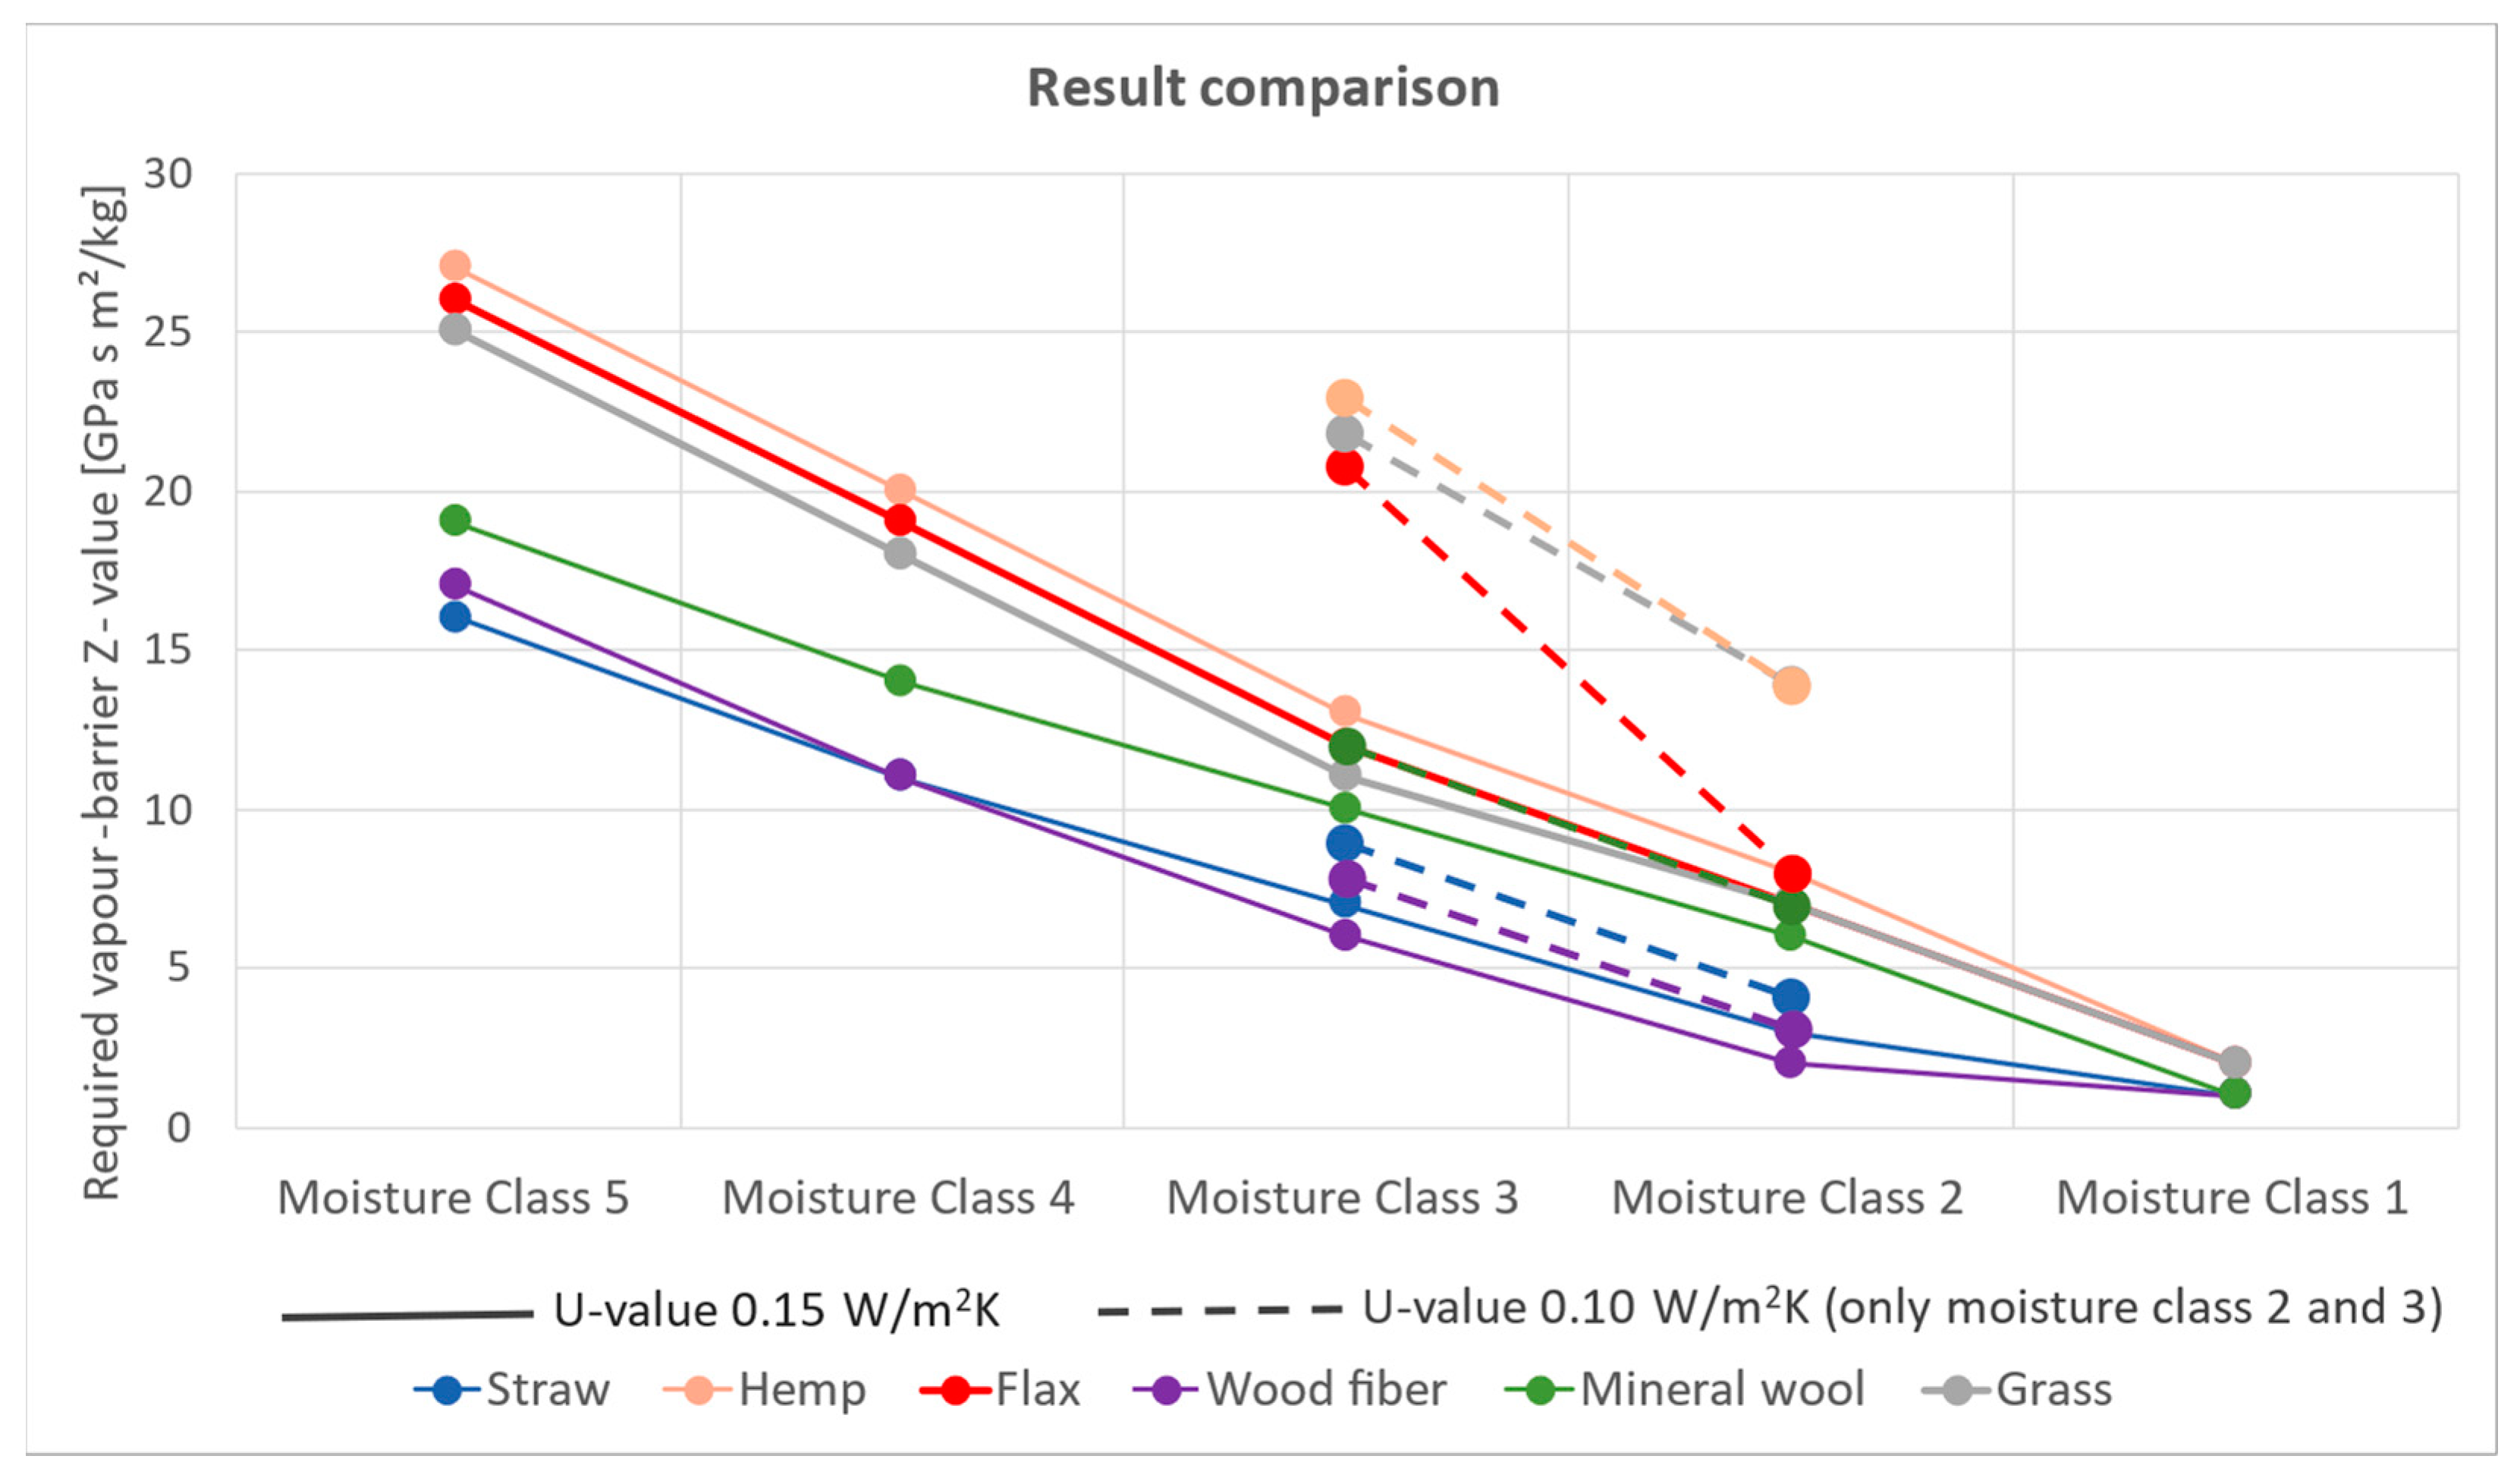
Figure 3 illustrates that, with better insulated walls, the vapour-barrier Z-value must be higher than for less insulated walls in an identical moisture class. For wood-frame walls with identical U-values but different moisture classes, the vapour barrier must have a higher Z-value in higher moisture classes. The assessment point in the wall is behind the wind barrier, and an increased insulation thickness entails lower temperatures behind the wind barrier and smaller changes in the vapour pressure. For low U-values, minor heat loss (heat flow) occurs, driving the moisture out of the structure; hence, a vapour barrier with a higher Z-value is necessary. The analyses with a U-value of 0.15 W/m2 K in moisture load class 3 demonstrated that the Z-value ratio for biogenic insulation materials was both higher and lower than a wall construction with mineral wool as the thermal insulation material. The Z-value ratios for the biogenic insulation materials shown in Table 3 ranged from 1:6 (wood fibre) to 1:13 (hemp) with a wind-barrier Z-value of 1.0 GPa s m2/kg.
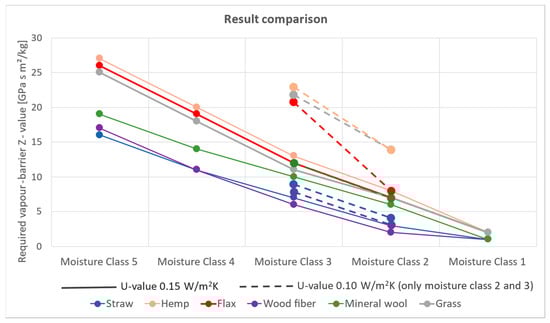
Figure 3.
Results for the required vapour-barrier Z-value for an exterior wood-frame wall, thermally insulated with wood fibre, straw, mineral wool, flax, grass, and hemp with U-values of 0.15 and 0.10 W/m2 K exposed to moisture load classes of 1, 2, 3, 4, and 5. The wind-barrier Z-value was 1.0 GPa s m2/kg.
The insulation materials were further analysed for moisture load classes of 2 and 3, with a U-value of 0.10 W/m2 K. However, this study found that the required Z-value ratio increases when the U-value lowers from 0.15 to 0.10 W/m2 K. Moreover, the required Z-value ratio decreases when the moisture load class decreases from 3 to 2, as depicted in Figure 3.
4.4. Z-Value Ratio
The instruction of 1:10 for the Z-value ratio between wind and vapour barriers is conservative in a moisture load class of 3 for wood-frame walls with a U-value of 0.15 W/m2 K. Wind barriers, i.e., non-biogenic barriers, typically have Z-values of about 1 GPa s m2/kg or higher. The required vapour-barrier Z-value depends on the thermal insulation material, the wind-barrier Z-value, and the heat loss of the wall given by the U-value, expressing the heat that flows through the construction. The tendency for new wind-barrier products is that they are more open to water-vapour diffusion (lower than 1 GPa s m2/kg) than the commonly used wind barriers, indicating that the 1:10 ratio is not representative of these wind barriers.
5. Conclusions
This paper presents the WUFI Pro calculations determining the moisture performance of exterior lightweight walls exposed to moisture load classes from 1 to 5. Several biogenic materials and mineral wool were applied as the thermal insulation of the wall. The results indicate that the required vapour-barrier Z-value can be reduced considerably for wood-frame walls with a similar U-value, changing the exposure from a moisture load class of 5 to 1 for a fixed wind-barrier Z-value. Conversely, the required vapour-barrier Z-value increased for a decreased U-value of the wall construction from 0.15 to 0.10 W/m2 K with exposure to similar moisture classes.
Introducing biogenic materials as the thermal insulation in wood-frame walls can change the way walls are designed in the future. This paper reveals the requirements for the water-vapour diffusion resistance of the vapour barrier as a function of that of the wind barrier. Using the requirements that make up the instruction is considered good practice, but in designing exterior walls, this is not adequate. For the requirement determining the ratio of the water-vapour diffusion resistance between the wind and vapour barriers, the ratio depends on the nature of the thermal insulation material, the water-vapour diffusion resistance of the wind barrier, the heat loss of the wall (U-value), the moisture load class, and the exterior climate. Depending on the nature of the biogenic thermal insulation material, the vapour-barrier Z-value varies between 6 and 13 GPa s m2/kg, using a wind barrier with a Z-value of 1 GPa s m2/kg for a wood-frame wall with the U-value of 0.15 W/m2 K exposed to a moisture class of 3. Guidelines in Denmark include an assumption that an exterior wall construction with a vapour-barrier Z-value that is 10 times higher than the wind-barrier Z-value has no to minimal risk of mould growth exposed to a moisture load class of 3 [11,12]. The parameter study reveals that this instruction is rather conservative for high wind-barrier Z-values ranging between 2 to 8 GPa s m2/kg. In addition, the parameter study reveals that this instruction is not adequate for lower wind-barrier Z-values ranging below 1.5 GPa s m2/kg, providing the need for further evaluations and analyses of a specific wall construction prior to execution to avoid the risk of mould growth.
This paper reveals that biogenic materials can be used for thermal insulation in exterior wood-frame walls, which meet the requirement for a construction that is robust to moisture in cold climates exposed to a moisture class of 1 to 5, as described by [20]. Further, depending on the nature of the thermal insulation material, the water-vapour diffusion resistance of the wind barrier, the heat loss of the wall, and the moisture load class, several materials that are rarely used as vapour barriers today (e.g., some types of laminated veneer lumber and oriented strand board) can be used as vapour barriers if they can be mounted in a sufficiently airtight manner during construction. However, the water-vapour diffusion resistance of the vapour barrier must be higher than that of the wind barrier, and the water-vapour diffusion resistance must decrease through the exterior wall from inside and out in cold climates. Additionally, it is absolutely necessary that moisture that penetrates into the thermal insulation of the exterior wall must have less resistance leaving towards the exterior side of the wall.
Author Contributions
Conceptualization S.S.H., M.A.T., T.V.R. and M.M.; methodology S.S.H., M.A.T., T.V.R. and M.M.; resources and writing—original draft preparation S.S.H. and M.A.T.; writing—review and editing T.V.R. and M.M.; supervising, writing—original draft preparation, T.V.R. and M.M.; validation, formal analysis, investigation, and data curation, S.S.H. and M.A.T. All authors have read and agreed to the published version of the manuscript.
Funding
This research received no external funding.
Data Availability Statement
Data are reported in Danish: https://kbdk-aub.primo.exlibrisgroup.com/permalink/45KBDK_AUB/a7me0f/alma9921565428205762 (accessed on 3 October 2024).
Conflicts of Interest
The authors declare no conflicts of interest.
References
- Brandt, E.; Møller, E.B.; Due, L. Installation of Vapour Barriers in Existing Buildings—Obstacles and Solutions. In Proceedings of the 5th International Conference on Building Physics (IBPC): Role of Building Physics in Resolving Carbon Reduction Challenge and Promoting Human Health in Buildings, Kyoto University, Kyoto, Japan, 28–31 May 2012; pp. 449–456. [Google Scholar]
- Møller, E.; Rasmussen, T. Testing Joints of Air and Vapour Barriers, Do We Use Relevant Testing Methods? In Proceedings of the Current Topics and Trends on Durability of Building Materials and Components: XV Edition of the International Conference on Durability of Building Materials and Components (DBMC 2020), Barcelona, Spain, 20–23 October 2020. [Google Scholar]
- Trewartha, G.T.; Horn, L.H. Introduction to Climate, 5th ed.; McGraw Hill: New York, NY, USA, 1980. [Google Scholar]
- McColl, R.W. Encyclopedia of World Geography; Facts on File, Inc.: New York, NY, USA, 2005; ISBN 0-8160-5786-9. [Google Scholar]
- BR18. Bekendtgørelse af Offentliggørelse af Bygningsreglement 2018 (Danish Building Regulations, in Danish); Trafik-, Bygge-og Boligstyrelsen: Copenhagen, Denmark, 2017. [Google Scholar]
- Quirouette, R.L. The difference between a vapour barrier and an air barrier. National Research Council Canada, Divisions of Building Research. Build. Pract. Note 1985, 54, 13. [Google Scholar] [CrossRef]
- Morelli, M.; Rasmussen, T.V.; Therkelsen, M. Exterior wood frame walls—Wind–vapour barrier ratio in Denmark. Buildings 2021, 11, 428. [Google Scholar] [CrossRef]
- Rasmussen, T.V.; Hansen, T.K.; Shashoua, Y.; Ottosen, L.M.; Pedersen, L.G.; Nielsen, J.K.; Steenstrup, F.R. Performance of polyethylene vapour barrier systems in temperate climates. Buildings 2022, 12, 1768. [Google Scholar] [CrossRef]
- Rasmussen, T.V.; Hansen, T.K.; Nielsen, J.K.; Steenstrup, F.R.; Ottosen, L.M.; Petersen, L.G.; Shashoua, Y. Long-Term Performances of New and Regenerated Polyethylene Membranes Used as Vapour Barriers in Temperate Climates. In Proceedings of the 2022 Thermal Performance of the Exterior Envelopes of Whole Buildings XV International Conference, Clearwater Beach, FL, USA, 5–8 December 2022; pp. 157–165, [C018] American Society of Heating, Refrigeration, and Air-Conditioning Engineers (ASHRAE). Thermal Performance of the Exterior Envelopes of Whole Buildings. Available online: https://www.ashrae.org/File%20Library/Conferences/Specialty%20Conferences/Buildings%20XV%20-%20Papers/C018.pdf (accessed on 4 May 2024).
- Rasmussen, T.V.; Thybring, E.E.; Bentsen, N.S.; Nord-Larsen, T.; Jørgensen, U.; Bruhn, A.; Gottlieb, S.C. Negative Emission Potentials Using Biogenic Building Materials—A Case Study from Denmark. In Proceedings of the XVI International Conference on Durability of Building Materials and Components, DBMC 2023, Beijing, China, 10–13 October 2023. [Google Scholar]
- Brandt, E.; Bunch-Nielsen, T.; Hansen, T.K.; Morelli, M.; Nielsen, A.; Sebastian, W. SBI-Anvisning 279, Fugt i Bygninger—Bygningsdele; BUILD, Aalborg University: København, Denmark, 2023. [Google Scholar]
- Brandt, E.; Bunch-Nielsen, T.; Hansen, T.K.; Morelli, M.; Nielsen, A. SBI-Anvisning 277, Fugt i Bygninger—Teori, Beregninger og Undersøgelser; BUILD, Aalborg University: København, Denmark, 2023. [Google Scholar]
- Vanpachtenbeke, M.; Langmans, J.; Van den Bulcke, J.; Van Acker, J.; Roels, S. On the hygrothermal behaviour of brick veneer cladded timber frame walls: The role of the vapour diffusion resistance of the wind barrier. In Proceedings of the 7th International Building Physics Conference, Syracuse, NY, USA, 23–26 September 2018; pp. 235–240. [Google Scholar]
- Vinha, J. Hygrothermal Performance of Timber-Framed External Walls in Finnish Climatic Conditions: A Method for Determining the Sufficient Water Vapour Resistance of the Interior Lining of a Wall Assembly. Ph.D. Thesis, Tampere University of Technology, Tampere, Finland, 2007. [Google Scholar]
- Sedlbauer, K. Prediction of Mould Growth by Hygrothermal Calculation; Fraunhofer-Institute for Building Physics: Holzkirchen, Germany, 2001. [Google Scholar]
- Johansson, P.; Lång, L.; Capener, C.-M. How well do mould models predict mould growth in buildings, considering the end-user perspective? J. Build. Eng. 2021, 40, 102301. [Google Scholar] [CrossRef]
- Vereecken, E.; Roels, S. Review of mould prediction models and their influence on mould risk evaluation. Build. Environ. 2011, 15, 296–310. [Google Scholar] [CrossRef]
- Vereecken, E.; Vanoirbeek, K.; Roels, S. A preliminary evaluation of mould prediction models based on laboratory experiments. Energy Procedia 2015, 78, 1407–1412. [Google Scholar] [CrossRef]
- Jensen, N.F.; Hansen, T.K.; Morelli, M.; Svane, A.M.; Waagepetersen, R. Klimadata til Fugtsimuleringer: Referenceår; BUILD, Aalborg University: København, Denmark, 2023. [Google Scholar]
- DS/EN ISO 13788. (2nd edition, 07.03.2013); Hygrothermal Performance of Building Components and Building Elements—Internal Surface Temperature to Avoid Critical Surface Humidity and Interstitial Condensation—Calculation Methods. Danish Standards: Copenhagen, Denmark.
- Mundt Petersen, S. Moisture Safety in Wood Frame Walls: Blind Evaluation of the Hygrothermal Calculation Tool Wufi 5.0 Using Field Measurements and Determination of Factors Affecting the Moisture Safety; Byggnadsfysik LTH, Lunds Tekniska Högskola: Lund, Sweden, 2013. [Google Scholar]
- Hansen, S.; Thomsen, M.A. Use of Biogenic Insulation Materials in Exterior Wall Constructions: Moisture-Resistant Exterior Wall Construction—Z-Value Considerations between the Density Plane, on the Warm Side of the Exterior Wall Structures and the Wind Barrier. Master’s Thesis, Aalborg University, Aalborg, Denmark, 2023. Available online: https://kbdk-aub.primo.exlibrisgroup.com/permalink/45KBDK_AUB/a7me0f/alma9921565428205762 (accessed on 12 April 2024).
- Leszmann, A.E.; Morelli, M.; Rasmussen, T.V. Moisture performance requirements for insulation in exterior wood-frame walls without a vapour barrier. J. Phys. Conf. Ser. 2023, 2654, 012115. [Google Scholar] [CrossRef]
- Latif, E.; Lawrence, R.; Shea, A.; Walker, P. An experimental investigation into the comparative hygrothermal performance of wall panels incorporating wood fibre, mineral wool. Energy Build. 2018, 165, 76–91. [Google Scholar] [CrossRef]
Disclaimer/Publisher’s Note: The statements, opinions and data contained in all publications are solely those of the individual author(s) and contributor(s) and not of MDPI and/or the editor(s). MDPI and/or the editor(s) disclaim responsibility for any injury to people or property resulting from any ideas, methods, instructions or products referred to in the content. |
© 2024 by the authors. Licensee MDPI, Basel, Switzerland. This article is an open access article distributed under the terms and conditions of the Creative Commons Attribution (CC BY) license (https://creativecommons.org/licenses/by/4.0/).