Article

Structural Behaviour and Mechanical Characteristics of BlueDeck Profiled Steel Sheeting for Use in Composite Flooring Systems

by
Harry Far
*,
Shami Nejadi
and
Suleiman A. Al-Hunaity
School of Civil and Environmental Engineering, Faculty of Engineering and Information Technology, University of Technology Sydney (UTS), Ultimo, NSW 2007, Australia
*
Author to whom correspondence should be addressed.
Buildings 2024, 14(10), 3204; https://doi.org/10.3390/buildings14103204
Submission received: 15 August 2024 / Revised: 4 October 2024 / Accepted: 5 October 2024 / Published: 9 October 2024
(This article belongs to the Section Building Structures)

Abstract

:
The BlueDeck profiled steel sheeting system offers an innovative composite flooring solution, integrating high-strength steel sheets with reinforced concrete to form a unified structure. This study aimed to evaluate the development of full composite action, the ultimate bearing capacity, and the flexural stiffness of the system. A comprehensive experimental programme involving 18 four-point bending tests and 6 shear tests was conducted to quantify the mechanical interaction between the steel deck and concrete slab. This study specifically examined bending capacity and vertical deflection, comparing the results with predictions from AS/NZS 2327. It was found that the system consistently achieved full composite action, with composite specimens demonstrating higher flexural stiffness and load-bearing capacity as the concrete depth increased. For example, specimens with 200 mm slab depths exhibited a 60% improvement in ultimate capacity compared to those with 150 mm slabs, while those with 175 mm depths saw a 27% increase. Additionally, the BlueDeck system showed an 81% improvement in de-bonding resistance in thicker slabs. The experimental results exceeded the bending moment and deflection limits prescribed by AS/NZS 2327, confirming that the system is structurally sound for use in buildings. This study provides quantitative evidence supporting the system’s compliance with Australian standards, highlighting its potential for improving construction efficiency through reduced material use, while maintaining structural integrity under imposed loads.

1. Introduction

Modular construction, employing prefabricated structural systems, is gaining significant traction in the construction industry due to its numerous advantages, including improved quality control, environmental sustainability, efficient material use, and reduced construction timelines [1,2,3,4]. For instance, Chourasia et al. [2] observed a 50% reduction in construction time and a 20% cost savings when using prefabricated structural systems compared to conventional methods. Additionally, Tam et al. [5] reported an 84% decrease in material usage for prefabricated systems. These systems present a viable and sustainable solution to the challenges posed by increasing urban populations, limited land availability, and resource depletion [6,7,8]. Consequently, their adoption has been expanding globally, particularly in countries such as Australia, the United States, Singapore, and the United Kingdom [2]. Furthermore, Lawson et al. [9] emphasised the suitability of prefabricated structural systems for buildings with repetitive units and potential for vertical expansion, such as car parks, educational institutions, residential apartments, and office spaces.
Prefabricated floor systems are available in various cross-sectional designs and can be constructed from materials such as steel, concrete, cold-formed steel, and timber. Composite systems, including steel–timber and cold-formed steel–timber combinations, are typically used in low-rise residential and commercial buildings [3,10,11,12,13]. In contrast, steel–concrete modular floors are more versatile, offering several benefits, such as being lightweight, providing higher load-bearing capacity, supporting open floor plans, allowing for longer spans, and requiring simple modular connections [4,14,15,16].
Numerous studies have been conducted on the structural behaviour of steel–concrete modular composite flooring systems. For example, de Seixas et al. [17] introduced an innovative system combining cold-formed trussed steel beams with precast concrete slabs, demonstrating sufficient flexural stiffness and load-bearing capacity. Dar et al. [18] investigated the impact of various shear connectors on the structural performance of cold-formed steel (CFS) and concrete composite floors, finding that these floors offer superior performance, economic benefits, and a high strength-to-weight ratio compared to traditional reinforced concrete slabs. Hassan et al. [19] explored the feasibility of continuous prefabricated steel–concrete slab systems with interlocking connections, revealing a 40% increase in ultimate capacity compared to traditional simply supported slabs and a 10% reduction relative to continuous composite slabs. Despite the extensive research, challenges such as industry resistance, a lack of skilled labour, changes to existing construction processes, and non-standard designs persist for prefabricated composite floor systems [20]. Moreover, the introduction of new prefabricated structural floors in modular construction underscores the need for periodic updates to design guidelines.
In Australia, for example, the Formwork, Technology, and Innovation (FTI) group has recently introduced the BlueDeck profiled steel sheeting system, a novel structural composite floor system. The BlueDeck system’s modular and prefabricated nature simplifies the installation process, reducing the reliance on skilled on-site labour. Additionally, the system’s ability to be prefabricated off-site enhances quality control and reduces construction times, further mitigating industry resistance by offering economic and efficiency benefits. This system features a rigid, permanent metal decking formwork that simplifies the construction of suspended reinforced concrete slabs by combining high-strength steel sheets with reinforced concrete. The composite design leverages the tensile strength and durability of steel sheets to enhance the typically weak tensile performance of concrete slabs. Manufactured from high-tensile steel, the BlueDeck system is ideal for buildings requiring large open floors with minimal intermediate supports, owing to its enhanced flexural rigidity and load-bearing capacity. Its application spans various building types, including car parks, offices, and hospitals, with the added benefit of a durable, galvanised finish that provides a clean, low-maintenance ceiling solution. Given the innovative nature of the BlueDeck composite decking system, its structural and mechanical properties remain largely unexplored. This study aims to investigate the structural performance of the BlueDeck system, focusing on its ultimate load-bearing capacity and flexural stiffness, as well as the mechanical behaviour of the connection between the steel deck and concrete slab. To this end, a series of four-point bending and shear tests were conducted to evaluate the structural properties of the system. Additionally, a finite element (FE) model was developed and validated against experimental results to extend the findings from the full-scale tests.

2. Experimental Program
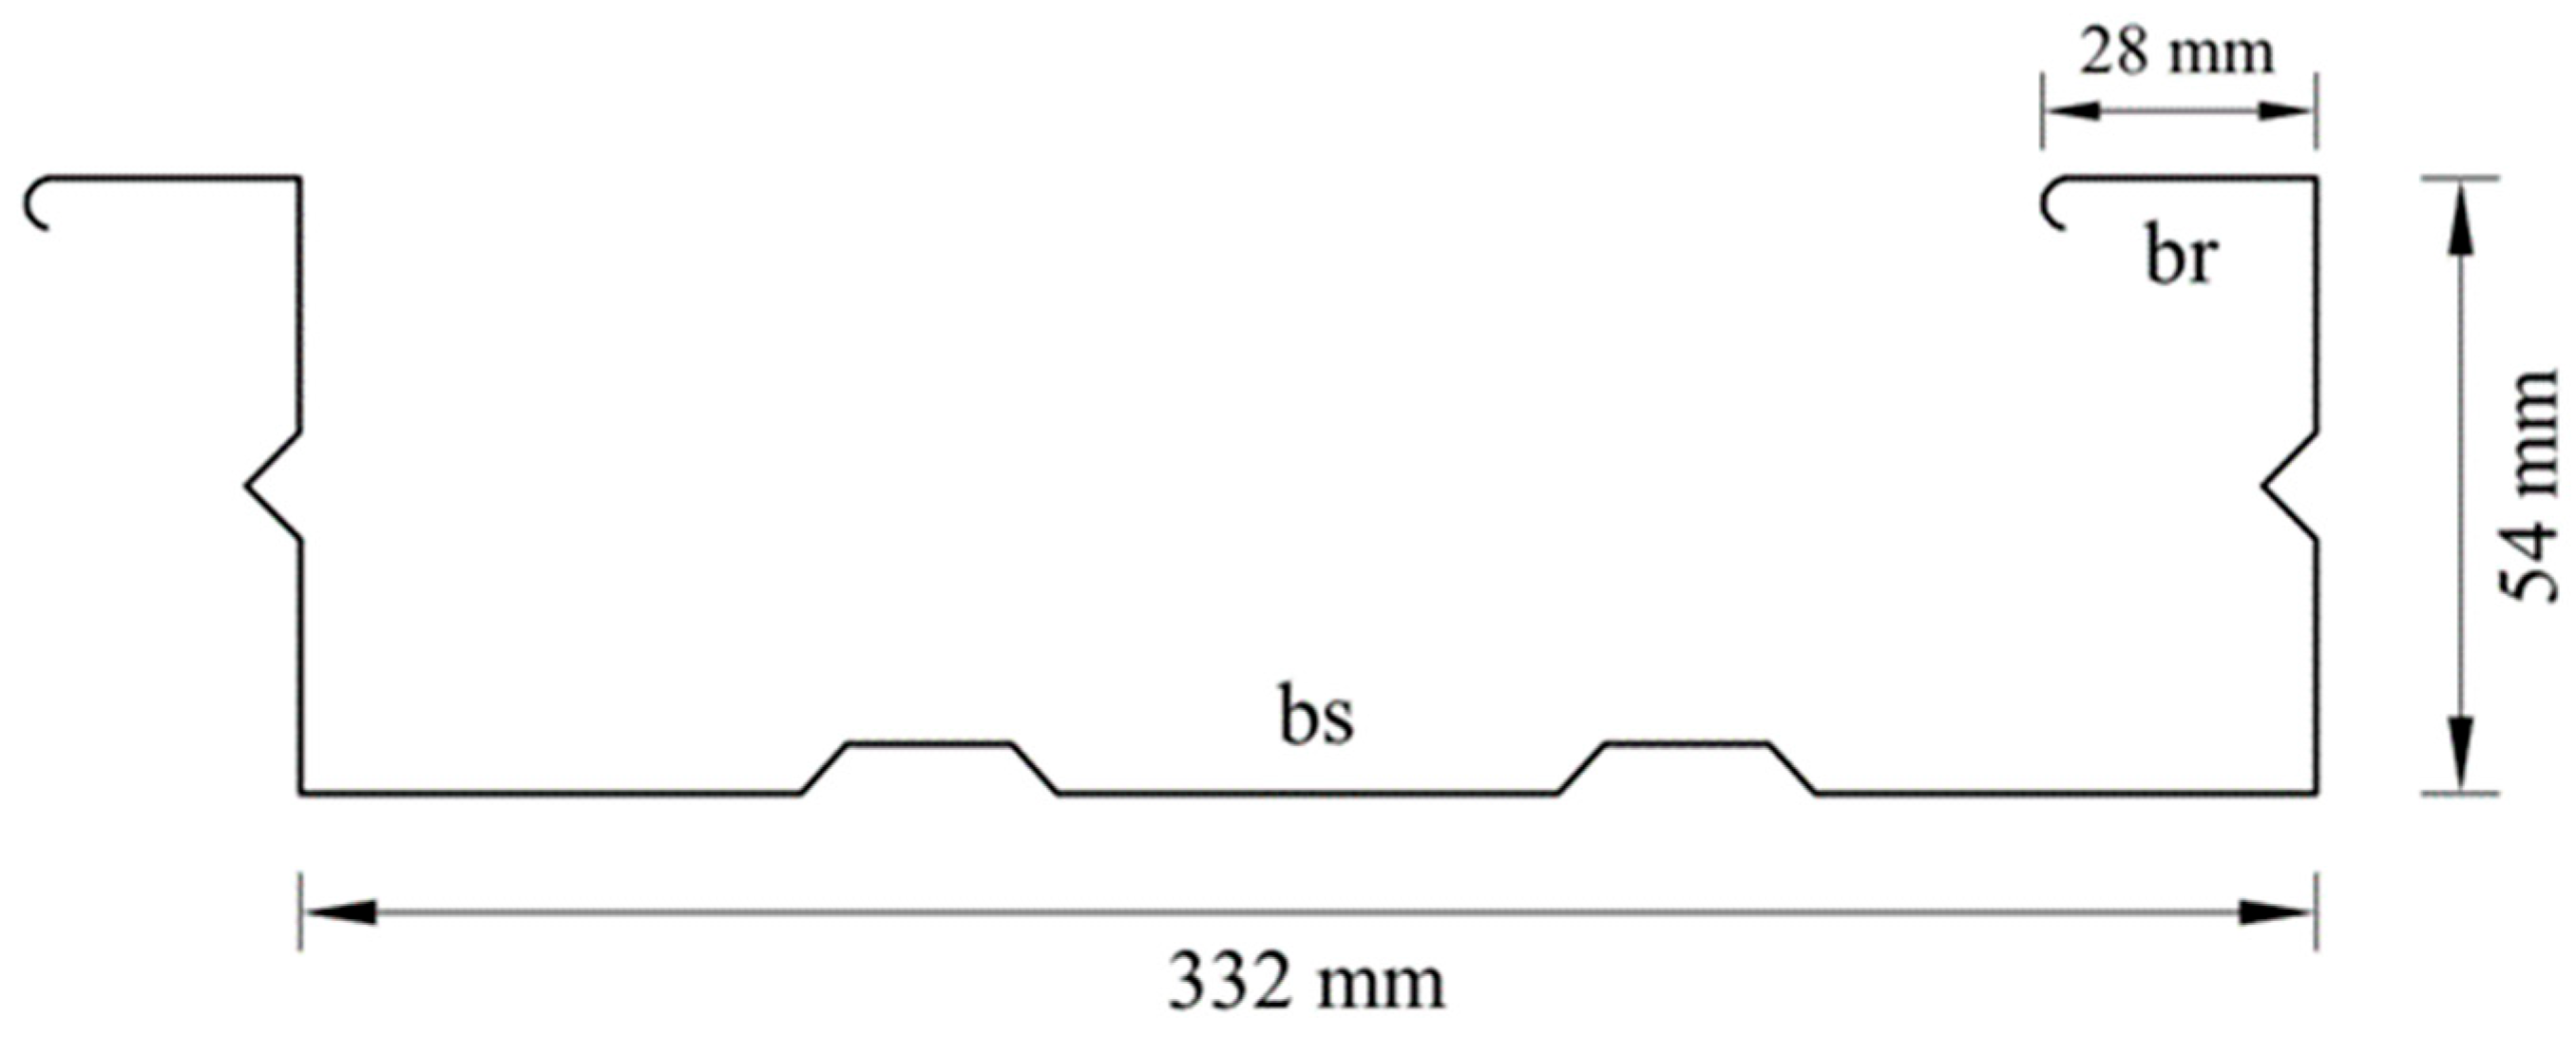
The experimental investigation was conducted at the structural laboratory of the University of Technology Sydney Tech Lab. A total of eighteen BlueDeck composite floor specimens were subjected to four-point bending tests to evaluate the flexural performance of the newly proposed composite flooring system. In addition, six shear tests were performed to assess the mechanical characteristics of the connection between the BlueDeck steel sheets and the concrete layer. The FTI group provided the test specimens, which were prefabricated with the necessary surface treatments at designated load and support locations. A summary of the experimental program is presented below.

2.1. Materials

The BlueDeck steel sheets employed in this study were fabricated from G550-grade steel, produced by roll-forming galvanized high-tensile steel sheets. These sheets had standard thicknesses of 0.75 mm and 1.0 mm, with a minimum zinc coating mass of 350 g/m2, compliant with the specifications of AS/NZS 2327 [21] and AS 1397 [22]. The steel sheets exhibited an average yield strength of 550 MPa. A detailed summary of the material specifications and section properties of the BlueDeck steel sheets, corresponding to a width of 1.0 m, is presented in Table 1.
Once installed, normal-strength concrete was cast directly onto the BlueDeck steel sheets. Two distinct batches of concrete were used for the project. For each batch, ten concrete cylinders (100 mm in diameter and 200 mm in height) were cast as companion specimens. Of these, three cylinders were tested at 7 days, three more at 14 days, and the remaining four cylinders at 28 days. The average compressive strengths recorded at 28 days were 36.80 MPa and 39.00 MPa for batches 1 and 2, respectively. According to AS 3600 Clause 3.1.3 [23], the density of normal-weight concrete is taken as 2400 kg/m3, allowing for the modulus of elasticity of the concrete to be calculated Equation (1).
E c j = ρ 1.5 × 0.043 f c
The concrete’s material properties are summarised in Table 2. Additionally, the concrete cast over the BlueDeck sheets was reinforced with a steel mesh featuring a 6.0 mm diameter, aimed at mitigating shrinkage and cracking due to temperature-induced differential strains.

2.2. Specimen Design and Test Setup

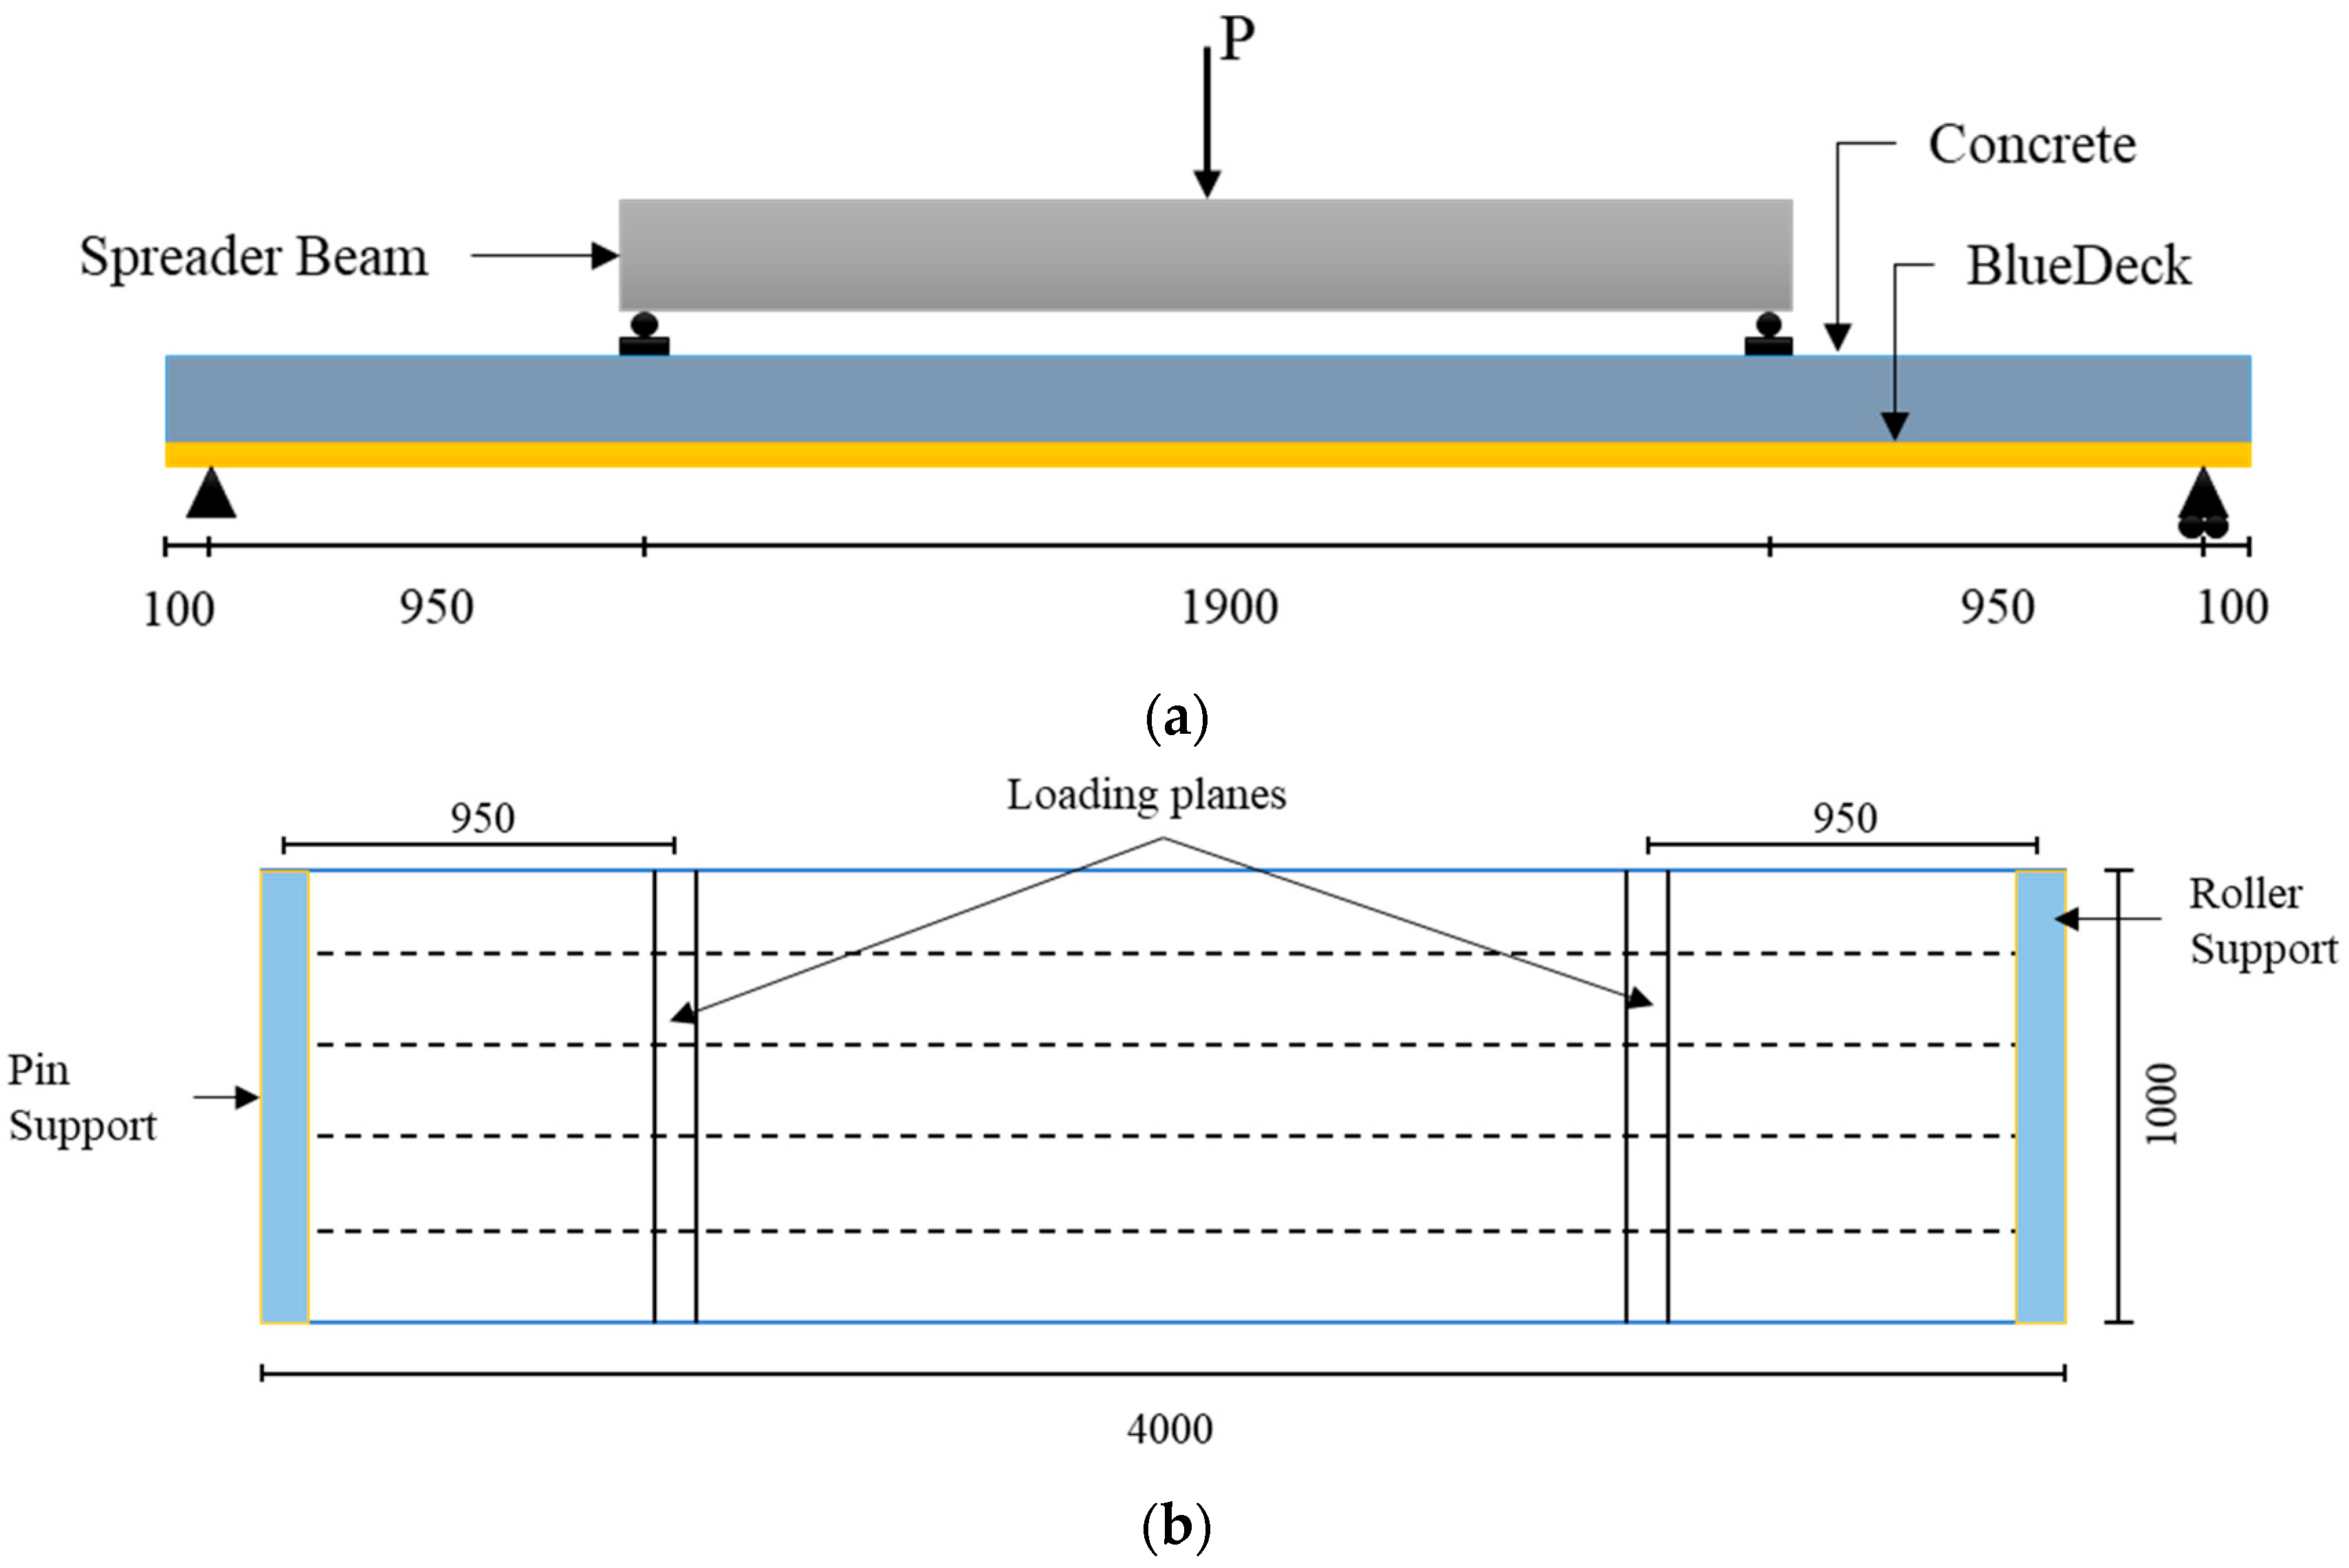
2.2.1. Four-Point Bending Tests
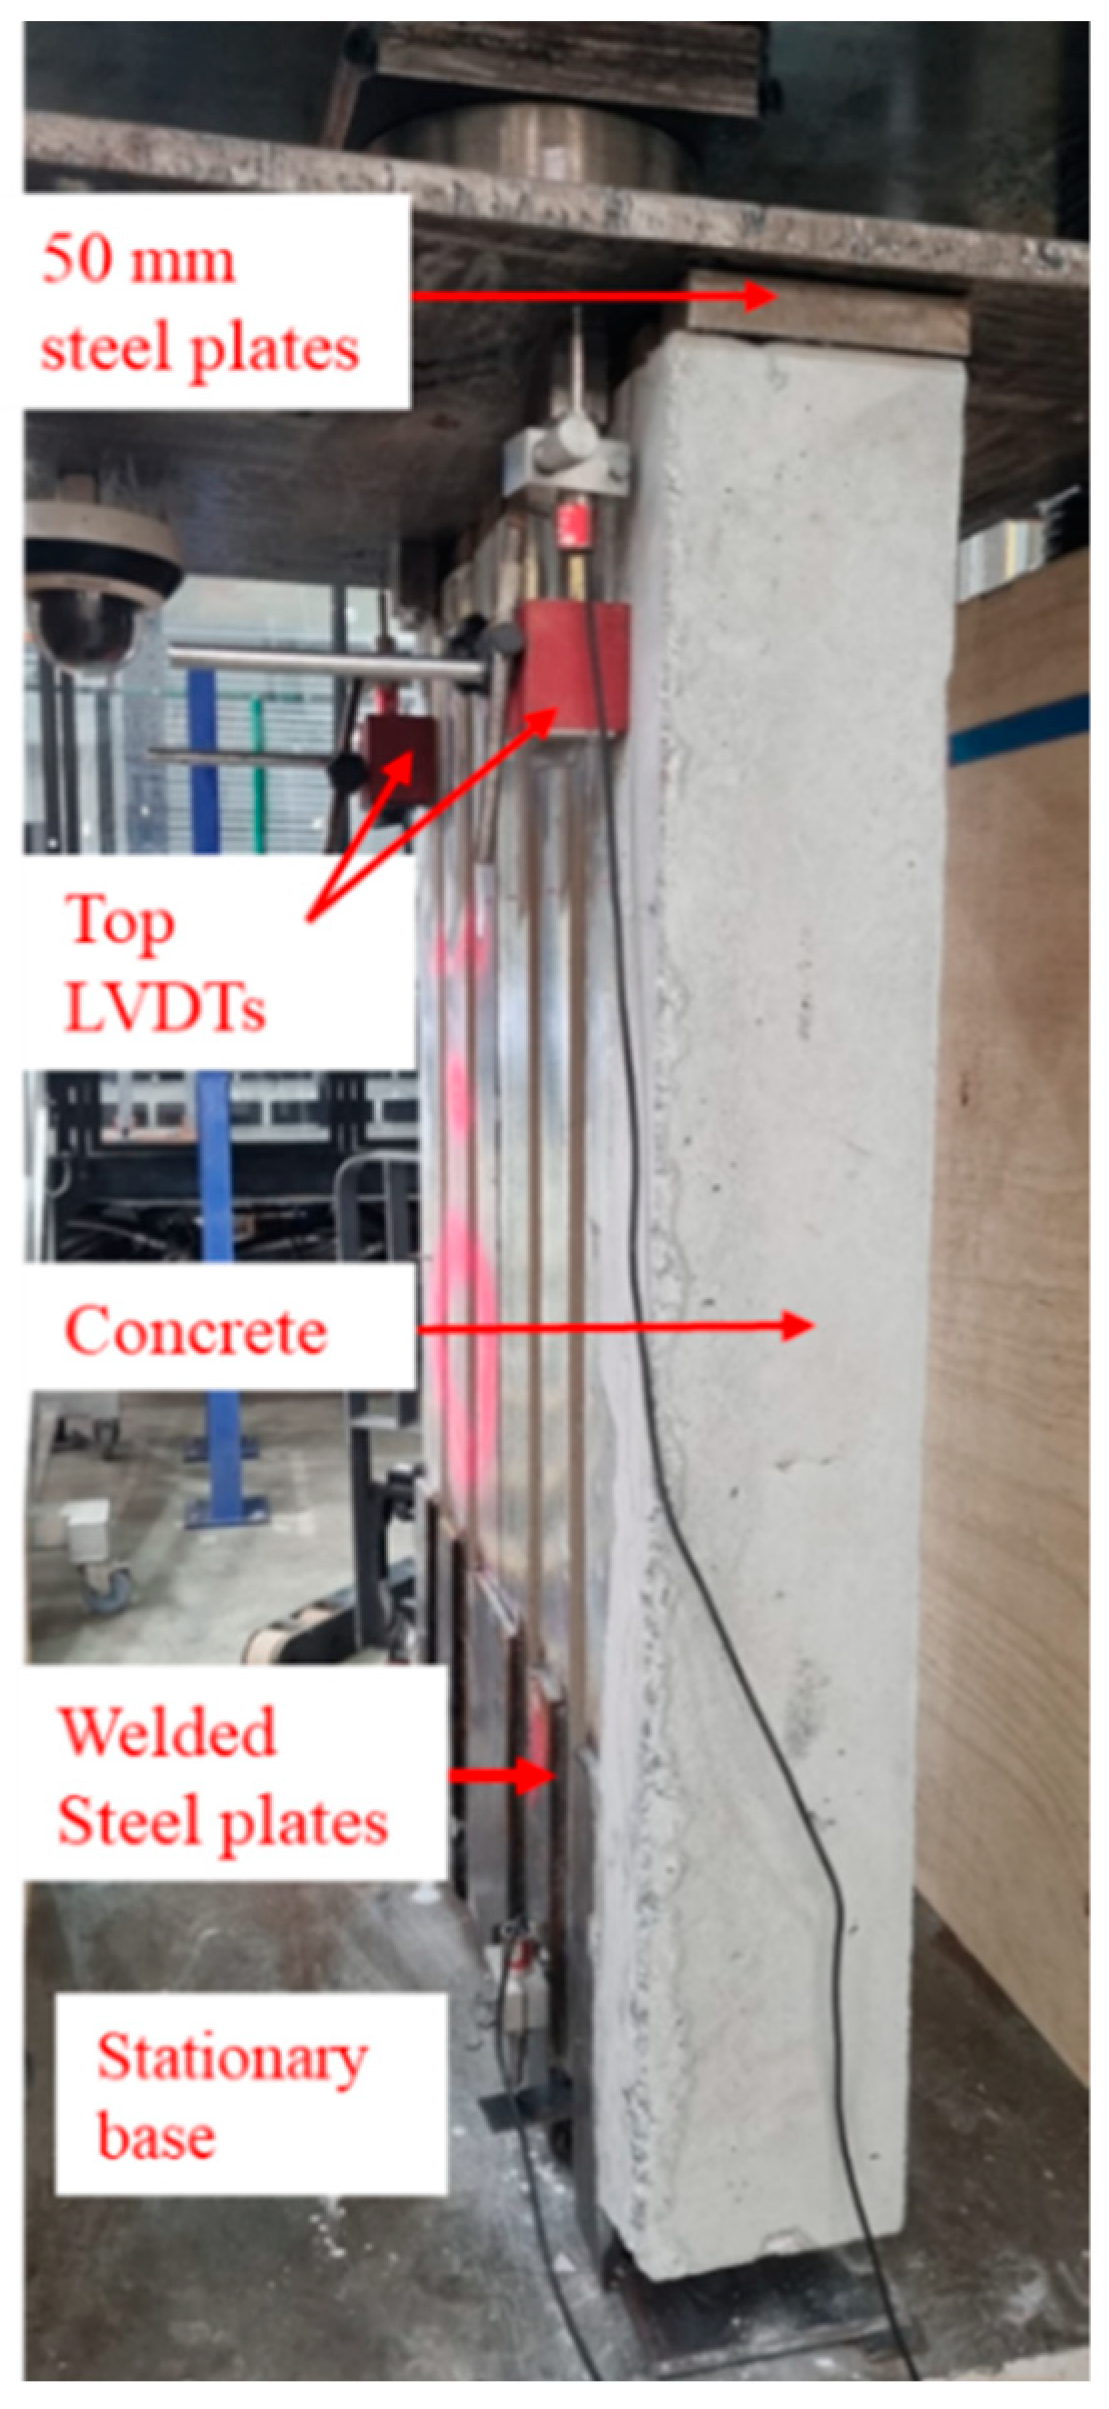
A total of eighteen composite floor specimens were tested in this project. A typical four-point test setup is shown in Figure 1.
The tested samples were 4000 mm in length and 1000 mm in width, whilst the span between supports was 3800 mm. The concrete depth and BlueDeck steel sheet thickness varied between samples. The loading planes were located at 950 mm from the centre of the supports at each side, as illustrated in Figure 1. For the sake of repeatability of the test results, specimens were categorised into six different groups, i.e., Groups A, B, C, D, E, and F, where, in each group, three identical samples, in terms of test arrangement, concrete depth, and BlueDeck sheet thickness, were tested. The concrete compressive strength varied between samples in Groups A, B, C, and E, as illustrated in Table 3. The concrete compressive strength of Group D samples was 39.00 MPa while it was 36.80 MPa for Group F samples. The varying parameters between the specimens were the concrete depth, BlueDeck steel sheet thickness, and concrete compressive strength. Table 3 summarises the basic varying parameters of the tested samples. The greater depth of the concrete slab increases the effective depth, improving the section’s moment capacity, while the thicker steel sheet enhances the tensile resistance of the composite section, contributing to higher load-bearing capacity.
The specimen’s ID is defined as follows: in column 1, letters R and Y stand for the concrete strengths (e.g., R: 36.80 MPa and Y: 39.00 MPa); in column 2, 0.75 and 1.00 indicate the thicknesses of the BlueDeck steel sheet in mm; and in column 3, 150, 175, and 200 are the concrete depths in mm. Finally, the numbers 1, 2, and 3 indicate the numbers of specimens within each group. The testing was carried out under a displacement control loading procedure at a displacement rate of 2 mm/min. The load applied from the 250 kN hydraulic jack was transferred to the specimens through a steel spreader beam. The spreader beam was supported by two hollow steel sections (1.0 m wide) that were in complete contact with the specimen using roller supports to accommodate the vertical displacement during testing and was located at 1050 mm (both sides) from the end face of the specimen. Additionally, specimens were simply supported using roller support at one end and pin support at the other end to conserve the stability of the floors during testing and to allow for the concrete and BlueDeck steel sheet to displace laterally during the tests. Since the concrete and the BlueDeck sheets were allowed to move laterally, four LVDTs were mounted on the end faces of the samples to measure the displacements at initial de-bonding between the two materials and the maximum slip at failure. Furthermore, an extra two LVDTs were placed under the samples at mid-span to measure the vertical displacements during the tests. A typical arrangement of test equipment is shown in Figure 2. The hydraulic jack used in the four-point bending tests was a model ABC-250, with a load capacity of 250 kN. Its accuracy is ±0.5%. The LVDTs used for displacement measurements were model GHI-12, with a precision of 0.01 mm, from DEF Instruments. The universal testing machine used for the shear tests was a model MNO-100 electrohydraulic servo system, with a load capacity of 100 kN and a measurement accuracy of ±0.2%, manufactured by JKL Corp. The spreader beams, steel angles, and support rollers were custom-fabricated to meet the testing requirements, with tolerances verified before the experiments.
The connection between the concrete and BlueDeck steel sheet was achieved by friction using shear keys, which were part of the BlueDeck steel sheeting. Shear keys were continuous in the span direction and were spaced at 332 mm at the cross-section, as illustrated in Figure 3.

2.2.2. Shear Tests

Shear tests were performed to assess the degree of composite action achieved between the concrete slab and the BlueDeck steel sheets. To achieve this goal, six samples were tested and evaluated. Each specimen measured 1000 mm in height and 666 mm in width. The depth of the concrete slab was consistently 150 mm across all specimens; however, variations were introduced in the concrete’s compressive strength and the thickness of the BlueDeck steel sheeting. To ensure the reliability of the results, three identical samples were tested, maintaining uniformity in the test setup, concrete depth, and BlueDeck sheet thickness. The specimens were divided into two distinct groups, labelled as sets A and B. The key parameters of the tested shear samples are summarised in Table 4, while Figure 4 and Figure 5 illustrate a typical shear test specimen and the test setup, respectively.
To quantify the relative displacement between the concrete slab and the BlueDeck, four linear variable differential transformers (LVDTs) were employed for each specimen: two positioned on the top surface and two on the bottom surface. These LVDTs were strategically placed near the interface of the concrete and BlueDeck to mitigate the impact of uneven load distribution and material inconsistencies on the slip measurements. The BlueDeck sheeting remained stationary during the tests, achieved by welding the sheeting to 10 mm thick steel angles, which were then secured to a fixed part of the testing apparatus, as illustrated in Figure 5. Additionally, the applied load was concentrated as close as feasible to the shear plane between the BlueDeck and the concrete slab to reduce the effects of any inadvertent eccentricity and to negate bending effects, thus avoiding uneven load distribution and induced moments. A 50 mm thick steel plate was used to evenly distribute the applied load across the entire cross-section of the samples. The primary outcomes from the push-out tests included the load–slip relationship and the observed failure modes. Testing was performed using a microcomputer-controlled electrohydraulic servo universal testing machine with a 100 kN capacity.

3. Test Results and Discussion

3.1. Four-Point Bending Tests

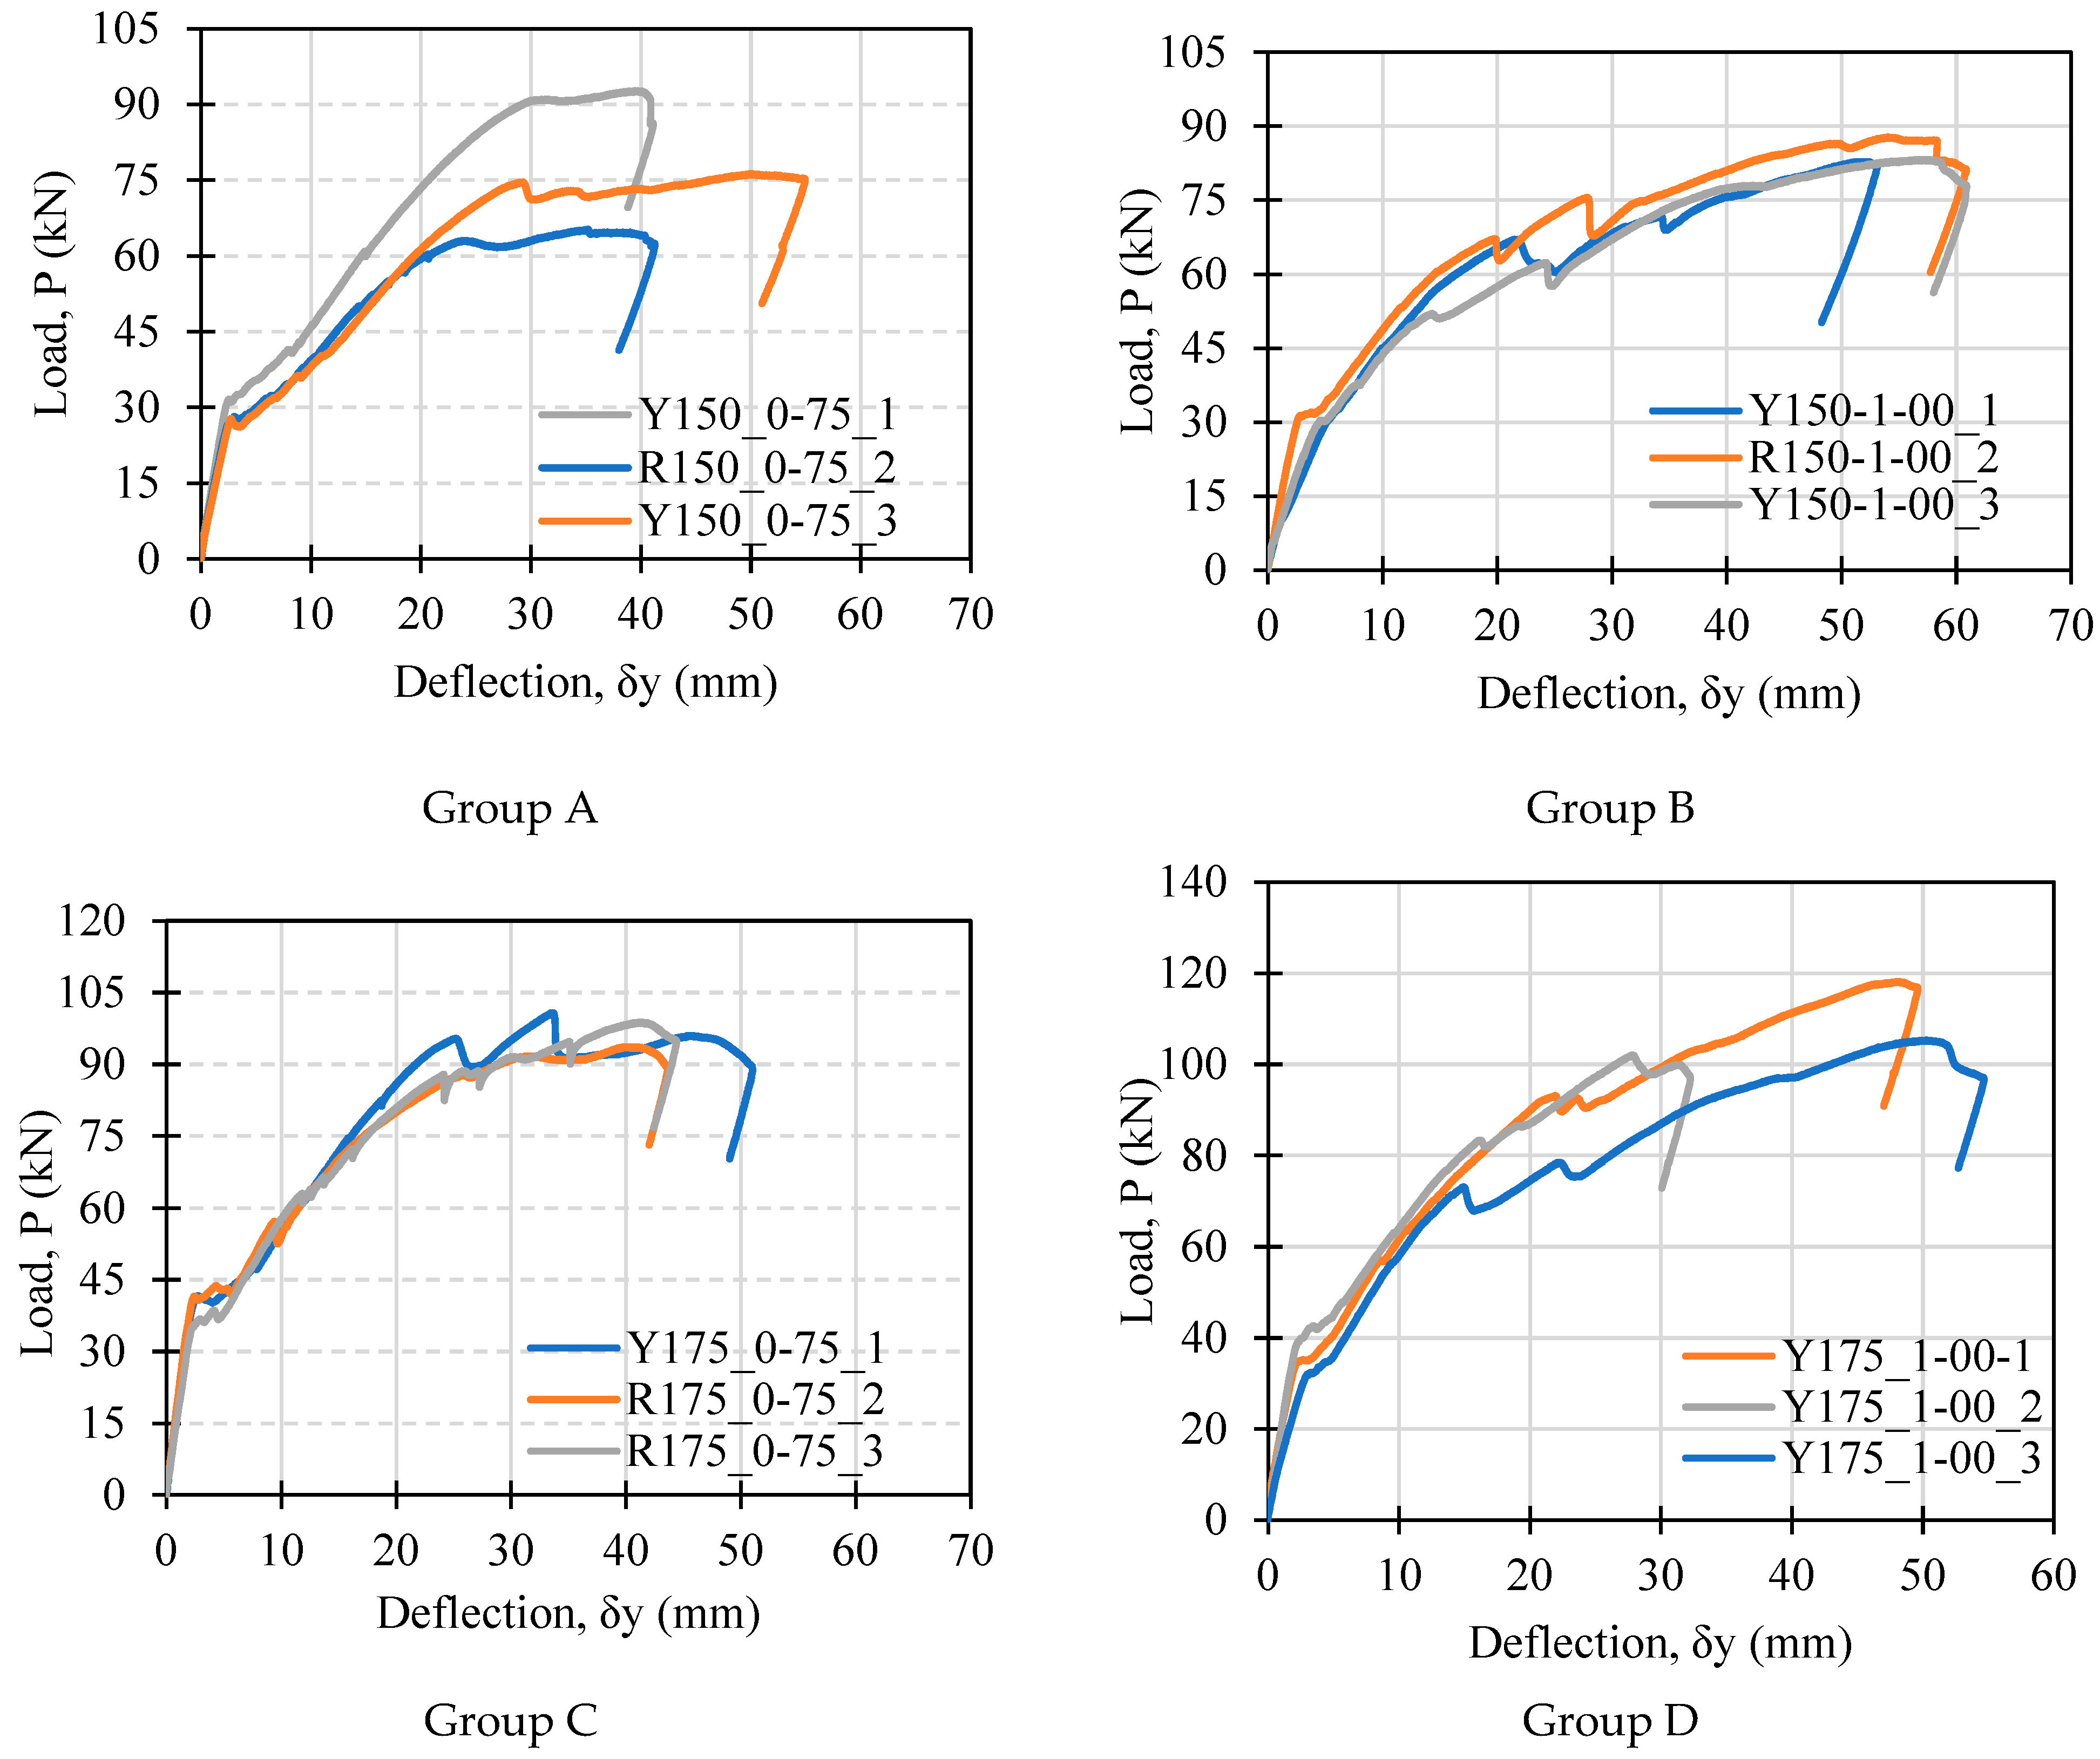
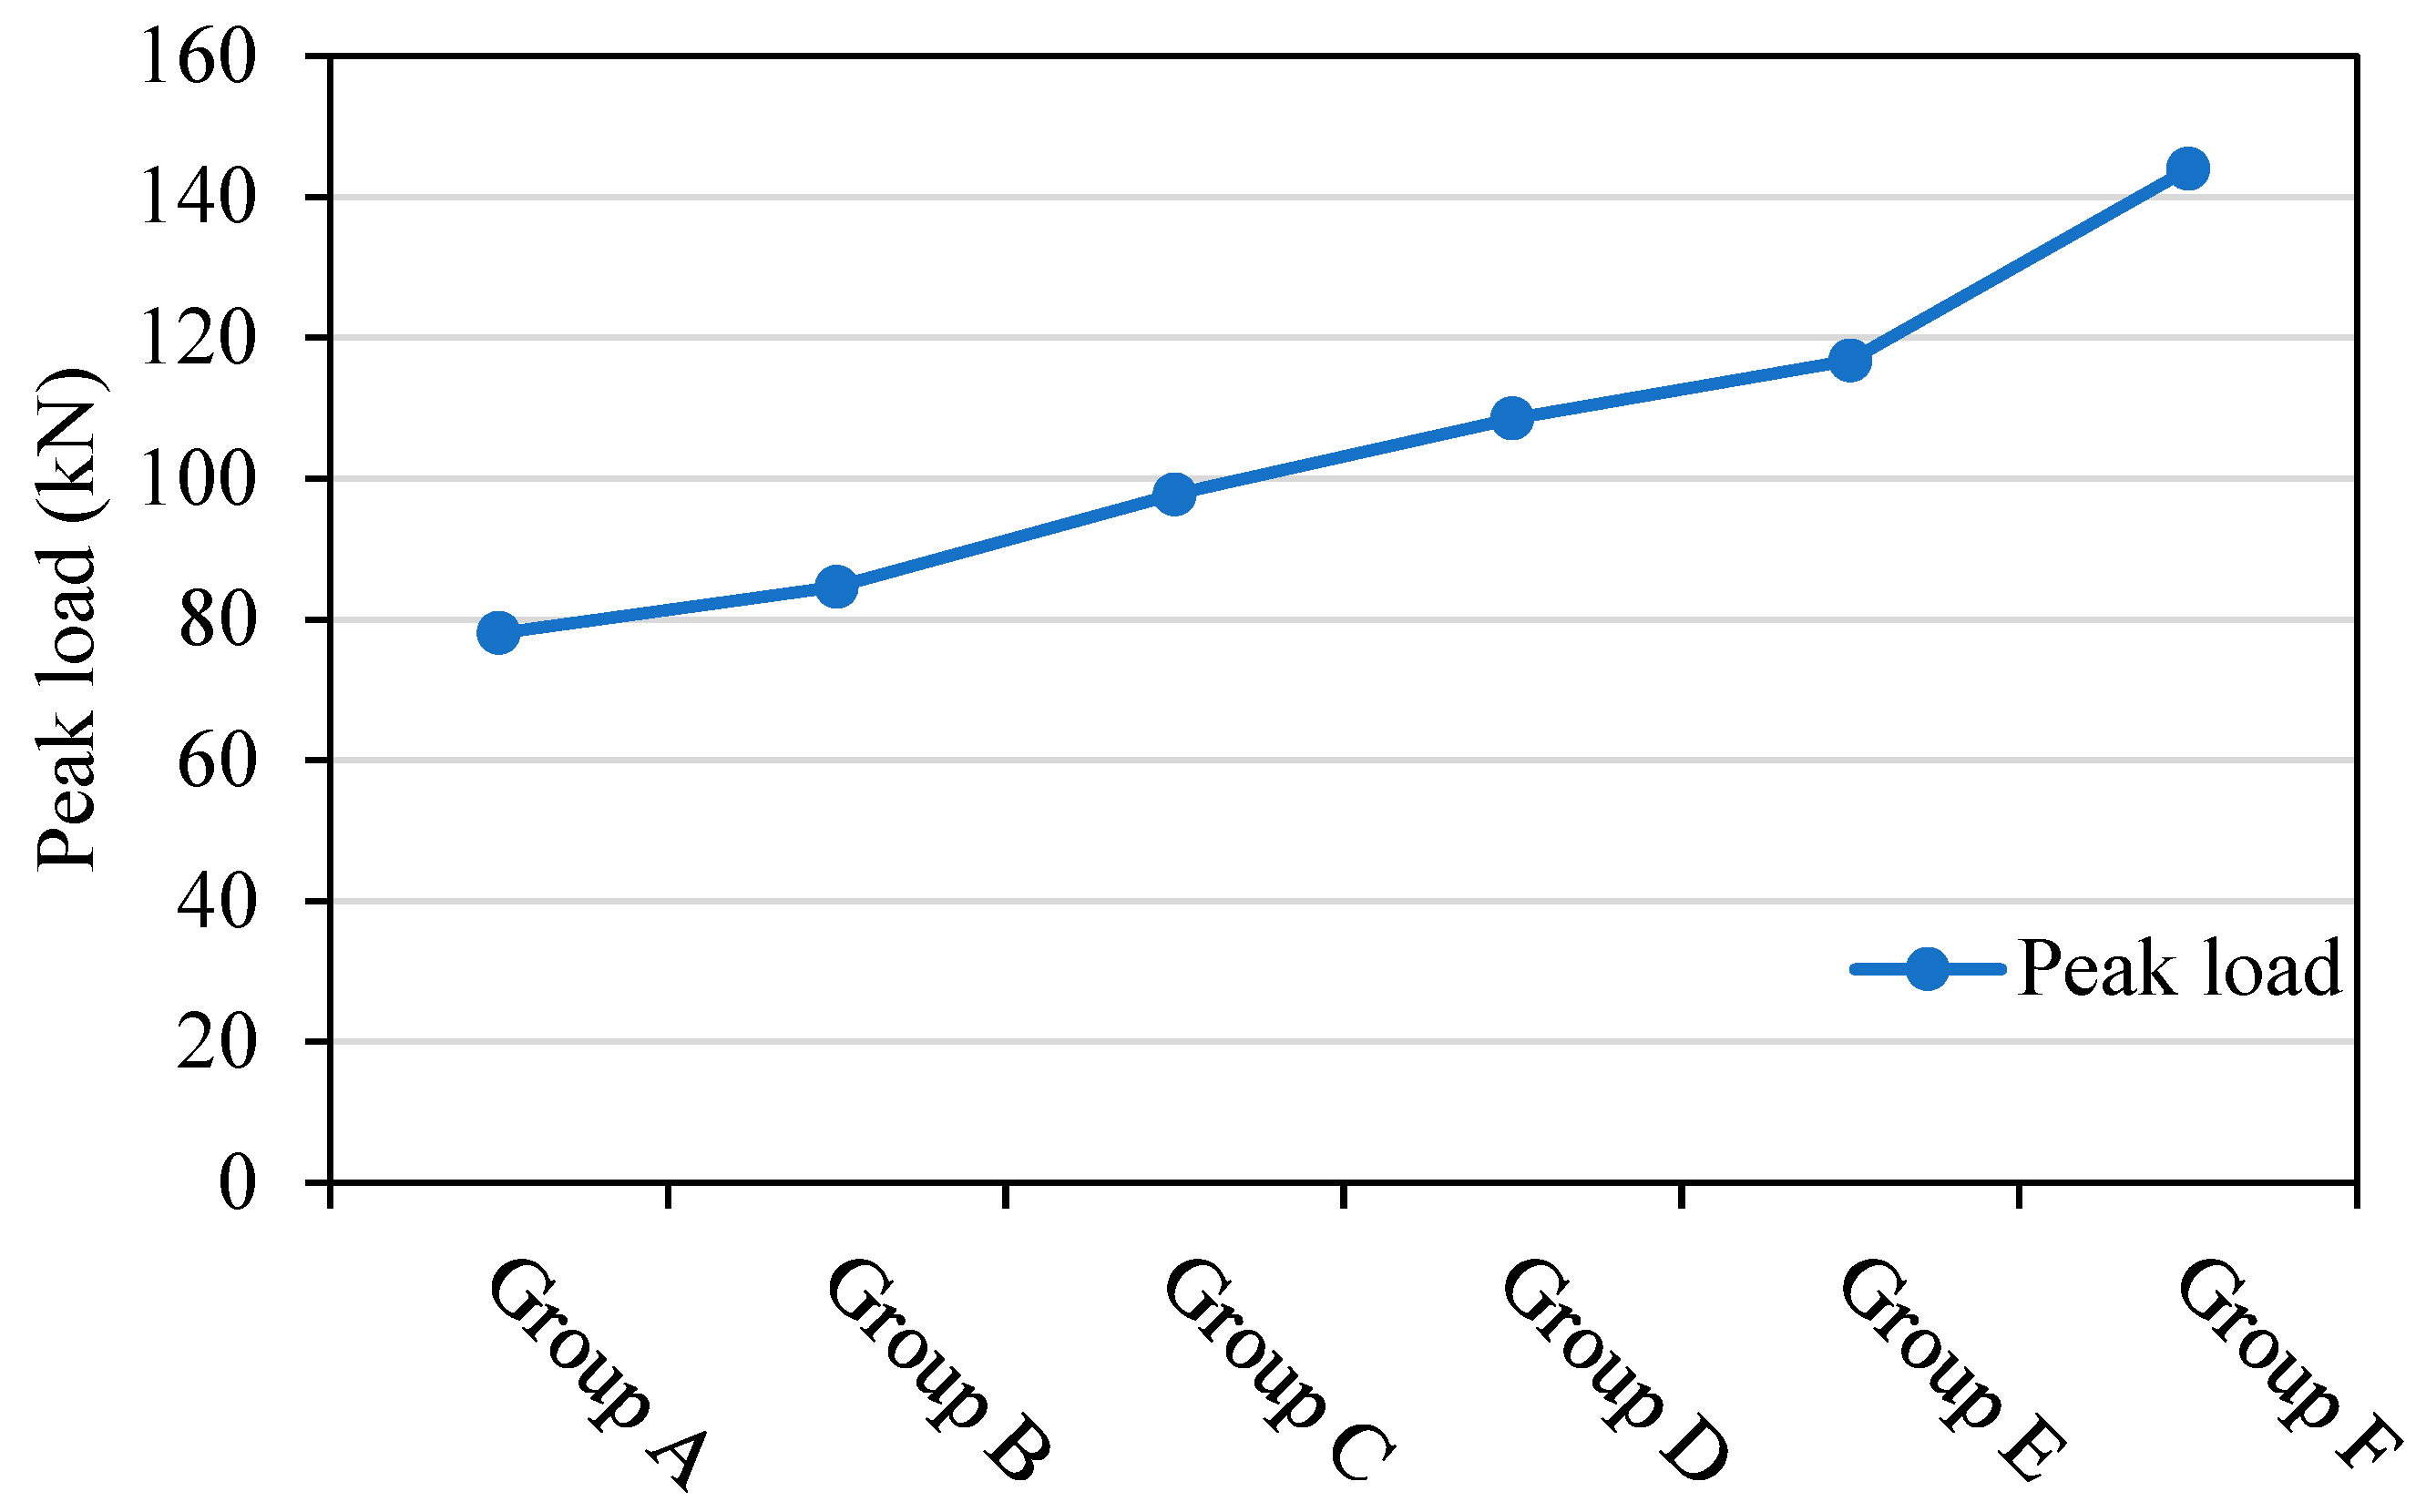
3.1.1. Load–Deflection Behaviour

The load–deflection curves for all the tested specimens are shown in Figure 6. The mid-span deflection was taken as the average of the values from the two vertical LVDTs located below the tested samples. The load–deflection curves shown in Figure 6 demonstrate the different stiffness, strength, and ductility values of the composite floor samples. Table 5 summarises the key results of the four-point bending tests, including ultimate bearing capacity, load at initial de-bonding, vertical deflection, and lateral slip at each side of the floor. The maximum load is taken as the peak load sustained by the test specimen during the test. As indicated in Table 5, specimens in Group A had the lowest peak load, while the ultimate bearing capacity improved as the depth of concrete and thickness of BlueDeck steel sheet increased. The average peak load values are depicted in Figure 7. The average peak load of Group A specimens is 78.08 kN with a standard deviation of 11.28 kN, indicating higher dispersion of the test results. Similar behaviours were observed in Group F specimens, with the average peak load of 143.98 kN and a standard deviation of 15.42 kN. Specimens of Groups B, C, D, and E have had more consistent test results, as proved by their standard deviation values.
In addition to the results reported in Table 5, the ultimate bending moment corresponding to the ultimate bearing capacity was also calculated. According to AS3600 [23] and AS/NZS 1170.1 [24], a typical permanent action load (G) on a concrete slab of 200 mm deep is 5.5 kPa (including the partitions) and the imposed action (Q) of residential and office buildings of general use is 3 kPa. The resultant ultimate load is, therefore, 11.10 kPa (wu = 1.2G + 1.5Q). Accordingly, the calculated ultimate bending moment based on wu = 11.10 kPa is equal to 20.03 kNm (for span L = 3.80 m). As shown in Table 5, the average experimental ultimate bending moments are well above the design load level for all groups. In serviceability limit state, based on the same applied actions for residential and office buildings of general use, the resultant serviceability load is 7.60 kPa (wu = G + 0.7Q) with the corresponding concentrated load at the mid-span equal to 14.5 kN. The mid-span deflection limit of span/240 being equal to 15.8 mm for the design required good alignment and visual quality importance. Looking at load–deflection curves for various groups of specimens in Figure 6, it becomes apparent that for the concentrated load of 14.5 kN, the corresponding deflection value is noticeably below the defection limit of span/240. As a result, it can be concluded that the composite flooring systems made of BlueDeck steel sheeting can competently bear and transfer the typical applied actions for general use and conform to the requirement of Australian Standards [21].
Generally, four distinctive stages present the load–slip curves (Figure 6) of the tested specimens. The first part of the load–slip curve is the no slip part. Tested composite floors behaved as full composite system with relatively negligible slip due to the friction at the interface between the concrete layer and BlueDeck steel sheeting. Overall, the no slip stage of the load–slip curve was observed at load values corresponding to 0.08 Pu. The second stage of the load–slip curve was the elastic stage (0.1 Pu–0.4 Pu), where the applied force exceeded the friction at the interface, and the slip increased relatively proportional to the increased load. Once the applied load nearly attained 40% of the peak load, excessive slips occurred at a lesser increase in the load, triggering the nonlinear behaviour of the composite system and eventually reaching the peak load. Finally, when the maximum load was attained, the load–slip curve started to descend, indicating that the failure of the specimen has initiated. It is highlighted that the apparent drops in the load–slip curves were due to local shear connection failure at the interface between the two materials.

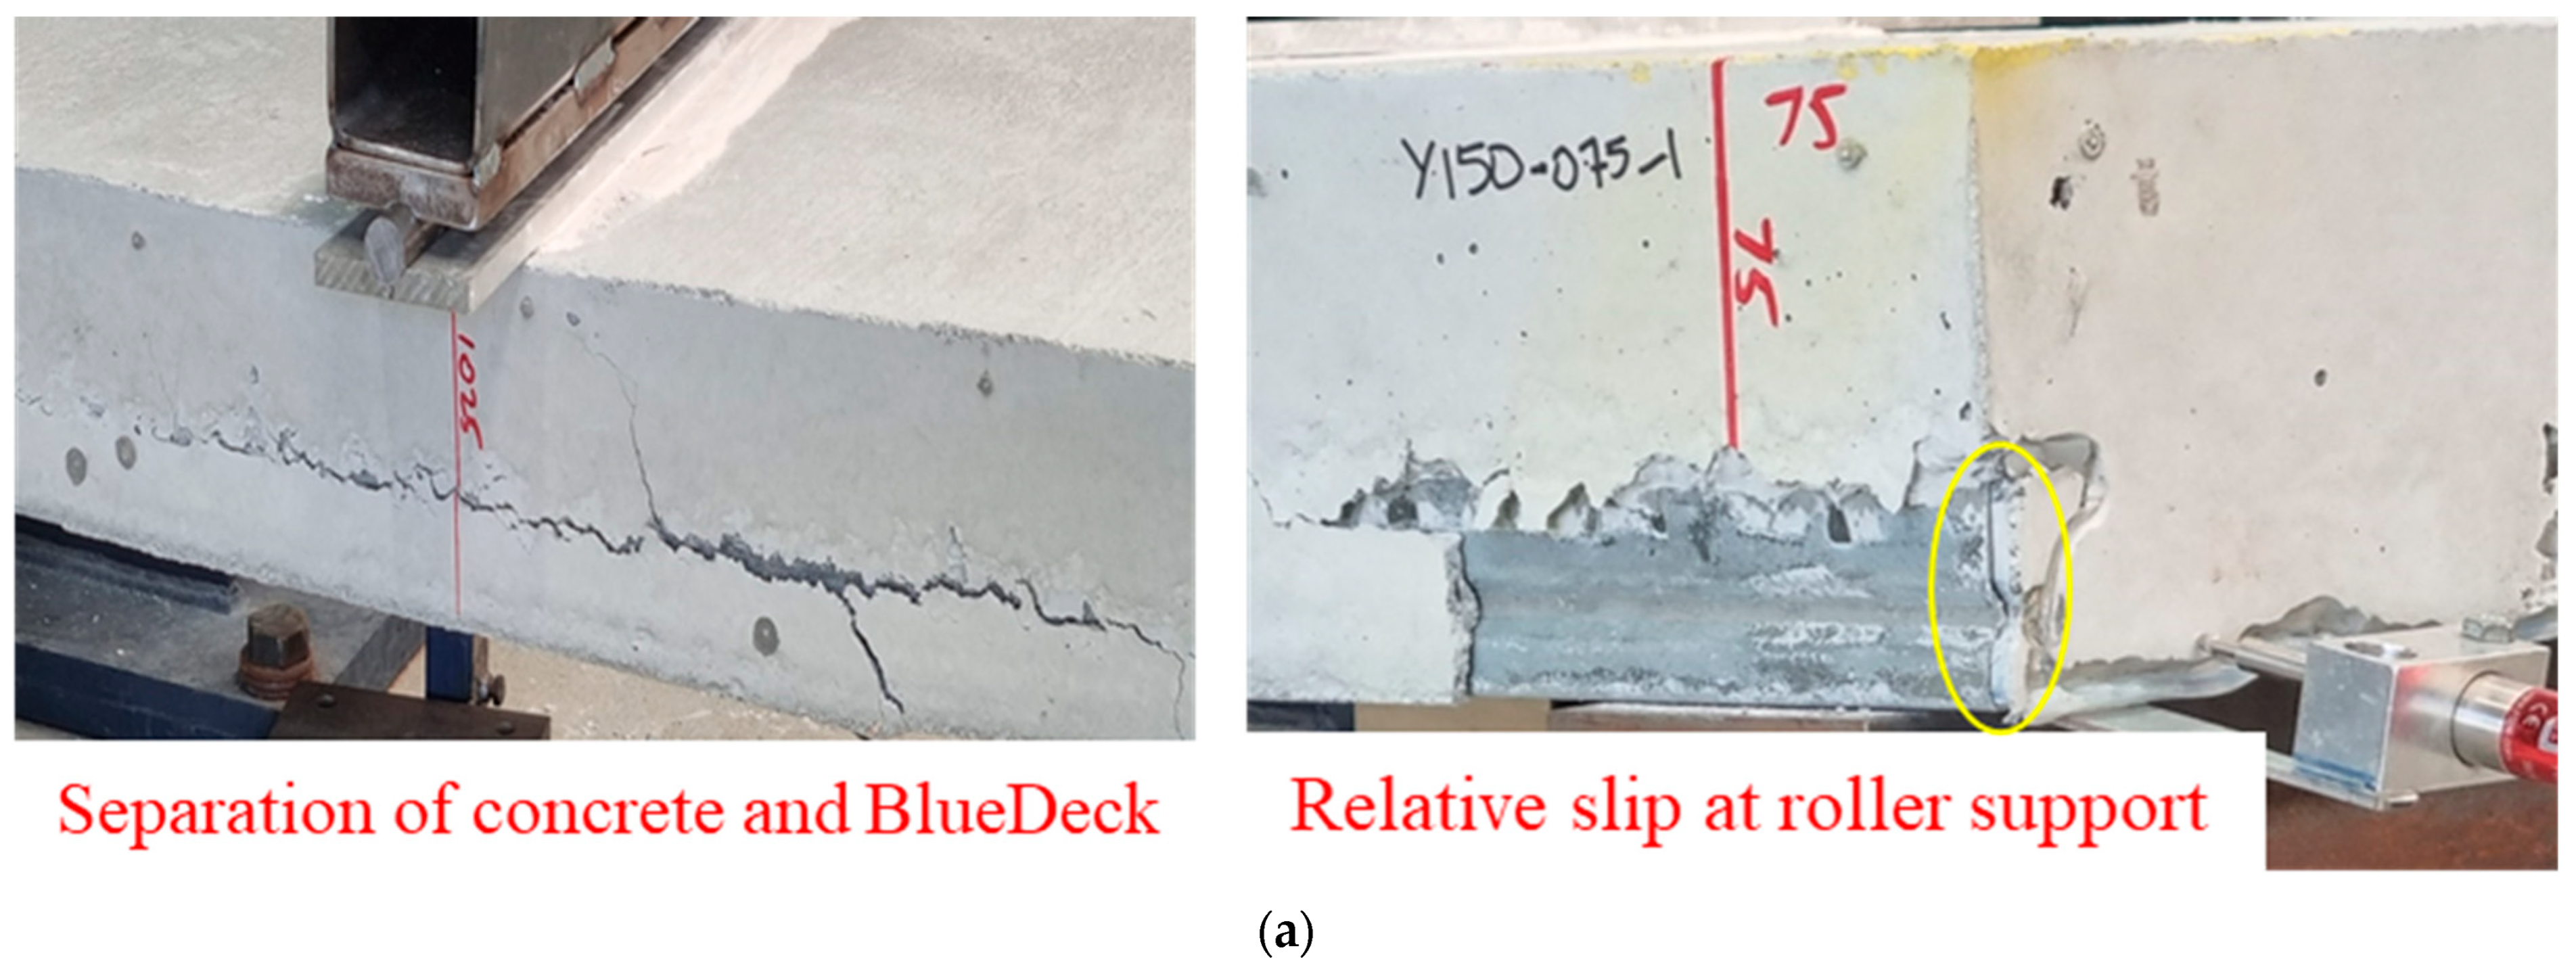
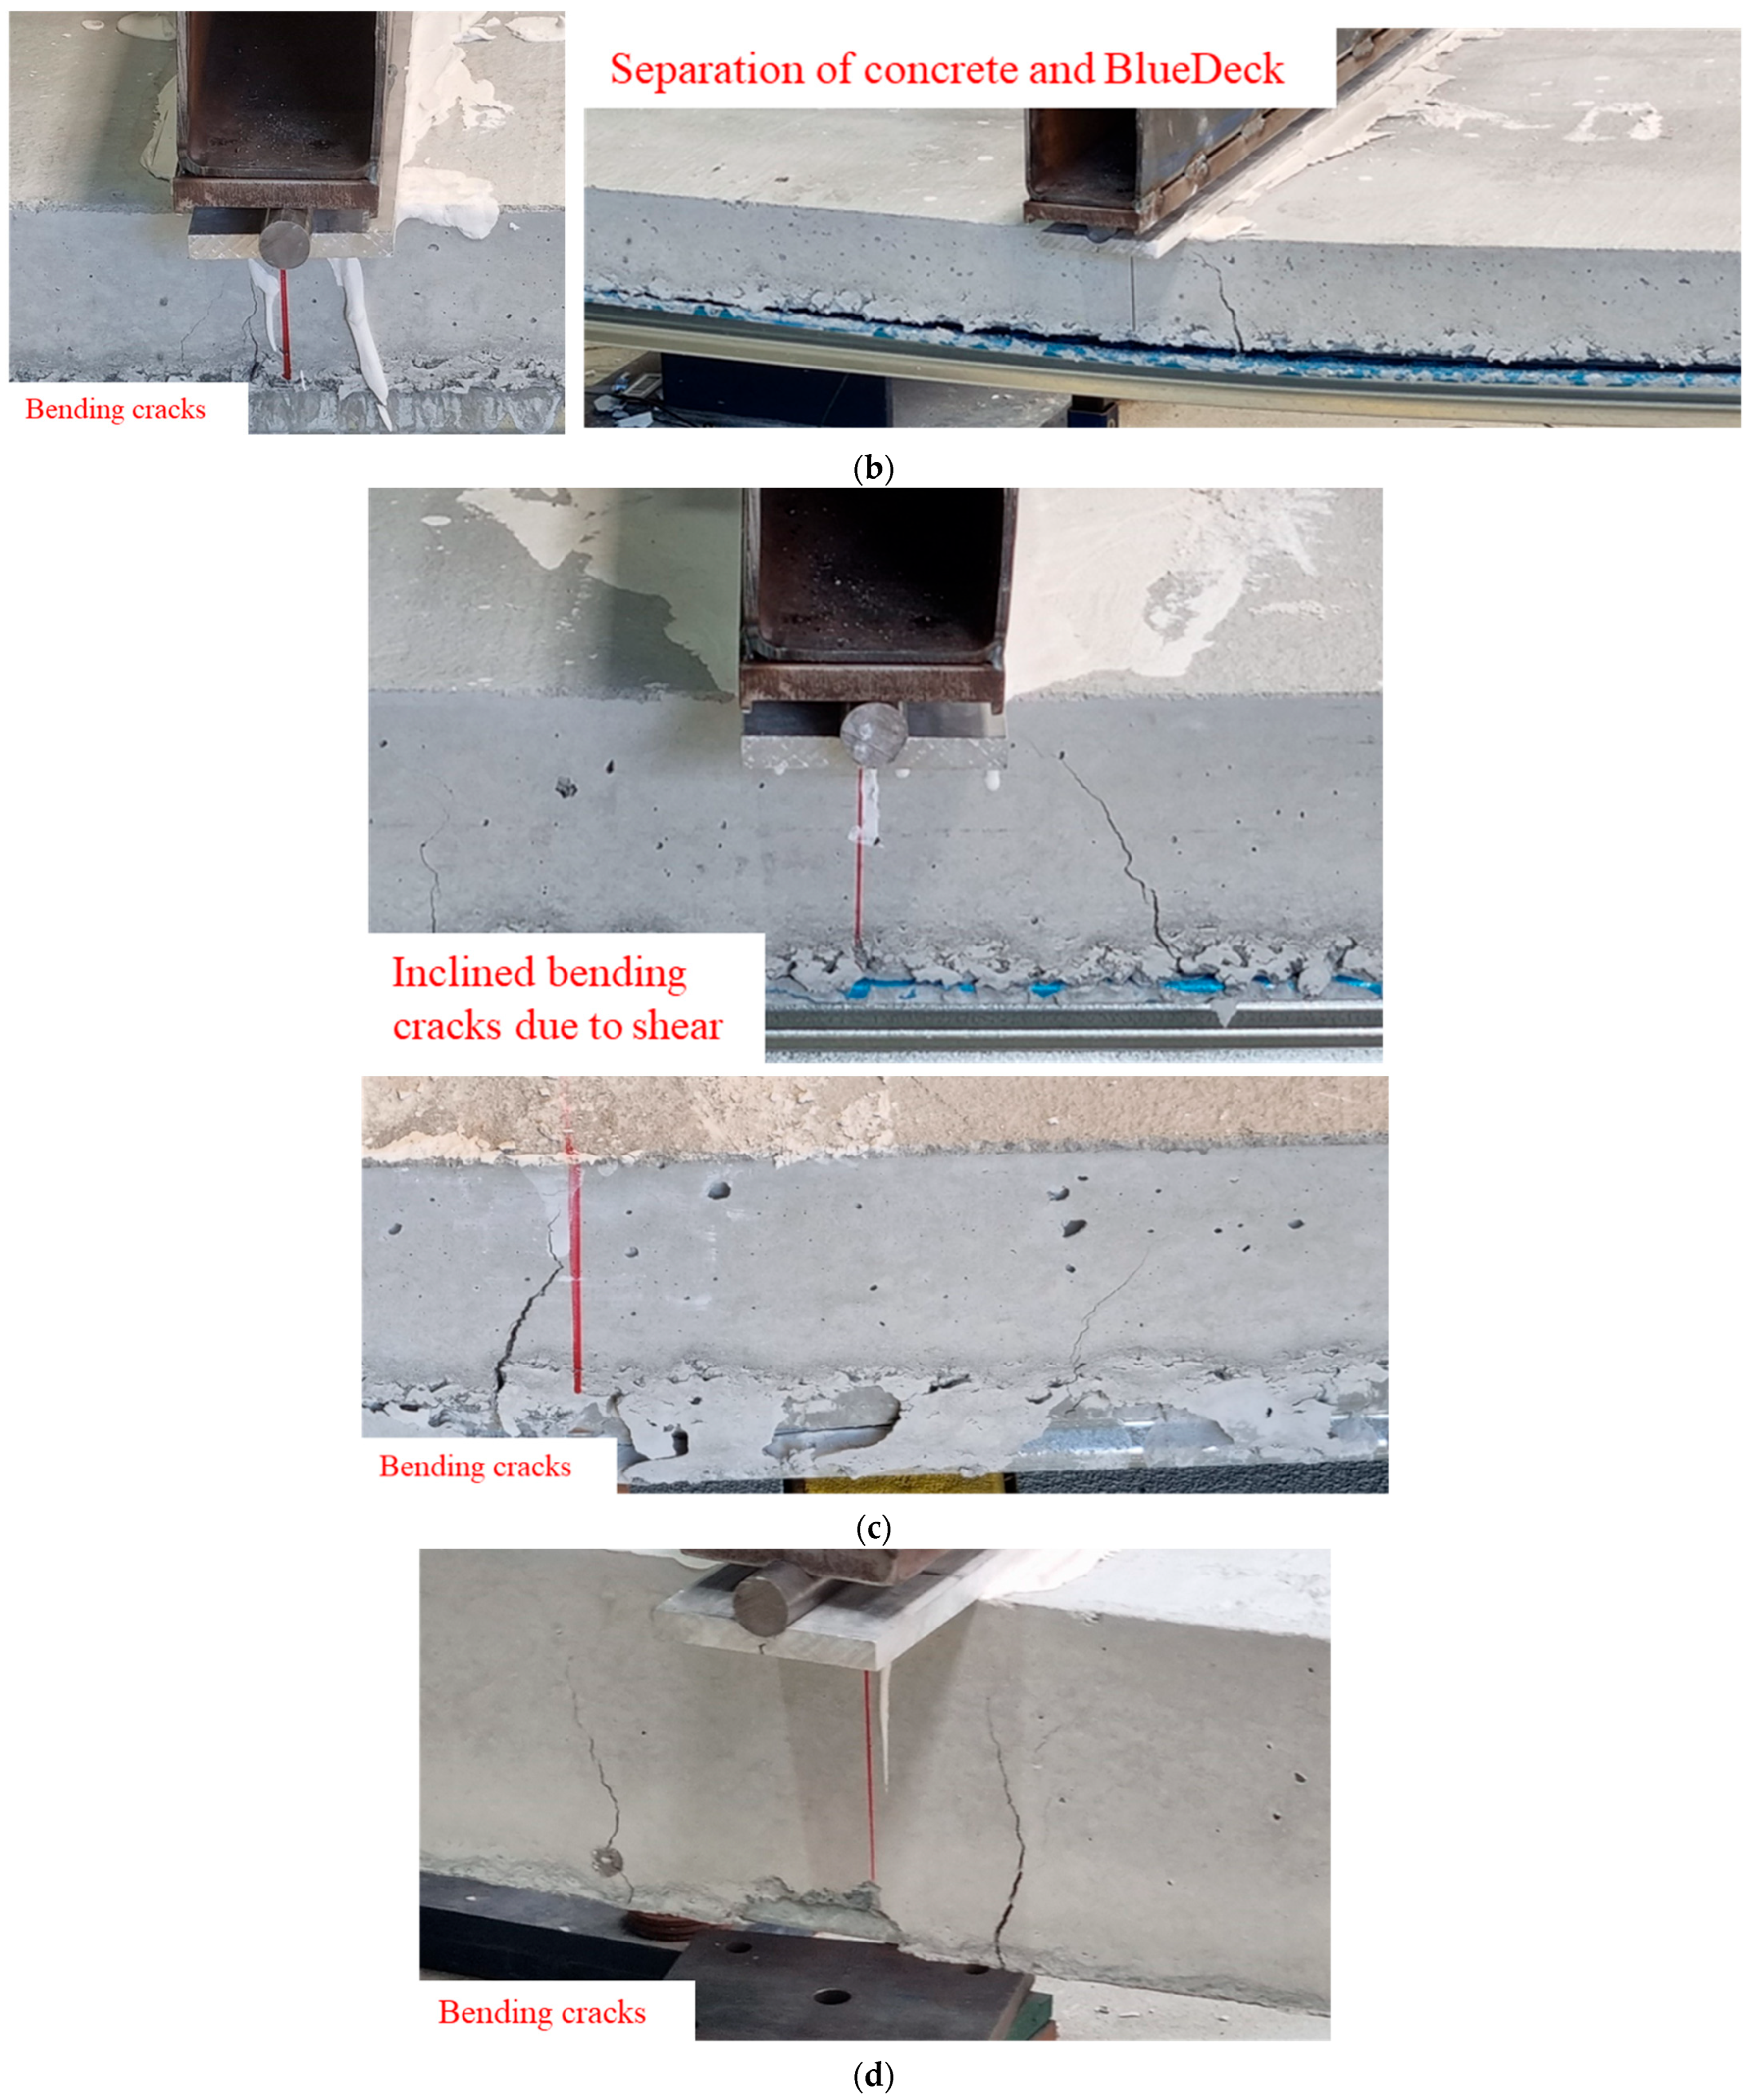
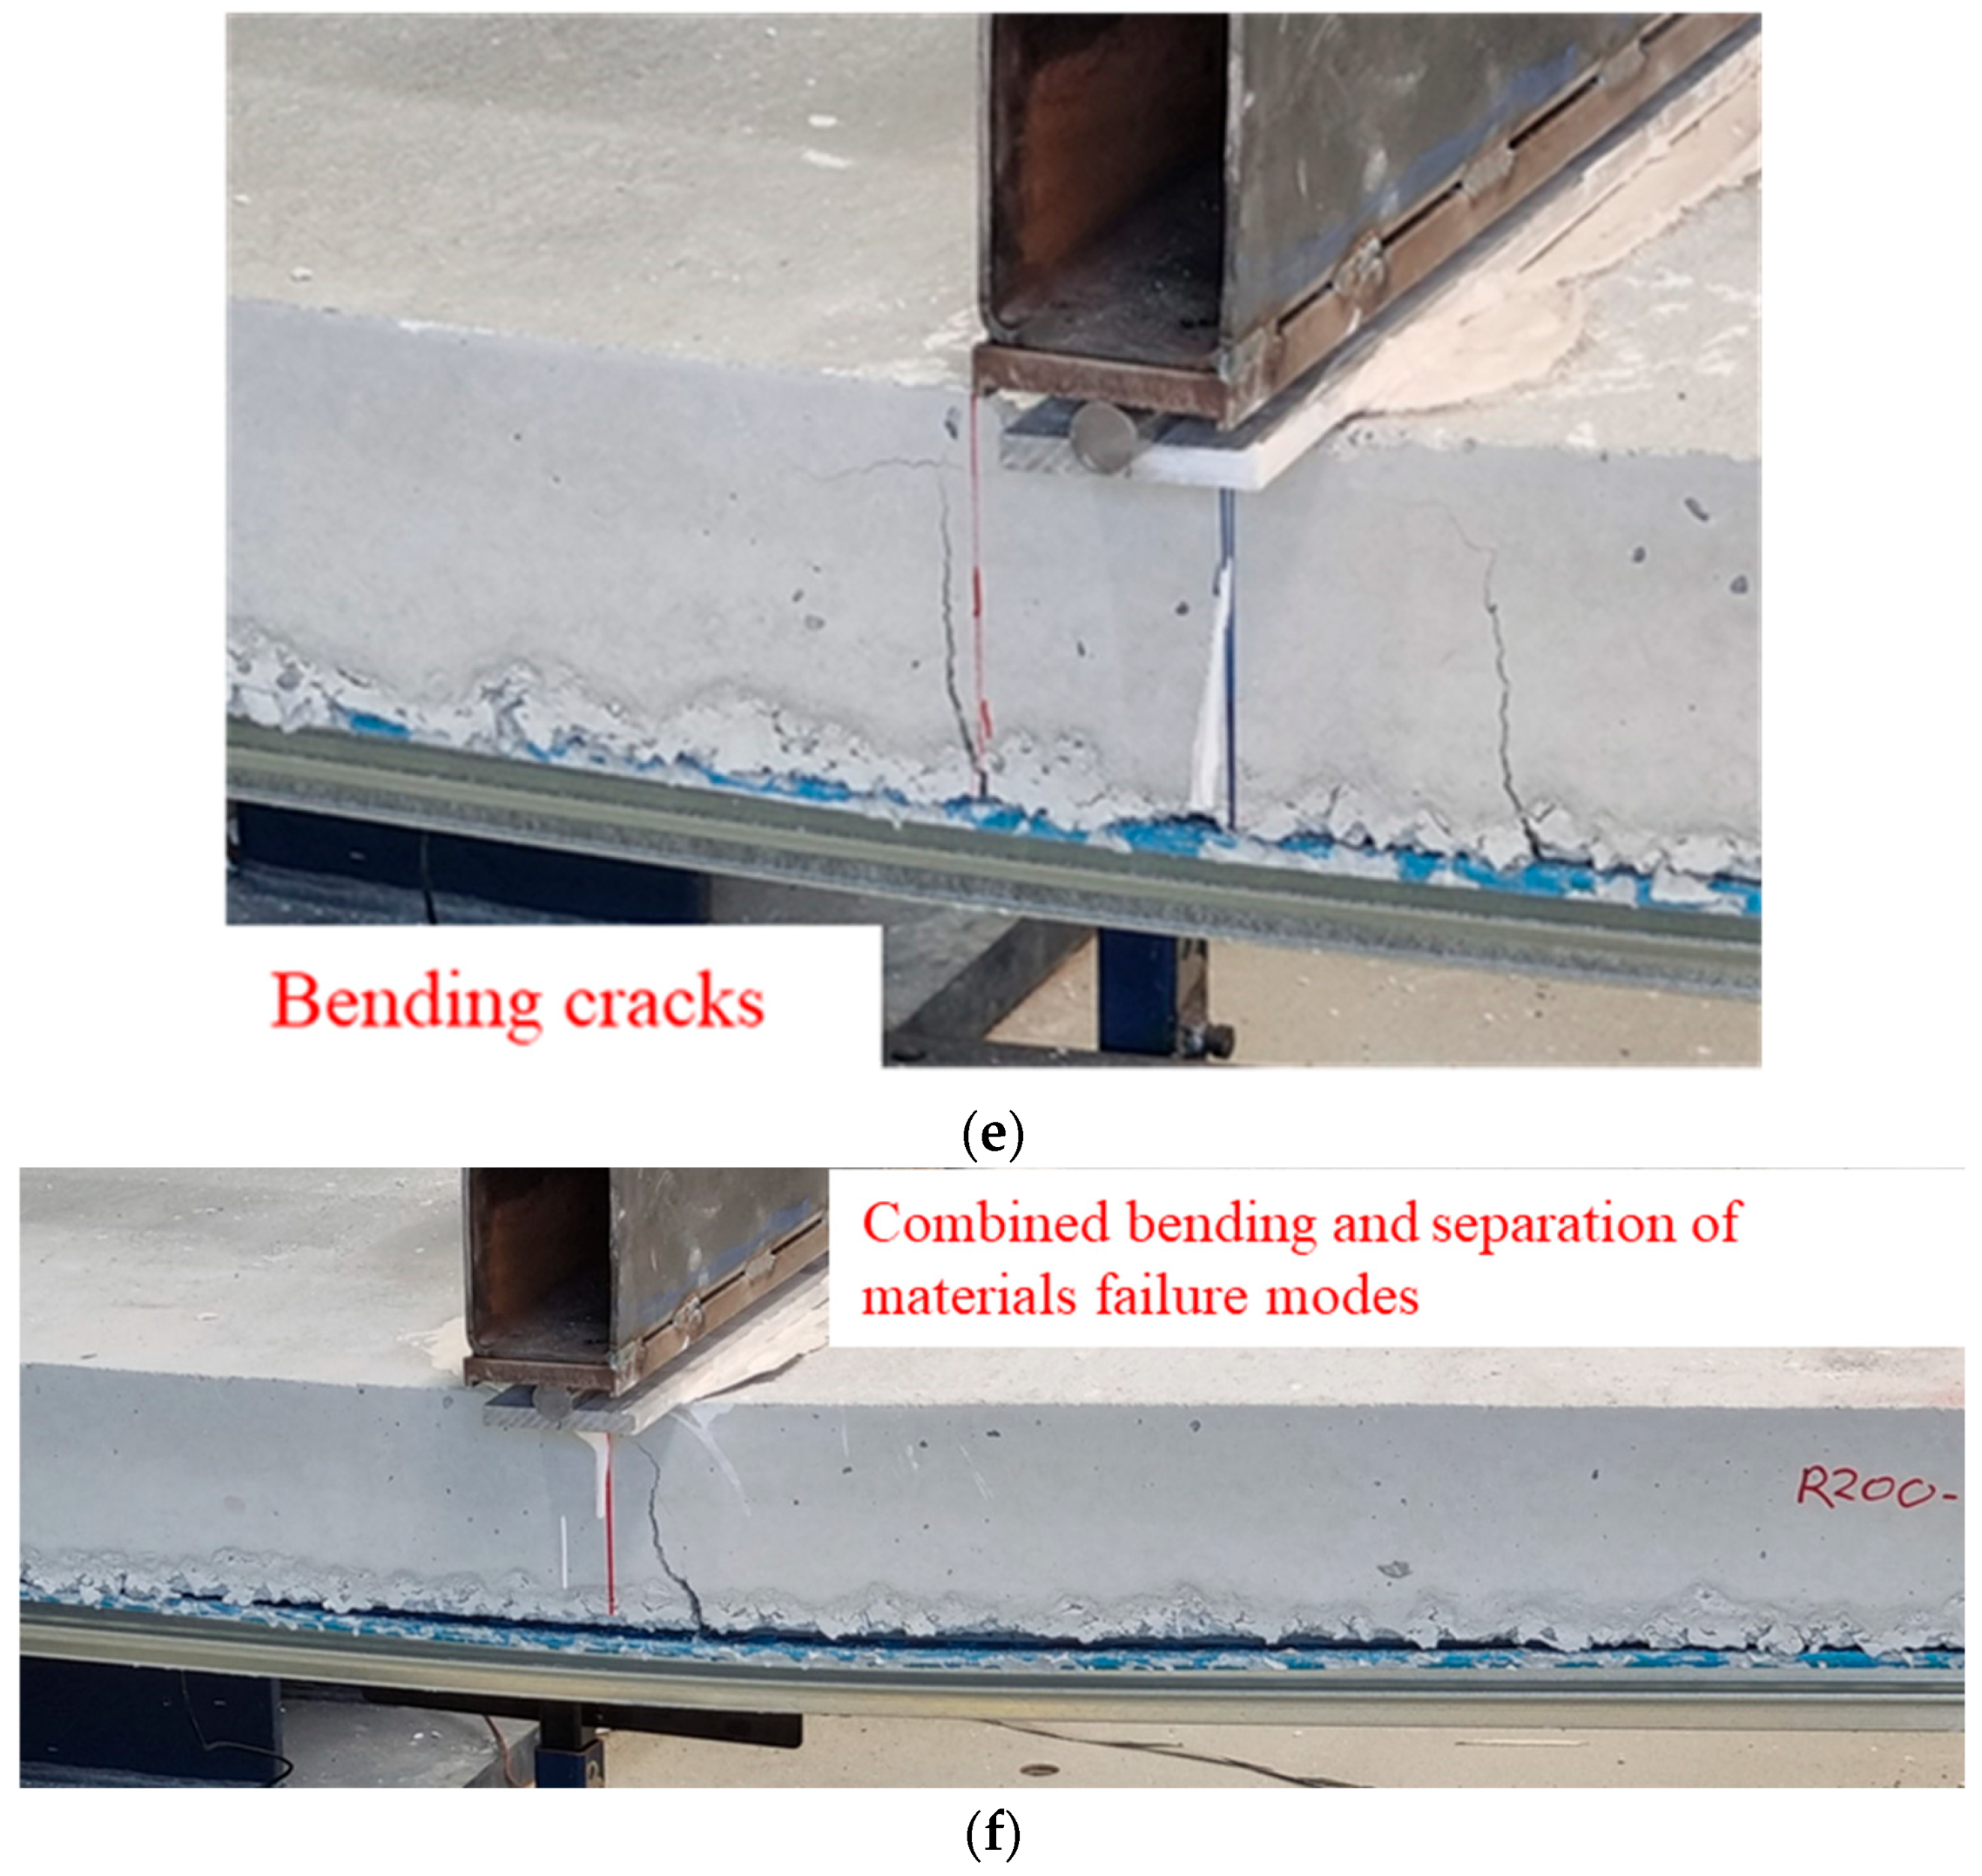
3.1.2. Failure Modes

In all groups, three different failure modes were observed in the tested composite floor samples. Diagonal concrete cracking was observed in shear were between the support and loading plane. Furthermore, pure bending cracks were also observed in the pure bending zone between the loading planes. Another failure mode was characterised by the separation of concrete slab from the BlueDeck sheet. Finally, a combination of the failure modes was also reported. Figure 8 shows typical failure modes observed in the tested specimens. Specimens in Group A failed primarily due to shear failure in concrete and separation of concrete from the BlueDeck steel sheets. Inclined shear cracks formed between the supports and loading planes in the shear zone, as shown in Figure 8a. Horizontal shear cracks were also observed along with a relative movement of concrete slab at the end supports, which indicate the failure mode of separation of materials. Similar failure modes were observed for specimens of Group B (Figure 8b), suggesting that increasing the thickness of BlueDeck steel sheets had a negligible influence on the failure mode due to shear. Group C specimens mainly failed due to bending, as indicated by the close-to-vertical bending cracks (Figure 8c). Further, shear cracks were also observed near the vicinity of the loading plane. Likewise, specimens of Group D failed under pure bending conditions combined with separation of materials as the interface failure mode (specimens Y175_1-00_1 and Y175_1-00_3) with no apparent formation of shear cracks in the samples, as shown in Figure 8d. Finally, failure modes of Group E and F specimens were mainly governed by the ultimate bending capacity, which is evident from the observed vertical bending cracks (Figure 8e,f). No shear cracks were detected in Group E and F specimens; however, separations of concrete from BlueDeck were observed in specimens R200_1-00_3 and R200_0-75_3. Separations of concrete from BlueDeck steel sheet failure mode were less noticeable in Groups C, D, E, and F due to the added mass of the concrete slab, which contributed to the normal force that exists at interface between the two materials and eventually improved the friction force at the interface. Failure modes in tested samples were primarily determined by the concrete slab properties (depth and compressive strength), while changing the thickness of the BlueDeck steel sheet had a negligible effect. The failure modes were predominantly influenced by the concrete slab because the ultimate failure was largely governed by concrete cracking and crushing rather than yielding of the steel sheet. While the thicker steel sheet provided enhanced tensile capacity, it did not significantly affect the failure modes, as the primary determinant of failure was the concrete’s mechanical properties.

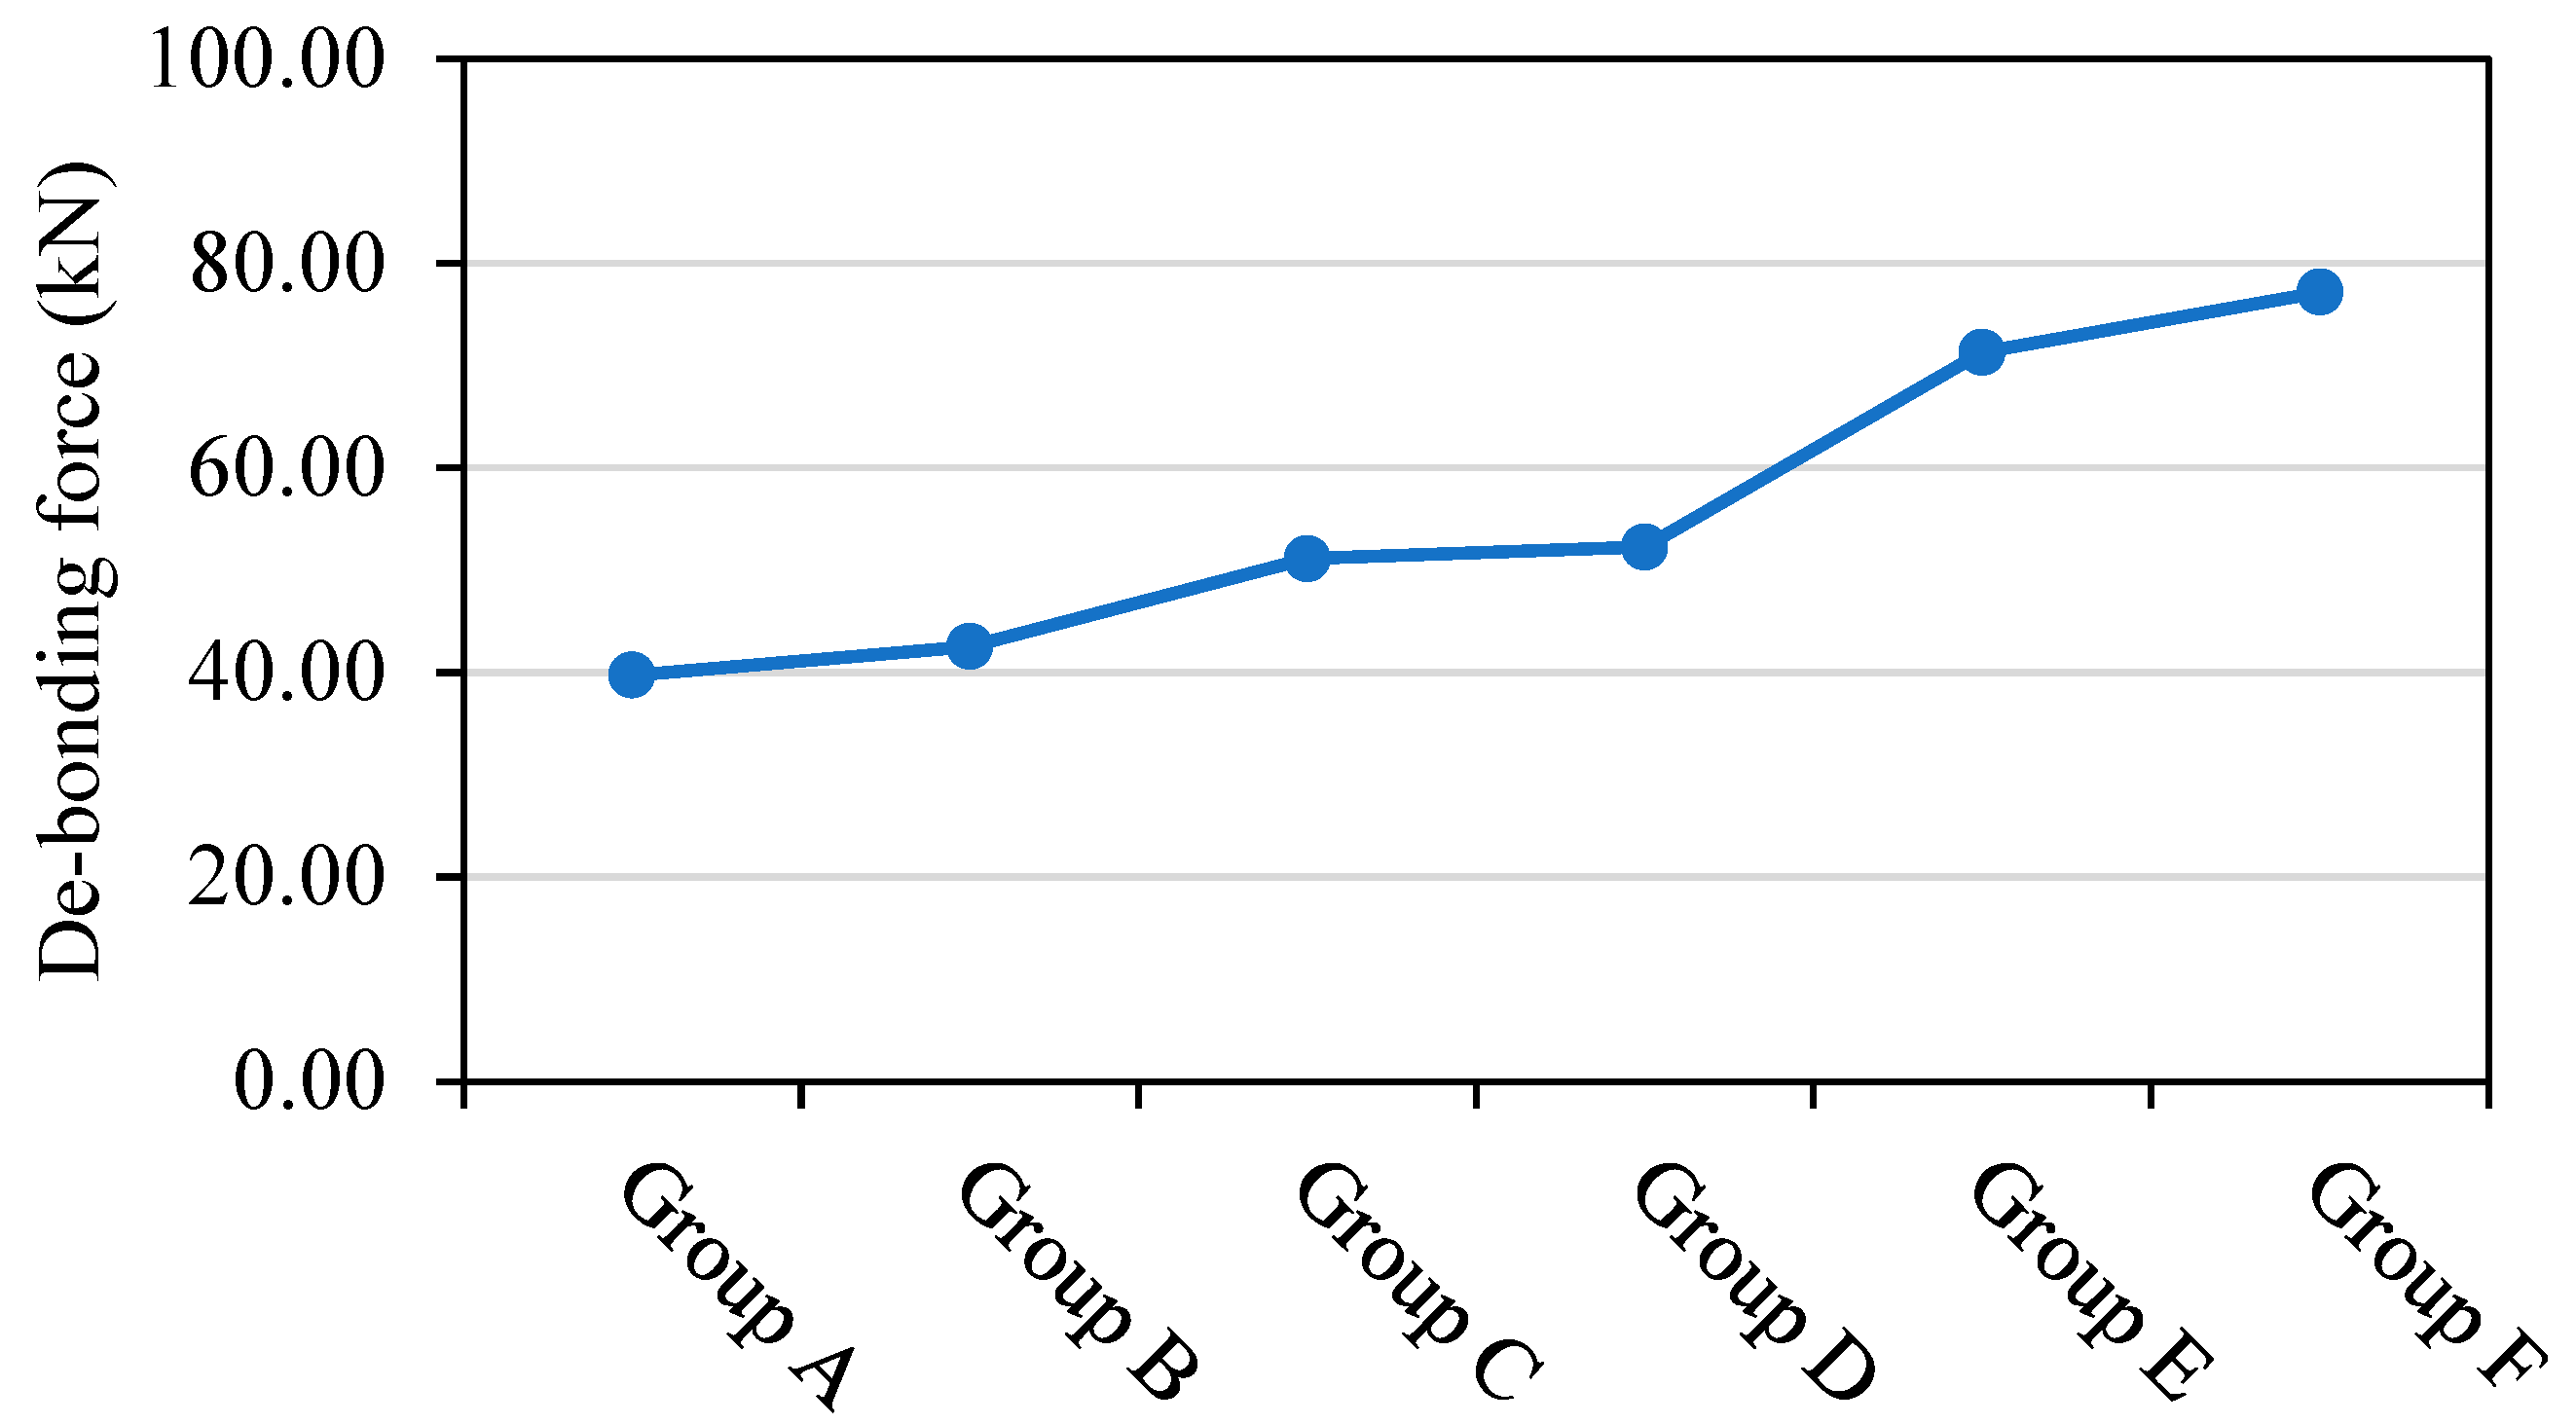
3.1.3. Relative Slip and De-Bonding Force

Relative slip and effective force at initial de-bonding are direct indicators of the attained degree of shear connection between concrete slab and BlueDeck steel sheeting. The measured relative slips and the corresponding initial de-bonding force are reported in Table 5. The reported relative slip in Table 5 is measured as the average of the LVDTs mounted at the roller support end of the test samples. The average measured slip for specimens of Groups A and B were 4.26 mm and 4.93 mm, respectively, whereas the average measured de-bonding force was 39.72 kN for Group A specimens and 42.53 kN for Group B specimens. The slight increase (7%) in the de-bonding force is attributed to the larger thickness of the BlueDeck steel sheets.
For the samples of Groups C and D, the average measured de-bonding forces were almost the same and reported at 51.11 kN for Group C specimens and 52.27 kN for Group D specimens. Contrarily, the average slips were different. Group C specimens had a 4.62 mm average slip, whilst the average slip of Group D specimens was 6.52 mm. Higher slip measurement of Group D specimens is attributed to a larger gap opening between the concrete slab and BlueDeck sheet, which resulted from the cracking of concrete during the initial stages of testing. As mentioned in Section 3.1.2, separations of materials at the interface failure mode were observed for Y175_1-00_1 and Y175_1-00_3 specimens.
Similarly, the average measured de-bonding forces of Group E and F specimens were 71.30 kN and 77.21 kN, respectively, with an 8% enhancement for Group F specimens. The slight increase (8%) in the de-bonding force is attributed to the larger thickness of the BlueDeck steel sheets. Accordingly, the average measured slip of Group E specimens was 3.54 mm, while it was measured at 3.94 mm (excluding the R200_1-00_3 slip measurement, as it was considered an outlier measurement) for Group F specimens. Higher slips in specimens R200_0-75_3 and R200_1-00_3 are attributed to a larger gap opening between the concrete slab and BlueDeck sheet, which resulted from the cracking of concrete during the initial stages of testing. As mentioned in Section 3.1.2, separations of materials at the interface as the failure modes were observed for specimens R200_0-75_3 and R200_1-00_3.
Overall, the average slip measurements for various groups illustrated a decreasing trend. Specimens with higher cross-sectional depth had lesser slip measurements, as depicted in Figure 9, which indicates that using larger depth of BlueDeck composite floor improves the shear connection at the interface between concrete slab and BlueDeck steel sheets. In contrary, the de-bonding force increased as the cross-sectional depth of the tested composite floors increased, which is evident from Figure 10. Regarding the de-bonding forces, specimens utilising the 175 mm concrete slab had an average increase of 26% compared to the specimens with the 150 mm concrete slab. Similarly, the specimens with the 200 mm concrete depth had an 81% average improvement compared to the specimens utilising the 150 mm concrete slab. As discussed in Section 3.1.2, the added mass from the concrete slab enhanced the friction at the interface between the two materials, ultimately improving the de-bonding force. Again, such behaviour indicates that using larger depth of BlueDeck composite floor improves the shear connection at the interface between concrete slab and BlueDeck steel sheets.

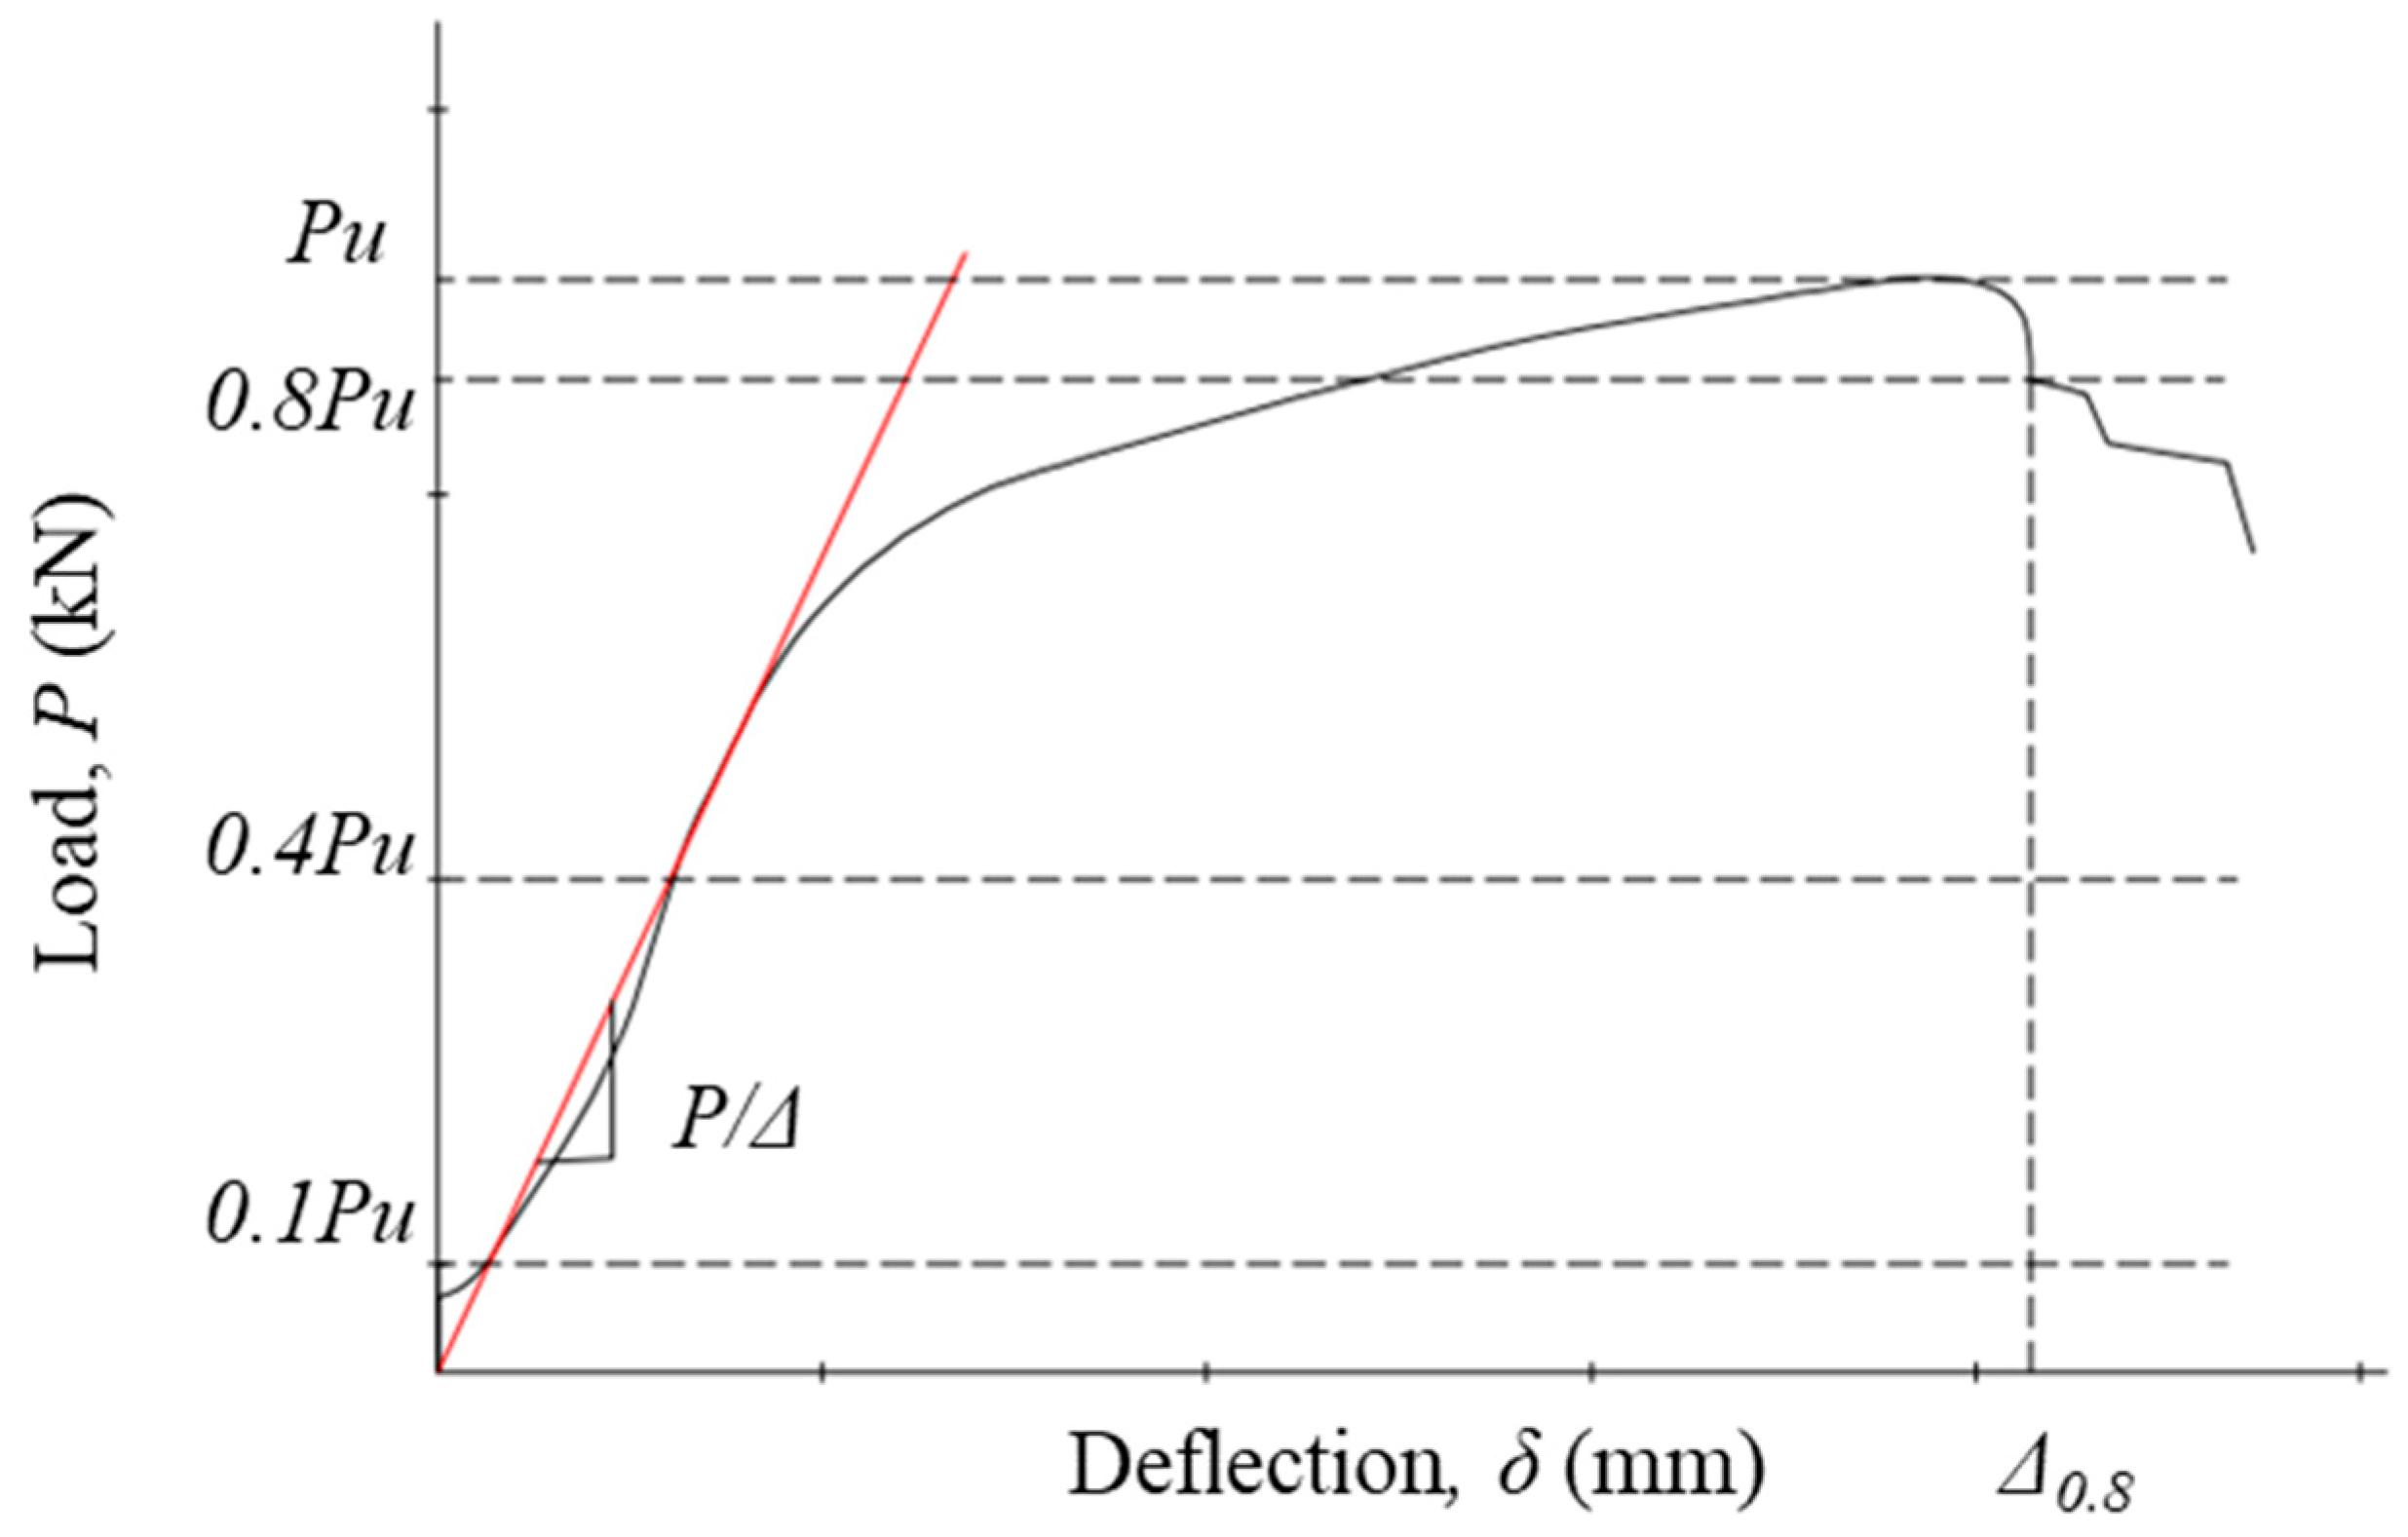
3.1.4. Flexural Stiffness
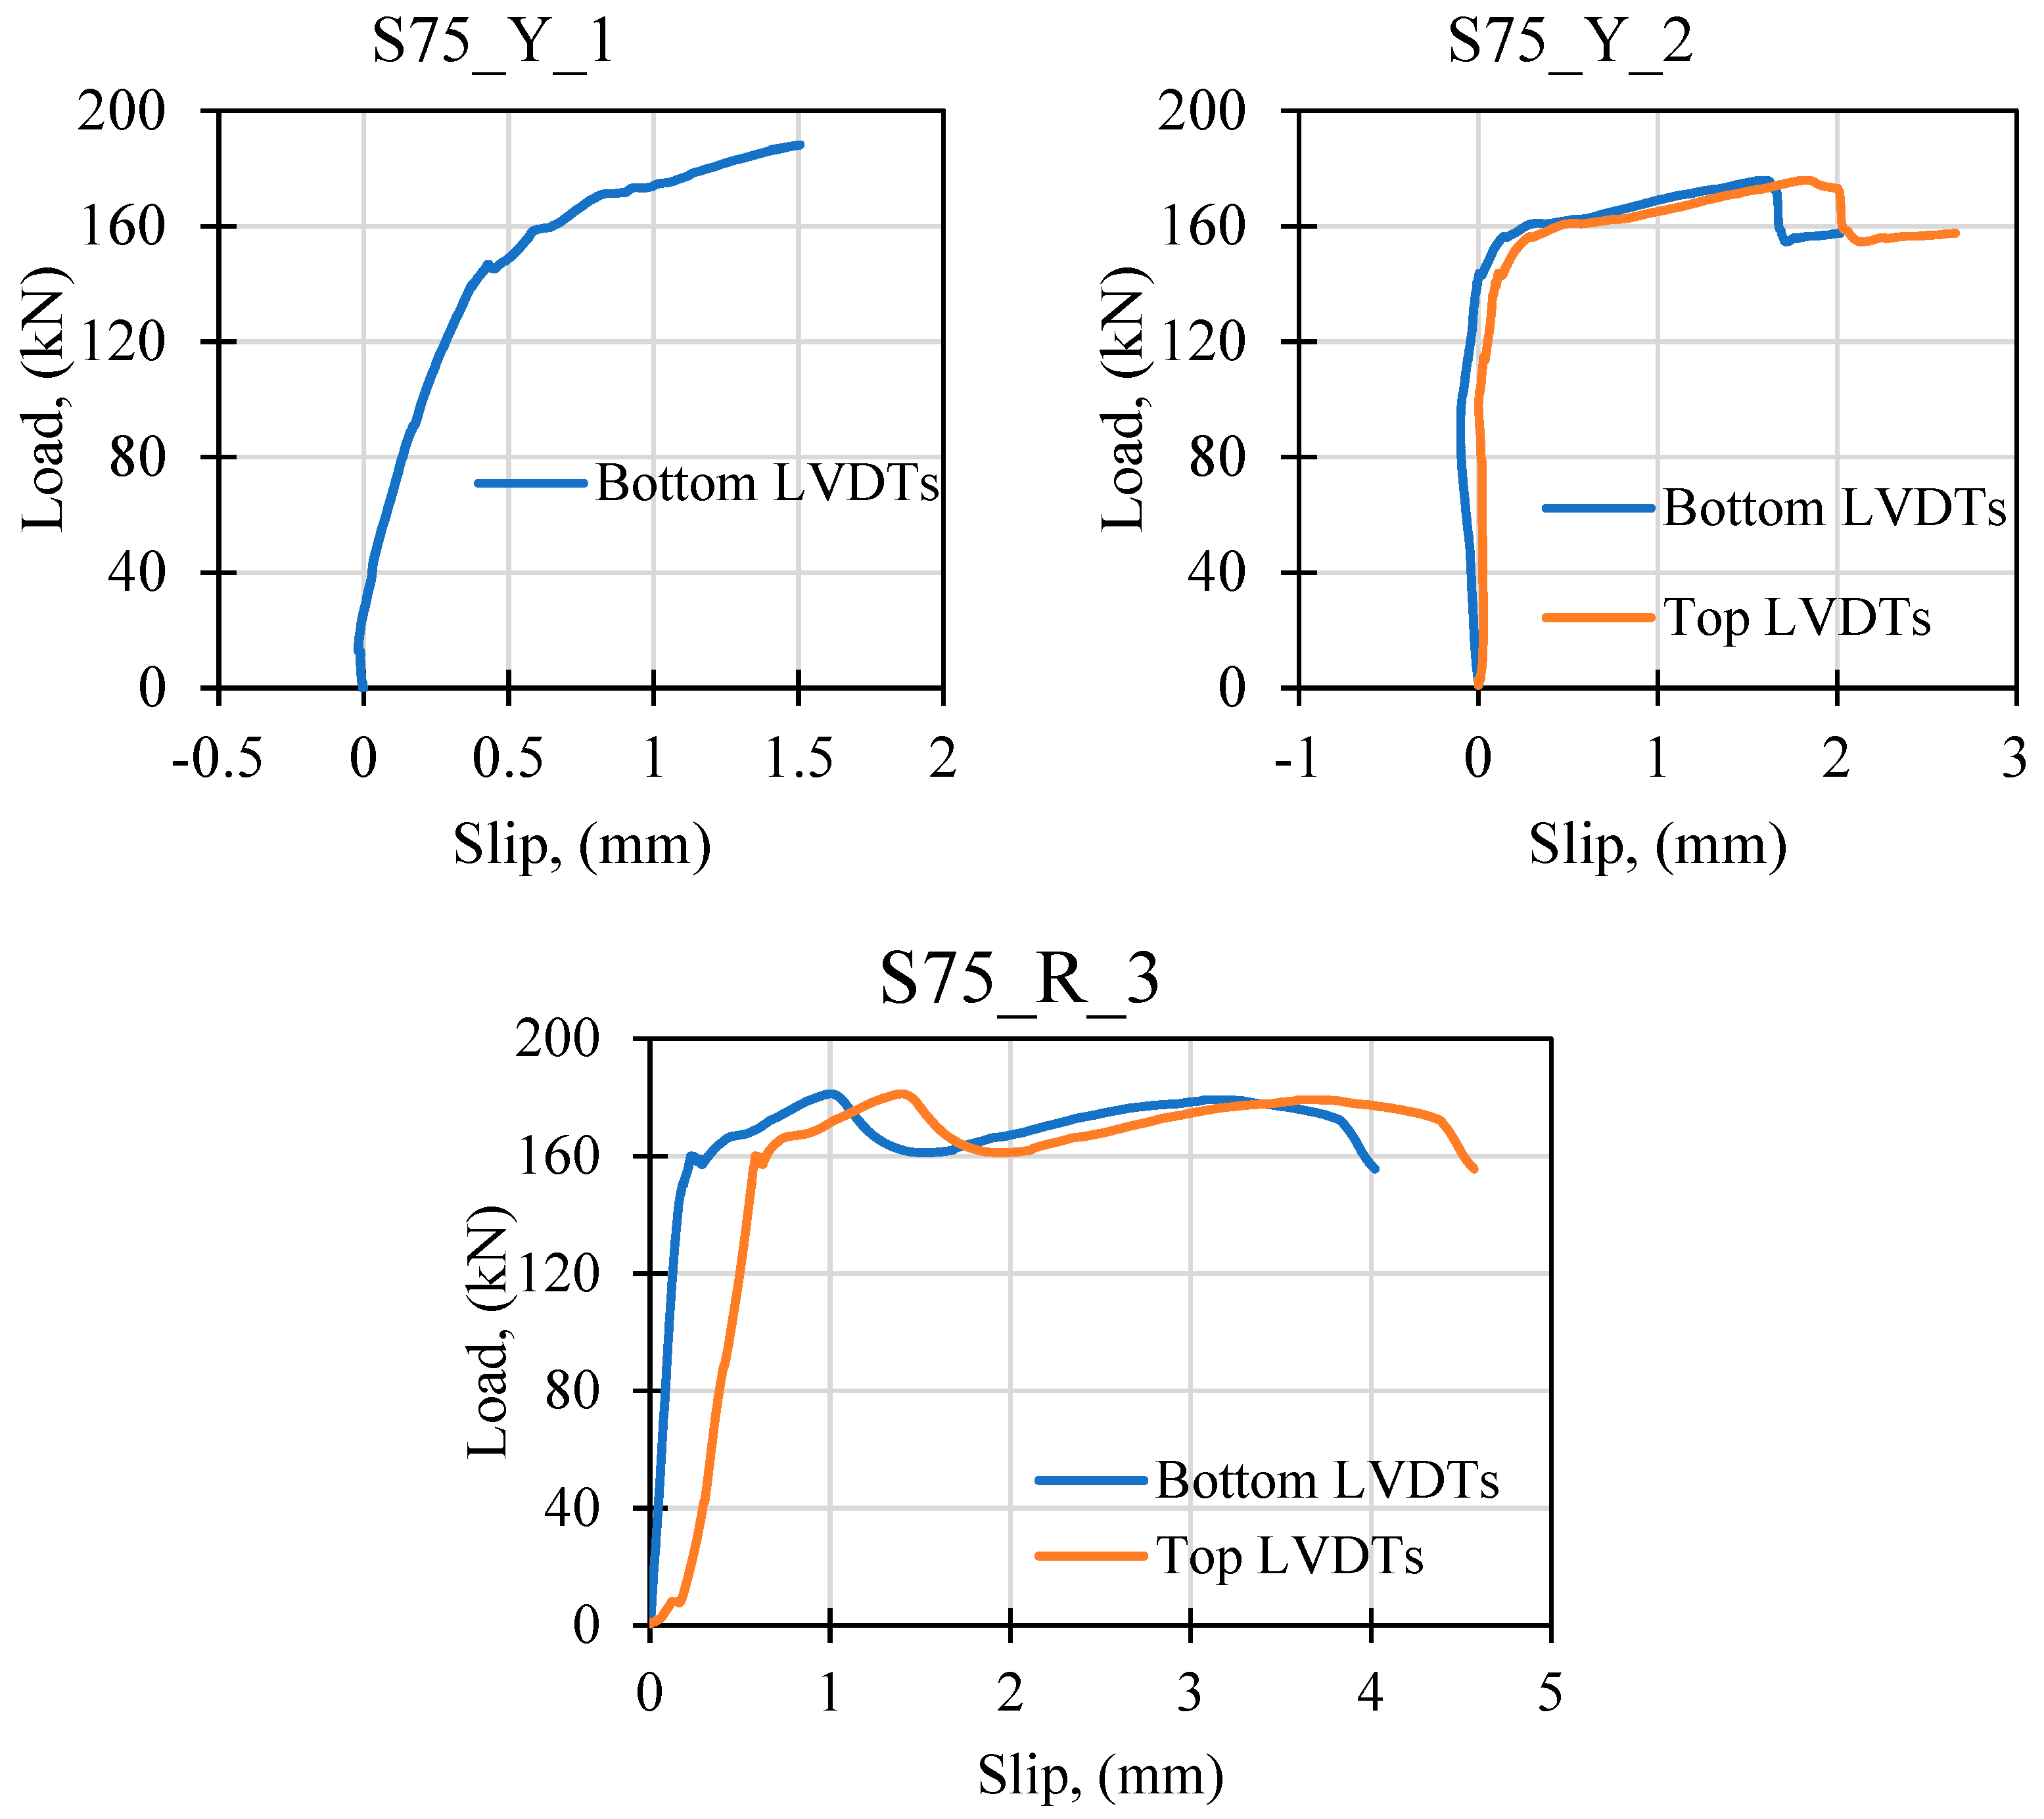
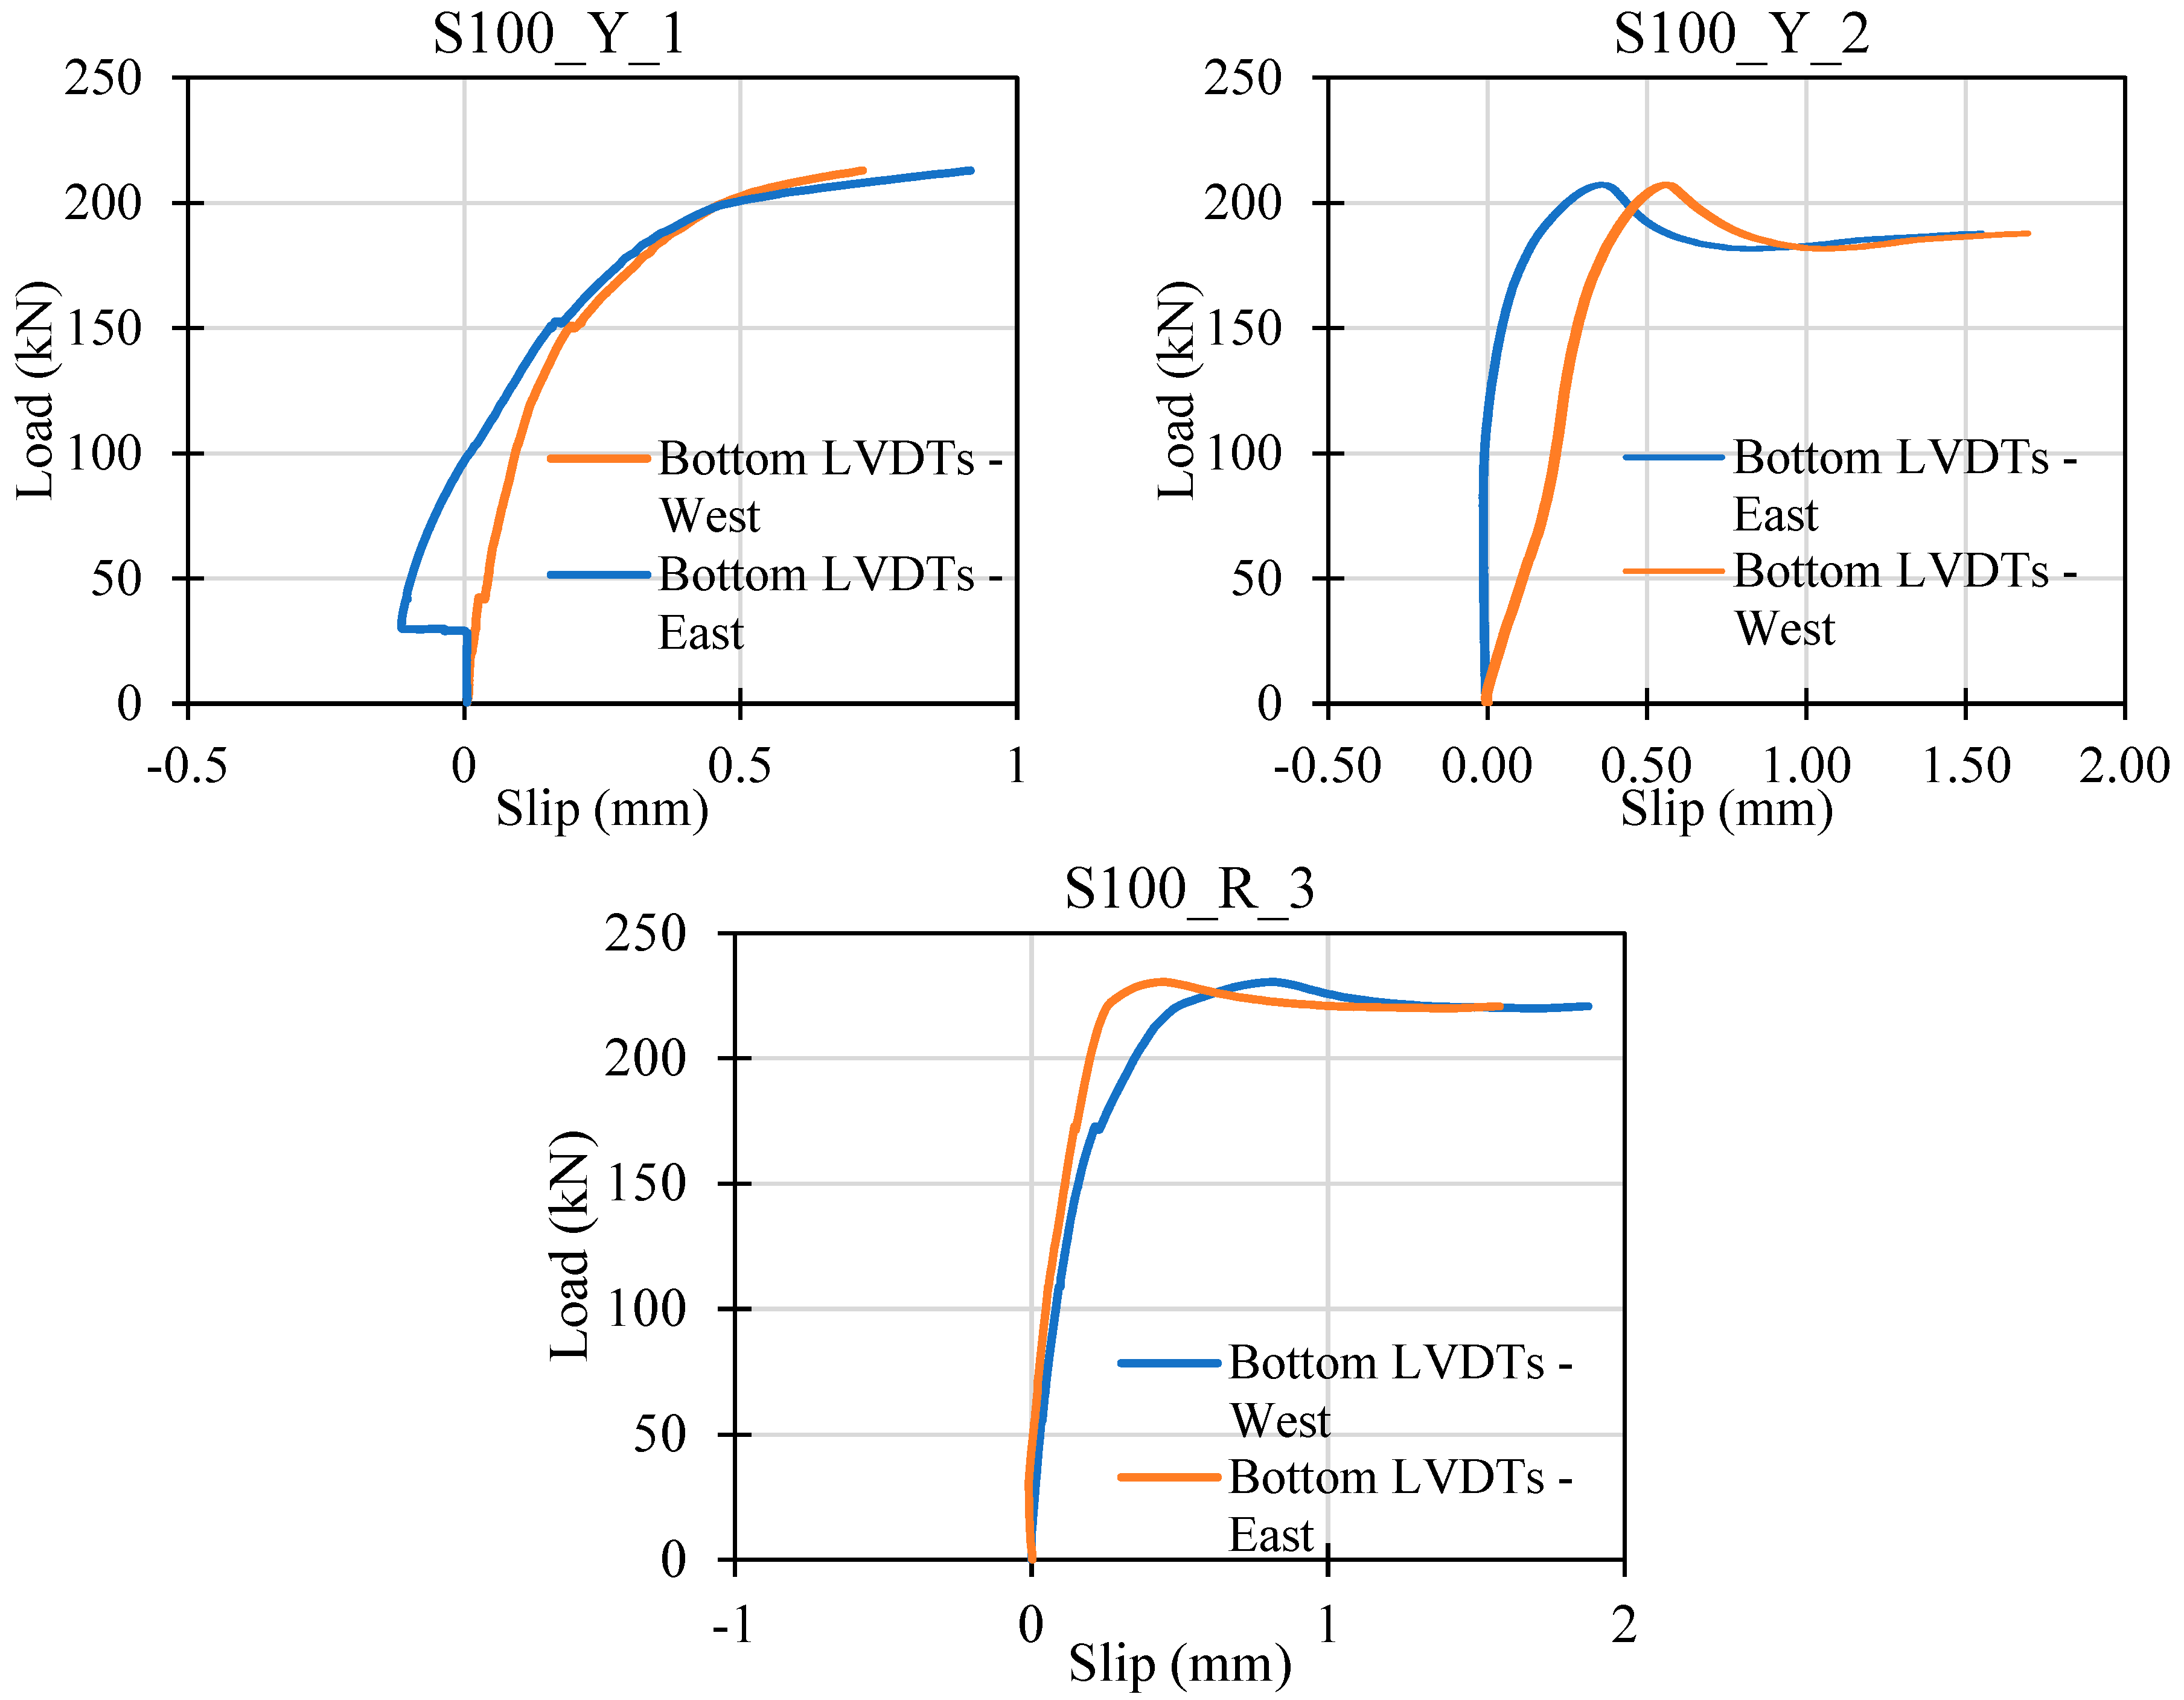
Two types of flexural stiffness were calculated for each tested composite floor based on the results from the four-point bending tests. First, the serviceability bending stiffness was determined based on Equation (2) (to ASTM D198-15 [25]), where L is the span, a is the shear span, and P/Δ is the slope of the load–deflection curve between 0.1Pu and 0.8Pu, which is the load level at serviceability limit state according to EN 26891:1991 [26].
E I = a 48 3 L 2 4 a 2 P
The ultimate bending stiffness was then calculated from the load–deflection curve using Equation (3), where Δ0.8 is the vertical deflection corresponding to 0.8Pu [26], as illustrated in Figure 11. The calculated bending stiffness values are reported in Table 6 and the average stiffness values for each group of specimens are depicted in Figure 12.
E I = a 48   3 L 2 4 a 2 0 . 8 P u 0.8
The data presented in Table 6 and illustrated in Figure 12 show that the serviceability bending stiffnesses were almost the same for all the tested composite samples, i.e., no significant changes in initial stiffnesses among the tested samples. The average serviceability stiffness for all specimens was 2970 kNm2 with a standard deviation of 80 kNm2, indicating low dispersions in serviceability stiffness measurements between the different BlueDeck–concrete composite floor samples. On the other hand, the ultimate bending stiffness was considerably different. The average ultimate bending stiffness of Group A specimens was 1142.48 kNm2, whilst it was measured at 942.33 kNm2 for Group B specimens. Similarly, the average ultimate stiffnesses for Group C and D specimens were 1369.35 kNm2 and 1624.25 kNm2, respectively. Also, the average ultimate stiffness of Group E specimens was 1687.91 kNm2, whereas it was calculated at 2336.82 kNm2 for Group F specimens. The ultimate bending stiffness increased as the depth of concrete slab and thickness of BlueDeck steel sheet increased, as illustrated in Figure 11. Except for Group B specimens, the thickness of the BlueDeck steel sheet improved the ultimate bending stiffness of Group D specimens by 19% compared to Group C specimens. Likewise, the ultimate bending stiffness of Group F specimens increased by 38% compared to specimens in Group E. In the same way, the concrete slab depth enhanced the ultimate bending stiffness by 44% for samples utilising 175 mm concrete slab and 93% for samples utilising the 200 mm concrete slab compared to the samples with 150 mm concrete slabs.
The decline in stiffness from serviceability state to the ultimate state is also recorded in Table 6. Specimens of Groups A and B showed the largest drops in the stiffness, which indicates that such specimens suffered extensive plastic deformation before reaching failure, although specimens of Groups A and B had the lowest ultimate bearing capacities. Samples with a 200 mm deep concrete slab had the highest load-bearing capacity but demonstrated less ductile behaviour. In general, samples with higher total cross-sectional depth expressed higher ultimate bearing capacities and exhibited milder plastic deformations before failure.

3.2. Shear Tests

The key results of the shear tests for the two sets of samples are reported in Table 6. In addition, the load–slip curves for the samples are shown in Figure 12 and Figure 13. It is inferred from Table 6 and Figure 7 that the thickness of the BlueDeck steel sheeting improved the shear capacity of the tested samples. The average shear capacity of Set B (BlueDeck thickness = 1 mm) samples was calculated at 212.42 kN, which is 16.83% higher than the reported average shear capacity of Set A samples at 181.82 kN. Accordingly, the measured relative slip for Set A samples was 2.87 mm, while the measure slip for Set B samples was 1.63 mm, which is 43% less than the slip in Set A specimens, suggesting that Set A samples exhibited larger plastic deformations before failure. Finally, the tested samples in both Sets A and B suffered a pure shear failure at the interface between the concrete slab and BlueDeck steel sheeting.
The BlueDeck profiled steel sheeting system, based on the findings of this study, offers a practical solution for use in large-span composite flooring applications where reducing material use, construction time, and costs are priorities. Practitioners should consider using deeper concrete slabs (e.g., 200 mm) to maximise load-bearing capacity and flexural stiffness, particularly in office buildings, car parks, and healthcare facilities. The ability of the system to achieve full composite action through its integrated shear keys allows for improved structural performance and minimal slip, making it suitable for applications requiring stringent structural integrity. Additionally, this system complies with AS/NZS 2327 standards, offering confidence in its suitability for projects requiring adherence to Australian design codes. For optimal application, careful consideration should be given to the specific load requirements and slab depths based on the project’s design criteria.
This study adds to the growing literature on modular composite systems, which have been shown to offer significant advantages in construction efficiency and sustainability. Previous research, such as studies by de Seixas et al. (2020) [17] and Hassan et al. (2021) [19], has demonstrated the value of prefabricated composite systems in enhancing load-bearing capacity and reducing construction timelines. The BlueDeck system, with its capacity for full composite action and superior performance under Australian standards, further validates the use of these systems in modern construction. Future research could focus on extending the application of this system by exploring its long-term durability, particularly under varying environmental conditions, as well as its fire resistance. These areas of exploration will help to further establish its viability across a wider range of construction applications and improve its adoption in the industry.

4. Conclusions

Eighteen BlueDeck composite floors were tested under four-point bending test conditions to measure the flexural behaviour of the proposed composite floor system. In addition, six shear tests were conducted to indicate the composite behaviour and mechanical properties of the connection between BlueDeck steel sheets and the concrete layer. All composite floor samples were fabricated and supplied by to UTS Tech Lab, and all tests (flexural and shear) were conducted at the Structural Lab facilities. Based on the experimental measurements and numerical calculations, it is apparent that samples with larger cross-sectional depth had higher ultimate bearing capacity. The concrete slab depth improved the peak load for the tested samples by 27% for samples utilizing a 175 mm concrete slab and 60% for samples with a 200 mm concrete slab compared to samples with a 150 mm deep concrete slab. The thickness of the BlueDeck steel sheets had less influence on the ultimate bearing capacity. For samples with a 150 mm concrete slab, 8% enhancement was reported. Also, 11% and 23% improvements were calculated for specimens with 175 mm and 200 mm concrete slabs, respectively. In flexural tests, all samples failed in a ductile manner, where the tested samples experienced three distinctive failure modes. Diagonal shear cracking, pure bending cracks, and separation of concrete from BlueDeck failure modes were observed. The thickness of the BlueDeck steel had insignificant influence on the failure mode. However, concrete slab depth had more effect on the failure mode of the tested samples due to the added mass from the concrete slab. The depth of the composite floors influenced the ultimate slip and de-bonding force of the tested specimens. Samples utilising a 200 mm concrete slab exhibited the least ultimate slip at failure and highest force at initial de-bonding force compared to specimens with concrete slab depths of 175 mm and 150 mm. The serviceability bending stiffness was similar for all the tested specimens. However, the ultimate bending stiffness improved as deeper sections of the composite floors were utilised. The samples with the least section depth had the highest decline in bending stiffness from the serviceability state to the ultimate state, which indicates that these specimens had demonstrated extensive plastic deformations before failure. Shear tests showed that the 1.00 mm thickness of the BlueDeck steel sheet produced 17% higher ultimate shear capacity and 43% lower ultimate slip compared to the samples utilising 0.75 mm steel sheets.
Based on the calculated ultimate design bending moments for the permanent load of 5.5 kPa and the imposed load of 3.0 kPa for the tested floors in this study, the average experimental ultimate bending moment capacities of the tested floors were significantly higher than the required design load level of residential and office buildings in practice for all the tested sample groups. In serviceability limit state, all the tested floors experienced mid-span deflections of less than the deflection limit of span/240 ratio for the de-sign requirements of a good alignment and visual quality importance.

Author Contributions

Conceptualization, H.F., S.N. and S.A.A.-H.; methodology, H.F., S.N. and S.A.A.-H.; validation, H.F. and S.N., formal analysis, H.F. and S.A.A.-H.; investigation, H.F. and S.A.A.-H.; resources, H.F. and S.N.; data curation, H.F. and S.A.A.-H.; writing—original draft preparation, H.F. and S.A.A.-H.; writing—review and editing, H.F. and S.N.; visualization, H.F. and S.A.A.-H.; supervision, H.F. and S.N.; project administration, H.F. and S.N.; funding acquisition, H.F. and S.N. All authors have read and agreed to the published version of the manuscript.

Funding

This research was funded by FTI Group Pty Ltd. grant number PRO22-15967.

Data Availability Statement

No new data were created or analysed in this study. Data sharing is not applicable to this article.

Conflicts of Interest

The authors declare no conflict of interest.

References

  1. Lin, X.; Far, H.; Saleh, A. Structural Behaviour and Mechanical Properties of Welded Steel I-Girders with Corrugated Webs. Int. J. Steel Struct. 2019, 19, 1342–1352. [Google Scholar] [CrossRef]
  2. Chourasia, A.; Singhal, S.; Manivannan. Prefabricated volumetric modular construction: A review on current systems, chal-lenges, and future prospects. Pract. Period. Struct. Des. Constr. 2023, 28, 03122009. [Google Scholar] [CrossRef]
  3. Haydar, H.; Far, H.; Saleh, A. Portal steel trusses vs. portal steel frames for long-span industrial buildings. Steel Constr. 2018, 11, 205–217. [Google Scholar] [CrossRef]
  4. Far, H. Flexural Behavior of Cold-Formed Steel-Timber Composite Flooring Systems. J. Struct. Eng. 2020, 146, 06020003. [Google Scholar] [CrossRef]
  5. Tam, V.W.Y.; Tam, C.M.; Zeng, S.X.; Ng, W.C.Y. Towards adoption of prefabrication in construction. Build. Environ. 2007, 42, 3642–3654. [Google Scholar] [CrossRef]
  6. Khan, K.; Chen, Z.; Liu, J.; Javed, K. State-of-the-art on technological developments and adaptability of prefabricated industrial steel buildings. Appl. Sci. 2023, 13, 685. [Google Scholar] [CrossRef]
  7. Srisangeerthanan, S.; Hashemi, M.J.; Rajeev, P.; Gad, E.; Fernando, S. Review of performance requirements for inter-module connections in multi-story modular buildings. J. Build. Eng. 2020, 28, 101087. [Google Scholar] [CrossRef]
  8. Srisangeerthanan, S.; Hashemi, M.J.; Rajeev, P.; Gad, E.; Fernando, S. Development of an innovative boltless connection for multistory modular buildings. J. Struct. Eng. 2022, 148, 04022085. [Google Scholar] [CrossRef]
  9. Lawson, R.M.; Ogden, R.G.; Bergin, R. Application of modular construction in high-rise buildings. J. Archit. Eng. 2012, 18, 148–154. [Google Scholar] [CrossRef]
  10. AL Hunaity, S.A.; Far, H.; Saleh, A. Vibration behaviour of cold-formed steel and particleboard composite flooring systems. Steel Compos. Struct. 2022, 43, 403–417. [Google Scholar]
  11. Karki, D.; Al-Hunaity, S.; Far, H.; Saleh, A. Composite connections between CFS beams and plywood panels for flooring systems: Testing and analysis. Structures 2022, 40, 771–785. [Google Scholar] [CrossRef]
  12. Loss, C.; Frangi, A. Experimental investigation on in-plane stiffness and strength of innovative steel-timber hybrid floor diaphragms. Eng. Struct. 2017, 138, 229–244. [Google Scholar] [CrossRef]
  13. Pan, W.; Yang, Y.; Yang, L. High-rise modular building: Ten-year journey and future development. Constr. Res. Congr. 2018, 2018, 523–532. [Google Scholar]
  14. Lawson, R.; Ogden, R.; Pedreschi, R.; Grubb, P.; Ola, S.P. Developments in pre-fabricated systems in light steel and modular construction. Transport 2005, 35, 15. [Google Scholar]
  15. Fang, J.; Bao, W.; Ren, F.; Pang, L.; Jiang, J. Behaviour of composite beams with beam-to-girder end-plate connection under hogging moments. Eng. Struct. 2021, 235, 112030. [Google Scholar] [CrossRef]
  16. Guan, Y.; Wang, J.; Shi, Y.; Zhao, S.; Zhou, T.; Yao, X. Study on in-plane and out-of-plane bearing capacity of cold-formed steel composite floor with opening. J. Build. Eng. 2023, 70, 106246. [Google Scholar] [CrossRef]
  17. De Seixas, L.; Alberto, A.L.; De Miranda Batista, E. Experimental investigation of composite floor system with thin-walled steel trussed beams and partially prefabricated concrete slab. J. Constr. Steel Res. 2020, 172, 106172. [Google Scholar] [CrossRef]
  18. Dar, M.A.; Subramanian, N.; Dar, A.R.; Ghowsi, A.F.; Sidiqui, F.; Fayaz, S.; Mir, M.S. Comparison of various shear connectors for improved structural performance in CFS concrete composite slabs. Eng. Struct. 2020, 220, 111008. [Google Scholar] [CrossRef]
  19. Hassan, M.K.; Subramanian, K.B.; Saha, S.; Sheikh, M.N. Behaviour of prefabricated steel-concrete composite slabs with a novel interlocking system—Numerical analysis. Eng. Struct. 2021, 245, 112905. [Google Scholar] [CrossRef]
  20. Zhang, Z.; Tan, Y.; Shi, L.; Hou, L.; Zhang, G. Current state of using prefabricated construction in Australia. Buildings 2022, 12, 1355. [Google Scholar] [CrossRef]
  21. AS/NZS 2327; Composite Structures—Composite Steel-Concrete Construction in Buildings. SAI Global: Sydney, Australia, 2017.
  22. AS 1397; Continuous Hot-Dip Metallic Coated Steel Sheet and Strip—Coatings of Zinc and Zinc Alloyed with Aluminium and Magnesium. SAI Global: Sydney, Australia, 2011.
  23. AS 3600; Concrete Structures. SAI Global: Sydney, Australia, 2018.
  24. AS/NZS 1170.1; Structural Design Actions Permanent, Imposed and Other Actions. SAI Global: Sydney, Australia, 2002.
  25. ASTM D198-15; Standard Test Methods of Static Tests of Lumber in Structural Sizes. ASTM International: West Conshohocken, PA, USA, 2015.
  26. BS EN 26891; Timber Structures—Joints Made with Mechanical Fasteners—General Principles for the Determination of Strength and Deformation Characteristics. British Standards Institution (BSI): London, UK, 1991.
  27. BS EN 12512; Timber Structures—Test Methods—Cyclic Testing of Joints Made with Mechanical Fasteners. British Standards Institution (BSI): London, UK, 2001.
Figure 1. Typical floor specimen setup for four-point bending tests (all dimensions are in mm): (a) Section. (b) Elevation.
Buildings 14 03204 g001
Figure 2. Test arrangement for typical four-point bending test: (a) Test set of a floor sample ready for testing. (b) Two LVDTs at each end face to measure lateral slip. (c) Two LVDTs at mid-span, under the sample to measure the vertical deflection.
Buildings 14 03204 g002
Figure 3. Clipped pan profile cross-section of 1.0 mm thick BlueDeck sheet.
Buildings 14 03204 g003
Figure 4. Typical arrangement of shear test sample (all dimensions are in mm).
Buildings 14 03204 g004
Figure 5. Typical arrangement of shear test.
Buildings 14 03204 g005
Figure 6. Load–deflection curves for various groups of specimens.
Buildings 14 03204 g006aBuildings 14 03204 g006b
Figure 7. Average ultimate bearing capacities of different groups.
Buildings 14 03204 g007
Figure 8. Observed failure modes for different groups of specimens: (a) Failure modes of Group A specimens. (b) Failure modes of Group B specimens. (c) Failure modes of Group C specimens. (d) Failure modes of Group D specimens. (e) Failure modes of Group D specimens. (f) Failure modes of Group D specimens.
Buildings 14 03204 g008aBuildings 14 03204 g008bBuildings 14 03204 g008c
Figure 9. Trend of the average slips for different groups.
Buildings 14 03204 g009
Figure 10. Trend of the average de-bonding forces for different groups.
Buildings 14 03204 g010
Figure 11. Definition of various stages of load in a typical load–deflection curve (BS EN 12512 [27]).
Buildings 14 03204 g011
Figure 12. Load–slip curves for Set A samples.
Buildings 14 03204 g012
Figure 13. Load–slip curves for set B samples.
Buildings 14 03204 g013
Table 1. Material specifications and section properties of the BlueDeck decking.
Thickness (mm) Mass (kg/m) Yield Strength (MPa) Cross-Sectional Area
(mm2)
Moment of Inertia (mm4) Section Modulus (mm3) Elastic Centroid
(mm)
0.759.065501153.86408,22031,35313.02
1.0011.875501511.93535,08539,05713.70
Table 2. Material properties of concrete.
Batch No.CodeCompressive Strength, fc
(MPa)
Density
(kN/m3)
Modulus of Elasticity
(MPa)
1R36.80240030,670
2Y39.00240031,573
Table 3. Key parameters of the tested flexural samples categorised into six different groups.
Specimen IDBlueDeck Thickness
(mm)
Concrete Depth
(mm)
Concrete Compressive Strength
(MPa)
Group A samples
Y150_0-75_10.75150.0039.00
R150_0-75_20.75150.0036.80
Y150_0-75_30.75150.0039.00
Group B samples
Y150_1-00_11.00175.0039.00
R150_1-00_21.00150.0036.80
Y150_1-00_31.00175.0039.00
Group C samples
Y175_0-75_10.75175.0039.00
R175_0-75_20.75175.0036.80
R175_0-75_30.75175.0036.80
Group D samples
Y175_1-00_11.00175.0039.00
Y175_1-00_21.00175.0039.00
Y175_1-00_31.00175.0039.00
Group E samples
Y200_0-75_10.75200.0039.00
R200_0-75_20.75200.0036.80
R200_0-75_30.75200.0036.80
Group F samples
R200_1-00_11.00200.0036.80
R200_1-00_21.00200.0036.80
R200_1-00_31.00200.0036.80
Table 4. Key parameters of the tested shear samples categorised into two sets.
Specimen IDBlueDeck Thickness
(mm)
Concrete Depth
(mm)
Concrete Compressive Strength
(MPa)
Set A
S75_R_10.75150.0036.80
S75_Y_20.75150.0039.00
S75_Y_30.75150.0039.00
Set B
S100_R_11.00150.0036.80
S100_Y_21.00150.0039.00
S100_Y_31.00150.0039.00
Table 5. Summary of the four-point bending test results.
Specimen IDPeak Load
(kN)
Load at Initial De-Bonding (kN)Max. Deflection (mm)Max. Slip–Pin Support (mm)Max. Slip–Roller Support (mm)
Group A
Y150_0-75_192.7144.7840.860.874.05
R150_0-75_265.2538.3541.060.874.05
Y150_0-75_376.2736.0456.161.644.67
Average78.0839.7246.021.134.26
Standard dev11.283.707.170.370.29
Group B
Y150_1-00_182.8245.0052.881.695.80
R150_1-00_287.8045.0060.85-2.077.60
Y150_1-00_383.2237.5961.172.501.40
Average84.6142.5358.300.714.93
Standard dev2.263.493.831.992.60
Group C
Y175_0-75_1100.7854.6051.853.215.71
R175_0-75_293.6745.0043.586.143.79
R175_0-75_398.7853.7344.133.154.36
Average97.7551.1146.524.174.62
Standard dev3.004.333.781.400.81
Group D
Y175_1-00_1118.1558.0348.651.486.39
Y175_1-00_2102.0444.3832.701.663.97
Y175_1-00_3105.3454.4055.041.929.19
Average108.5152.2745.471.696.52
Standard dev6.955.779.390.182.13
Group E
Y200_0-75_1114.0265.2624.430.332.28
R200_0-75_2121.8174.7332.714.260.96
R200_0-75_3114.4673.9239.200.547.38
Average116.7671.3032.121.713.54
Standard dev3.574.296.041.812.77
Group F
R200_1-00_1124.8988.3129.931.843.81
R200_1-00_2144.3869.8337.952.734.12
R200_1-00_3162.6773.4955.573.909.53
Average143.9877.2141.152.823.94
Standard dev15.427.9910.710.842.62
Table 6. Key test results of shear tests.
Specimen IDUltimate Shear Strength
(kN)
Ultimate Slip
(mm)
Set A
S75_Y_1188.231.50
S75_Y_2175.973.08
S75_R_3181.254.03
Average181.822.87
Set B
S100_Y_1213.010.92
S100_Y_2207.312.80
S100_R_3216.951.16
Average212.421.63
Disclaimer/Publisher’s Note: The statements, opinions and data contained in all publications are solely those of the individual author(s) and contributor(s) and not of MDPI and/or the editor(s). MDPI and/or the editor(s) disclaim responsibility for any injury to people or property resulting from any ideas, methods, instructions or products referred to in the content.

