Article

Influence of Thermal Environment on College Students’ Learning Performance in Hot Overhead Spaces in China

School of Architecture and Urban Planning, Guangzhou University, 230 Guangzhou Higher Education 5 Mega Center West Outer Ring Road, Panyu District, Guangzhou 510006, China
*
Author to whom correspondence should be addressed.
Buildings 2024, 14(10), 3225; https://doi.org/10.3390/buildings14103225 (registering DOI)
Submission received: 28 August 2024 / Revised: 27 September 2024 / Accepted: 9 October 2024 / Published: 11 October 2024
(This article belongs to the Section Architectural Design, Urban Science, and Real Estate)

Abstract

:
With the popularization of informal learning styles in universities, building overheads in hot and humid regions of China has become one of the main spaces for informal learning among college students in the region due to their improved thermal environmental conditions relative to outdoor spaces. However, the effects of thermal environmental changes on students’ learning performance on the overhead floors are not yet clear. Therefore, we recruited volunteers to conduct several tests, including the Stroop test, the Go/No-go test, the 2-back test, and the 3-back test, in the overhead space of a building in September and October. This was followed by a questionnaire survey, which yielded a total of 500 samples. Learning performance was quantified as a total of accuracy, response time, and final performance metrics. The results show that in hot and humid regions of China, the thermal perception of college students in the overhead was mainly related to Ta and Tmrt, and the relationship with Va was not significant; the maximum acceptable physiological equivalent temperature of college students in the overhead space was 30.3 °C; the change in the thermal environment had an effect on the learning performance of the four tests, and under neutral to slightly warm temperature (22.1–31.2 °C physiological equivalent temperature), the learning performance of the perceptually oriented and short-term memory task types increased by 2.5% and 1.1%, and the relationship between thermal environment and learning performance was not significant when the short-term memory task became more difficult. Attention-oriented learning had a relationship between the spatial thermal environment and learning performance in overhead spaces in hot and humid regions and suggests a basis for future overhead retrofitting.

1. Introduction

The effect of the thermal comfort of the indoor environment on the cognitive performance of students during learning can be considered as a determinant of the effectiveness of teaching [1,2]. For example, room temperature is associated with academic performance [3,4], and poor indoor air quality is hazardous to health and makes working difficult [5,6]. While air conditioning can provide a stable and comfortable indoor thermal climate, a significant proportion of modern building energy consumption is accounted for by Heating, Ventilation, and Air Conditioning (HVAC) systems [7,8]. In the tropics, HVAC systems are responsible for more than 50% of the total energy consumption of a building [8]. Prolonged work in artificial environments can cause human health problems [9,10]. In addition, poor indoor air quality poses health risks and has a negative impact on work [5,6]. Studies have shown that exposure to natural landscapes can be a source of stress reduction and positive emotions in people [11], and that people have a greater tolerance for thermal comfort in semi-outdoor and outdoor environments compared to indoor environments [12]. It is therefore necessary to promote outdoor activities and appropriate outdoor work, which not only enhances one’s physical and mental health but also reduces energy consumption and ameliorates the UHI.
Several previous studies have focused on the relationship between thermal comfort and students’ academic performance in controlled indoor environments. In Sarbu and Pacurar’s study, the academic performance of the subject students increased and then decreased with increasing temperature, with the highest academic performance at 27 °C [13]. Lan et al. learned from students performing seven neurobehavioral tasks in a controlled room that 24 °C had the highest learning performance [14]. Wang et al. investigated the effects of indoor thermal environments on occupants’ mental load and task performance and found that the optimal temperature range was between 22.6 °C and 26.0 °C, and the relative humidity range was between 50% and 68% [15]. Barbic et al. found better cognitive performance, and therefore energy savings, in a cooler indoor environment during the cold season [16]. In addition, studies have discussed the different effects of thermal environments on different dimensions of learning ability. Cho et al. found that there was a peak in the effect of indoor temperature on students’ thinking ability and that when the temperature deviated from 26 °C, people’s ability to think began to decline [17]; Pradhan et al., on the other hand, concluded that 23–26 °C significantly improved working memory performance [18]. This means that thermal environments have differential effects on multiple learning dimensions such as problem solving and memory. Gündogdu et al. also examined the effects of shaded outdoor spaces on thermal acclimatization and cognitive performance of college students in a classroom setting and found that experiencing shaded outdoor spaces helped improve students’ attentional performance (CP) [19].
Guangzhou is a typical city in the hot and humid region of China, where high population and building densities lead to increased building energy consumption [20], increased UHI effects, and the deterioration of the thermal environment. At the same time, differences in spatial factors such as building height and density directly affect the absorption and reflection of solar radiation, leading to temperature fluctuations in different built environments, and thus resulting in spatial heterogeneity of social activities [21]. Elevated floors are a common type of semi-outdoor space on the ground floor of a building between outdoor and indoor spaces in Guangzhou [22,23]. They are open on all sides, providing not only shade but also a close relationship with the outdoor landscape. Acero et al. found that the average thermal comfort level in semi-outdoor spaces in Singapore varied significantly less over the diurnal cycle, with the average always within the acceptable thermal comfort range. Therefore, for hot and humid areas, it is important to utilize overhead space to increase outdoor activity space and reduce building energy consumption [24]. Furthermore, with the spread of informal learning [25], in that semi-outdoor learning spaces are becoming increasingly popular among students and faculty at Tropical University [26], there is a need for an assessment of the thermal comfort and learning performance of students on overhead floors.
The relationship between thermal comfort and students’ learning performance on overhead floors has not been fully explored. Overhead floors offer spatial openness and landscape views, influencing students’ thermal perception and learning performance. This study aims to investigate this relationship by measuring the thermal environment of university teaching buildings’ overhead floors in Guangzhou during September and October. We assess how environmental parameters affect thermal comfort and learning performance, providing insights and recommendations for renovating overhead floors in hot and humid areas.

2. Materials and Methods

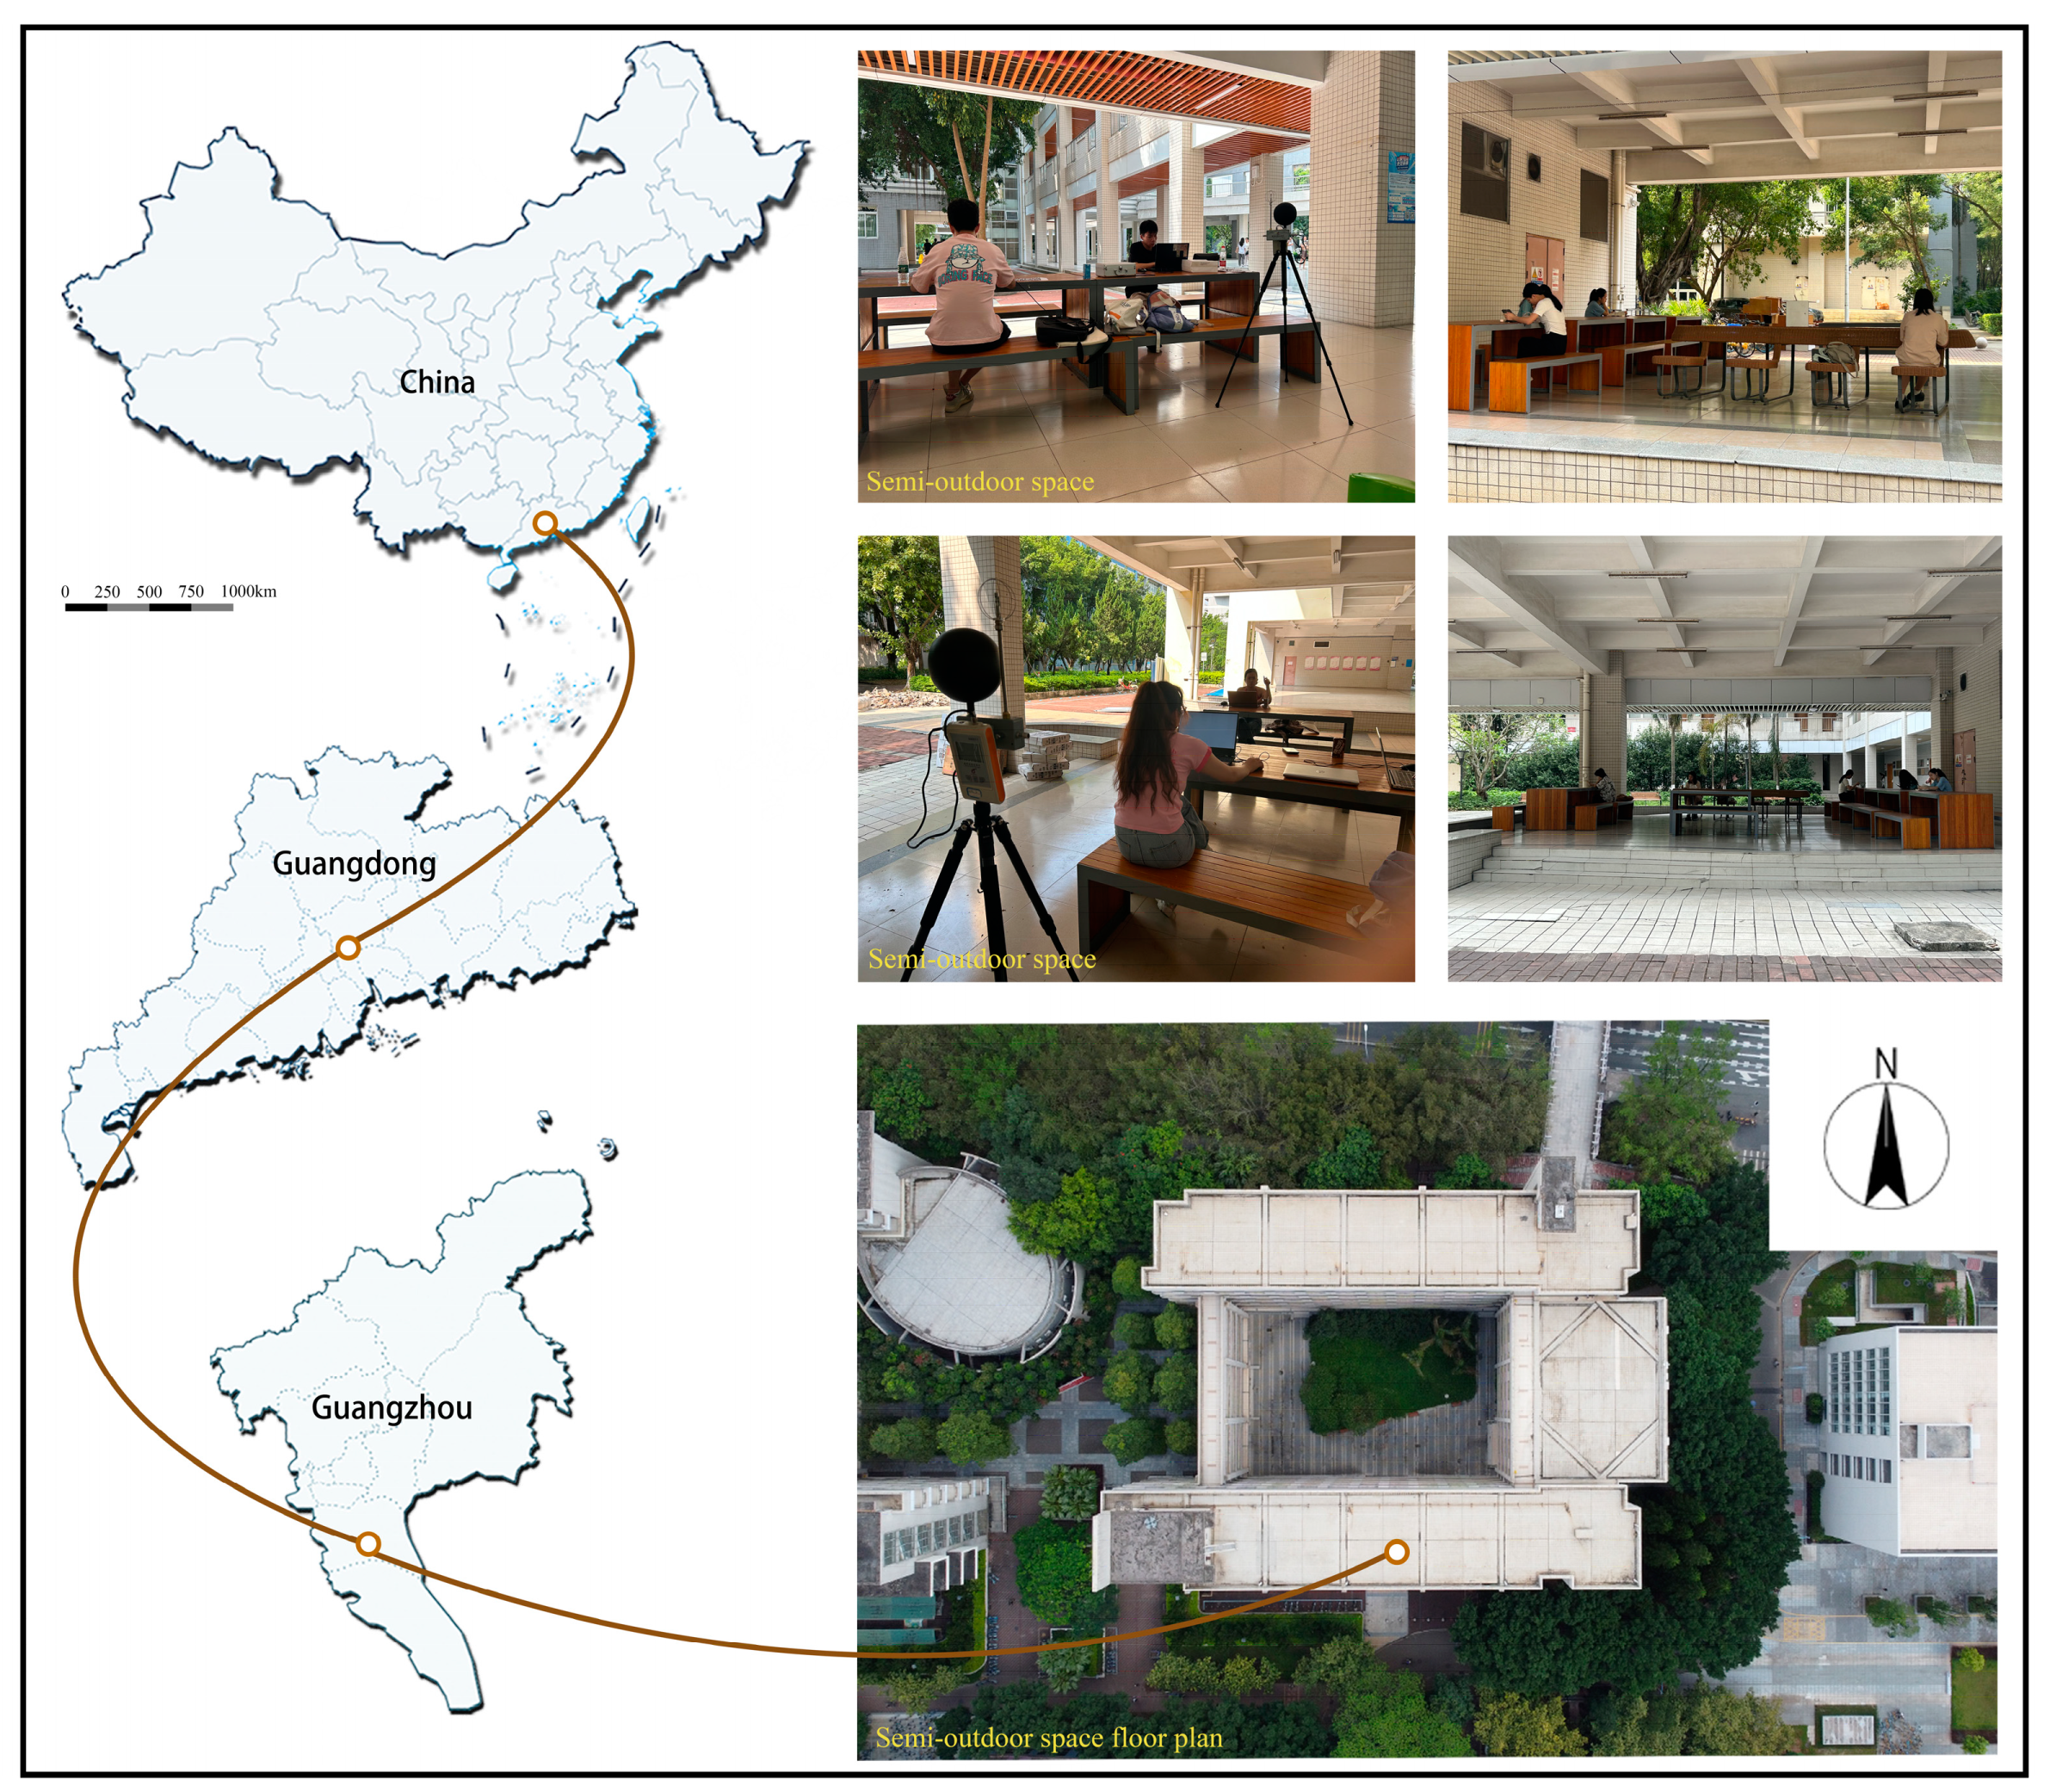
2.1. Study Area and Weather Conditions

This study was conducted in Guangzhou City, located in a hot and humid region in the southern part of China, between 112.8° and 114.2° E, and 22.3° and 24.1° N. The summer is hot and humid with abundant rainfall. The average annual temperature and humidity in the region are 22 °C and 77%, respectively, with the hottest months being July and August [27]. The combination of high temperatures and high humidity in Guangzhou during the summer causes residents to experience moderate to severe heat stress on a regular basis [28]. The research site was selected in a teaching building with a courtyard at Guangzhou University, which consists of a U-shaped teaching building and a connecting corridor, with elevated space and tables and chairs on the first floor, providing sufficient space for activities and studies, and a courtyard surrounded by a U-shaped building with some greenery on the north side. On the south side, there is a hard road and a green belt consisting of several large trees. It is a seven-story, 24-meter-high, reinforced concrete frame structure, as shown in Figure 1.
Since the students have summer vacation in July and August, and the seasonal division method in meteorology is not suitable for the hot and humid Guangzhou area, September and October still belong to summer in the typical weather of Guangzhou. Therefore, this experiment was conducted in September and October. The dates are 23, 26–27 September 2023, from 9 a.m. to 5 p.m., and 7, 16–17 October 2023, from 9 a.m. to 5 p.m. The experiments were conducted in September and October [29]. The specific environmental parameters are shown in Figure 2, which shows that there is a temperature difference between September and October and a slight difference in relative humidity. The temperature in September ranged from 28.3 °C to 34.1 °C with an average temperature of 31.8 °C, while the temperature in October ranged from 23.9 °C to 29.3 °C with an average temperature of 25.7 °C. The humidity in September ranged from 60.3% to 88.8%, with an average of 71.9%. The humidity in October ranged from 52.4% to 72.4%, with a mean of 59.8%. Overall wind speeds ranged from 0 m/s to 2.3 m/s, with a mean of 0.4 m/s in September and 0.6 m/s in October, with a slight increase in wind speed in October, but the difference was not significant. The next study referred to September as Stage 1 and October as Stage 2. Specific meteorological parameters are shown in Table 1.

2.2. Measured Parameters and Instruments

Ta, Va, RH, and Tg were recorded every minute at the overhead location using the SSDZY-1 Thermal Comfort Instrument. The manufacturer is Beijing Tianjian Huayi Science and Technology Development Co., Ltd. (Beijing, China) and the country of origin is China.Detailed information about the equipment used in the experiment is listed in Table 2. the instrument was placed at a distance of 1.0 m from the subjects [30].The black sphere thermometer had a diameter (D) of 0.15 m and a spherical emissivity (εg) of 0.95.
The following formula is used to calculate the average radiant temperature (Tmrt).
T m r t = T g + 273 4 + 1.1 × 10 8 × V a 0.6 ε g × D 0.4 × T g T a 1 4 273.15
where Tg is the black sphere temperature (°C), Va is the wind speed (m/s), ε is the Earth’s emissivity, D is the Earth’s diameter (m), and Ta is the air temperature (°C).

2.3. Outdoor Thermal Comfort Index

PET is an outdoor thermal environment evaluation metric derived from the energy balance equation (Munich Energy Balance Model) and has been incorporated into the German VDI 3787 [31]. It expresses the complex conditions of the outdoor environment as the equivalent air temperature of a typical indoor environment (i.e., without air movement or solar radiation) [32]. Its applicability has been proven in many climatic regions of the world [33]. Examples include Guangzhou [34], Singapore [35], and Hong Kong [36] in China. Therefore, this study used RayMan Pro software to calculate PET and quantitatively evaluated the outdoor thermal comfort level using this metric.

2.4. Survey Questionnaire

A questionnaire survey was conducted to investigate the thermal comfort and satisfaction of the participants. As shown in Table 3, the questionnaire is divided into three parts; the first part relates to personal information, including gender, age, weight, height, and clothing conditions. Clothing insulation (Clo) was calculated based on ASHRAE Standard 55 [37] and ISO Standard 7730 [38].
The second part evaluates people’s thermal perception, including the Thermal Sensation Vote (TSV), Thermal Comfort Vote (TCV), Thermal Acceptability Vote (TAV), and Thermal Preference Vote (TPV). The ASHRAE 7-point Thermal Sensation Vote (TSV) scale (−3 (cold), −2 (cool), −1 (slightly cool), 0 (neutral), +1 (slightly hot), +2 (hot), and +3 (hot)) is used to determine the neutral temperature for the respondents. TCV is a vote on thermal comfort conditions, indicating satisfaction with the thermal environment. TAV is a vote on people’s reported thermal acceptability in the thermal environment. TPV is a vote on people’s expectations or preferences for the current thermal environment.
The third part refers to the questionnaire from the Occupational Fatigue Working Group of the Japan Industrial Health Association to evaluate participants’ degree of fatigue [39]. This questionnaire is also used for relevant research on the indoor thermal environment [40]. The questionnaire covers three types of subjective symptoms of fatigue: the first group includes terms such as “drowsiness and dullness”, the second group covers terms related to “mental fatigue”, and the third group comprises terms associated with “lack of physical integration”.

2.5. Cognitive Test

Neurobehavioral tests have been used to evaluate the impact of indoor environmental quality on human performance [41,42,43,44]. These tests primarily examine various neurobehavioral abilities, including perception, memory, attention, thinking, and emotional control. The current tests mainly assess learning performance from three dimensions: perceptual ability, memory ability, and concentration ability. The aim is to explore the relationship between different dimensions of learning performance and the thermal environment. Participants underwent four cognitive tests, including the Stroop test, the Go/No-go test, and the N-back test, with the N-back test including 2-back and 3-back versions to assess short-term memory abilities at different levels of difficulty.
The Stroop test focuses primarily on a person’s perceptual ability. Participants are presented with a series of color words in different colors. When the color of the word matches its meaning (e.g., the word “red” written in red), the participant needs to press a specific button; however, when the color of the word does not match its meaning (e.g., the word “red” written in green), they need to press a different button. Learning performance is evaluated based on response time and accuracy [45].
The Go/No-go test is primarily designed to assess a person’s attention. Researchers present a series of stimuli, such as images or words, where some are designated as “Go” stimuli, requiring participants to press a button quickly and accurately, while the rest are “No-go” stimuli, requiring participants to inhibit the urge to press the button. This test is divided into two sections, with a total of 40 stimuli presented. The accuracy rate and total reaction time for correct responses are recorded for the participants. Based on these metrics, learning performance is calculated.
The N-back test primarily focuses on a person’s short-term memory ability. Participants are presented with a random letter stimulus, followed by a series of stimuli presented continuously at a fixed time interval. At each stimulus presentation, the participant is required to compare it with the reference stimulus. If the current stimulus matches the nth previous stimulus, the participant needs to respond as quickly as possible, such as pressing a button or performing other specified actions [46]. For this experiment, the 2-back and 3-back versions were selected.
Finally, learning performance is quantified by calculating the average accuracy rate (ACC) and average reaction time (ART) of students completing each test item. ACC represents the percentage of correct answers, while ART refers to the time taken to complete the task. LP stands for the overall correct completion rate of each task [47]. The relationship between them is as follows:
L P = ( A C C 0.5 * ( 1 / A R T ) 0.5 ) 2
All experiments were conducted on a computer using the software E-prime 3.0, which is a psychological experiment platform capable of presenting stimuli such as text, images, and sounds (any combination of the three can be presented simultaneously) and providing accurate ACC and ART for a further data analysis. Additionally, this software enables random sequencing of stimuli to avoid recognizable patterns of stimulus repetition [48].

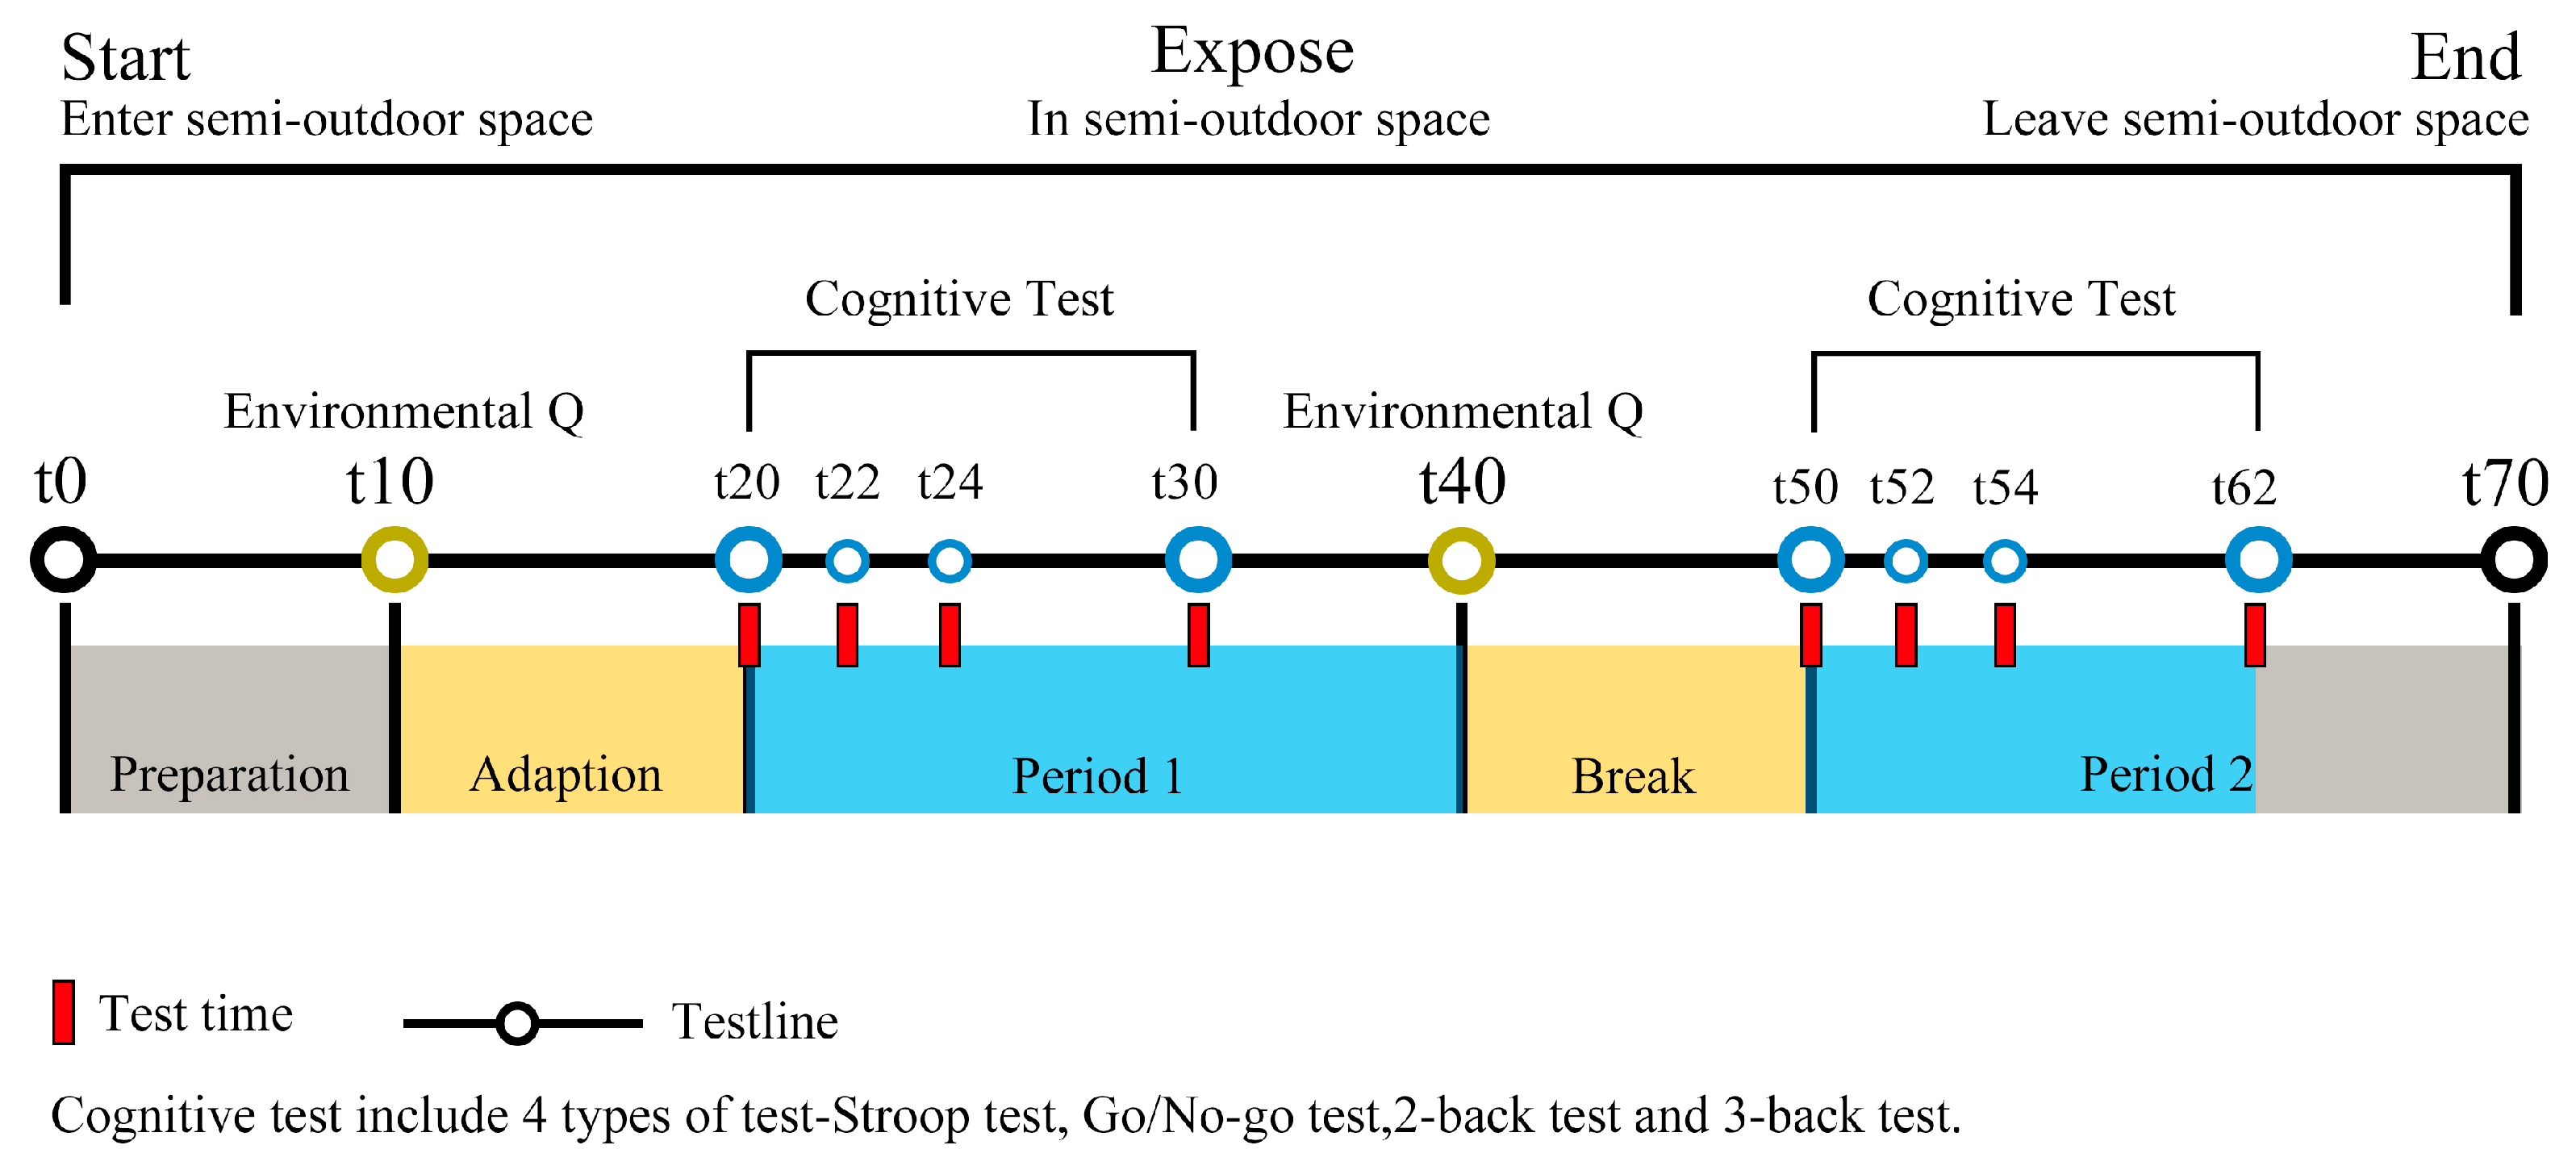
2.6. Experimental Procedures

To ensure the representativeness of the data, 38 college students from different grades and genders were invited to participate, and all of them were from Guangzhou University with the same level of familiarity with the overhead space. They were instructed to avoid late nights, caffeine, and alcohol before the experiment to ensure familiarity with the procedure; a pre-experiment was conducted one week prior. As shown in Figure 3, subjects underwent a 20 min sedentary adaptation period in the overhead space, during which they completed an initial environmental perception questionnaire. This was followed by randomized cognitive tests to avoid learning effects. After the tests, they filled out the perception questionnaire again. Each experiment included a 10 min break between tests. The experiment ran from 9:00 a.m. to 5:00 p.m.

3. Results

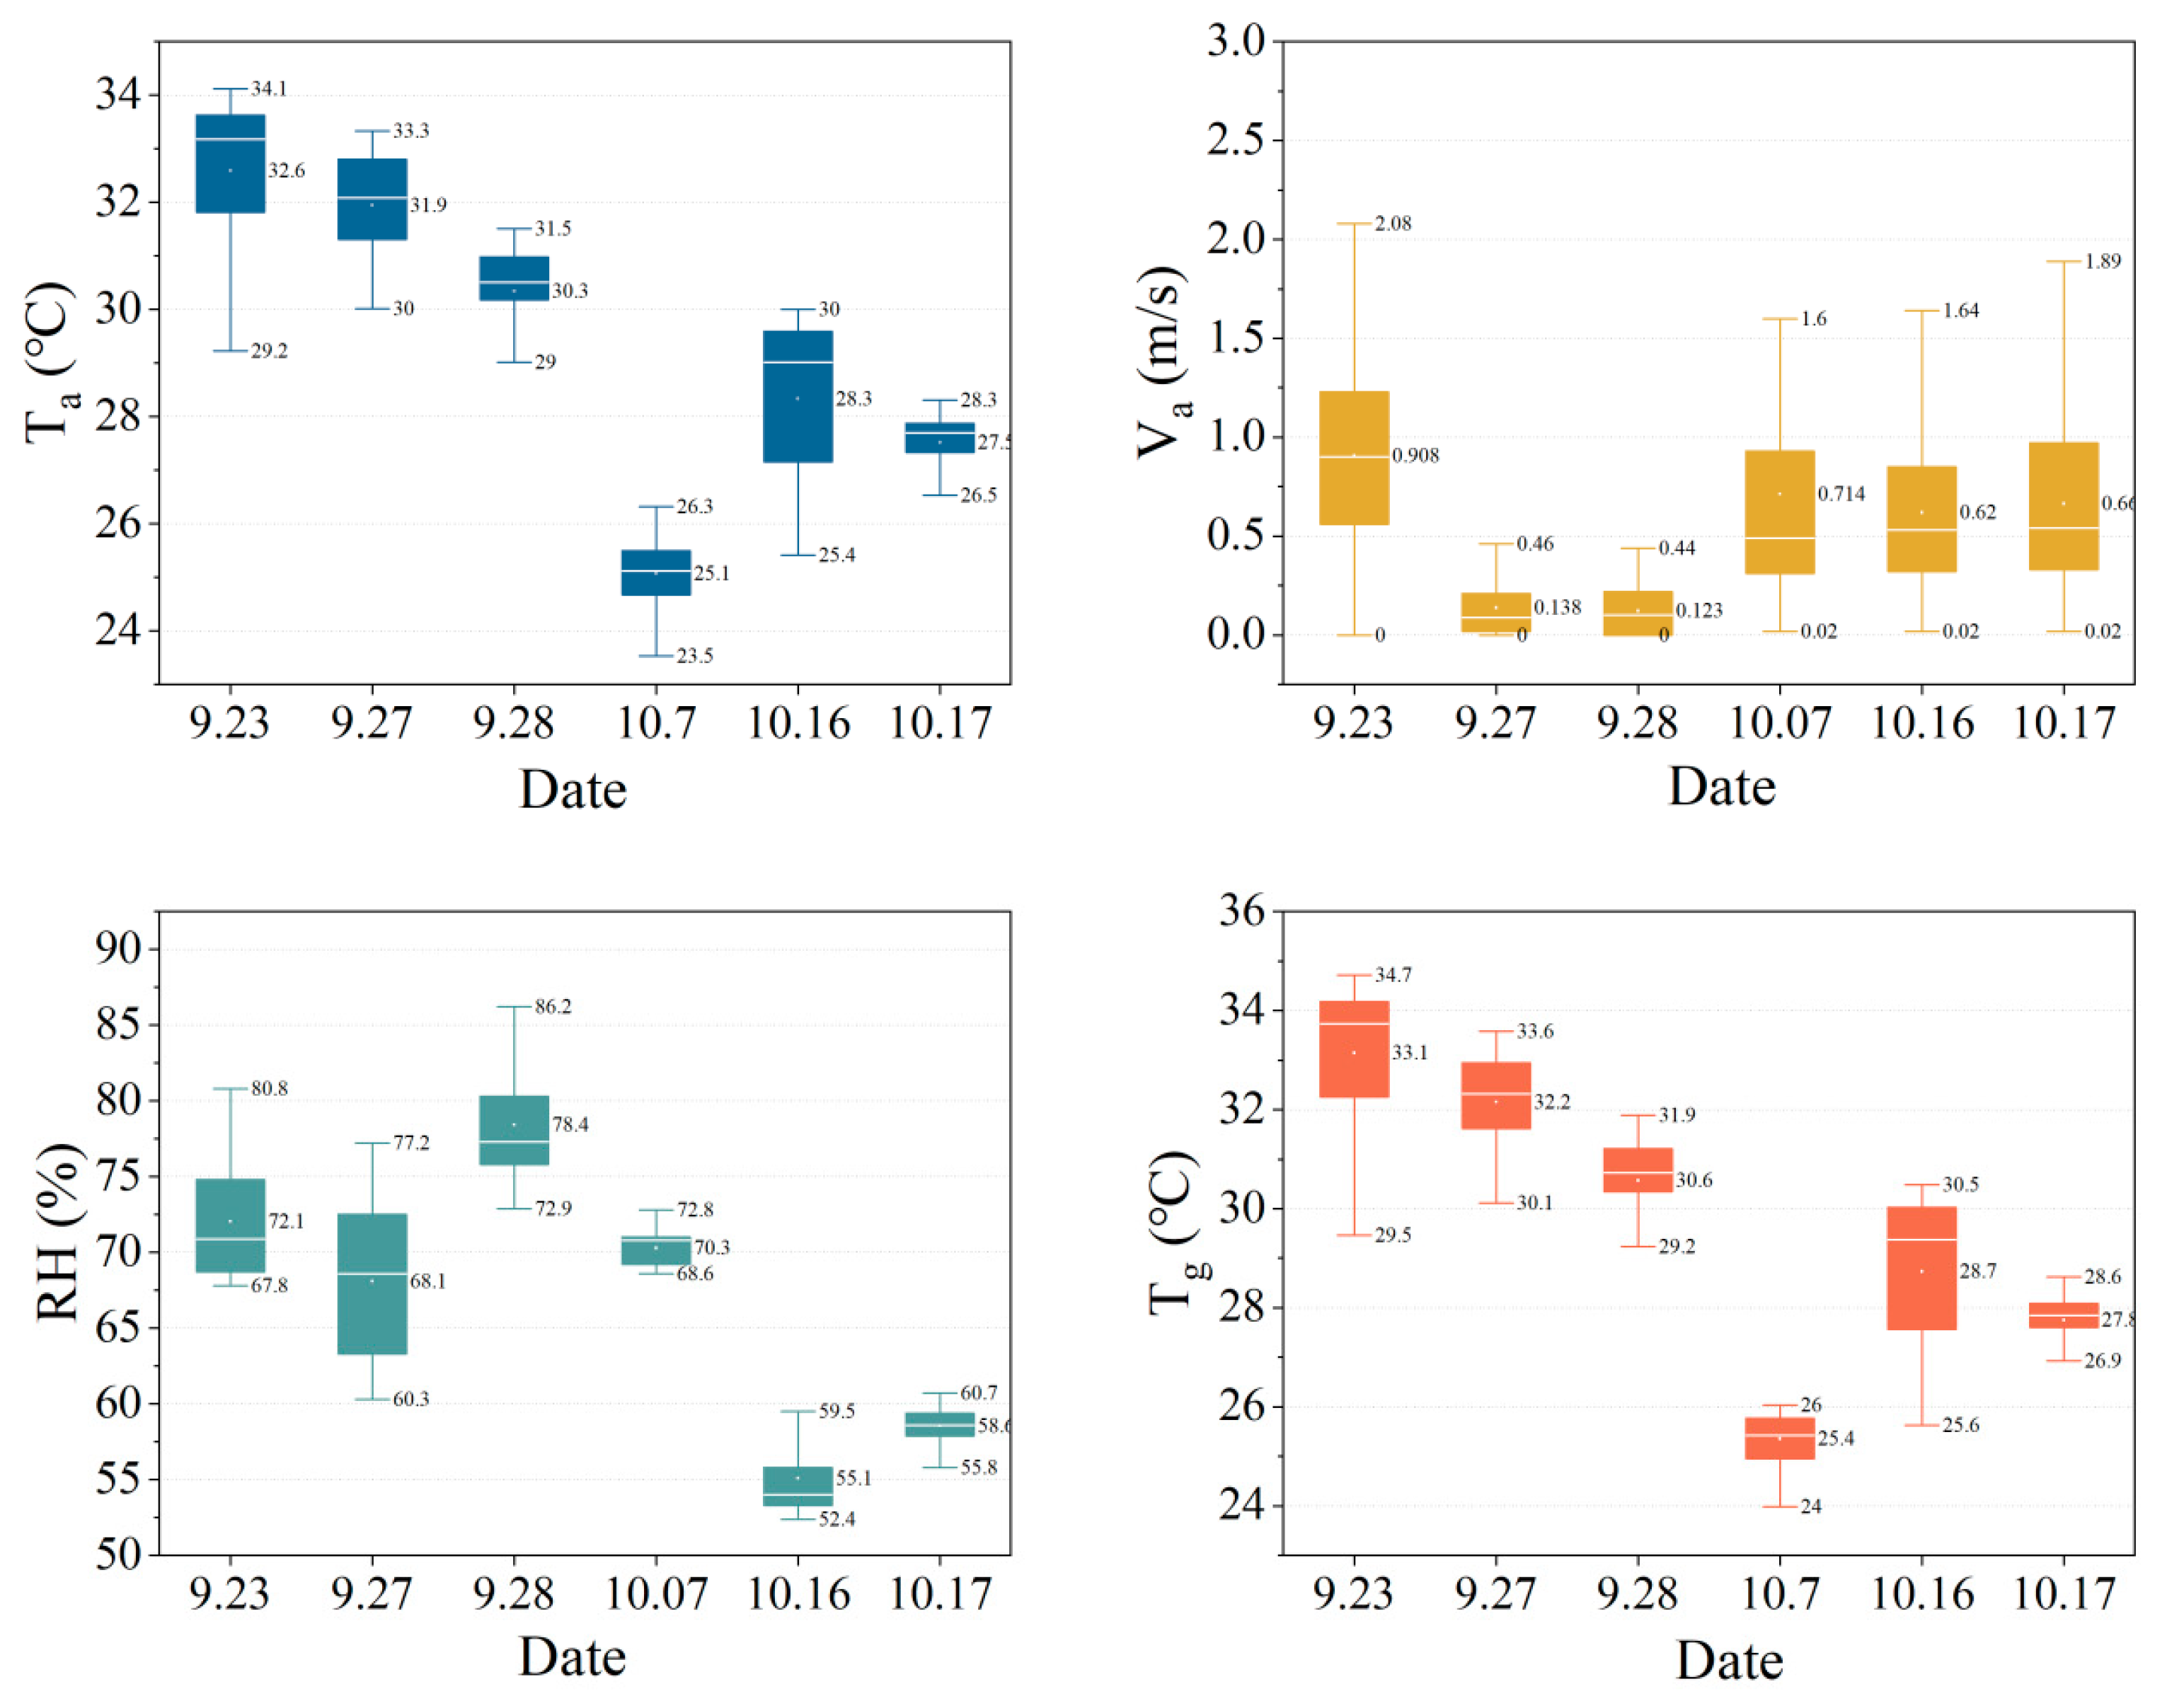
3.1. Descriptive Statistics

The information of the subjects is shown in Table 4. A total of 500 questionnaires were collected, including 219 questionnaires for males and 281 questionnaires for females. Complete information was included for environmental data, thermal comfort survey data, and cognitive performance test data. The total number of data samples was expected to be 523; however, due to the fact that some data samples were incomplete, only data samples with complete information existed and were analyzed. The age of the subjects ranged from 18 to 24 years old. The average height of males and females was 1.71 m and 1.58 m, respectively, and the average weight was 60.9 kg and 51.9 kg, respectively. Clothing impediments ranged from 0.22 to 0.67.

3.2. Subjective Views of Factors Affecting Learning Performance

As shown in Figure 4, in Stage 1 and Stage 2, wind speed and temperature were the main factors that subjects chose to study in the overhead. The percentages were 60.4% and 41.4% for Stage 1 and 75.6% and 76.6% for Stage 2, respectively. Even though humidity has been mentioned as a possible influence on learning performance in previous studies on indoor spaces [49], only 31.7% and 47.8% of the students considered relative humidity as a factor for studying in the overhead space in the two phases of the current study, respectively. The effect of solar radiation was selected by the least number of subjects in both phases, which may be due to the fact that there is no direct sunlight in the overhead space and the perception of solar radiation is not obvious to the subjects.

3.3. Symptoms of Fatigue

As shown in Table 5, the percentage of subjects experiencing fatigue was 11.6% higher in Stage 1 (64.9%) than in Stage 2 (53.2%). The main type of fatigue felt by subjects in both phases was “drowsiness and dullness” (73.3% compared to 47.8%). This was followed by “mental fatigue” (49.0%, 32.3%). Only 18.4% felt a “lack of physical integration” in Stage 2. In addition, the percentage of all fatigue symptoms is higher in Stage 1 and decreases slightly in Stage 2. The largest number of subjects felt “My eyes are getting tired” in Stage 1 (34.2%). This decreased by 8.3% in Stage 2. Next, 23.8% of the subjects felt “I feel like lying down” in Stage 1, decreasing by 9.3% to 13.9% in Stage 2. The percentage of subjects who felt “I am uncertain” was 19.3% in Stage 1 and 12.4% in Stage 2. Other symptoms of fatigue were relatively minor. In summary, people are more likely to feel fatigue at higher temperatures (28.3 °C–34.1 °C), and the main symptoms of fatigue are “mental fatigue” and “drowsiness and dullness.”

3.4. Thermal Response Analysis

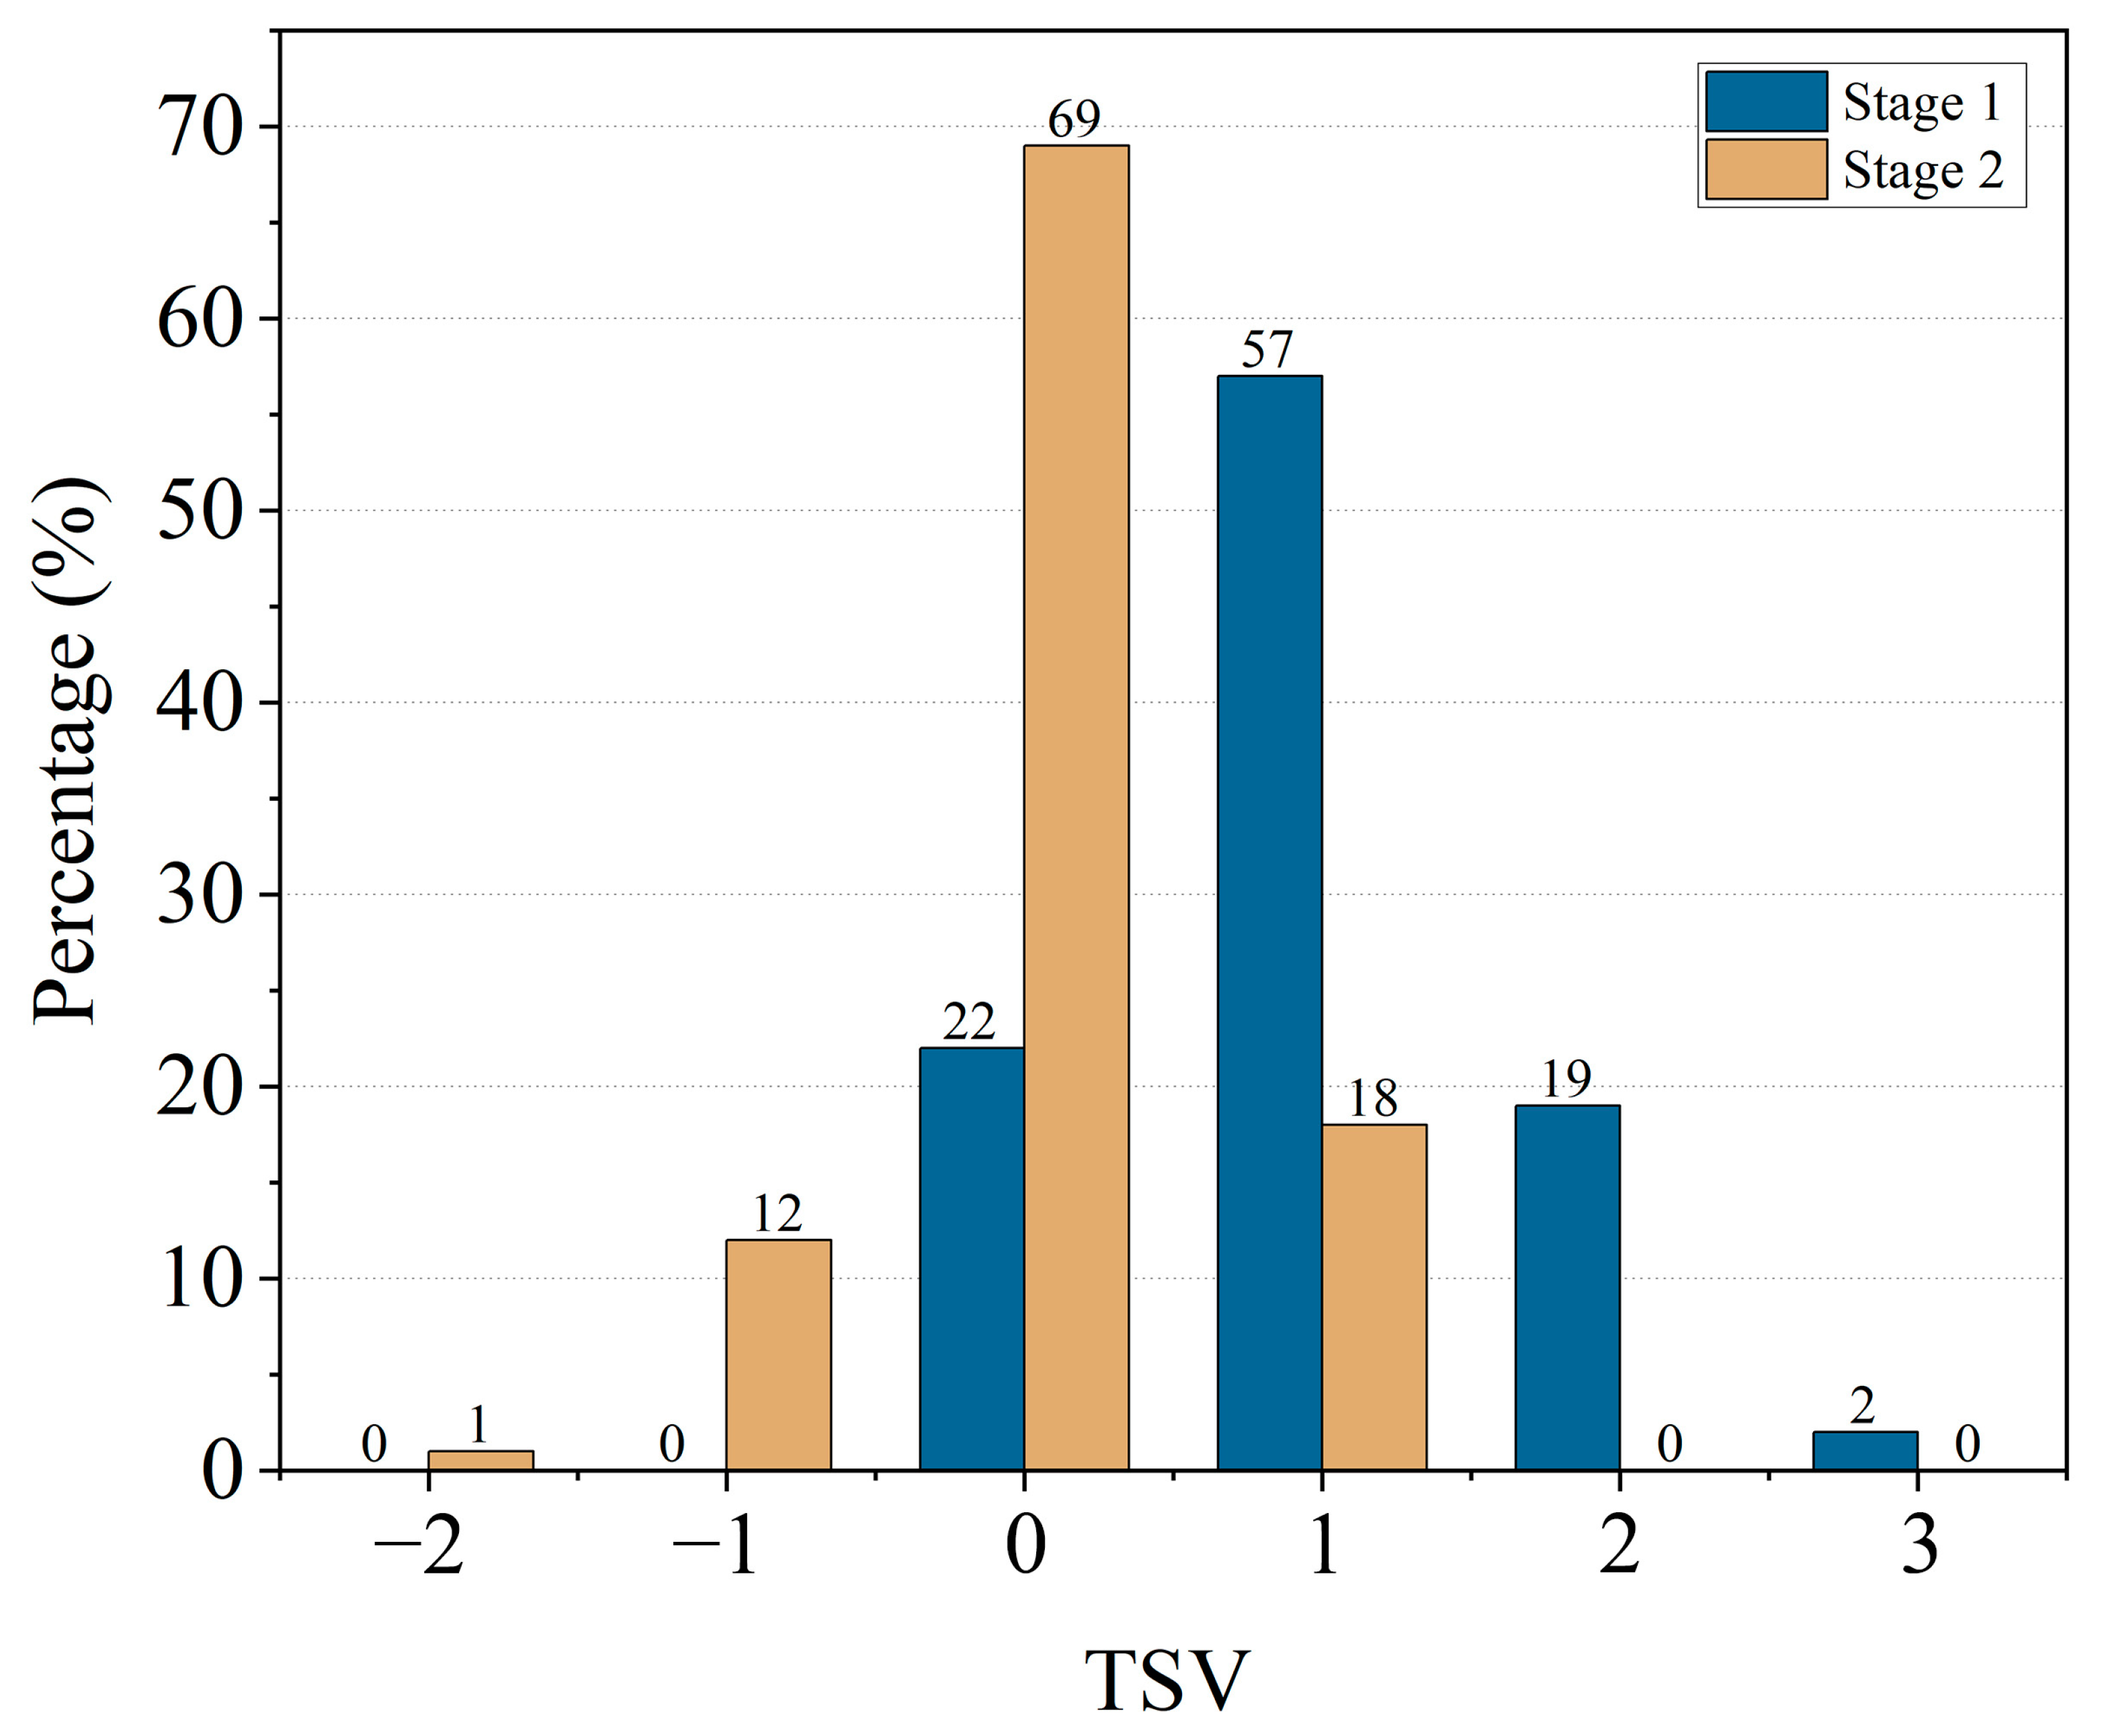
3.4.1. Distribution of Thermal Sensation Vote

As shown in Figure 5, the predominant thermal sensation for subjects in Phase 1 was “slightly hot” (TSV = 1) at 57%. This was followed by “neutral” (22%), and “hot” (19%). In Stage 2, the heat sensation decreased, with 47% more subjects feeling mainly “neutral” (69%) compared to Stage 1, and the percentage of subjects feeling “slightly hot” decreased by 19%. No one felt “hot” (TSV = 2) or “very hot” (TSV = 3) in Stage 2.

3.4.2. Thermal Satisfaction

As shown in Figure 6, the percentage of people who felt “neutral” about the environment in Stage 1 was 46%. Stage 2 was 22%. The percentages of those who chose “slightly satisfied” in both phases were 31% and 17%, respectively. In total, 7% and 13% of the subjects chose “satisfied” and “very satisfied” in Stage 2. However, only 9% of the subjects chose “satisfied” in Stage 1, and there were no subjects who chose “very satisfied”. However, more subjects felt “slightly dissatisfied” in Stage 2 (21%) than in Stage 1 (12%). In total, 20% of the subjects chose “dissatisfied” in Stage 2, which is 18% higher than in Stage 1. This indicates that subjects’ heat satisfaction varied with the contrast between the elevated level and the outdoor environment. In Stage 1, the outdoor environment was hotter, and the elevated floor provided a relatively good thermal environment, which resulted in a higher level of satisfaction, while in Stage 2, the outdoor thermal environment was relatively suitable, and the difference between the thermal environment and that of the elevated floor was not as high as that of Stage 1, which resulted in a decrease in the level of satisfaction of the subjects.

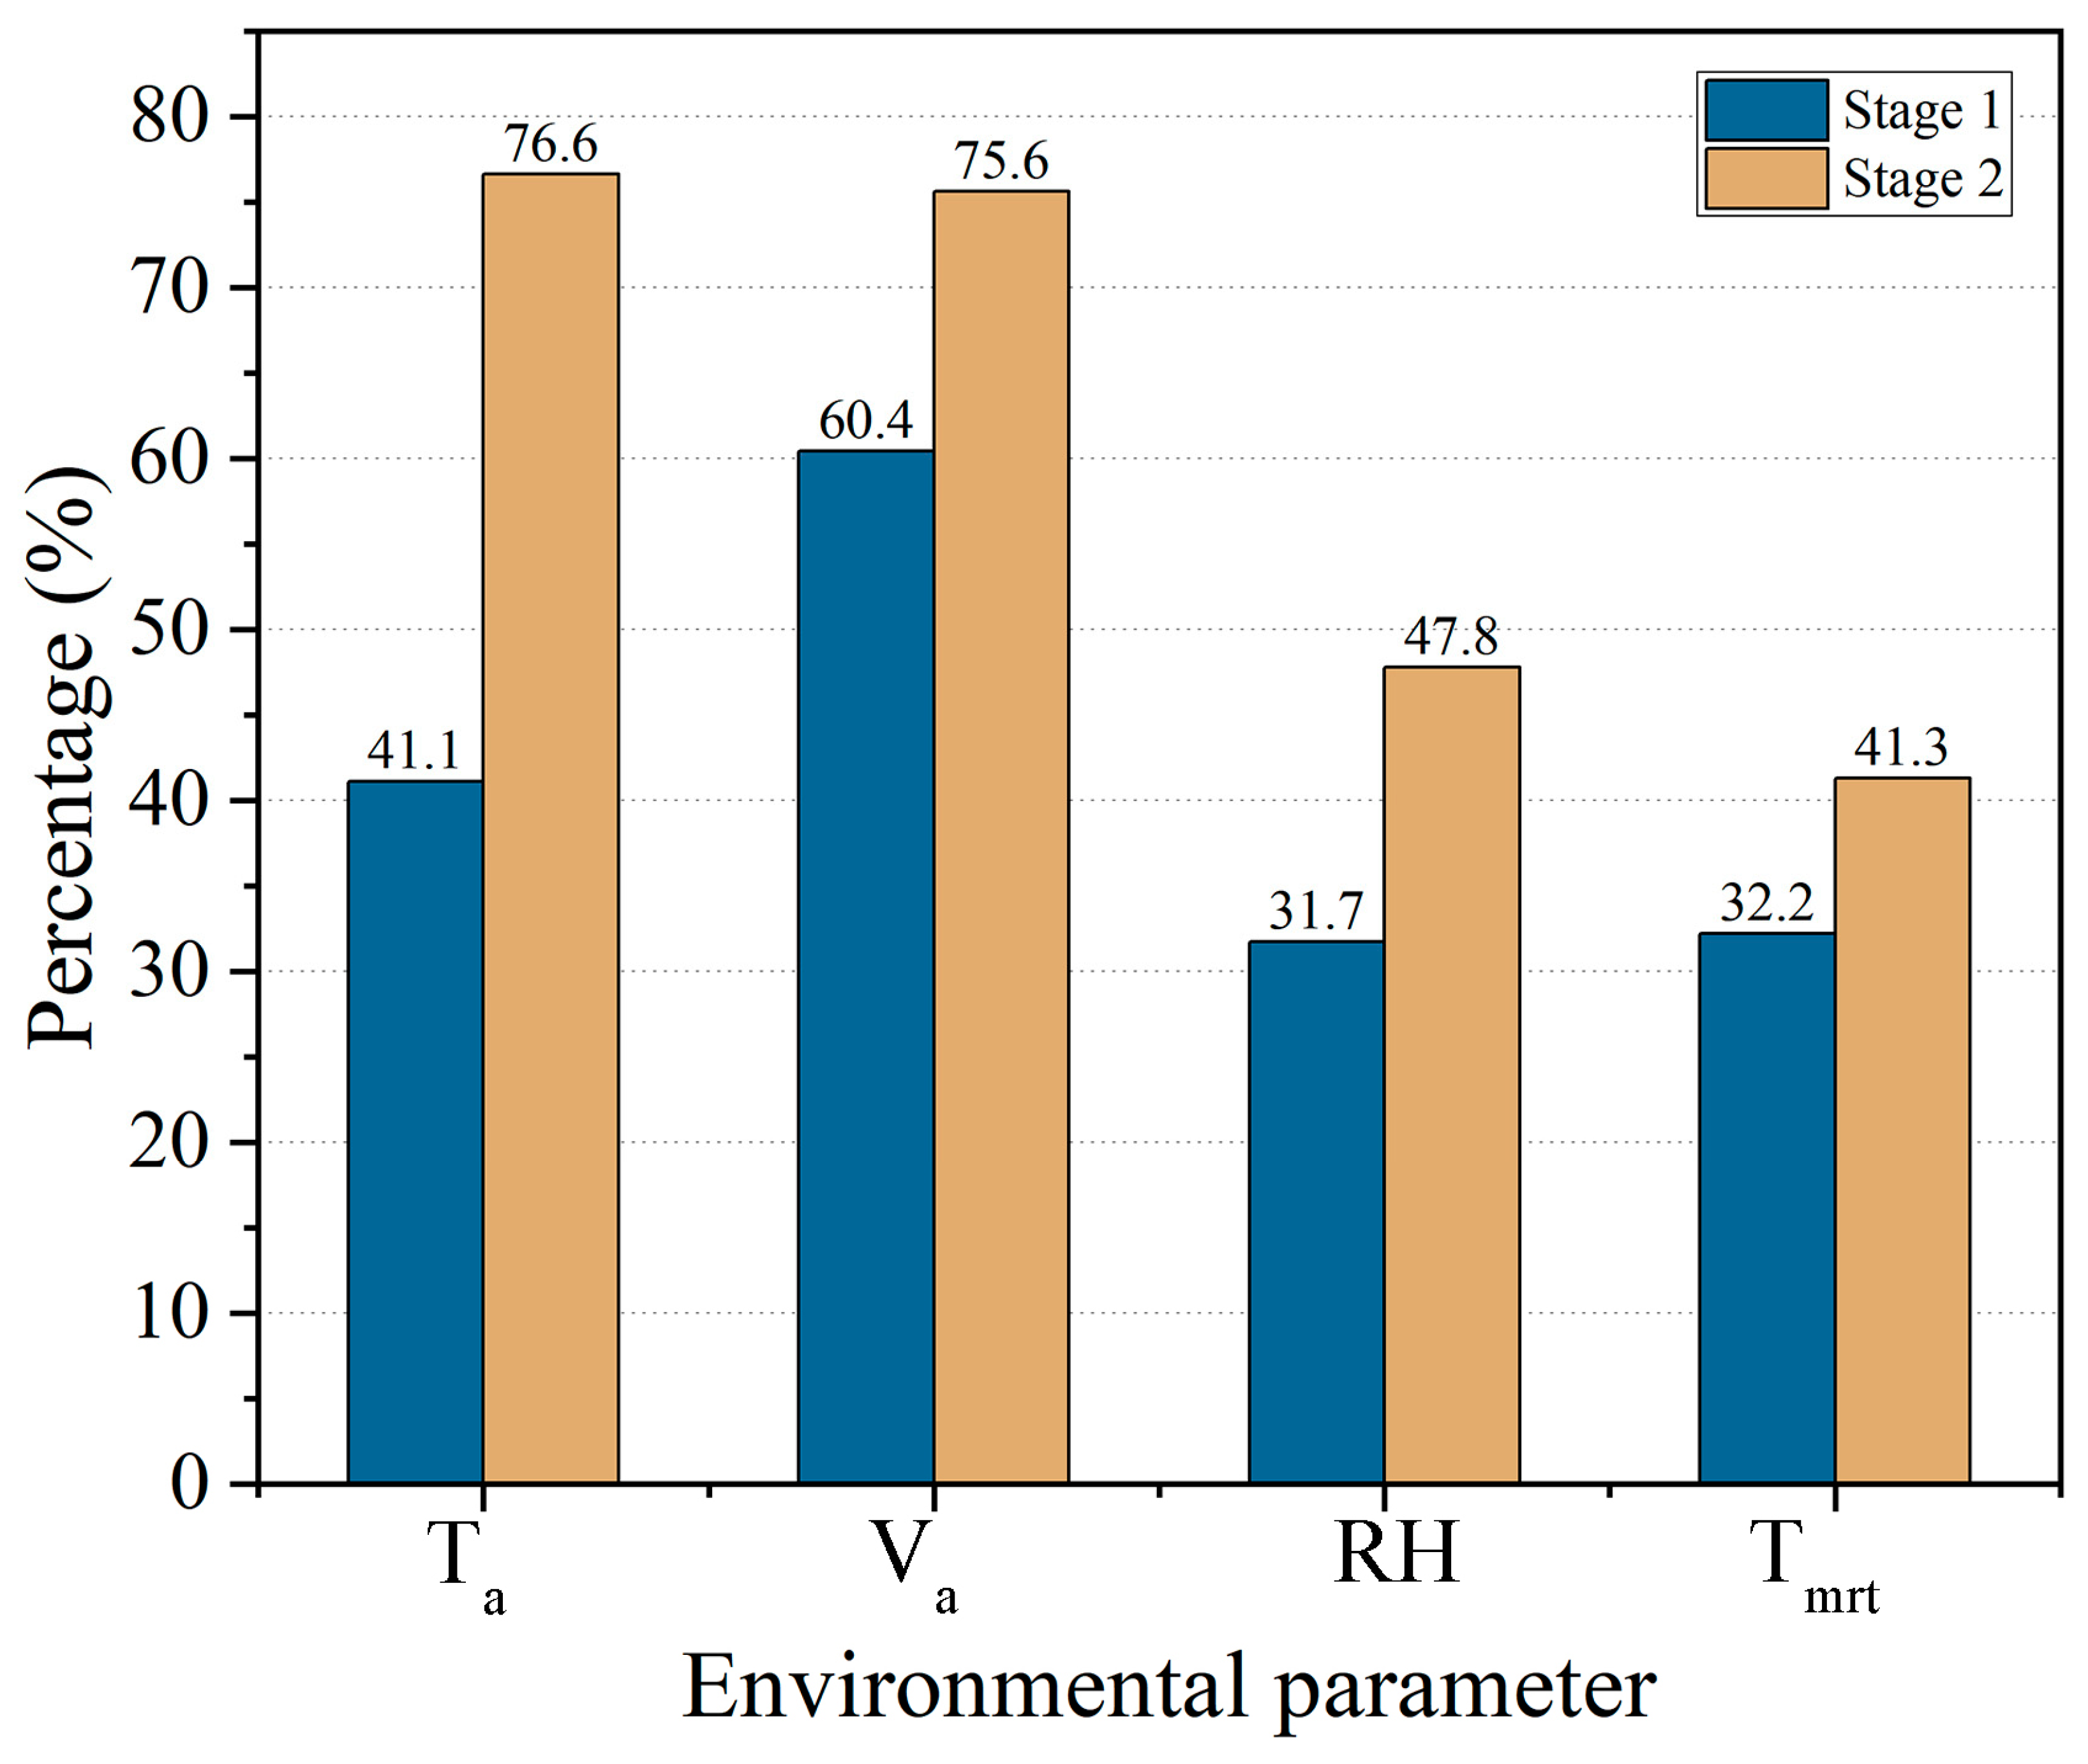
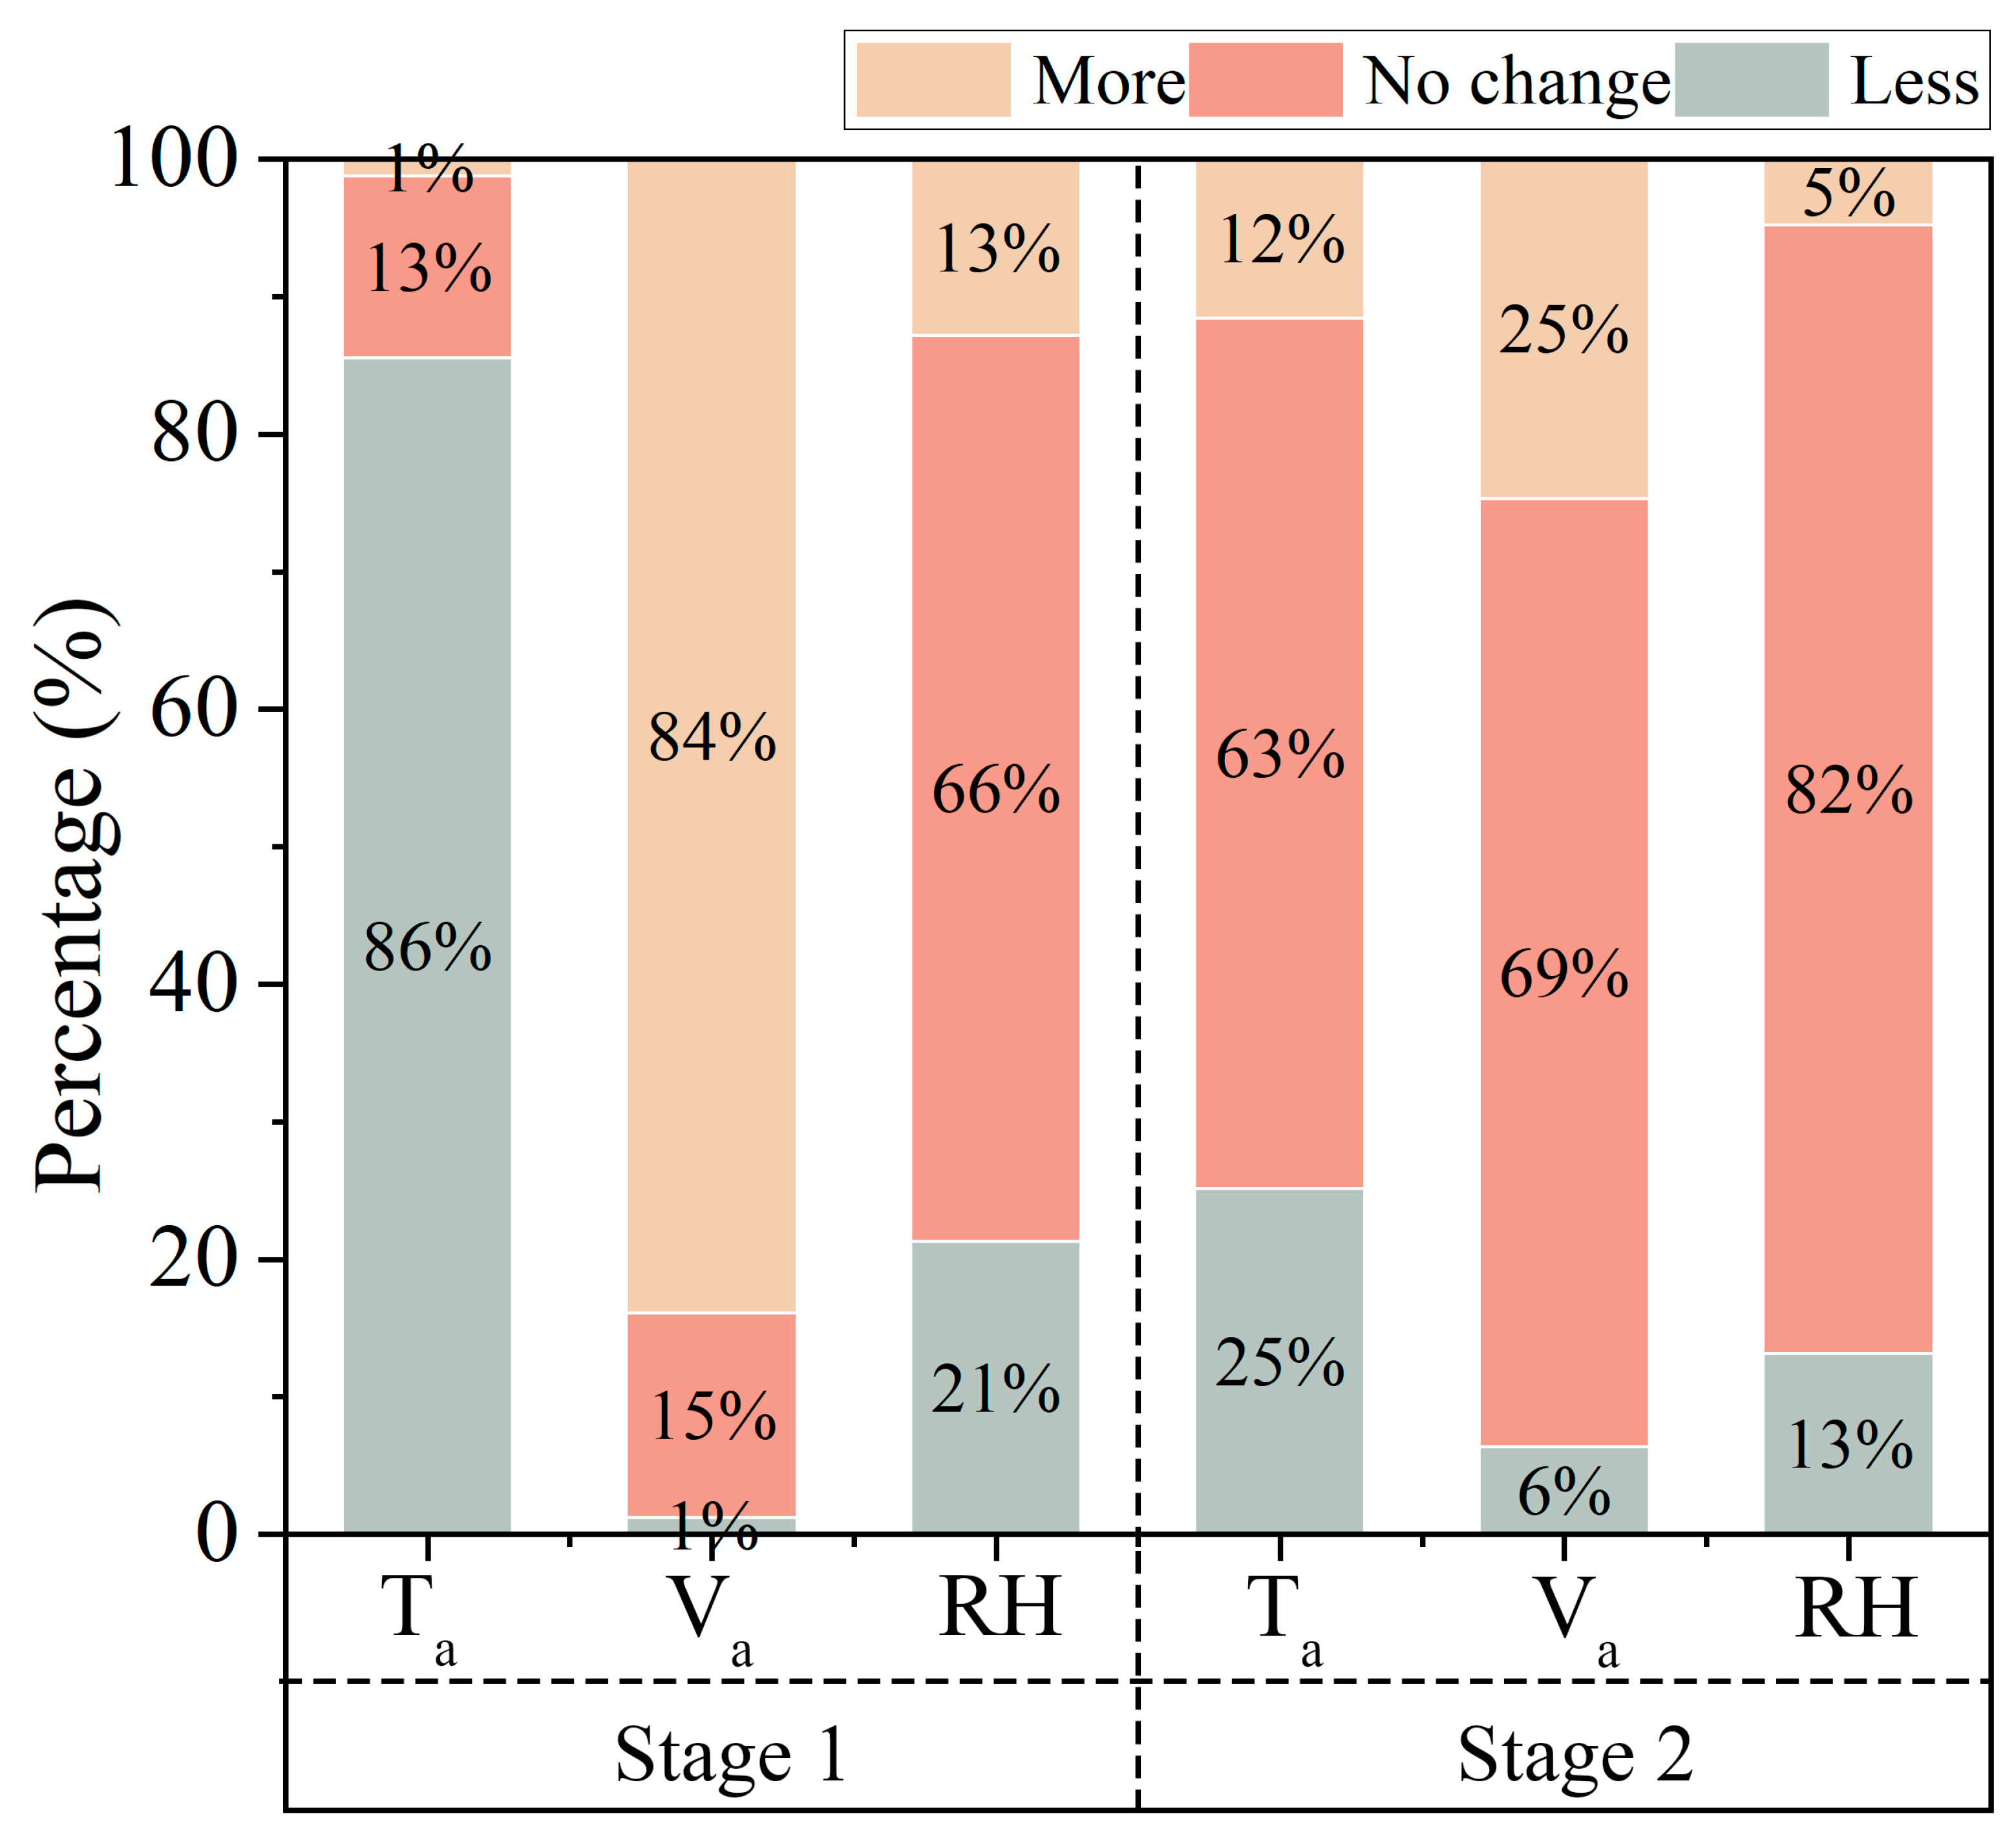
3.4.3. Preference of Thermal Parameter

Figure 7 shows the heat preferences of the subjects in the different phases of the survey. In phase 1, 86% of the students wanted the temperature to be lowered. In Stage 2, 63% of the students wanted the temperature to be neutral. In total, 25% of the students wanted the temperature to be lowered. In terms of wind speed preference, in Stage 1, 84% would like the wind speed to be increased. In Stage 2, 69% of the students wanted the wind speed to remain the same. In addition, both Stage 1 and Stage 2 had the highest percentage of those who wanted the humidity to remain the same at 66% and 82%, and only 13% (Stage 1) and 5% (Stage 2) wanted the humidity to increase. This indicates that the subjects were less sensitive to fluctuations in relative humidity.

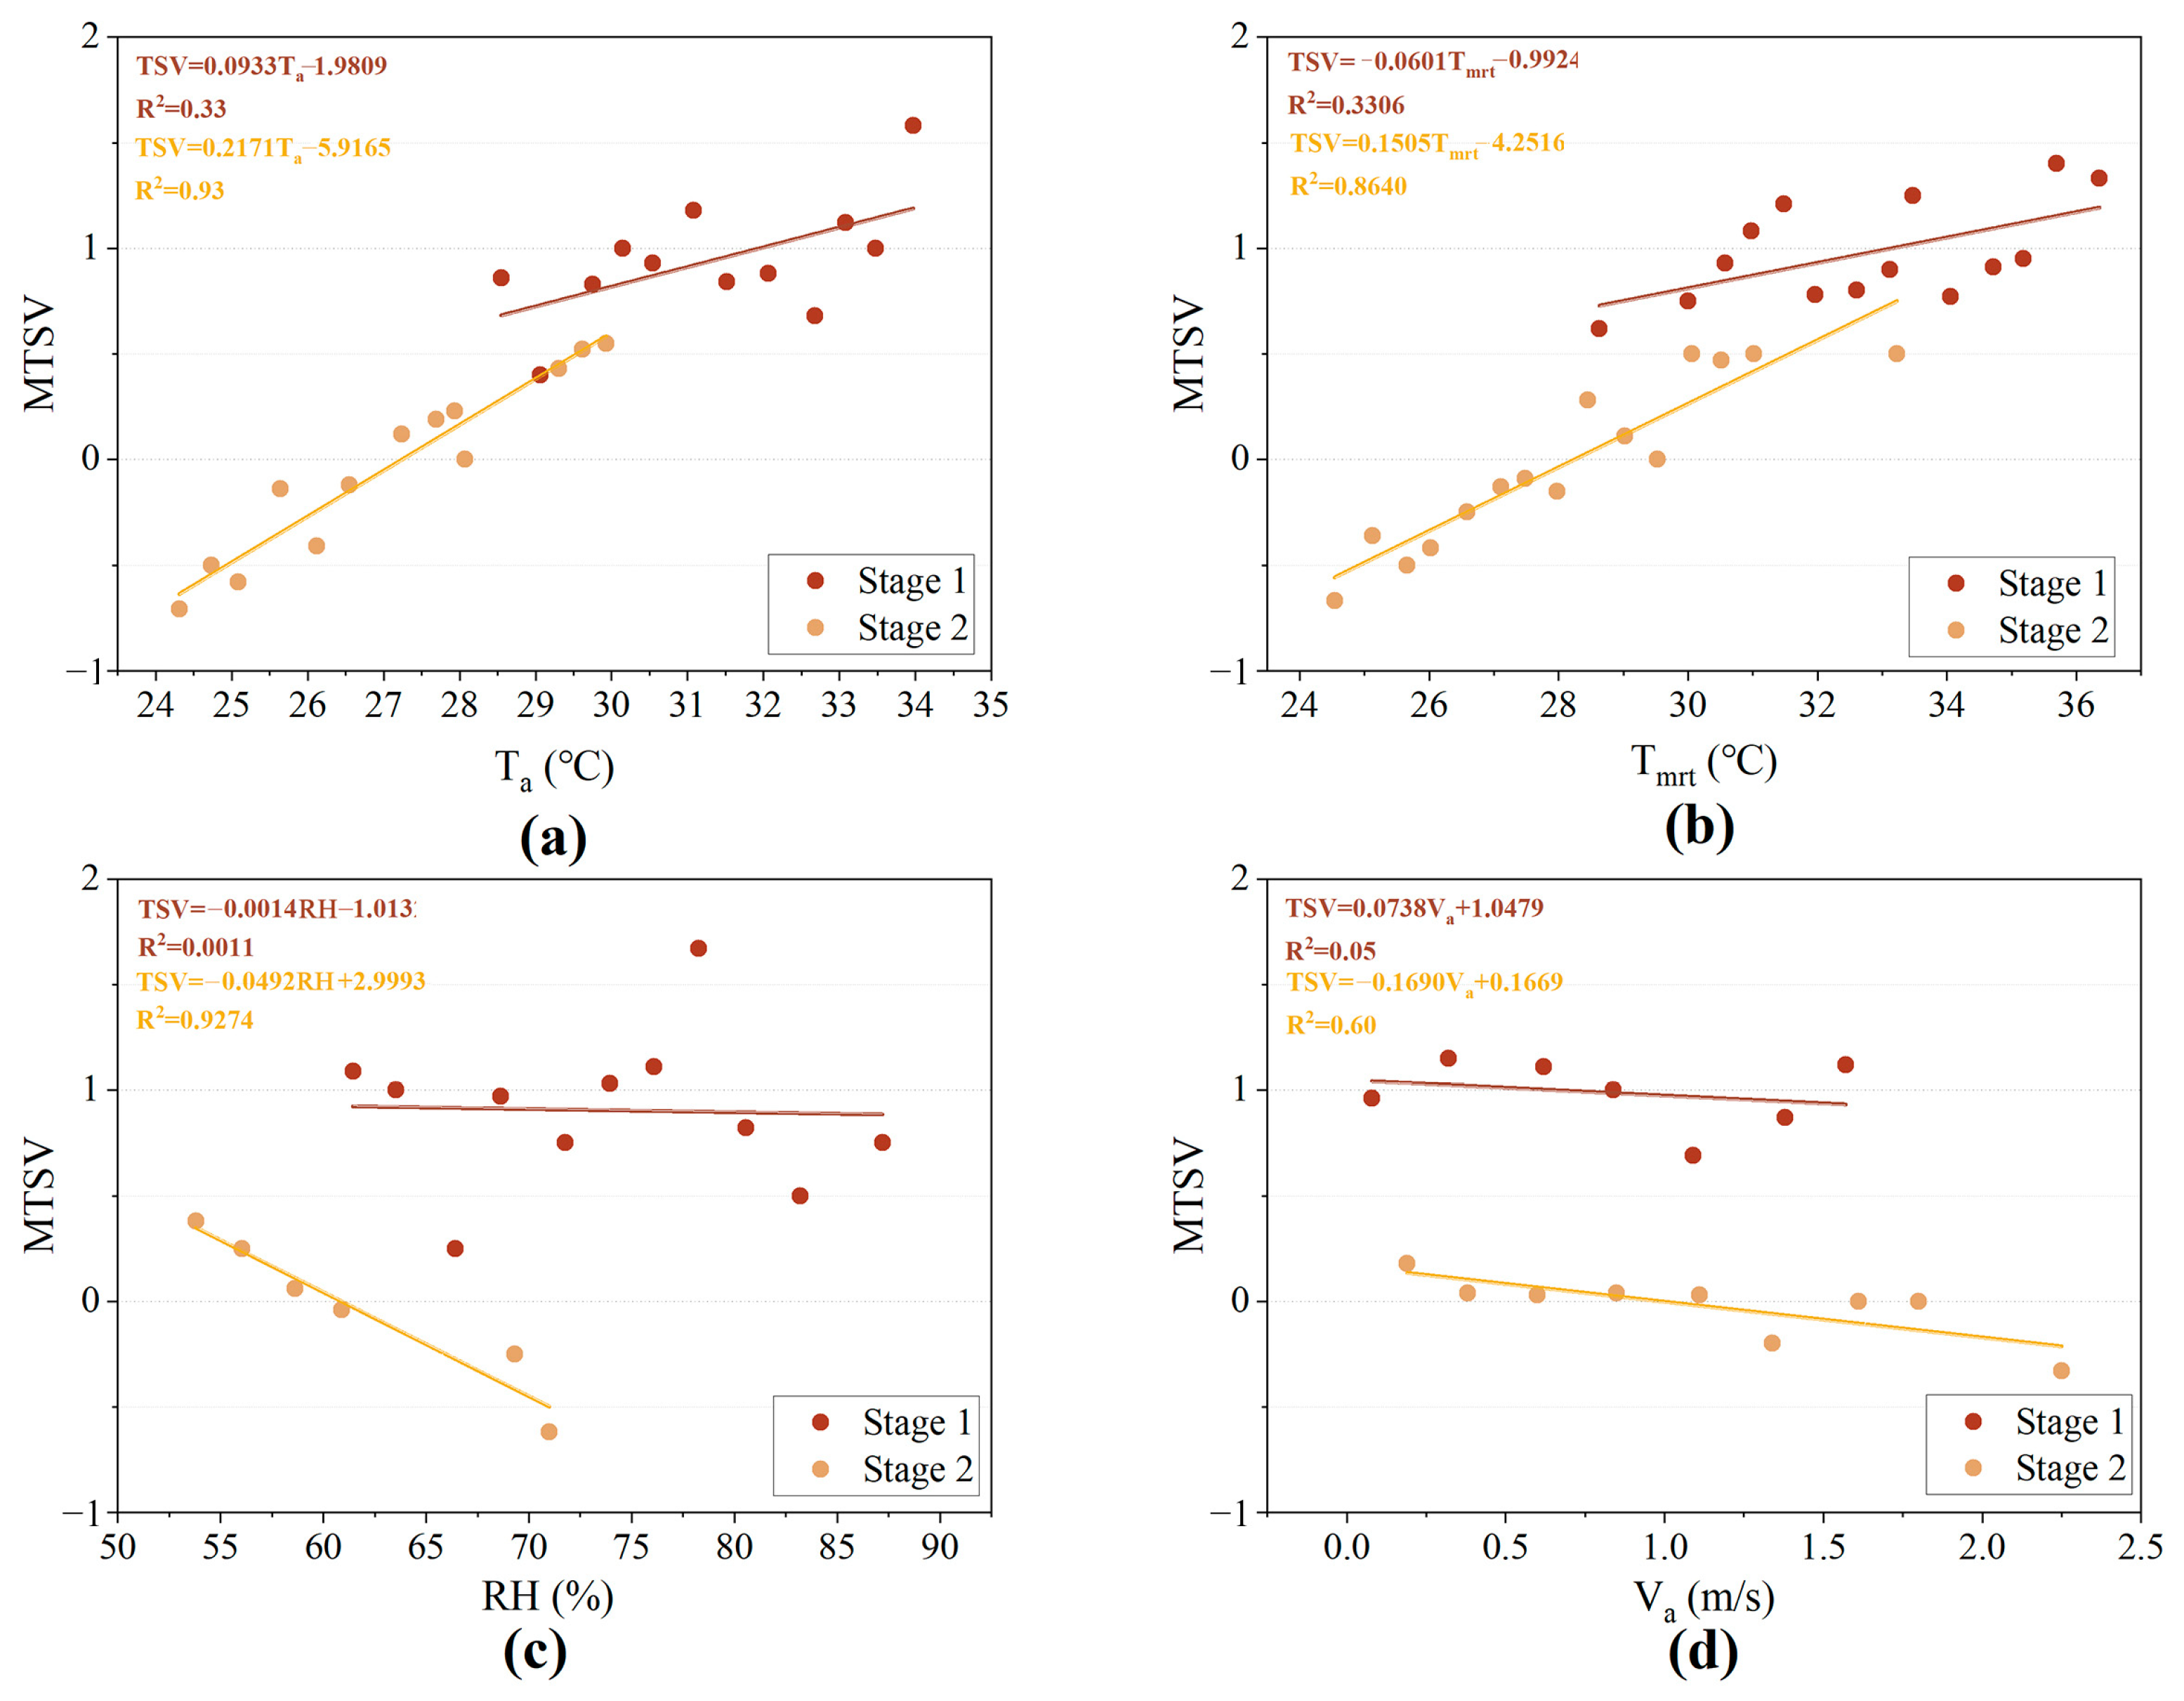
3.5. Correlation between MTSV Variation and Thermal Parameters

In order to assess the thermal comfort of a given population, the more common method is to obtain the MTSV. The mean values of Ta, Va, RH, and MTSV per 0.5 °C, per 0.2 m/s Va, and per 5% RH and Tmrt were calculated, and a linear regression fit using a quadratic function was used to determine the relationship between the environmental parameters and the thermal comfort of the respondents. As shown in Figure 8, in Stage 1, the relationship between subjects’ MTSV and Ta, Va, RH, and Tmrt were all insignificant (R2 < 0.3) with the main range between 0.5 and 1.5 due to the better acceptability of the elevated floor in relation to the outdoor open-air environment. At Stage 2, subjects’ MTSV was positively correlated with Ta (R2 = 0.93) and Tmrt (R2 = 0.8640) and negatively correlated with RH (R2 = 0.9274). When Ta = 27.3 °C or Tmrt = 28.3 °C, MTSV = 0, and the neutral temperature range was 24.9 °C–29.6 °C. In addition, the relationship between MTSV and Va was not significant for subjects in either Stage 1 or Stage 2 (R2 = 0.05/R2 = 0.60) because of the small magnitude of change in wind speed.

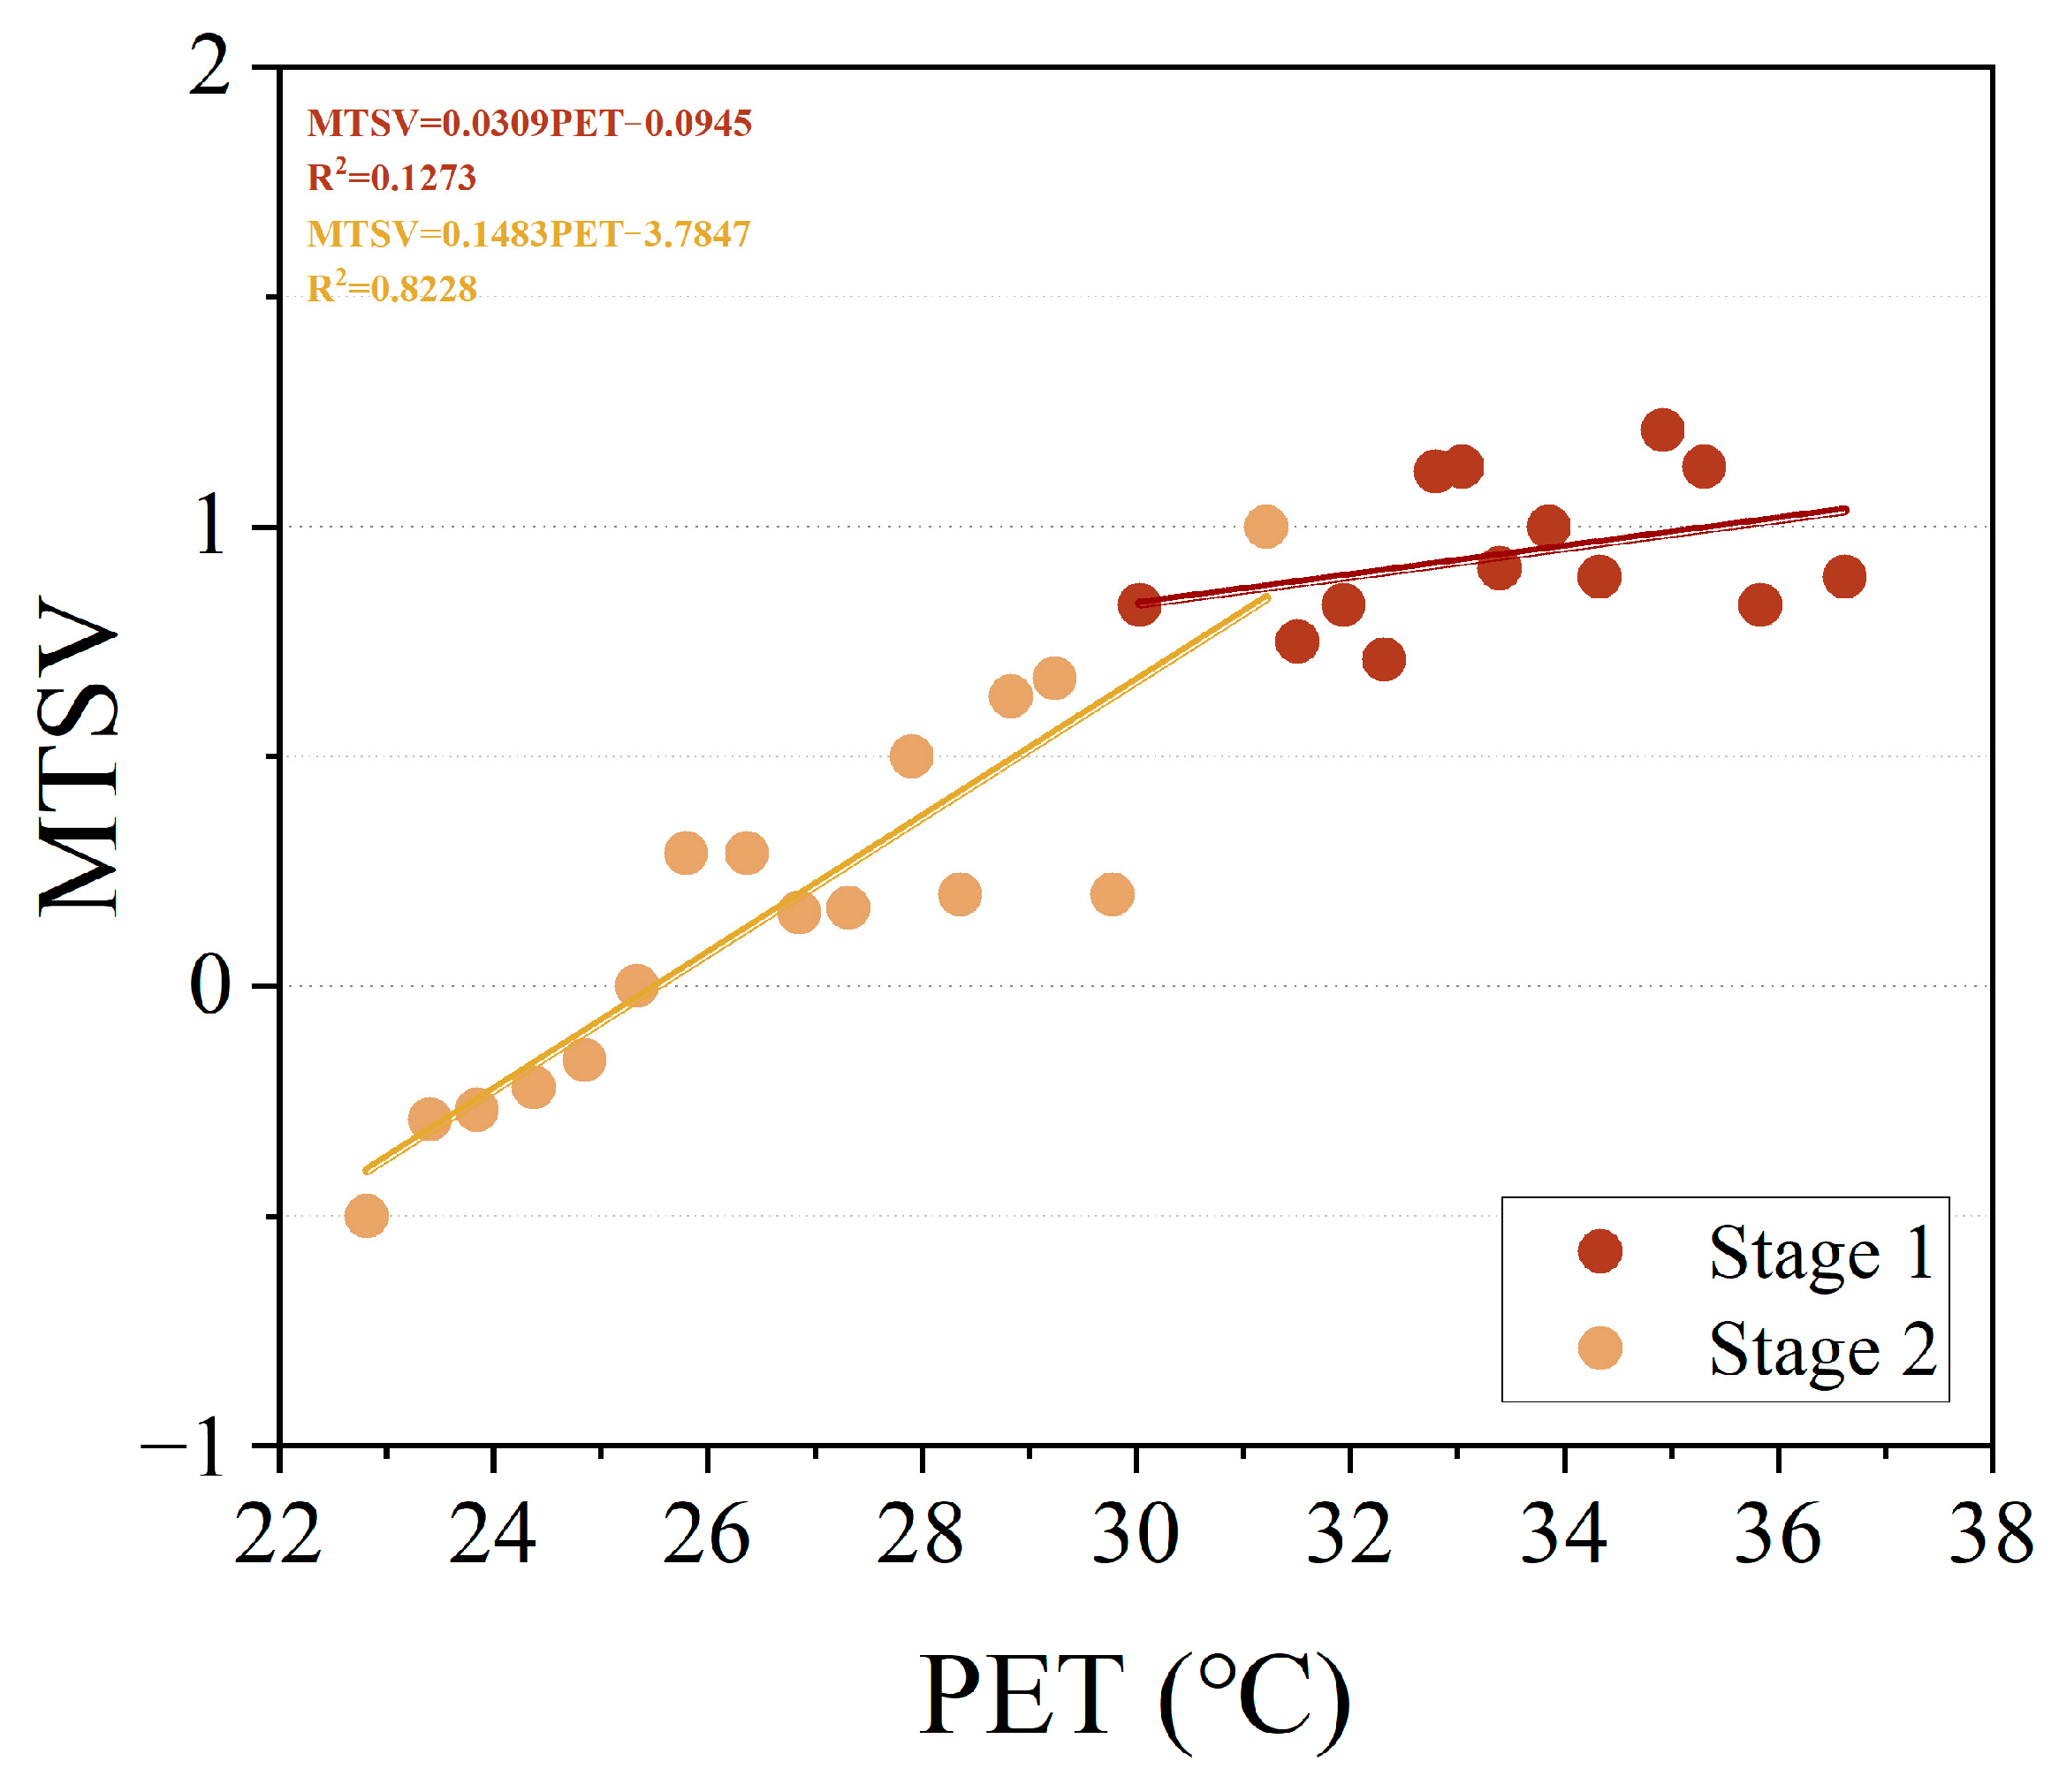
3.6. Thermal Stress Corresponding to Thermal Indices

As shown in Figure 9, the fit determined the relationship between PET and subjects’ thermal comfort, with Stage 1 having a non-significant relationship with MTSV (R2 = 0.1273), which essentially corresponded to a warm thermal sensation level. Stage 2 PET was positively correlated with MTSV (R2 = 0.8228) and was 25.5 °C when MTSV = 0. The neutral PET ranged from 22.1 °C to 28.9 °C.

3.7. Thermal Parameters and Thermal Acceptability

Figure 10 shows a linear fit to PET and the percentage of the population found to have unacceptable Ta, RH, and Va for Stage 1 and Stage 2, where it can be seen that in Stage 1, subjects can accept thermal environments with a Ta < 30.7 °C, RH < 70.3%, and PET < 30.3 °C, whereas the percentage of unacceptable wind speeds in Stage 1 is consistently higher than 20%, which suggests that in Stage 1, subjects required greater wind speed. In Stage 2, the thermally unacceptable ratios for temperature, humidity, wind speed, and PET were consistently lower than 20%. This indicates that the subjects were always able to accept thermal environments within this range.

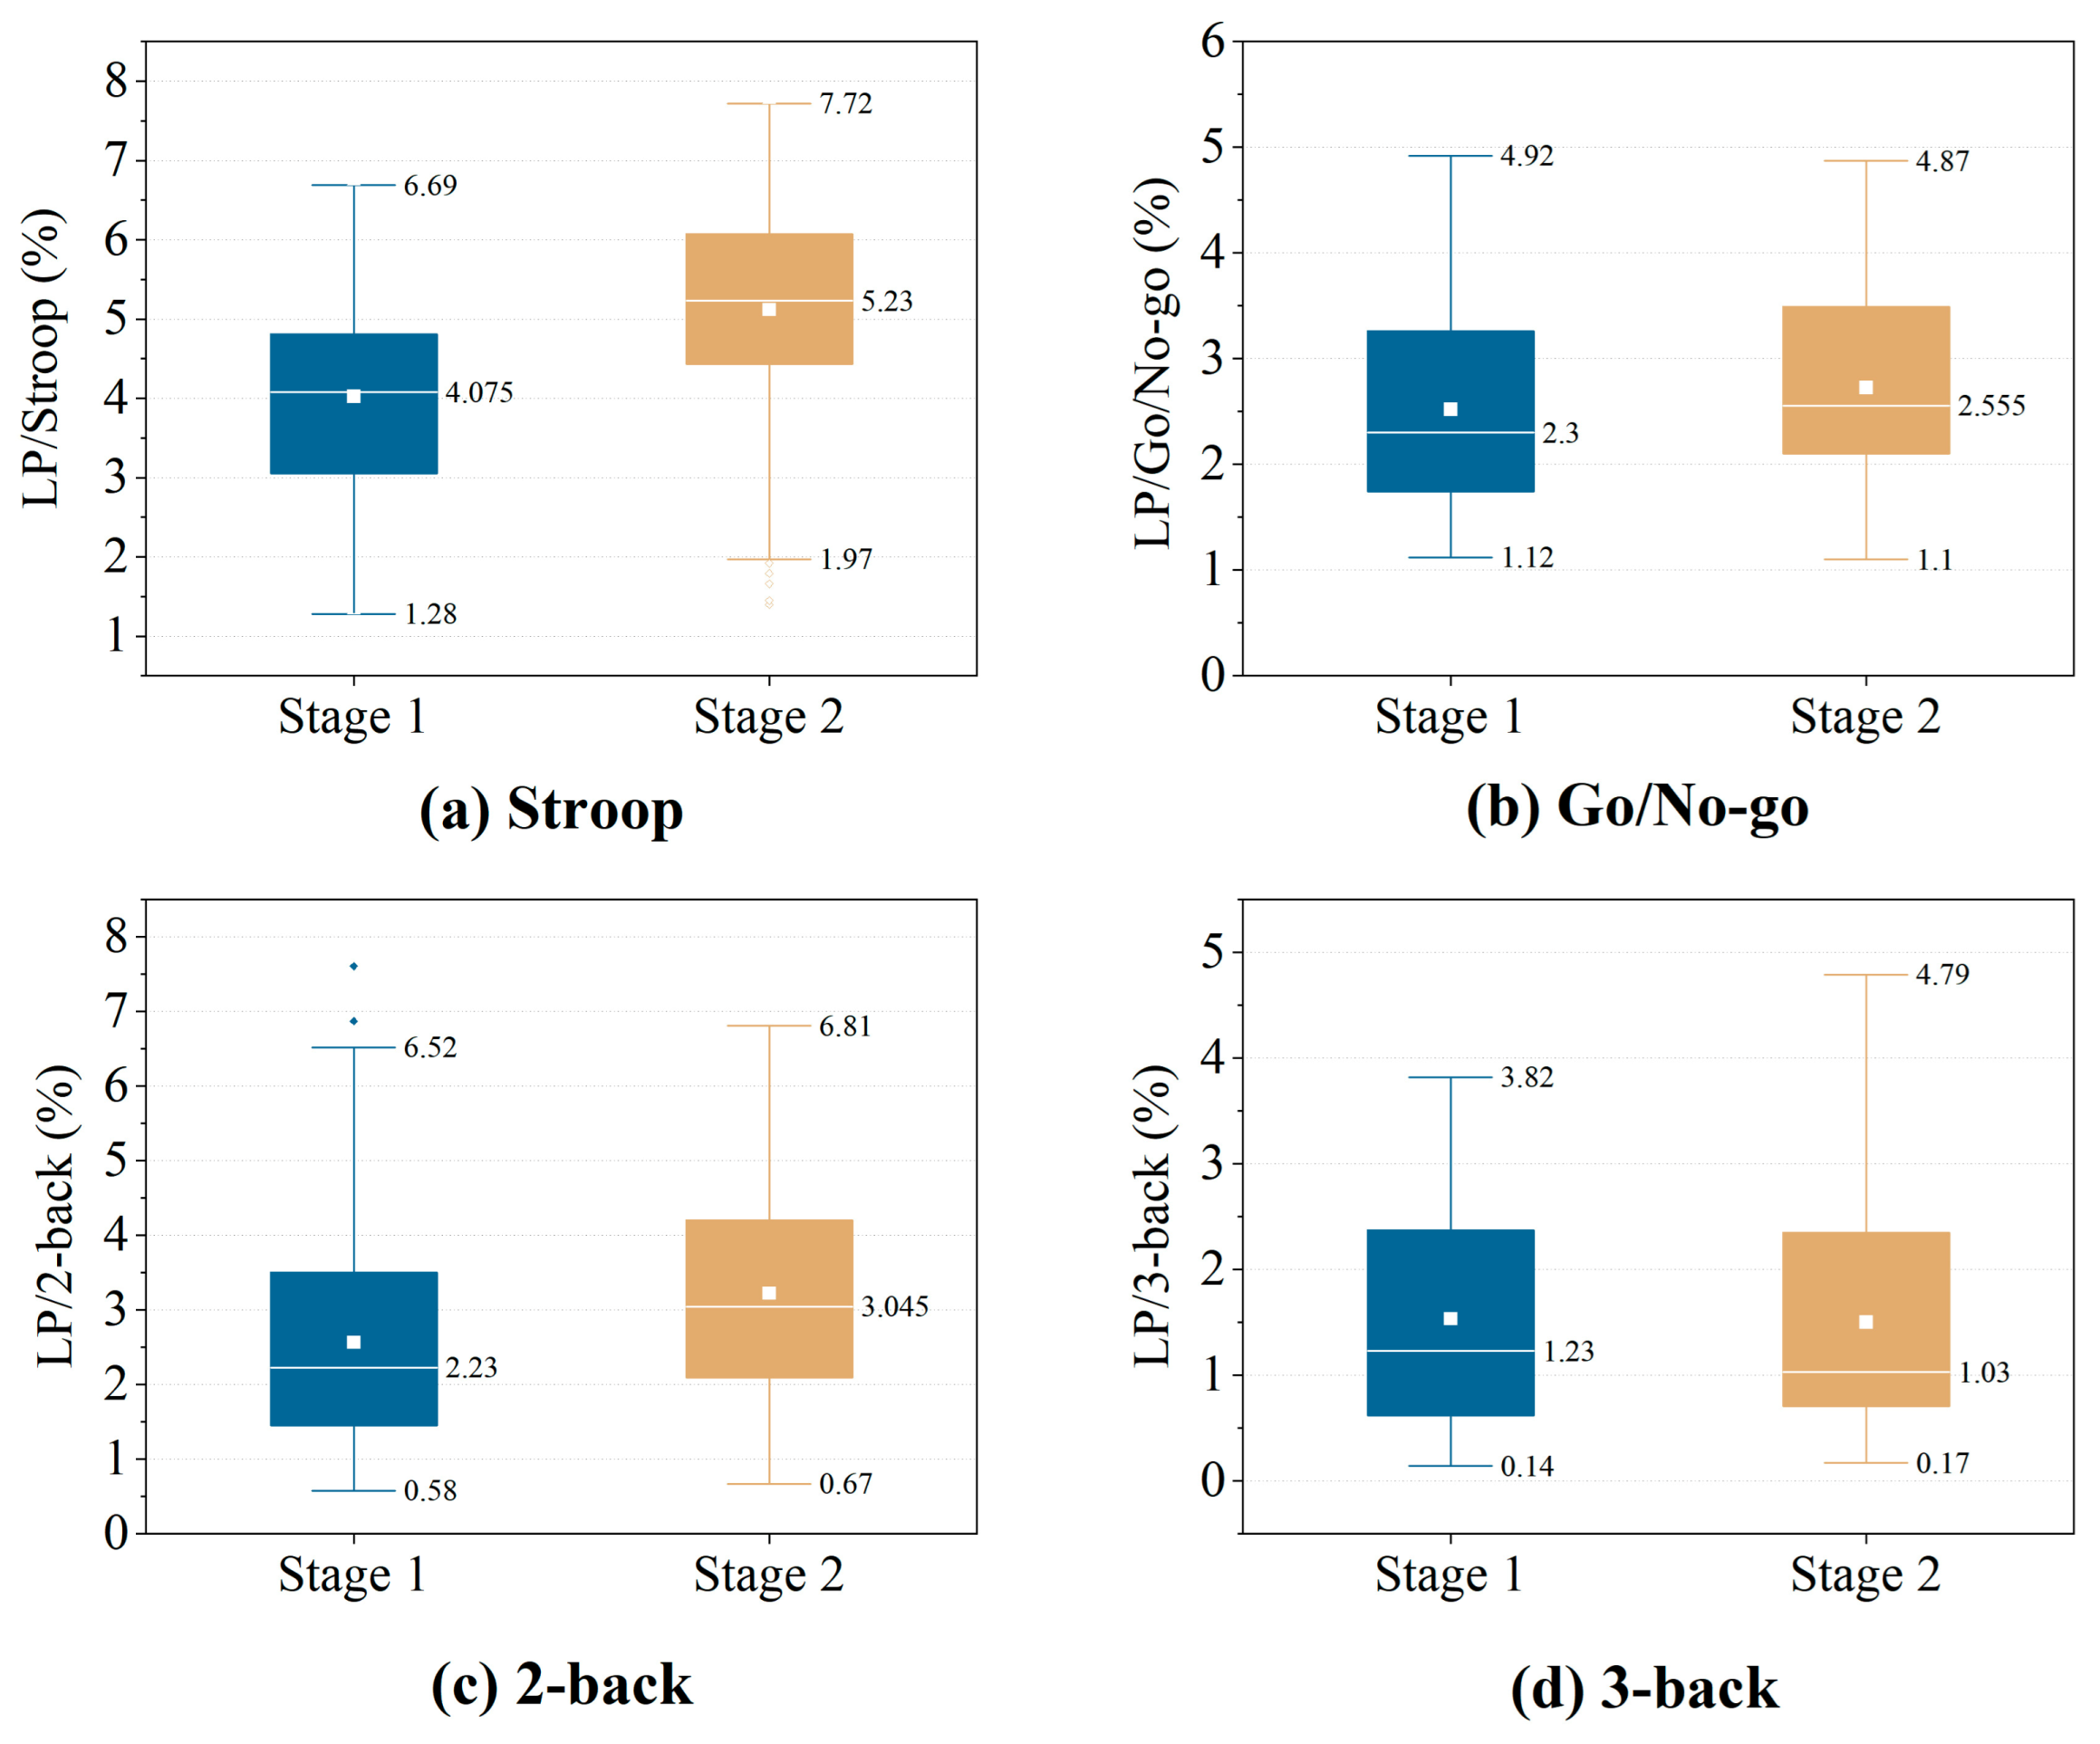
3.8. Differences in Learning Performance

When exploring the academic performance of subjects, different types of test items in different thermal environments should be considered; the results of a single category of test cannot be used to judge students’ learning performance. In order to obtain a clear picture of the effects of environmental differences on subjects’ academic performance, four tests were conducted, corresponding to subjects’ perception, attention, and memory. Among them, memory included both 2-back and 3-back tests.
Figure 11 presents the participants’ learning performance on the perceptual ability, attention, and short-term memory tests in two different phases. First, the perceptually oriented Stroop test showed significant differences between Stage 1 and Stage 2, with maximum, minimum, and mean values of 6.69, 1.28, and 4.075, respectively, for Stage 1, and 7.72, 1.97, and 5.23, respectively, for Stage 2. The maximum value increased by 1.03% from Stage 1. Second, the learning performance in the attention-oriented Go/No-go test was relatively stable in both stages. The difference between the maximum, minimum, and mean values for Stage 1 and Stage 2 was 0.05, 0.02, and 0.3, respectively. The overall range of learning performance was not very different. This suggests that subjects’ attention was less affected by the thermal environment in the overhead environment. In the 2-back test and the 3-back test targeting short-term memory, the obtained learning performances showed slight variations in both phases. Specifically, the maximum, minimum, and mean of the 2-back learning performance scores were 6.52, 0.58, and 2.23, respectively, for Stage 1. The maximum, minimum, and mean for Stage 2 were 6.81, 0.67, and 3.05, respectively. Learning performance was better in Stage 2 than in Stage 1. However, in the more difficult 3-back test, the maximum values for Stage 1 and Stage 2 were 3.8 and 4.8, respectively; the mean values were 1.2 and 1.0, respectively; and the minimum values were 0.14 and 0.17, respectively, so the gap between the two stages of learning performance became wider. It can be seen that the results of the test for short-term memory are related to the level of difficulty, and as the difficulty increases, the subjects need to perform more intense mental activities, and thus the differences between the performance scores become more evident.

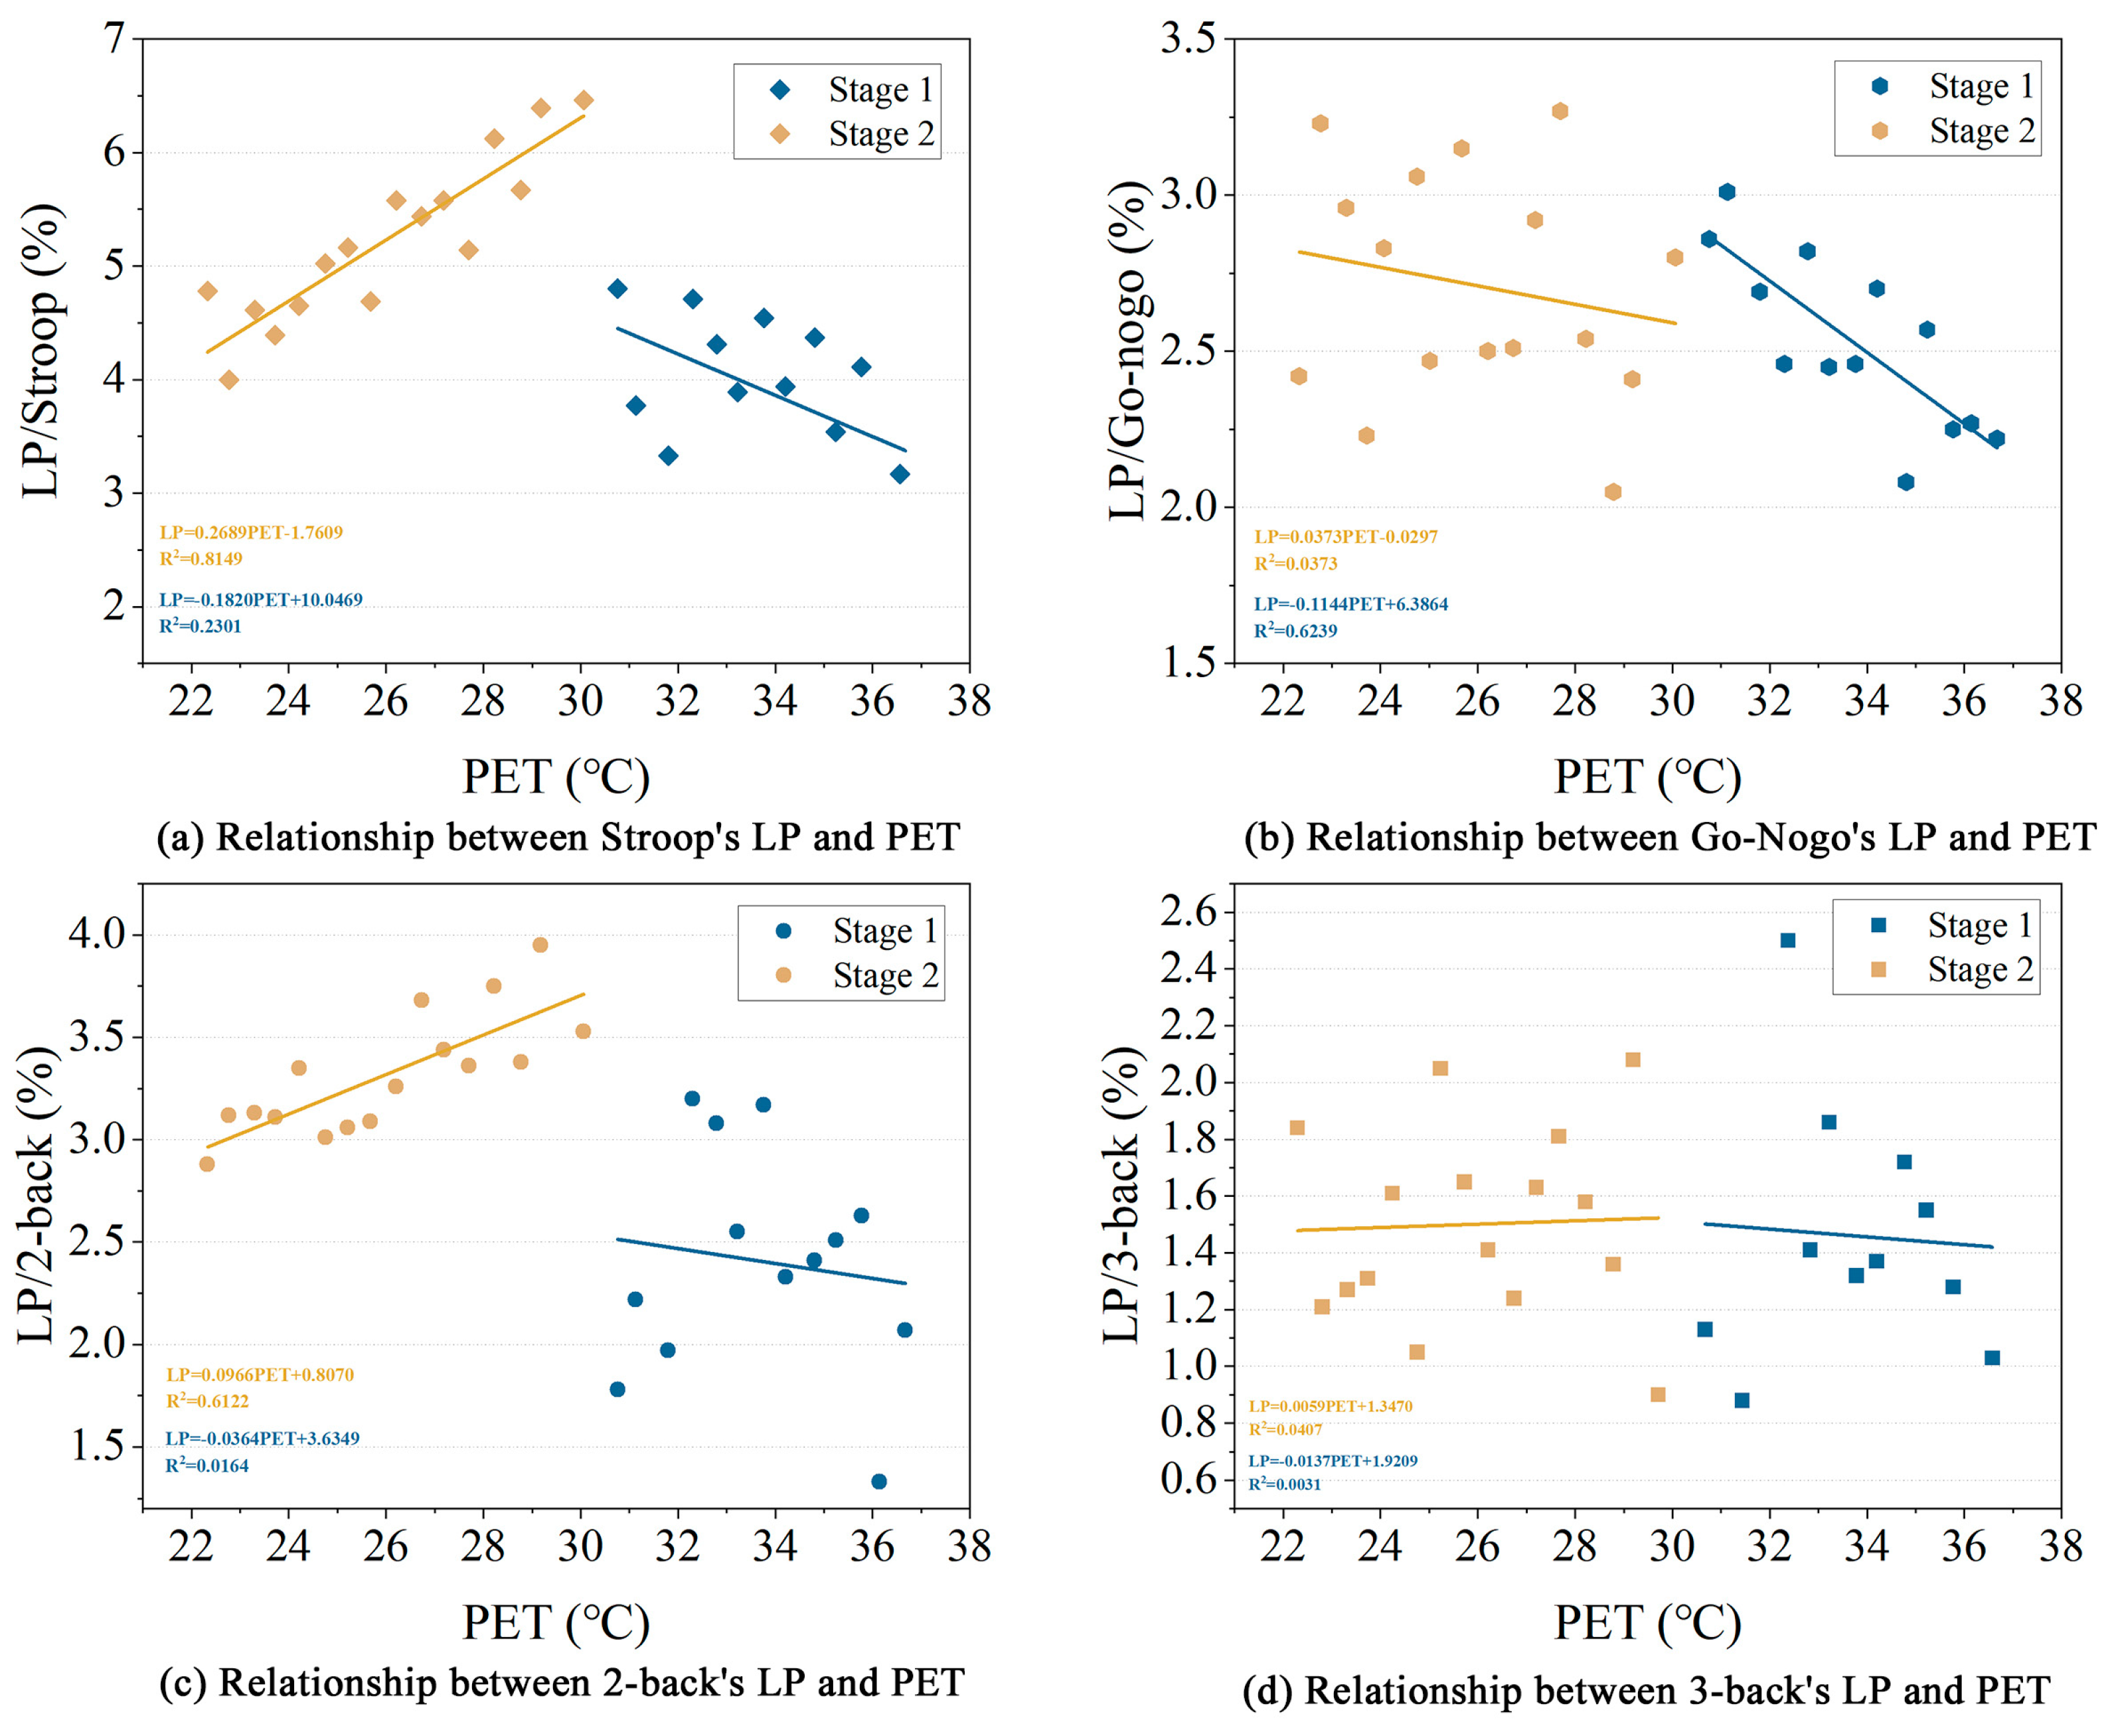
3.9. Relationship between PET and Learning Performance

As shown in Figure 12a, the relationship between PET and LP was not strong (R2 = 0.2301) when the perceptually oriented Stroop test was administered in Stage 1, and in Stage 2, there was a positive relationship between learning performance on the Stroop test and PET (R2 = 0.8149), with an increase of 2.5% in the range of 22.1 °C–31.2 °C PET. This implies that LP values tend to become higher with increasing PET in the neutral to warm range.
Figure 12b shows that LP at Stage 1 was negatively correlated with PET in the Go/No-go test for attention (R2 = 0.6239). That is, there was a 1% decrease in learning performance in the range of 30.4 °C–36.8 °C PET (R2 = 0.6239). There was no significant correlation between LP and PET in Stage 2 (R2 = 0.0373), which suggests that subjects’ attention was not strongly related to the thermal environment between 22.1 °C PET and 31.2 °C PET.
In Figure 12c,d of the n-back test targeting short-term memory, there were two experiments, 2-back and 3-back. Among them, in Stage 1, neither the 2-back test nor the 3-back test had a significant relationship with PET (R2 < 0.3). It indicates that the relationship between changes in the thermal environment and short-term memory is not strong when subjects are in a hotter environment. At Stage 2, the 2-back test was positively related to PET (R2 = 0.6122), with a 1.1% rise in LP as PET increased. This suggests that in the range of 22.1 °C PET–31.2 °C PET, memory improved as PET increased. However, when the difficult 3-back test was administered, the subjects’ academic performance was not significantly correlated with PET (R2 = 0.0407).
Based on these results, it can be concluded that the increase in PET at Stage 1 had a significant negative effect on attention, which decreased by 1%; similar significant negative effects were not observed for short-term memory and perception. In Stage 2, learning performance in perception and short-term memory showed an improvement with the increase in PET, rising by 2.5% and 1.1%, respectively. However, the effect of the more difficult short-term memory test, 3-back, with the thermal environment was not significant.

4. Discussion

4.1. Comparison of Thermal Comfort with Other Regions

At present, most studies focus on sedentary subjects as the main target to analyze the range of neutral temperatures and acceptable environmental parameters for residents in various regions. There are differences in the range of comfort levels in semi-outdoor spaces in different climatic regions [50,51,52]. In this study, the neutral temperature range for college students sitting and studying in semi-outdoor spaces was found to be 24.9–29.6 °C, with a neutral temperature of 27.3 °C (Stage 2). It was discovered that participants could accept a thermal environment with PET < 30.2 °C. Xie et al. measured the neutral temperature in semi-outdoor spaces in Shenzhen during the hot season, which was 28.3 °C, which is relatively consistent with the conclusion of this study [53]. Spagnolo’s findings in Australia and Hwang et al.’s findings in Taiwan were 25 °C [54] and 25.8 °C [12], which is slightly lower than the findings of this study. Othman et al. measured the neutral temperature in semi-outdoor spaces in Malaysia and found it to be 30.8 °C [55], 3.5 °C higher than the result of this study. This suggests that due to climate adaptation, climatic conditions affect the level of thermal adaptation among local populations, resulting in regional differences in neutral temperatures. Furthermore, Yang et al.’s study in the elevated layer in Guangzhou found that the acceptable upper limit of PET was 30.6 °C [56], which is similar to the acceptable upper limit of PET (30.7 °C) obtained in this study. However, Wang et al. found in Guangzhou that when subjects were performing moderate-intensity activities in an elevated layer space, the WBGT should be lower than 29.4 °C [51]. This suggests that there is also some variation in the range of temperatures acceptable to subjects when performing activity behaviors of varying intensities in a semi-outdoor space, with the upper limit of PET acceptable to learners being higher. Additionally, Mihara et al. conducted a similar study in Singapore on subjects performing cognitive tests in elevated layers and found that the acceptable thermal environment range for learning was 23.3 °C to 30.1 °C SET, with a neutral temperature of 27.9 °C [57]. Singapore is located in a tropical region, and residents typically have a higher heat tolerance, leading to a higher neutral temperature compared to this study.

4.2. Indoor Learning Performance

In a study of indoor cognitive ability testing in Singapore, Cen et al. found that subjects demonstrated higher adaptive capacity when performing cognitive tests in cool conditions compared to warm conditions, with subjects’ overall relative performance scores for warm sensations being 7.4%, 8.4%, and 7.4% lower than those for cool, mild, and neutral sensations, respectively [58]. Lan et al. also suggested that higher air temperatures in the thermal comfort range of 24 °C to 28 °C also lead to cognitive decline [26]. However, the results of the present study showed that subjects’ learning performance increased by 2.5% and 1.1% when their thermal sensation was elevated from thermo-neutral to warm (23.5–30 °C) in a semi-outdoor space for a perception-oriented task and a short-term memory task. This is somewhat similar to the study by Kawakud et al., where females were most productive in an indoor neutral to slightly warm environment [59], even though the current study did not consider gender differences. Pradhan et al.’s study concluded that temperatures between 23 and 26 °C play a dominant role in improving learning performance in working memory [18], slightly lower than the findings of this study. In addition, when the difficulty of the short-term memory test increased in the present study, the relationship between learning performance and the thermal environment was not significant at any time. Yang et al. found no significant differences in subjects’ scores on the short-term memory performance test under different temperature conditions indoors [60]. Similar to the findings of the present study, in the attention-oriented task, a weak relationship between attention and a hot environment was found between 22.1 °C PET and 31.2 °C. In contrast, a negative linear relationship between attention and PET was found at 30.4–36.8 °C PET, with a 1% decrease in learning performance, which implies that high temperatures can have some negative effects on attention, whereas Xiong et al.’s study concluded that attention was highest in cool, fairly quiet, and bright environments [61].

4.3. Suggestions for Renovation of Overhead Spaces

The optimizing effect of trees on the outdoor thermal environment has been demonstrated [62]. Trees close to the overhead, the selection of tree species with high LAI values, and a lower height under the branches than the height of the overhead space can improve the thermal environment of the overhead space [63]. And the ecological characteristics of the trees around the overhead and the different planting patterns and orientations will affect the potential microclimate of the overhead. Therefore, improving the thermal environment of the overhead space through rational planting is one of the options to improve the learning performance of the users. Secondly, Mihara et al. found that job performance is affected by emotions [57]; Tao et al. showed that green landscaping has a healing effect and improves the learning performance of the users [63]. This suggests that positive emotions can be enhanced through green plants to improve learning performance on the overhead floor, so green walls, shady plants, etc., can be installed on the overhead floor to increase green landscaping. In addition, the fogging system, as a low-energy evaporative cooling system, can significantly improve the thermal environment [64]. Properly installing a fogging system in the non-learning area of the overhead floor is beneficial for maximizing the user’s learning performance.

4.4. Limitations and Future Research

This study examines how the thermal environment of overhead floors affects college students’ academic performance during the summer and transitional seasons. Future research should consider winter conditions to determine acceptable thermal environments for year-round study. Additionally, this study focused solely on thermal parameters, which may not fully capture the environmental quality of semi-outdoor spaces. Future studies should investigate the interactions between light, visual comfort, and thermal perception on learning performance [65]. In addition, data on physiological parameters of personnel, such as the picoelectric test, skin temperature, etc., can be included in future research work to increase the reliability of the experiment.

5. Conclusions

This study used PET to evaluate how changes in thermal conditions in semi-outdoor spaces under natural conditions affect college students’ thermal comfort and academic performance and to establish a relationship between the thermal environment and the academic performance of university students.
  • Subjects would prioritize Ta and Va when choosing to study in the overhead; they were relatively insensitive to RH and Tmrt. Subjects were more likely to feel fatigued in thermal environments with higher Ta. Most subjects expressed the following: “My eyes are getting tired”.
  • Subjects’ MTSV had no correlation with Ta, Va, RH, and Tmrt in Stage 1 and had a positive correlation with Ta and Tmrt in Stage 2. It was negatively correlated with RH and insignificantly correlated with Va in both stages. The neutral PET of the subjects was 25.5 °C, and the maximum acceptable PET was 30.2 °C.
  • In neutral to slightly warm conditions, perception and short-term memory increased with PET by 2.5% and 1.1%, respectively; however, if the short-term memory test was more difficult, the relationship between the hot environment and learning performance was not significant, and when the environment was overheated, the learning performance declined as a whole, but the magnitude of the decline showed individual differences. In the attention-oriented test, learning performance decreased by 1% as PET increased from 30.4 °C to 36.8 °C, indicating that the thermal environment would have an effect on the attention of college students.
  • As the temperature of the overhead floor changes daily, it is recommended that different types of studies be conducted at varying time periods. When the environment of the overhead floor is too hot, the attention of college students decreases, in which case it is recommended that students go indoors to study.
  • Learning efficiency is affected by the thermal environment, and it is of great significance to make targeted improvements to the thermal environment of the elevated floor for the learning population. This should mainly be through the study of the perimeter of the overhead layer tree planting methods, tree species, ground materials, and appropriate height of the overhead layer.

Author Contributions

Conceptualization, methodology, investigation, writing—first draft preparation, visualization, writing—critique and editing, W.W.; conceptualization, methodology, resources, investigation, funding acquisition, Y.Z.; conceptualization, methodology, resources, investigation, writing—review and editing, J.Y.; resources, supervision, writing critique and editing, M.D., B.H. and Z.Z. supervision, writing critique, X.L. All authors have read and agreed to the published version of the manuscript.

Funding

This research was funded by the Hub Platform for Innovation in Critical Infrastructure Security and Intelligent Operation and Maintenance of Guangzhou University (grant no. PT252022006).

Data Availability Statement

Data supporting this study are available from the corresponding author upon reasonable request.

Conflicts of Interest

The authors declare no conflicts of interest.

References

  1. Kumar, S.; Tewari, P.; Mathur, S.; Mathur, J. Development of mathematical correlations for indoor temperature from field observations of the performance of high thermal mass buildings in India. Build. Environ. 2017, 122, 324–342. [Google Scholar] [CrossRef]
  2. Kang, S.X.; Ou, D.Y.; Mak, C.M. The impact of indoor environmental quality on work productivity in university open-plan research offices. Build. Environ. 2017, 124, 78–89. [Google Scholar] [CrossRef]
  3. Zhang, F.; Haddad, S.; Nakisa, B.; Rastgoo, M.N.; Candido, C.; Tjondronegoro, D.; de Dear, R. The effects of higher temperature setpoints during summer on office workers’ cognitive load and thermal comfort. Build. Environ. 2017, 123, 176–188. [Google Scholar] [CrossRef]
  4. Valancius, R.; Jurelionis, A. Influence of indoor air temperature variation on office work performance. J. Environ. Eng. Landsc. Manag. 2013, 21, 19–25. [Google Scholar] [CrossRef]
  5. Milton, D.K.; Glencross, P.M.; Walters, M.D. Risk of sick leave associated with outdoor air supply rate, humidification, and occupant complaints. Indoor Air-Int. J. Indoor Air Qual. Clim. 2000, 10, 212–221. [Google Scholar] [CrossRef] [PubMed]
  6. Tham, K.W. Indoor air quality and its effects on humans-A review of challenges and developments in the last 30 years. Energy Build. 2016, 130, 637–650. [Google Scholar] [CrossRef]
  7. Pérez-Lombard, L.; Ortiz, J.; Pout, C. A review on buildings energy consumption information. Energy Build. 2008, 40, 394–398. [Google Scholar] [CrossRef]
  8. Chua, K.J.; Chou, S.K.; Yang, W.M.; Yan, J. Achieving better energy-efficient air conditioning—A review of technologies and strategies. Appl. Energy 2013, 104, 87–104. [Google Scholar] [CrossRef]
  9. Chen, A.L.; Chang, V.W.C. Human health and thermal comfort of office workers in Singapore. Build. Environ. 2012, 58, 172–178. [Google Scholar] [CrossRef]
  10. D’Amato, M.; Molino, A.; Calabrese, G.; Cecchi, L.; Annesi-Maesano, I.; D’Amato, G. The impact of cold on the respiratory tract and its consequences to respiratory health. Clin. Transl. Allergy 2018, 8, 20. [Google Scholar] [CrossRef]
  11. Elgheznawy, D.; Eltarabily, S. The impact of sun sail-shading strategy on the thermal comfort in school courtyards. Build. Environ. 2021, 202, 108046. [Google Scholar] [CrossRef]
  12. Hwang, R.-L.; Lin, T.-P. Thermal comfort requirements for occupants of semi-outdoor and outdoor environments in hot-humid regions. Archit. Sci. Rev. 2007, 50, 357–364. [Google Scholar] [CrossRef]
  13. Sarbu, I.; Pacurar, C. Experimental and numerical research to assess indoor environment quality and schoolwork performance in university classrooms. Build. Environ. 2015, 93, 141–154. [Google Scholar] [CrossRef]
  14. Lan, L.; Tang, J.; Wargocki, P.; Wyon, D.P.; Lian, Z. Cognitive performance was reduced by higher air temperature even when thermal comfort was maintained over the 24–28 °C range. Indoor Air 2022, 32, e12916. [Google Scholar] [CrossRef] [PubMed]
  15. Wang, X.; Li, D.; Menassa, C.C.; Kamat, V.R. Investigating the effect of indoor thermal environment on occupants’ mental workload and task performance using electroencephalogram. Build. Environ. 2019, 158, 120–132. [Google Scholar] [CrossRef]
  16. Barbic, F.; Minonzio, M.; Cairo, B.; Shiffer, D.; Cerina, L.; Verzeletti, P.; Badilini, F.; Vaglio, M.; Porta, A.; Santambrogio, M.; et al. Effects of a cool classroom microclimate on cardiac autonomic control and cognitive performances in undergraduate students. Sci. Total Environ. 2022, 808, 152005. [Google Scholar] [CrossRef]
  17. Cho, H. The effects of summer heat on academic achievement: A cohort analysis. J. Environ. Econ. Manag. 2017, 83, 185–196. [Google Scholar] [CrossRef]
  18. Pradhan, S.; Jang, Y.; Chauhan, H. Investigating effects of indoor temperature and lighting on university students’ learning performance considering sensation, comfort, and physiological responses. Build. Environ. 2024, 253, 111346. [Google Scholar] [CrossRef]
  19. Gündogdu, B.; Nouri, A.S.; Afacan, Y.; Matzarakis, A. Investigating the impacts of shaded outdoor spaces on thermal adaptation and cognitive performance of university students in classroom environments. Int. J. Biometeorol. 2023, 67, 1941–1955. [Google Scholar] [CrossRef]
  20. Błażejczyk, K. UTCI—10 years of applications. Int. J. Biometeorol. 2021, 65, 1461–1462. [Google Scholar] [CrossRef]
  21. Zou, B.W.; Fan, C.L.; Li, J.J. Quantifying the Influence of Different Block Types on the Urban Heat Risk in High-Density Cities. Buildings 2024, 14, 2131. [Google Scholar] [CrossRef]
  22. Lau, S.S.Y.; Zhang, J.; Tan, Y.Q. A comparative study of thermal comfort in learning spaces using three different ventilation strategies on a tropical university campus. Build. Environ. 2019, 148, 579–599. [Google Scholar] [CrossRef]
  23. Wong, N.H.; Song, J.; Istiadji, A.D. A study of the effectiveness of mechanical ventilation systems of a hawker center in Singapore using CFD simulations. Build. Environ. 2006, 41, 726–733. [Google Scholar] [CrossRef]
  24. Acero, J.A.; Ruefenacht, L.A.; Koh, E.J.Y.; Tan, Y.S.; Norford, L.K. Measuring and comparing thermal comfort in outdoor and semi-outdoor spaces in tropical Singapore. Urban Clim. 2022, 42, 101122. [Google Scholar] [CrossRef]
  25. Kicherova, M.; Zyuban, E.; Muslimova, E. Non-Formal and Informal Learning: International Recognition Practices. Vopr. Obraz.-Educ. Stud. Mosc. 2020, 126–158. [Google Scholar] [CrossRef]
  26. Tao, Y.; Zhao, F.; Xue, M.; Jiang, B.; Lau, S.S.Y.; Zhang, L. Factors Influencing Seating Preferences in Semi-Outdoor Learning Spaces at Tropical Universities. Buildings 2023, 13, 982. [Google Scholar] [CrossRef]
  27. Deng, X.; Nie, W.; Li, X.; Wu, J.; Yin, Z.; Han, J.; Pan, H.; Lam, C.K.C. Influence of built environment on outdoor thermal comfort: A comparative study of new and old urban blocks in Guangzhou. Build. Environ. 2023, 234, 110133. [Google Scholar] [CrossRef]
  28. Mao, Y.; Zhu, Y.; Guo, Z.; Zheng, Z.; Fang, Z.; Chen, X. Experimental investigation of the effects of personal protective equipment on thermal comfort in hot environments. Build. Environ. 2022, 222, 109352. [Google Scholar] [CrossRef] [PubMed]
  29. Li, K.M.; Zhang, Y.F.; Zhao, L.H. Outdoor thermal comfort and activities in the urban residential community in a humid subtropical area of China. Energy Build. 2016, 133, 498–511. [Google Scholar] [CrossRef]
  30. Dell’Isola, M.; Frattolillo, A.; Palella, B.I.; Riccio, G. Influence of Measurement Uncertainties on the Thermal Environment Assessment. Int. J. Thermophys. 2012, 33, 1616–1632. [Google Scholar] [CrossRef]
  31. Meteorology, V.E. Methods for the human Biometeorological Evaluation of Climate and Air Quality for the Urban and Regional Planning at Regional Level; VDI: Berlin, Germany, 1998; Volume 3787. [Google Scholar]
  32. Höppe, P. The physiological equivalent temperature: A universal index for the biometeorological assessment of the thermal environment. Int. J. Biometeorol. 1999, 43, 71–75. [Google Scholar] [CrossRef] [PubMed]
  33. Gulyas, A.; Unger, J.; Matzarakis, A. Assessment of the microclimatic and human comfort conditions in a complex urban environment:: Modelling and measurements. Build. Environ. 2006, 41, 1713–1722. [Google Scholar] [CrossRef]
  34. Chen, L.; Ng, E. Outdoor thermal comfort and outdoor activities: A review of research in the past decade. Cities 2012, 29, 118–125. [Google Scholar] [CrossRef]
  35. Heng, S.L.; Chow, W.T.L. How ‘hot’ is too hot? Evaluating acceptable outdoor thermal comfort ranges in an equatorial urban park. Int. J. Biometeorol. 2019, 63, 801–816. [Google Scholar] [CrossRef] [PubMed]
  36. Cheung, P.K.; Jim, C.Y. Subjective outdoor thermal comfort and urban green space usage in humid-subtropical Hong Kong. Energy Build. 2018, 173, 150–162. [Google Scholar] [CrossRef]
  37. ANSI/ASHRAE, 55. Thermal Environmental Conditions for Human Occupancy; American Society of Heating: Norcross, GA, USA, 1992; Volume 5.
  38. ISO7730; Determination of the PMV and PPD Indices and Specification of the Conditions for Thermal Comfort. International Organisation for Standardisation: Geneva, Switzerland, 1994.
  39. Yoshitake, H. Occupational Fatigue-Approach from Subjective Symptom; The Institute for Science of Labor: Tokyo, Japan, 1973. (In Japanese) [Google Scholar]
  40. Tanabe, S.; Nishihara, N. Productivity and fatigue. Indoor Air 2004, 14, 126. [Google Scholar] [CrossRef] [PubMed]
  41. Zhang, X.; Wargocki, P.; Lian, Z.; Thyregod, C. Effects of exposure to carbon dioxide and bioeffluents on perceived air quality, self-assessed acute health symptoms, and cognitive performance. Indoor Air 2017, 27, 47–64. [Google Scholar] [CrossRef]
  42. Lan, L.; Lian, Z. Use of neurobehavioral tests to evaluate the effects of indoor environment quality on productivity. Build. Environ. 2009, 44, 2208–2217. [Google Scholar] [CrossRef]
  43. Liu, W.; Zhong, W.; Wargocki, P. Performance, acute health symptoms and physiological responses during exposure to high air temperature and carbon dioxide concentration. Build. Environ. 2017, 114, 96–105. [Google Scholar] [CrossRef]
  44. Lan, L.; Lian, Z.; Pan, L.; Ye, Q. Neurobehavioral approach for evaluation of office workers’ productivity: The effects of room temperature. Build. Environ. 2009, 44, 1578–1588. [Google Scholar] [CrossRef]
  45. Stroop, J.R. Studies of interference in serial verbal reactions. J. Exp. Psychol. 1935, 18, 643. [Google Scholar] [CrossRef]
  46. Leon-Dominguez, U.; Francisco Martin-Rodriguez, J.; Leon-Carrion, J. Executive n-back tasks for the neuropsychological assessment of working memory. Behav. Brain Res. 2015, 292, 167–173. [Google Scholar] [CrossRef] [PubMed]
  47. Lan, L. Mechanism and Evaluation of Indoor Environment on Personnel Work Efficiency. Master’s Thesis, Shanghai Jiao Tong University, Shanghai, China, 2010. [Google Scholar]
  48. Nishihara, N.; Xiong, J.; Kim, J.; Zhu, H.; de Dear, R. Effect of adaptive opportunity on cognitive performance in warm environments. Sci. Total Environ. 2022, 823, 153698. [Google Scholar] [CrossRef] [PubMed]
  49. Tian, X.; Fang, Z.; Liu, W. Decreased humidity improves cognitive performance at extreme high indoor temperature. Indoor Air 2021, 31, 608–627. [Google Scholar] [CrossRef] [PubMed]
  50. Fukawa, Y.; Watanabe, Y.; Ogawa, Y.; Hisayama, R.; Nomoto, A.; Nakano, J.; Nakagawa, J.; Tanabe, S.-i. Effects of various environmental grades on thermal comfort in semi-outdoor spaces. Jpn. Archit. Rev. 2023, 6, e12414. [Google Scholar] [CrossRef]
  51. Wang, W.; Ding, G.; Wang, Y.; Li, J. Field study on the effect of space type, exercise intensity, and wet bulb globe temperature on thermal responses of exercisers. Build. Environ. 2022, 225, 109555. [Google Scholar] [CrossRef]
  52. Zafarmandi, S.; Mahdavinejad, M.; Norford, L.; Matzarakis, A. Analyzing Thermal Comfort Sensations in Semi-Outdoor Space on a University Campus: On-Site Measurements in Tehran’s Hot and Cold Seasons. Atmosphere 2022, 13, 1034. [Google Scholar] [CrossRef]
  53. Xie, X.; Liao, H.; Wang, R.; Gou, Z. Thermal Comfort in the Overhead Public Space in Hot and Humid Climates: A Study in Shenzhen. Buildings 2022, 12, 1454. [Google Scholar] [CrossRef]
  54. Spagnolo, J.; de Dear, R. A field study of thermal comfort in outdoor and semi-outdoor environments in subtropical Sydney Australia. Build. Environ. 2003, 38, 721–738. [Google Scholar] [CrossRef]
  55. Othman, N.E.; Zaki, S.A.; Rijal, H.B.; Ahmad, N.H.; Razak, A.A. Field study of pedestrians’ comfort temperatures under outdoor and semi-outdoor conditions in Malaysian university campuses. Int. J. Biometeorol. 2021, 65, 453–477. [Google Scholar] [CrossRef]
  56. Zhao, Y.; Yang, J.; Fang, Z.; Zhang, X.; Guo, T.; Li, Y. Passive design strategies to improve student thermal comfort: A field study in semi-outdoor spaces of academic buildings in hot-humid areas. Urban Clim. 2024, 53, 101807. [Google Scholar] [CrossRef]
  57. Mihara, K.; Chen, S.; Hasama, T.; Tan, C.L.; Lee, J.K.W.; Wong, N.H. Environmental satisfaction, mood and cognitive performance in semi-outdoor space in the tropics. Build. Environ. 2022, 216, 109051. [Google Scholar] [CrossRef]
  58. Cen, C.; Cheng, S.; Wong, N.H. Effect of elevated air temperature and air velocity on thermal comfort and cognitive performance in the tropics. Build. Environ. 2023, 234, 110203. [Google Scholar] [CrossRef]
  59. Kawakubo, S.; Sugiuchi, M.; Arata, S. Office thermal environment that maximizes workers’ thermal comfort and productivity. Build. Environ. 2023, 233, 110092. [Google Scholar] [CrossRef]
  60. Yang, Y.; Hu, L.; Zhang, R.; Zhu, X.; Wang, M. Investigation of students? short-term memory performance and thermal sensation with heart rate variability under different environments in summer. Build. Environ. 2021, 195, 107765. [Google Scholar] [CrossRef]
  61. Xiong, L.; Huang, X.; Li, J.; Mao, P.; Wang, X.; Wang, R.; Tang, M. Impact of Indoor Physical Environment on Learning Efficiency in Different Types of Tasks: A 3 × 4 × 3 Full Factorial Design Analysis. Int. J. Environ. Res. Public Health 2018, 15, 1256. [Google Scholar] [CrossRef]
  62. Yang, J.; Zhao, Y.; Zou, Y.; Xia, D.; Lou, S.; Liu, W.; Ji, K. Effects of Tree Species and Layout on the Outdoor Thermal Environment of Squares in Hot-Humid Areas of China. Buildings 2022, 12, 1867. [Google Scholar] [CrossRef]
  63. Yang, J.; Zhao, Y.; Guo, T.; Luo, X.; Ji, K.; Zhou, M.; Wan, F. The impact of tree species and planting location on outdoor thermal comfort of a semi-outdoor space. Int. J. Biometeorol. 2023, 67, 1689–1701. [Google Scholar] [CrossRef]
  64. Xie, X.; Sun, Z.; Zhu, X.; Zhao, S.; Wang, Z.; Zhai, Y. Influence of misting system on the thermal environment and thermal comfort of seated people in semi-outdoor space in Xi’an, China. Front. Archit. Res. 2024, 13, 668–681. [Google Scholar] [CrossRef]
  65. te Kulve, M.; Schlangen, L.; Lichtenbelt, W.v.M. Interactions between the perception of light and temperature. Indoor Air 2018, 28, 881–891. [Google Scholar] [CrossRef]
Figure 1. Sites for conducting thermal experiments and learning efficiency tests.
Buildings 14 03225 g001
Figure 2. Climatic parameters of the experiment.
Buildings 14 03225 g002
Figure 3. Procedures.
Buildings 14 03225 g003
Figure 4. Selection of environmental elements.
Buildings 14 03225 g004
Figure 5. Distribution of Thermal Sensation Votes (TSVs), and −2: cool; −1: slightly cool; 0: neutral; 1: slightly hot; 2: hot; and 3: very hot.
Buildings 14 03225 g005
Figure 6. Thermal satisfaction.
Buildings 14 03225 g006
Figure 7. Thermal parameter preference votes.
Buildings 14 03225 g007
Figure 8. Environmental parameters and MTSV.
Buildings 14 03225 g008
Figure 9. PET and MTSV.
Buildings 14 03225 g009
Figure 10. Relationship between the percentage of unacceptability and each thermal parameter.
Buildings 14 03225 g010
Figure 11. Learning performance at two stages.
Buildings 14 03225 g011
Figure 12. Learning performance and PET in both stages.
Buildings 14 03225 g012
Table 1. Two phases of climate change.
Stage 1Stage 2
MinimumMaximumAverageStandard DeviationMinimumMaximumAverageStandard Deviation
Air temperature, °C28.2634.1231.811.3823.8629.2625.651.54
Relative humidity, %60.388.871.920.4652.472.459.815.69
Globe temperature, °C28.2234.7232.11.4724.1931.6927.511.6
Wind speed, m/s01.640.40.460.022.310.640.45
Mean radiation
temperature, °C
28.2236.732.51.8324.2927.9837.741.77
PET, °C30.3636.7533.791.322.1331.2225.621.92
Table 2. Instruments used in this study.
InstrumentTypeParameterMeasurement RangeAccuracySampling Rate (s)
Thermal comfort level recorderSSDZY-1Ta−20.0–80.0 °C±0.3 °C60
RH0.01–99.9%±2% (10–90%)60
Tg−20.0−80.0 °C±0.3 °C60
Va0.05–5 m/s5% ± 0.05 m/s60
Table 3. Subjective thermal response voting scale.
Thermal SensationThermal ComfortThermal PreferenceAcceptabilitySatisfaction
−3, Very cold−1, Uncomfortable−1, Cooler−1, Unacceptable−3, Very dissatisfied
−2, Cold0, Neutral0, No change1, Acceptable−2, Dissatisfied
−1, Slightly cold1, Comfortable+1, Warmer −1, Slightly dissatisfied
0, Neutral 0, Neutral
1, Slightly hot 1, Slightly satisfied
2, Hot 2, Satisfied
3, Very hot 3, Very Satisfied
Table 4. Anthropometric data of subjects (SD: standard deviation).
SexNumber Age in Years (SD)Height in m (SD)Weight in kg (SD)Body Surface Area in m2 (SD)
Male219Mean21.57 (2.37)1.71 (0.0025)60.9 (37.96)1.67 (0.0062)
Maximum24183852.05
Minimum18160501.46
Female281Mean21.32 (3.58)1.58 (0.0035)51.89 (25.28)1.48 (0.0042)
Maximum241.67651.70
Minimum181.50431.31
Table 5. Proportion of fatigue.
FatigueStage 1Stage 2
Total64.953.2
mental fatigue (%)I feel impatient6.46.0
I am uncertain19.312.4
I can’t concentrate23.313.9
Total49.032.3
drowsiness and dullness (%)My eyes are getting tired34.225.9
I can’t stop yawning15.410.4
I feel like lying down23.811.4
Total73.347.8
lack of physical integration (%)I have a headache6.43.5
My eyes are twitching8.42.5
My shoulder muscles are tense10.46.0
My limbs are shaking1.50.5
I feel unwell4.02.5
My back hurts4.02.5
I feel giddy1.01.0
Total35.718.4
Disclaimer/Publisher’s Note: The statements, opinions and data contained in all publications are solely those of the individual author(s) and contributor(s) and not of MDPI and/or the editor(s). MDPI and/or the editor(s) disclaim responsibility for any injury to people or property resulting from any ideas, methods, instructions or products referred to in the content.

