Article

Fatigue Behavior of H-Section Piles under Lateral Loads in Cohesive Soil

by
José A. Pérez
1,
Alberto Ponce-Torres
1,
José D. Ríos
2,* and
Estíbaliz Sánchez-González
1
1
Department of Mechanical Engineering, Energy and Materials, Escuela de Ingenierías Industriales, Universidad de Extremadura, 06006 Badajoz, Spain
2
Department of Continuum Mechanics and Structural Analysis, Escuela Superior de Ingeniería, Universidad de Sevilla, 41004 Sevilla, Spain
*
Author to whom correspondence should be addressed.
Buildings 2024, 14(10), 3228; https://doi.org/10.3390/buildings14103228 (registering DOI)
Submission received: 30 August 2024 / Revised: 30 September 2024 / Accepted: 9 October 2024 / Published: 11 October 2024
(This article belongs to the Section Building Structures)

Abstract

:
Most structures supporting solar panels are found on thin-walled metal piles partially driven into the ground, optimizing costs and construction time. These pile foundations are subjected to repetitive lateral loads from various external forces, such as wind, which can compromise the integrity of the pile-soil system. Given that the expected operational lifespan of photovoltaic solar plants is generally 20–30 years, predicting their service life under fatigue loads is crucial. This research analyzes the response of H-section piles to lateral fatigue loads in cohesive rigid soils through four field tests, subjected to load cycles of 55%, 72%, and 77% of the static failure load, corresponding to maximum loads of 25 kN, 32 kN, and 35 kN, respectively. Additionally, the effect of load cycles on the degradation of pile-soil adhesion is studied through two pull-out tests following cyclic tests. This study reveals that soil fatigue does not occur under repetitive loads and that soil stiffness remains constant once the cycles causing soil compaction have been overcome. Nevertheless, the accumulated plastic deflection of the soil increases steadily once soil compaction occurs due to cyclic loading. The implications of these results on the fatigue life of photovoltaic solar panel foundations are discussed.

1. Introduction

Foundations with piles are widely used in low-bearing capacity soils to transfer loads to more resistant layers [1,2]. In cohesive soils, the load-bearing capacity of piles depends on various factors, such as soil cohesion, internal friction angle, friction, and adhesion between the soil and the pile shaft, among others [3,4,5]. These foundations can be subjected to both axial and lateral loads simultaneously [6,7,8,9]. In some cases, lateral loads may be relatively light and do not need to be accounted for in pile design. However, in other scenarios, such as the pillars of photovoltaic solar panels, lateral wind loads predominate due to the large surface area of the panels and their low weight. This cyclic loading can lead to fatigue and potential failure if not properly accounted for [10,11,12]. Therefore, the design must ensure that the piles can withstand these repeated lateral forces over the lifespan of the installation, which is approximately 20–30 years. This makes resistance to lateral cyclic loads a crucial aspect of the design, often governing the design of piles.
According to Uncuoğlua and Laman [13] and Vahabkashi et al. [14], the geometry of the pile plays an essential role in the soil-pile interaction, affecting the stress distribution in the soil, which has direct implications for the design. In scenarios where lateral loads predominate, it is common to use profiles with high flexural inertia, such as circular or H-section piles [15,16]. Qui Lai et al. [17] demonstrated that circular piles distribute stresses more homogeneously, being especially effective in cohesive soils to avoid localized failures. Consequently, there is a significant amount of research dedicated to foundations utilizing circular hollow piles, constructed from materials such as concrete [3,18,19,20,21] or steel [22,23,24,25,26]. The high flexural inertia of these profiles is crucial for resisting lateral loads, ensuring stability, and preventing excessive deflections.
However, in pile foundations used to support solar panel structures in photovoltaic plants, H- or U-section piles are often driven directly into the ground. In these applications, the piles are typically only partially embedded, which reduces their load-bearing capacity due to the smaller friction surface and the increased concentration of stresses in the surrounding soil. This can lead to progressive erosion and excessive lateral displacements [27,28]. The partial embedding also means that the piles are more susceptible to lateral loads, which can cause significant bending stresses. If the lateral load exceeds the pile’s flexural capacity, it may result in lateral buckling and excessive bending. Furthermore, the cyclic nature of wind loads on solar panels can exacerbate these issues, leading to fatigue and potential failure over time. Therefore, it is crucial to consider these factors in the design phase to ensure the long-term stability and performance of the pile foundations.
The analysis of lateral loads is more complex than that of axial loads, as it requires solving nonlinear differential equations to obtain reliable results [1]. Pile failure under lateral forces can happen because of the soil or the pile itself. When the soil around the embedded part of the pile yields, it leads to what is known as rigid-pile (or short pile) failure. Conversely, if the pile section yields at the point of maximum stress, it results in a flexible pile (or long pile) failure [21,29]. Hence, accurately assessing the lateral behavior of single piles is crucial for their reliable design and performance.
Bauer and Reul [30] conducted extensive experimental tests and numerical simulations to investigate the lateral pressure on individual piles and pile groups in cohesive soils. Their research identified critical factors such as soil-pile interface roughness, pile size, pile shape, and spacing that significantly influence the development of lateral pressure. By utilizing small-scale 1 × g-model tests and finite element method simulations, they provided a more comprehensive understanding of these influences and developed a simplified analysis approach to address the limitations of existing design methods for H-section piles under lateral loads.
Additionally, research by Zhang and Ahmari [31] developed a novel method for the nonlinear analysis of laterally loaded rigid piles in cohesive soils. Their approach considers force and moment equilibrium to derive system equations for a rigid pile under lateral eccentric loads, solved through an iterative scheme. They introduced a new closed-form expression for determining the lateral bearing factor, accounting for the nonlinear variation of ultimate lateral soil resistance with depth. Additionally, their method incorporates horizontal shear resistance at the pile base using a bilinear shear-displacement relationship. The validity of their method was confirmed through comparisons with 3D finite element analysis and field test results, offering a simplified yet effective alternative for analyzing laterally loaded rigid piles in cohesive soils.
On the other hand, the work of Luo et al. [32] on the bearing capacity of piles in cohesive soils has been fundamental in understanding the failure mechanisms and factors affecting the stability of piles under lateral loads. They developed a design model for laterally loaded rigid monopiles in cohesive soils, focusing on the depth of the rotation point and soil reaction distribution. Their work identified key factors such as the mobilization coefficient of soil reaction and its relationship with monopile head rotation. The model’s reliability was validated through numerical simulations, offering a robust method for predicting nonlinear load-deformation responses in cohesive soils.
In the case of piles with open-ended cross-sections, recent studies have begun to address the particularities of their behavior [33,34,35,36]. For example, Kido et al. [37] demonstrated that for open-ended piles in thin bearing layers, significant soil displacement occurs within and below the pile tip, reducing soil density and friction, which lowers bearing capacity. Their findings emphasize the importance of considering specific geometric and loading conditions in developing accurate models for pile behavior.
Despite significant advancements in understanding the behavior of lateral piles in cohesive soils, critical knowledge gaps remain, particularly concerning H-section piles subjected to fatigue loads. This research delves into the progressive degradation of cohesive soils not saturated under cyclic lateral loads applied to partially embedded, thin-walled H-section piles. By evaluating lateral deflection until soil failure and comparing it with static analysis results, this study aims to bridge these gaps.
A full-scale experimental study was conducted, focusing on the flexion of profiles with low torsional susceptibility, analyzing cyclic lateral deflections and soil stiffness loss over the structure’s service life. Real stress conditions commonly used in the foundations of photovoltaic plants were simulated. The process included comprehensive soil characterization through penetration tests (Dynamic Probing Super Heavy, DPSH), geotechnical test pits, soil characterization tests, and lateral load tests to failure, establishing a homogeneous behavior zone for the test field.
Simulating wind effects on solar panel structures, lateral load tests with multiple load and unload cycles were performed using specialized instrumentation to measure both lateral loads and resulting deflections. Additionally, tensile tests with progressive loads to soil failure were conducted, adhering to standardized design codes such as API (American Petroleum Institute) standards [38] and France’s Fascicule 62 [39]. The objective of these tests is to analyze whether repetitive loads influence soil adherence under vertical actions.
Finally, the study evaluated the influence of load cycles on recorded deflections and soil stiffness deterioration. By solving the elastic equation and utilizing experimental data, the impact of repeated loads on the tensile capacity of the piles and the resulting permanent deformations were analyzed. This comprehensive analysis offers a deeper understanding of soil and structure behavior under long-term cyclic loading conditions, promising to enhance future design and maintenance strategies in civil infrastructure.

2. Methodological Approach

2.1. Steel Pile Description, Properties and Preliminary Testing

For this experiment, bi-symmetrical metal profiles with parallel flanges from the American series, specifically W6 × 15 piles as per ASTM A6/A 6M [40], were selected. These profiles, manufactured from S355 steel, were chosen for their superior torsional constant, which surpasses that of other available profiles (see Table 1). The alignment of the center of gravity with both the shear and torsional centers minimizes the potential impact of torsion caused by small eccentricities during load application, ensuring accurate experimental results [41].
Additionally, the selection of S355 steel was based on its high yield strength and excellent ductility, which are critical for withstanding the dynamic loads applied during testing. The material properties were verified through tensile tests, confirming compliance with the specified standards.
The geometric properties of the W6 × 15 piles, including flange width, web thickness, and overall height, were meticulously measured and recorded. These dimensions are crucial for calculating the section modulus and moment of inertia, which are essential parameters in the analysis of pile behavior under load.
To further enhance the reliability of the experimental results, each pile was subjected to a series of preliminary tests to assess its initial straightness and any residual stresses. These preliminary tests included visual inspections and non-destructive testing methods such as ultrasonic testing to detect any internal flaws or inconsistencies.
The experimental setup was designed to replicate real-world loading conditions as closely as possible. The piles were embedded in a controlled soil environment, with precise control over soil properties such as density and moisture content. Load application was carried out using a hydraulic actuator, with load increments carefully monitored and recorded using high-precision load cells.

2.2. Soil Characterization and Testing

The field investigation was conducted on a 10.50 ha plot located in the Los Caños de Zafra Industrial Park, Extremadura, Spain. First, a 20 × 20 m area with similar stratigraphic behavior was delineated to allow for comparison of the results obtained from the different tests. In this designated area, geotechnical excavations (see Figure 1), two DPSH tests [42], and a series of laboratory tests were carried out. These procedures enabled a comprehensive soil characterization, revealing that the area exhibited homogeneous geotechnical characteristics.
The study analyzes the behavior of cohesive soil with specific mechanical characteristics. The results can be extrapolated to soils with similar characteristics by first characterizing their lateral deformation parameters. The mechanical conditions of the soil and in particular its modulus of deformation will vary as a function of moisture content [43,44,45,46], which must be taken into account in the design of foundations, by means of models that analyze the long-term change in stiffness as a function of the expected changes in moisture content.

2.2.1. Granulometric Analysis

The granulometric analysis was conducted following the EN 17892-4:2019 standard [47], which ensures that the procedures are consistent and reliable. This standard outlines specific methods for preparing soil samples, conducting sieving processes, measuring particle sizes, and calculating gradation. Adherence to this standard guarantees that rigorous protocols were followed during testing. Each sieve captures particles of a specific size range, allowing for the separation and quantification of different particle sizes. This process requires precise calibration of the sieves to ensure accuracy. The sieving process is typically conducted in a controlled environment to minimize external variables that could affect the results.

2.2.2. Atterberg Limits

The Atterberg Limits were measured in accordance with the UNE-EN ISO 17892-4:2019 standard [47]. These tests are crucial for determining the soil’s behavior at different moisture contents, providing valuable insights into its plasticity and potential for shrink-swell behavior.
Liquid Limit (LL): The Liquid Limit was determined using the Casagrande cup method. In this method, a soil sample is placed in a standard brass cup, and a groove is cut through the soil. The cup is then repeatedly dropped from a specified height onto a hard rubber base. The number of blows required to close the groove over a distance of 12.7 mm (0.5 inches) is recorded. The moisture content at which the groove closes after 25 blows is defined as the Liquid Limit. This test identifies the moisture content at which the soil transitions from a plastic to a liquid state, providing critical data on the soil’s consistency and workability.
Plastic Limit (PL): The Plastic Limit was determined by rolling out soil threads until they crumble at a specific moisture content. A small portion of soil is rolled into threads of 3 mm diameter on a glass plate. The moisture content at which the soil threads begin to crumble and cannot be re-rolled is recorded as the Plastic Limit. This test indicates the transition from a semi-solid to a plastic state, offering insights into the soil’s plasticity and its ability to be molded without cracking.
Plasticity Index (PI): The Plasticity Index is calculated as the difference between the Liquid Limit and the Plastic Limit (PI = LL − PL). This index provides a measure of the soil’s plasticity, indicating its potential for shrink-swell behavior. Soils with a high Plasticity Index are more likely to undergo significant volume changes with variations in moisture content, which is crucial for assessing the soil’s suitability for construction and engineering applications.

2.2.3. Direct Shear Strength

The direct shear strength of the soil was assessed in accordance with the EN 17892-10:2019 standard [47]. This rigorous standard ensures that the testing procedures are consistent and reliable, providing high-quality data. The test involved placing soil samples in a shear box apparatus, a device specifically designed to measure the shear strength of soil. The shear box consists of two stacked halves that can move relative to each other.
A normal load was applied to the soil sample within the shear box to simulate the pressure that the soil would experience in situ. This load was carefully controlled and monitored to ensure precision. The soil was then sheared along a predetermined plane by moving the top half of the shear box horizontally while the bottom half remained stationary. This shearing action mimics the forces that soil would encounter in real-world conditions, such as during construction or under the weight of structures.
The test provided crucial data on two key parameters: the soil’s cohesion and its internal friction angle. Cohesion refers to the soil particles’ ability to stick together, while the internal friction angle measures the resistance to sliding along internal surfaces within the soil. These parameters are essential for understanding the soil’s stability and load-bearing capacity.

2.2.4. Geotechnical Strata Identification

The following geotechnical strata have been identified, as shown in Figure 1:
Level 1. Vegetative Soil: Clayey sands with a thickness ranging from 0.10 to 0.20 m in the test zone.
Level 2. Sandy clays: With a thickness between 0.80 and 0.90 m in the test zone (Table 2). Direct shear tests (UD) yielded cohesion values between 0.44 and 0.75 kPa, and an internal friction angle of 23.4° to 24.7°. The bulk density of the soil is 21.5 kN/m3.
Level 3. Clay with gravel: Extending from Level 2 to the end of the boreholes, at depths greater than 3 m (Table 3). Direct shear tests (UD) indicated cohesion values between 0.41 and 0.44 kPa, and an internal friction angle of 23.7° to 27°. The bulk density of the soil is 22.0 kN/m3.

2.2.5. Consistency and Compaction

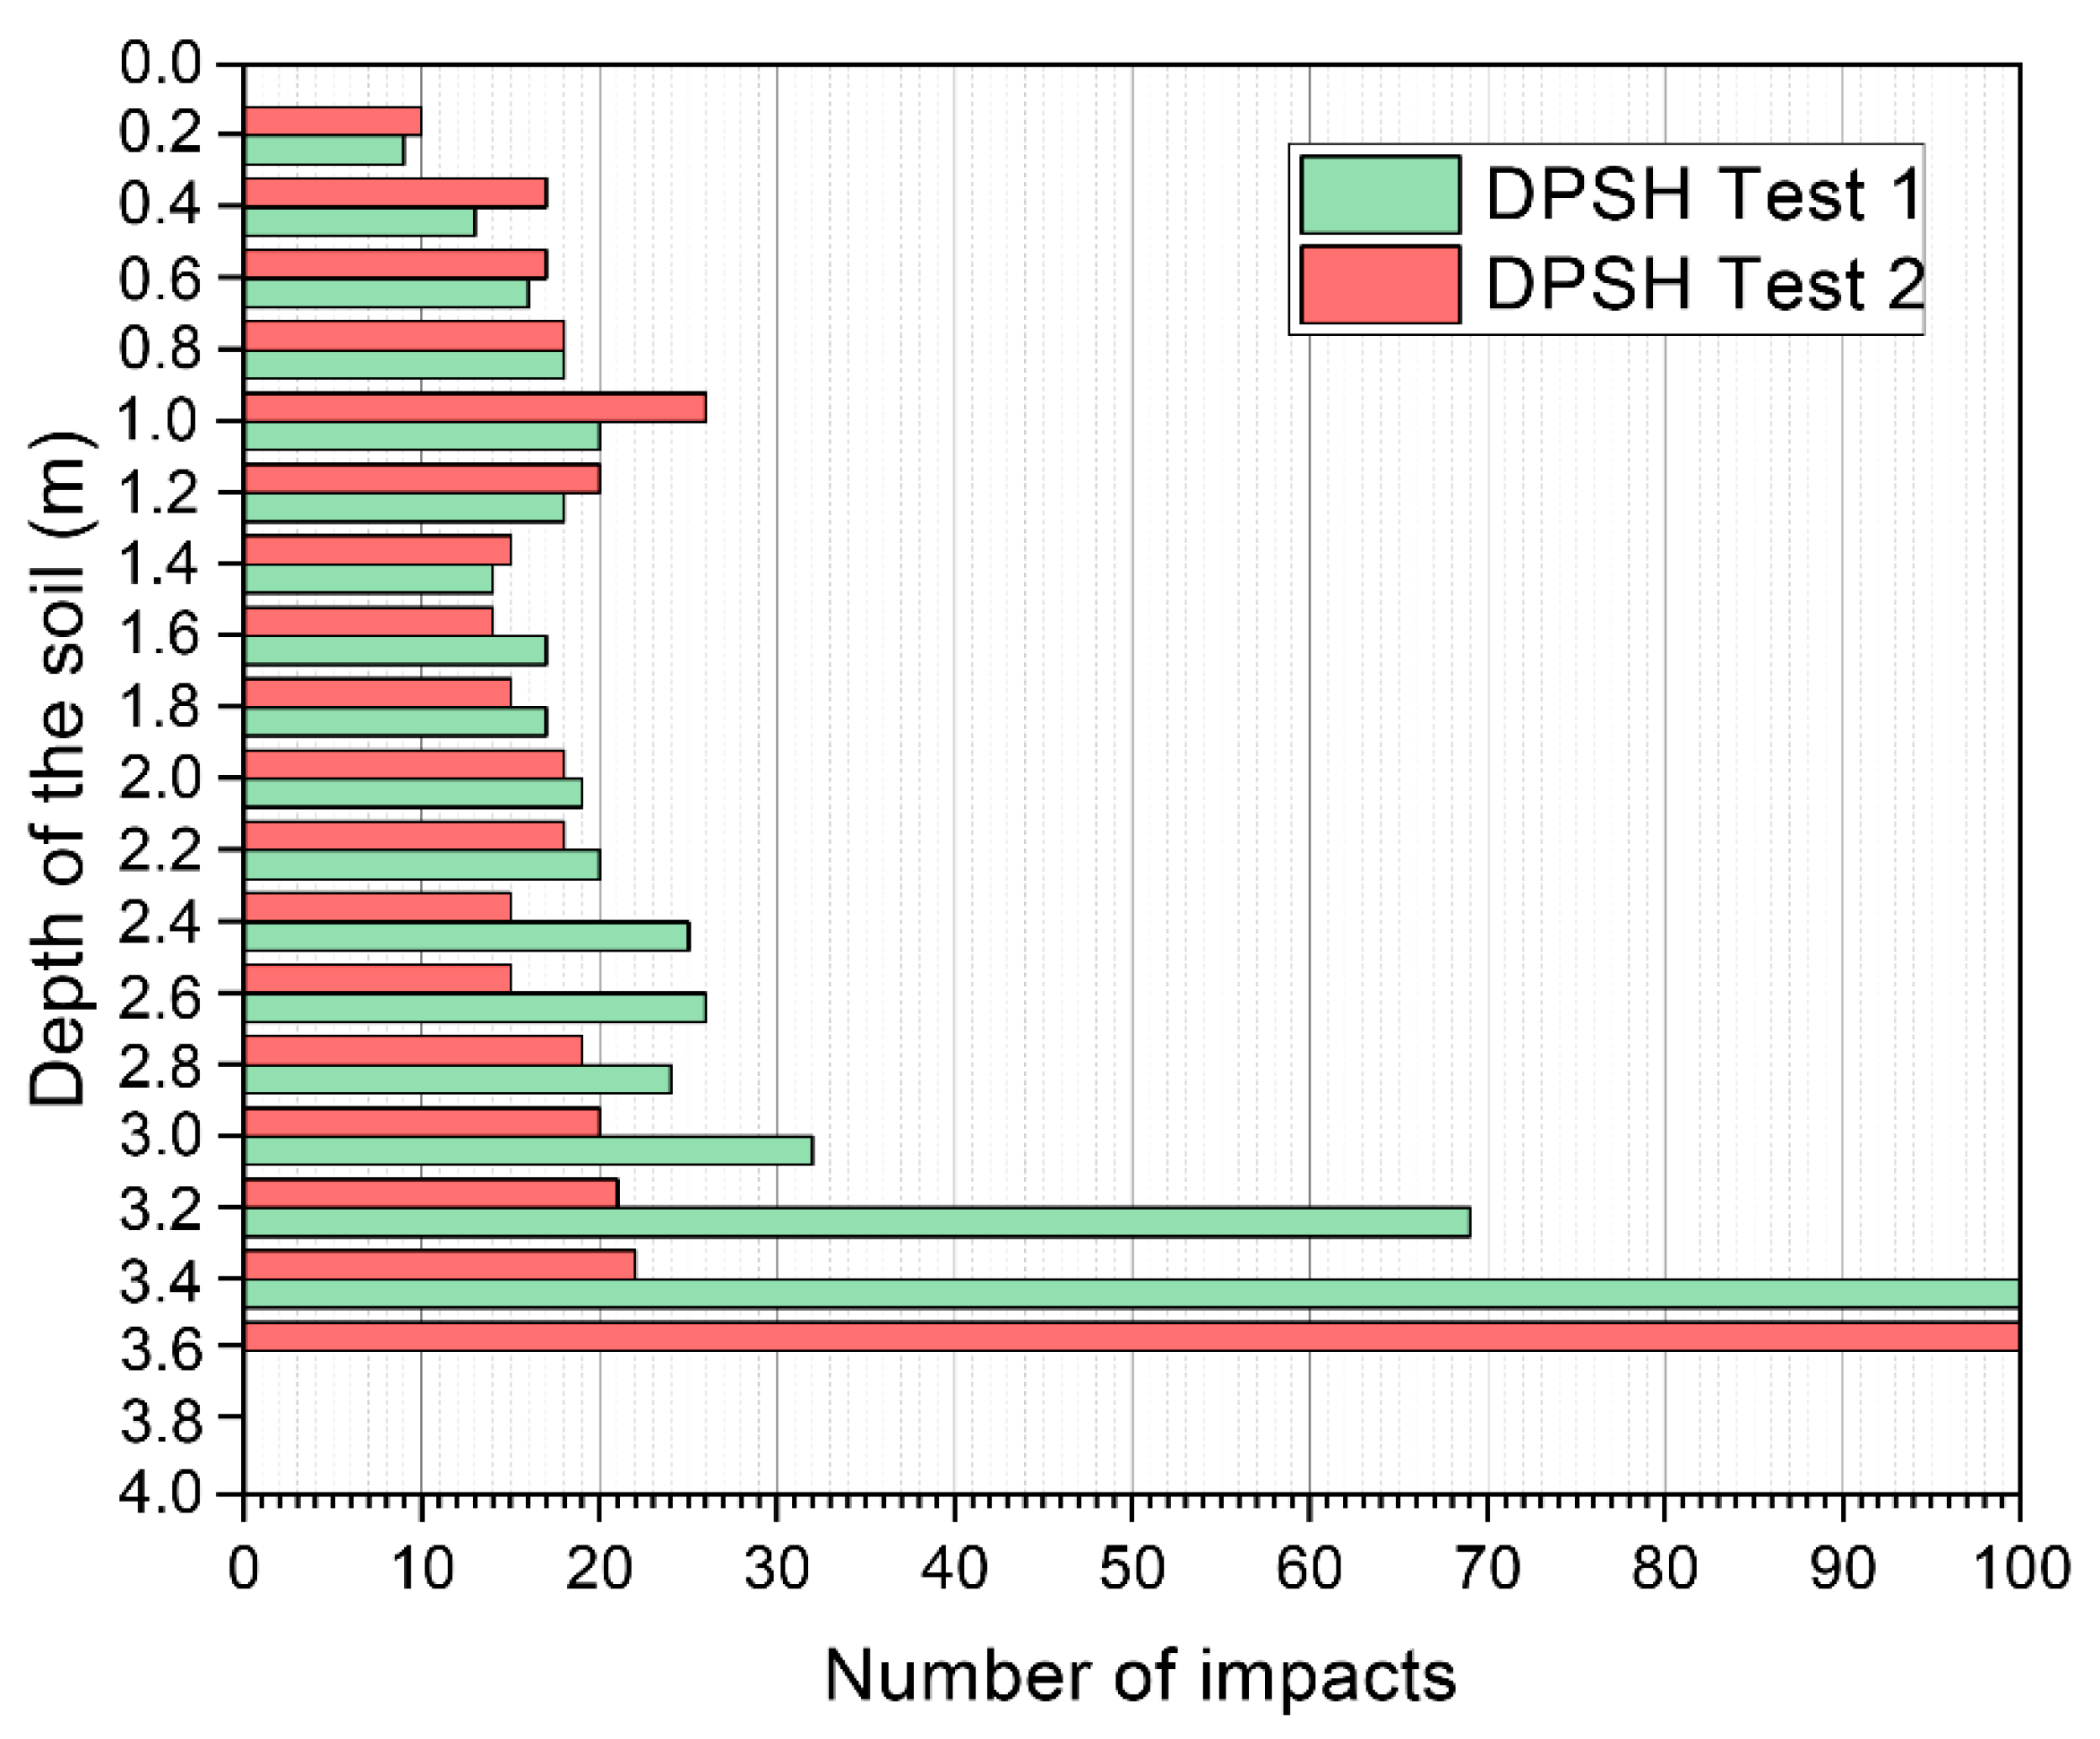
The soil consistency was assessed through DPSH tests, which are designed to evaluate the compaction and strength of the soil. The results from these tests indicate a medium level of compaction. Specifically, two DPSH tests were conducted up to the point of refusal, and the results from both tests were remarkably similar, underscoring the consistency of the soil’s compaction characteristics.
Figure 2 visually represents the results of these DPSH tests. The graph displays the number of impacts on the horizontal axis, ranging from 0 to 100, and the depth in meters on the vertical axis, ranging from 0 to 4.0 m at intervals of 0.2 m. There are two sets of data represented by bars: one set in green labeled “DPSH Test 1” and another set in red labeled “DPSH Test 2”. Both sets show a similar pattern of increasing the number of impacts with depth, indicating medium compaction consistency as mentioned in the text. The bars for both tests are almost identical at each depth level, which visually supports the statement that the DPSH tests yielded very similar results up to refusal. This graphical representation provides empirical evidence that enhances the reliability of the textual description by showing consistent data across two separate DPSH tests.

2.2.6. Soil Characterization and Depth Determination for Experimentation

Prior characterization of the soil was essential for planning the experimental campaign. The DPSH tests provided a measure of soil compactness with depth, which is directly related to strength. Additionally, together with the trial pits, the tests enabled the delineation of an area with homogeneous compactness at the test points.
The trial pits were executed to allow direct observation of the geotechnical units and the extraction of samples. The granulometry, Atterberg limits, and direct shear tests provided physical data on the soil, which are closely related to its mechanical behavior.
These preliminary tests allowed for the delineation of a test area with similar theoretical behavior and the characterization of the soil to design the test campaign according to the expected theoretical results.
The characterization was completed with the Grundbau-Taschenbuch [48] studies, classifying the soil as ‘Sand with fines that alter the granular structure’, with a secant deformation modulus, Es, of 25 MN/m2, which considers the elastic-plastic behavior of the soil [49].
Horizontal subgrade reaction was determined from the expressions of Terzaghi [41] and Broms [50]:
k h = 0.75 E s b
where b is the contact width of the pile with the soil.
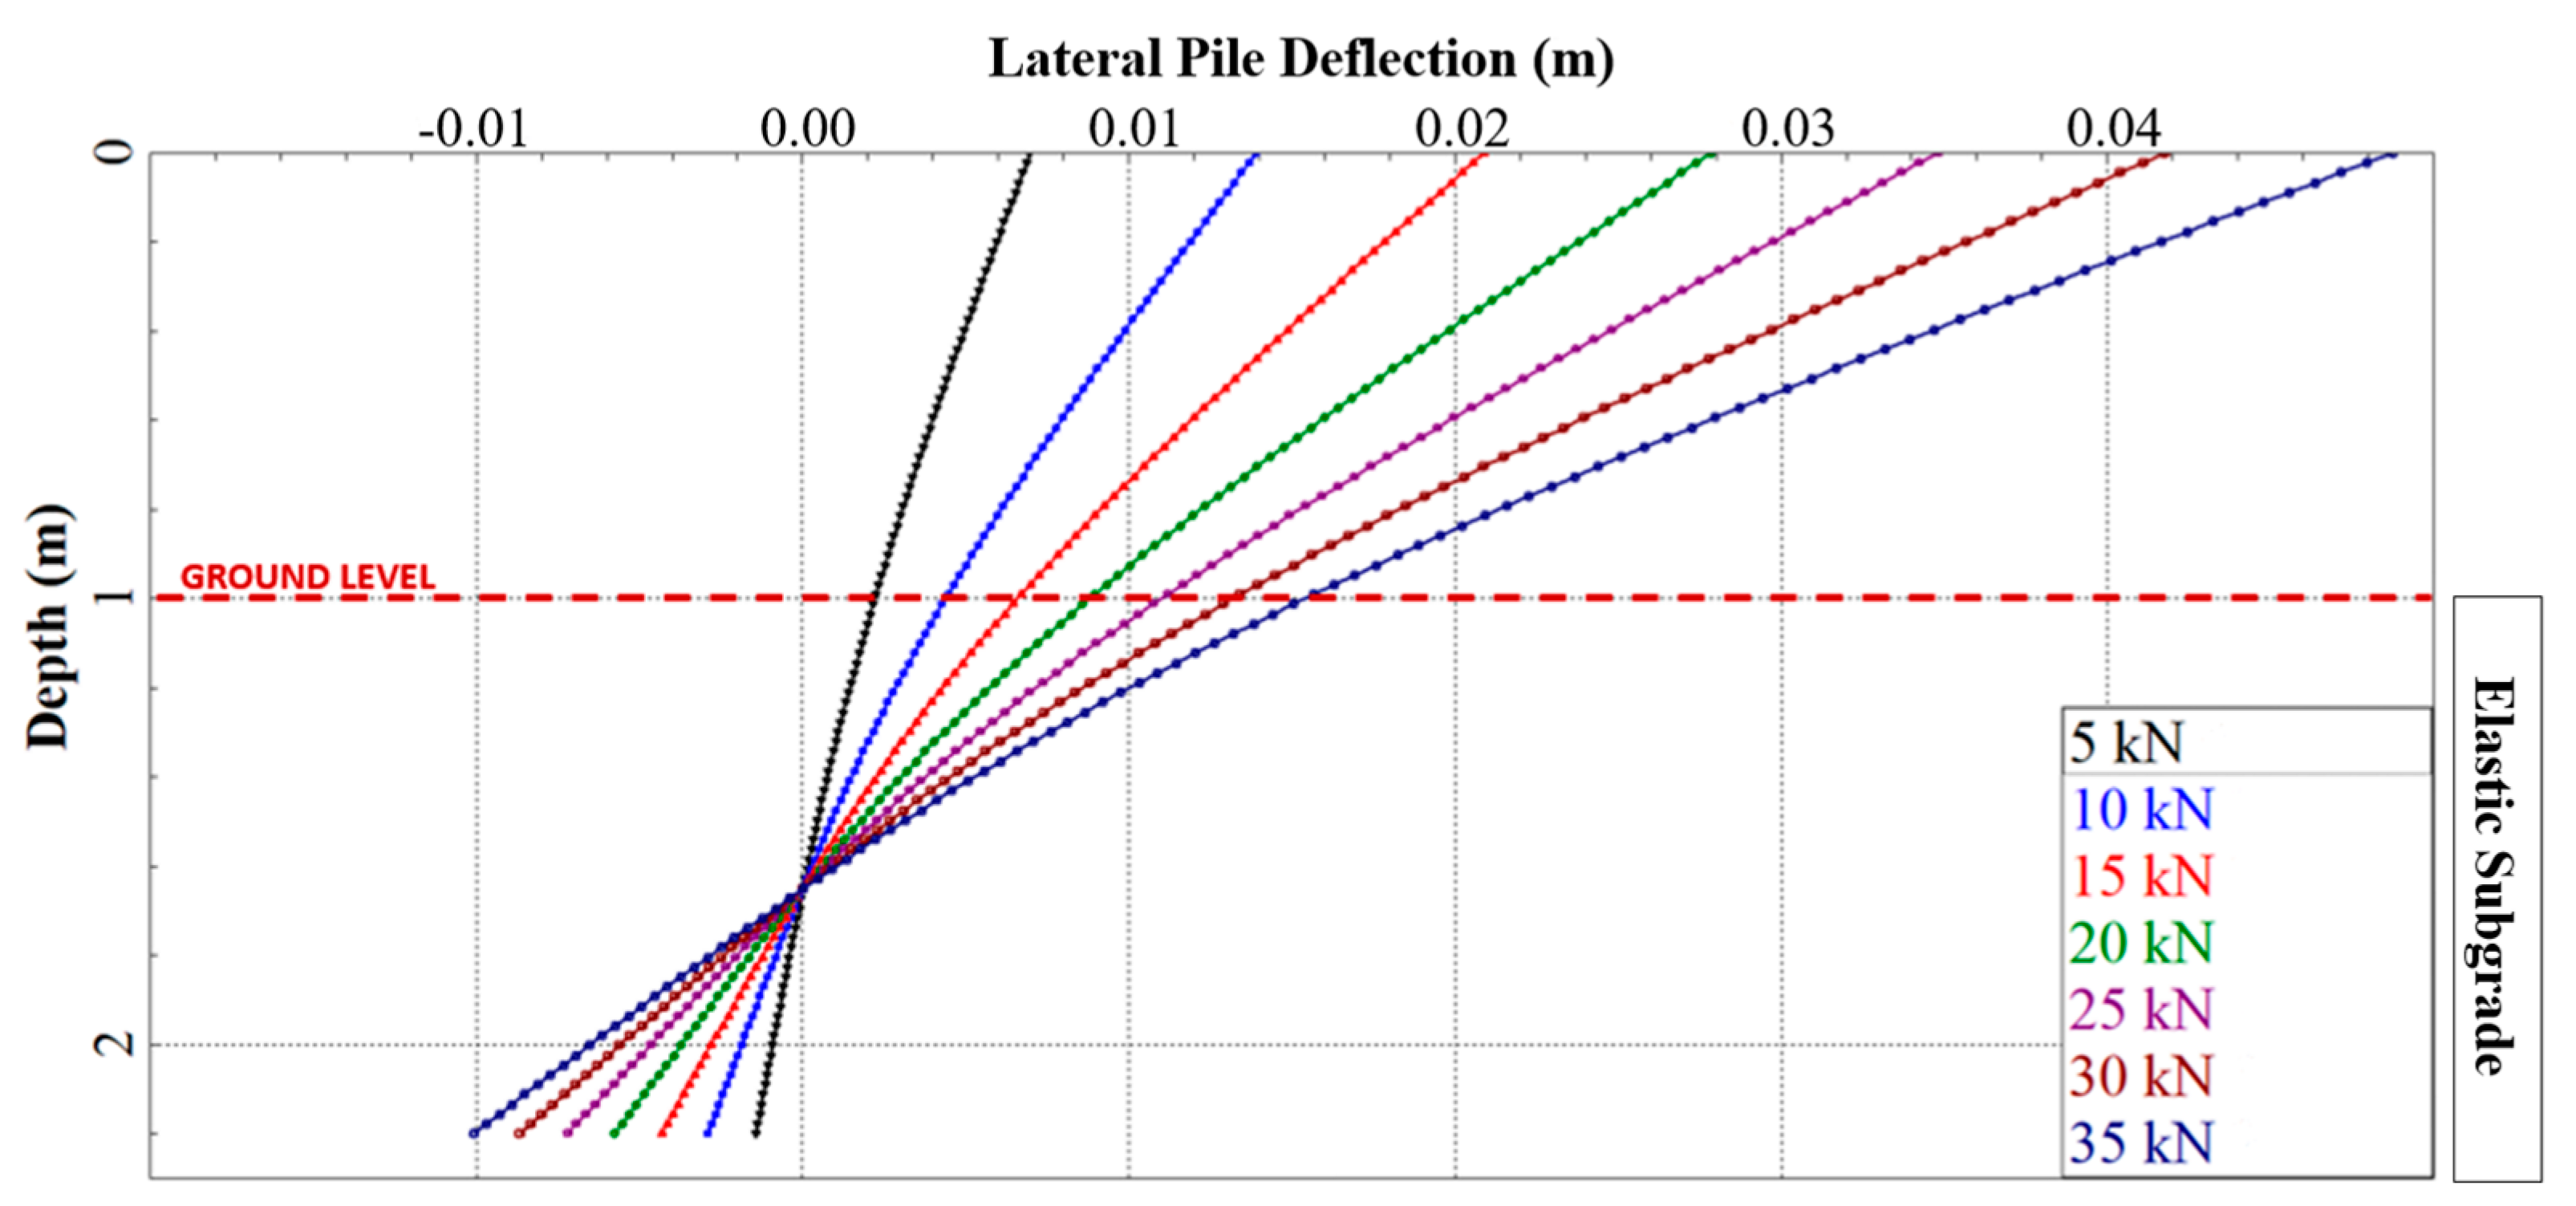
An initial elastic model was created based on the calculated theoretical horizontal modulus of the reaction to determine the depth of the test piles (Figure 3). The maximum deflection was limited to 20 mm, measured at 10 cm above ground level, which are values commonly used in the design of photovoltaic plants. An incremental load of 5 kN was simulated in steps until the static unbalanced state of the model was reached. The L-pile v2019 software was used, considering an elastic ground with a bulk density of 21.5 kN/m3, and a kh = 123.35 MN/m3, obtaining the following deflections in the profile for load steps between 5 kN and 35 kN, not reaching the equilibrium of the system for loads higher than 35 kN:
This elastic model, considering the theoretical secant deformation modulus, provided us with a first approximation of the behavior of the ground, which allowed the design of the experimental Tests 1 and 2, with an embedment depth of the profiles of 1.20 m.

2.2.7. Horizontal Subgrade Modulus Experimental Calculation

To calculate the experimental horizontal subgrade modulus of the soil, lateral load tests were conducted on W6 × 15 profiles driven to a depth of 1.20 m, with incremental loading applied until final soil failure (Tests 1 and 2). At each stage, the deflection and rotation of the profile were measured to ensure that torsional deflections did not influence the results [23]. The W6 × 15 profile was used because it is one of the commonly used profiles in photovoltaic solar panel supports and has relatively high torsional and warping inertia, which minimizes torsional deflection and warping. This allows the study to focus on flexural behavior, which is the main objective. Additionally, its geometric and material properties are well-documented, facilitating reliable modeling and validation of the research findings.

2.2.8. Load Application and Measurement

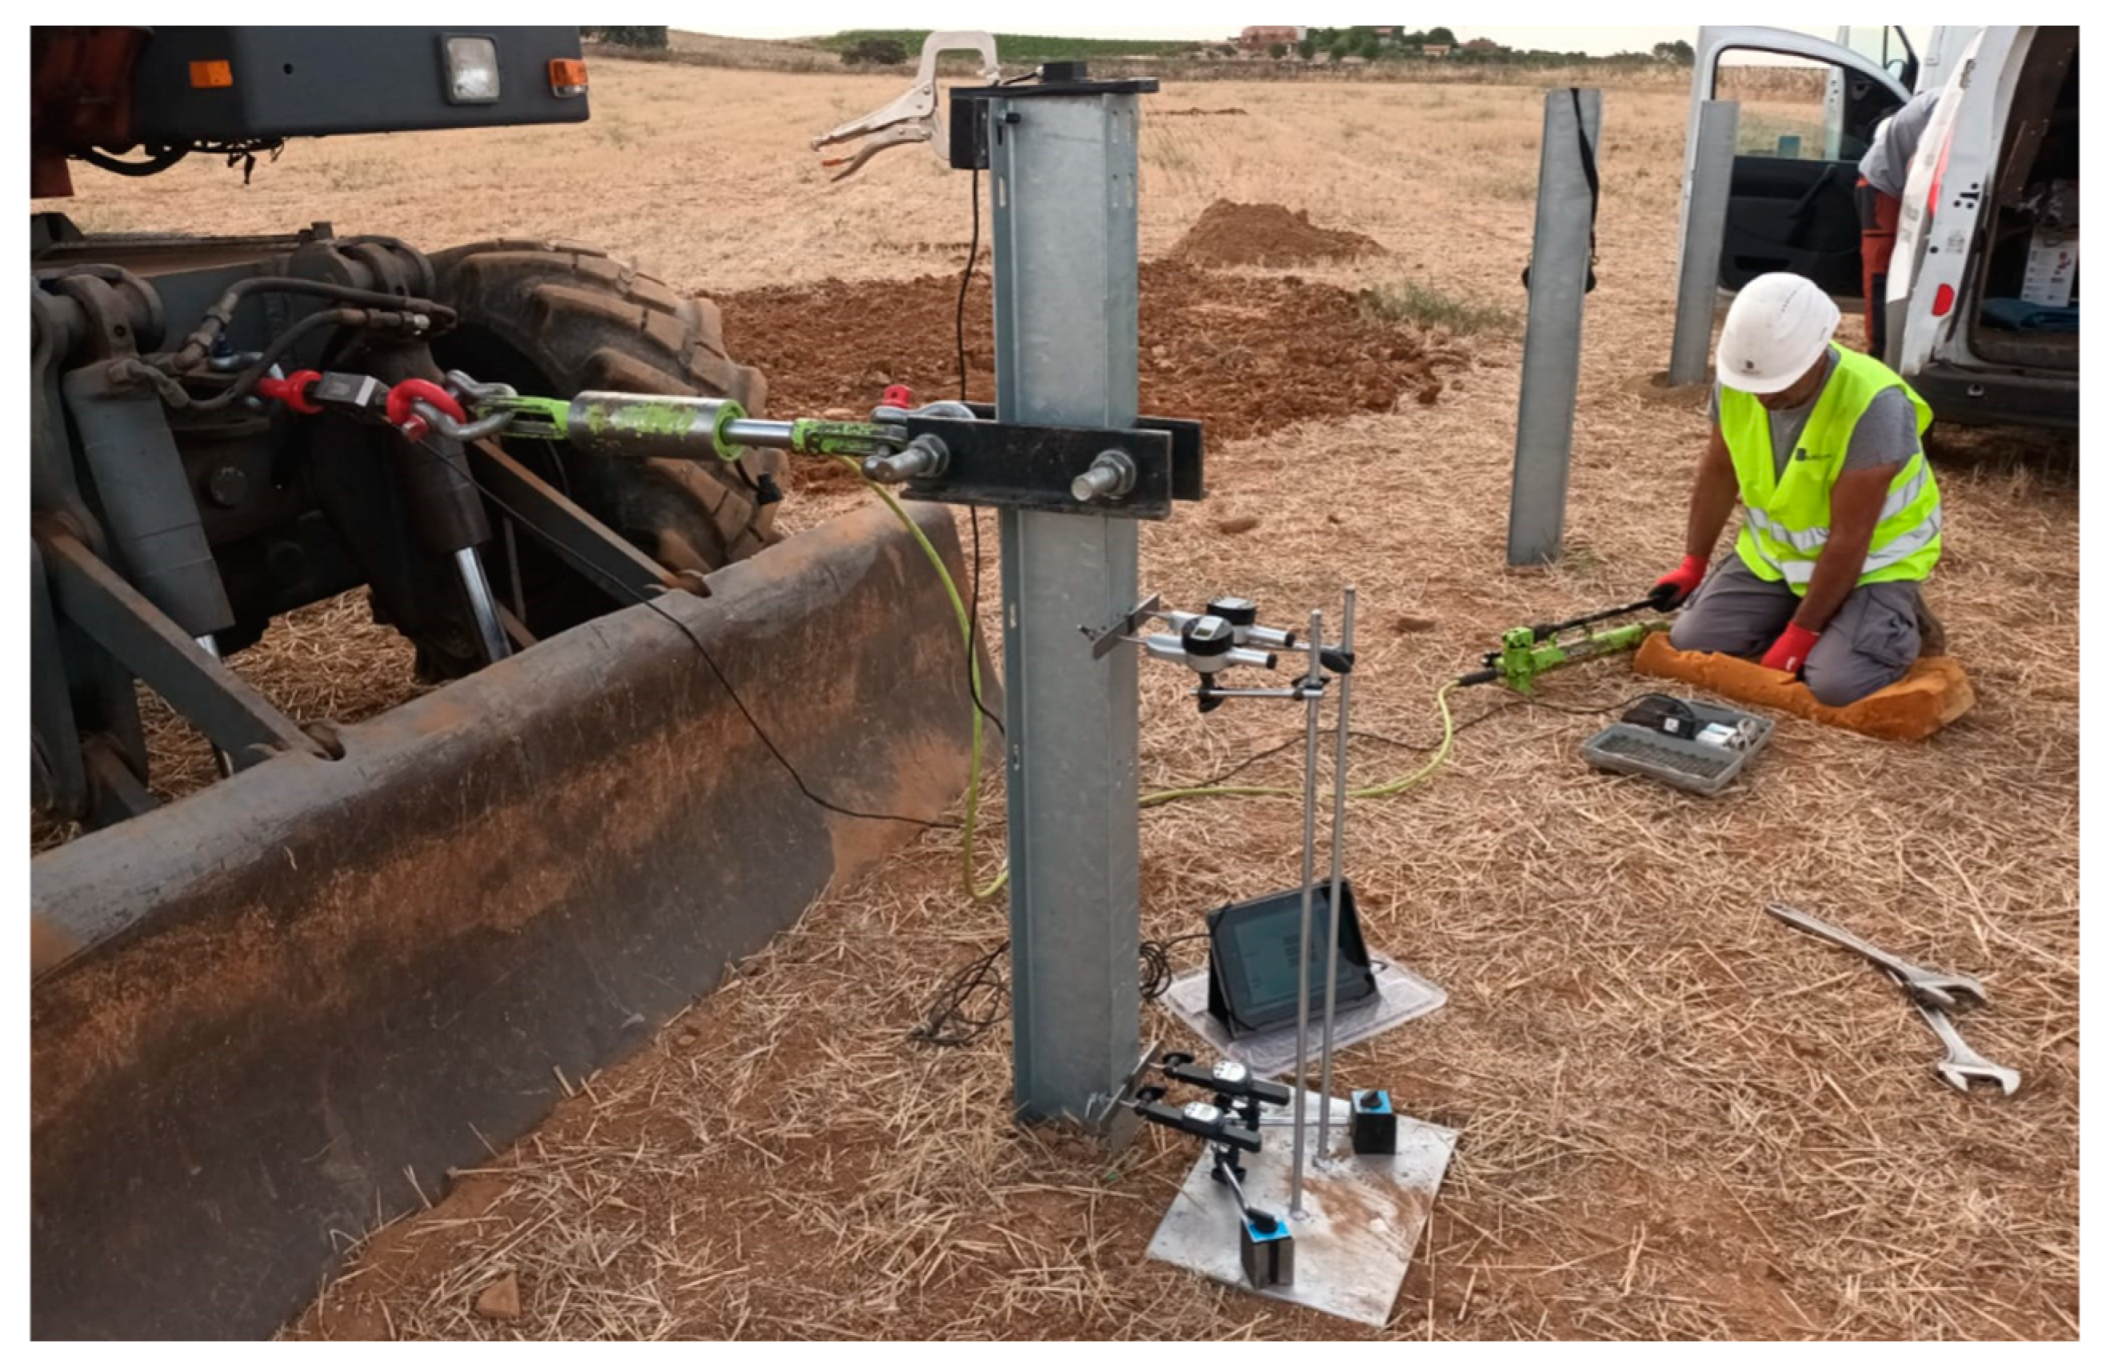
The test load was applied using a hydraulic cylinder. This cylinder was securely anchored to an excavator, ensuring stability and precise control over the applied load. The load was meticulously managed using a calibrated tension load cell, allowing for accurate measurement and control throughout the test.
The load application equipment is based on the requirements indicated in ASTM D3966-22 [38], adapted to the objectives of the experiment. An ENERPAC brand hydraulic cylinder, model BRP106L with a capacity of 100 kN, higher than 20% of the maximum applied load indicated in ASTM D3966-22 [38], was used. The stroke of the hydraulic cylinder is 152.40 mm, which is greater than expected during the test and 15% of the width of the W6 × 15 profile. A DINACELL tensile load cell, model CTC 15T AC M30X2 with serial number 2201635M001, calibrated between 0 and 150 kN, much higher than the maximum expected load, was used. The calibration of the cell was carried out on 11 August 2023, with certification number 87104, by the company TCC S.L. accredited by the ENAC accreditation body. The tests were carried out between 15 and 18 August 2023, so the calibration was less than 6 months old in accordance with the recommendations of the ASTM D3966-22 [38] standard. The calibrated cell has an accuracy of 30 N, less than 10% of the applied load. The load cell used has a resolution of 10 N, less than 1% of the applied load. Calibrations are carried out with UNE (Una Norma Española) criteria instead of ASME (American Society of Mechanical Engineers) by using European-accredited laboratories.
Deflection and rotation of the profile were measured using pairs of calibrated micrometer gauges, precision instruments capable of measuring small distances or angles with high accuracy. These gauges were strategically positioned at two points: 10 cm and 75 cm above the soil surface. This dual positioning allowed for detailed monitoring of both deflection and rotation at different heights, providing a comprehensive understanding of the profile’s behavior under load.
Measurements were taken at each stage of loading and unloading, ensuring that the data captured reflected the profile’s response to both increasing and decreasing loads. This approach offered insights into its elastic and plastic deformation characteristics. The entire instrumentation setup, including the hydraulic cylinder, load cell, and micrometer gauges, was carefully arranged to minimize errors and ensure the accuracy of the experimental tests.
Calibrated micrometer gauges have a real-time display of the movement available during the test. The indicators have graduations of 0.01 mm less than the 0.25 mm required by the ASTM D3966-22 [38] standard. Dial indicators used have calibration certificates issued by SERIKAL CALIBRACIÓN, S.L., a company accredited by the authorized body in Spain ENAC. Calibrations are carried out with UNE criteria instead of ASME by using European-accredited laboratories.
The torsional deflections were measured by means of two pairs of precision micrometric gauges, placed on graduated rulers, allowing us to control the position of 4 points of the profile and calculate the rotation. Although the angle of rotation was less than 2° during the tests, the deflection was corrected by eliminating the displacement produced by the torsional component that has been measured.
The setup is illustrated in Figure 4 and Figure 5, which provide a visual representation of the equipment and their relative positions.

3. Experimental Campaign

The following sections describe the tests conducted and the different stages of the experimental field campaign.

3.1. Monotonic Lateral Load Tests

Two lateral load tests (Test 1 and 2) were conducted on W6 × 15 type profiles, each with a length of 2.2 m and a penetration depth of 1.2 m into the soil. These tests were specifically designed to characterize the soil properties through lateral load testing up to soil failure and to determine the soil’s ultimate bearing capacity. The results provided detailed insights into the soil’s behavior, contributing to an experimental characterization of the initial horizontal subgrade reaction as a function of the applied load.
Loading steps were established considering the indications of the ASTM D3966-22 [38] standard, where the load increments are established between 10% and 25% of the design load. In the tests, load increments of 10% of the theoretical breaking load of 25 kN estimated by the previous experience of the company AUSCULTIA were established. The previous analysis of the ground described in Section 2.2. was also considered, where the loss of static equilibrium of the elastic model described above occurs at loads of more than 35 kN.

3.2. Lateral Load Fatigue Tests

Four cyclic lateral load tests (FT-1 to FT-4) were conducted on W6 × 15 profiles to evaluate their behavior under various conditions. The profile length and penetration depth were the same as those used in Section 3.1. FT-1 and FT-2 tests were subjected to maximum loads equivalent to 55% of the soil’s static failure load, with 31 loading cycles applied in increments of 12.5 kN, 18.75 kN, and 25.0 kN. The choice of 55% of the failure load was based on the results from experimental static tests, following the practice of using a safety factor between 1.8 and 2 to ensure soil integrity under service loads.
Subsequently, additional cyclic lateral load tests were conducted with maximum loads reaching 72% and 77% of the soil’s failure load. These tests (FT-3 and FT-4) involved 120 loading cycles with increments between 32 and 35 kN, respectively. The decision to increase both the load level and the number of cycles was motivated by observations from the previous phase, where the soil did not exhibit significant deterioration. This adjustment was made to explore a broader range of loads and to gather additional data on soil behavior.

3.3. Pull-Out Pile Tests

One of the objectives of this study was to determine whether repetitive lateral load tests could impact the future tensile strength of the foundations. To investigate this, seven static tensile load tests were conducted until the profiles were pulled out. Five of these profiles had been previously tested under lateral loads (Tests 1, 2, FT-1, FT-2, and FT-4), while two (POT-1 and POT-2) underwent only the tensile test, serving as a reference for potential loss of soil strength due to alteration during the lateral load tests.
All tensile tests were performed on S355 steel W6 × 15 profiles with an initial penetration depth of 1.20 m. The test was conducted using pressure jaws at the center of the web section, applying a continuous incremental load until the profile was pulled out. To minimize deviations in the load direction, the verticality of the pull was controlled using a precision inclinometer.

4. Results and Discussions

4.1. Experimental Determination of Subgrade Reaction

Figure 6 presents the experimental values of the horizontal subgrade reaction obtained from the two characterization tests. Initially, at loads below 15 kN for TEST-2 and 17.5 kN for TEST-1, an apparent increase in the subgrade reaction is observed. This phenomenon is attributed to the initial compaction of the soil, which temporarily increases the subgrade reaction. This variation is caused by the increased contact between particles as they begin to reorient themselves to accommodate the applied stress [51].
The horizontal reaction of the subgrade is not constant in the soil. If this coefficient is calculated for different stresses and strains, the parameter will vary accordingly. What can be observed in this case is that for loads in the range of 12.5–17.5 kN, the soil reaches peak strength and maximum stiffness (higher values of horizontal subgrade reaction). As is typical for ductile solids, when a cohesive soil is subjected to a stress field [50,52,53,54,55] it deforms through an initial phase that can be considered essentially elastic (in plastic cohesive soils, this phase is very small), a creep phase where the slope of the stiffness curve decreases, and a phase of essentially plastic behavior, where deformations increase and the stiffness of the soil decreases until failure occurs.
This can be seen in Figure 6, where the compacted soil shows essentially elastic-plastic behavior (creep) between 12.5 and 17.5 kN, and then essentially plastic behavior until failure at 42.5 kN.

4.2. Fatigue Behavior of Laterally Loaded Piles

In this section, we analyze the fatigue response of steel piles with H-sections and thin walls when subjected to cyclic loading. The objective is to assess the long-term performance of these elements. Figure 7 illustrates the evolution of the experimentally measured lateral deflection in the pile, with the number of loading cycles on the abscissa axis and the deflection on the ordinate axis. Additionally, the evolution of the maximum deflection with cycles is depicted by a red dashed line, while the permanent or residual deflection is represented by a black dashed line.
Figure 7a and Figure 7b depict the fatigue tests of the W6 × 15 piles under the conditions described in Section 3.2. The tests reached a maximum load of 25 kN, which is 55% of the ultimate static load, with 31 loading-unloading cycles. For this maximum load, and based on the soil characterization results shown in Figure 6, the average horizontal soil subgrade reaction is 199 MN/m3. Greater deformation was observed in the initial compaction phase for FT-2 due to the intrinsic variability in soil behavior [56].
Examining the total deflection (dashed red curve), it is evident that in both FT-1 and FT-2, there is a gradual exponential increase, with transitions to a linear trend after the first 10 cycles. The trend of the permanent deflection (dashed black curve) is qualitatively similar to that of the maximum deflection.
In the test FT-3 (Figure 7c), the maximum load for each cycle was 32.5 kN, representing 72% of the ultimate static load, with the number of cycles increased to 120 in an attempt to induce fatigue failure in the soil. As shown in Figure 6, the average horizontal soil subgrade reaction for this load was 164 MN/m3, lower than that observed for FT-1 and FT-2 (25 kN). Due to this lower horizontal soil subgrade reaction, the highest deflections were recorded, reaching a maximum value of 28 mm. A significant deflection occurred during the first loading cycle, likely because that area of the soil may have had lower cohesion compared to other test points. The trends of maximum and permanent deflections repeated, but soil fracture was still not achieved.
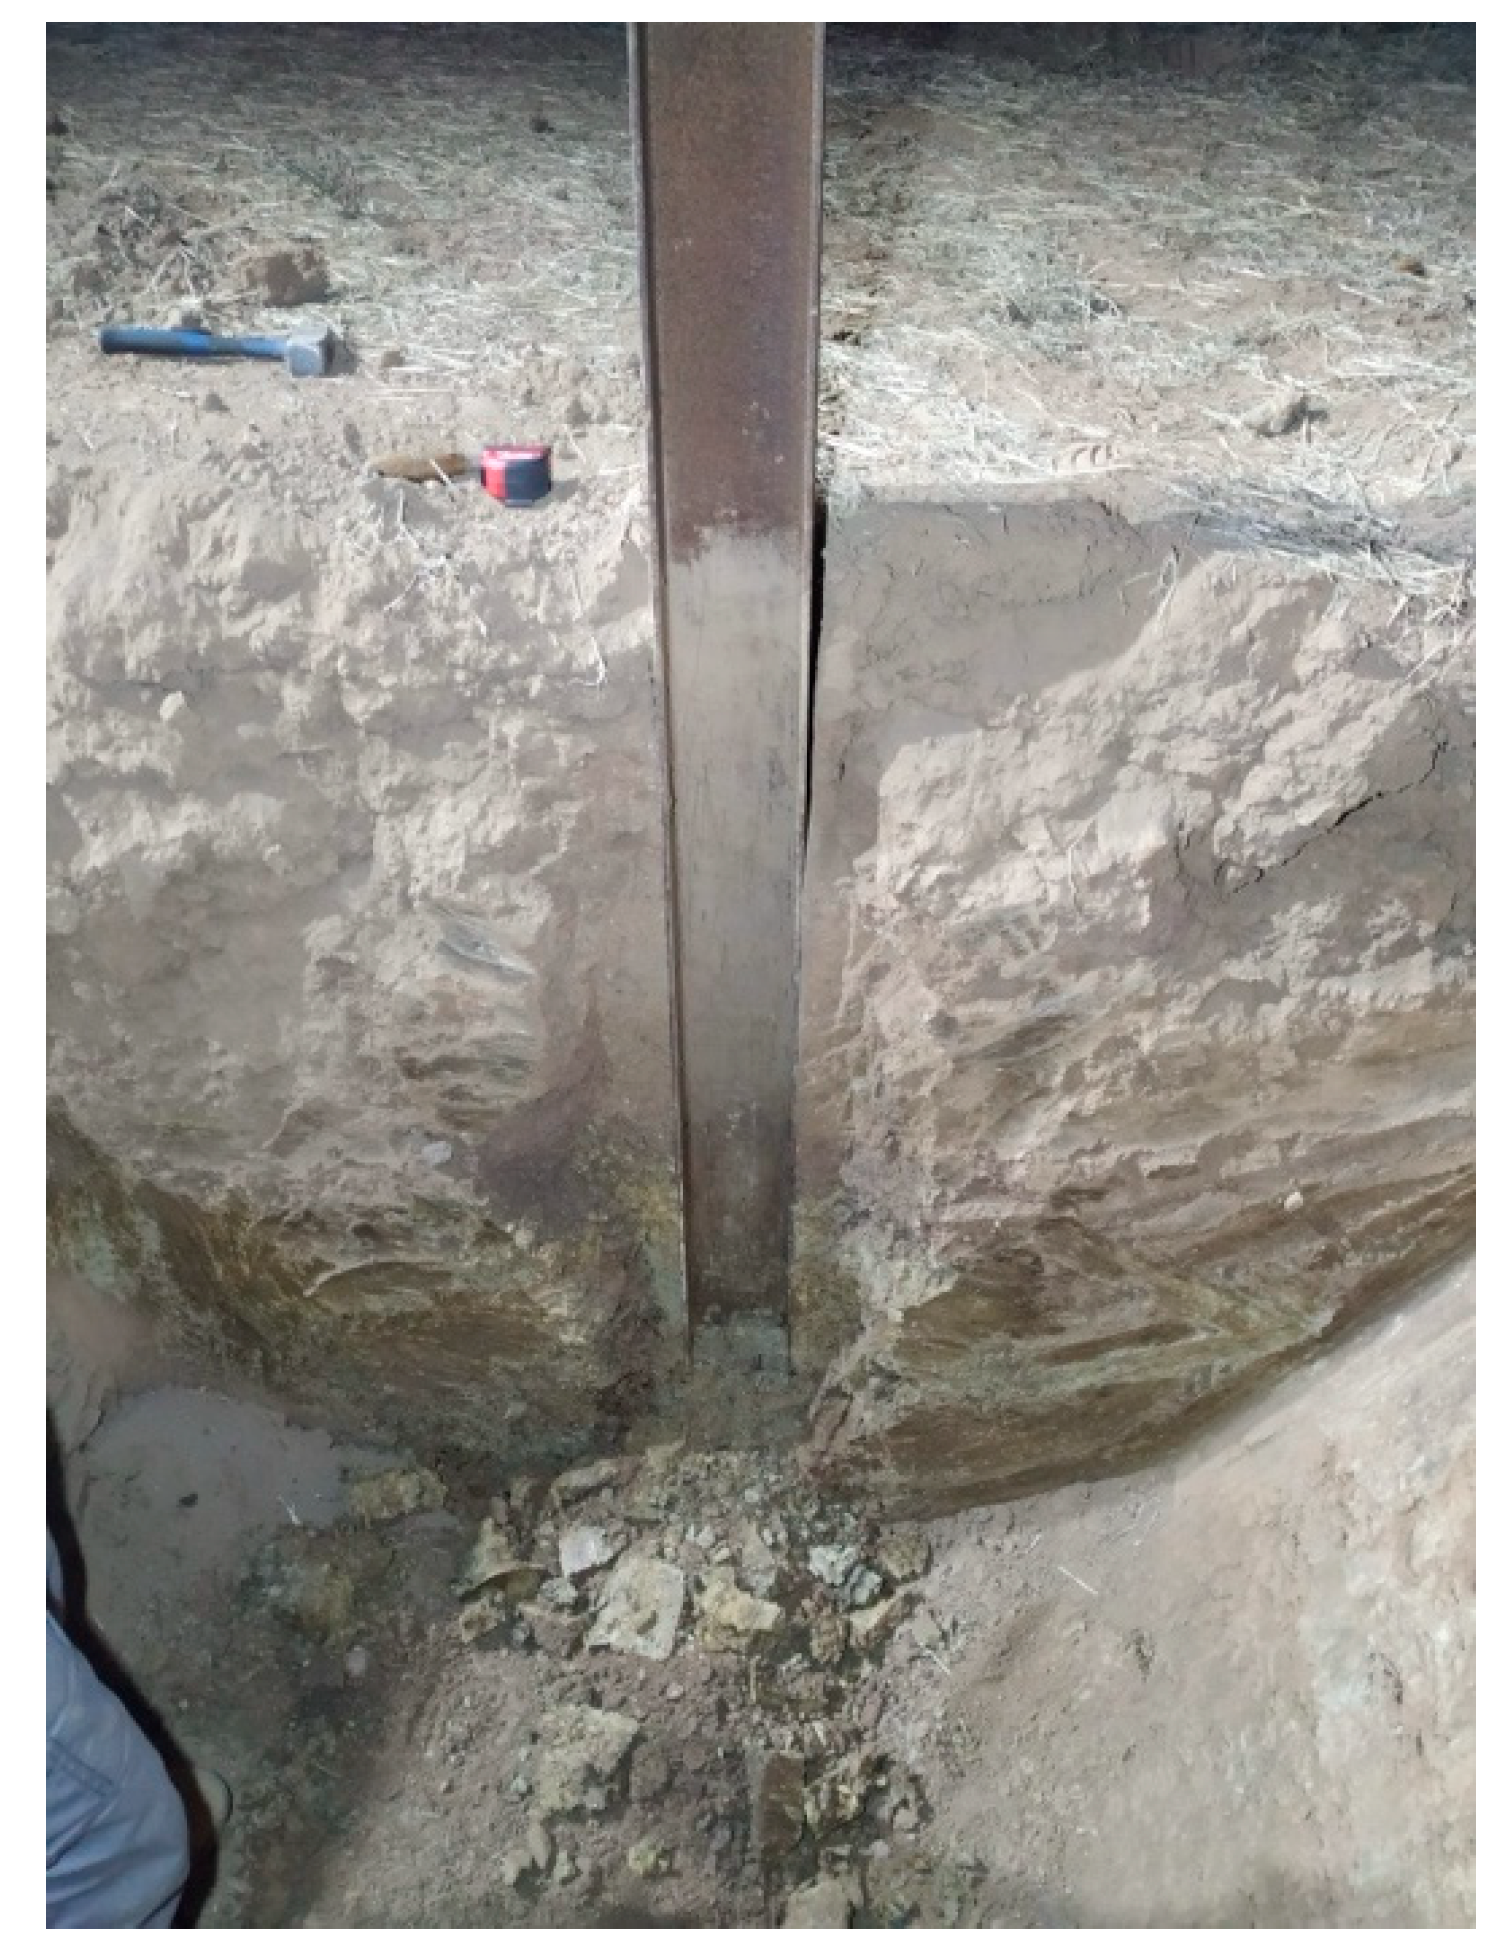
Figure 8 shows the cross-section at the end of test FT-3. It is evident that the separation between the pile and the soil occurred due to permanent deflection; however, the profile still maintained adherence and resistance at the base, likely due to the weight of the adjacent soil and the stress-strain effects it produced.
Finally, the load was increased to 35 kN, corresponding to 77% of the ultimate static load, with the number of cycles extended to 130. Despite this, soil fracture was still not achieved. The soil behavior remained similar to previous cases, though with greater deformation in each cycle due to the higher applied load (Figure 7d).
In Figure 9, the results of the elastic-plastic lateral deflection resisted by the pile during each loading cycle are analyzed. The elastic-plastic lateral deflection of each cycle was calculated as the difference between the accumulated elastic-plastic deflection (red curve in Figure 7) and the permanent deflection (black curve in Figure 7), referred to earlier as the deflection amplitude in Figure 7.
As shown in Figure 9, all curves exhibit an initial phase of gradual nonlinear degradation, followed by a phase of stable linearity until reaching the final number of cycles. The highest residual deflection is consistently observed in the first cycle. This occurs because the natural soil initially undergoes a compaction process due to the pressure applied during the test. Consequently, the initial cycles contribute to soil cohesion and reduce its plasticity. Once maximum soil cohesion is reached, plasticity remains constant, leading to a reduction and stabilization of elastic-plastic deflection (as seen in the quasi-horizontal portion of Figure 9).
Figure 9a and Figure 9b present the results of tests FT-1 and FT-2, respectively. Both tests were subjected to maximum cyclic loads of 25 kN, with deflection values recorded for loads of 12.5 kN, 18.75 kN, and 25 kN. It was observed that the maximum elastic-plastic deflection in the first cycle was 8.15 mm for FT-1 (Figure 9a) and 13 mm for FT-2 (Figure 9b) during the compaction stage, which falls within the typical dispersion range for different points in the same soil [57]. Nonetheless, starting from cycle 5 in FT-1 and cycle 9 in FT-2, the elastic-plastic deflection reduced to 7 mm and remained constant for a greater number of cycles. This indicates that the cycle at which the soil consolidates and reaches constant plasticity depends on its initial characteristics. Regardless of these initial characteristics, the early load cycles promote soil compaction, resulting in a consistent linear behavior across different points within the same soil. This behavior is also observed in the FT-1 and FT-2 curves for loads of 18.75 kN (orange curve) and 12.5 kN (green curve), which stabilize at elastic-plastic deflections of 5.7 mm and 4.4 mm, respectively.
Test FT-3 was subjected to a higher maximum load of 32.5 kN to examine the effect of increasing the load and tripling the number of cycles compared to tests FT-1 and FT-2 (Figure 9c). This was completed to verify if any degradation of the soil would occur due to a higher number of cycles and higher load. Behavior like that described in the previous tests was observed. From the fifth cycle onward, the plasticity of the soil stabilizes at a load of 32.5 kN. No additional soil degradation was detected with the increased number of applied load cycles.
In test FT-4, the load was further increased to 35 kN (Figure 9d). The observed behavior was similar to that of the previous tests. Due to the higher applied load, stiffness was reduced, which was reflected in an increase in elastic-plastic deflection within the stable zone to 9.9 mm, starting from the tenth load cycle. No further reduction in soil stiffness was observed with the increase in cyclic load. Therefore, there is no degradation of the mechanical behavior of the soil because of applying cycles of equal loading as potentially envisaged in the initial objectives of the research.
The fact that this elastic-plastic deflection remains independent of the number of load cycles indicates that the soil’s ability to recover elastically is not affected by the frequency load application. Even if the soil undergoes repeated cycles of loading and unloading, the reversible elastic-plastic deflection will remain constant as long as the applied loads stay within the same range. The evolution of the soil’s plastic deflection component increases proportionally with the number of loads if the same pressure level is maintained.

4.3. Residual Strength and Pull-Out Capacity after Lateral Loading

This section presents the results of the pull-out resistance for a W6 × 15 pile embedded 1.2 m in the cohesive soil described in Section 2.2. Additionally, the residual pull-out resistance results are included after the pile was subjected to lateral loads in both the TEST-1 and TEST-2 trials from Section 4.1, as well as in the fatigue tests FT-1, FT-2, and FT-4 from Section 4.2. It is important to note that the pull-out test was not performed in the FT-3 trial, as the pile was used for dissecting the soil and analyzing its structure after the fatigue tests (see Figure 8).
In Figure 10, the results of the maximum pull-out resistance are presented in blue, showing values of 80 kN and 64 kN, with an average of 72 kN and a coefficient of variation of 11%, which falls within the normal range of geotechnical variation. These tests are considered the reference, as they were performed on profiles not previously tested for lateral loading.
The pull-out test results conducted after applying monotonic loads in the TEST-1 and TEST-2 soil characterization trials are shown in green. A significant decrease in adherence is observed after soil exhaustion, with an average reduction of 43% compared to the previous trial.
The results of the pull-out tests after fatigue tests at 25 kN (FT-1 and FT-2) and 35 kN (FT-4) are presented in red columns. An average decrease of 33% in adherence is observed compared to the reference trial, as the soil did not collapse after the fatigue cycles. This suggests that the compaction effects in the surface layers of the soil result in permanent deflection and a loss of pile-soil contact, leading to a consequent decrease in the pile’s tensile capacity (see Figure 8). No significant differences are observed between the fatigue tests, indicating that damage occurs primarily during the initial loading cycles that induce compaction of the surface soil layers.
From the tests carried out, the loss of adhesion does not depend on the number of cycles, with similar behavior in the tests where 32 and 120 cycles were applied. The loss of adhesion depends on the compaction level, which in turn is a function of the pressure and energy applied [43,44]. This is the reason for a greater loss of adhesion in the reference tests (Test-1 and Test-2), which reached loads of 42.5 kN compared to the 25–35 kN applied in the fatigue tests.
The observed results are consistent with many of the studies that have addressed the soil compaction process [43,44]. The transverse loads applied in this study produce a compaction effect in the area around the pile, which is a function of the applied pressure and energy [44]. This process favors the readjustment of the solid soil structure (its particles) and is coupled with a decrease in voids in the soil structure, which favors soil stiffening, but also the creation of a crack between the soil and the pile up to a certain depth (Figure 8). This gap is due to the loss of connection between the soil and the structure due to the decrease in soil volume in the compacted area. Compaction produces an increase in shaft resistance in the area where the structure continues to be in contact with the soil, due to increased friction of the soil particles with the structure (more soil particles in contact as the pores close, increased soil density in that area), but at the same time, the shaft resistance is completely lost in the area where the loss of contact has occurred.

5. Concluding Remarks and Significance

This study researched the fatigue effects on thin-walled, open-ended piles subjected to cyclic lateral loads applied at the shear center. The impact of fatigue on the horizontal soil subgrade reaction, tensile adherence, and load-deflection response of the pile was analyzed. The findings are summarized as follows:
  • The elastic-plastic deflection of the soil reaches its maximum value during the first loading cycle due to soil compaction. Nonetheless, after a few additional cycles (approximately 10 cycles under the studied conditions), the elastic-plastic deflection per cycle remains constant in all cases examined.
  • The permanent or residual deflection of the soil shows a steady increase after the initial compaction phase. This suggests that the soil does not experience fatigue from that point onward and that its lateral load stiffness remains constant for the same cyclically applied load, contrary to what is indicated in other studies on large-diameter piles. Nonetheless, despite the absence of soil fatigue, stability may be compromised due to the accumulated permanent deflection that occurs with each cycle, which can destabilize the system due to the effects of large deformations over the long term.
  • The horizontal soil subgrade reaction initially increases with the applied load, enhancing the lateral resistance of the pile through soil cohesion. However, there is an optimal cohesion load beyond which soil degradation and eventual collapse occur as the applied load continues to increase.
  • In static monotonic tests, the soil-pile behavior differs depending on whether the applied load is below or above the soil’s optimal cohesion load. Below the optimal load, an initial improvement in soil-pile cohesion is observed; above it, progressive degradation occurs.
  • The compaction effects on the surface layers of the soil result in permanent deflection and a loss of pile-soil contact, leading to a consequent decrease in the piles’ tensile capacity. No significant differences were observed between the fatigue tests, indicating that the damage primarily occurs during the initial loading cycles that induce compaction of the surface soil layers.
  • From the results of this study, it is evident that the horizontal soil subgrade reaction remains unaffected by repetitive cycles of the same load intensity. However, there is a gradual accumulation of permanent deflection, which could potentially lead to cumulative tilting over time. Therefore, it may be necessary to implement interventions on the structures to correct the alignment of the piles and restore them to their original position.

Author Contributions

J.A.P.: Conceptualization, Investigation, Formal Analysis, Writing original draft. A.P.-T.: Conceptualization, Methodology. J.D.R.: Conceptualization, Formal Analysis, Writing—Review and Editing, Supervision. E.S.-G.: Conceptualization, Writing—Review and Editing, Supervision. All authors have read and agreed to the published version of the manuscript.

Funding

This research was partially funded by AUSCULTIA corporation (Madrid, Spain).

Data Availability Statement

Data relating to the research is available to any researcher upon request to the authors.

Acknowledgments

A portion of the research for this paper was conducted by José A. Pérez during his tenure at the Universidad de Sevilla in collaboration with José D. Ríos in 2024. The authors wish to thank Miguel Candel Pérez and Eusebio Rubio Ceferino for fruitful discussions in the revision of this work.

Conflicts of Interest

The authors declare no conflicts of interest.

Nomenclature

APile cross-section
bWidth of the pile’s contact surface with soil
cWidth of the top flange of the cross-section
eDistance of the horizontal load from the cross-section’s center of gravity
E0Soil’s elastic modulus
EsSoil’s secant deformation modulus
EpSteel pile’s elastic modulus
GShear modulus of the steel pile
IpMaximum moment of inertia of the steel pile
ItTorsional constant of the steel pile
IwWarping constant of the steel pile
IyMoment of inertia about the y-axis
IzMoment of inertia about the z-axis
khHorizontal modulus of subgrade reaction
LLength of the pile
LdeLength of the pile with zero lateral displacement from the soil surface
LeEmbedded length of the pile in the soil
LuHeight of horizontal load application from to soil surface
MtTorsional moment
pSoil reaction force
RHHorizontal load at the pile head
tThickness of the web of the cross-section
δhHorizontal or lateral displacement at the pile head
δsHorizontal or lateral displacement at the soil surface
ωTorsional susceptibility index

References

  1. Ahangar-Asr, A.; Javadi, A.A.; Johari, A.; Chen, Y. Lateral Load Bearing Capacity Modelling of Piles in Cohesive Soils in Undrained Conditions: An Intelligent Evolutionary Approach. Appl. Soft Comput. 2014, 24, 822–828. [Google Scholar] [CrossRef]
  2. Chen, Z.; Shuai, S.; Pu, S.; Zhang, L.; Rao, J. Study on the Ultimate Flexural Bearing Capacityof Micro Anti-Slide Piles. Tumu Yu Huanjing Gongcheng Xuebao/J. Civ. Environ. Eng. 2019, 41, 59–66. [Google Scholar] [CrossRef]
  3. Shakir, R.R.; Zhu, J. Behavior of Compacted Clay-Concrete Interface. Front. Archit. Civ. Eng. China 2009, 3, 85–92. [Google Scholar] [CrossRef]
  4. Duque, J.; Ochmański, M.; Mašín, D.; Hong, Y.; Wang, L. On the Behavior of Monopiles Subjected to Multiple Episodes of Cyclic Loading and Reconsolidation in Cohesive Soils. Comput. Geotech. 2021, 134, 104049. [Google Scholar] [CrossRef]
  5. Fuentes, W.; Mašín, D.; Duque, J. Constitutive Model for Monotonic and Cyclic Loading on Anisotropic Clays. Geotechnique 2020, 71, 657–673. [Google Scholar] [CrossRef]
  6. Zormpa, T.E.; Comodromos, E.M. Numerical Evaluation of Pile Response Under Combined Lateral and Axial Loading. Geotech. Geol. Eng. 2018, 36, 793–811. [Google Scholar] [CrossRef]
  7. Hazzar, L.; Karray, M.; Bouassida, M.; Hussien, M.N. Ultimate Lateral Resistance of Piles in Cohesive Soil. DFI J.-J. Deep Found. Inst. 2013, 7, 59–68. [Google Scholar] [CrossRef]
  8. Heller, L.W. Discussion of “Lateral Resistance of Piles in Cohesive Soils. ” J. Soil Mech. Found. Div. 1964, 90, 211–212. [Google Scholar] [CrossRef]
  9. Kahribt, M.A.; Abbas, J.M. Lateral Response of a Single Pile under Combined Axial and Lateral Cyclic Loading in Sandy Soil. Civ. Eng. J. 2018, 4, 1996. [Google Scholar] [CrossRef]
  10. Abadie, C.N. Cyclic Lateral Loading of Monopile Foundations in Cohesionless Soils. Ph.D. Thesis, University of Oxford, Oxford, UK, 2015. [Google Scholar]
  11. Peng, J.; Clarke, B.G.; Rouainia, M. Increasing the Resistance of Piles Subject to Cyclic Lateral Loading. J. Geotech. Geoenviron. Eng. 2011, 137, 977–982. [Google Scholar] [CrossRef]
  12. Abadie, C.N.; Byrne, B.W.; Houlsby, G.T. Rigid Pile Response to Cyclic Lateral Loading: Laboratory Tests. Geotechnique 2019, 69, 863–876. [Google Scholar] [CrossRef]
  13. Uncuoǧlu, E.; Laman, M. Numerical Modelling of Short Pile Behaviour Subjected to Lateral Load. Eur. J. Environ. Civ. Eng. 2012, 16, 204–235. [Google Scholar] [CrossRef]
  14. Vahabkashi, P.; Rahai, A.; Amirshahkarami, A. Lateral Behavior of Piles with Different Cross Sectional Shapes under Lateral Cyclic Loads in Granular Layered Soils. Int. J. Civ. Eng. 2014, 12, 112–120. [Google Scholar]
  15. Standard Guidelines for the Design and Installation of Pile; American Society of Civil Engineers: Reston, VA, USA, 1997.
  16. Suthar, D.B.; Chore, H.S.; Dode, P.A. Comparative Analysis of High Rise Building Subjected to Lateral Loads and Its Behavior. In Advances in Structural Engineering; Matsagar, V., Ed.; Springer: New Delhi, India, 2015; pp. 613–625. [Google Scholar]
  17. Lai, V.Q.; Banyong, R.; Keawsawasvong, S. Stability of Limiting Pressure behind Soil Gaps in Contiguous Pile Walls in Anisotropic Clays. Eng. Fail. Anal. 2022, 134, 106049. [Google Scholar] [CrossRef]
  18. Chiou, J.S.; Chen, C.H.; Chen, Y.C. Deducing Pile Responses and Soil Reactions from Inclinometer Data of a Lateral Load Test. Soils Found. 2008, 48, 609–620. [Google Scholar] [CrossRef]
  19. Lu, Y.; Wang, Z.; Yin, Z.; Wu, G.; Liang, B. Experimental and Numerical Studies on Local Scour around Closely Spaced Circular Piles under the Action of Steady Current. J. Mar. Sci. Eng. 2022, 10, 1569. [Google Scholar] [CrossRef]
  20. Su, X.; Li, Z.; Wang, Q.; Li, J.; Xie, X.; Mao, X.; Ren, Z.; Liu, J. Comparison and Optimization of Bearing Capacity of Three Kinds of Photovoltaic Support Piles in Desert Sand and Gravel Areas. Buildings 2024, 14, 2559. [Google Scholar] [CrossRef]
  21. Abdelaziz, A.Y.; El Naggar, M.H.; Ouda, M. Determination of Depth-of-Fixity Point for Laterally Loaded Vertical Offshore Piles: A New Approach. Ocean Eng. 2021, 232, 109113. [Google Scholar] [CrossRef]
  22. Cheng, X.; Ibraim, E.; Liu, H.; Pisanò, F.; Diambra, A. Large Diameter Laterally Loaded Piles in Sand: Numerical Evaluation of Soil Stress Paths and Relevance of Laboratory Soil Element Testing. Comput. Geotech. 2023, 154, 105139. [Google Scholar] [CrossRef]
  23. Pérez, J.A.; Reyes-Rodríguez, A.M.; Sánchez-González, E.; Ríos, J.D. Experimental and Numerical Flexural–Torsional Performance of Thin-Walled Open-Ended Steel Vertical Pile Foundations Subjected to Lateral Loads. Buildings 2023, 13, 1738. [Google Scholar] [CrossRef]
  24. Zhao, X.; Liao, X.; Hu, Z.; Li, X.; Nie, Y.; Liu, J.; Xu, Y. Seismic Fragility Analysis of Steel Pipe Pile Wharves with Random Pitting Corrosion. Buildings 2023, 13, 2619. [Google Scholar] [CrossRef]
  25. Li, W.; Li, X.; Wang, T.; Yin, Q.; Zhu, M. The Simplified Method of Head Stiffness Considering Semi-Rigid Behaviors of Deep Foundations in OWT Systems. Buildings 2024, 14, 1803. [Google Scholar] [CrossRef]
  26. Wang, M.; Wang, M.; Cheng, X.; Lu, Q.; Lu, J. A New p–y Curve for Laterally Loaded Large-Diameter Monopiles in Soft Clays. Sustainability 2022, 14, 5102. [Google Scholar] [CrossRef]
  27. Tra, H.T.; Huynh, Q.T.; Keawsawasvong, S. Estimating the Ultimate Load Bearing Capacity Implementing Extrapolation Method of Load-Settlement Relationship and 3D-Finite Element Analysis. Transp. Infrastruct. Geotechnol. 2024, 11, 2764–2789. [Google Scholar] [CrossRef]
  28. Li, B.; Wang, Y.; Qi, W.; Wang, S.; Gao, F. Lateral Bearing Capacity of a Hybrid Monopile: Combined Effects of Wing Configuration and Local Scour. J. Mar. Sci. Eng. 2022, 10, 1799. [Google Scholar] [CrossRef]
  29. Chen, Y.-J.; Lee, Y.-H. Evaluation of Lateral Interpretation Criteria for Drilled Shaft Capacity. J. Geotech. Geoenviron. Eng. 2010, 136, 1124–1136. [Google Scholar] [CrossRef]
  30. Bauer, J.; Reul, O. Lateral Pressure on Pile Foundations in Cohesive Soils Due to Horizontal Soil Movements. Acta Geotech. 2024, 19, 6375–6390. [Google Scholar] [CrossRef]
  31. Zhang, L.; Ahmari, S. Nonlinear Analysis of Laterally Loaded Rigid Piles in Cohesive Soil. Int. J. Numer. Anal. Methods Geomech. 2013, 37, 201–220. [Google Scholar] [CrossRef]
  32. Luo, R.; Hu, M.; Yang, M.; Li, W.; Wang, A. Static Design for Laterally Loaded Rigid Monopiles in Cohesive Soil. J. Mar. Sci. Eng. 2023, 11, 817. [Google Scholar] [CrossRef]
  33. Aghayarzadeh, M.; Khabbaz, H.; Fatahi, B.; Terzaghi, S. Interpretation of Dynamic Pile Load Testing for Open-Ended Tubular Piles Using Finite-Element Method. Int. J. Geomech. 2020, 20, 04019169. [Google Scholar] [CrossRef]
  34. Liyanapathirana, D.S.; Deeks, A.J.; Randolph, M.F. Behaviour of Thin-Walled Open-Ended Piles during Driving. In Computational Mechanics–New Frontiers for the New Millennium; Elsevier: Amsterdam, The Netherlands, 2001; pp. 393–398. [Google Scholar] [CrossRef]
  35. Qin, W.; Cai, S.; Dai, G.; Wang, D.; Chang, K. Soil Resistance during Driving of Offshore Large-Diameter Open-Ended Thin-Wall Pipe Piles Driven into Clay by Impact Hammers. Comput. Geotech. 2023, 153, 105085. [Google Scholar] [CrossRef]
  36. Zhu, N.; Cui, L.; Liu, J.; Wang, M.; Zhao, H.; Jia, N. Discrete Element Simulation on the Behavior of Open-Ended Pipe Pile under Cyclic Lateral Loading. Soil Dyn. Earthq. Eng. 2021, 144, 106646. [Google Scholar] [CrossRef]
  37. Kido, R.; Suezawa, R.; Sawamura, Y.; Kimura, M. Experimental Investigation of Bearing Mechanism of Closed- and Open-Ended Piles Supported by Thin Bearing Layer Using X-ray Micro CT. Soils Found. 2022, 62, 101179. [Google Scholar] [CrossRef]
  38. ASTM D3966/D3966M-22; Standard Test Methods for Deep Foundation Elements Under Static Lateral Load. ASTM: West Conshohocken, PA, USA, 2022.
  39. Ministère de l’Equipement Du Logement et Des Transports. Fascicule 62, Titre V: Règles Techniques de Conception et de Calcul Des Fondations Des Ouvrages de Génie Civil; Ministère de l’Equipement Du Logement et Des Transports: Paris, France, 1993.
  40. ASTM A6/A6M; Standard Specification for General Requirements for Rolled Structural Steel Bars, Plates, Shapes, and Sheet Piling. ASTM: West Conshohocken, PA, USA, 2001.
  41. Terzaghi, K. Evaluation of Coefficients of Subgrade Reaction. Géotechnique 1955, 5, 297–326. [Google Scholar] [CrossRef]
  42. UNE-EN ISO 22476-2:2005; Geotechnical Investigation and Testing—Field Testing—Part 2: Dynamic Probing. ISO: Geneva, Switzerland, 2005.
  43. Terzaghi, K.P.R.B.M.G. Soil Mechanics in Engineering Practice; Wiley: Hoboken, NJ, USA, 1996. [Google Scholar]
  44. Lambe, W.T.; Whitman, R.V. Soil Mechanics; John Wiley & Sons: Hoboken, NJ, USA, 1969. [Google Scholar]
  45. Goh, S.G.; Rahardjo, H.; Leong, E.C. Shear Strength of Unsaturated Soils under Multiple Drying-Wetting Cycles. J. Geotech. Geoenviron. Eng. 2014, 140, 06013001. [Google Scholar] [CrossRef]
  46. Lu, N.L.W.J. Unsaturated Soil Mechanics; Wiley: Hoboken, NJ, USA, 2004. [Google Scholar]
  47. UNE-EN ISO 17892; Geotechnical Investigation and Testing—Laboratory Testing of Soil. ISO: Geneva, Switzerland, 2019.
  48. Witt, K.J. Grundbau-Taschenbuch; Ernst & Sohn: Hoboken, NJ, USA, 2017. [Google Scholar]
  49. Bowles, J.E. Foundation Analysis and Design; McGraw-Hill: New York, NY, USA, 1997. [Google Scholar]
  50. Broms, B.B. Lateral Resistance of Piles in Cohesive Soils. J. Soil Mech. Found. Div. 1964, 90, 27–63. [Google Scholar] [CrossRef]
  51. Basack, S. A Boundary Element Analysis of Soil-Pile Interaction under Lateral Cyclic Loading in Soft Cohesive Soil. Asian J. Civ. Eng. Build. Hous. 2008, 9, 379–390. [Google Scholar]
  52. Matlock, H. Correlation for Design of Laterally Loaded Piles in Soft Clay. In Proceedings of the Offshore Technology Conference, Houston, TX, USA, 22–24 April 1970. [Google Scholar]
  53. Reese, L.C.; Van Impe, W.F. Single Piles and Pile Groups under Lateral Loading; CRC Press: Boca Raton, FL, USA, 2010; ISBN 9780429109706. [Google Scholar]
  54. Prakash, S.S.H.D. Pile Foundations in Engineering Practice; CBS: New York, NY, USA, 2013. [Google Scholar]
  55. Vesić, A.B. Bending of Beams Resting on Isotropic Elastic Solid. J. Eng. Mech. Div. 1961, 87, 35–53. [Google Scholar] [CrossRef]
  56. Phoon, K.-K.; Tang, C. Characterisation of Geotechnical Model Uncertainty. Georisk Assess. Manag. Risk Eng. Syst. Geohazards 2019, 13, 101–130. [Google Scholar] [CrossRef]
  57. Phoon, K.-K. Reliability-Based Design in Geotechnical Engineering: Computations and Applications; CRC Press: Boca Raton, FL, USA, 2008. [Google Scholar]
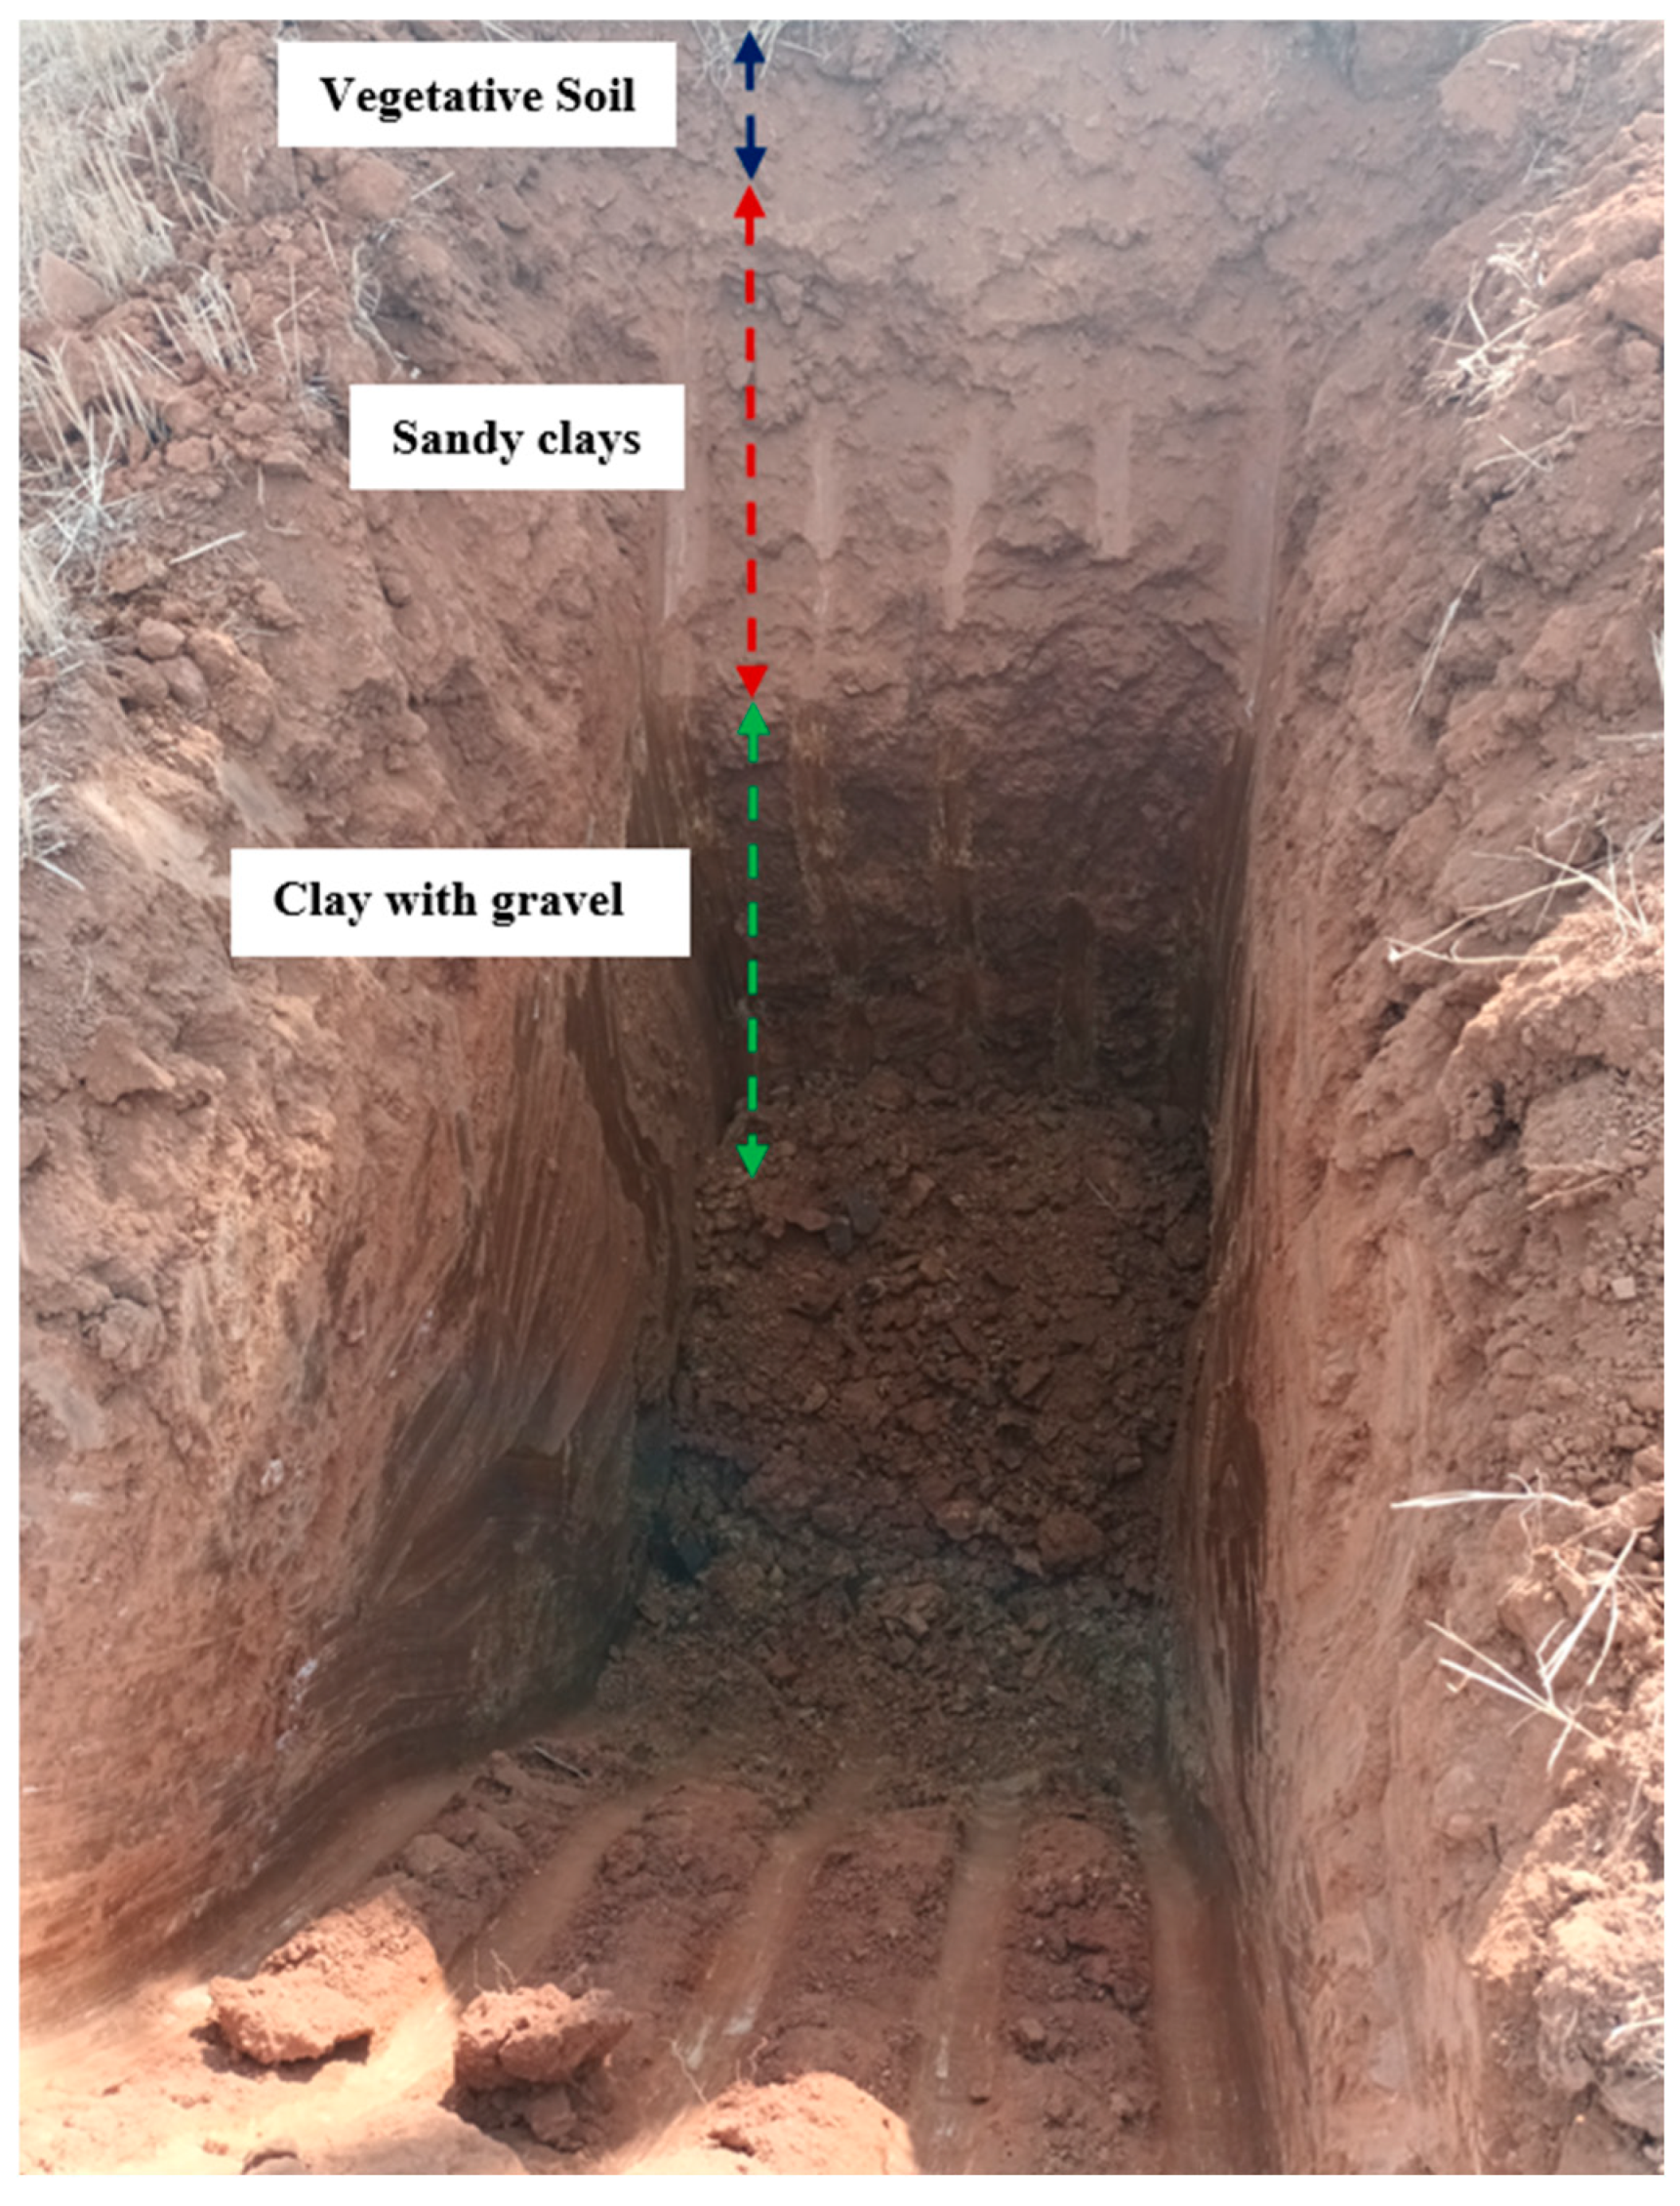
Figure 1. Soil profile section illustrating vegetative soil, sandy clays, and clay with gravel layers.
Buildings 14 03228 g001
Figure 2. Comparative results of DPSH tests showing soil compaction consistency at various depths.
Buildings 14 03228 g002
Figure 3. Lateral deflection, of 2D FEM. Pile W6 × 15. Ground level 1 m.
Buildings 14 03228 g003
Figure 4. Visual representation of the equipment and their relative positions.
Buildings 14 03228 g004
Figure 5. Monitoring system for measuring torsional and bending deflections.
Buildings 14 03228 g005
Figure 6. Variation of horizontal subgrade reaction with increasing horizontal load.
Buildings 14 03228 g006
Figure 7. Evolution of lateral pile deflection with cyclic loading: (a) FT-1, (b) FT-2, (c) FT-3, and (d) FT-4.
Buildings 14 03228 g007
Figure 8. Unraveling the soil-pile bond. Permanent deflection and separation for FT-3.
Buildings 14 03228 g008
Figure 9. Influence of cyclic loading on elastic deflection: (a) FT-1, (b) FT-2, (c) FT-3 and (d) FT-4.
Buildings 14 03228 g009
Figure 10. Effect of preconditioning on pull-out capacity.
Buildings 14 03228 g010
Table 1. Classification and Characteristics of Steel Piles.
Profileh (mm)tw (mm)b (mm)tf (mm)A (cm2)Iy
(cm4)
Iz
(cm4)
It (cm4)
W6 × 15152.155.84152.156.6028.581211.23387.934.20
Table 2. Results of In Situ Soil Characterization Tests: Test M-1 and M-3.
SampleProspectingDepth (m)USCS
Classification
LL (%)PL (%)PI (%)
M-1C-11.0CL47.830.017.8
M-3C-20.8CL36.824.312.5
Table 3. Results of In Situ Soil Characterization Tests: Test M-2 and M-4.
SampleProspectingDepth (m)USCS
Classification
LL (%)PL (%)PI (%)
M-2C-12.0GC43.128.214.9
M-4C-21.7GM-GC28.122.75.4
Disclaimer/Publisher’s Note: The statements, opinions and data contained in all publications are solely those of the individual author(s) and contributor(s) and not of MDPI and/or the editor(s). MDPI and/or the editor(s) disclaim responsibility for any injury to people or property resulting from any ideas, methods, instructions or products referred to in the content.