Article

Experimental and Theoretical Study on Local Damage of Reinforced Concrete Column under Rectangular Charge

1
School of Mechanical Engineering, Nanjing University of Science and Technology, Nanjing 210094, China
2
Military Commission Equipment Development Center, Beijing 100034, China
*
Author to whom correspondence should be addressed.
Buildings 2024, 14(10), 3229; https://doi.org/10.3390/buildings14103229 (registering DOI)
Submission received: 13 September 2024 / Revised: 30 September 2024 / Accepted: 9 October 2024 / Published: 11 October 2024

Abstract

:
During an explosion, a building’s stability is directly impacted by reinforced concrete (RC) columns. However, there is currently no theoretical analysis model that can precisely predict damage to RC columns after close-in/contact explosions. In the present study, the local damage response of RC columns under a rectangular charge was experimentally and numerically investigated, and a theoretical analysis model for predicting local damage after a contact explosion was developed. The experimental results verify the effects of concrete strength, standoff distance, transverse reinforcement spacing, and axial load on damage to RC columns. When the standoff is 100 mm, increasing the axial load can effectively reduce the damage to the center of the column surface. Numerical simulations were carried out to study the effect of different parameters on concrete damage, showing that the damage span of reinforced concrete increases with increased stirrup distance; however, when the stirrup distance decreases to 70 mm, the distance between the stirrups and the explosives is too close to limit the damage. The prediction model innovatively considers the attenuation of steel cross-section transmission and the characteristics of rectangular charges. Compared with traditional semi-empirical calculation models, it can accurately calculate local damage caused by contact explosions on reinforced concrete columns.

1. Introduction

RC columns are the main load-bearing elements of most buildings, contributing greatly to the maintenance of their stability. The failure of RC columns in critical structures will result in a building’s progressive collapse, causing serious property loss and many casualties. Small amounts of explosives may cause acute damage to RC columns in contact explosions, posing a significant threat to the structural safety of buildings. Thus, the damage evolution and dynamic response of RC columns subject to contact explosions have been widely researched in recent years.
The response of building structures subjected to contact explosions significantly differs from those subjected to non-contact explosions [1]. Explosive loads can be divided into far-field, close-in, and contact explosions. However, different types of blast loads are difficult to unify. ASCE59-11 [2] defines a close-in explosion as an explosion at a proportional distance of less than 1.2 m/kg1/3. Shin et al. [3] proposed that the calculated explosion parameters of ConWep [4] are not accurate enough in the close-in range (a scale distance of less than 0.4 m/kg1/3). Through numerical studies, Sherkar et al. [5] found that the effects of the explosive’s shape and initiation method can be ignored at scaled distances greater than 3 m/kg1/3, but in close-in explosions, the charge shape and initiation point significantly affect the peak overpressure and impulse. In general, the loads acting on the structure from a far-field explosion are uniformly distributed, while the loads acting on the structure from a close-in explosion are unevenly distributed; thus, a contact explosion is only a local load effect on the structure, causing concrete damage.
Explosive experiments can obtain real and reliable damage data and allow us to observe real damage and responses regarding RC columns under blast loads. Test results can also be used for accurate analysis and simulation. Therefore, numerous explosive experiments have been conducted by other scholars to study the destructive response of RC columns to explosive loads. DuA et al. [1,6,7] conducted contact explosion tests on full-scale RC columns to quantitatively and qualitatively assess damage patterns and the remaining axial load capacity. They proposed that increasing the cross-sectional width of rectangular columns can effectively reduce contact explosion damage. Mejia et al. [8] conducted explosion experiments on 33 RC columns, studied damage on RC columns under the combined effects of explosions and axial loads, and conducted damage evaluation. The authors believe that the axial load increased the strength of the columns and improved the concrete core area’s restraint. Furthermore, when the explosive dosage exceeded 500 g, the damaging effect of the transverse reinforcement on the RC columns was relatively small. Cai et al. [9] conducted contact explosion tests on RC plates and studied the effects of different plate sizes. They proposed that under similar TNT contact explosions, the damage area on the bottom surface of small RC plates would be small, and it was recommended that at least one-quarter of the real structure in the test be used to reduce the size effect of contact explosions. Yang et al. [10] carried out contact explosion tests on full-scale RC beams. These exhibited local high-strain responses after contact explosions, establishing a semi-empirical formula for calculating the local damage span of RC beams. Chiquito et al. [11] conducted a series of full-scale blast tests on concrete slabs at scaled distances ranging from 0.20 to 0.83 m/kg1/3. The results showed no clear improvement in the concrete performance when the charge was located 0.5 m from the slab.
Explosions under various conditions are difficult to predict through experiments owing to the high site requirements and costs. Therefore, numerical simulation has become an important method for studying the responses of RC columns. Kyei et al. [12] used LS-DYNA to simulate the explosion responses of RC columns and studied the effect of transverse reinforcement spacing on their explosion resistance. Their research shows that reducing the transverse reinforcement of RC columns significantly reduces RC column displacement after close-in explosions; in addition, the axial load will also reduce their displacement under explosive loads. At the same proportional distance, the greater the charge mass is, the more serious an RC columns’ damage and displacement will be. The RHT material model [13] was first proposed in 1999 and applied to the response of concrete under explosive loads [8,14,15]. The K&C model is also widely used to evaluate damage to concrete under explosive loads [16,17,18].
Damage assessment for RC columns under explosive loads is also a popular field of research. Single-degree-of-freedom (SDOF) models are commonly used for theoretical analyses of RC components under explosive loads and to obtain calculation data for P–I curves [19,20,21,22,23]. Yu et al. [24] and Park et al. [25] proposed an improved nonlinear analysis method based on Timoshenko beam theory and compared the analysis and experiment results, finally establishing a P–I curve. Shi [17] used numerical simulation to predict local damage to RC columns and defined a new damage criterion based on the residual axial bearing capacity. Zhu et al. [26] analyzed the damage modes and dynamic responses of SRC beams under contact explosions. Holgado et al. [27] established a neural network model to predict the responses of RC walls subjected to contact and near-contact explosions; their current model is a significantly better predictor of damage categories than the semi-empirical approach outlined in UFC 3-340-02.
The SDOF method and P–I curves greatly simplify load and RC components, improving our ability to predict the total deformation of a structure. However, local damage to RC columns caused by contact explosions is difficult to accurately predict using this method.
This study conducted explosion experiments on 17 RC columns; performed a series of numerical simulations; investigated the effects of concrete strength, column length, axial load, and charge mass on local damage to RC columns under explosive loads; and compared the impact of contact and close-in explosions on damage to RC columns. The current damage prediction model for RC columns after contact explosions is an empirical formula, directly predicting based on the number of explosives, structural type, and thickness; it cannot consider the influence of an explosive’s geometric dimensions or the arrangement of internal stirrups on the damage. Consequently, we propose a model for predicting concrete damage, accounting for the effect of charge size and location, as well as transverse reinforcement spacing. Moreover, this model can accurately consider compression and spalling damage on RC columns caused by contact explosions, providing a basis for determining the remaining load-bearing capacity after damage.

2. Explosion Experiment and Result Analysis

2.1. RC Columns Characteristics

Four RC columns of different types were manufactured following the local structural typology for explosion tests. RC columns are available in 1350 mm and 2500 mm sizes and concrete strengths of 30 and 40 Mpa. The cross-sectional size of the RC columns was 220 mm × 220 mm, the concrete cover thickness was 13 mm, and the steel reinforcement yield stress was 400 Mpa. A schematic of the RC column structure is shown in Figure 1. The design axial bearing capacity of the RC columns was lower than the actual bearing capacity, following relevant design specifications. The calculation formula is as follows:
N 0.9 ϕ f d c A + A s f y
where ϕ is the stability coefficient of the compressed member, f d c is the design value of the concrete strength, f c is the actual value of the concrete strength, A is the cross-sectional area of the concrete, f y is the design value of the reinforcement strength, and A s is the cross-sectional area of the longitudinal reinforcement. The design axial bearing capacity is shown in Table 1.

2.2. Experiment Setup

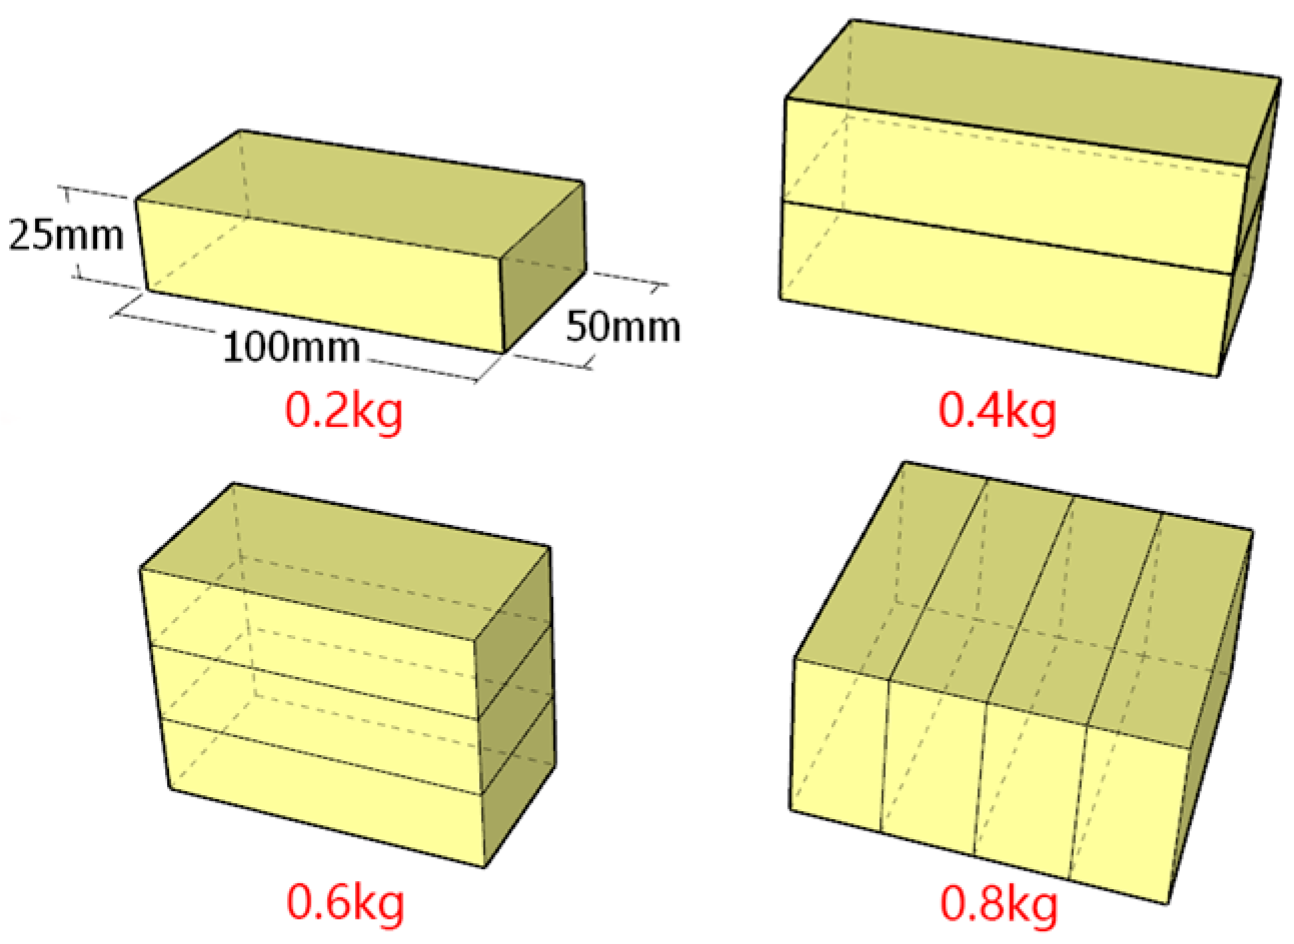
TNT is a common high explosive, and it was used as the explosive charge in the experiment. The mass of a single TNT explosive block is 0.2 kg, and the size is 25 mm × 50 mm × 100 mm. Several pieces of TNT were stacked into a cube and placed in the middle of the RC column at the front surface position for detonation, and the detonator was inserted into the top of the TNT for detonation. The sizes of the TNT blocks are shown in Figure 2.
Concrete support frames were established on both sides of the RC column for support and fixed with steel frames at both ends to suspend the RC column and simulate the vacant state around the column. Hydraulic jacks were placed on one side of the RC column to transmit axial load, and steel plates were placed between the column and the jacks to increase the contact area. The explosive was placed on the surface of the RC column or at a particular height. The standoff is defined as the vertical distance between the bottom of the TNT and the surface of the RC column. The layout is shown in Figure 3.

2.3. Experiment Results and Analysis

The experiments were labeled according to different explosive masses, standoff distances, axial loads, column lengths, and concrete strengths, as shown in Figure 4.
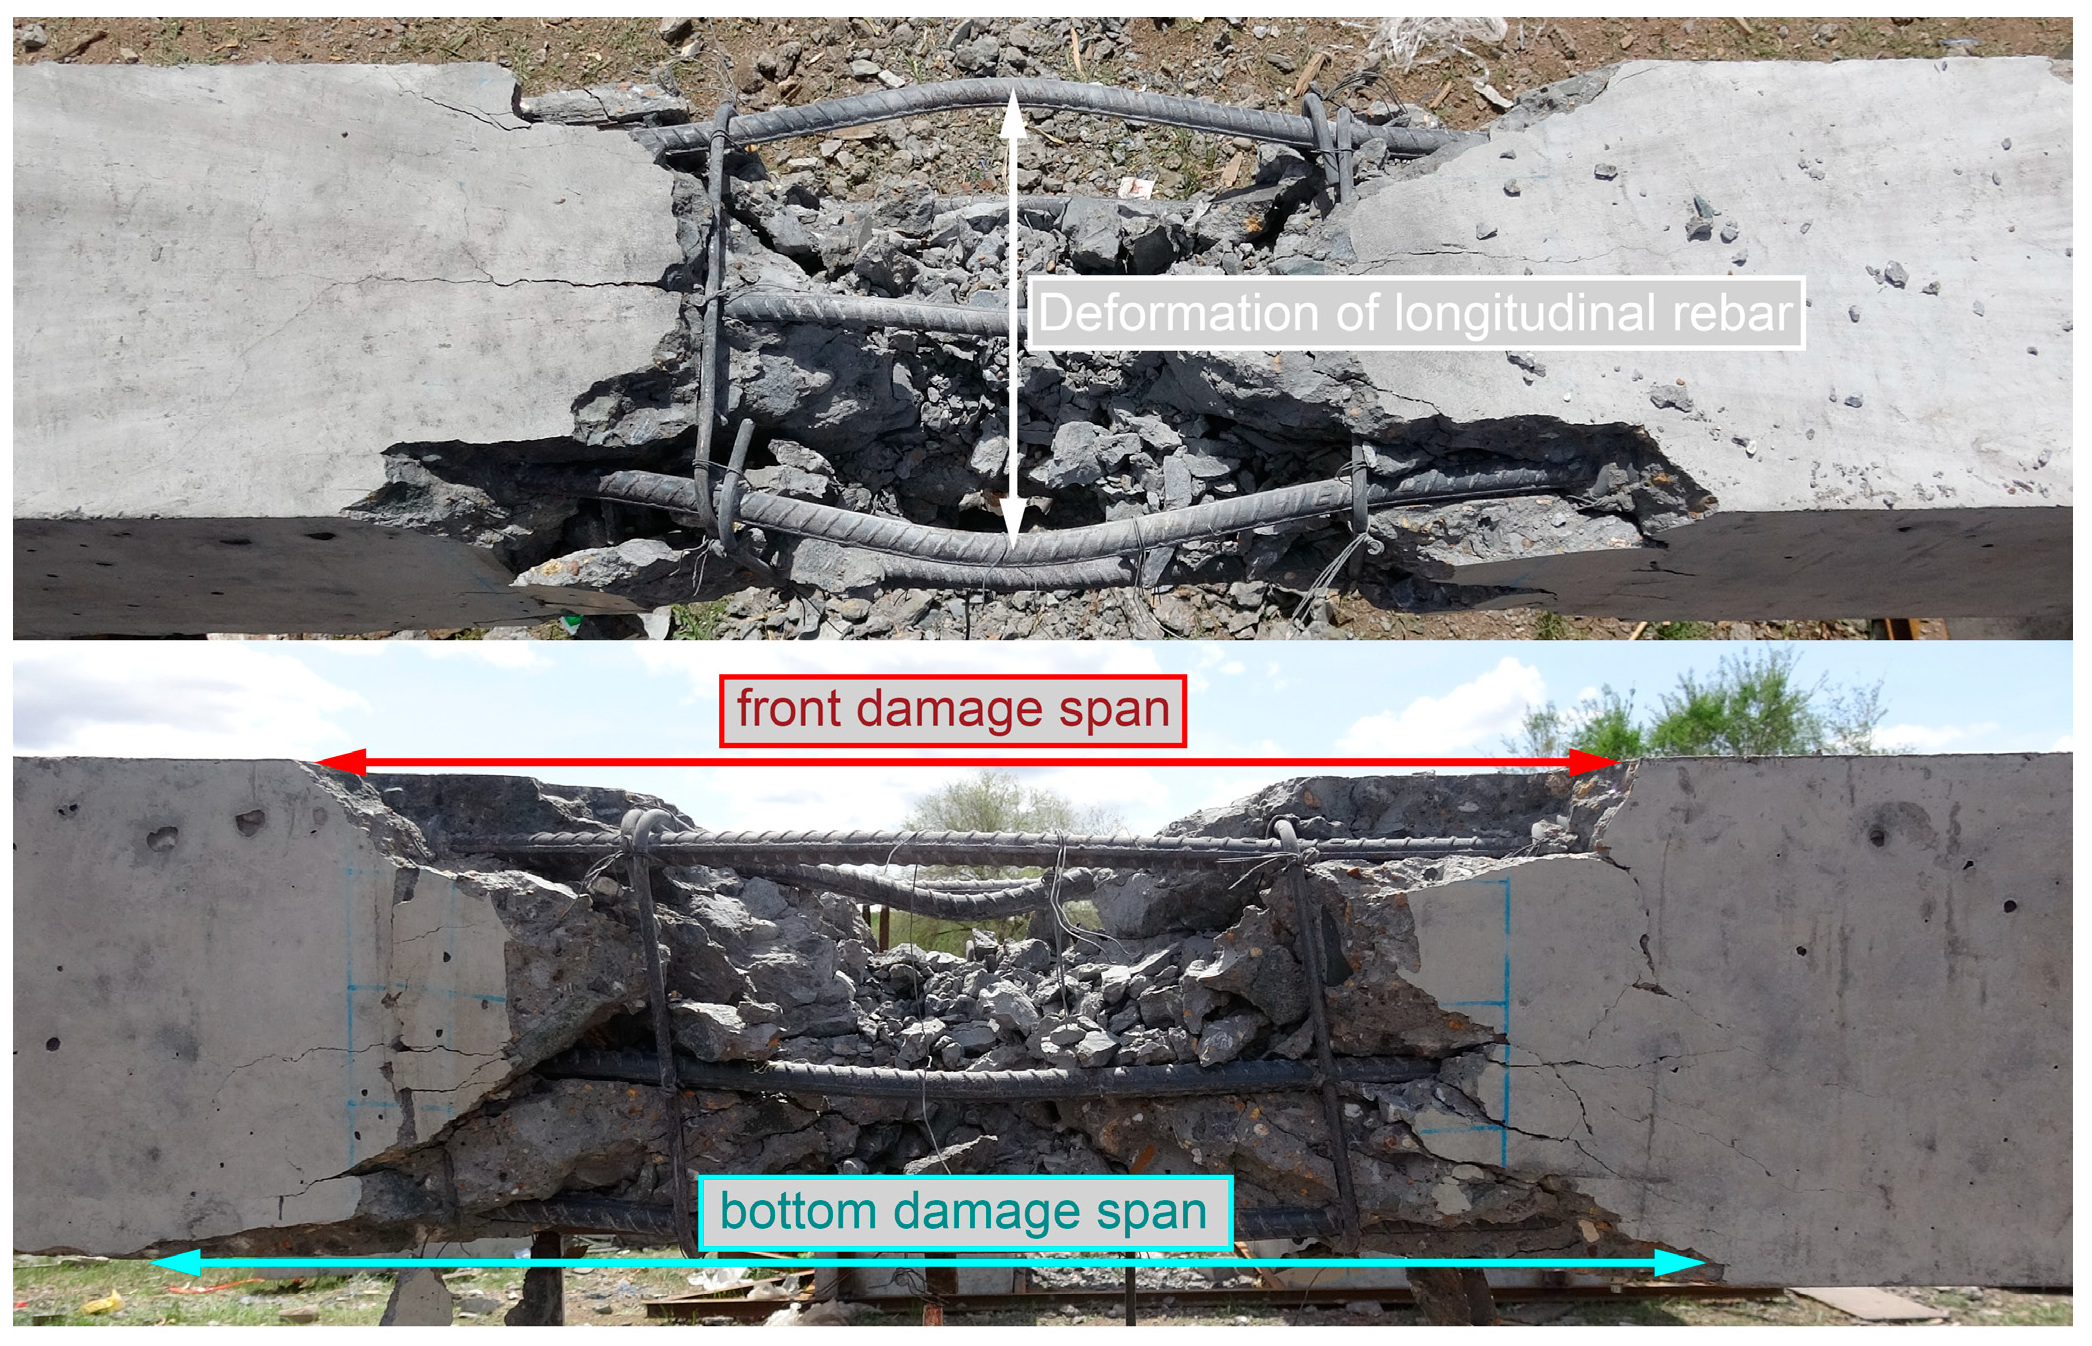
Local damage to the RC column was measured at the end of the test, including the length of the concrete surface damage (head-on surface, D f , and back-on surface, D b ) and the maximum deformation length of the top longitudinal rebar, L r , as shown in Figure 5. The damage data for each test condition are shown in Table 2.
These results were classified to consider the effects of concrete strength, standoff distance, axial load, and explosive mass on damage to RC columns.
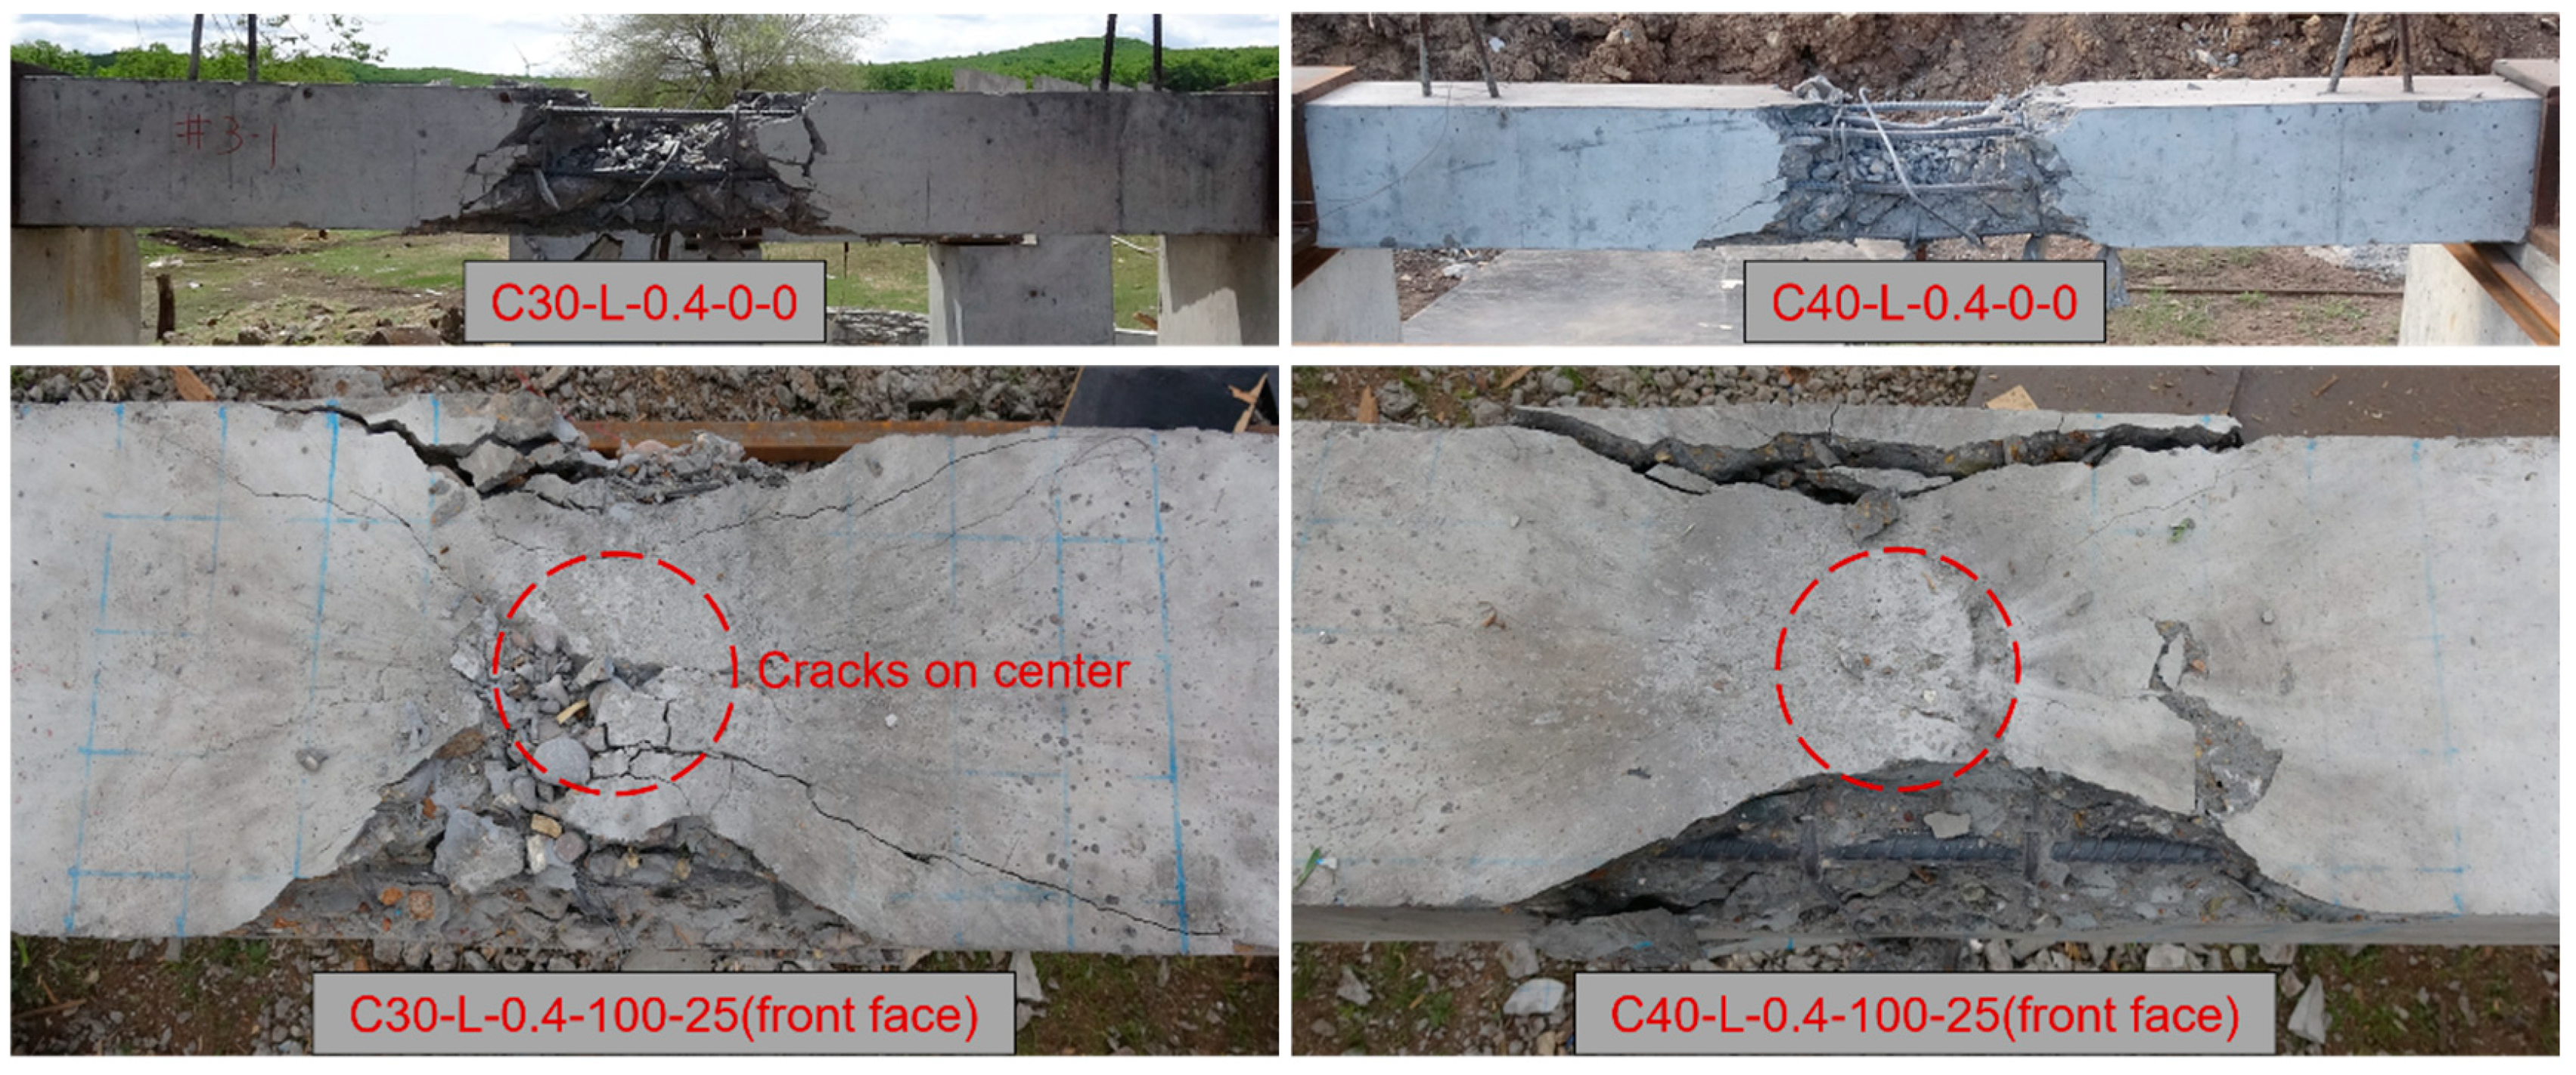
  • The test compared the results of RC column destruction under the C30 and C40 conditions for two groups, as shown in Figure 6. After upgrading the concrete strength from C30 to C40, local damage to the RC columns was reduced to a certain degree, and the steel deformation and concrete damage gap decreased. In the near-field explosion, the side concrete damage to the C40 concrete was minor. The data are compared in Figure 7. Under contact explosion conditions, the effect of the increased concrete strength on improving the RC column’s blast resistance was very small.
  • The scaled distances of the 100, 150, and 200 mm standoff distances were 0.170, 0.238, and 0.305 m/kg1/3, respectively, while the mass of the TNT charge was 0.4 kg. The test results are shown in Figure 8. For the C40 column at a scaled distance of 0.238 m/kg1/3, the damage was smaller than that of the C30 column at a scaled distance of 0.305 m/kg1/3. Furthermore, increasing the concrete strength effectively reduced concrete damage on the column surface under a large standoff (≥150 mm). At a scaled distance of 0.238 m/kg1/3, the blast load only caused slight damage to the concrete protective layer; at a scaled distance of 0.170 m/kg1/3, the concrete protective layer on the blast-facing surface of the RC column was severely damaged, but the reinforcement was not significantly deformed, and the concrete in the core area was intact. Under contact blast conditions (a scaled distance of 0.034 m/kg1/3), the RC column showed severe concrete damage and reinforcement deformation.
  • Different axial loads were transmitted to the RC column under the same explosion conditions, and the test results are shown in Figure 9. The collapse on the side of the RC column without an axial load formed two inverted triangles. When the axial pressure was 50 kN, the concrete constraint effect was enhanced by the axial load, and the peeling surface of the side concrete protective layer was basically flush with the stirrup. A comparison of two tests, namely, C30-S-0.4-0-50 and C30-S-0.4-0-75, revealed that when the axial load increased to 75 kN, the damage to the column intensified. While the standoff was 100 mm, increasing the axial load effectively reduced the damage to the center of the column surface.
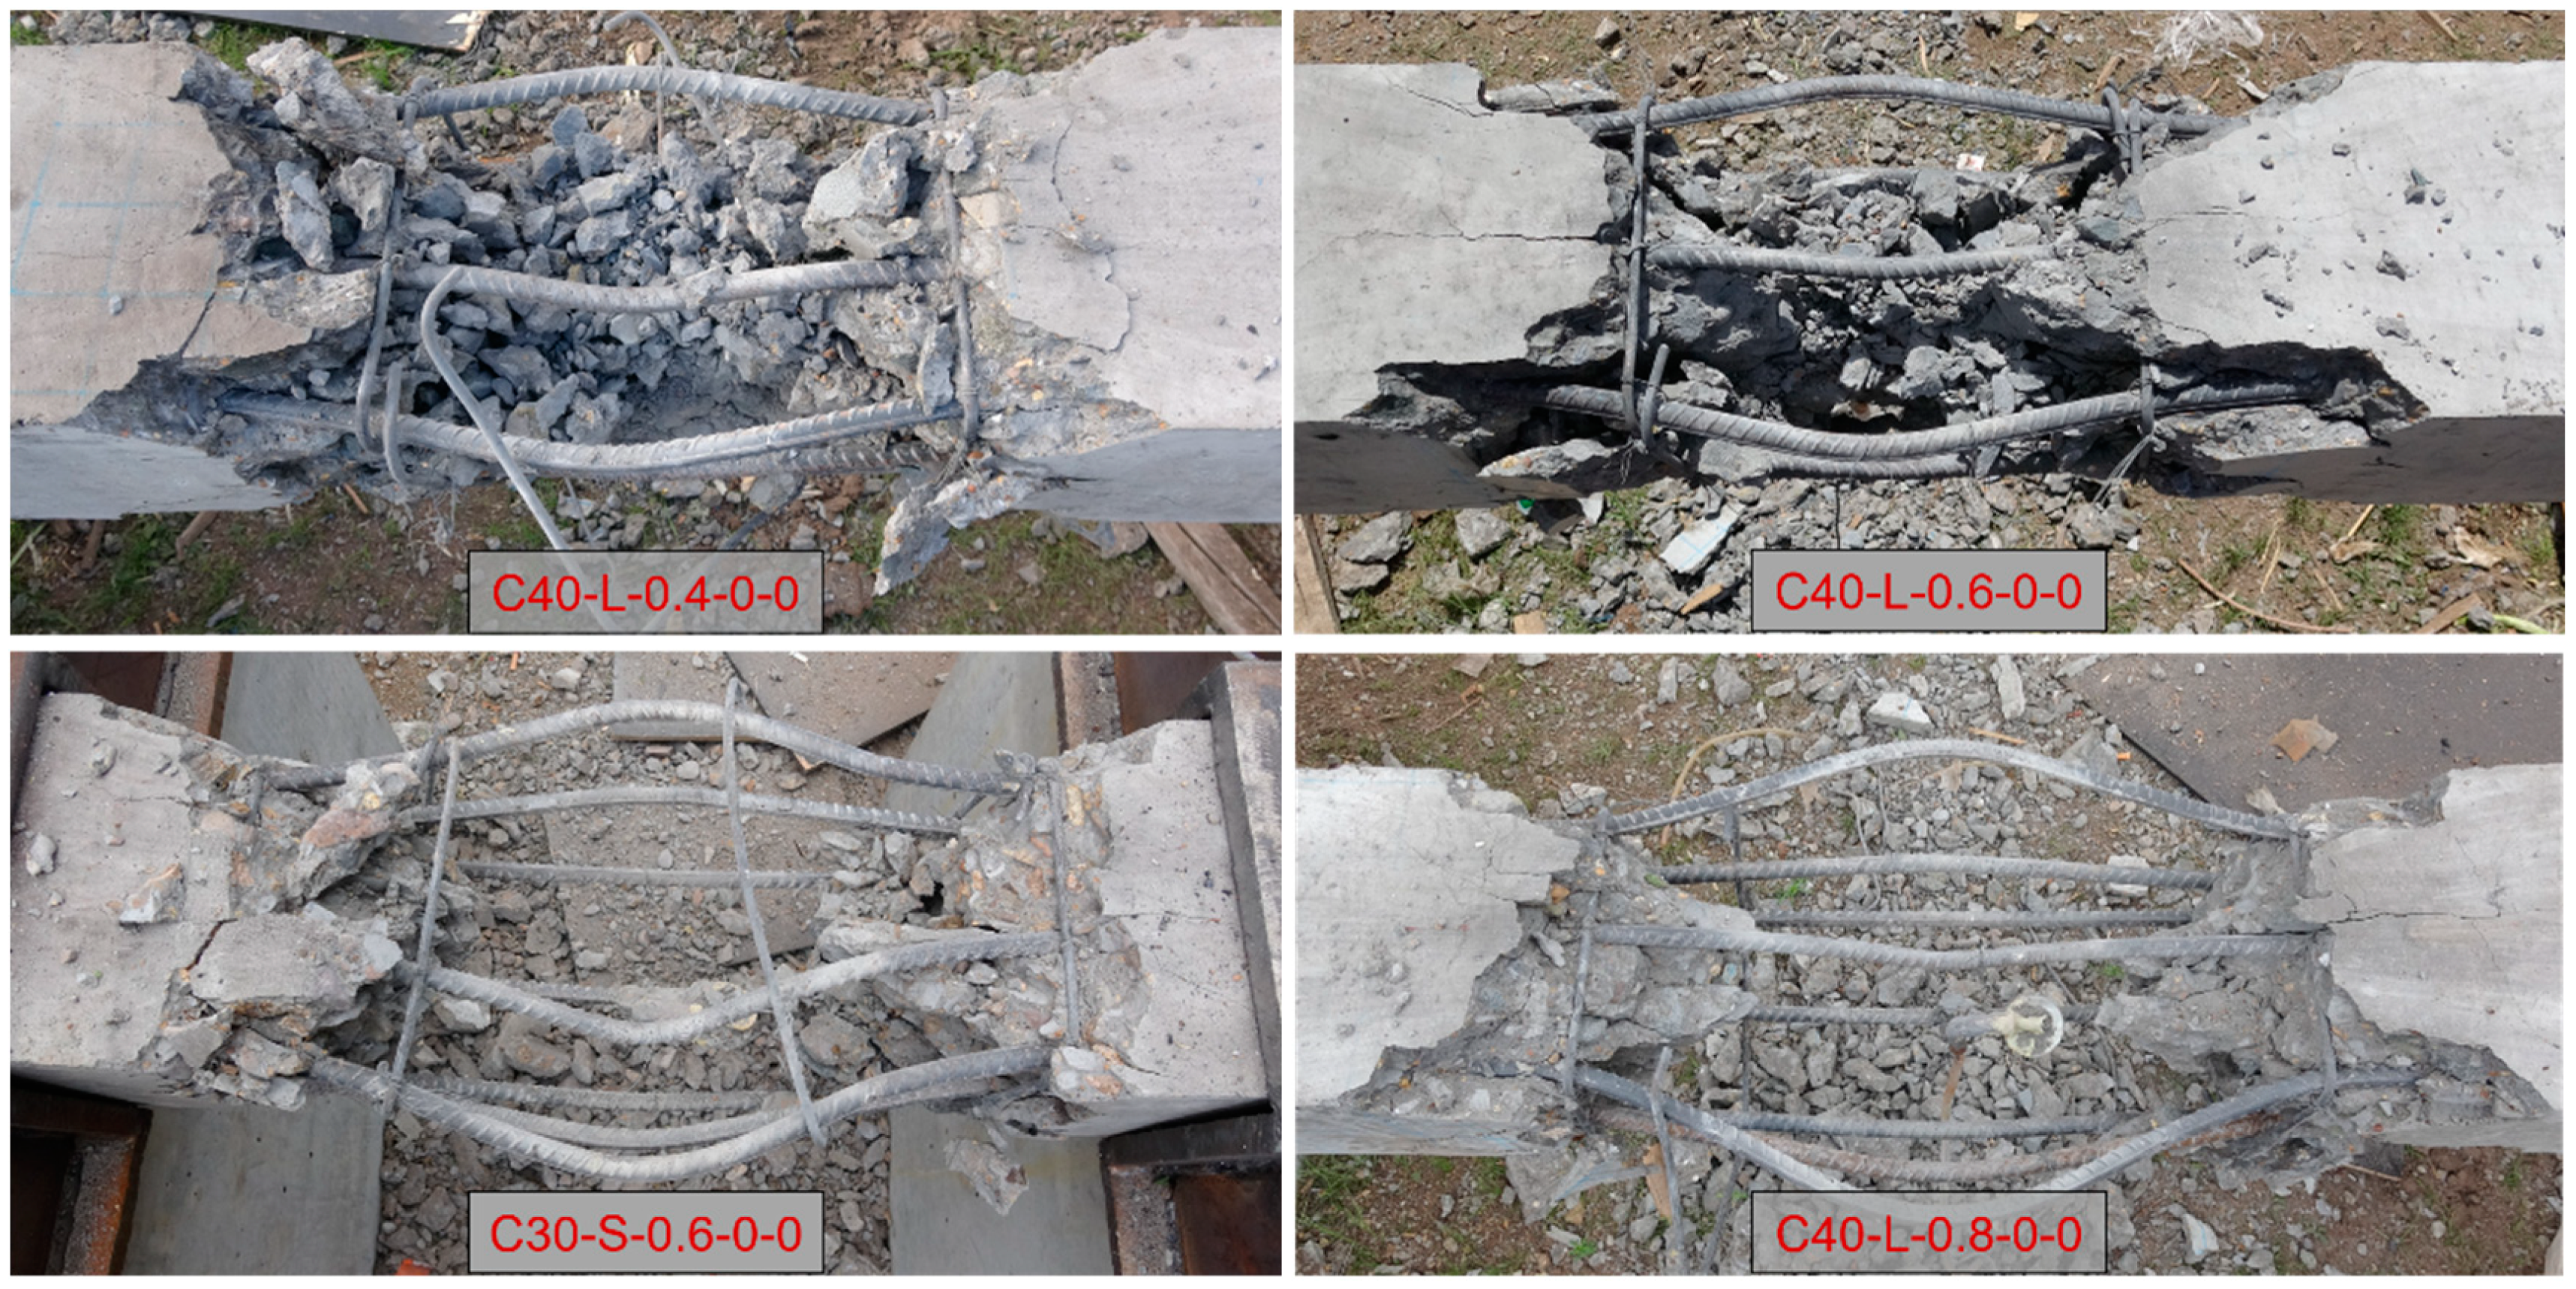
  • The 0.2 kg TNT caused severe damage to the column protective layer under contact explosion conditions, while the concrete in the core area only sustained a small amount of damage. When the TNT mass was 0.4 kg, the deformation of the steel bars intensified, and the concrete in the core area was severely damaged. When the TNT mass was 0.6 kg, the damage to the concrete core area exceeded 50%. In addition to the blast-facing surface, both sides of the core area endured serious damage. When the TNT mass was 0.8 kg, a significant angle on the supports could be observed; the concrete in the core area and the internal longitudinal bars were completely damaged. In addition, the shape of the explosive seriously impacted the damage to the column (C30-S-0.6-0-0). Ignoring the impact of column length on the damage, the contact area between the explosive and the column was large, and the scaled distance was small, causing serious damage, as shown in Figure 10.
  • Under contact explosion conditions (C40-S-0.4-0-0 and C40-L-0.4-0-0), the difference in local damage to the columns was relatively small; furthermore, the difference in concrete damage was also relatively small. When the concrete in the core area was damaged, there was a clear correlation with the transverse reinforcement. Given the different transverse reinforcement arrangements when the short and long columns exploded at the center, certain differences in the damaged area were observed. However, the core damage area was limited by the transverse reinforcement, and the damage length was similar. This phenomenon also obviously occurred when the mass of the TNT increased and the damage was severe, as shown in Figure 11.

3. Numerical Study

A series of regular phenomena can be observed by conducting multiple sets of tests with different variable conditions. However, local damage to RC columns under blast loads can be affected by numerous factors, so many scholars have predicted and analyzed blast loading with numerical simulations [28,29,30]. In this study, the finite element software LS-DYNA 17.0 was used to simulate local damage to RC columns under blast loads and analyze the effects of different related factors.

3.1. Numerical Model Setup

A 10 mm grid was used to model the concrete and rebar of the RC columns. The solid grid around the reinforcement was slightly less than 10 mm, owing to the location limitations of the reinforcement. The reinforcement bars were bonded to the concrete, and stirrup rebars were attached to one another at the intersections. The overall numerical model and mesh division of the RC columns are shown in Figure 12. The present study defined the parameters of the erosion model through the trial-and-error method. The Arbitrary Lagrange–Euler method was used to simulate explosives and air, and their interaction with concrete elements. This method can simulate interactions between detonation products and is thus suitable for contact explosions.

3.2. Material Models

In this model, air is considered an ideal gas, and the density is set to 1.225 kg/m3. By using the MTA_NULL material model and the EOS_LINEAR_POLYNOMIAL equation of state, the linear equation of state can be shown below:
p = C 0 + C 1 u + C 2 u 2 + C 3 u 3 + C 4 + C 5 u + C 6 u 2 E
where C 0 , C 1 , C 2 , and C 3 and C 6 are 0; C 4 and C 5 are 0.4; and the specific internal energy is E = 253.4 kPa when the atmospheric pressure is 101 kPa.
The MAT_HIGH_EXPLOSIVE_BURN material model and the Jones–Wilkins–Lee equation of state are used to simulate TNT explosives:
p = A 1 ω R 1 V e R 1 V + B 1 ω R 2 V e R 2 V + ω V E
where p is the hydrostatic pressure; V is the specific volume; e is the specific internal energy; A , B , R 1 , R 2 , and ω are the material constants; and the material parameters are adopted from the explosive parameters provided in the literature [31], as shown in Table 3.
Many experimental and numerical studies have shown that the strength of concrete and steel increases significantly at high strain rates [32], and the enhancement rate of a material’s dynamic strength is often referred to as the dynamic growth factor. The MAT_CONCRETE_DAMAGE_REL3 [33] material model was used to simulate the dynamic behavior of concrete under explosion loads, allowing the material properties of concrete to change at high strain rates by defining strain rate curves. In this study, the empirical equation proposed by CEB [34] and the concrete tensile equation proposed by Malvar and Ross [35] were used to calculate the concrete strain rate with the material parameters shown in Table 3. The CEB equation for concrete under compression is shown in Equation (4):
f c d f c s = ε ε s 1.026 α s , ( ε 30   s 1 ) γ s ε ε s 1 3 , ( ε > 30   s 1 )
where f c d and f c s are the dynamic and static compressive strengths, respectively; ε is the strain rate; and ε s = 3 × 10⁻⁵ s−1 (static strain rate). γ s is calculated from Equation (5), and α s is calculated from Equation (6).
γ s = 10 6.156 α s 2
α s = 1 5 + 9 f c s f c o
The equation for the tensile strength of concrete is expressed as Equation (7):
f t d f t s = ε ε s δ , ( ε < 1   s 1 ) β ( ε ε s ) 1 3 , ( ε > 1   s 1 )
where f t d and f t s are the dynamic and static compressive strengths, respectively; ε is the strain rate; β is calculated from Equation (8); and δ is calculated from Equation (9).
β = 10 6 δ 2
δ = 1 1 + 8 f f
The steel bars were modeled using the MAT_PLASTIC_KINEMATIC material model, which can simulate strength changes in the material at high strain rates well. The material failure can be defined by the plastic strain, as shown in Equation (10):
σ Y = [ 1 + ( ε C ) 1 P ] ( σ 0 + β E P ε P e f f )
where σ 0 is the static yield stress, ε is the strain rate, C and P are the Cowper–Symonds model parameters, ε P e f f is the effective plastic strain, and E P is the plastic hardening modulus. Steel material parameters provided in the literature [10] were used in the numerical simulations, and the relevant parameters are shown in Table 3.

3.3. Model Verification

Typical experimental tests were chosen to compare the pattern damage of the numerical simulation. Later, appropriate erosion parameters for the concrete and rebars were selected for numerical simulation, and the results were consistent with the experimental results. The tensile strength of the concrete material is much less than its compressive strength. The tensile failure of the back of the column is obvious in the numerical simulation, whereas only the concrete cover was damaged in the tests, and the concrete in the core area was protected by the reinforcement. Figure 13 shows the results of the numerical simulations.
Given the simulation results, the numerical simulation could realistically simulate the damage to the concrete protective layer on the front face and the concrete in the core area. The damage to the concrete can be judged from its effective plastic strain in the K&C model, and the failure value can produce great variability in the final damage state. Therefore, the failure value was defined conservatively. A series of numerical simulations were carried out to investigate the factors affecting damage to RC columns under explosion loads.

3.4. Numerical Results and Discussion

3.4.1. Length of Column and Standoff Effect

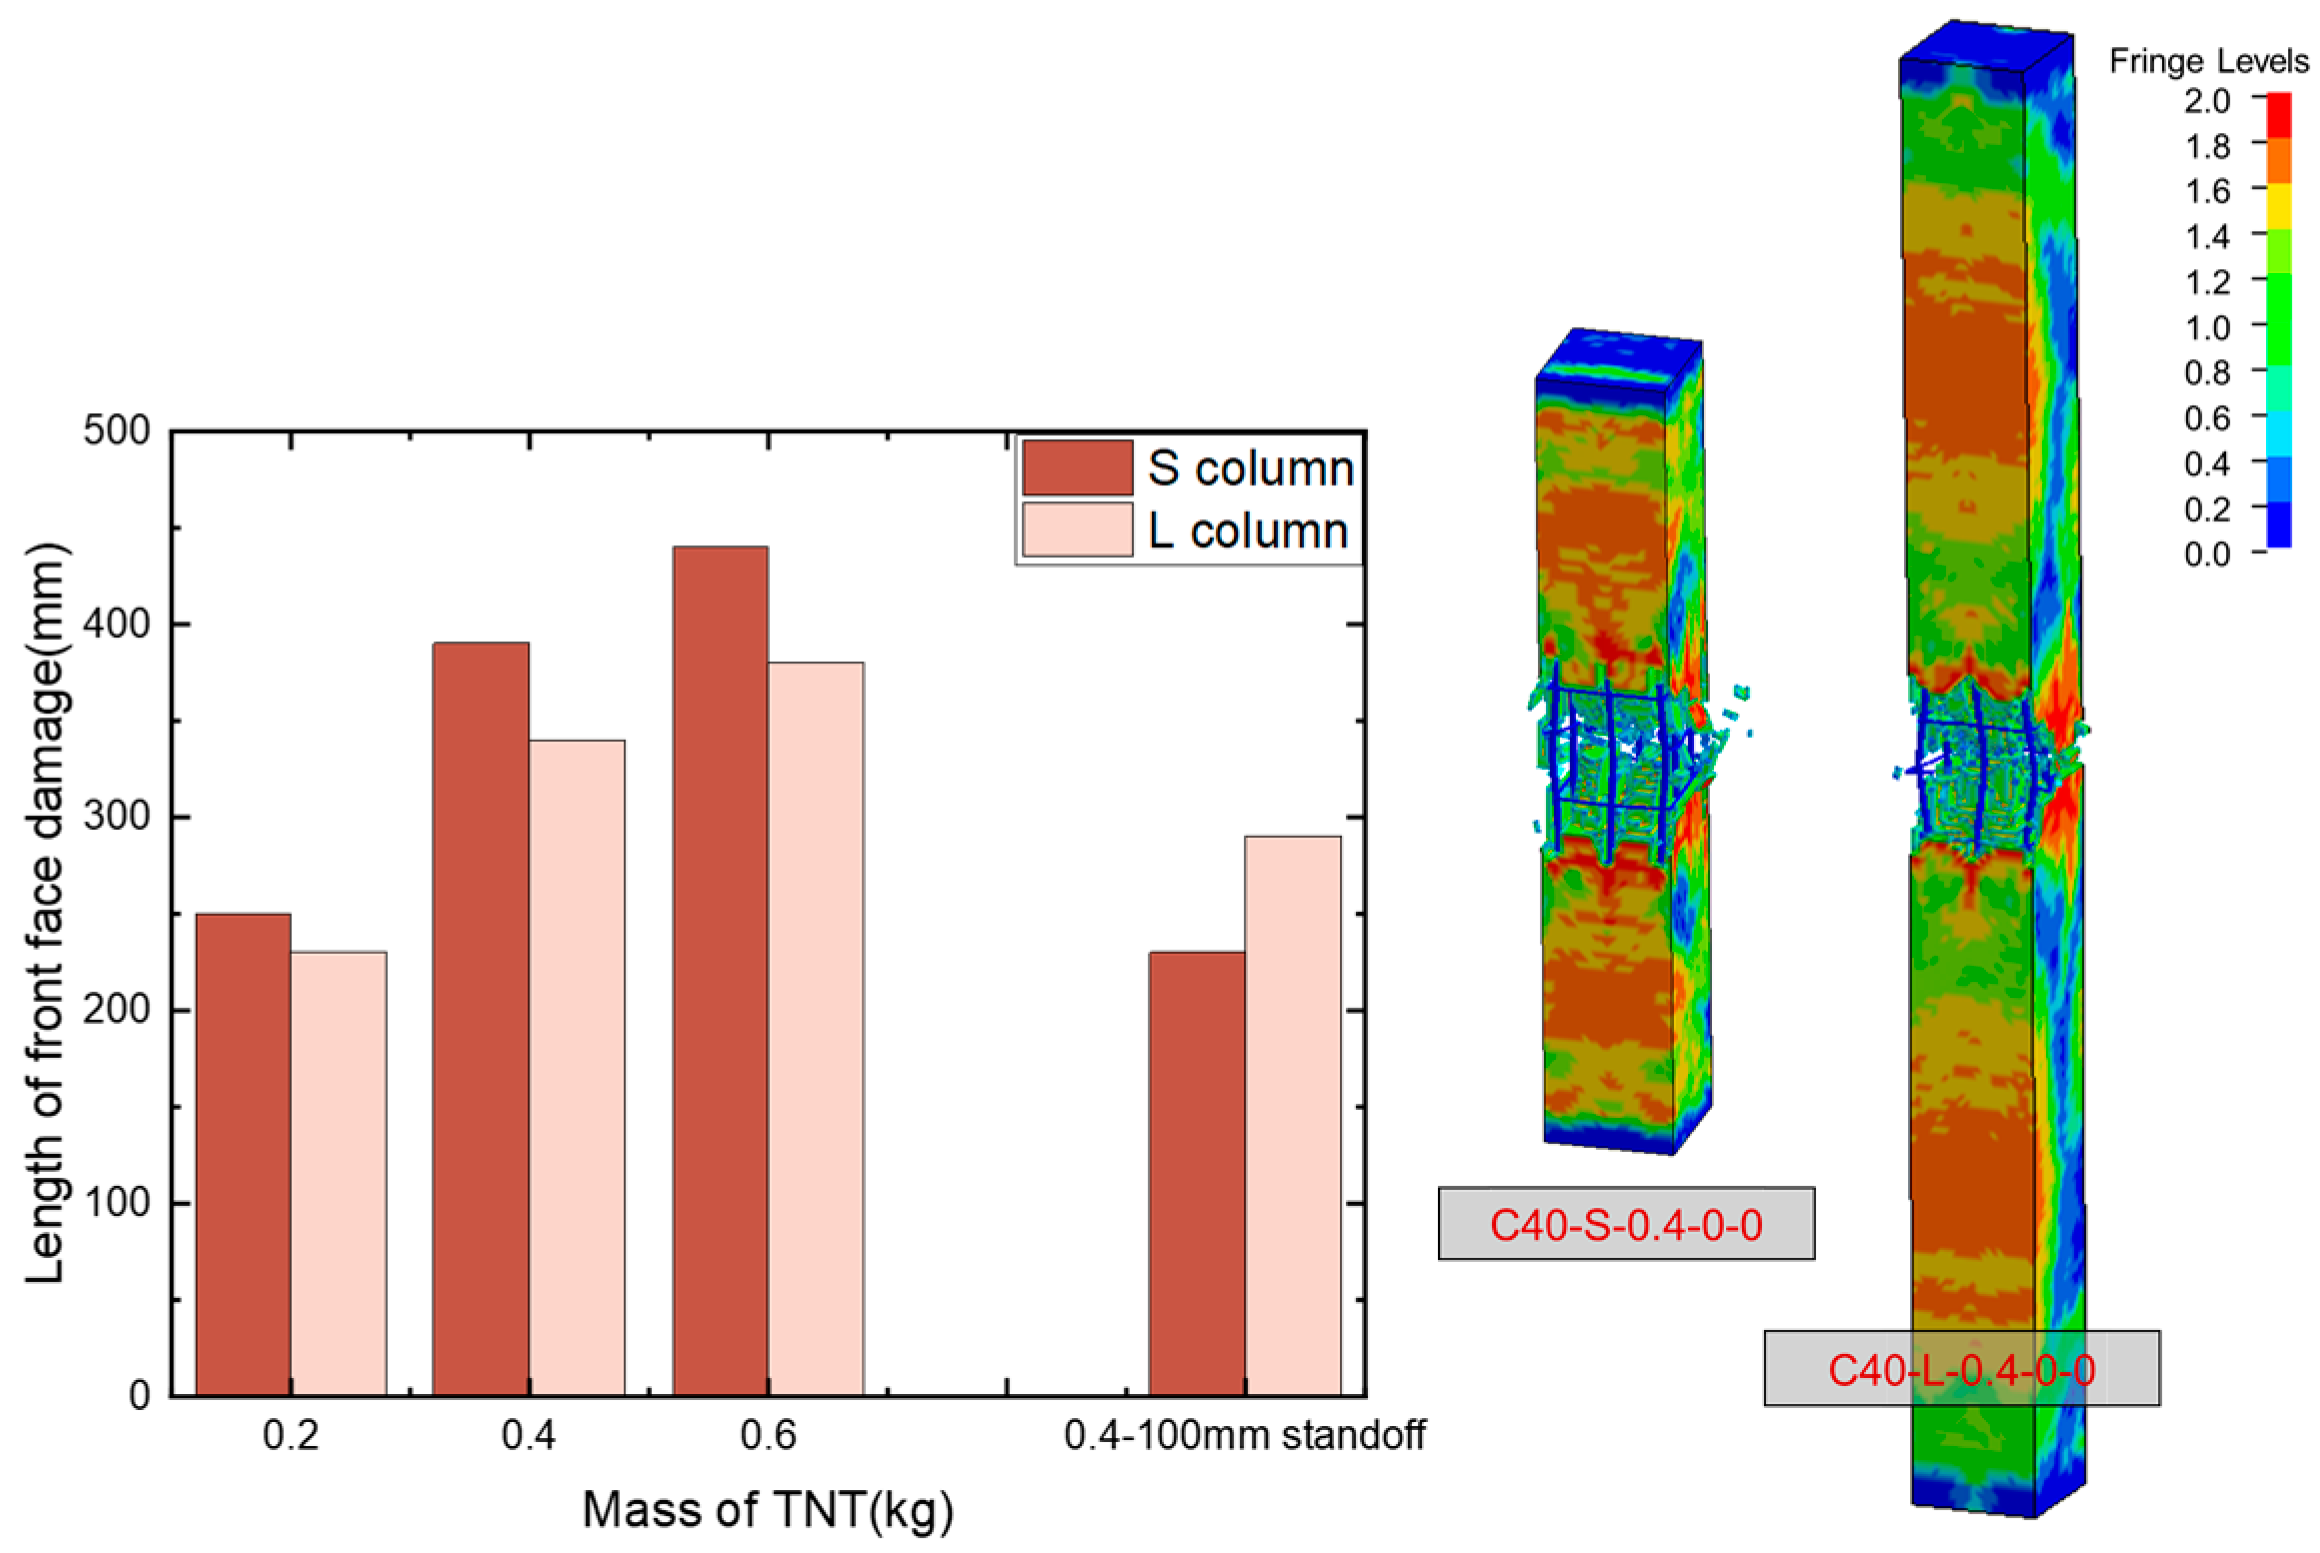
An analysis of the test results shows that concrete strength affects the damage results of RC columns. In addition, the column length and standoff affect these results, and different factors affect damage to RC under different conditions to different degrees. Figure 14 shows numerical simulations for different column lengths and blast height conditions. The damage results were tallied and are also shown in Figure 14.
The larger the standoff distance is, the smaller the damage area of the RC column is, and the RC column frontal damage decreases rapidly with the increased standoff distance under constant concrete strength. Under contact explosion conditions, damage to the 1350 mm and 2500 mm columns is basically the same, but damage to the 2500 mm column is significantly smaller than that of the 1350 mm column under a particular standoff. However, this phenomenon is difficult to reflect in numerical simulations. Owing to significant bending in the long column, mesh deformation and failure increase. Therefore, the numerical simulation in this study mainly focuses on contact explosion situations.
Statistics for the different simulation conditions (1350 mm and 2500 mm) were obtained, and a damage index [8] was introduced as the criterion of damage assessment to plot the damage results under different explosive qualities. The damage index was defined by the damage profiles. When the concrete core has no effect, the damage is considered minor. When the concrete core has a minimal effect, the damage is considered moderate. When the concrete core is partially fragmented, the damage is considered significant. Finally, when the concrete core is completely fragmented, the damage is considered penetrative. To quantify the concrete damage index, the four degrees of damage were assessed based on the concrete core breakage rate (fragmented volume/total volume) within the local damage area of the RC column, as shown in Figure 15.
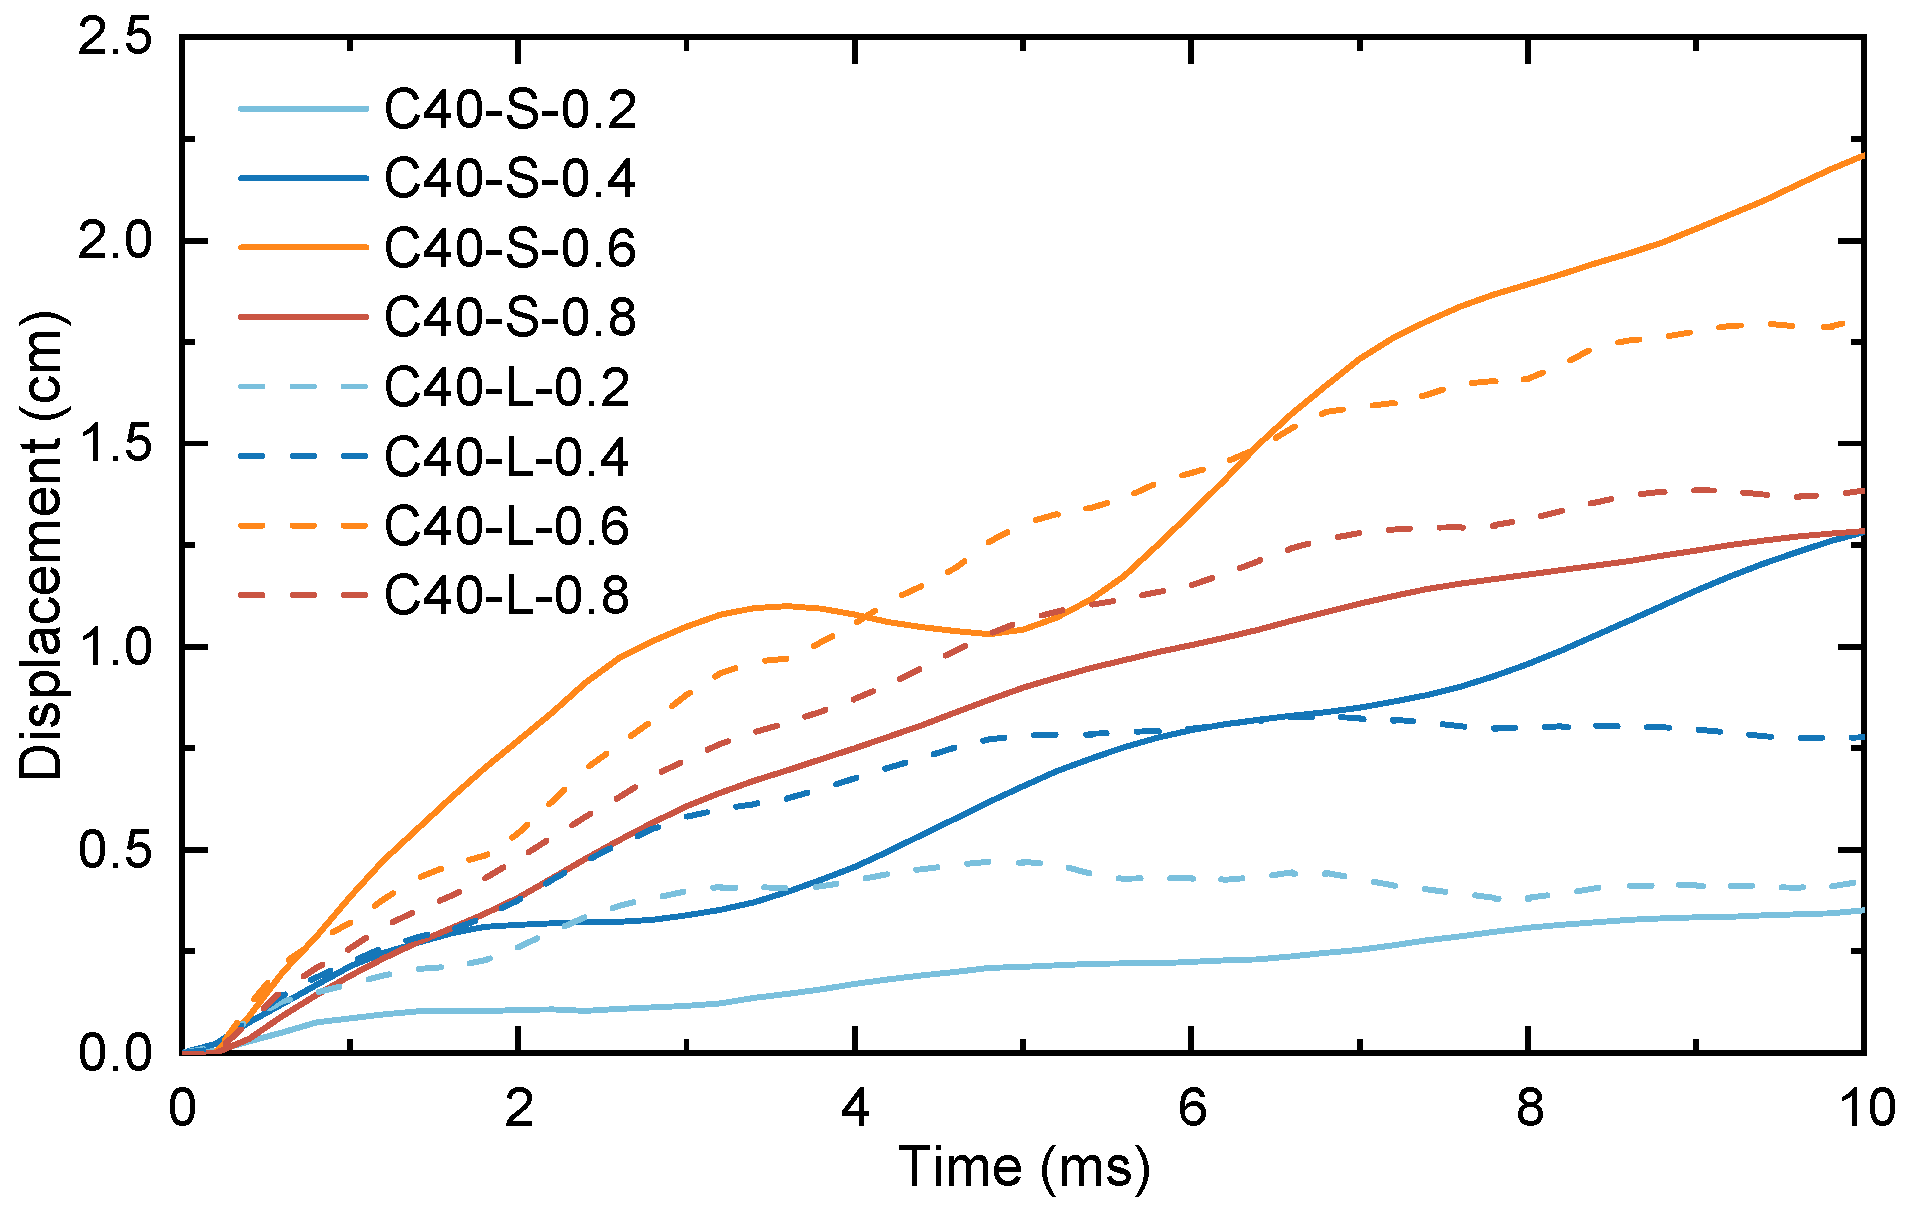
Displacement time–history curves under different TNT masses are shown in Figure 16. Under column contact explosion conditions, the displacement change at the mid-span was relatively minor, and the primary damage mode can be characterized by localized concrete fragmentation, with no significant overall bending deformation evident. When the TNT mass is 0.8 kg, the RC column experiences through failure, and the explosive load is unloaded from the through area, resulting in a smaller mid-span displacement than under the 0.6 kg TNT condition. Because the numerical calculations stopped after local damage was completed, with a total calculation time of only 10 ms, the displacement time–history curve could not record the complete mid-span displacement.

3.4.2. Effects of Stirrup Distance and Location of Explosive

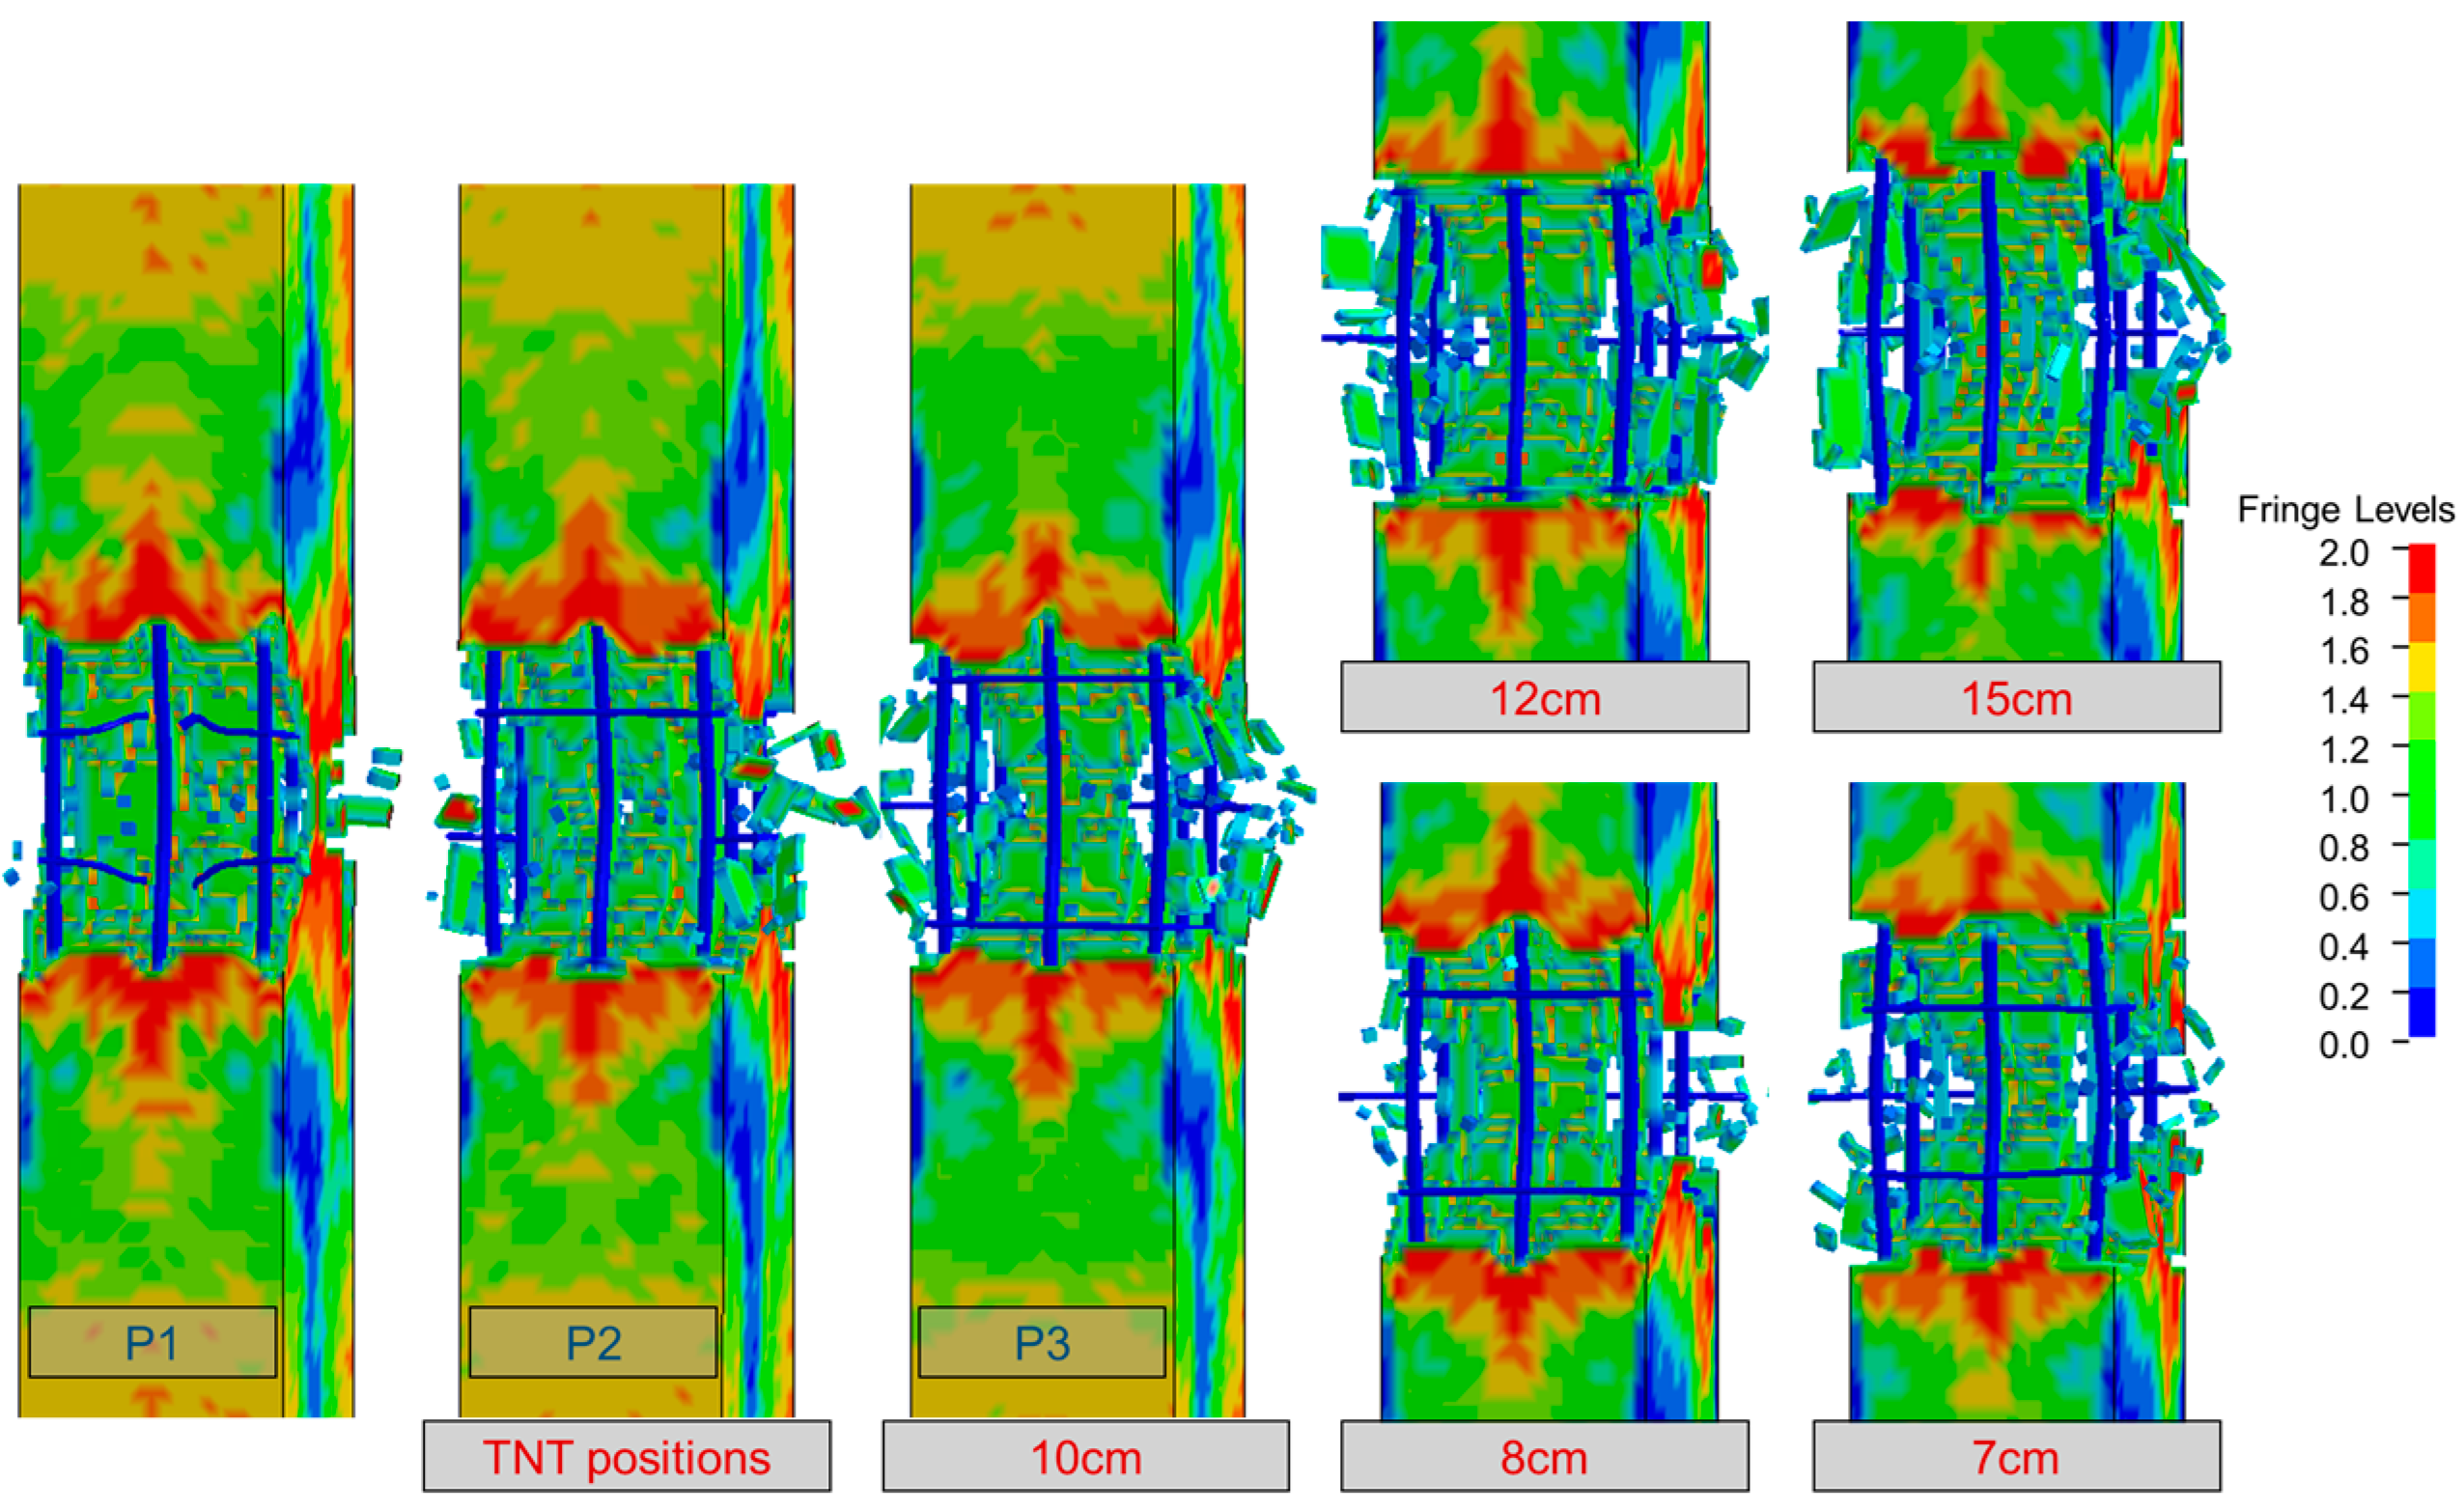
Fujikake [36] conducted contact explosion tests, revealing that shear reinforcing rebars confining the core concrete of RC column specimens significantly affect damage to these specimens caused by blasting. Numerical simulations were carried out for different explosive locations above the transverse reinforcement and different transverse spacings; the transverse spacing was maintained at 100 mm when the explosive location conditions were changed, as shown in Figure 17. The numerical simulation shows that the number of hoop fractures changed with the explosive position. Thus, the relationship between the explosive mass, the standoff distance, and the transverse spacing can be inferred. The numerical simulation results are shown in Figure 18.
The transverse spacing and the explosive locations affect the frontal damage to RC columns: the transverse reinforcement near the explosive will fracture, while the transverse reinforcement far from the explosive will partly limit the damage to the concrete. Meanwhile, the concrete core area and the side spalling will be equally influenced by the position of the transverse reinforcement.
When the explosive was located at P1, the transverse reinforcement close to the explosive fractured, while the longitudinal reinforcement on both sides bent less. The concrete on the front side of the column had the most serious damage length, but the concrete on the back side had the least damage. When the explosive was located at P3, the center transverse reinforcement fractured, in addition to the two exposed transverse reinforcements on both sides, and the concrete damage area was basically confined by the exposed transverse reinforcement. However, the concrete damage on the back and sides of the column was severe. When the explosive was located at P2, the damage showed significant asymmetry, with the transverse reinforcement at the bottom of the explosives fracturing; while the transverse reinforcement closer to the explosives did not fracture, it failed to effectively limit the damage to the concrete on the front face of the column.
A series of numerical simulations were carried out by changing the transverse reinforcement spacing. When the spacing was 120 mm and 150 mm, the column on both sides of the longitudinal bar expanded outward because the spacing was too large; on the two sides of the transverse reinforcement, the concrete damage was serious. When the spacing was 100 mm, the concrete damage was completely limited, and further increasing the hoop spacing made the face of the explosion damage more serious; at the same time, the longitudinal bar of the bending deformation also increased. When the spacing was 80 mm, the transverse reinforcement was closer to the explosives but basically undeformed; this limited the damage to the concrete on the front side and the collapse of the side and back to the transverse reinforcement spacing. However, when the spacing was reduced to 70 mm, although the explosive did not fracture the reinforcement on both sides, the concrete damage was less restricted than the 80 mm spacing, and the front concrete damage and longitudinal bar bending deformation were more serious. It can be assumed that reducing the transverse reinforcement spacing to 80 mm can effectively improve the explosive resistance in the P3 position.

4. Damage Prediction

4.1. Contact Explosive Load

For a prismatic explosive size of b × l × h , Equation (11) can calculate the total impulse acting on the contact surface, and Equations (12), (13) and (14) can define μ , W , and u x , respectively [35].
I = u x W μ
μ = 1 h b h l + 4 3 h 2 b l ( b h 2 ) 1 4 b 2 l h l b 1 3 ( b h < 2 )
W = b l h ρ W
u x 2 Q W ,
Here, Q W is the energy of the explosive, and u x is the speed of the detonation products.
The same explosive mass with different charge structure sizes will affect the size of the impulse acting on the surface of the column, where b is the variable, and b h is changed to determine the impulse size.
According to the principle of momentum conservation, the pressure impulse is equal to the change in momentum.
I = m v 0 ,
Here, m = 4 π ρ m a 1 b 1 2 / 3 is the mass of the initial explosion body, ρ m is the medium density, a 1 is the semi-major axis of the elliptical, and b 1 is the semi-minor axis of the elliptical and the height of the initial explosion body [37]. Assuming that the radial velocity of the initial explosion body is the same, the impulse is directly proportional to the mass of the initial explosion body, as shown in Figure 19.
For a hemispherical charge with u = 0.5, the impulse action surface is equal to the contact surface. Based on the impulse of the hemispherical explosive, a 1 and b 1 can be determined by the following equation:
a 1 b 1 = l b a 1 b 1 2 = 3 b l h u

4.2. Damage Prediction Model

4.2.1. Damage Evolution and Basic Model

Based on the experiment and findings of previous studies, we can categorize the damage evolution of RC columns under contact explosion conditions into three stages:
  • The explosion immediately acts on the RC column upon charge detonation. The portion of the RC column in direct contact with the charge enters a plastic flow state as a result of the substantially elevated peak pressure exceeding the material yield strength; this section of the material is referred to as the “initial explosion body”. The bars in the initial explosion body can be ignored, and the concrete within the initial explosion body is subject to complete destruction, thus rendering the confinement effect of the bars on the concrete negligible.
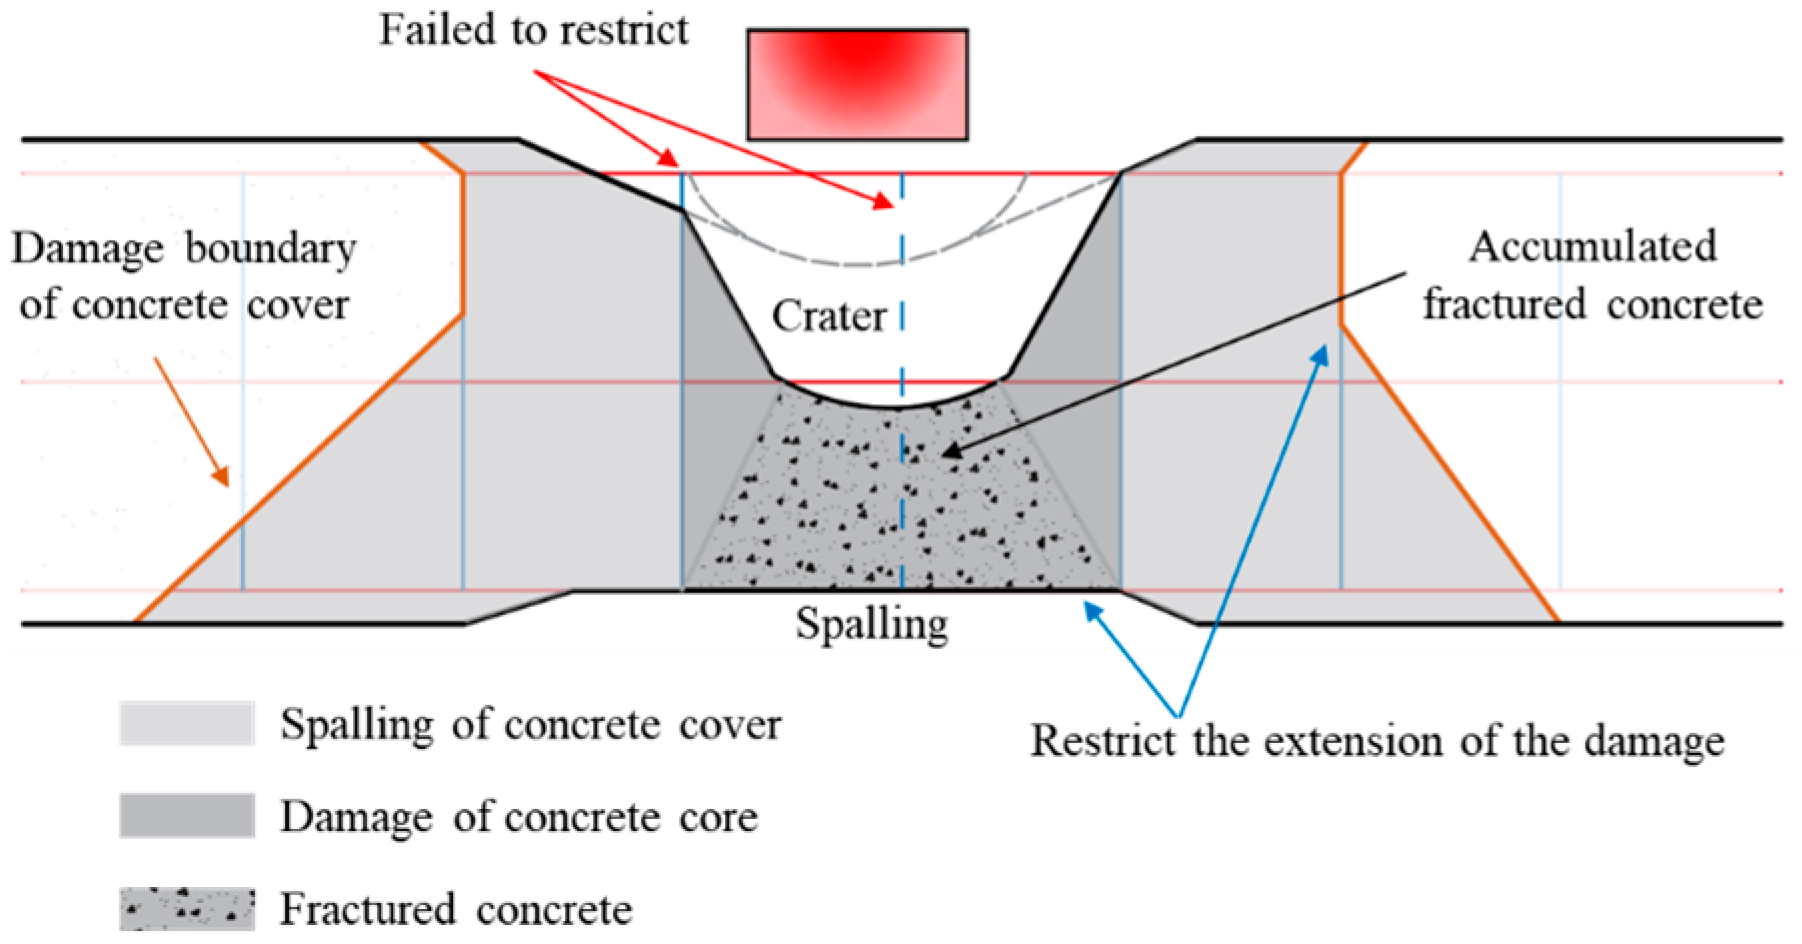
  • The external concrete in the initial explosive body experiences compression upon impact, causing internal void collapse and compaction, consequently leading to heightened compressive strength. As the stress wave propagates within the column, the material transitions from compaction hardening to pore crushing. Consequently, the compressive failure crater is formed, as depicted in Figure 20.
  • The stress wave continues to propagate through the column, reflected as a rarefaction wave at the bottom and lateral face. When the tensile stress acting on the lateral and bottom concrete of the column exceeds its ultimate tensile strength, it leads to tensile failure, resulting in cracking and spalling.
The simulation results reveal that the transverse reinforcement arrangement significantly affects the damage to the column. In the initial explosion body, the transverse reinforcement breaks and has little effect on the front damage. However, while the transverse reinforcement outside the initial explosion body can partly restrict the extension of the concrete destruction region, the longitudinal reinforcement can constrain the movement of the fractured concrete, as shown in Figure 21. In the RC column subjected to axial loading, the length of the front face damage to the concrete is the distance between the two transverse reinforcements, the length of which is affected by the reinforcement spacing.

4.2.2. Correction of Initial Explosion Body

In Section 4.1, impulse calculations did not consider the influence of explosive height, h . Consequently, a corrective calculation method can be introduced to account for this omission. In the context of ideal detonation conditions, the contact area and peak pressure remain constant, and the impulse is solely influenced by the action time. Increasing h will extend the action time. The decay of pressure over time follows an exponential form, and the action time is proportional to h ; thus, we can derive the coefficient K i for an increased impulse after extending the action time, as shown in Equation (17):
K i = ( 2 h b ) A k               ( b h < 2 )
where A k is the attenuation index; the value used in this study is 0.5. Equation (12) can be changed to Equation (18):
μ = 1 h b h l + 4 3 h 2 b l ( b h 2 ) 1 4 b 2 l h ( l b 1 3 ) 2 h b ( b h < 2 )
The initial explosion body can be calculated according to Equation (18) and the equations in Section 4.1. Thus, the concrete inside the initial explosion body is completely damaged after the explosion.
Equation (19a–c) are generally known as the “Rankine–Hugoniot Equations” [38] and can determine the shock states of concrete coming into contact with explosives.
Mass :   ρ 0 u s = ρ 1 u s u
Momentum :   P P 0 = ρ 0 u s u
Energy :   E E 0 = 1 2 ( P + P 0 ) ( 1 ρ 0 1 ρ 1 )
Here, ρ 0 is the initial density; ρ 1 is the density after the shock; P is the shock pressure; P 0 is the initial pressure; u s is the shock wave velocity; u is the particle velocity; E 0 is the initial energy; and E is the shocked energy.
Since the number of variables in Equation (19a–c) exceeds the number of analytical relations, the equation of state (EOS) should be provided to describe the relationship of the shock wave velocity, u s , to the particle velocity, u , as shown in Equation (20).
u s = c 0 + K s u
The authors of [39] described the linear fit, and parameters c 0 and K s can be derived as 1800 m/s and 1.8, respectively. The explosion pressure is extremely high, allowing P 0 to be neglected. Thus, Equation (19b) can be simplified into Equation (21):
P = ρ 0 u s u
In accordance with impedance matching [40], the relationship between pressure and particle velocity at the interface between explosives and concrete can be determined, as shown in Equation (22).
ρ W D u + 2 P W = P
By combining Equations (20)–(22), we can derive Equation (23) to calculate particle velocity and related parameters.
( ρ 0 c 0 + ρ W D ) u + ρ 0 K s u 2 = 2 P W

4.2.3. Propagation and Compressive Damage

When the pressure exceeds lockup pressure, the pores of the compressive concrete are compacted, and the concrete behaves as a solid material. However, this range of action is small, so only the propagation attenuation of concrete under compression and crushing conditions can be considered. An exponentiated decay model can be used for a simplified description of shock decay in concrete [40], as shown in Equation (24).
P 1 x 2.5
The concrete dynamic failure strength is in the 400 MPa to 1000 MPa range under contact explosion conditions, and the compressive strain rates are approximately 105 s−1. Based on Equations (4)–(6), the dynamic compressive strength, f c d , can be determined to be 700 MPa, which is within the range of the concrete crushing strength.
In the predictive model, concrete undergoes compressive damage when the peak pressure surpasses the dynamic compressive strength. The crater depth is determined based on the sum of the depths of the initial explosion body and the compressive damage zone.

4.2.4. Equivalent Transmission via Reinforcement

In experimental and numerical simulation research, it has been found that stress waves inside concrete exhibit significant damage-restricted effects when passing through the cross-section of the reinforcement. Based on the propagation law of one-dimensional stress waves in composite media, a transmission attenuation model of stress waves passing through the cross-section of the hoop reinforcement can be established, as shown in Figure 22. In the calculation process, stress wave attenuation in the steel bar section can be neglected, and it is assumed that the initial velocity and stress of the particles are zero. The stress transfer coefficient can then be calculated based on the wave impedance ratio between Section 1 and Section 2, as shown in Equations (25) and (26).
k 1 = ρ s C s ρ 0 C 0 , k 2 = ρ 0 C 0 ρ s C s
T 1 = 2 k 1 k 1 + 1 , T 2 = 2 k 2 k 2 + 1
Here, ρ 0 = 2300 kg/m3 is the density of concrete, C 0 = 4000 m/s is the sound velocity of concrete, ρ s = 7800 kg/m3 is the density of rebar, C s = 5200 m/s is the sound velocity of rebar, and T 1 and T 2 are the attenuation coefficients of Section 1 and Section 2, respectively.
The calculated attenuation coefficient is 0.6.

4.2.5. Reflection and Spalling

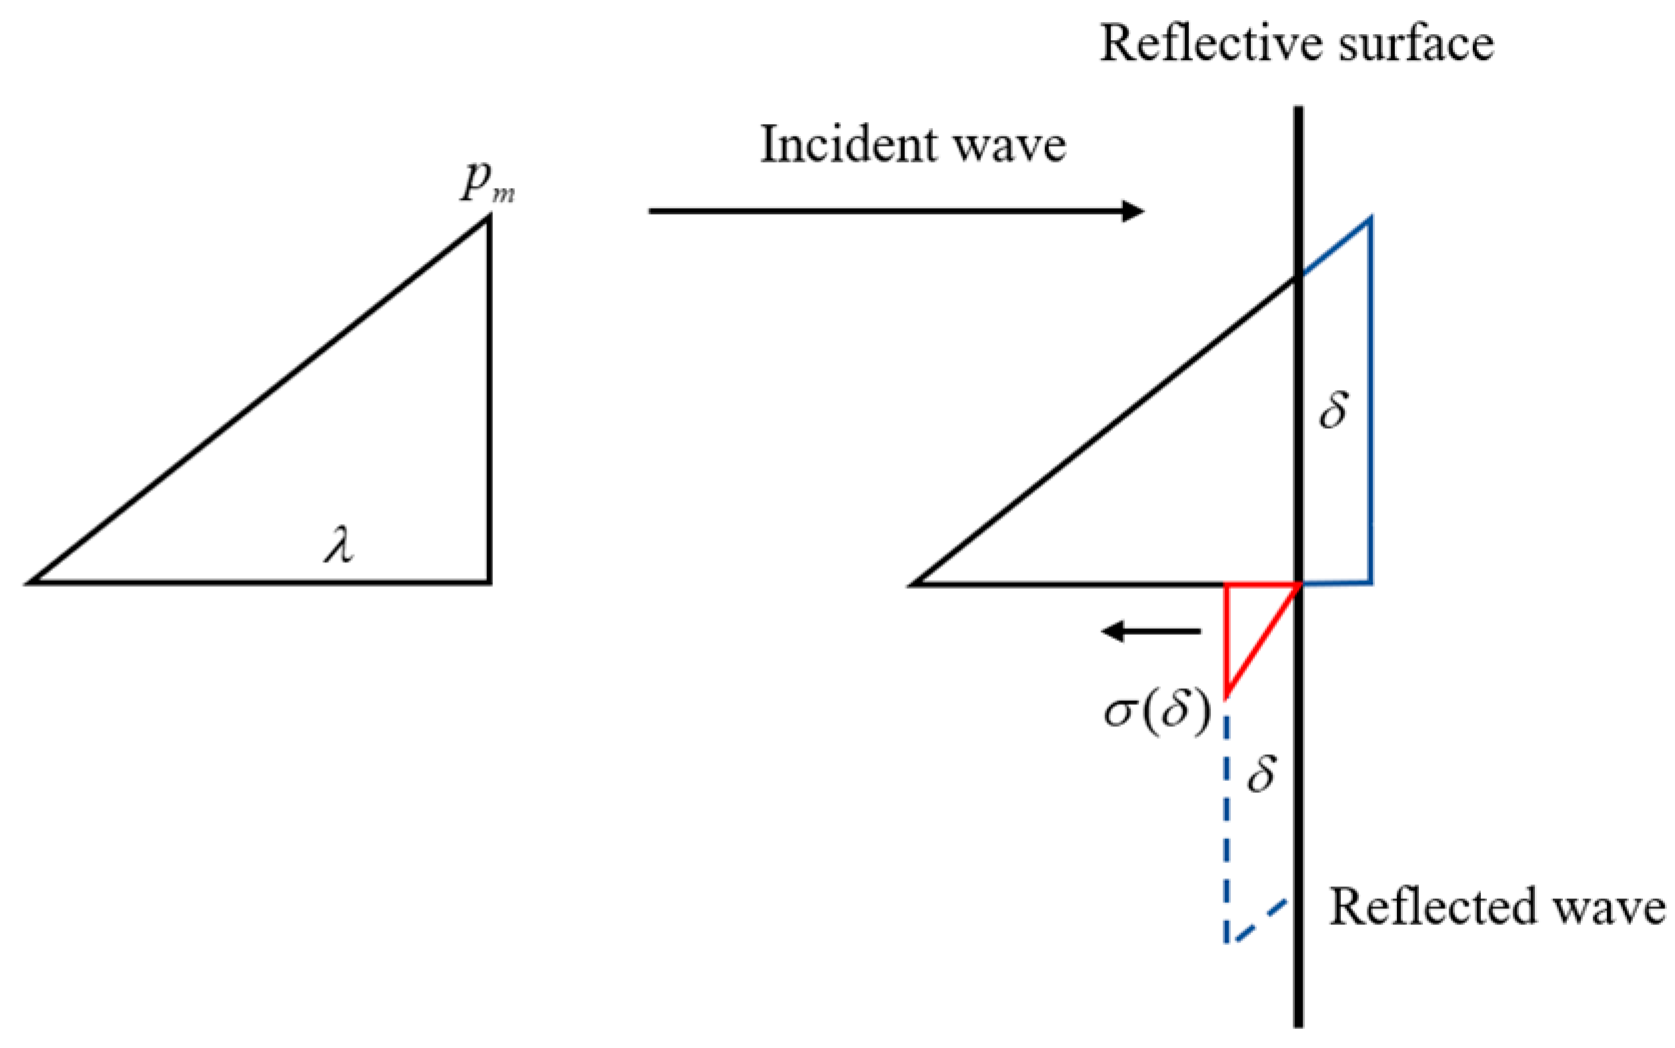
The compressive wave propagates through the column and reflects as a rarefaction wave at the bottom and lateral face. When the tensile stress acting on the lateral and bottom concrete of the column exceeds the dynamic tensile strength, it leads to tensile failure, resulting in cracking and spalling. It is assumed that the incident wave is a triangular load, with the load form shown in Figure 23, and complete reflection occurs at the interface.
The moment when the incident wave reaches the interface is designated as time zero, and the relative coordinate at time t is C 0 t . The pressure time–history curve at the interface is represented by Equation (27):
p t = p m 1 C 0 t λ
Assuming that the first spalling occurs at distance δ from the interface, δ is the depth of the spalling. The tensile stress wave at the interface is denoted by p m , and the compressive stress wave is p 2 δ / C . Therefore, the net tensile stress σ ( δ ) at the interface can be obtained, as shown in Equation (28):
σ ( δ ) = p m p m ( 1 2 δ λ ) = p m 2 δ λ
When the tensile stress exceeds the dynamic tensile strength of the concrete, σ t d , spalling occurs, and Equation (29) can be used to calculate the collapse depth.
δ = λ σ t d 2 p m
After the first spalling, the peak value of the triangular load changes to p m σ t d , and reflection and collapse occur again on the first spalling surface. The depth of the second spalling is shown in Equation (30).
δ 2 = λ 2 δ 2 σ t d p m σ t d = λ λ σ t d p m 2 σ t d p m σ t d = λ σ t d 2 p m = δ
The depth of each spalling can be inferred to be the same from Equation (30), and the amount of spalling is the maximum integer smaller than p m / σ t d .
The relationship between the stress wavelength λ and the temporal pulse length τ can be defined by the sound velocity, C 0 , through Equation (31). The pulse duration of the detonation wave can be approximated as l / 2 D (surface center detonation). The pulse length in the concrete changes because of different wave propagation velocities in the concrete and explosive. Therefore, the initial pulse length τ 0 can be determined, as shown in Equation (32).
λ = C 0 τ
τ 0 = l 2 D u s D = l u s 2 D 2
Reference [41] introduced a method of calculating the pulse length in concrete, as shown in Equations (33) and (34):
τ 1 = τ 0 + x ( 1 C 0 1 u s )
τ 2 = τ 1 x x 1
where τ 1 is the pulse length of the shock wave with a magnitude greater than lockup pressure, x is the propagation distance from the impacted face, τ 2 is the pulse length of a stress wave with a magnitude smaller than lockup pressure, and x 1 is the propagation distance at the location where the pressure is equal to the lockup pressure.
Owing to attenuation during propagation, the strain rate on the side and bottom of the concrete is significantly lower than on the blasting face. Riedel et al. [39] investigated the response of concrete under a range of dynamic scenarios, pointing out that the tensile strain rate after wave reflection is two orders of magnitude smaller than the compressive strain rate under contact explosion, about 102 to 103 s−1. According to Equations (7)–(9), the DIF for concrete dynamic tensile strength can be determined as five.
Furthermore, attenuation occurs through the transmission of the reinforcement cross-section, and the spalling depth can be subsequently calculated. If only one spalling occurs, its depth corresponds to the thickness of the sum of the concrete protective layer and the longitudinal reinforcement.

4.3. Verification of the Predictive Model

By neglecting the influence of column length on local damage, damage to RC columns under contact explosion conditions with different explosive masses of explosives can be predicted. The results are shown in Table 4, the center of the explosive coincides with the cross-section of the transverse reinforcement under all conditions.
Based on the predicted results and accounting for the attenuation of the transverse reinforcement, the damaged section can be calculated and compared with the experimental results, as shown in Figure 24. The error between the depth of the carter and spalling calculated by the prediction model and the experimental results is less than 20%. When the contact area of the explosive remains constant, increasing the height (and, thus, the mass) of the explosive results in a small increase in damage to the column, consistent with the experimental observations. Comparing the predicted results with the experimental results, the results accurately predict contact explosion damage. Changing the shape of the explosive (contact area) will significantly increase damage to the column. Although the shape gain of the explosive is considered in the prediction model, this gain is still relatively conservative.
According to the cross-section of the initial explosion body for the first three working conditions presented in Table 4, as shown in Figure 25, maintaining a constant contact surface while increasing the height of the explosives gradually decreases the increase in the initial explosion body.
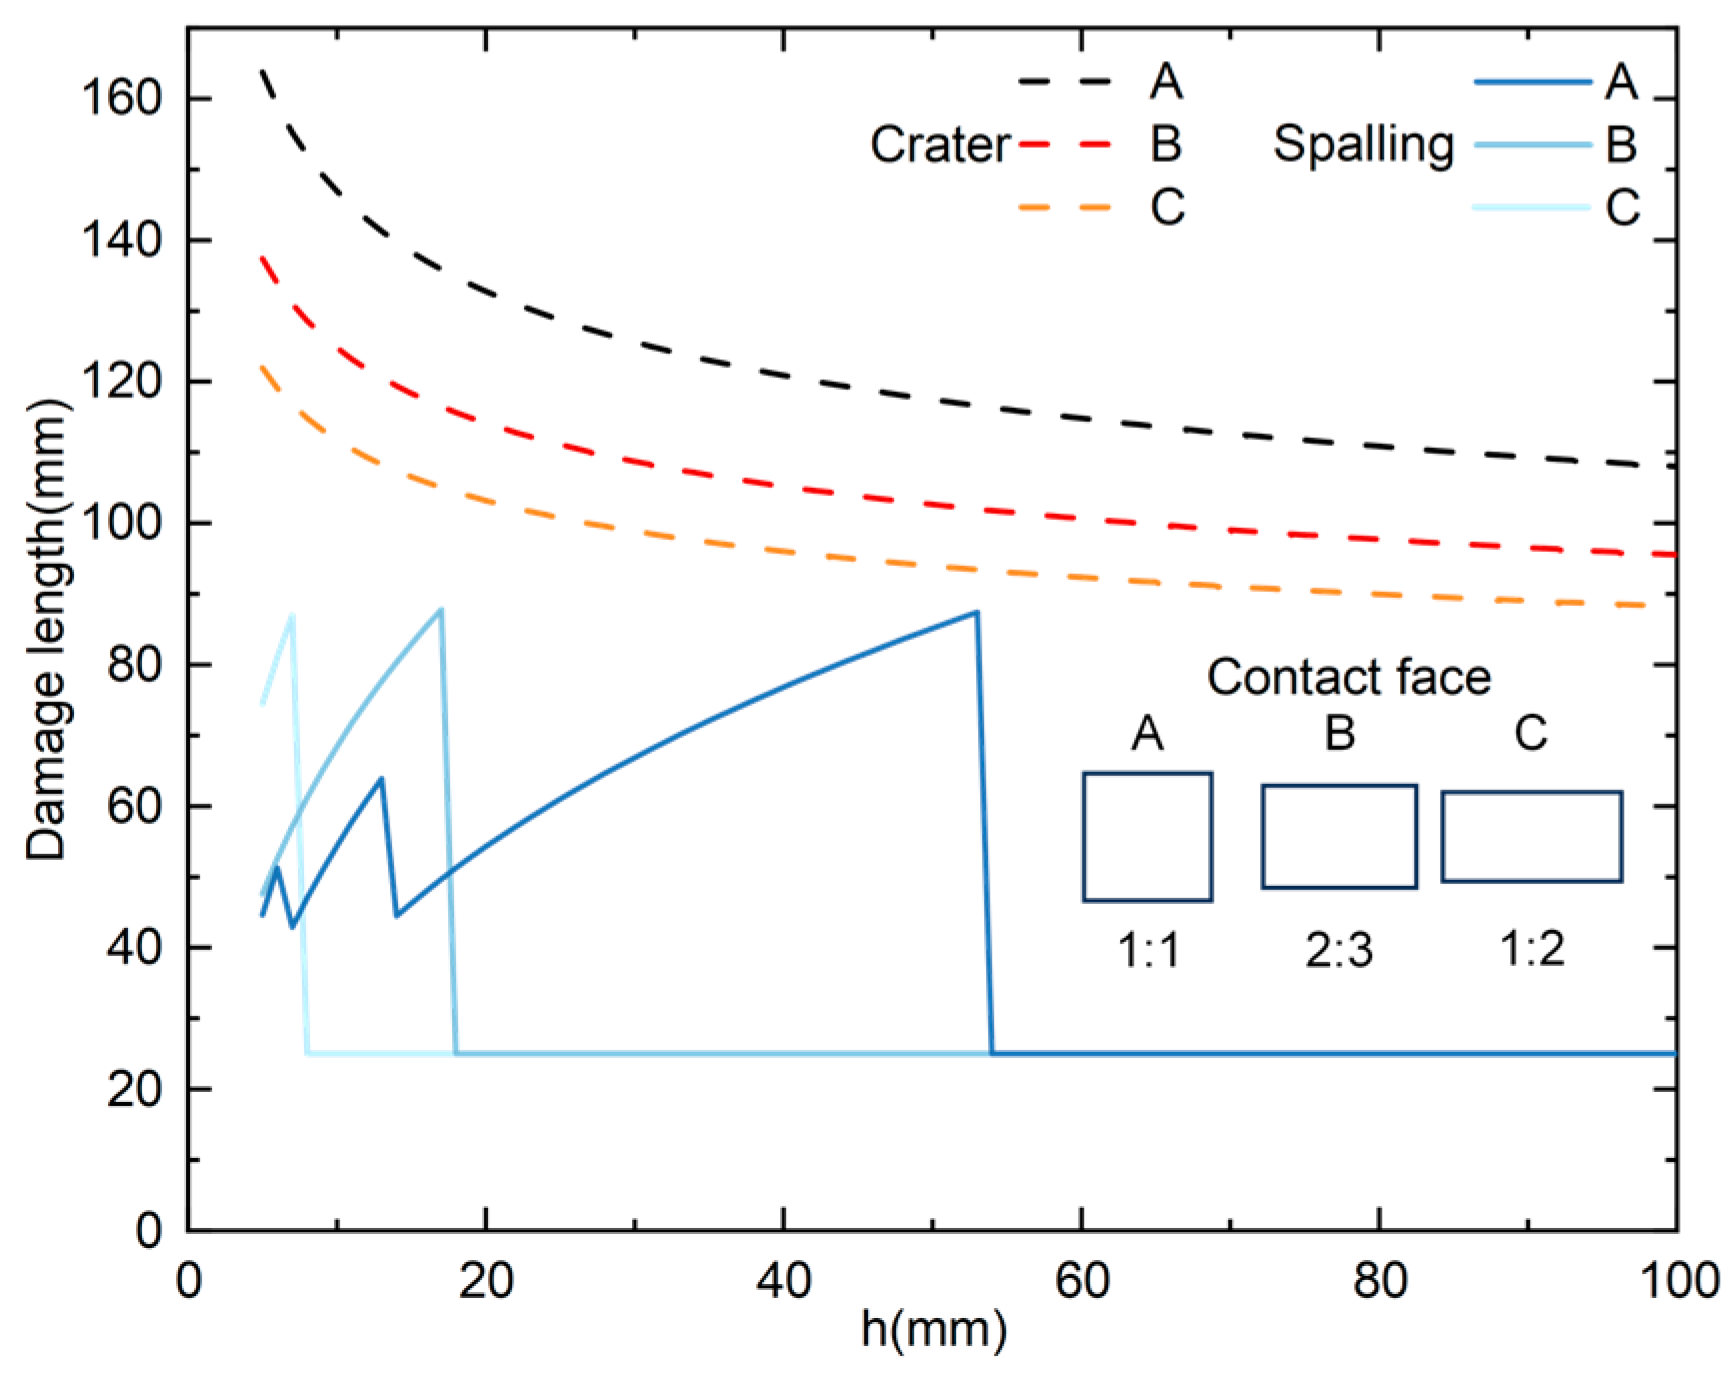
Figure 26 shows the variation in crater and spalling depth with charge height for different cross-sectional sizes while maintaining a constant explosive mass of 0.4 kg. At different cross-sectional sizes, the depth of the crater gradually decreases as the charge height increases, while the depth of the spalling suddenly decreases as the charge height increases. Owing to the increased charge height, an increase in the wavelength of the stretching wave results in a greater spalling depth for the same amount of spalling. However, as the charge height continues to increase, the peak value of the tensile wave gradually decreases, reducing the amount of spalling and suddenly decreasing the spalling depth.

5. Conclusions

This study conducted explosion tests on 17 RC columns to investigate the impact of various factors on local damage to RC columns. A finite element model was established to assess the effects of different explosive sizes and positions, as well as transverse reinforcement spacing, on local damage to columns. Finally, a prediction model for local damage to RC columns subjected to contact explosions was developed, considering the shape, position, and reinforcing effect of transverse reinforcement. The findings of this study can be summarized as follows:
  • Increasing the concrete strength by 10 MPa (C30 to C40) does not substantially improve the blast resistance of RC columns, while increasing the blast height by 100 mm substantially reduces the local damage suffered by RC columns.
  • When the axial load is 50 kN, the concrete constraint effect is enhanced because of the axial load, and the peeling surface of the side concrete protective layer is basically flush with the stirrup. A comparison of two tests, namely, C30-S-0.4-0-50 and C30-S-0.4-0-75, revealed that when the axial load is increased to 75 kN, the damage to the column is intensified. While the standoff is 100 mm, increasing the axial load can effectively reduce the damage to the center of the column surface.
  • When the concrete in the core area is damaged, a clear correlation with the transverse reinforcement exists. The numerical simulation results indicate that the reinforcement effect diminishes when the distance between the transverse reinforcement and the explosive is reduced. Consequently, the local damage at 80 mm spacing is less than that at 70 mm. Based on the numerical simulation analyzing the shock wave attenuation in the transverse reinforcement, we can conclude that the transverse reinforcement arrangement affects the length of damage.
  • The attenuation coefficient of the concrete transverse reinforcement section, derived from a one-dimensional stress wave calculation model, is 0.6. After accounting for the attenuation effects in the transverse reinforcement section, the model can accurately simulate the concrete protective layer on the back blasting surface spalling while the concrete core remains intact when the RC column does not experience penetration damage.
  • The damage prediction model for RC columns developed in this study can accurately forecast local damage caused by contact explosions, with an error margin of no more than 20% compared with experimental results. The model accounts for the shape gain of explosives; however, this gain is still somewhat conservative and has not been systematically validated concerning the reinforcement and material strength of reinforced concrete structures. Consequently, the applicability of this model to other contact explosion scenarios remains unverified.

Author Contributions

Conceptualization, Q.W. and X.J.; methodology, Q.W.; software, Q.W.; validation, Q.W., X.J. and T.C.; investigation, Q.W.; data curation, T.C.; writing—original draft preparation, Q.W.; writing—review and editing, X.J. and Z.H.; visualization, Q.W. and Y.S.; supervision, Z.H. All authors have read and agreed to the published version of the manuscript.

Funding

The study was funded by National Natural Science Foundation of China (Grant No. 12372360). The study was supported by “the Fundamental Research Funds for the Central Universities” No. 30922010906.

Data Availability Statement

All data, models that support the findings of this study are available from the corresponding author upon reasonable request.

Conflicts of Interest

The authors declare no conflicts of interest.

References

  1. Dua, A.; Braimah, A.; Kumar, M. Contact explosion response of RC columns: Experimental and numerical investigation. Proc. Inst. Civ. Eng.-Struct. Build. 2020, 173, 799–820. [Google Scholar] [CrossRef]
  2. ASCE Blast Protection of Buildings; American Society of Civil Engineers, Structural Engineering Institute: Reston, VA, USA, 2011.
  3. Shin, J.; Whittaker, A.S.; Cormie, D.; Wilkinson, W. Numerical modeling of close-in detonations of high explosives. Eng. Struct. 2014, 81, 88–97. [Google Scholar] [CrossRef]
  4. Hyde, D.W. Microcomputer Programs CONWEP and FUNPRO, Applications of TM 5-855-1, ‘Fundamentals of Protective Design for Conventional Weapons’ (User’s Guide); US Army Engineer Waterways Experiment Station: Vicksburg, MS, USA, 1988. [Google Scholar]
  5. Sherkar, P.; Shin, J.; Whittaker, A.; Aref, A. Influence of charge shape and point of detonation on blast-resistant design. J. Struct. Eng. 2016, 142, 04015109. [Google Scholar] [CrossRef]
  6. Dua, A.; Braimah, A.; Kumar, M. Contact explosion response of reinforced concrete columns: Experimental and validation of numerical model. Build. Tomorrow Soc. 2018, 173, 1–10. [Google Scholar]
  7. Dua, A.; Braimah, A.; Kumar, M. Experimental and numerical investigation of rectangular reinforced concrete columns under contact explosion effects. Eng. Struct. 2020, 205, 109891. [Google Scholar] [CrossRef]
  8. Mejía, N.; Peralta, R.; Tapia, R.; Durán, R.; Sarango, A. Damage assessment of RC columns under the combined effects of contact explosion and axial loads by experimental and numerical investigations. Eng. Struct. 2022, 254, 113776. [Google Scholar] [CrossRef]
  9. Cai, R.; Li, Y.; Zhang, C.; Cao, H.; Qi, H.; Mao, J. Size effect on reinforced concrete slabs under direct contact explosion. Eng. Struct. 2022, 252, 113656. [Google Scholar] [CrossRef]
  10. Yang, C.; Jia, X.; Huang, Z.; Zhao, L.; Shang, W. Damage of full-scale reinforced concrete beams under contact explosion. Int. J. Impact Eng. 2022, 163, 104180. [Google Scholar] [CrossRef]
  11. Chiquito, M.; López, L.M.; Castedo, R.; Santos, A.P.; Pérez-Caldentey, A. Full-Scale Field Tests on Concrete Slabs Subjected to Close-In Blast Loads. Buildings 2023, 13, 2068. [Google Scholar] [CrossRef]
  12. Kyei, C.; Braimah, A. Effects of transverse reinforcement spacing on the response of reinforced concrete columns subjected to blast loading. Eng. Struct. 2017, 142, 148–164. [Google Scholar] [CrossRef]
  13. Riedel, W.; Thoma, K.; Hiermaier, S.; Schmolinske, E. Penetration of reinforced concrete by BETA-B-500 numerical analysis using a new macroscopic concrete model for hydrocodes. In Proceedings of the 9th International Symposium on the Effects of Munitions with Structures, Berlin-Strausberg, Germany, 3–4 May 1999; p. 315. [Google Scholar]
  14. Codina, R.; Ambrosini, D.; de Borbón, F. Experimental and numerical study of a RC member under a close-in blast loading. Eng. Struct. 2016, 127, 145–158. [Google Scholar] [CrossRef]
  15. Abladey, L.; Braimah, A. Near-field explosion effects on the behaviour of reinforced concrete columns: A numerical investigation. Int. J. Prot. Struct. 2014, 5, 475–499. [Google Scholar] [CrossRef]
  16. Yan, J.; Liu, Y.; Xu, Z.; Li, Z.; Huang, F. Experimental and numerical analysis of CFRP strengthened RC columns subjected to close-in blast loading. Int. J. Impact Eng. 2020, 146, 103720. [Google Scholar] [CrossRef]
  17. Shi, Y.; Hao, H.; Li, Z.X. Numerical derivation of pressure–impulse diagrams for prediction of RC column damage to blast loads. Int. J. Impact Eng. 2008, 35, 1213–1227. [Google Scholar] [CrossRef]
  18. Hong, J.; Fang, Q.; Chen, L.; Kong, X. Numerical predictions of concrete slabs under contact explosion by modified K&C material model. Constr. Build. Mater. 2017, 155, 1013–1024. [Google Scholar]
  19. Astarlioglu, S.; Krauthammer, T.; Morency, D.; Tran, T.P. Behavior of reinforced concrete columns under combined effects of axial and blast-induced transverse loads. Eng. Struct. 2013, 55, 26–34. [Google Scholar] [CrossRef]
  20. Li, Q.M.; Meng, H. Pressure-impulse diagram for blast loads based on dimensional analysis and single-degree-of-freedom model. J. Eng. Mech. 2002, 128, 87–92. [Google Scholar] [CrossRef]
  21. Fallah, A.S.; Louca, L.A. Pressure–impulse diagrams for elastic-plastic-hardening and softening single-degree-of-freedom models subjected to blast loading. Int. J. Impact Eng. 2007, 34, 823–842. [Google Scholar] [CrossRef]
  22. Dragos, J.; Wu, C. A new general approach to derive normalised pressure impulse curves. Int. J. Impact Eng. 2013, 62, 1–12. [Google Scholar] [CrossRef]
  23. Rong, Q.; Zhao, Z.; Hou, X.; Jiang, Z. A P-I Diagram Approach for Predicting Dynamic Response and Damage Assessment of Reactive Power Concrete Columns Subjected to Blast Loading. Buildings 2022, 12, 462. [Google Scholar] [CrossRef]
  24. Yu, R.; Chen, L.; Fang, Q.; Yan, H.; Chen, G. Generation of pressure–impulse diagrams for failure modes of RC columns subjected to blast loads. Eng. Fail. Anal. 2019, 100, 520–535. [Google Scholar] [CrossRef]
  25. Park, G.K.; Kwak, H.G.; Filippou, F.C. Evaluation of nonlinear behavior and resisting capacity of reinforced concrete columns subjected to blast loads. Eng. Fail. Anal. 2018, 93, 268–288. [Google Scholar] [CrossRef]
  26. Zhu, W.; Yang, C.; Yin, T.; Jia, J.; Yu, J.; Song, J. Blast resistant performance and damage mechanism of steel reinforced concrete beams under contact explosion. Eng. Struct. 2024, 315, 118472. [Google Scholar] [CrossRef]
  27. Holgado, D.; Mourão, R.; Montalva, A.; Florek, J. On the Assessment of Reinforced Concrete (RC) Walls under Contact/Near-Contact Explosive Charges: A Deep Neural Network Approach. Buildings 2024, 14, 2683. [Google Scholar] [CrossRef]
  28. Deng, G.; Yu, X. Numerical study on the case effect of a bomb air explosion. Def. Technol. 2021, 17, 1461–1470. [Google Scholar] [CrossRef]
  29. Gao, C.; Kong, X.-Z.; Fang, Q.; Hong, J.; Wang, Y. Numerical investigation on free air blast loads generated from center-initiated cylindrical charges with varied aspect ratio in arbitrary orientation. Def. Technol. 2022, 18, 1662–1678. [Google Scholar] [CrossRef]
  30. Bai, C.; Zhao, X.; Yao, J.; Sun, B.-F. Numerical investigation of the shockwave overpressure fields of multi-sources FAE explosions. Def. Technol. 2021, 17, 1168–1177. [Google Scholar] [CrossRef]
  31. Cui, J.; Shi, Y.; Li, Z.X.; Chen, L. Failure analysis and damage assessment of RC columns under close-in explosions. J. Perform. Constr. Facil. 2015, 29, B4015003. [Google Scholar] [CrossRef]
  32. Bischoff, P.H.; Perry, S.H. Compressive behaviour of concrete at high strain rates. Mater. Struct. 1991, 24, 425–450. [Google Scholar] [CrossRef]
  33. Malvar, L.J.; Crawford, J.E.; Wesevich, J.W.; Simons, D. A plasticity concrete material model for DYNA3D. Int. J. Impact Eng. 1997, 19, 847–873. [Google Scholar] [CrossRef]
  34. Comité Euro-International du Béton. CEB-FIP Model Code 1990: Design Code; Thomas Telford Publishing: London, UK, 1993. [Google Scholar]
  35. Malvar, L.J.; Crawford, J.E. Dynamic increase factors for concrete. DTIC Doc. 1998, 1, 1–6. [Google Scholar]
  36. Fujikake, K.; Aemlaor, P. Damage of reinforced concrete columns under demolition blasting. Eng. Struct. 2013, 55, 116–125. [Google Scholar] [CrossRef]
  37. Henrych, J.; Abrahamson, G.R. The dynamics of explosion and its use. J. Appl. Mech. 1980, 47, 218. [Google Scholar] [CrossRef]
  38. Yang, C.; Huang, Z.; Jia, X.; Shang, W.; Chen, T. Analytical model for predicting localized damage in RC beams under contact explosion. Int. J. Impact Eng. 2024, 185, 104870. [Google Scholar] [CrossRef]
  39. Riedel, W. Beton Unter Dynamischen Lasten: Meso-Und Makromechanische Modelle und Ihre Parameter; EMI: London, UK, 2000. [Google Scholar]
  40. Tu, H.; Fung, T.C.; Tan, K.H.; Riedel, W. An analytical model to predict the compressive damage of concrete plates under contact detonation. Int. J. Impact Eng. 2019, 134, 103344. [Google Scholar] [CrossRef]
  41. Tu, H.; Fung, T.C.; Tan, K.H.; Riedel, W. An analytical model to predict spalling and breaching of concrete plates under contact detonation. Int. J. Impact Eng. 2022, 160, 104075. [Google Scholar] [CrossRef]
Figure 1. RC column configuration.
Buildings 14 03229 g001
Figure 2. Sizes of TNT charges.
Buildings 14 03229 g002
Figure 3. Experimental layout.
Buildings 14 03229 g003
Figure 4. Experimental case designation.
Buildings 14 03229 g004
Figure 5. Measurement of RC column damage.
Buildings 14 03229 g005
Figure 6. Comparison between the C30 and C40 columns.
Buildings 14 03229 g006
Figure 7. Damage data from columns. (a) Comparison of concrete strength. (b) Comparison of mass of charge.
Buildings 14 03229 g007
Figure 8. Influence of standoff distance on damage to the columns.
Buildings 14 03229 g008
Figure 9. Influence of axial load on damage to the columns.
Buildings 14 03229 g009
Figure 10. Different charge masses.
Buildings 14 03229 g010
Figure 11. Restriction of stirrups on concrete core damage.
Buildings 14 03229 g011
Figure 12. Damage data from columns.
Buildings 14 03229 g012
Figure 13. Numerical simulation results.
Buildings 14 03229 g013
Figure 14. Damage results.
Buildings 14 03229 g014
Figure 15. Damaged index of different TNT masses. (a) Comparison of concrete strengths. (b) Comparison of charge masses.
Buildings 14 03229 g015
Figure 16. Displacement time–history curves.
Buildings 14 03229 g016
Figure 17. Different explosive positions.
Buildings 14 03229 g017
Figure 18. Different stirrup distance numerical simulation results.
Buildings 14 03229 g018
Figure 19. Impulse action surface and explosive contact surface.
Buildings 14 03229 g019
Figure 20. Local failures in the RC column under contact explosion conditions.
Buildings 14 03229 g020
Figure 21. Local damage constrained by transverse reinforcement.
Buildings 14 03229 g021
Figure 22. Propagation of one-dimensional stress waves in composite media.
Buildings 14 03229 g022
Figure 23. Reflection of triangular loads at interfaces.
Buildings 14 03229 g023
Figure 24. Comparison between predicted results and experiments.
Buildings 14 03229 g024
Figure 25. Initial explosion body.
Buildings 14 03229 g025
Figure 26. Crater and spalling depth.
Buildings 14 03229 g026
Table 1. Design value of axial bearing capacity.
Length
(mm)
ϕ f d c
(N/mm2)
f c
(N/mm2)
f y
(N/mm2)
A
(mm2)
A s
(mm2)
Design Value of Axial Load (kN)
13501.014.33036048,40012301000
16.7401250
25000.9514.330950
16.7401188
Table 2. Results after explosions.
GroupDesignation D f (mm) D b (mm) L r (mm)
StandoffC30-S-0.4-200-0220//
C40-S-0.4-100-0490270/
C40-S-0.4-150-0///
Axial load and concrete strengthC30-L-0.4-100-25380390/
C30-L-0.4-100-50440440/
C30-L-0.4-100-75490360/
C40-L-0.4-100-0440350/
C40-L-0.4-100-25450220/
TNT mass and axial loadC30-S-0.6-0-0620650310
C30-S-0.4-0-50550570260
C30-S-0.4-0-75610620260
C40-S-0.2-0-0560580205
C40-S-0.4-0-0500560250
TNT mass and concrete strengthC30-L-0.4-0-0510590230
C40-L-0.4-0-0540580240
C40-L-0.6-0-0540630250
C40-L-0.8-0-0740780350
Table 3. Material parameters.
Material TypeMaterial ModelMain Parameters
ExplosiveMAT_HIGH_EXPLOSIVE_BURNρ/(g/cm3)C/(m/s)A/GPaB/Gpa
1.636930373.773.75
R1R2ωE0/KJ/m3
4.50.90.356.0 × 106
ConcreteMAT_CONCRETE_DAMAGE_REL3ρ/(g/cm3)A0 (MPa)UCFLCRATE
2.3−30/−40145723
RSIZE (MPa)Failure strain
39,3700.015
ReinforcementMAT_PLASTIC_KINEMATICρ/(g/cm3)E/GPaνσy
7.82070.3400
Table 4. Damage prediction results.
Mass of TNT (kg)Size of Charge
b × l × h (mm)
Size of Initial Explosion Body a 1 × b 1 (mm)Depth of Compressive Damage (mm)Reflected Wave (MPa)Depth of Spalling (mm)
0.250 × 100 × 2586 × 4310025.825
0.450 × 100 × 5096 × 4810528.825
0.650 × 100 × 75102 × 5110830.625
0.675 × 100 × 5087 × 651223678
0.8100 × 100 × 5079 × 791364593
Disclaimer/Publisher’s Note: The statements, opinions and data contained in all publications are solely those of the individual author(s) and contributor(s) and not of MDPI and/or the editor(s). MDPI and/or the editor(s) disclaim responsibility for any injury to people or property resulting from any ideas, methods, instructions or products referred to in the content.