Abstract
The growth in per capita consumption levels and the e-commerce industry have shifted the shopping mall model from a product consumption to a time-based consumption focus. This paper evaluates customer satisfaction with shopping malls using an importance–performance questionnaire, which identified eight key areas for improvement. Through field surveys and virtual reality (VR) simulation experiments, the impact of the components of public spaces within shopping malls on user satisfaction was assessed using both quantifiable and unquantifiable elements. Our findings inform the formulation of optimization design strategies in the areas of multipurpose functionality of facilities, intensification of boundaries, complexity of functions, and integration of resources, and have implications for the future design of internal public spaces in shopping malls.
1. Introduction
At present, most shopping malls focus on improving commercial value in the early stages of design and pay insufficient attention to user space satisfaction, resulting in a lack of rational planning and design of indoor public spaces. Specifically, design deficiencies manifest as unreasonable layouts, poor space quality, and a lack of functional diversity, experiential interactivity, flexibility, and sociability, which not only hinder resting behavior but also compromise the creation of a pleasing spatial environmental ambience. Therefore, optimization of indoor public spaces is urgently needed. Reflecting on the current situation of shopping malls and in accordance with the context of the times and the objective need for spatial optimization, this study examines the non-compulsory consumer public space planned and operated by mall managers, specifically referring to path-based public space characterized by a high degree of sharing and openness. This study aims to explore methods for optimizing public spaces inside shopping malls through a modern experiential business model, with the objective of enhancing the overall spatial experience and thereby rectifying the existing design deficiencies.
1.1. The Influence of User Satisfaction on the Economic Value of Shopping Malls
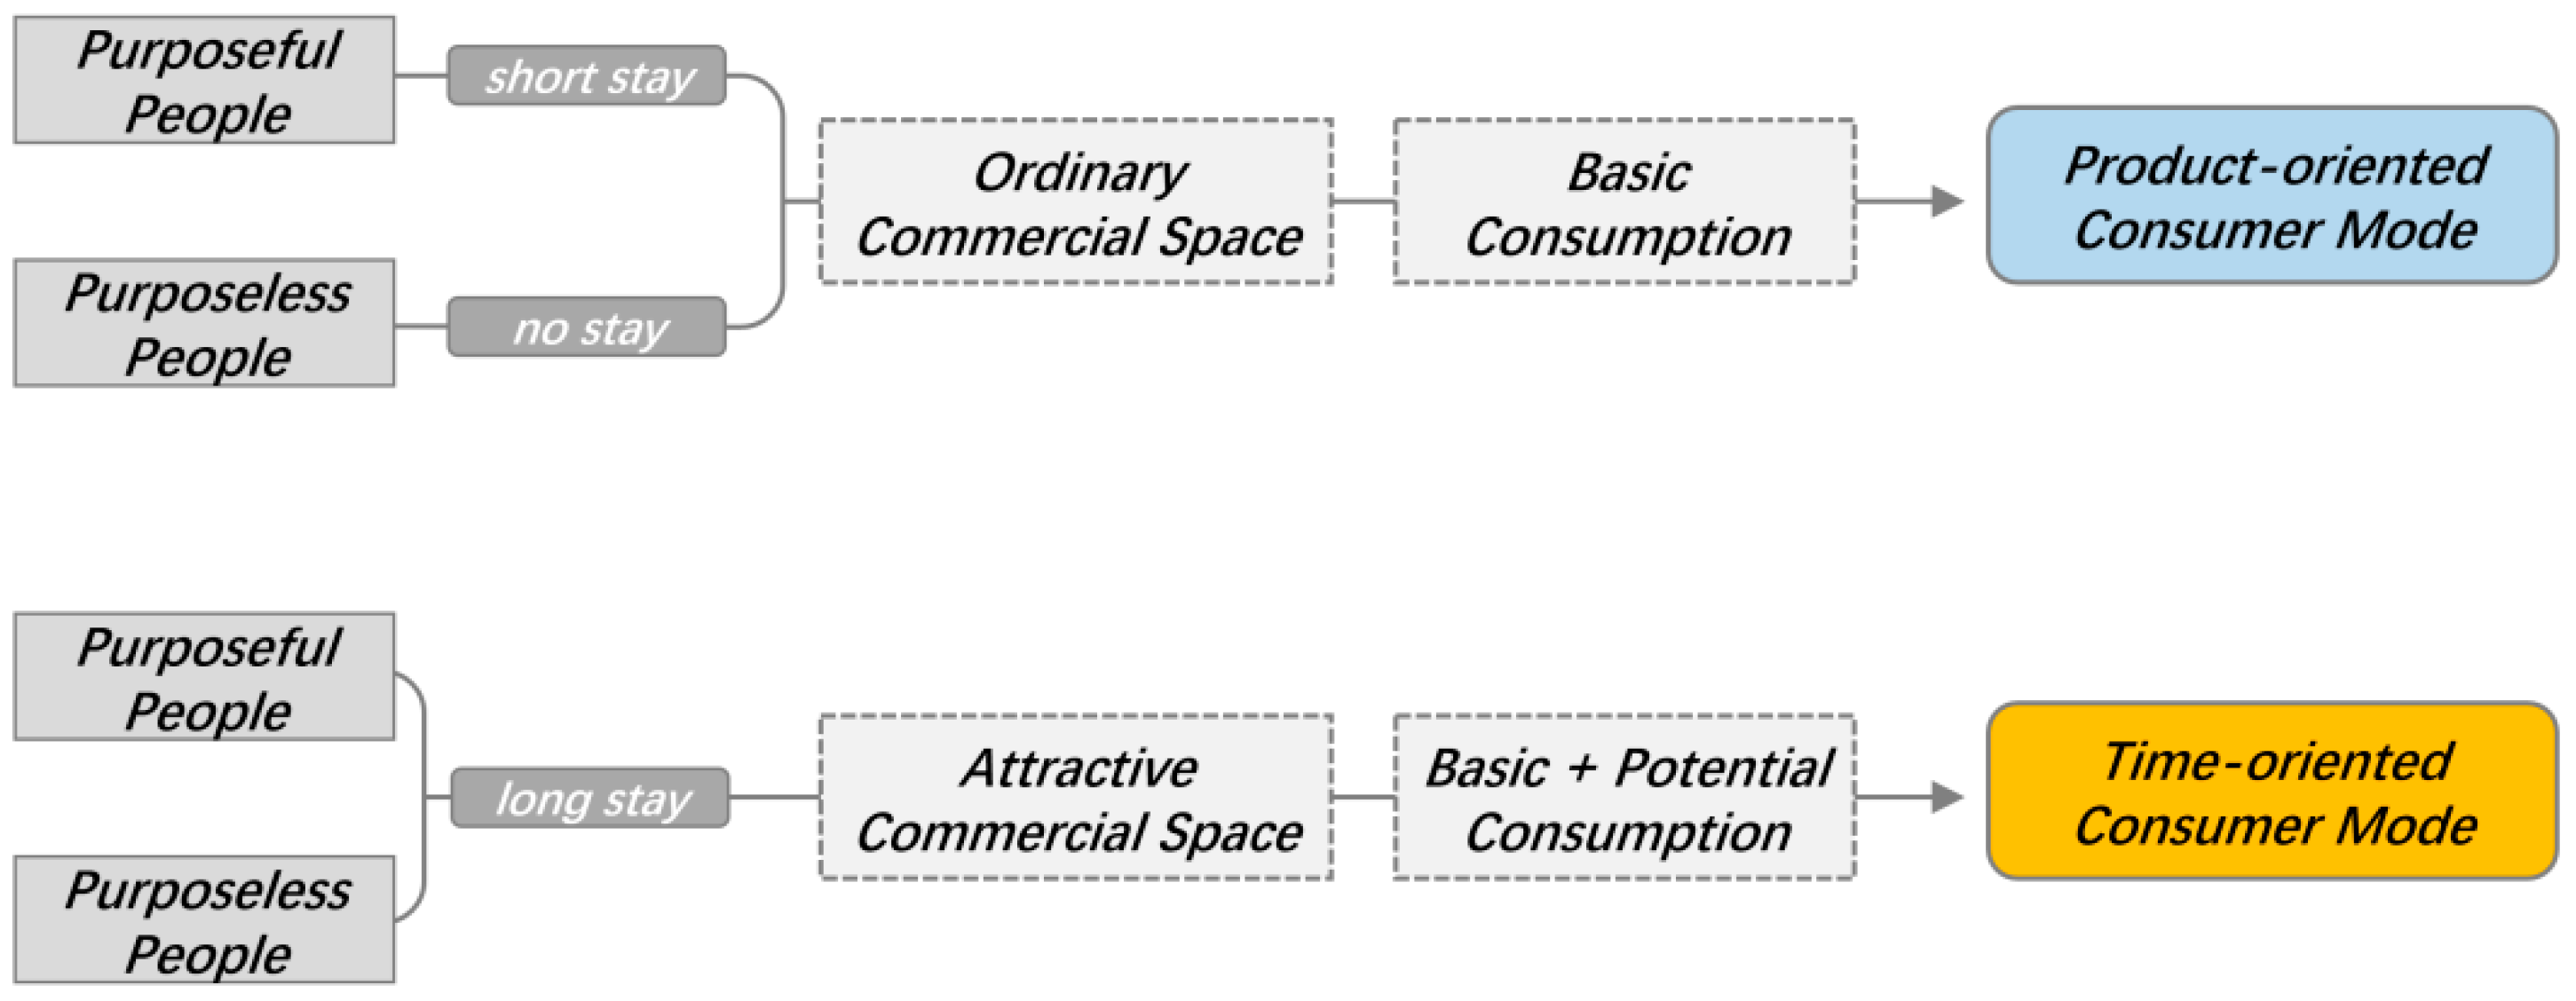
With the development of social economics and improvements in national income and expenditure, consumer shopping needs have gradually changed from “material enrichment” to “spiritual enrichment”. The market trend of consumption upgrading has prompted modern shopping malls, to meet the consumer’s pursuit of spiritual enjoyment of shopping by creating a commercial space with the concept of “time-oriented consumption” (Figure 1), a modern consumption feature in which “service” and “time” greatly influence users’ consumption decisions [1]. This necessitates the reinforcement of functional diversity, experiential interactivity, flexibility and adaptability, and sociability of the public spatial configuration of shopping. These are important because the improvement of user satisfaction with the commercial space has a positive role in promoting the economic value of the shopping mall, facilitating customers’ increased stay time, increasing the frequency of space use, and improving the environmental evaluation of shopping mall services. In turn, this promotes guidance of passenger flow, enhancing the visibility of publicity information, and the popularity of the shopping mall. These will eventually enhance its rent and advertising revenue and achieve a balance between space efficiency and quality (Figure 2).
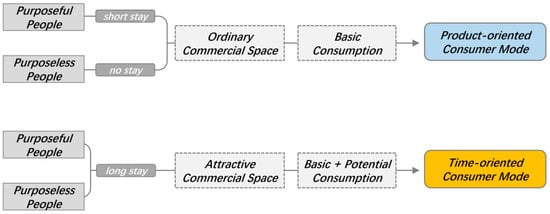
Figure 1.
Differences between product-oriented and time-oriented consumption.

Figure 2.
The logic of the business value of interior public space satisfaction enhancement.
1.2. Literature Review of Virtual Reality Technology in the Field of Architecture
Since the 1990s, Western scholars have introduced virtual reality (VR) technology into urban planning, architectural spatial cognition, and behavioral experiments, gradually confirming the validity and reliability of experimental results. Studies of architectural spatial cognition can be broadly classified into two types: visual perception and spatial memory studies, and spatial behavior studies.
In 1997, Ruddle et al.’s extended navigation experiment with a non-immersive virtual environment demonstrated that participants in the virtual environment had similar abilities in directional judgments and distance perception as those in real space after adapting to and overcoming initial disorientation during the experiment [2]. In 2001, Bishop et al. explored the feasibility of landscape experience assessment for public behavior analysis in a virtual environment and proposed preliminary experiments [3]; in the same year, they completed an experimental study of paths [4]. In 2006, Zacharias examined the relationship between environmental preferences and spatial behavior using VR demonstrations, and found no differences in path selection between human responses to real urban environments and VR demonstrations, while most of the choices focused on expressing environmental preferences [5]. In 2008, Meilinger et al. investigated the working memory system and visual influence mechanisms involved in human wayfinding behavior through simulated virtual urban space walking experiments [6]. In 2015, Felnhofer et al. demonstrated that virtual environments can normally elicit happy, bored, anxious, and other emotional responses, through comparative experiments with virtual park scenarios [7]. In 2017, Deb et al. developed a novel pedestrian simulator using VR technology and experimentally confirmed that participants’ motor behavior conformed to real-world norms and produced correct subjective responses in VR scenarios developed with HTC VIVE head-mounted display devices and the Unity 3D development platform [8]. In the same year, the finding that the memory and executive performance of emissaries in multitasking virtual scenarios were similar to those of traditional paper-and-pencil measures of memory was confirmed in a study by Parsons et al. [9]. In 2018, Siegrist et al. confirmed through simulated roaming experiments with eye-tracking data that in VR environments, consumer information seeking and behavioral decision-making do not differ significantly from those in real-world settings, and concluded that VR can be an effective tool for conducting consumer behavior experiments in empirical studies [10]. In 2020, Cai conducted research into the application of immersive VR technology within the interior decoration of folk houses, establishing a theoretical foundation for the enhancement of interior design through VR assistance. This underscores VR’s potential to revolutionize the interior design process [11]. Similarly, Pérez et al. explored the realm of 3D immersive learning in architecture and construction, accentuating the advantages of immersive technologies in educational contexts, thus highlighting VR’s educational applications [12]. In 2023, Hao et al. delved into the application of VR technology in landscape architecture, identifying Virtual Reality, Design, and System as international research hotspots within the field, thereby underscoring VR’s increasing relevance in architectural research [13]. In 2024, Ma et al. conducted analytical research using image processing to create architectural virtual scenes, emphasizing the potential of these scenes in architectural design and visualization, and thereby demonstrating VR’s value in design visualization [14].
After nearly 30 years of exploration and experimentation by scholars in various countries, the reliability of VR technology and virtual environment roaming experimental results has been confirmed. Compared to traditional space research methods, experimental research using a virtual space model demonstrates advantages in terms of operability, flexibility, and cost savings. This shows that VR technology has high research and application value. Virtual scene experiment results can effectively reflect the experience of participants in spatial cognition and behavior and guide the optimal design of architectural spaces.
1.3. Research Gaps in Shopping Mall Interior Public Space Satisfaction
Scholars have gradually developed their research on shopping mall design from the functional organization of internal spaces to the integration of space design with urban public life. In addition to traditional atriums, entrances, and sales spaces [15,16,17,18], there has been increasing research on service and experiential ways of designing atypical public spaces such as women’s spaces, hygiene spaces, and shared spaces [19,20,21]. With the recent development of technology and availability of advanced research equipment, interdisciplinary quantitative and experimental research methods have been widely applied in the scientific study of shopping malls. Many empirical studies on comprehensive commercial buildings use the results of statistical data analysis to guide spatial design methods and design recommendations in a scientifically sound manner [22]. The exploration of VR technology in the cognitive and interactive design of architectural spaces by experts over the past three decades has similarly confirmed the accuracy and reliability of the findings of this experimental approach in the field of design as well as its powerful flexibility, universality, and development [10,23,24].
VR experiments play a pivotal role in predicting user satisfaction outcomes. By utilizing VR technology to create virtual environments and simulate different spatial configuration scenarios, users can experience them in a virtual setting. This not only gathers extensive data on user behavior patterns and preferences but also accurately predicts the impact of different spatial configurations on user satisfaction. Specifically, VR experiments facilitate assessing the influence of different spatial layouts on user flow and dwell time, testing the enhancement effects of various facility configurations on user experiences and satisfaction, and predicting the promotional impact of different arrangements on user engagement and loyalty.
However, most studies on interior public spaces in shopping malls remain at the stage of traditional research on the current state of the space [16,25,26], and few scholars have focused on improving the quality of interior public spaces in shopping malls based on an evaluation of user space satisfaction [27]. Although the application of VR technology in the field of architectural space cognition research is maturing, the integration of VR simulation experiments with systematic theoretical investigation remains scarce. Traditional survey research methods, which primarily focus on explicitly articulated user needs and expectations, may fall short in effectively capturing potential factors that users may be unaware of or find challenging to precisely articulate, such as emotional factors, environmental ambiance, or unconscious preferences. This limitation underscores the need for innovative research approaches that harness the capabilities of VR technology and integrate quantitative and qualitative methods.
The current environment of indoor public spaces in shopping malls does not meet the needs of contemporary users, and there are realistic spatial motives for design optimization. To fill this gap in the existing research, this study:
- (1)
- Constructed a satisfaction evaluation system and conducted an importance–performance questionnaire survey to screen the space evaluation indices to be optimized;
- (2)
- Combined VR experiments and statistical analysis methods to obtain the relationship between satisfaction and design elements of interior public space in a shopping mall;
- (3)
- Proposed an analysis method that integrates both quantifiable and unquantifiable indicators to deeply analyze the underlying mechanism of satisfaction.
2. Satisfaction Factors for Interior Public Spaces
Human needs are constantly developing and being updated as society evolves, and can be divided into material and spiritual aspects. Maslow’s hierarchy of needs further divides human needs into five categories arranged from low to high levels in the hierarchy: physiology, security, social interaction, respect, and self-realization [28]. On this basis, scholars have divided needs into three levels in their analysis of public spaces: meeting basic physiological requirements, realizing passive personality development, and promoting active personality development [29]. From the perspective of spatial behavior theory, this conclusion can be summarized into two main levels: basic and advanced psychological needs [30,31]. Basic psychological needs include physiological needs, safety, accessibility, and convenience. Advanced psychological needs include comfort, privacy, and social needs. Considering the relatively low complexity of the behavior motivation and needs related to public activities in the shopping environment, and based on the above related research results, this study summarizes the use needs of public space in shopping malls into two levels: basic behavior needs and advanced psychological needs.
2.1. Basic Behavior Needs
Regarding the physical conditions of the place, basic behavior needs describe the basic-level requirements for meeting the use behavior and realizing the space function, which remain at the level of drawing people’s attention to the existence of space and using it effectively. The indoor public space of a shopping mall includes requirements for safety, comfort, and convenience.
- Security requirements are the basic premise for users to feel protected and choose to stay and carry out activities in the space. The safety of facilities and site conditions are conducive to relaxation through sitting and restful activities.
- Comfort is a necessary condition for the public rest space to enable “effective recovery of physical strength and relaxation of body and mind”. The comfort of seats and the improvement of other shared service facilities are the main considerations for the comfort of rest spaces. A public rest space in a commercial complex is a service-oriented space for shopping and commercial activities.
- The convenience of its location and connection with other public spaces should also be considered necessary basic considerations to ensure the efficiency of space use.
Therefore, basic behavioral needs can be divided into three dimensions: rest facilities, auxiliary facilities, and site conditions.
2.2. Advanced Psychological Needs
Advanced psychological needs refer to needs related to feelings and cognition in the commercial public space environment and can stimulate a sense of satisfaction and identity on the premise of guaranteeing basic needs related to rest. Specifically, these include the requirements for privacy, sociability, and aesthetics of public rest spaces.
- Compared to other activities, rest behavior is a relatively static and stable activity; therefore, users will have a sense of personal space and privacy needs for their environment.
- In modern commercial spaces characterized by entertainment experiences, people’s demand for social interaction and activity participation in public rest spaces is growing.
- A beautiful space can promote happy spiritual enjoyment, which represents the subjective aesthetic need of users during their stay and will affect people’s willingness to stay in the space and use time.
Advanced psychological needs can be divided into two dimensions: environmental and spiritual experience.
To facilitate implementation of the survey, the spatial evaluation indicators under the two demand levels were subdivided into 21 items. Their evaluation angles and meanings were supplemented and explained to enhance the effectiveness of the spatial evaluation, as shown in Table 1.

Table 1.
Satisfaction factors for interior public spaces and descriptions of their meanings.
3. Methodology
3.1. Work Flow
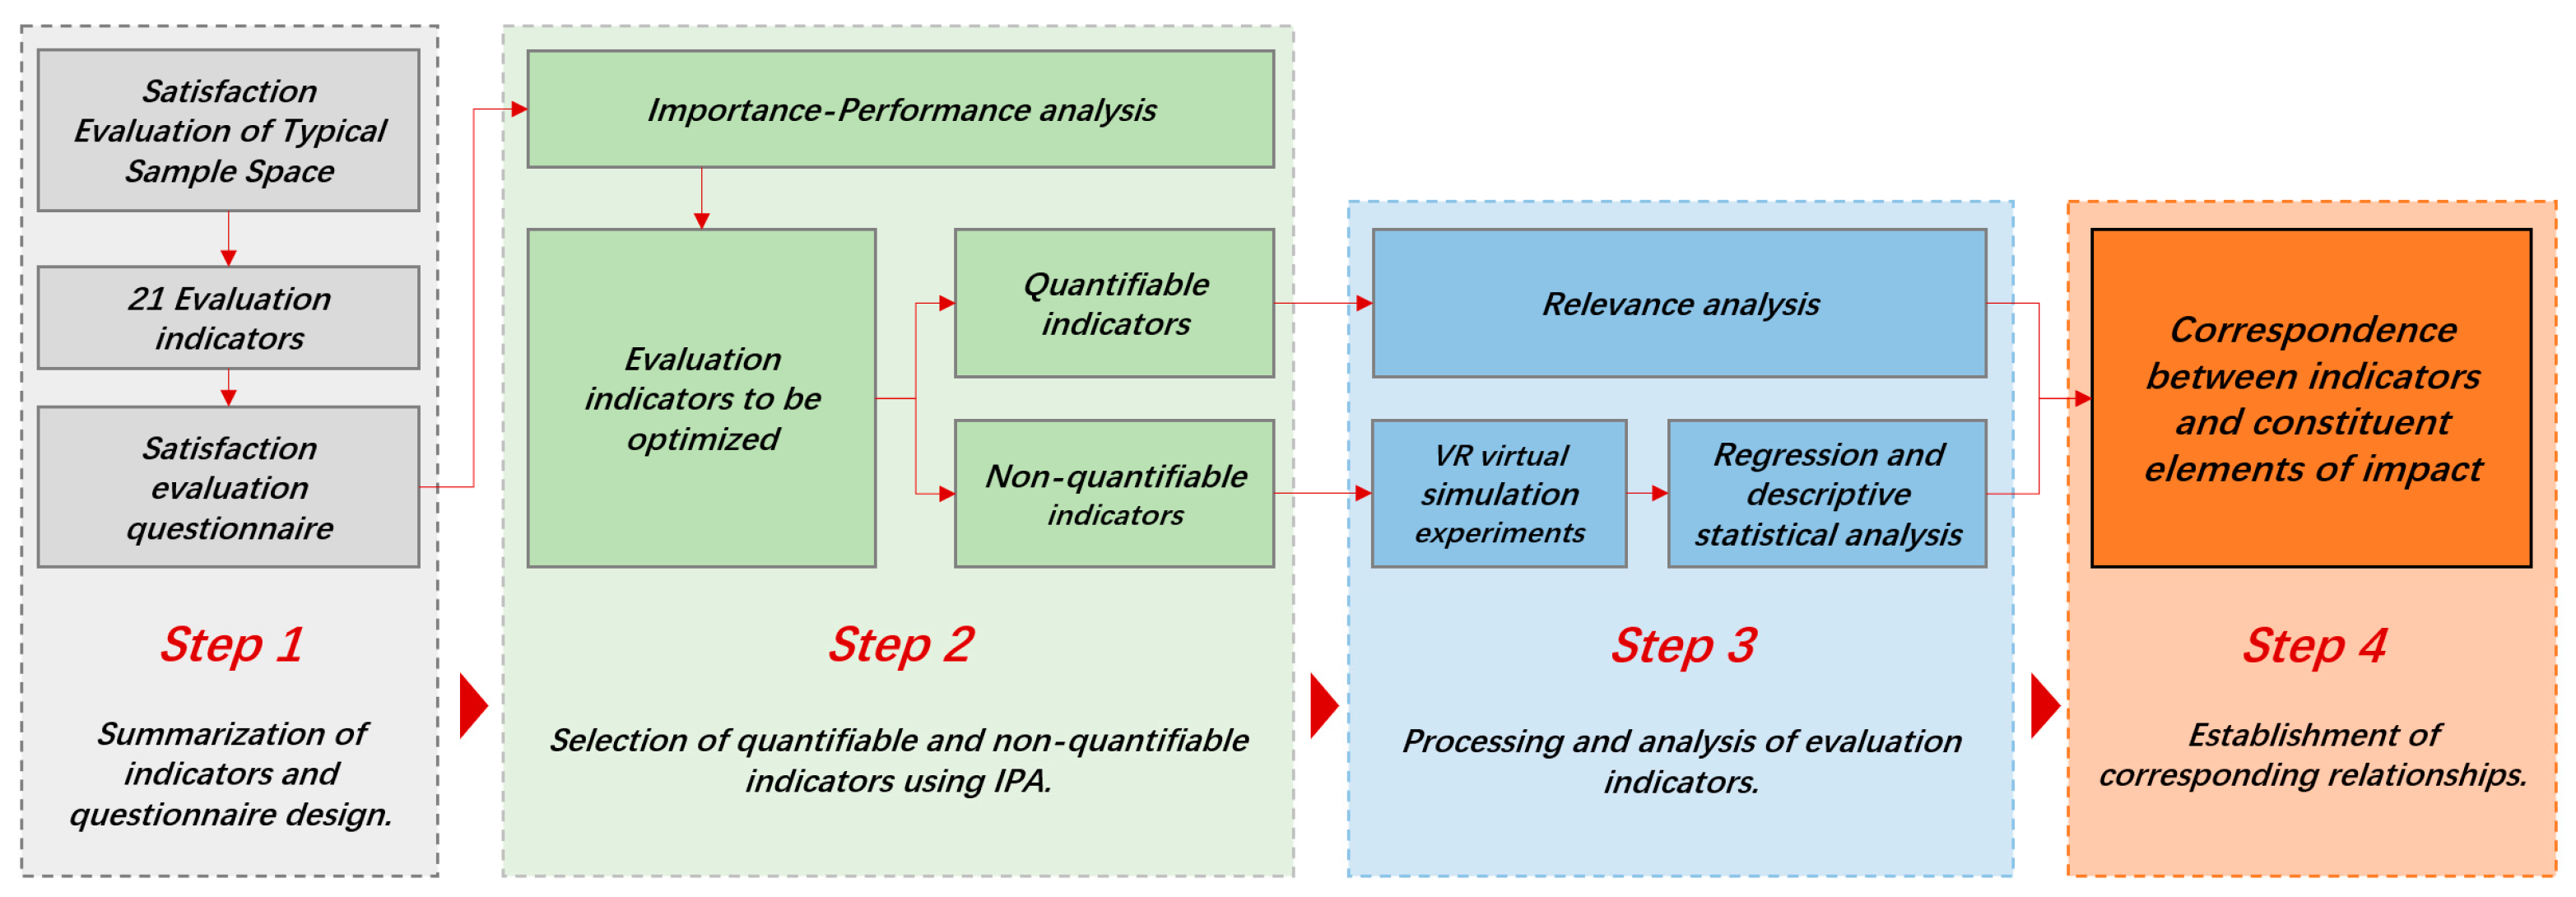
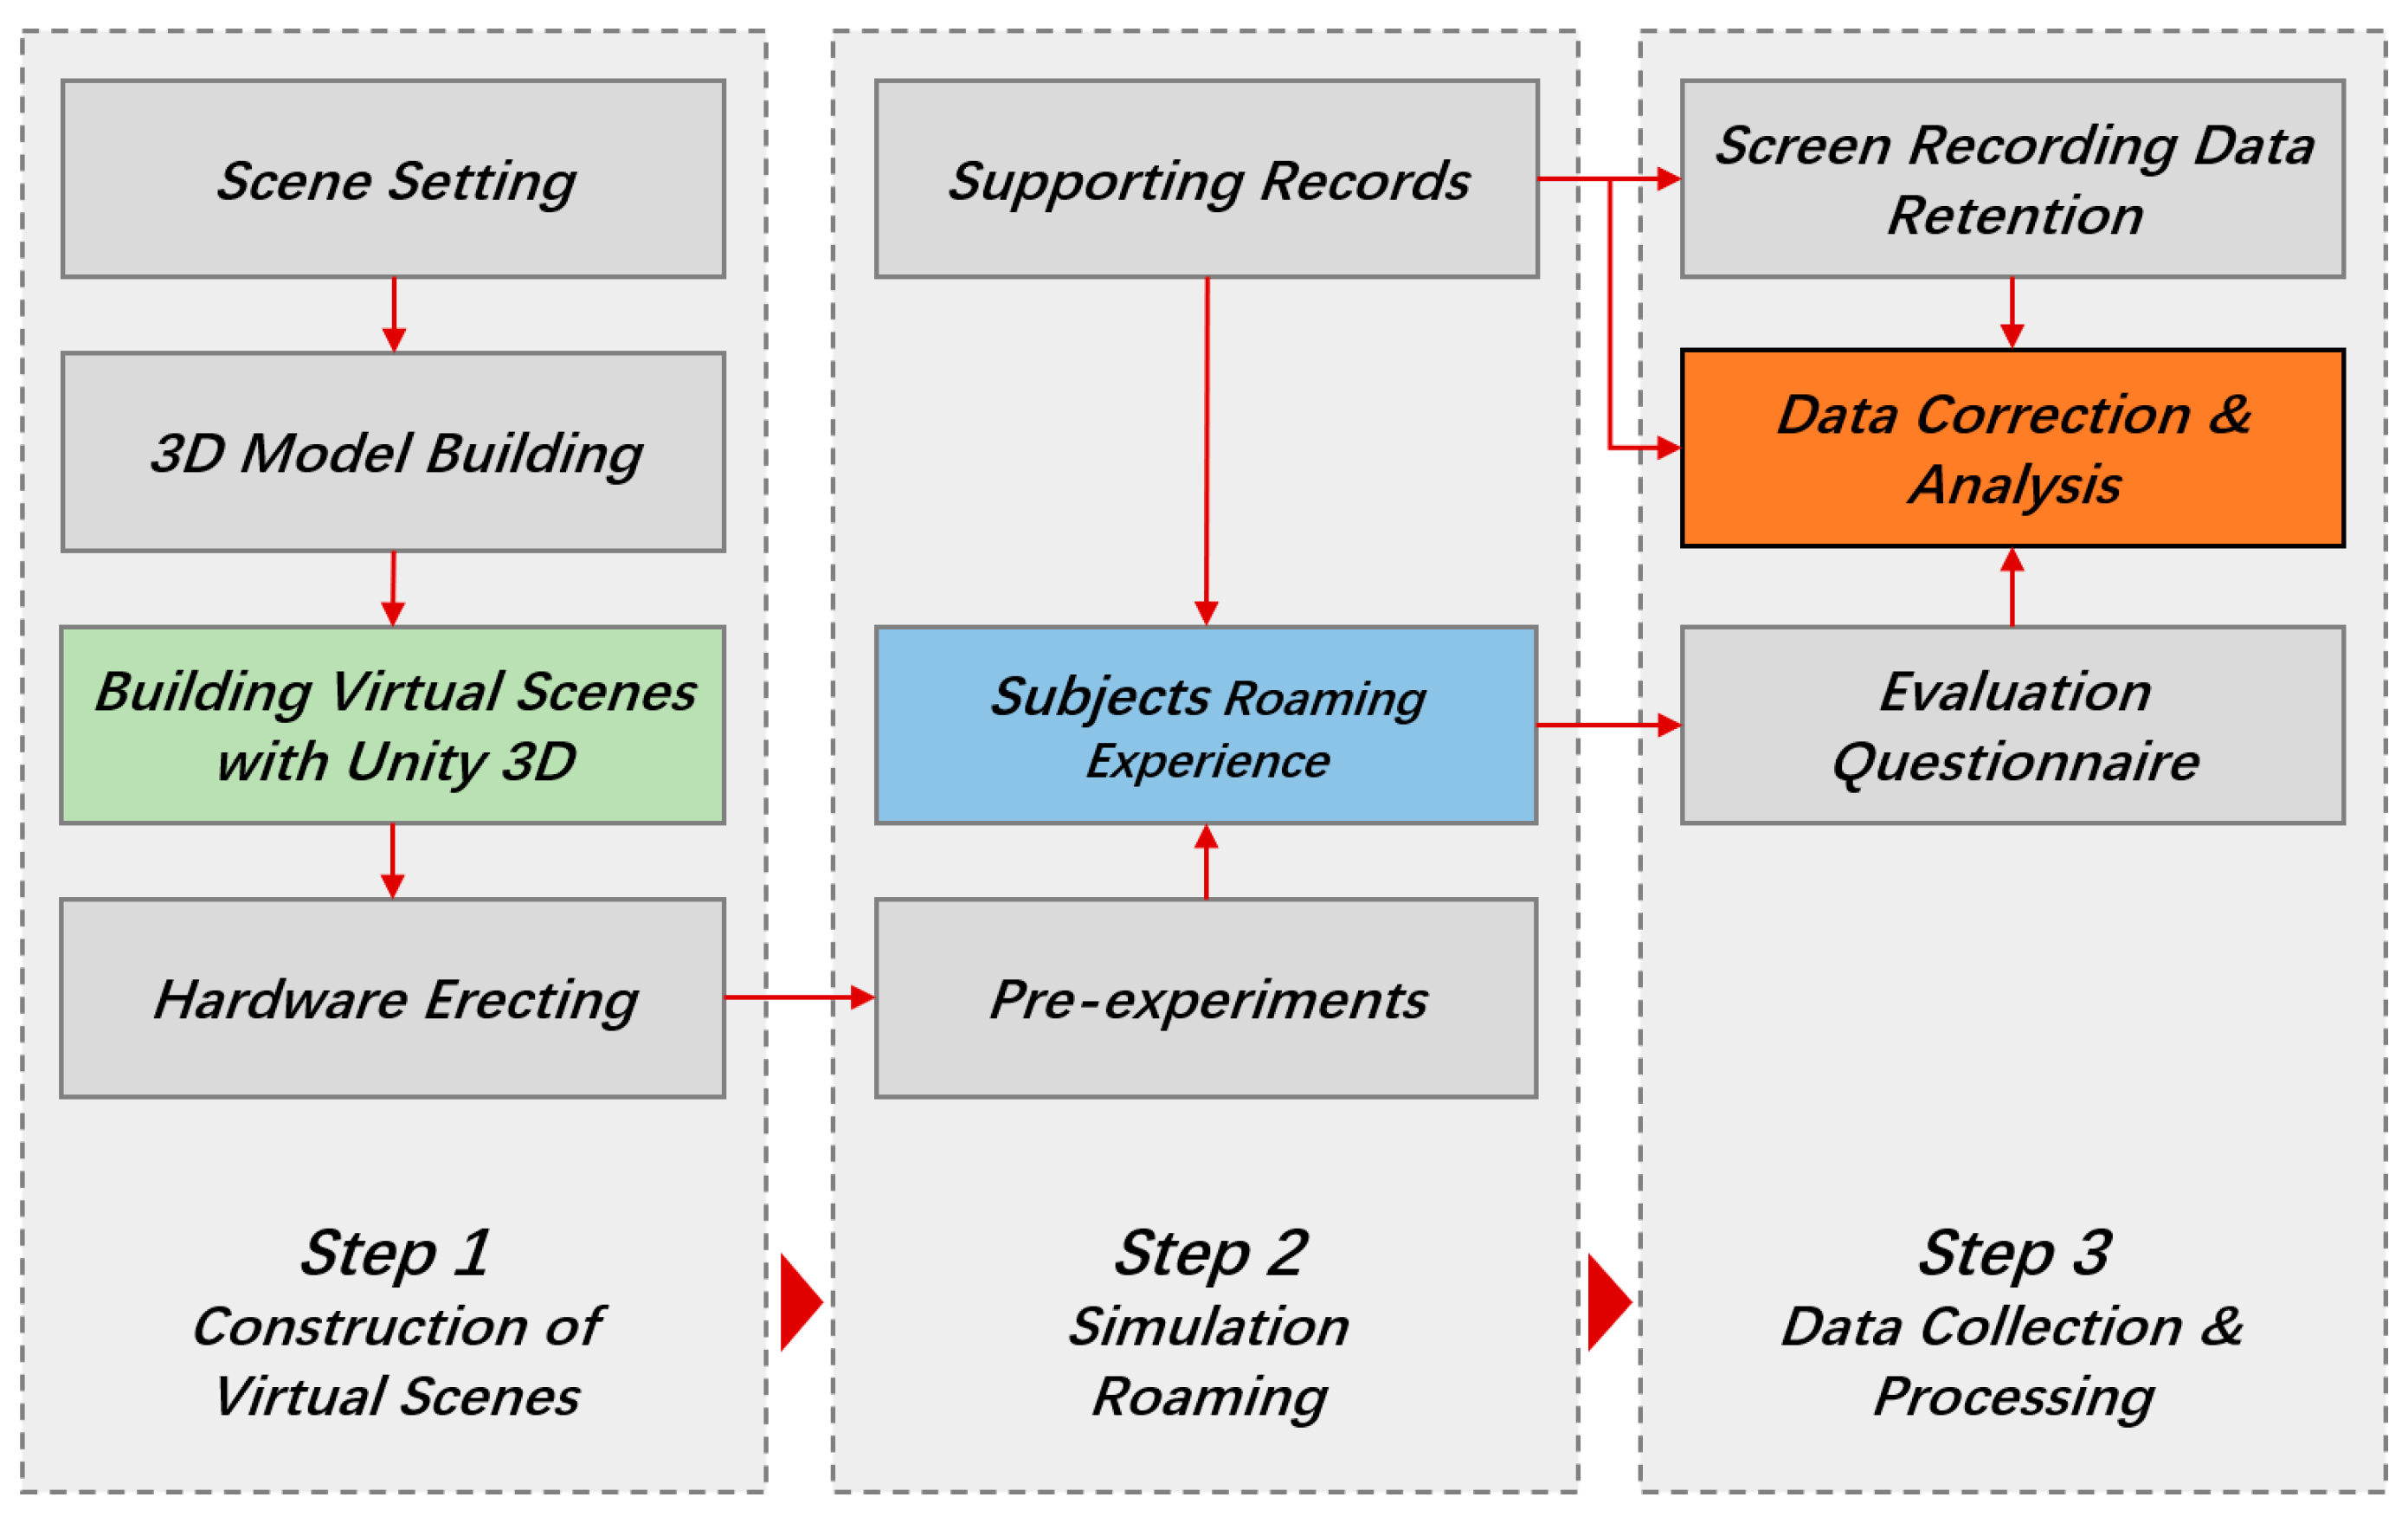
The work flow of the study was as follows (Figure 3):
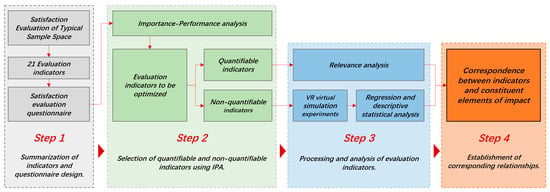
Figure 3.
The work flow of this study.
- Based on a comprehensive review of theoretical foundations, literature research, and field surveys, 21 evaluation indicators for the indoor public space of shopping malls were identified. Following this, a user questionnaire was designed to capture data on these indicators, assessing both their importance and performance, with responses measured using a Likert scale.
- Using importance–performance analysis, the results of the questionnaire were analyzed, and the evaluation indicators of indoor public spaces were screened and divided into quantifiable and unquantifiable indicators.
- Using correlation analysis to analyze quantifiable indicators, a VR simulation experiment was used to process the unquantifiable indicators, and regression and descriptive analyses were used for statistical analysis.
- Finally, this study established the corresponding relationship between indicators and influencing elements.
3.2. Field Survey
3.2.1. Materials
Based on the evaluation index items, a questionnaire was designed to evaluate satisfaction with public rest spaces in shopping malls (Supplementary Materials S1). The questionnaire contained two parts. The first part was a basic information survey containing four questions on the respondents’ sex, age, occupation, and average frequency of visits. The second part was an indicator importance–satisfaction evaluation scale. The questionnaire used a 5-point Likert scale. Respondents rated the importance and satisfaction of the indicators by ticking the corresponding scores, ranging from 1 to 5 for very unimportant/unsatisfactory, unimportant/satisfactory, average, relatively important/satisfactory, and very important/satisfactory, to obtain the satisfaction and importance scores of the 21 indicators (Table 2).

Table 2.
Quantitative assignment of evaluations.
3.2.2. Procedure and Participants
Questionnaires were distributed to customers with a certain amount of leisure time in the selected sample spaces to obtain respondents’ subjective evaluation data on their satisfaction and importance ratings for the sample spaces. The determination of the sample size was based on several key factors, including the research objectives, the size and diversity of the target population, the desired level of confidence, the acceptable margin of error, as well as the available resources and feasibility of this study [32]. Specifically, we aimed to distribute a sufficient number of questionnaires to ensure that, after excluding invalid responses, we would still have a robust dataset for analysis. Consequently, a total of 386 questionnaires were distributed, of which 378 were valid and 8 were invalid.
The reliability analysis was conducted using IBM SPSS Statistics 23.0, after standardization of the data to ensure the reliability and stability of the questionnaire evaluation score data. In the results (Table 3), Cronbach’s alpha coefficients for satisfaction and importance were 0.892 and 0.876 (>0.8), respectively, indicating that the consistency of the study data reflected good reliability, and the evaluation results were reliable.

Table 3.
Questionnaire data reliability analysis.
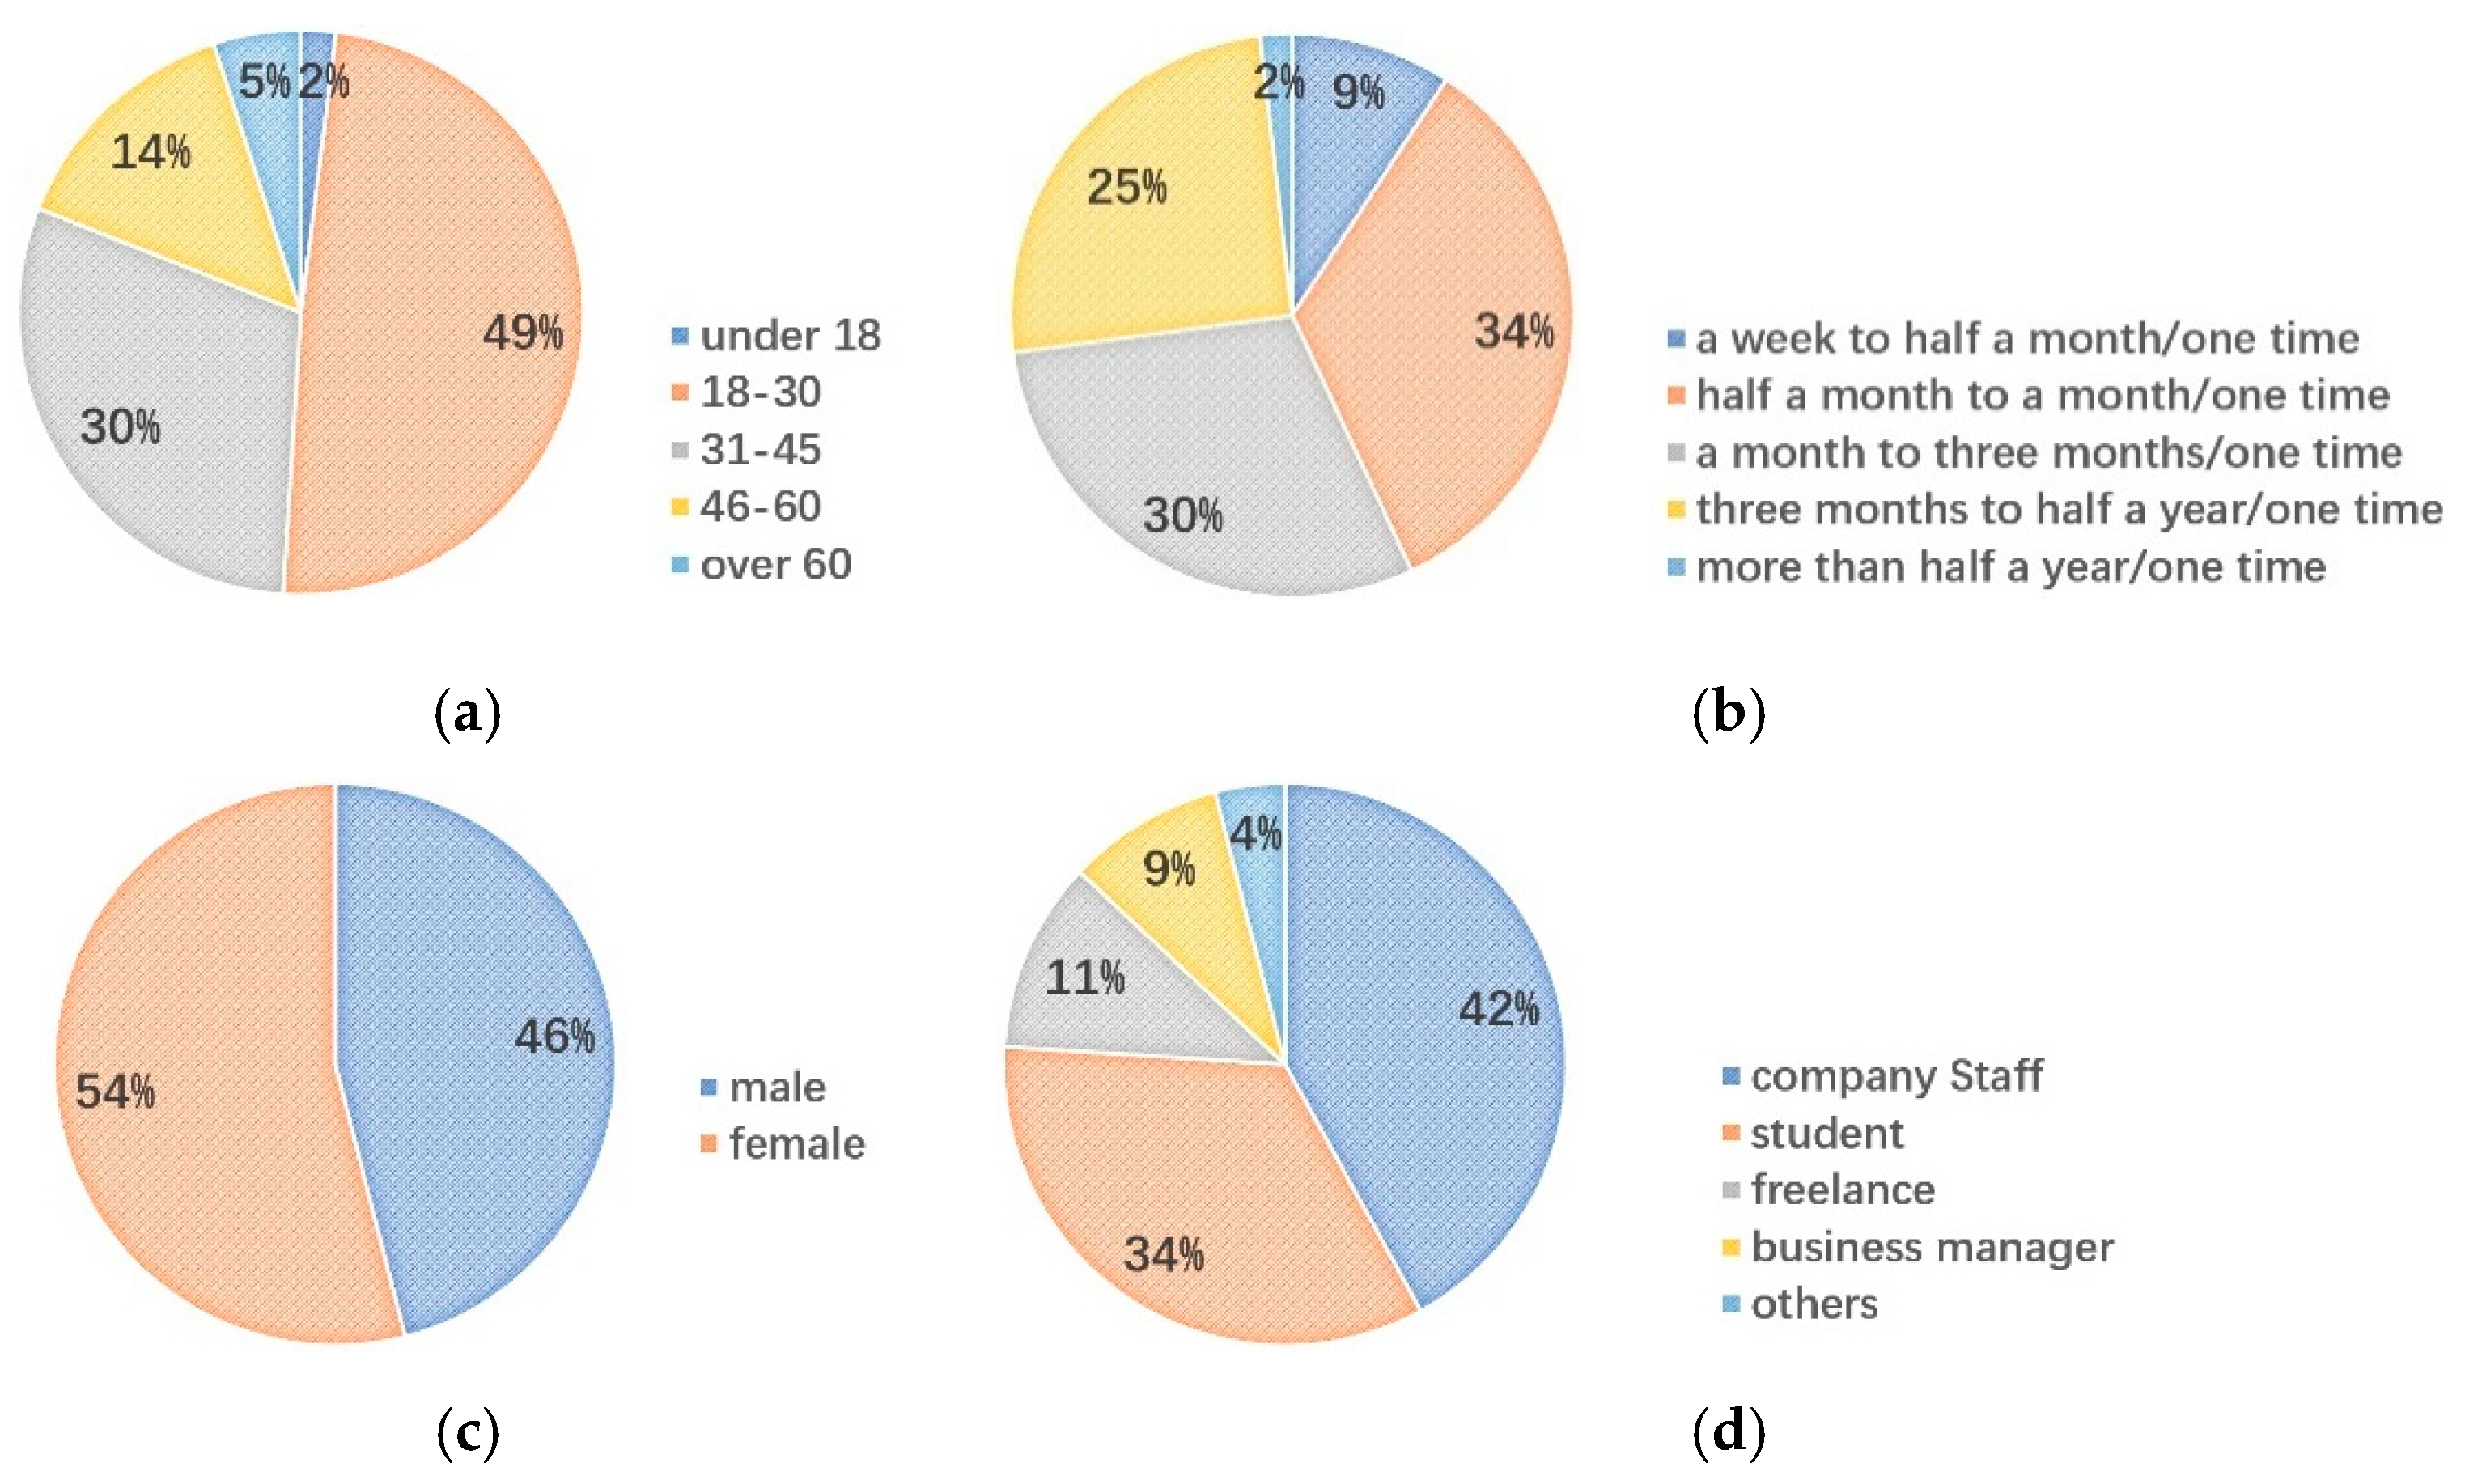
The basic information data of the questionnaires were counted, and their demographic characteristics were in line with the characteristics of the population using the space objects. The age composition of respondents was predominantly young and middle-aged, accounting for 84.97%, with 53.85% of respondents aged 18–30 and 31.12% aged 31–45. The frequency of shopping center visits averaged between once semimonthly and once a month, with 33.6% of respondents, followed by once every month to three months, with 29.89% of respondents. The sex composition of respondents was slightly higher for women (54%) than for men (46%). Additionally, the majority of respondents were company employees (42.31%) and students (34.27%) (Figure 4).

Figure 4.
Demographic distribution of the questionnaire: (a) age distribution of respondents; (b) frequency of respondents going to shopping malls; (c) sex distribution of respondents; (d) occupation distribution of respondents.
3.2.3. Significant Factor Filtering
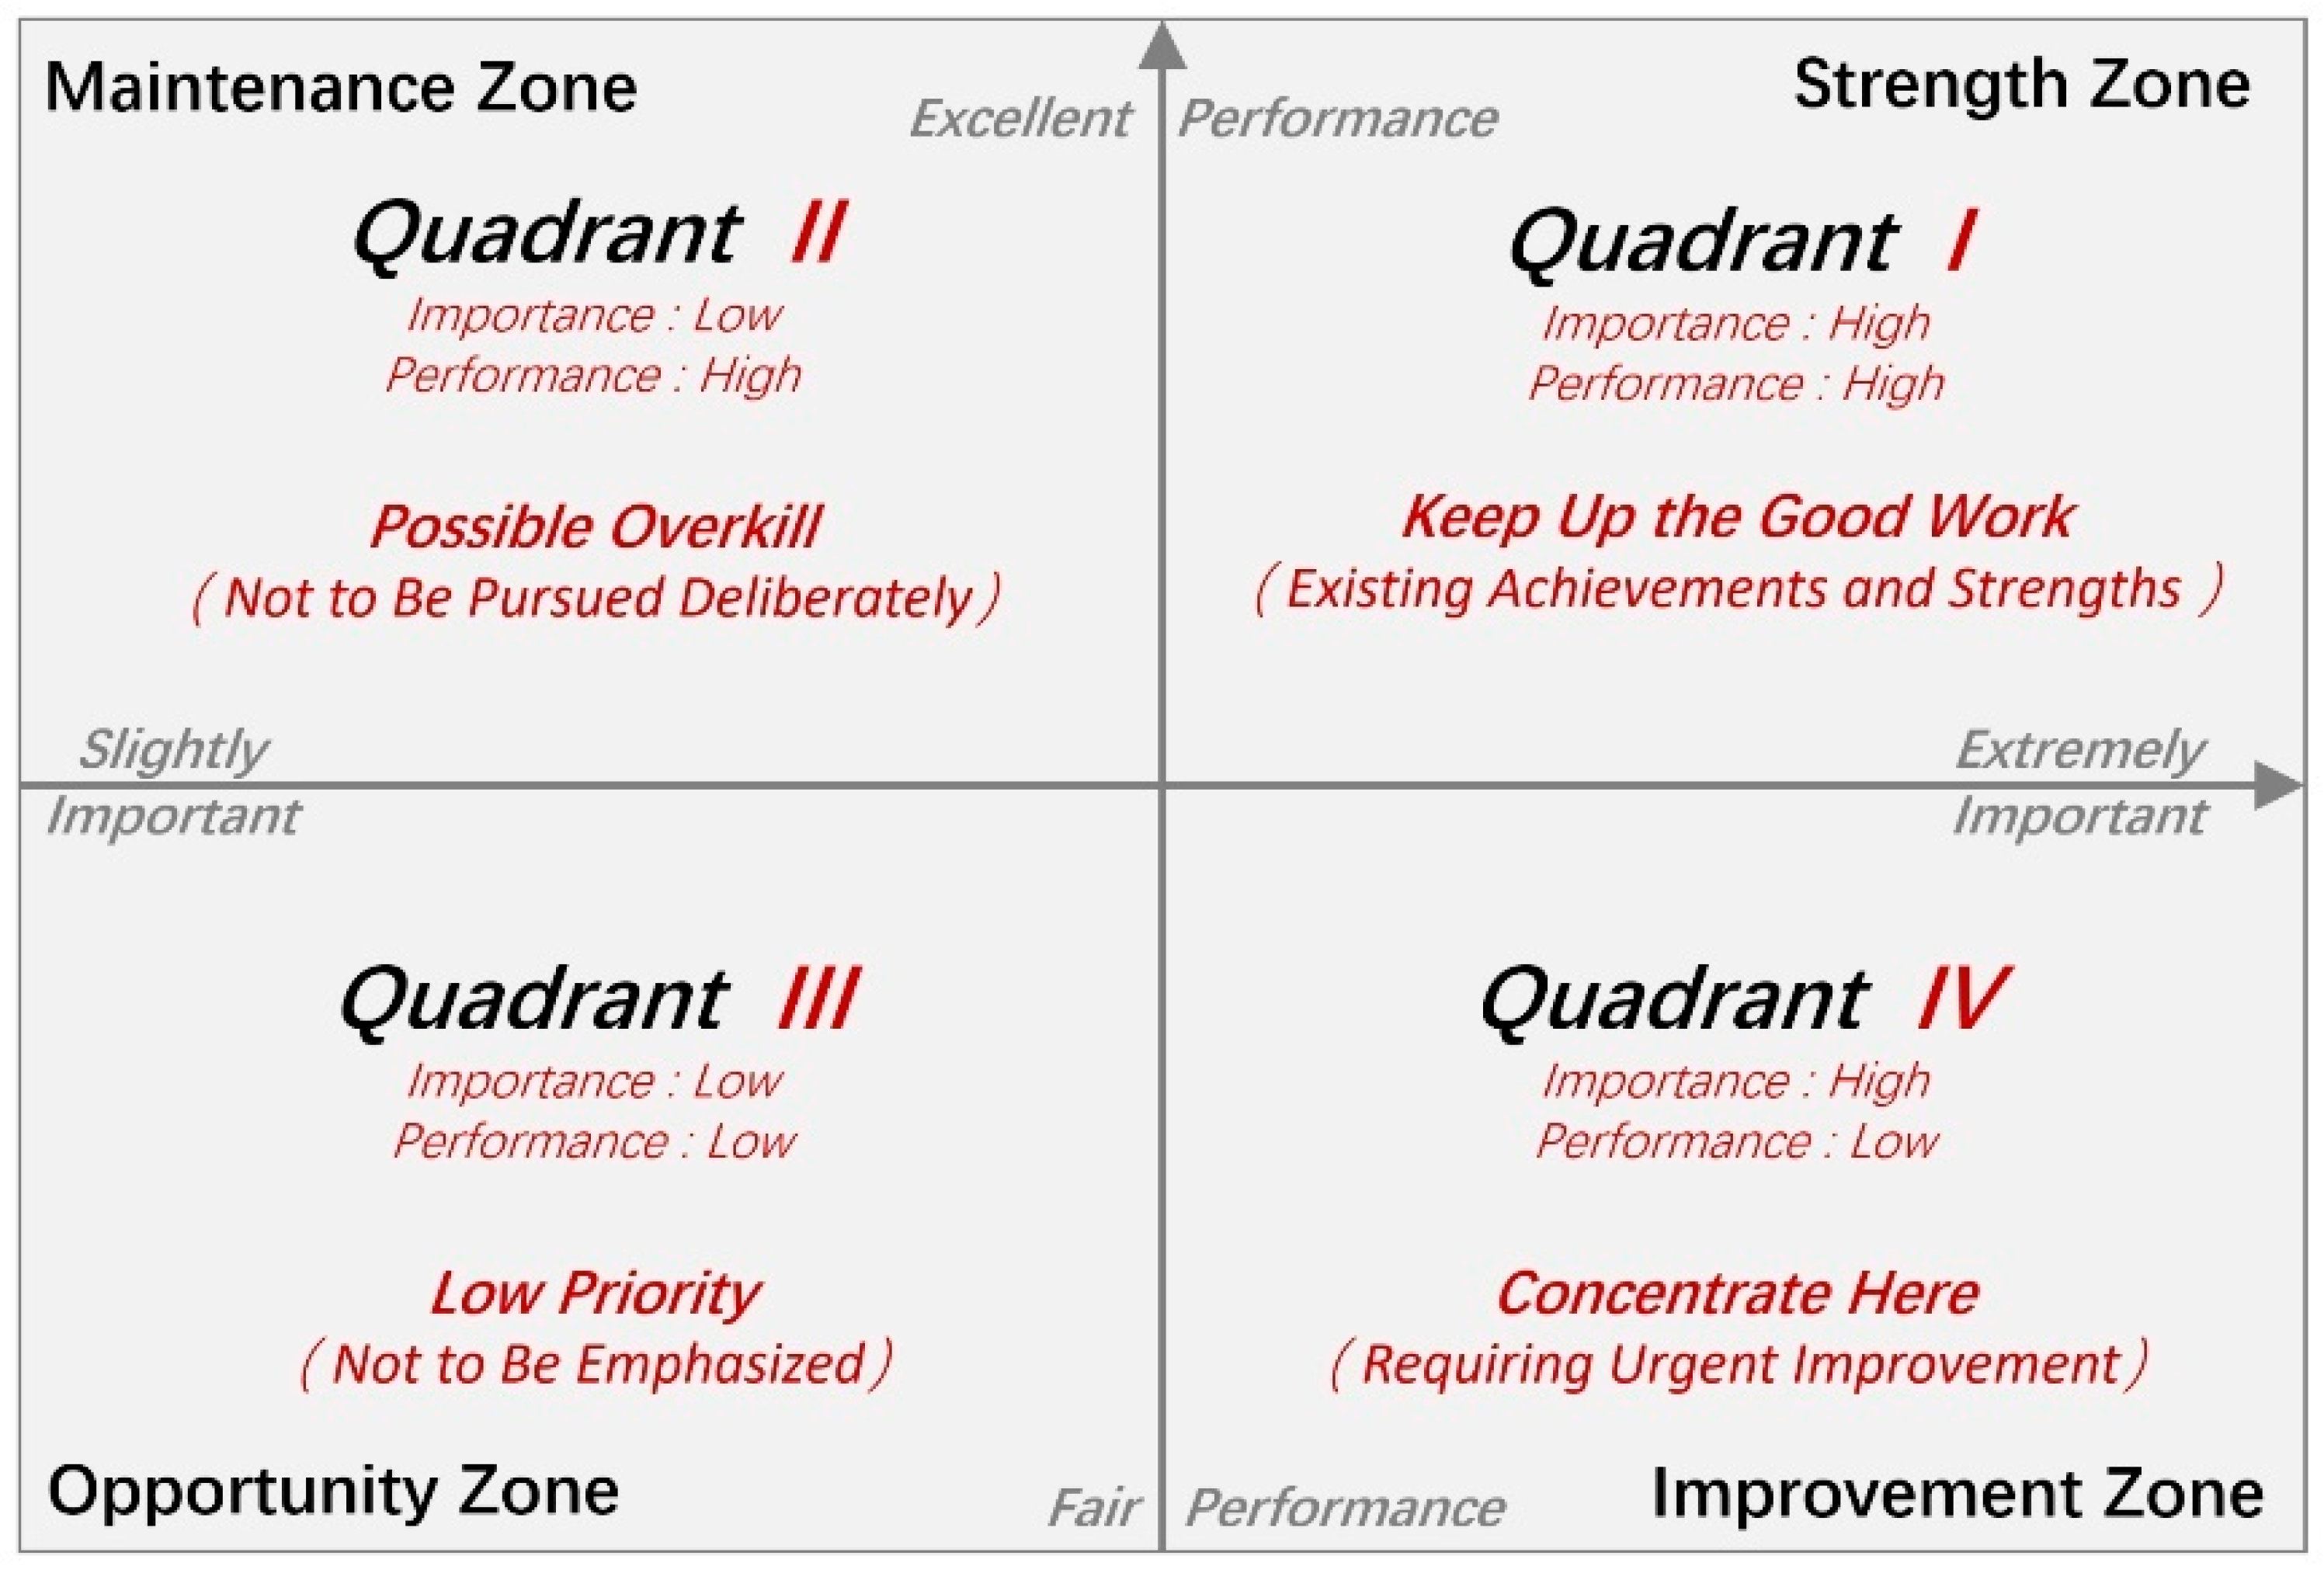
This study used importance–performance analysis to screen the evaluation indicators to be optimized. This method is an ideal tool for analysis and evaluation, as it distinguishes the strengths and weaknesses of current resources and prioritizes them by comparing users’ expectations (importance) with their actual perceptions (performance), thereby assisting in the formulation of improvement decisions [33,34,35,36]. The data obtained in the analysis were reflected in a two-dimensional matrix analysis diagram in the form of (x, y) coordinates, and the two-dimensional plane was divided into four quadrants (Figure 5) using the mean value of each axis as the boundary for the improvement zone (Concentrate Here), strength zone (Keep Up the Good Work), opportunity zone (Low priority), and maintenance zone (Possible Overkill).
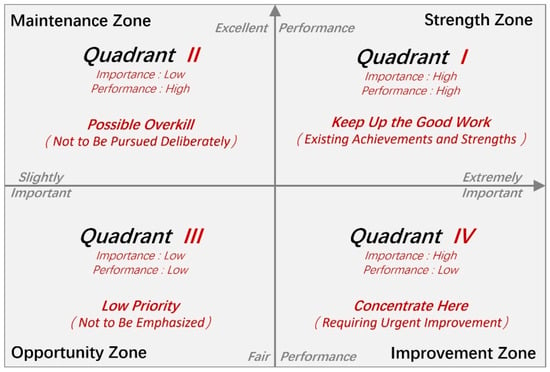
Figure 5.
Description of importance–performance analysis.
The importance–performance analysis method was chosen for the following three reasons:
- The combination of the two can focus more efficiently on the key points of the space from the perspective of rational allocation of resources, and increase the rationality and energy efficiency of the proposed optimization strategies.
- A two-dimensional graphical representation of importance and satisfaction can be used to analyze the current situation more clearly, and the combination of paired-sample t-tests and other data analysis methods can improve the interpretation of subjective evaluation data.
- The satisfaction scores corresponding to the evaluation indicators to be optimized are used for research analysis in the subsequent subsections, guaranteeing the continuity of the research process.
3.2.4. Quantitative Descriptions of Significant Factors
To investigate the relationship between the evaluation indexes to be optimized and the design of public resting spaces in commercial complexes, as screened by importance–performance analysis, a research project on spatial elements was conducted.
The quantifiable spatial elements were divided into two categories: physical environment elements and perceptual experience elements. The former pertains to interface transparency, density of leisure facilities, types of shared-service facilities, average distance between shared-service facilities, density of decorative vignettes, visual permeability, number of main colors, color-difference value, functional density, and shop density. The latter category is related to other indicators. The quantification of each spatial element is presented in Table 4.

Table 4.
Quantitative indicators and quantification of environmental elements.
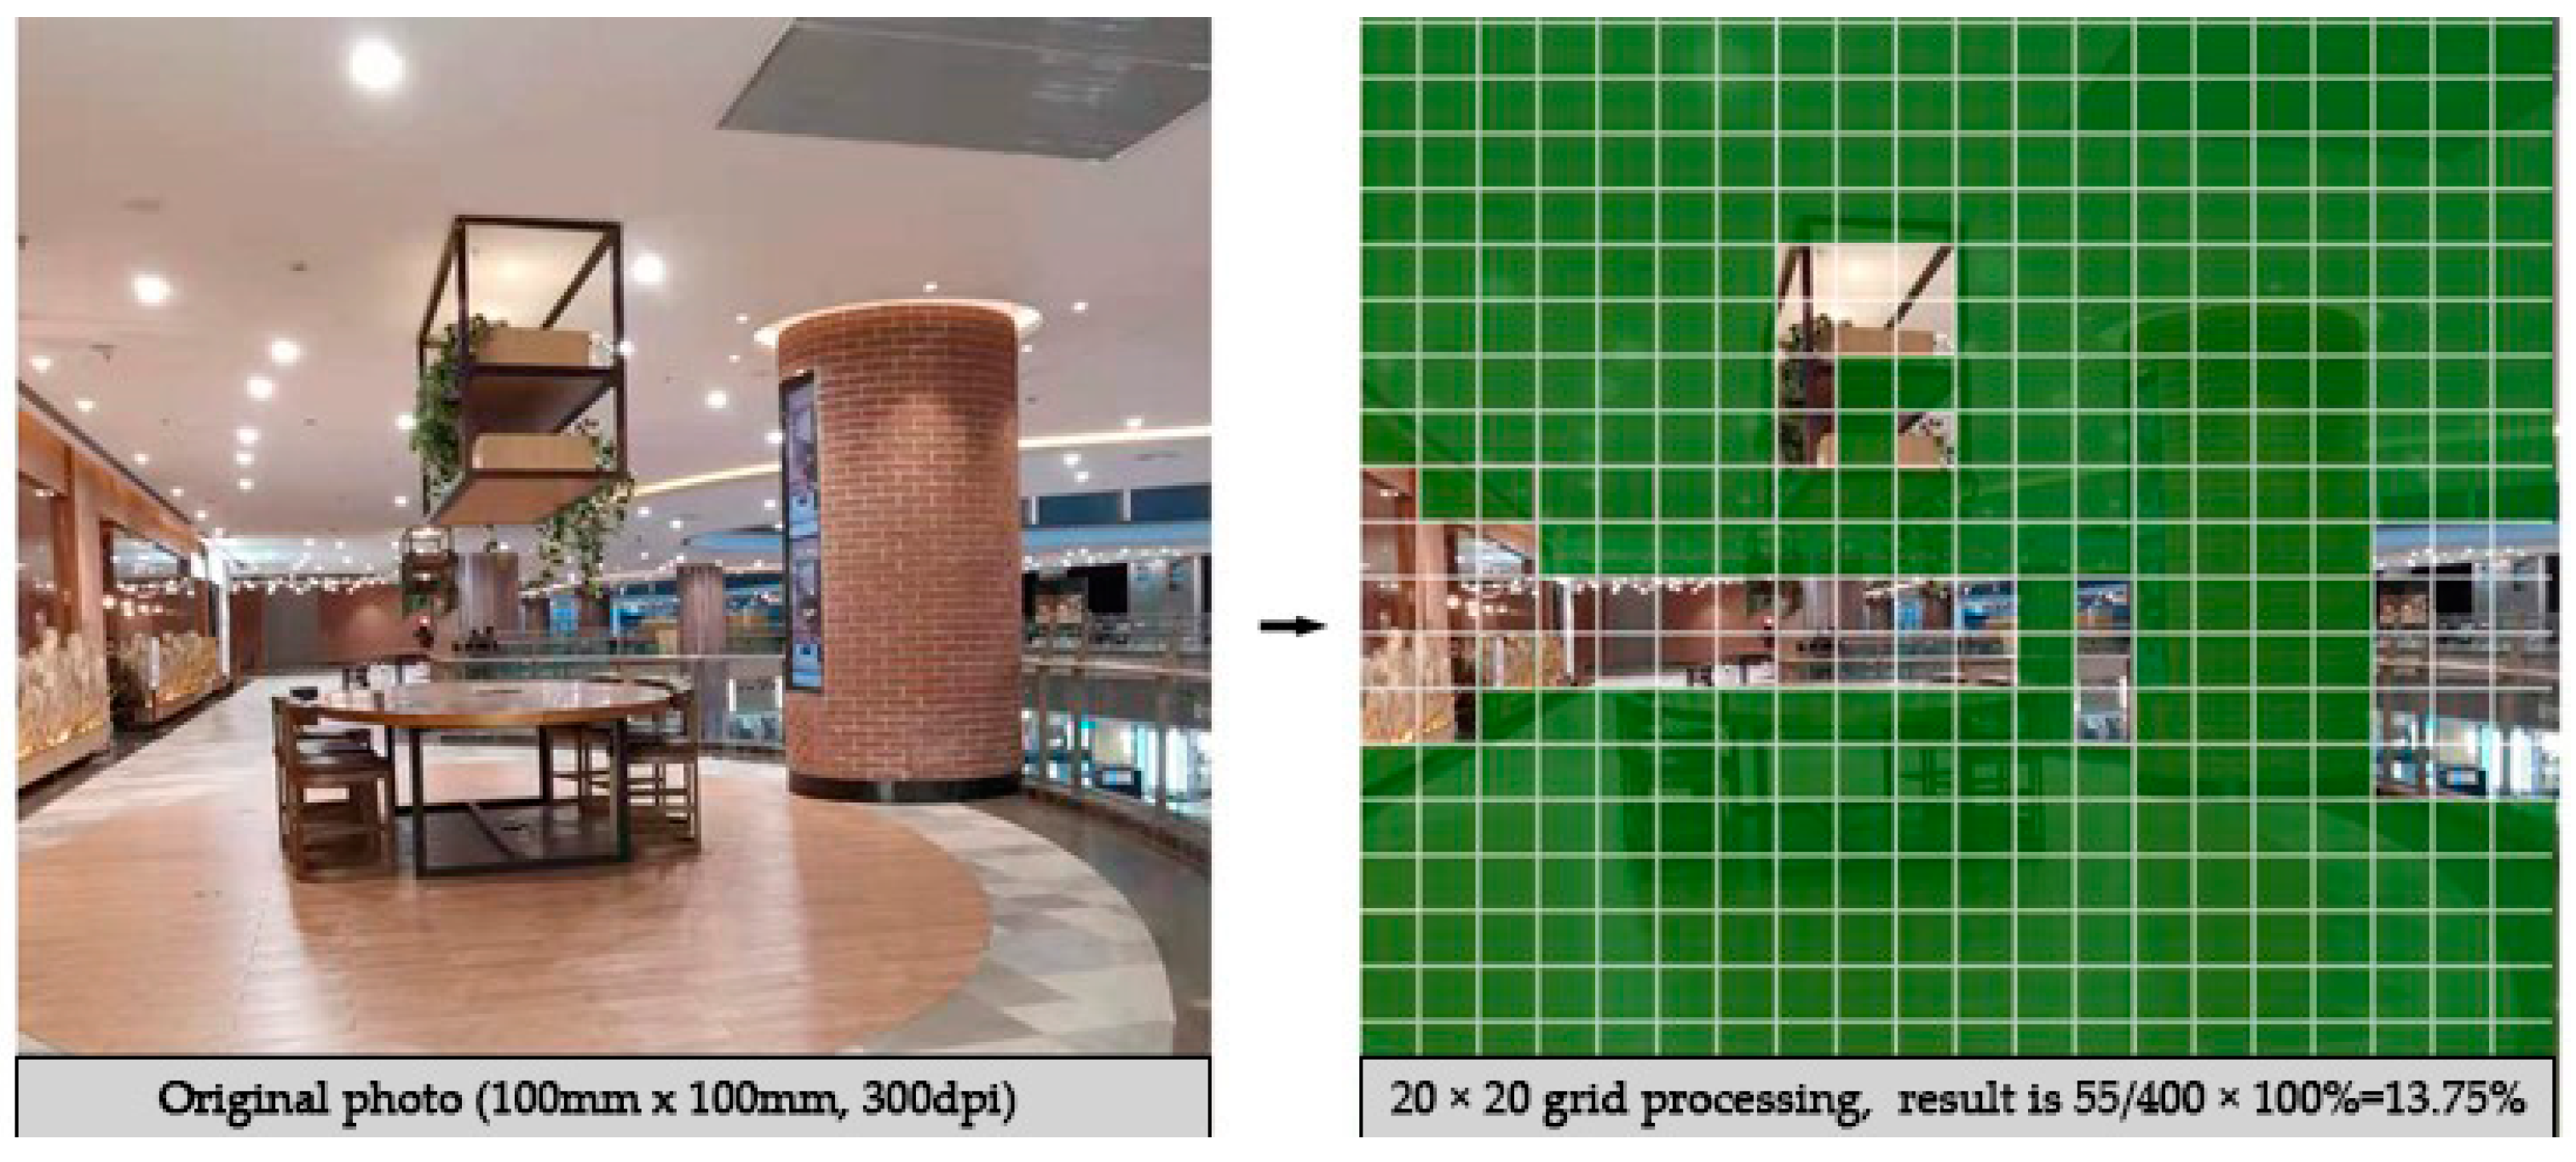
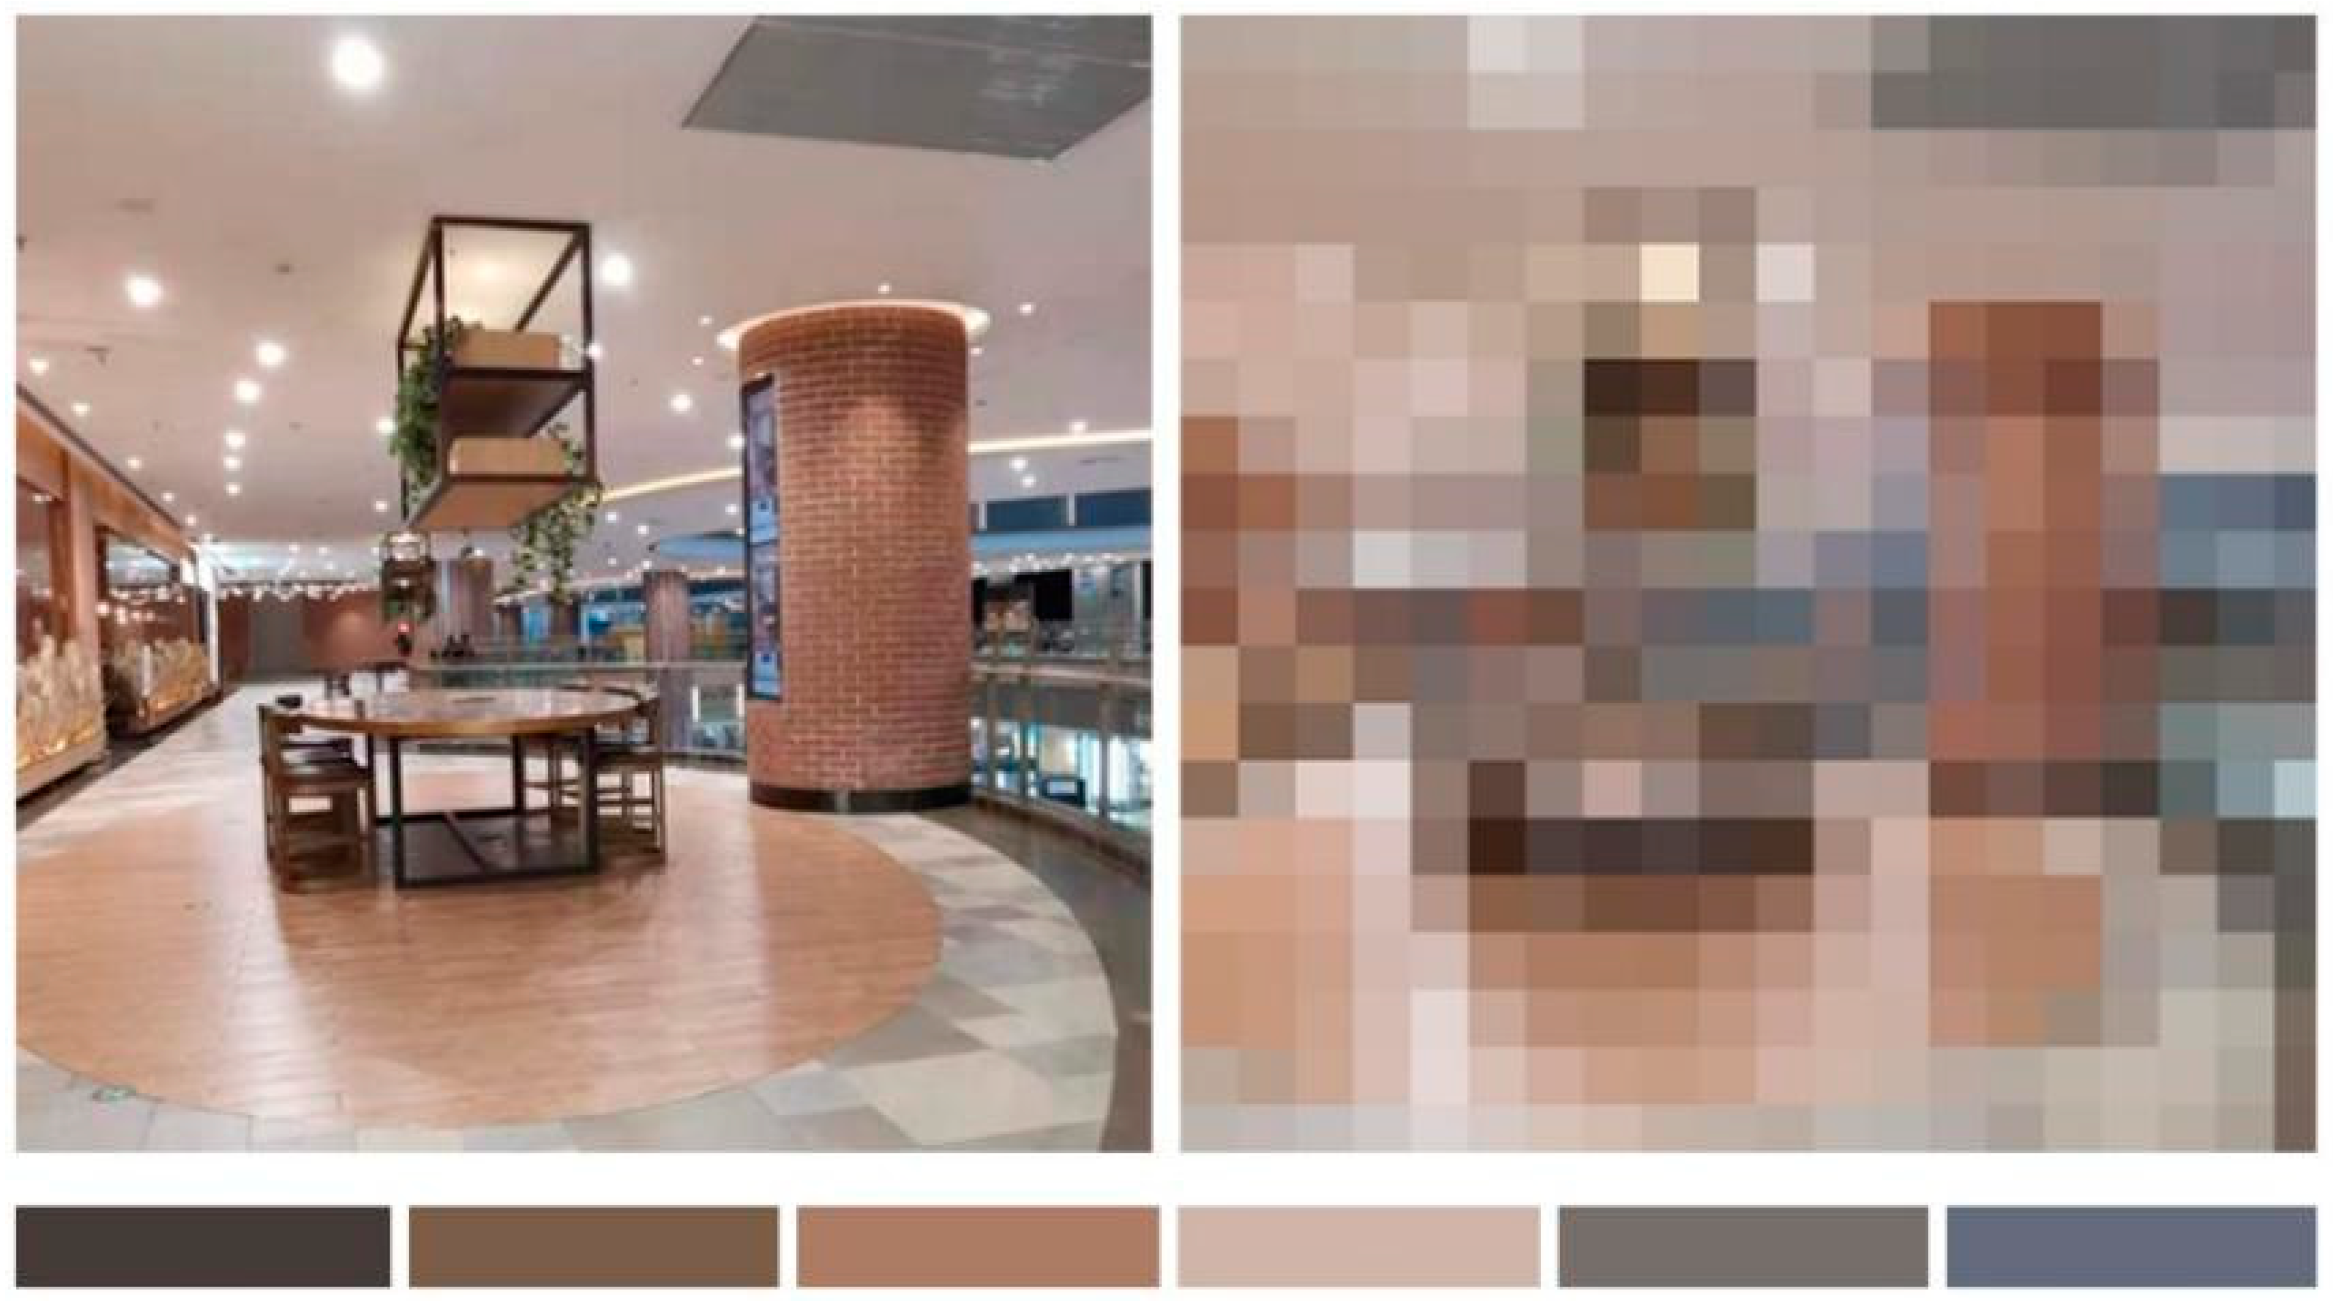
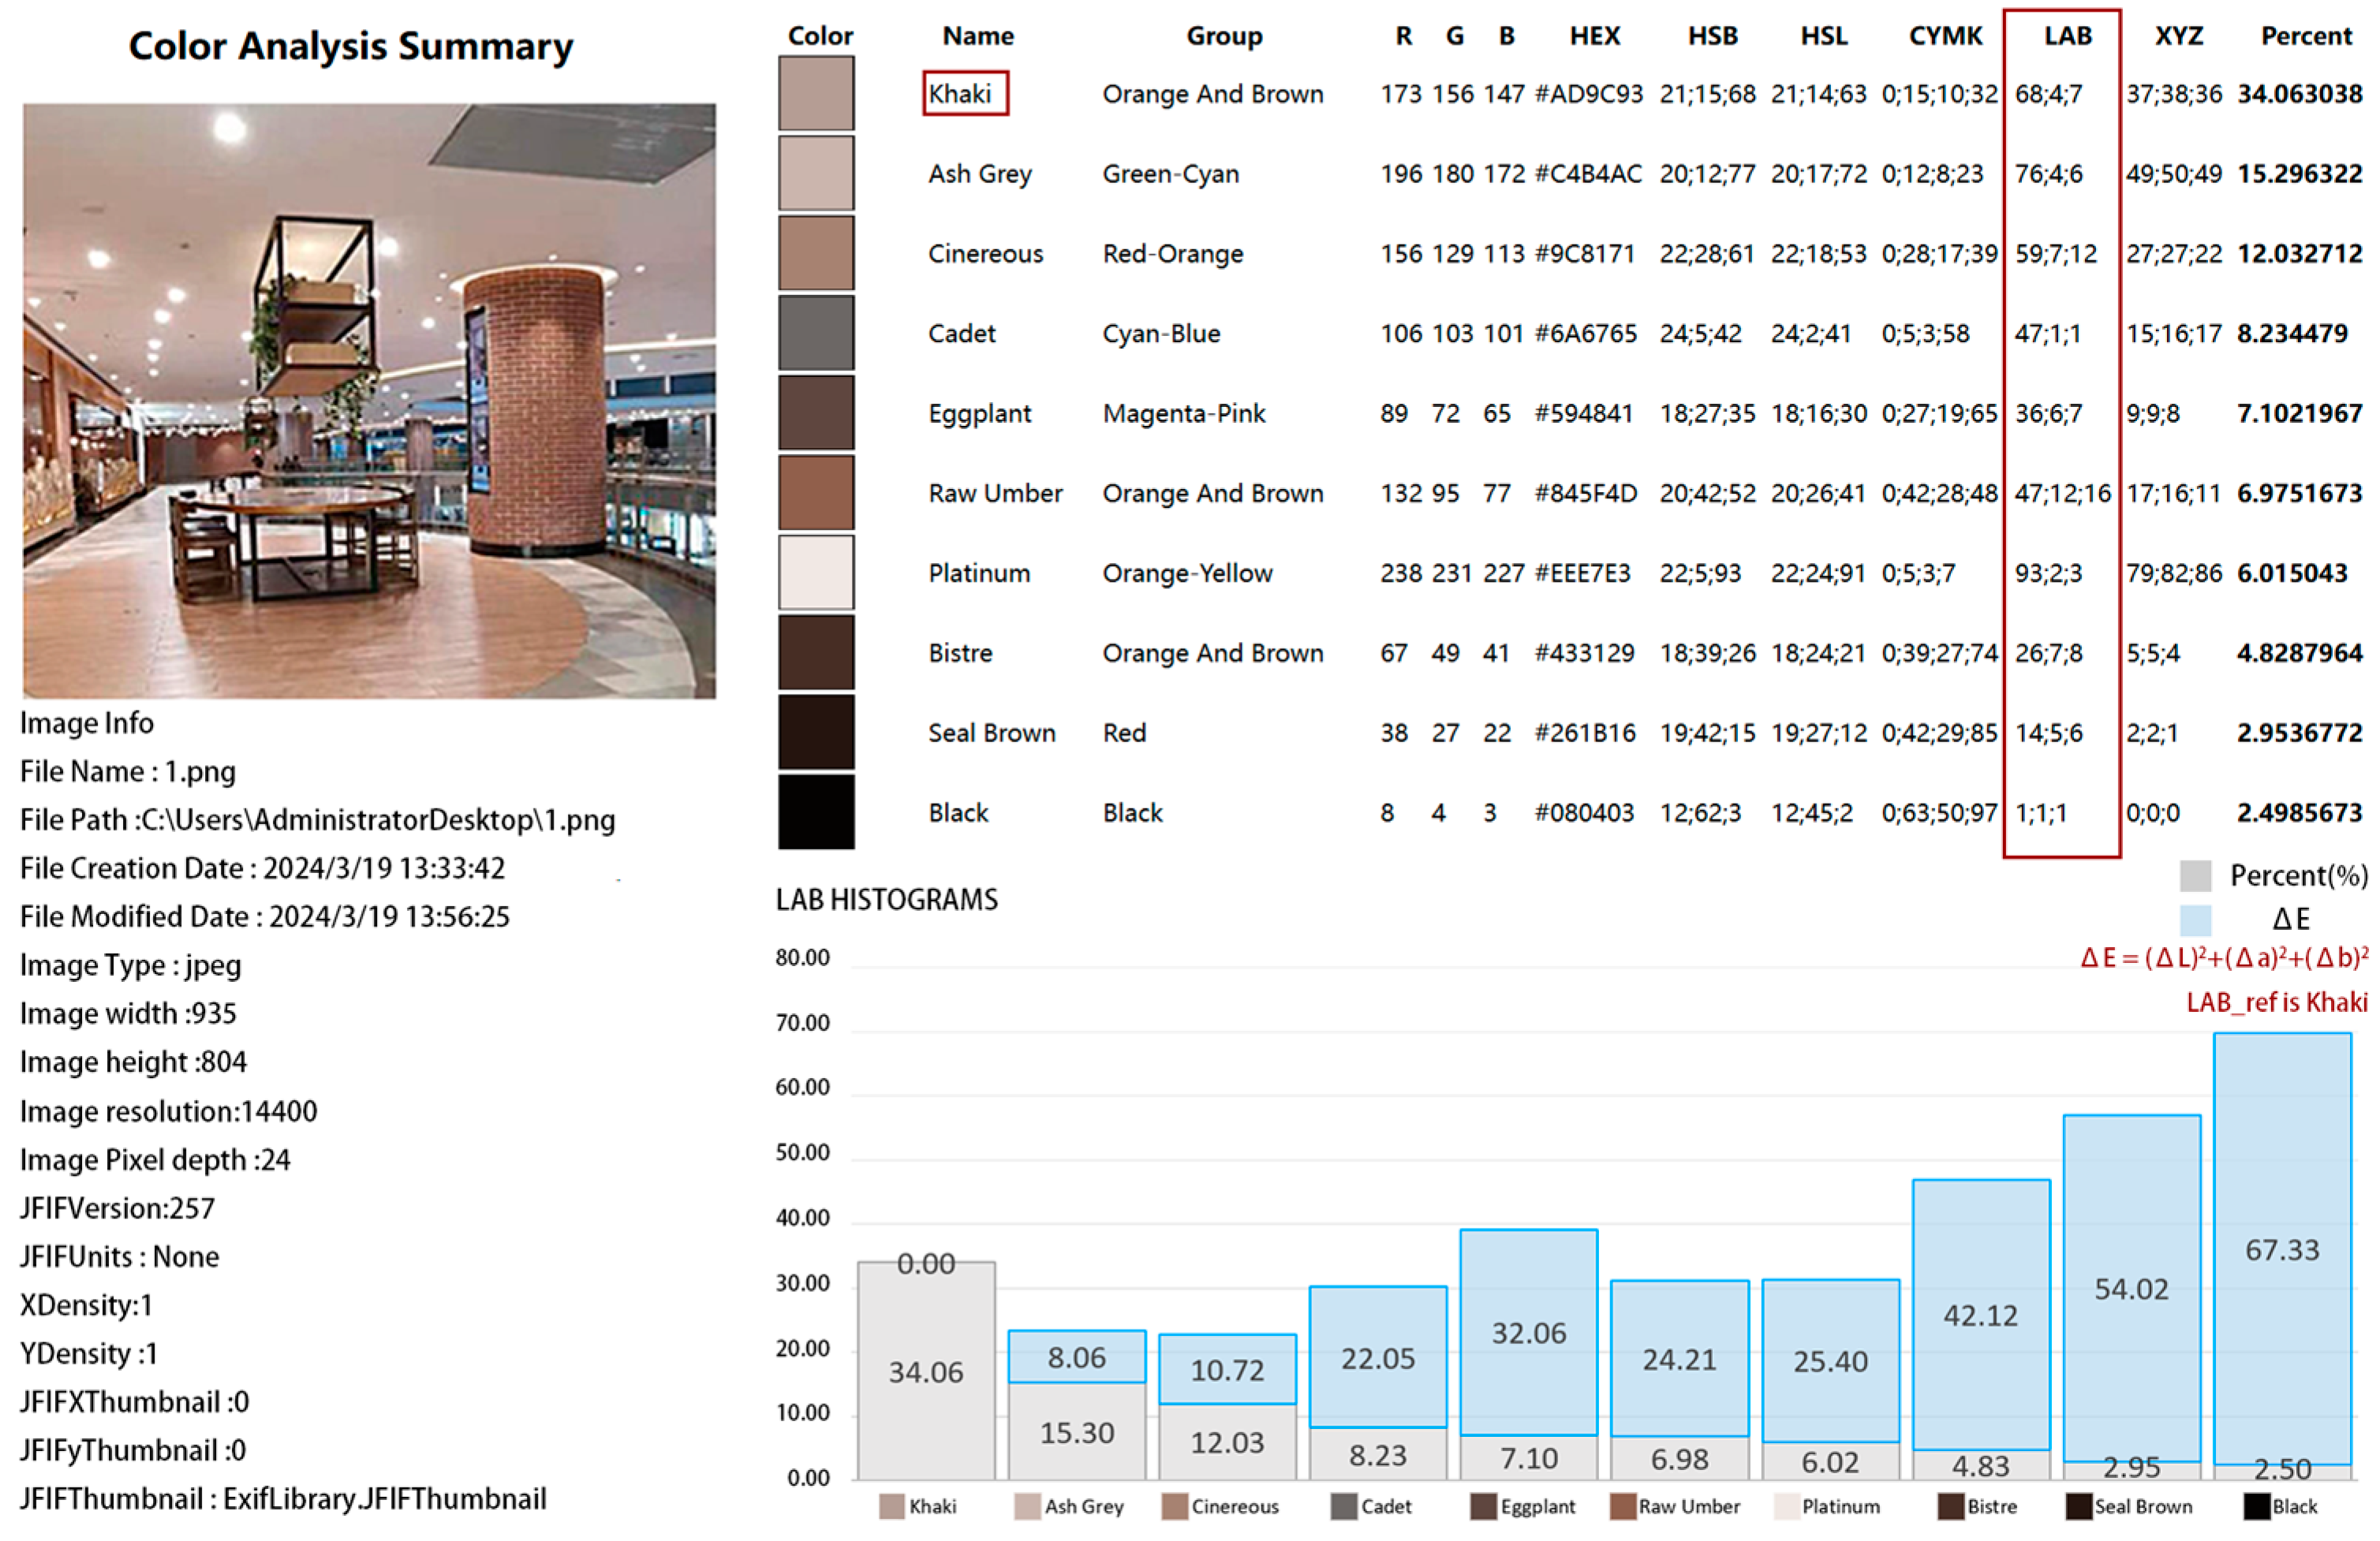
Visual permeability was calculated using the line-of-sight rate. The specific method involved calculating the average value of the permeability in the four directions of the selected space sample points: front, back, left, and right. After taking the photos, the longitudinal and transverse grids of the four directions of each point were processed using Adobe Photoshop 2021 software, and the percentage of the area of the nonsolid part of the photo in the longitudinal plane of the photo was calculated (Figure 6). The number of main colors was used to quantify the number of main colors in the space, and Adobe Photoshop was used to pixelate the photo to extract the number of colors with the largest proportion (Figure 7); the color difference value was extracted by the Image Color Summarizer color calculator to extract the 10 main colors in the space and obtain the corresponding value of LAB color space, and we used the LAB color space color difference formula ΔE = (ΔL)2 + (Δa)2 + (Δb)2 to calculate the color difference value results (Figure 8).
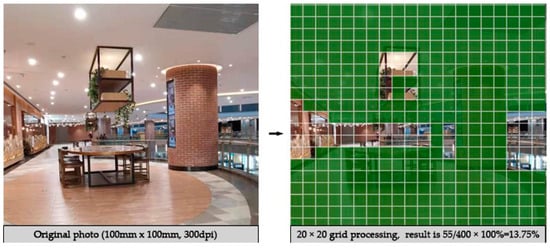
Figure 6.
Example of how to calculate field-of-view permeability.
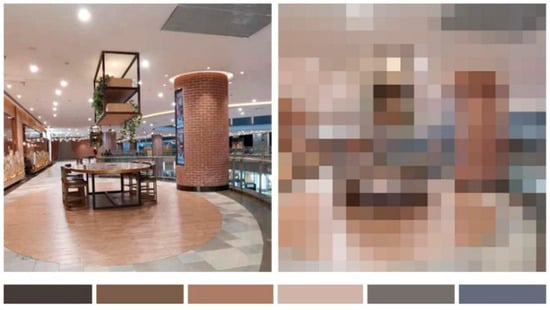
Figure 7.
Example of main body color number extraction method.
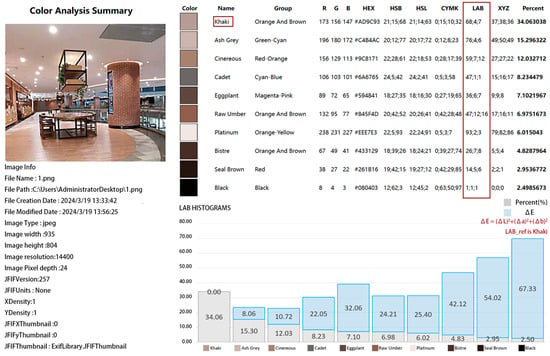
Figure 8.
Example of calculation method of color difference value.
3.2.5. Influence Analysis
Using SPSS 23.0 software, the quantitative results of the aforementioned spatial constituents were correlated with the results of the satisfaction evaluation of the indicators obtained from the questionnaire survey using Pearson correlation analysis, and the contents that showed significant correlation results were marked.
3.3. VR Experiments
3.3.1. Materials
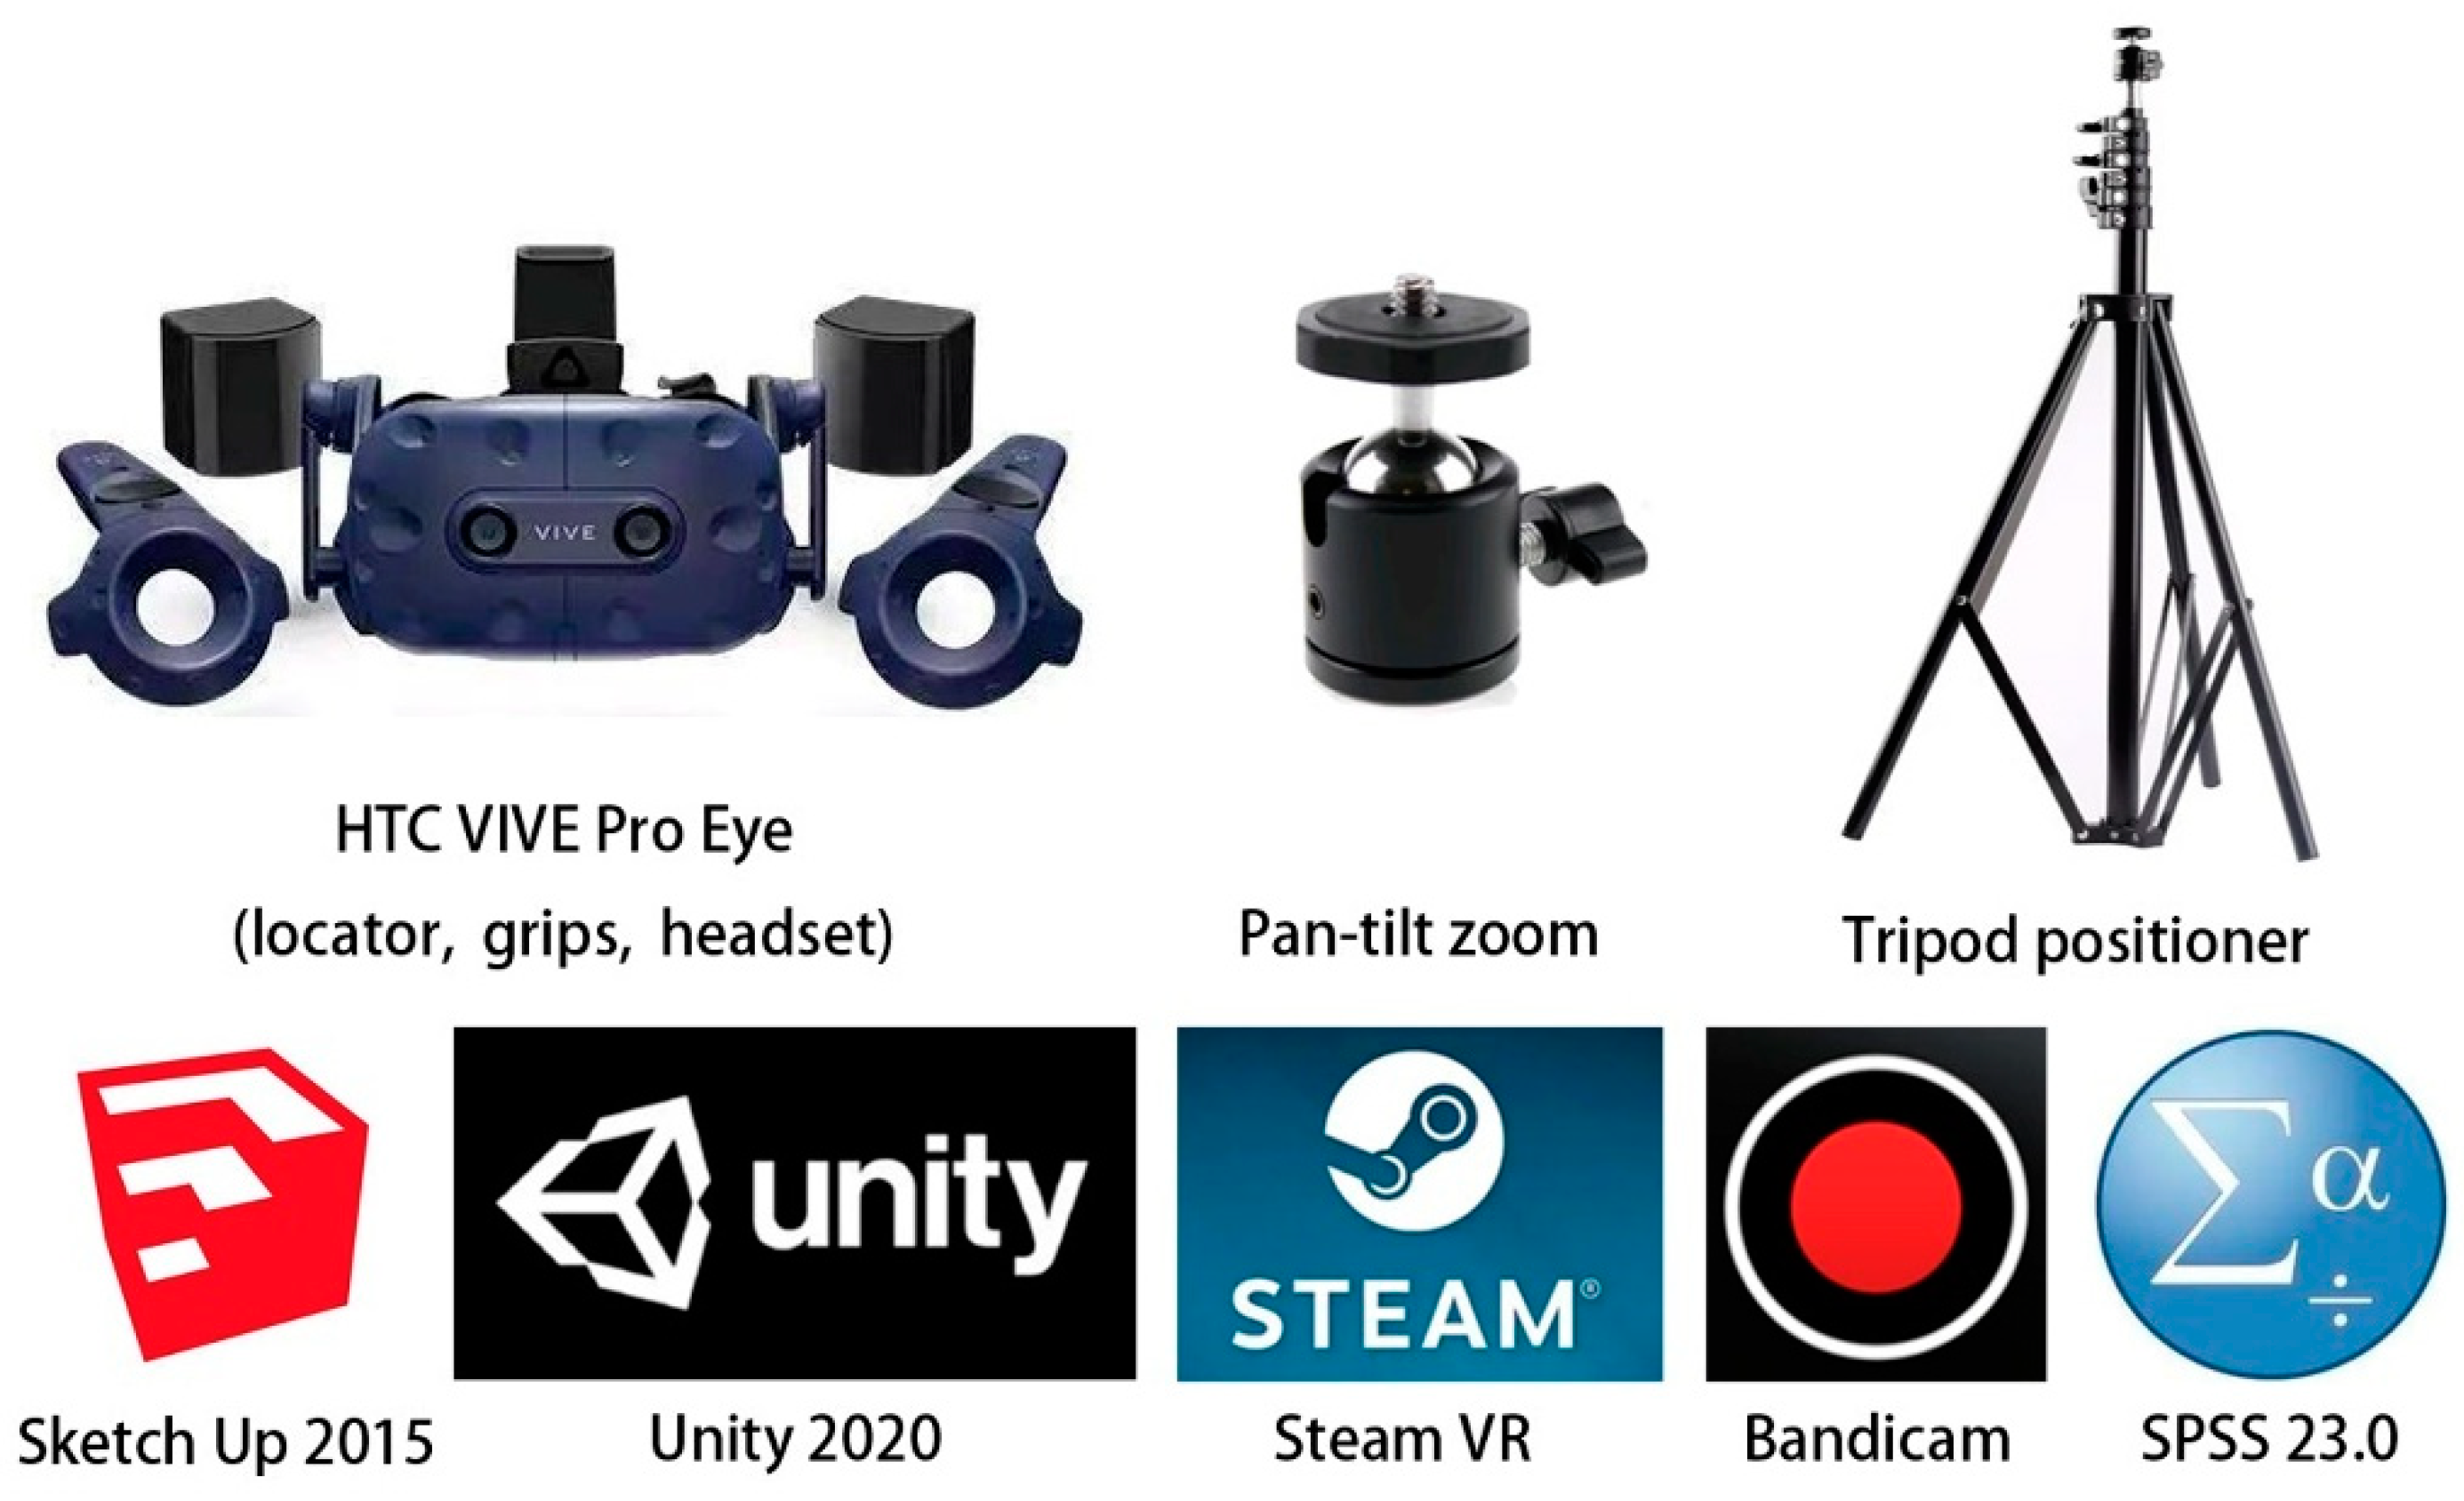
The virtual experiment used a desktop computer as the software running platform, the operating system was Microsoft Windows 10, the processor was Intel Core i7-6700K (Intel, Santa Clara, CA, USA) with a main frequency of 4.0 GHz, and the graphics card was NVIDIA GeForce GTX 1070 (NIVIDIA, Santa Clara, CA, USA), which fully satisfied the development system configuration and the smooth demand of 3D display. A virtual immersion device using an HTC VIVE Pro Eye head-mounted VR device (HTC Corporation, Hsinchu, China) and an auxiliary equipped with equipment supporting the bracket and gimbal were used (Figure 9, Table 5).
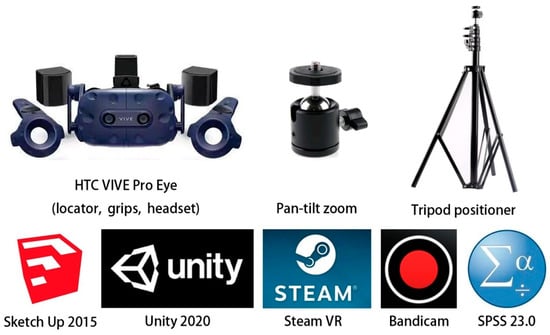
Figure 9.
The main equipment and software involved in the experiment.

Table 5.
Experimental equipment information.
The VR simulation experiment aimed at investigating the influence of unquantifiable indicators on spatial satisfaction in the public rest spaces of commercial complexes. Unquantifiable elements such as seating density, width ratio of rest space to public transportation space (d1/d2), space location, and seat form were selected as control variables for the virtual scenario design.
Owing to the large number of control variables and measurement levels, and the interaction between different influencing factors, a full-scale experiment would cumulatively produce a large number of experimental samples, and the experimental operability would be extremely weak. Therefore, a uniform experimental design was adopted. The idea of this method is to select representative test points for experiments from the perspective of uniformity to represent full-scale experiments with fewer experimental times, which is important for computer and physical experiments. This approach is widely used in many experimental fields such as medicine, industry, and environmental protection because of its “uniformity and dispersion” feature that can not only effectively reduce the number of experimental samples but also infer the optimal experimental conditions by means of statistical analysis of data [37,38]. Simultaneously, the level of measurement of the influencing factors (control variables) in the homogeneous experimental design is applicable to both numerical and qualitative categories, which is consistent with the type of variable investigated in this study and is highly practical.
Furthermore, virtual roaming experimental space scenes were developed based on variable-specific information. Finally, six groups of experimental 3D scene models were created using SketchUp 2019 software (Table 6).

Table 6.
Scenario design for VR experiments in public rest spaces.
3.3.2. Procedure and Participants
The experimental process is shown in Figure 10.
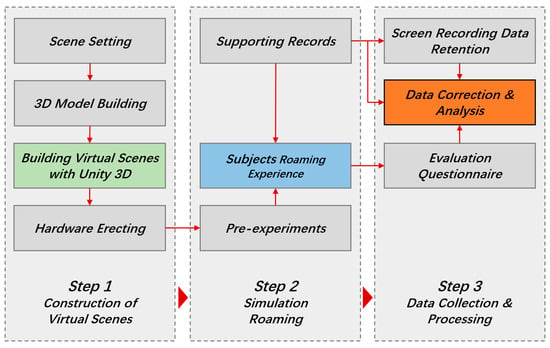
Figure 10.
Experimental operation process.
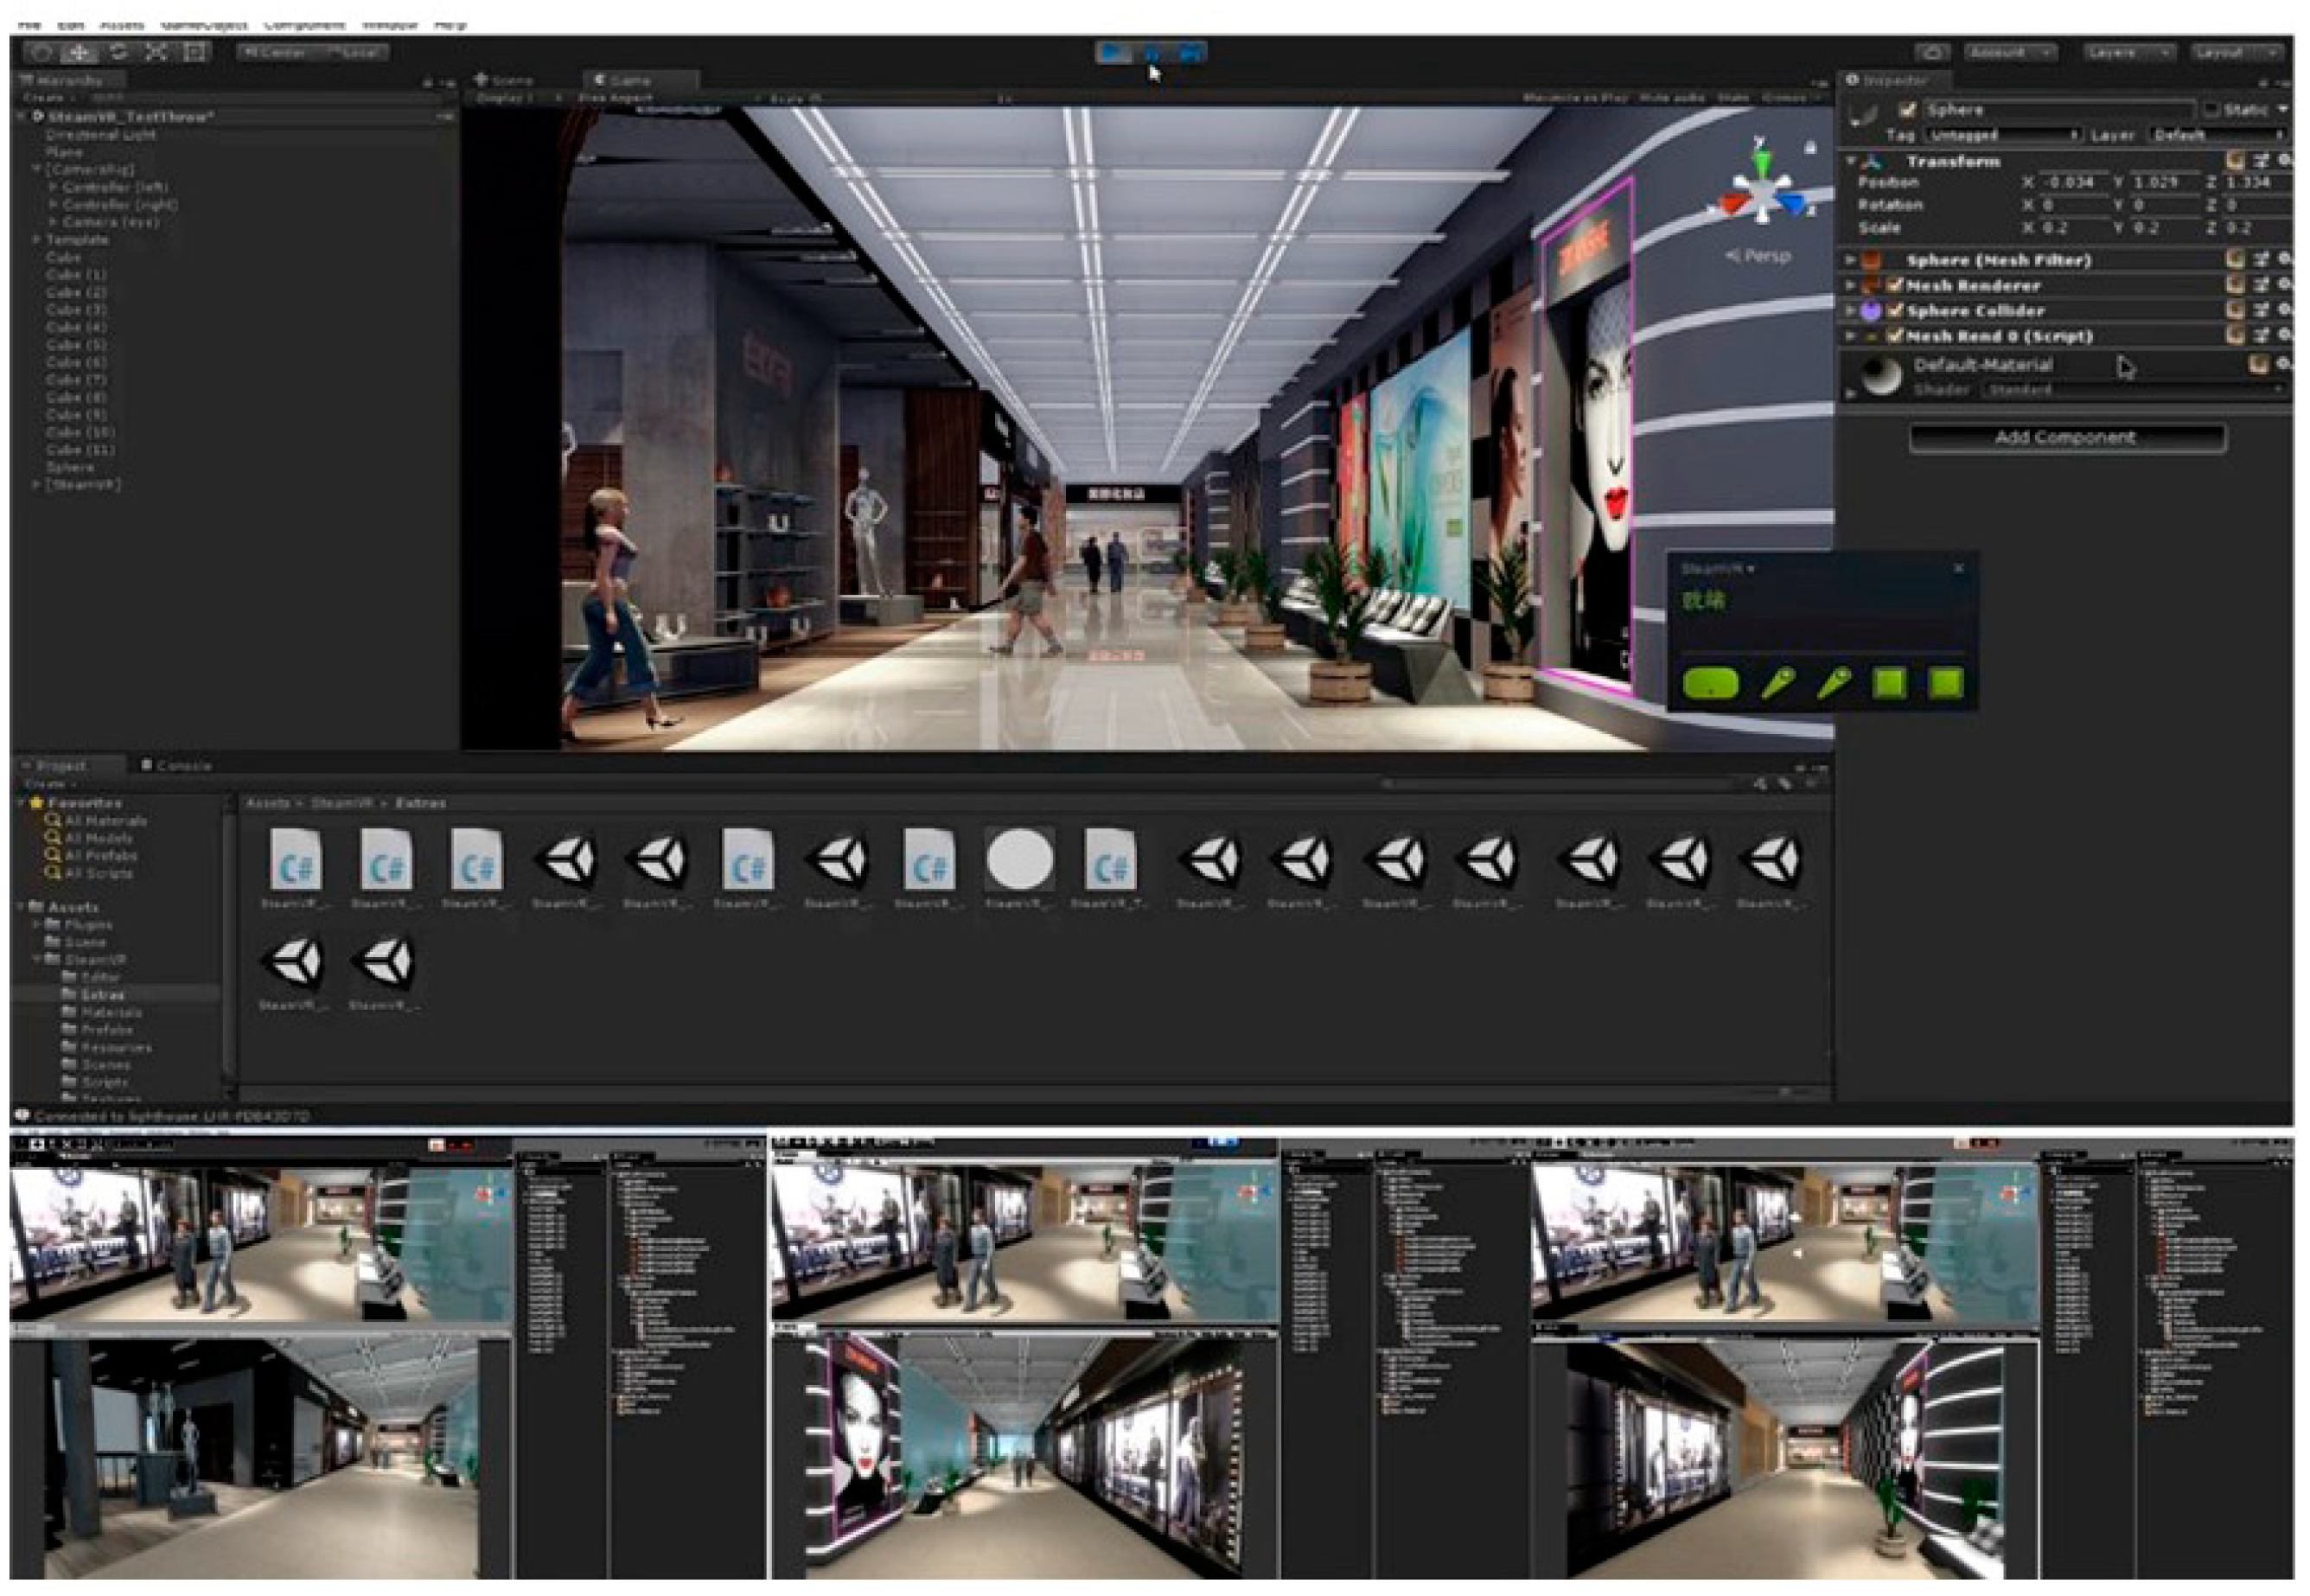
First, the SketchUp modeling software was used to build the 3D scene model, complete the material endowment, and save it as an FBX file. The mapping file package and FBX file were imported into the Unity 3D project folder, and the model units, material mapping, scene lighting brightness, and other virtual scene settings were debugged to enhance the three-dimensionality and realism of the virtual scene and complete the preparation of the virtual space scene. The HTC VIVE equipment setup was completed at the proposed experimental site and included the installation of brackets and base stations, debugging base stations, and equipment connections. Furthermore, Steam VR was used for equipment debugging, which included four steps: equipment connection, starting SteamVR, checking equipment status, and running tests.
Second, after ensuring that the equipment was effective and the virtual headset was worn correctly, a 15 min pretest experiment was conducted to familiarize the testers with the use of the equipment and ensure that no discomfort occurred during the experiment, to ensure smooth conduct of the formal experiment. After the program was started, six spatial scenes were played in a random order, and the formal experiment was conducted. Simultaneously, participants’ spatial roaming was actively observed and recorded, while the recording software was opened to record the experimental process (Figure 11).

Figure 11.
Roaming experimental process screen interface recording.
Finally, participants completed the spatial satisfaction evaluation questionnaire (Supplementary Materials S2) at the end of the scene roaming experiment. Participants saved the recorded screen mp4 files for easy playback and data correction during later analysis.
In terms of participants, the VR simulation experiment recruited college students between the ages of 20 and 25, with a total of 35 participants. College students were recruited for three main reasons. First, college students are not only the easiest subjects to recruit for this experiment but are also one of the most commonly used participant groups for behavioral experiments. The higher uniformity of research results in the field of social sciences and questionnaires for student groups than for non-student groups has also been confirmed [39]. Second, previous studies have shown that significant age differences in spatial cognitive abilities exist, and 18–25 years can be considered the same age group for spatial cognitive experiments [40,41,42,43]. Finally, young people are the mainstream users of VR, with more than 60% of users aged 16–34 [44,45]. Therefore, the young college student group will have stronger adaptability in the process of VR device operation and virtual roaming and minimize the differences in results due to other factors, such as device operation barriers or visual vertigo.
3.3.3. Data Analysis
The data collected were classified according to spatial type and analyzed using SPSS 23.0 software. Multiple regression and curve-fitting analyses were used in that order.
Because of the homogeneous experimental design approach used, a regression analysis of the experimental results was required [46]. Multiple regression analysis is a mathematical and statistical method for studying the dependence of a dependent variable on multiple control variables and is used to analyze the magnitude of the effect of individual control variables on the dependent variable. In this study, data on public rest spaces were subjected to multiple regression analysis to ascertain the extent to which the control variables influenced the overall satisfaction rating scores.
To investigate the relationship between spatial perception and satisfaction evaluation in the different experimental scenarios, the collected evaluation data were analyzed using curve fitting after calculating the average value. The evaluation indices of “willingness to prefer” and “willingness to stay” were introduced to explore the relationship between spatial experience and these two willingness factors.
4. Results
4.1. Significant Influencing Factors
According to the importance–performance process, a paired-samples t-test was first required to determine whether there was a significant difference between the importance (I) and performance (P) values of each indicator in the public space, to eliminate evaluation indicators that were not suitable for importance–performance analysis in each group. The paired-sample t-test is a data analysis method that detects whether there is a significant difference between two groups of statistics with normal means from the aggregate. If the test result p-value (two-sided) is less than 0.05, a significant difference between the two is indicated. The results (Table 7) show that the p-values of all the indicators were less than 0.05, which is significant and suitable for importance–performance analysis.

Table 7.
Summary sample of differences between importance and performance data.
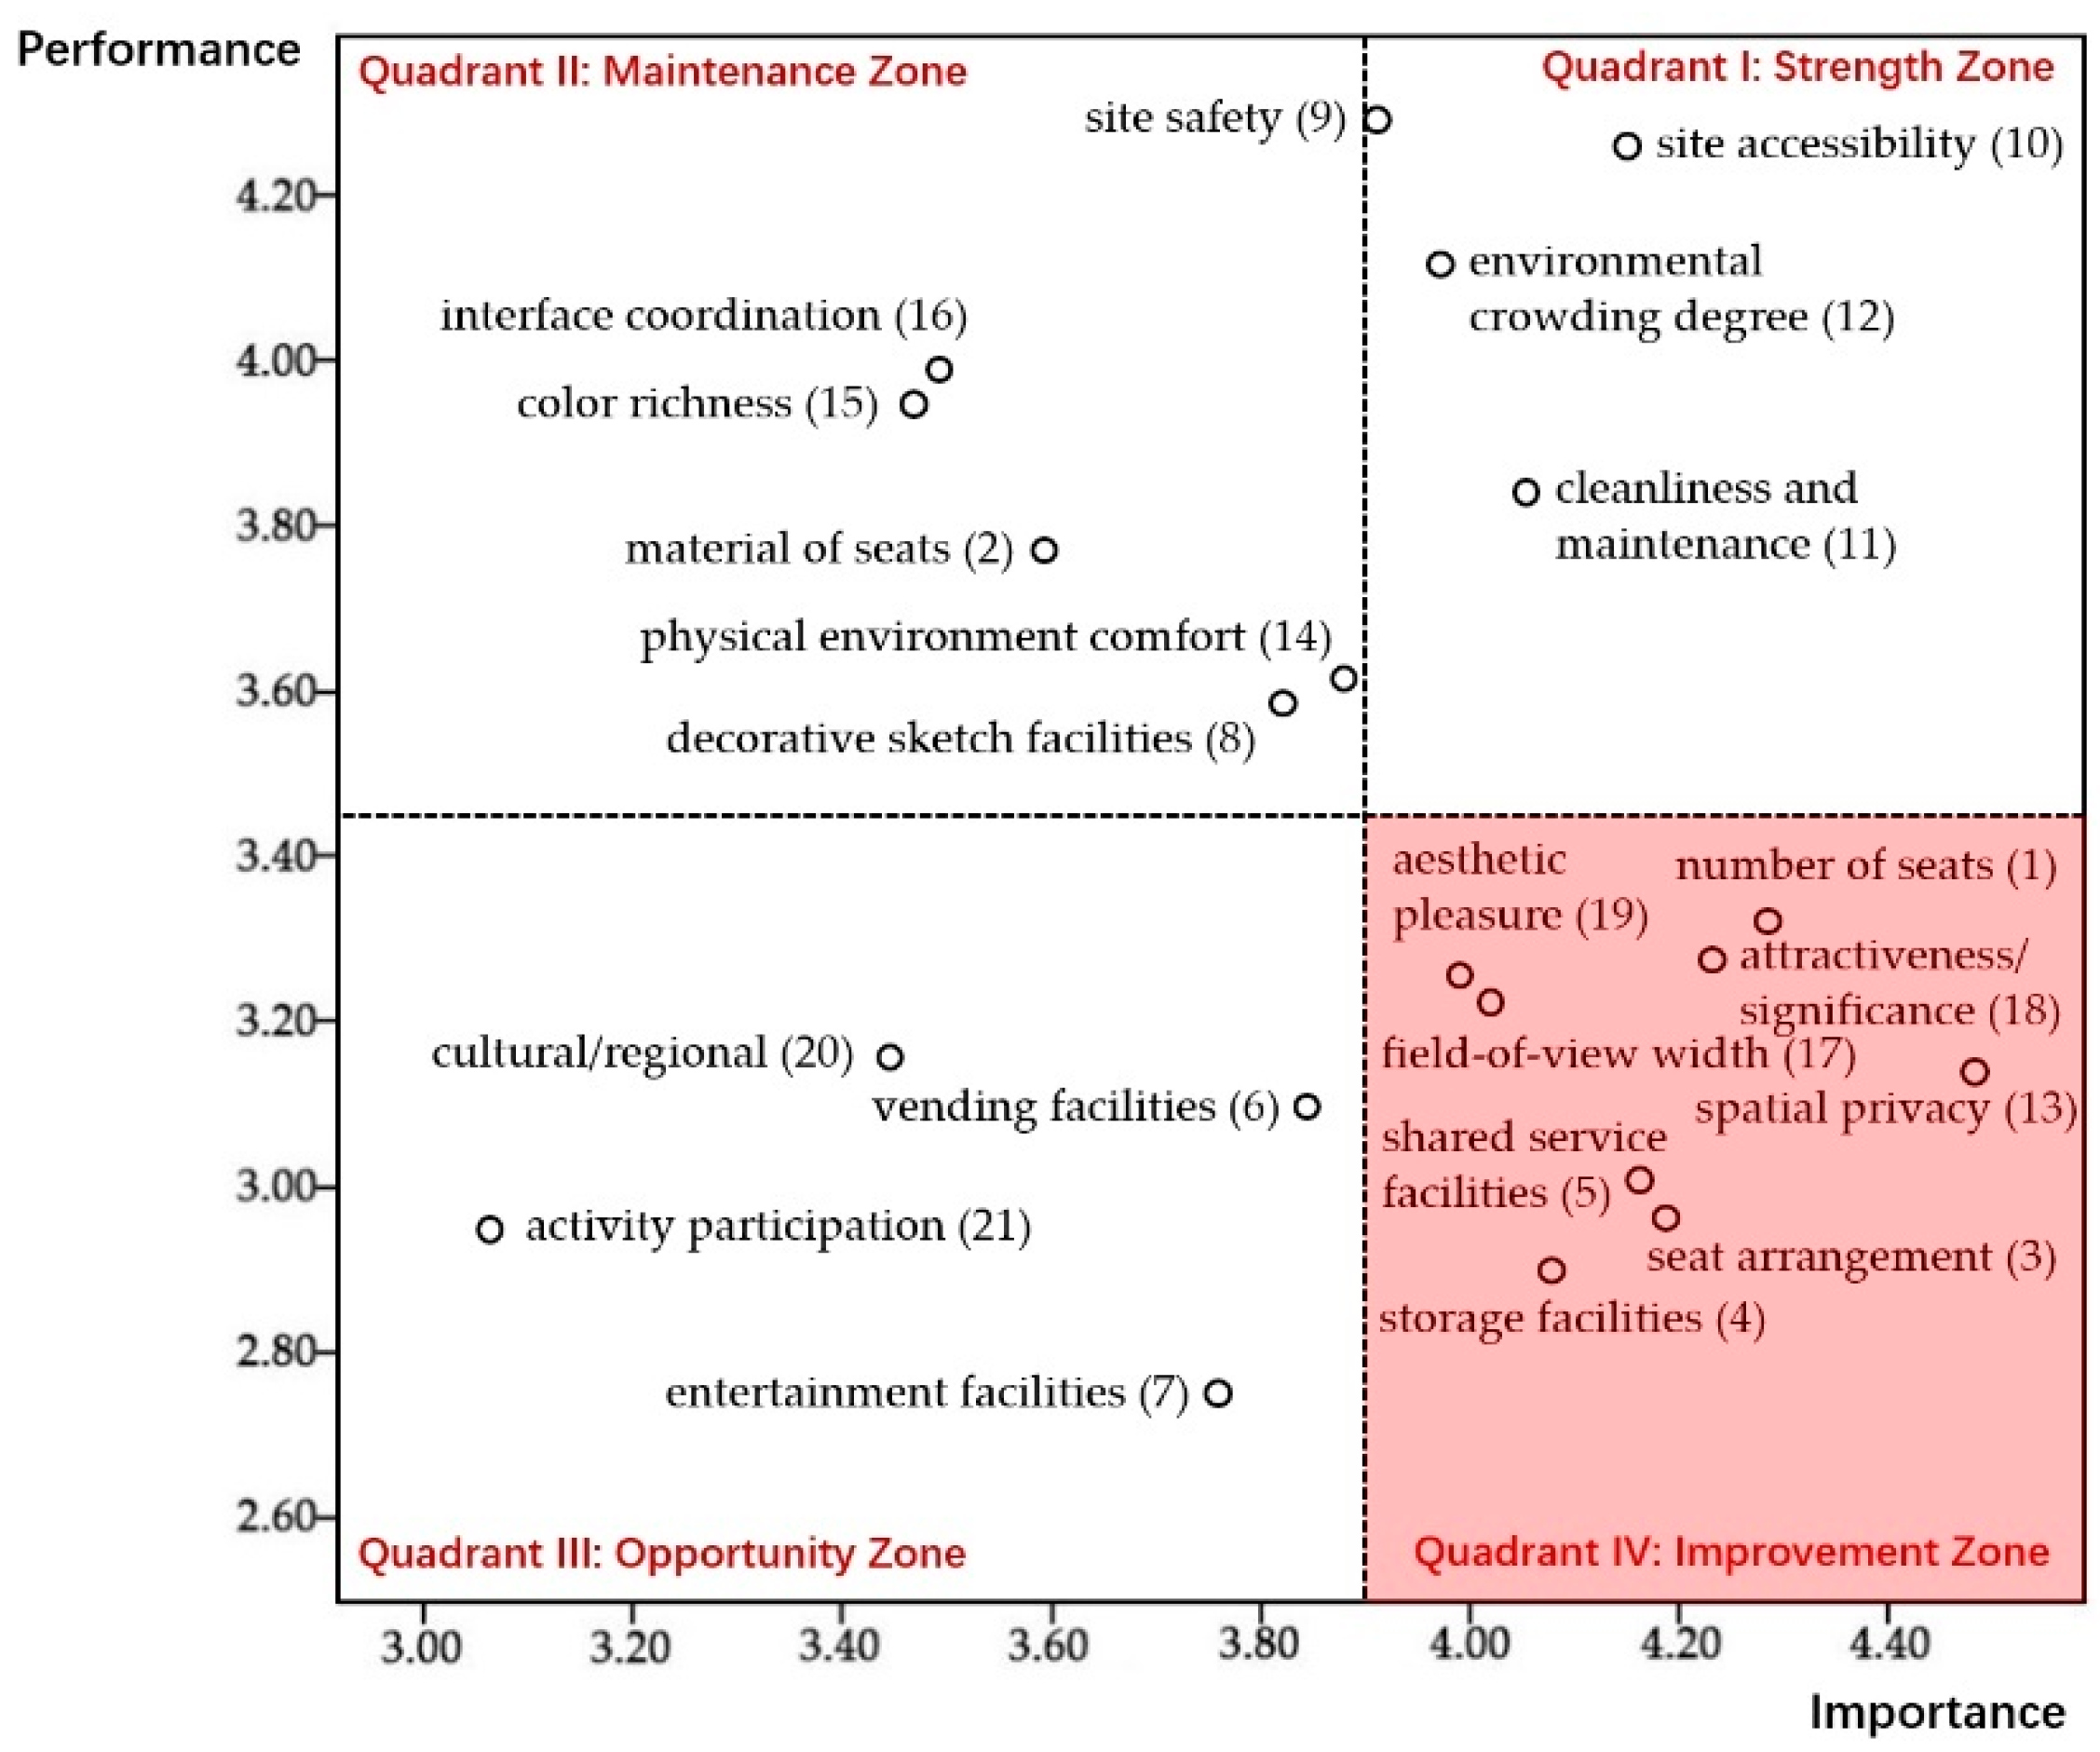
We mapped out the public rest space importance–performance analysis matrix and summarized the evaluation indicators in quadrant IV (urgent improvement area). The mean values of importance and expressiveness of each evaluation index of the path-type public rest space were 3.90 and 3.45, respectively, and the overall satisfaction was at a low level. As shown in Figure 12, quadrant IV (urgent improvement area) contains eight indicators: number of seats (1), seat arrangement (3), storage facilities (4), shared service facilities (5), spatial privacy (13), field-of-view width (17), attractiveness/significance (18), and aesthetic pleasure (19).
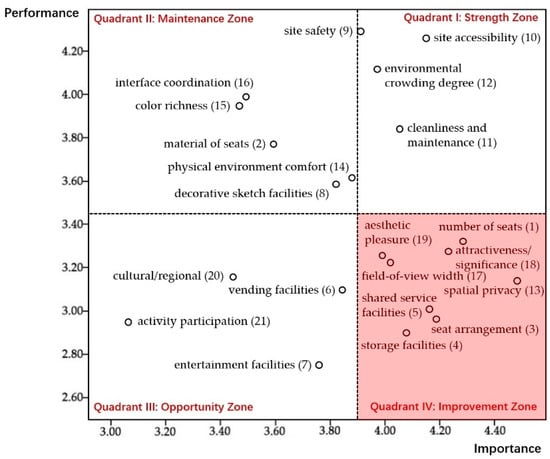
Figure 12.
Importance–performance analysis matrix diagram of path-type public rest space.
4.2. Influence Mechanisms of Quantifiable Factors
The correlation results are shown in Table 8 and Table 9, and the values in the tables are Pearson correlation coefficients. The results of the data correlation analysis revealed the following.

Table 8.
Results of correlation analysis between physical elements and evaluation indicators.

Table 9.
Results of correlation analysis between perceptual experience and evaluation indicators.
In Table 8, among the objective physical elements, sitting density and spatial privacy showed a significant negative correlation (r = −0.652, p < 0.05). This means that the higher the seating density, the lower the satisfaction rating for spatial privacy. Interface transparency was significantly positively correlated with aesthetic pleasantness (r = 0.820, p < 0.05). This indicates that, as the transparency of the interface increases, the aesthetic pleasantness rating increases. The density of decorative vignettes was significantly positively correlated with aesthetic pleasantness (r = 0.514, p < 0.05). This means that the higher the density of decorative vignettes in the space, the higher the aesthetic pleasantness evaluation score.
As shown in Table 9, among the elements of perceptual experience, visual permeability was significantly negatively correlated with the form of the seating layout (r = −0.481, p < 0.05) and with the attractiveness/significance evaluation (r = −0.619, p < 0.05). This shows that an increase in view permeability will change the trend so it takes the opposite direction in seating layout and attractiveness/significance rating scores. Store density showed a significant negative correlation with view openness evaluation (r = 0.412, p < 0.05), indicating that the higher the density of surrounding stores, the higher the user view openness evaluation. There was a significant positive correlation between functional density and attractiveness/significance evaluation (r = 0.734, p < 0.01). This indicates that the greater the variety of store functions within the perimeter of the public rest space, the greater the attractiveness/significance evaluation scores.
The results of the correlation analysis between satisfaction with the evaluation indexes to be optimized and the spatial components are summarized in Table 10.

Table 10.
Summary of correlation analysis.
4.3. Influence Mechanisms of Unquantifiable Factors
4.3.1. Influence of Spatial Elements on Overall Satisfaction
Multiple linear stepwise regression analysis was performed on the satisfaction comprehensive evaluation scores with four control variables: seating density, d1/d2 (width ratio), location, and seating form, to derive the weight of each factor’s influence on the satisfaction evaluation scores. The quotient (i.e., F-value) of removing the within-group mean square with the between-group mean square was much greater than 1, which indicates that the data are statistically significantly different in the image of all four factors on the comprehensive evaluation, and the results of the analysis are as follows.
The regression model analysis results were significant (p < 0.05), and the control variables as a whole explained a significant proportion of the variance of the overall satisfaction rating (Table 11). The location of the relative weight was larger, with an absolute value of 0.356; the width ratio weight was the second largest, with an absolute value of 0.163; and the seat form and seat density influence weights were relatively small, with absolute values of 0.108 and 0.009, respectively (Table 12).

Table 11.
Analysis of variance using control variables.

Table 12.
Factors influencing overall satisfaction.
In conclusion, the overall satisfaction rating for the public rest space was primarily influenced by the location and two control variables, d1/d2 (width ratio). In contrast, the two variables of seating form and seating density exerted a relatively limited influence on satisfaction. Consequently, the subsequent analysis employed a curve-fitting diagram in the regression analysis to examine the impact of location on the sense of privacy and attractiveness of a space and the influence of the width ratio on the sense of spatial scale and spatial pleasantness. This approach facilitated the identification of a more intuitive relationship between subjective experience and curve evaluation.
4.3.2. Influence of Spatial Elements on Preference for Selection and Staying
Two evaluation perspectives were introduced, namely, “preference for selection” and “preference for staying”. The curvilinear relationships between the ratings of spatial privacy and spatial attractiveness were analyzed from the perspective of “preference for selection”, while the curvilinear relationships between the ratings of spatial pleasure level and spatial scale sense were analyzed from the perspective of “preference for staying”.
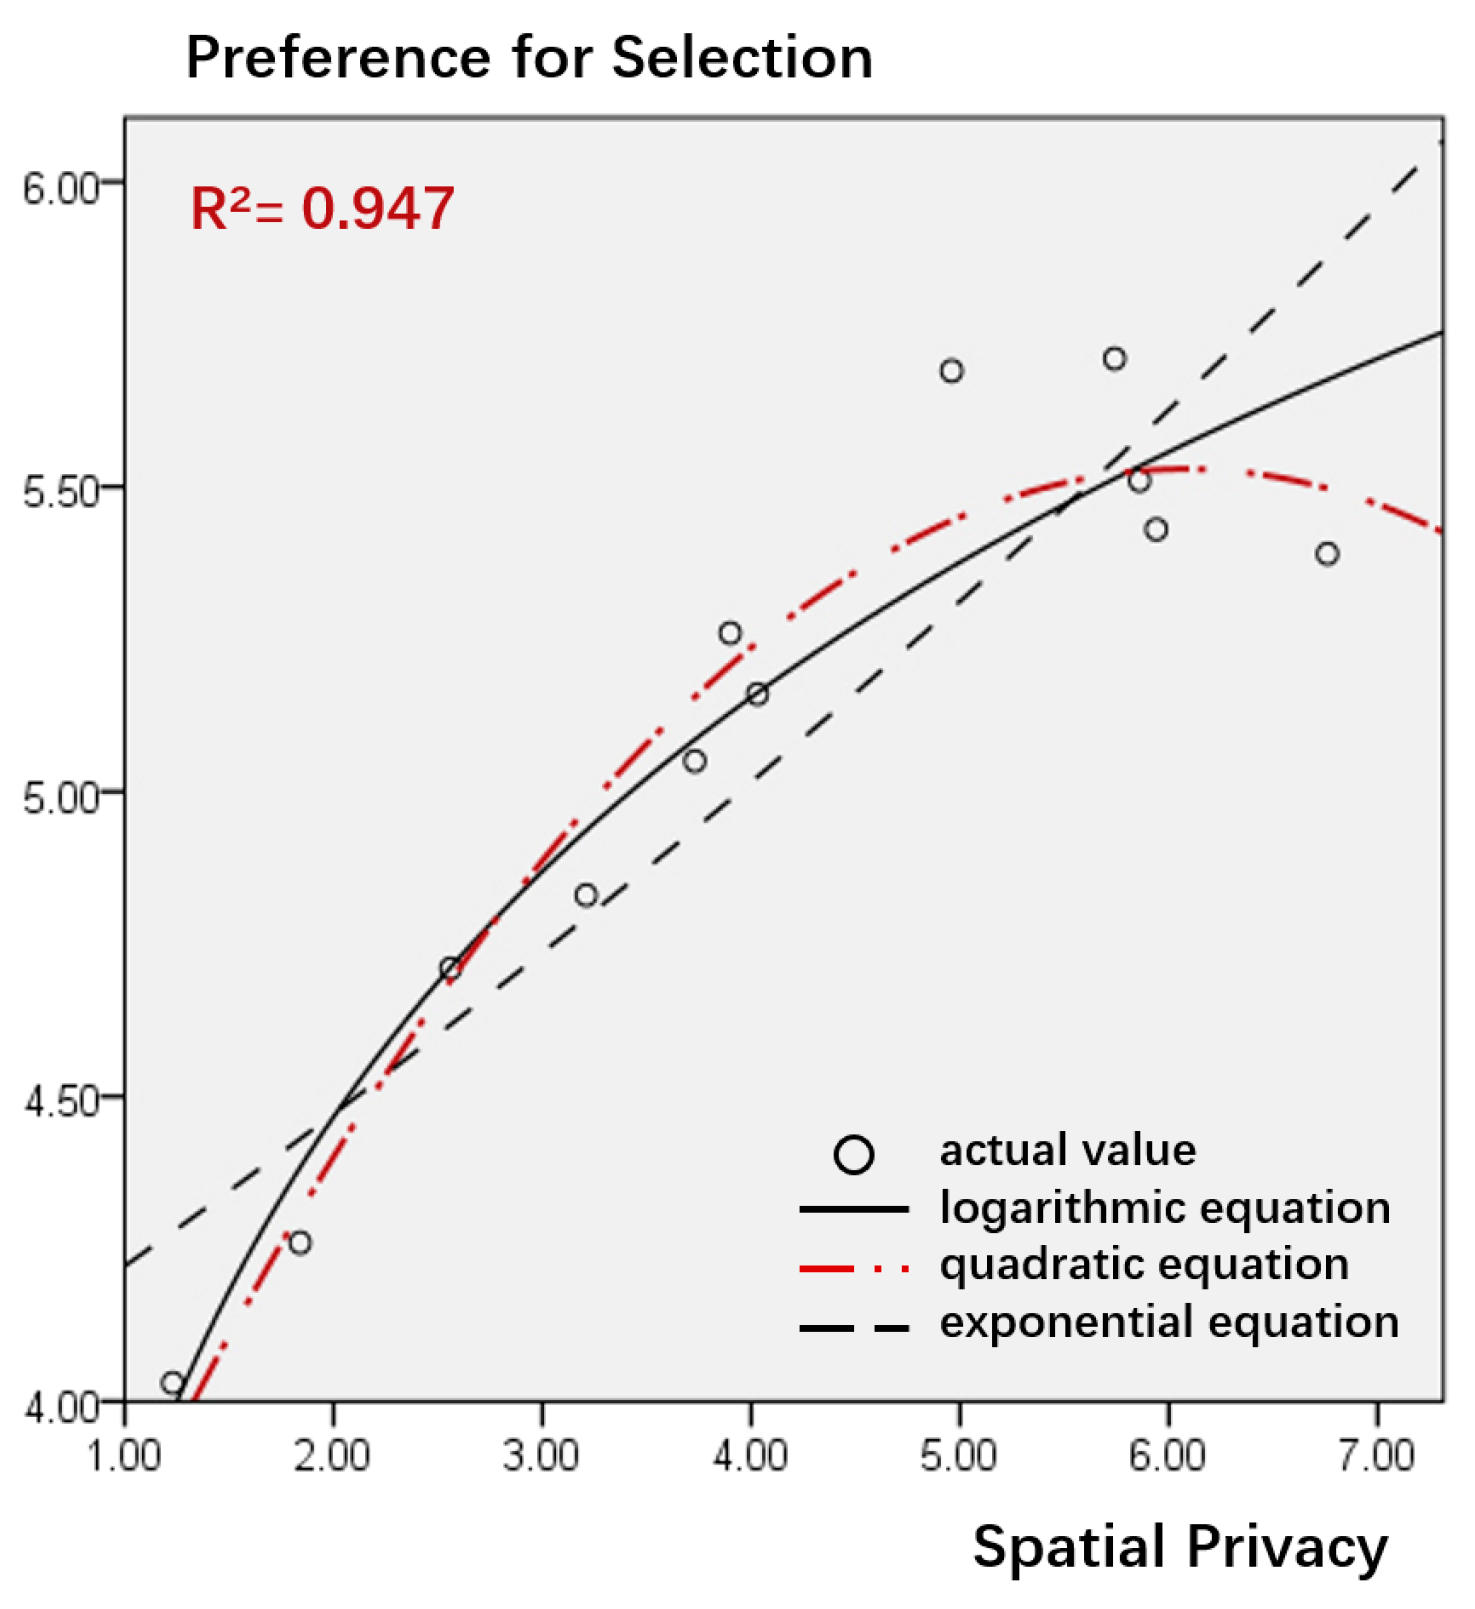
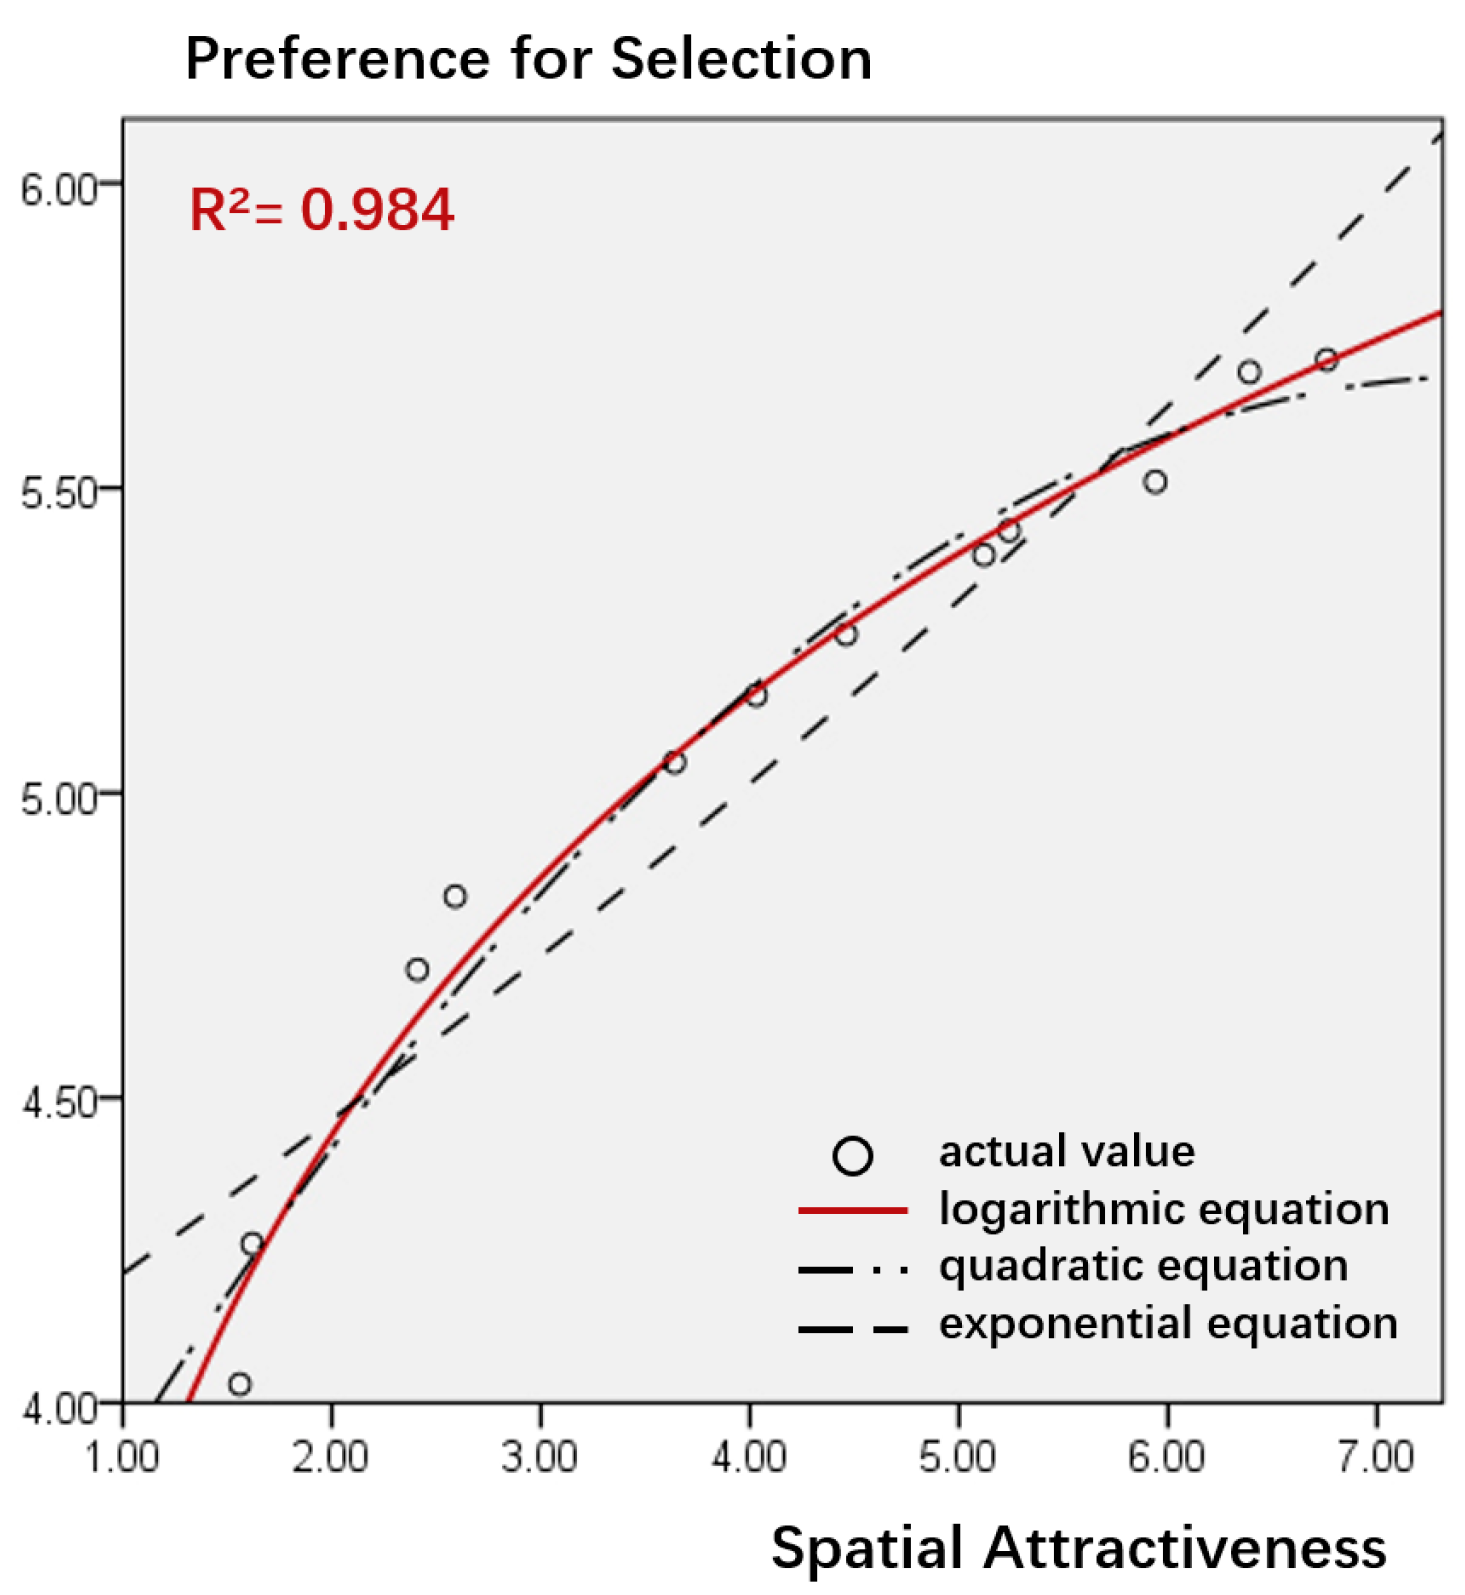
A peak was observed for medium-to-high levels of privacy in terms of the effect on selection preference. Conversely, a low or high level of privacy decreased people’s willingness to behave in public resting spaces (Figure 13). This may be because when the feeling of privacy is too high, it leads to lower behavioral ratings owing to a stronger sense of spatial segmentation from public movement, which, in turn, reduces the crowd’s perception of overall public space vitality. When the level of privacy is insufficient, the resting space is unable to fulfil the requisite demand for such a space, which, in turn, results in the public being disinclined to use it. Therefore, public rest spaces should be designed with a balance between the need for privacy and the creation of a vibrant atmosphere to better meet the psychological and behavioral expectations of the public in terms of the use of space. Concurrently, the evaluation of preference for selection increased in conjunction with the enhancement of space attraction. Furthermore, as the level of attractiveness increases, the impact of preference enhancement gradually diminishes (Figure 14).
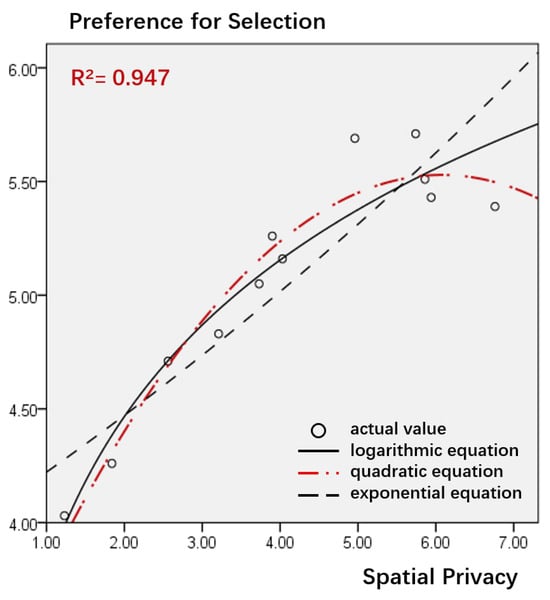
Figure 13.
Curve fitting analysis of spatial privacy and preference for selection.
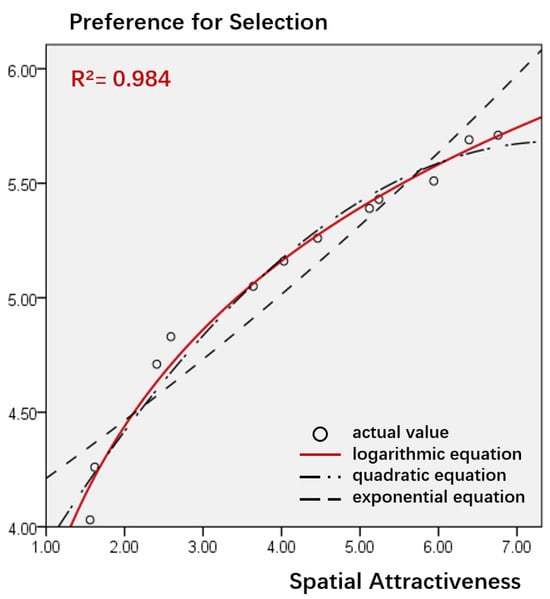
Figure 14.
Curve fitting analysis of spatial attractiveness and preference for selection.
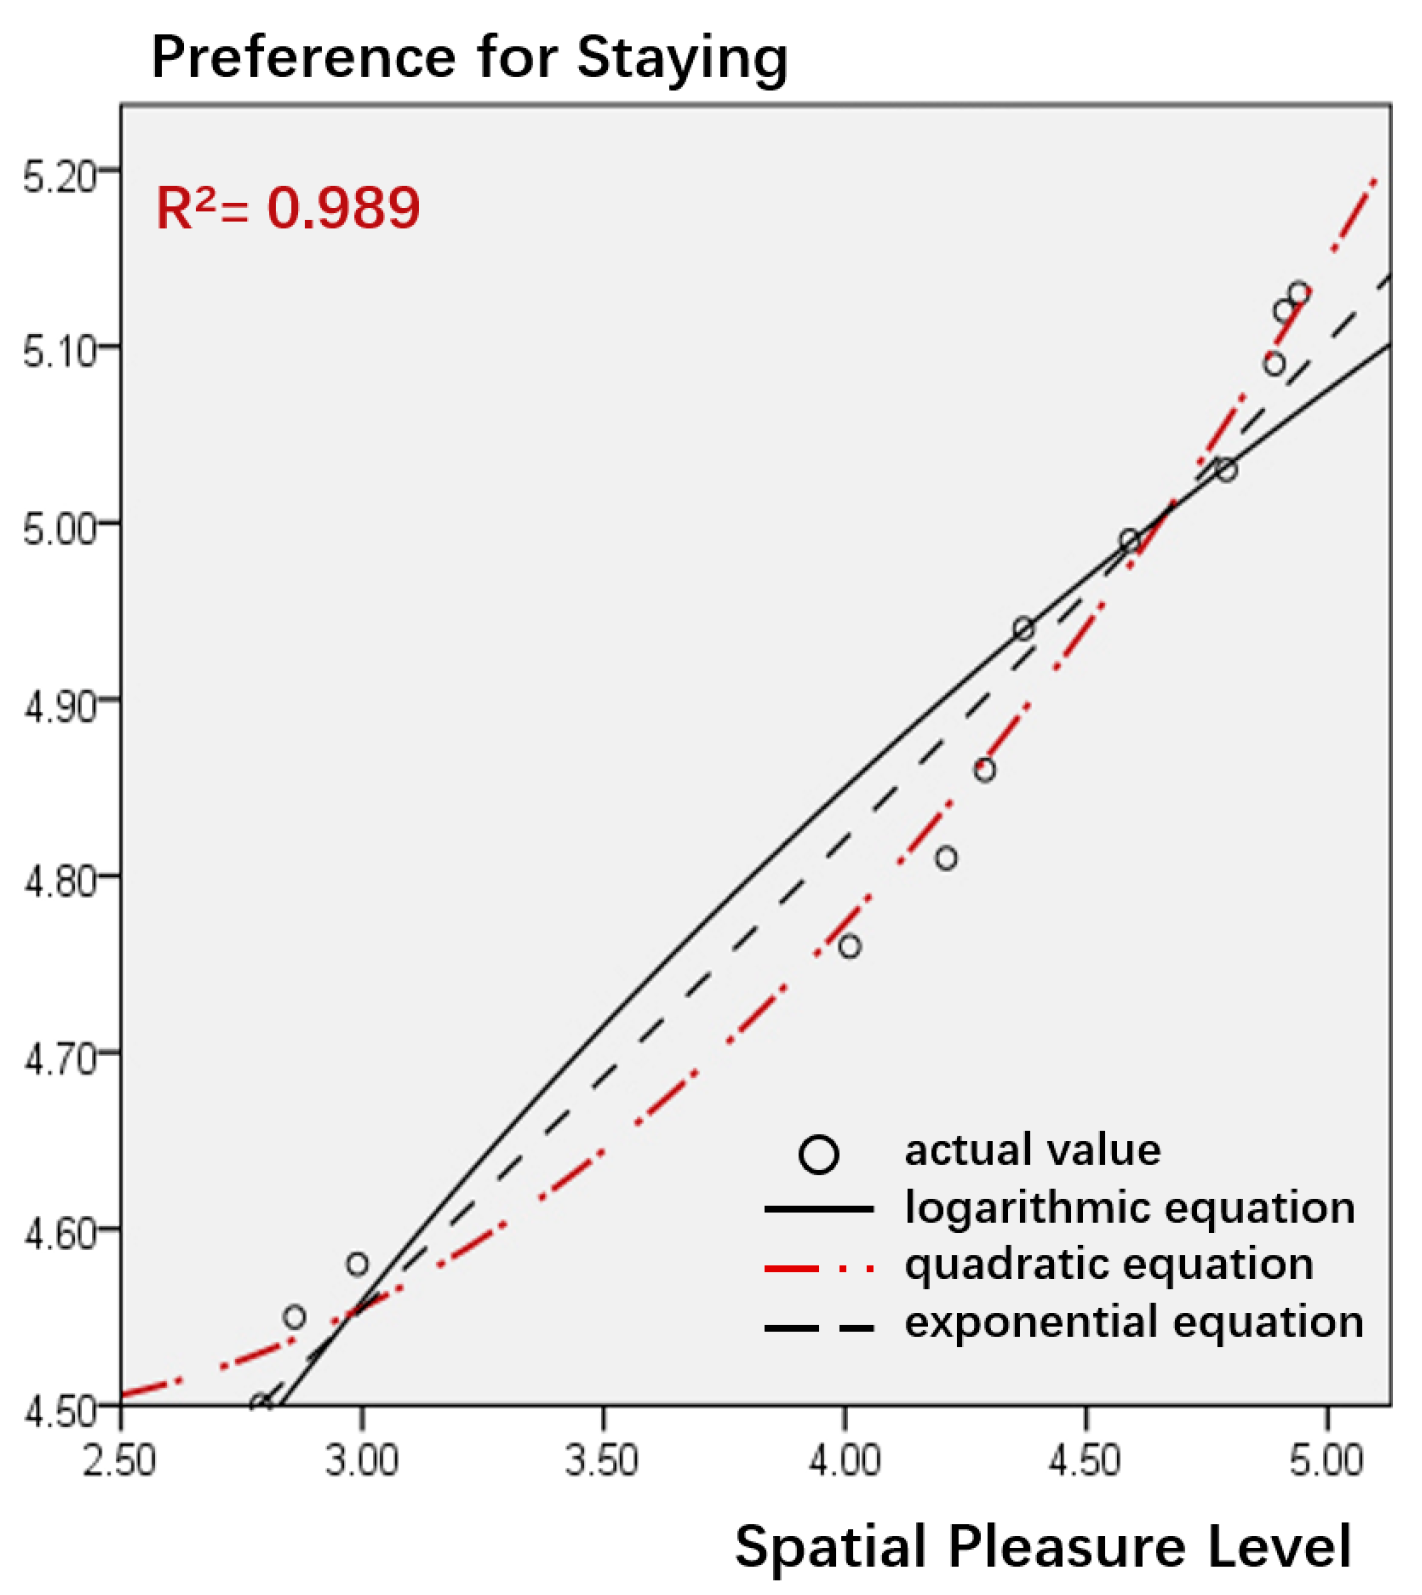
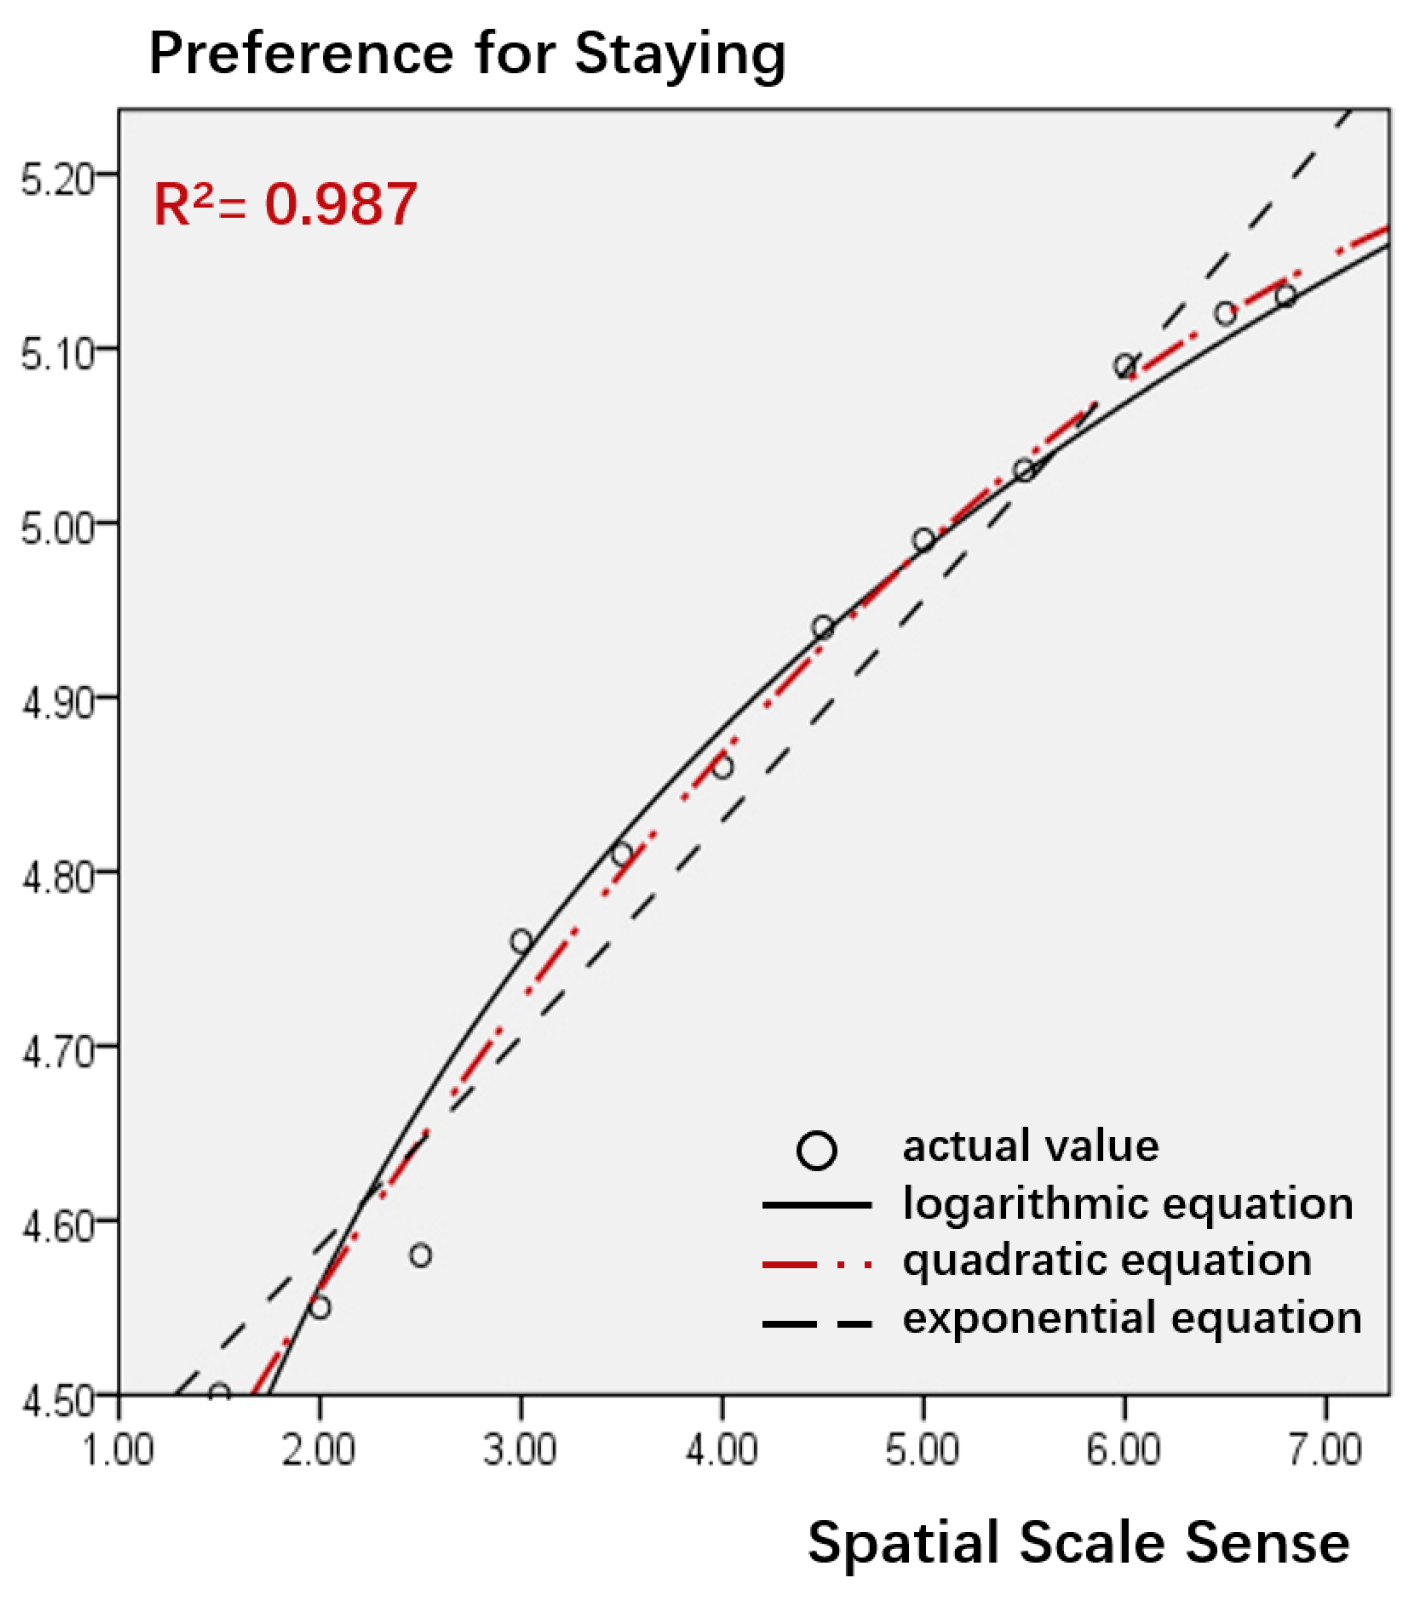
Regarding the impact on preference for staying, the relationship between spatial pleasure level and preference for staying demonstrated a clear upward trajectory. When the spatial pleasure level was medium or higher, the increase in preference for staying evaluation score was particularly pronounced (Figure 15). While the impact of spatial scale sense on the evaluation of preference for staying exhibited fluctuations when the level of scale perception was low, the overall trend demonstrated a gradual increase with a rise in spatial openness perception. Conversely, as the level of spatial scale sense increased, the effect on preference for staying tended to diminish (Figure 16). The preceding analyses demonstrated that an increase in both spatial pleasure level and spatial scale sense can facilitate an increase in users’ preferences for staying in public spaces.
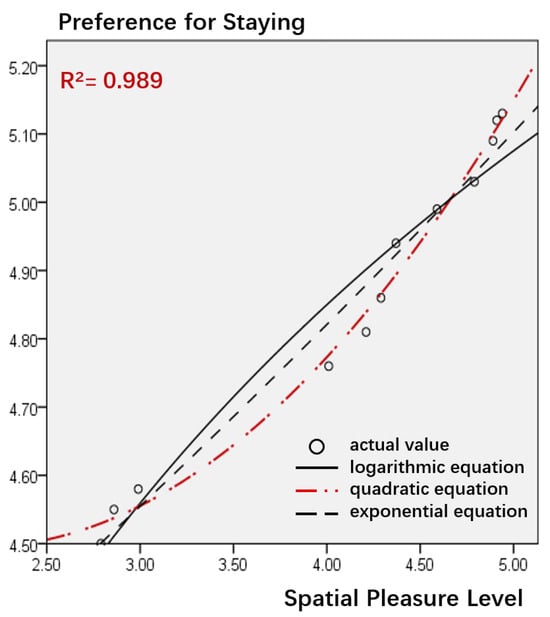
Figure 15.
Curve fitting analysis of spatial pleasure level and preference for staying.
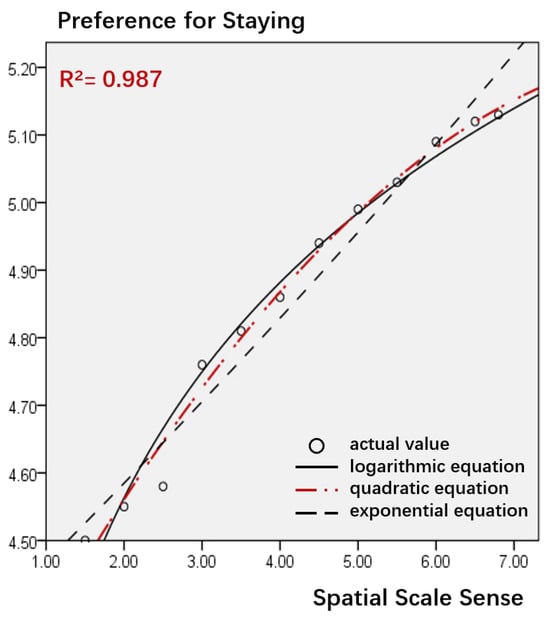
Figure 16.
Curve fitting analysis of spatial scale sense and preference for staying.
5. Discussion
After the importance–performance analysis, the evaluation indicators of interior public spaces that needed to be optimized were number of seats (1), seat arrangement (3), storage facilities (4), shared service facilities (5), spatial privacy (13), field-of-view width (17), attractiveness/significance (18), and aesthetic pleasure (19). The VR-based simulation assessments not only provide us with precise quantitative data but also facilitate a profound understanding of user preferences and behavioral patterns, which can be leveraged to develop more personalized and user-centered public spaces within shopping malls.
By analyzing user interactions and feedback within the virtual environment, designers can accurately capture the diverse needs and expectations of customers, enabling them to tailor designs that are more aligned with reality and comprehensively enhance the overall experience. Building on this foundation, our proposed optimization strategies focus on four aspects: multiple purposes of facilities, intensification of boundaries, complexity of functions, and integration of resources. These strategies are well-aligned with the mainstream trends in shopping mall design.
Specifically, the push for multipurpose facilities reflects the industry’s shift towards creating flexible spaces that can accommodate a variety of activities and events, thereby increasing customer engagement. The intensification of boundaries acknowledges the need for clear yet inviting spatial definitions that enhance the shopper’s sense of place and navigation. The complexity of functions resonates with the trend of offering immersive and multifaceted experiences within shopping centers, moving beyond traditional retail to incorporate entertainment, dining, and leisure activities. Lastly, the integration of resources underscores the importance of sustainable and efficient use of space, materials, and technology, which is a prominent concern in modern architectural and interior design practices.
These strategies are guided by a correlation analysis of objective composition elements and the results of VR experimental research (Table 13). By aligning our approach with these design trends, we aim to create shopping center interior public spaces that are not only optimized for user satisfaction but also resonate with broader industry shifts towards more dynamic, sustainable, and experiential environments.

Table 13.
Spatial contextualization optimization strategy and corresponding content.
5.1. Design Suggestions According to the Multiple Purposes of Facilities
The objective of this study was to propose optimal design strategies for resting seats, storage facilities, and shared service facilities, leveraging VR simulations to ensure both high user satisfaction and efficient space utilization. Specific design techniques can be classified into two categories: multipurpose functionality and facility utilization, and modular seating combinations. First, in the initial stage of the design process, seats can be created with flexible backrests that allow a combination of sitting, resting, and storage functions. VR simulations were employed to test various configurations and combinations of these flexible seats, allowing designers to assess user comfort, accessibility, and overall satisfaction in a virtual environment. Furthermore, seating can be integrated into existing facilities or structures within a designated area. Auxiliary seating can be formed by utilizing landscape green tables, exhibition stages, and space decorations, thereby adapting the limited area of path-type public rest spaces to accommodate various modes of use or scene decoration requirements. VR simulations helped to visualize these integrations and assess their impact on space utilization and user experience.
Second, a modular seating combination mode was employed. Seats exhibit commonalities in form, features, standard scales, and so forth. Different seat forms could be combined by selecting uniformly sized and collocable seat modules. VR simulations were used to test the modularity and adaptability of these seat modules, ensuring that they could be easily reconfigured to meet changing needs and preferences. In addition to being placed according to the scale of the path of the different lines of movement and the seating requirements of the rest space, the overall style of the facility can be maintained through coordination and unity, which was also evaluated and refined through VR simulations.
Lastly, by integrating the analysis of user behavior data monitored during VR experiments with subjective feedback collected through post-experiment questionnaires, we derived the relationship between users’ spatial perception and their satisfaction evaluations across various experimental scenarios. Using these findings as a design basis ensured that the design of shopping malls not only aligns with user expectations and needs but also achieves efficient space utilization.
5.2. Design Suggestions According to the Intensification of Boundaries
In terms of boundary intensification, the boundaries of a given space can be defined in terms of the enclosure and division of solid or imaginary bodies. This intensification holds significant importance in enhancing user privacy and comfort within shopping center public spaces. By clearly delineating different functional areas, a sense of security and privacy is created for users, allowing them to relax and enjoy their surroundings without feeling exposed. The results of the VR experiment indicated that the satisfaction score for the unilateral layout was significantly higher than that for the intermediate layout.
Therefore, when a space interface is situated on one side of a path-type public space, it should be arranged in a manner similar to that of a unilateral layout of lounge seating, which forms a harbor-style resting area that allows for “passing through, but not entering”. This arrangement not only respects user privacy but also enhances their overall comfort by providing a cozy and secluded spot within the bustling shopping center. When one side of the court is traversed via a high space, the local hollow way can be utilized to “protrude” rest seats, thereby disrupting the linear boundary form of the traffic space. This simultaneously enhances the sense of place of the public rest space and privacy, while facilitating interaction between the commercial traffic dynamic line and each other in its own way, and while also reducing interference and ensuring that the rest of the area is tranquil and uninterrupted.
In such a configuration, the wall or exterior environment on one side may be considered. The creation of a recessed public rest space on one side of the wall or in the outside world can enhance spatial stability and further contribute to user comfort. Furthermore, the height of greenery and structures can impede visibility, which is a common method for creating private spaces in interior design. By strategically placing these elements, a balance between openness and privacy can be achieved, making the shopping center a more enjoyable and comfortable place for all.
Moreover, the use of VR technology plays a crucial role in exploring and refining the boundary intensification strategies within shopping mall public spaces. Compared to traditional design methods, VR simulations offer the advantage of efficient iteration. Designers can quickly adjust parameters such as boundary settings, materials, and colors in the virtual environment, observe their impact on the spatial effect, and rapidly identify the optimal solution. This not only saves significant time and costs but also improves design efficiency and quality. Furthermore, VR simulations can collect behavioral data from users within the virtual space, such as dwell time, movement trajectories, and gaze foci. By analyzing these data, designers can gain a deeper understanding of users’ reactions and preferences towards different boundary strategies, providing a scientific basis for the optimization of spatial strategies.
5.3. Design Suggestions According to the Complexity of Function
The functional complexity of interior public spaces exerts a significant influence on user satisfaction. This diversity offers users a rich array of choices and conveniences, enabling them to fulfil multiple needs within the same space. However, if the functionality is excessively complex and lacks a reasonable layout and navigation guidance, users may feel confused and discomforted, thereby diminishing their satisfaction. With regard to functional compositing, an increase in attractiveness evaluation scores derived from the findings of the VR experiment influenced individuals’ behavioral inclinations to favor public rest areas. Conversely, the correlation results demonstrated that satisfaction scores for attractiveness/significance correlated with functional density and visual permeability. Considering the flexibility inherent to the path-type public rest space, an optimized design strategy for functional composites is proposed from two perspectives: the composite dynamic consumption space and sharing with the commercial dynamic line. First, a small business space with a brief shopping period, such as catering, book bars, or temporary consumption spaces, can be combined with a path-type public resting space. This integration can enhance the space utilization rate and comprehensive functional density of the space, while also ensuring the continuity of the commercial atmosphere and vitality of the indoor public space. Second, the path-type public rest space can be integrated with the traffic system, thereby achieving a composite use of the space. For instance, the integration of rest areas with wide steps facilitates cross-layer connections, thereby reducing consumers’ sense of spatial oppression. They also enable the creation of distinctive public social spaces.
However, this increase in functional complexity must be carefully managed to avoid overwhelming users and compromising their comfort and ease of navigation. VR experiments can be instrumental in achieving this balance. By simulating different functional configurations and observing user behavior in the virtual environment, designers can gain insights into how users interact with and navigate through multifunctional spaces. This allows for the identification of potential bottlenecks, confusing layouts, or areas where users may feel uncomfortable or disoriented. Furthermore, VR simulations can help assess the impact of functional density and visual permeability on user satisfaction. By manipulating these variables in the virtual environment and collecting user feedback, designers can refine their design strategies to ensure that the space remains attractive, functional, and easy to navigate.
5.4. Design Suggestions According to the Integration of Resources
In terms of resource integration, the design begins with the integration of function, space, and traffic, with the objective of maximizing the value of space. The correlation analysis and VR experimental results indicate that enhancing the perception of openness enhances users’ willingness to stay in the public rest space of shopping malls. This highlights the potential of VR simulations in optimizing resource allocation to create more inviting and comfortable environments. Furthermore, the evaluation of aesthetic pleasure and transparency of the interface were significantly correlated. Given the restricted dimensions of path-type public rest spaces, the interpenetration of the visual environment can be enhanced by connecting other spatial elements to form an organized continuous space through the application of an integrated design. First, the location of the space can be selected and adjusted to expand the spatial field of view and strengthen visual coherence with the surrounding space. To illustrate, the exchange of sight lines between the resting spaces located on different levels of the plane can be achieved vertically through the height of the space. An additional option would be to consider the arrangement of seating on the side of the interface with high transparency, such as a curtain wall, to strengthen the visual connection with the outdoor environment.
In the context of VR simulations, the integration of public space resources can be further refined to enhance user satisfaction and promote more sustainable architectural designs for shopping centers. By simulating different scenarios and gathering user feedback, designers can identify the most effective ways to optimize space utilization, improve visual appeal, and create a more comfortable and inviting environment for users. This user-centered approach, combined with sustainable design principles, leads to higher levels of satisfaction, loyalty, and environmental responsibility, ultimately contributing to the long-term success and sustainability of shopping centers.
5.5. Benefits and Limitations
This study finds that VR simulations offer a powerful and valuable means for further analyzing the shift towards time-based consumption in shopping malls and for implementing and evaluating design strategies. By creating virtual shopping environments, these simulations allow for the comprehensive testing and assessment of various consumption scenarios, time schedules, shopping mall layouts, flow lines, and functional configurations, as well as exploring innovative design solutions that prioritize not only aesthetics but also functionality and sustainability. For instance, VR can help assess how well a mall’s layout facilitates navigation, how natural light is harnessed to enhance the shopping experience, and how energy-efficient systems can be integrated into the design. All of these factors can be explored prior to physical construction or renovation. This process gathers extensive data on consumer behavior patterns, preferences, pathways, dwell times, points of interest, and space utilization efficiency, revealing demands and expectations related to time consumption and overall user experience.
Identifying potential issues and areas for improvement in terms of both form and function, as well as environmental impact, enables optimization of shopping mall designs, ensuring not only alignment with customer needs and expectations but also promoting sustainable practices. For example, data from VR simulations can guide the selection of materials that are both visually appealing and eco-friendly, or the design of spaces that encourage natural ventilation and reduce the need for artificial cooling. Additionally, VR simulations facilitate rapid design iteration and cost reduction while providing immersive interactive experiences. Therefore, in future project practices, the experimental and testing feedback from VR simulation technology can be actively utilized to ensure that our design strategies achieve optimal results in the real world.
This study also highlights a synergistic relationship between field surveys and VR simulations in assessing unquantifiable aspects of user satisfaction. Field surveys capture immediate user feedback and subtle sensations within real-world environments, providing rich, qualitative data. In contrast, VR simulations create highly realistic virtual environments that enable immersive interactive experiences and rapid design iteration, thereby reducing costs. By integrating these methods, field feedback informs VR simulations, and the simulation results are then validated on-site, creating a closed-loop process that enhances assessment accuracy. Moreover, VR simulations transcend field survey limitations by identifying potential issues and future needs, driving continuous innovation not just in aesthetic design but also in functional efficiency and sustainable practices through this multidimensional analysis of user satisfaction.
It is important to note that the VR scenarios in this study were based on existing shopping mall designs, which introduces certain constraints on the test results. However, future design schemes can incorporate VR-based user satisfaction surveys to facilitate multiple iterations and ongoing monitoring of design proposals. This approach will continually optimize the design of shopping mall interior public spaces, balancing the needs of aesthetics, functionality, and sustainability to ensure both high user satisfaction and efficient space utilization.
6. Conclusions
This study constructed an evaluation system for the satisfaction of public rest spaces in shopping malls and identified evaluation indicators that require optimization. Twenty-one evaluation indicators were selected through a literature review and theoretical analysis. User satisfaction evaluations of public rest spaces in shopping malls were conducted using an importance–performance questionnaire. Furthermore, using an importance–performance matrix, eight indicators that urgently require optimization were identified, and the discrepancies between users’ initial expectations and actual experiences of the space were analyzed.
This study established the relationship between public space satisfaction and shopping mall spatial components through a combined analysis of quantifiable and nonquantifiable indicators. Through field research and data correlation analysis, the relationships between satisfaction with the evaluation indicators to be optimized and quantifiable spatial components, such as seating density, visual permeability, and number of theme colors, were summarized. The results indicated that among the objective material elements of space, there was a significant negative correlation between seating density and spatial privacy (r = −0.652, p < 0.05), and a significant positive correlation between interface transparency and aesthetic pleasure (r = 0.820, p < 0.05). Among the perceptual experience elements, there was a significant negative correlation between visual permeability and seat arrangement (r = −0.481, p < 0.05), and a significant negative correlation with attractiveness/significance evaluation (r = −0.619, p < 0.05). There was also a significant negative correlation between store density and field-of-view width evaluation (r = 0.412, p < 0.05) and a significant positive correlation between functional density and attractiveness/significance (r = 0.734, p < 0.01). Meanwhile, through VR simulation experiments and data regression analysis, the satisfaction evaluation of public rest spaces in shopping malls was divided into two aspects: preference for selection and staying. The results showed a quadratic relationship between spatial privacy and preference for selection, with an R2 value of 0.947. The relationship between spatial attractiveness and preference for selection evaluation followed a logarithmic curve with an R2 value of 0.984. A quadratic relationship was found between spatial pleasure and the preference for staying, with an R2 value of 0.989. The relationship between spatial scale sense and preference for staying was more aptly described by a quadratic curve with an R2 value of 0.987.
In conclusion, this study refined the focus of optimization design from the user’s perspective, thereby facilitating the enhancement of the operational efficacy of public rest spaces in shopping malls operating within the experience economy. Additionally, it provided a foundation upon which the optimization and renewal of public rest spaces in shopping malls can be based, a process that is of considerable social and practical significance.
Supplementary Materials
The following supporting information can be downloaded at: https://www.mdpi.com/article/10.3390/buildings14103264/s1, Supplementary Materials S1: Satisfaction and Importance Evaluation of Public Rest Areas in Commercial Complexes; Supplementary Materials S2: VR Virtual Simulation Experiment Evaluation Questionnaire.
Author Contributions
Conceptualization, T.F. and Z.Z.; methodology, Z.Z.; software, K.W. and Z.Z.; validation, Z.Z.; formal analysis, T.F. and Z.Z.; investigation, K.W.; resources, T.F.; data curation, Z.Z.; writing—original draft preparation, Z.Z.; writing—review and editing, T.F. and Z.Z.; visualization, Z.Z. and K.W.; supervision, T.F.; project administration, T.F.; funding acquisition, T.F. All authors have read and agreed to the published version of the manuscript.
Funding
This research was funded by National Key R&D Program Sub-themes of China, grant number 2022YFC3803805-2.3.
Data Availability Statement
Data are contained within this article.
Conflicts of Interest
Authors Teng Fei and Kun Wang were employed by the company The Architectural Design and Research Institute of HIT Co., Ltd. The remaining authors declare that the research was conducted in the absence of any commercial or financial relationships that could be construed as a potential conflict of interest.
References
- Ohuchi, H. Time-oriented consumption and business innovation. Econ. Perspect. 1990, 9, 72–75. [Google Scholar]
- Ruddle, R.A.; Payne, S.J.; Jones, D.M. Navigating buildings in \“desk-top\” virtual environments: Experimental investigations using extended navigational experience. J. Exp. Psychol. Appl. 1997, 3, 143–159. [Google Scholar] [CrossRef]
- Bishop, I.; Ye, W.-S.; Karadaglis, C. Experiential approaches to perception response in virtual worlds. Landsc. Urban Plan. 2001, 54, 117–125. [Google Scholar] [CrossRef]
- Bishop, I.D.; Wherrett, J.R.; Miller, D.R. Assessment of path choices on a country walk using a virtual environment. Landsc. Urban Plan. 2001, 52, 225–237. [Google Scholar] [CrossRef]
- Zacharias, J. Exploratory spatial behaviour in real and virtual environments. Landsc. Urban Plan. 2006, 78, 1–13. [Google Scholar] [CrossRef]
- Meilinger, T.; Knauff, M.; Bülthoff, H.H. Working memory in wayfinding—A dual task experiment in a virtual city. Cogn. Sci. 2008, 32, 755–770. [Google Scholar] [CrossRef]
- Felnhofer, A.; Kothgassner, O.D.; Schmidt, M.; Heinzle, A.-K.; Beutl, L.; Hlavacs, H.; Kryspin-Exner, I. Is virtual reality emotionally arousing? Investigating five emotion inducing virtual park scenarios. Int. J. Hum.-Comput. Stud. 2015, 82, 48–56. [Google Scholar] [CrossRef]
- Deb, S.; Carruth, D.W.; Sween, R.; Strawderman, L.; Garrison, T.M. Efficacy of virtual reality in pedestrian safety research. Appl. Ergon. 2017, 65, 449–460. [Google Scholar] [CrossRef]
- Parsons, T.D.; Mcmahan, T. An Initial Validation of the Virtual of the Virtual Environment Grocery Store. J. Neurosci. Methods 2017, 291, 13. [Google Scholar] [CrossRef]
- Siegrist, M.; Ung, C.-Y.; Zank, M.; Marinello, M.; Kunz, A.; Hartmann, C.; Menozzi, M. Consumers’ food selection behaviors in three-dimensional (3D) virtual reality. Food Res. Int. 2019, 117, 50–59. [Google Scholar] [CrossRef]
- Cai, S. Application and Research of Immersive Virtual Reality Technology in the Interior Decoration of Folk Houses in Guanzhong. In Proceedings of the 4th International Conference on Culture, Education and Economic Development of Modern Society (ICCESE 2020), Moscow, Russia, 13–14 March 2020; pp. 119–123. [Google Scholar]
- Pérez, G.; Rodríguez, X.F.; Burgués, J.M.; Solé, M.; Coma, J. 3D immersive learning in architecture and construction areas = Aprendizaje inmersivo 3D en el campo de la arquitectura y construcción. Adv. Build. Educ. 2020, 4, 9–19. [Google Scholar] [CrossRef]
- Hao, L.; Wang, Q. Research progress on application of virtual reality technology in landscape architecture. In Proceedings of the 3rd International Conference on Computer Graphics, Image and Virtualization (ICCGIV 2023), Nanjing, China, 16–18 June 2023; pp. 404–409. [Google Scholar]
- Ma, B.; Luo, X.; An, X.; Guo, J.; Liu, P. An analytical research using image processing to create an architectural virtual scene. In Proceedings of the 2nd International Conference on Physics, Photonics, and Optical Engineering (ICPPOE 2023), Kunming, China, 10–12 November 2023. [Google Scholar]
- Kusumowidagdo, A.; Sachari, A.; Widodo, P. Visitors’ Perceptions on The Important Factors of Atrium Design in Shopping Centers: A Study of Gandaria City Mall and Ciputra World in Indonesia. Front. Archit. Res. 2016, 5, 52–62. [Google Scholar] [CrossRef]
- Ge, J.; Zhao, Y.; Zhao, K. Impact of a Non-Enclosed Atrium on the Surrounding Thermal Environment in Shopping Malls. J. Build. Eng. 2021, 35, 101981. [Google Scholar] [CrossRef]
- Fang, T.M.; Sun, L.; Xu, X.; Li, H.; Shao, Z. Exploring the Impacts of Spatial Morphology of Underground Shopping Mall Atriums on Natural Lighting Performance. Archit. Eng. Des. Manag. 2023, 20, 808–831. [Google Scholar] [CrossRef]
- Eckert, A.; He, Z.; West, D.S. An Empirical Examination of Clustering and Dispersion Within Canadian Shopping Centers. J. Retail. Consum. Serv. 2013, 20, 625–633. [Google Scholar] [CrossRef]
- Jäger, P.F. Where the whole city meets: Youth, gender and consumerism in the social space of the MEGA shopping mall in Aktobe, western Kazakhstan. Cent. Asian Surv. 2016, 35, 178–194. [Google Scholar] [CrossRef]
- Steins, K.; Goolsby, C.; Grönbäck, A.-M.; Charlton, N.; Anderson, K.; Dacuyan-Faucher, N.; Prytz, E.; Granberg, T.A.; Jonson, C.-O. Recommendations for Placement of Bleeding Control Kits in Public Spaces—A Simulation Study. Disaster Med. Public Health Prep. 2023, 17, e527. [Google Scholar] [CrossRef]
- Hami, A.; Moula, F.F.; Maulan, S. Public Preferences Toward Shopping Mall Interior Landscape Design in Kuala Lumpur, Malaysia. Urban For. Urban Green. 2018, 30, 1–7. [Google Scholar] [CrossRef]
- Plieninger, S.; Gebreiter, D.; Mühlberger, J.; Justiz, S. Die Netzschale der Jinji Lake Mall. Stahlbau 2015, 84, 101–110. [Google Scholar] [CrossRef]
- Chuanrong, C.; Hengliang, T. The Application of Digital Technology in Interior Design Education. In Proceedings of the 2016 Eighth International Conference on Measuring Technology and Mechatronics Automation, Macau, China, 11–12 March 2016; pp. 688–691. [Google Scholar]
- Freitas, M.; Ruschel, R. What is Happening to Virtual and Augmented Reality Applied to Architecture? Caadria 2013, 407, 10. [Google Scholar]
- Zhang, J.; Zhao, Y. Humanistic Design of Soft Space in Commercial Building. Adv. Inf. Sci. Serv. Sci. 2012, 4, 376–382. [Google Scholar]
- Garcia, B. Retailising space: Architecture, retail and the territorialisation of public space. Urban Des. Int. 2015, 20, 253–254. [Google Scholar] [CrossRef]
- Tang, H.; Ding, Y.; Singer, B.C. Post-occupancy evaluation of indoor environmental quality in ten nonresidential buildings in Chongqing, China. J. Build. Eng. 2020, 32, 101649. [Google Scholar] [CrossRef]
- Maslow, A.H. A Theory of Human Motivation. Psychol. Rev. 1943, 50, 370–396. [Google Scholar] [CrossRef]
- Rapoport, A. The Mutual Interaction of People and Their Built Environment. World Anthropol. 1973, 54, 550–560. [Google Scholar] [CrossRef]
- Mehrabian, A.; Russell, J.A. An Approach to Environmental Psychology; MIT: Cambridge, MA, USA, 1974. [Google Scholar]
- Gehl, J. Life between Buildings: Using Public Space; VAN Nosrand Reinhold: New York, NY, USA, 1987. [Google Scholar]
- Du, X.; Zhang, Y.; Lv, Z. Investigations and analysis of indoor environment quality of green and conventional shopping mall buildings based on customers’ perception. Build. Environ. 2020, 177, 106851. [Google Scholar] [CrossRef]
- Martilla, J.A.; James, J.C. Importance-performance analysis. J. Mark. 1977, 41, 77. [Google Scholar] [CrossRef]
- Ainin, S.; Hisham, N.H. Applying Importance-Performance Analysis to Information Systems: An Exploratory Case Study. J. Inf. Inf. Technol. Organ. 2008, 3, 95–103. [Google Scholar] [CrossRef] [PubMed]
- Tontini, G.; Picolo, J.D. Identifying the impact of incremental innovations on customer satisfaction using a fusion method between importance-performance analysis and Kano model. Int. J. Qual. Reliab. Manag. 2013, 31, 32–52. [Google Scholar] [CrossRef]
- Cao, J.; Cao, X. Comparing importance-performance analysis and three-factor theory in assessing rider satisfaction with transit. J. Transp. Land Use 2017, 10, 837–854. [Google Scholar] [CrossRef]
- Fang, K.T. Uniform Experimental Design. In International Encyclopedia of Statistical Science; Springer: Berlin/Heidelberg, Germany, 2011. [Google Scholar]
- Kaitai, F. Orthogonal and Uniform Experimental Design; Science Press: Beijing, China, 2001. [Google Scholar]
- Peterson, R.A. On the Use of College Students in Social Science Research: Insights from a Second-Order Meta-analysis. J. Consum. Res. 2001, 28, 450–461. [Google Scholar] [CrossRef]
- Allen, R.C.; Singer, M.J.; McDonald, D.P.; Cotton, J.E. Age Differences in a Virtual Reality Entertainment Environment: A Field Study. Proc. Hum. Factors Ergon. Soc. Annu. Meet. 2000, 44, 542–545. [Google Scholar] [CrossRef]
- Hong, J.-C.; Hwang, M.-Y.; Tai, K.-H.; Tsai, C.-R. Effects of Gender and Age on Learning Spatial Concepts from a Virtual Reality Game. In Proceedings of the 2018 IEEE International Conference on Teaching, Assessment, and Learning for Engineering (TALE), Wollongong, Australia, 4–7 December 2018; pp. 1206–1207. [Google Scholar]
- Chang, W.-T. The effects of age, gender, and control device in a virtual reality driving simulation. Symmetry 2020, 12, 995. [Google Scholar] [CrossRef]
- Huang, X.; Zhao, Q.; Liu, Y.; Harris, D.; Shawler, M. Learning in an Immersive VR Environment: Role of Learner Characteristics and Relations Between Learning and Psychological Outcomes. J. Educ. Technol. Syst. 2023, 53, 3–29. [Google Scholar] [CrossRef]
- Virtual Reality Statistics and Facts. Available online: https://www.enterpriseappstoday.com/stats/virtual-reality-statistics.html (accessed on 7 July 2024).
- Who’s Really Using VR These Days? Six Data-Driven Insights into Today’s VR User Demographic. Available online: https://medium.com/@annabell_37704/whos-really-using-vr-these-days-six-data-driven-insights-into-today-s-vr-user-demographic-422372a75c8c (accessed on 5 July 2024).
- Li, Z.; Du, S. Experimental Optimization Design and Statistical Analysis; Science Press: Beijing, China, 2010. [Google Scholar]
Disclaimer/Publisher’s Note: The statements, opinions and data contained in all publications are solely those of the individual author(s) and contributor(s) and not of MDPI and/or the editor(s). MDPI and/or the editor(s) disclaim responsibility for any injury to people or property resulting from any ideas, methods, instructions or products referred to in the content. |
© 2024 by the authors. Licensee MDPI, Basel, Switzerland. This article is an open access article distributed under the terms and conditions of the Creative Commons Attribution (CC BY) license (https://creativecommons.org/licenses/by/4.0/).

