Analyzing the Impact of Interior Public Space on User Satisfaction in Shopping Malls Using Virtual Reality Simulation Experiments

Abstract
1. Introduction
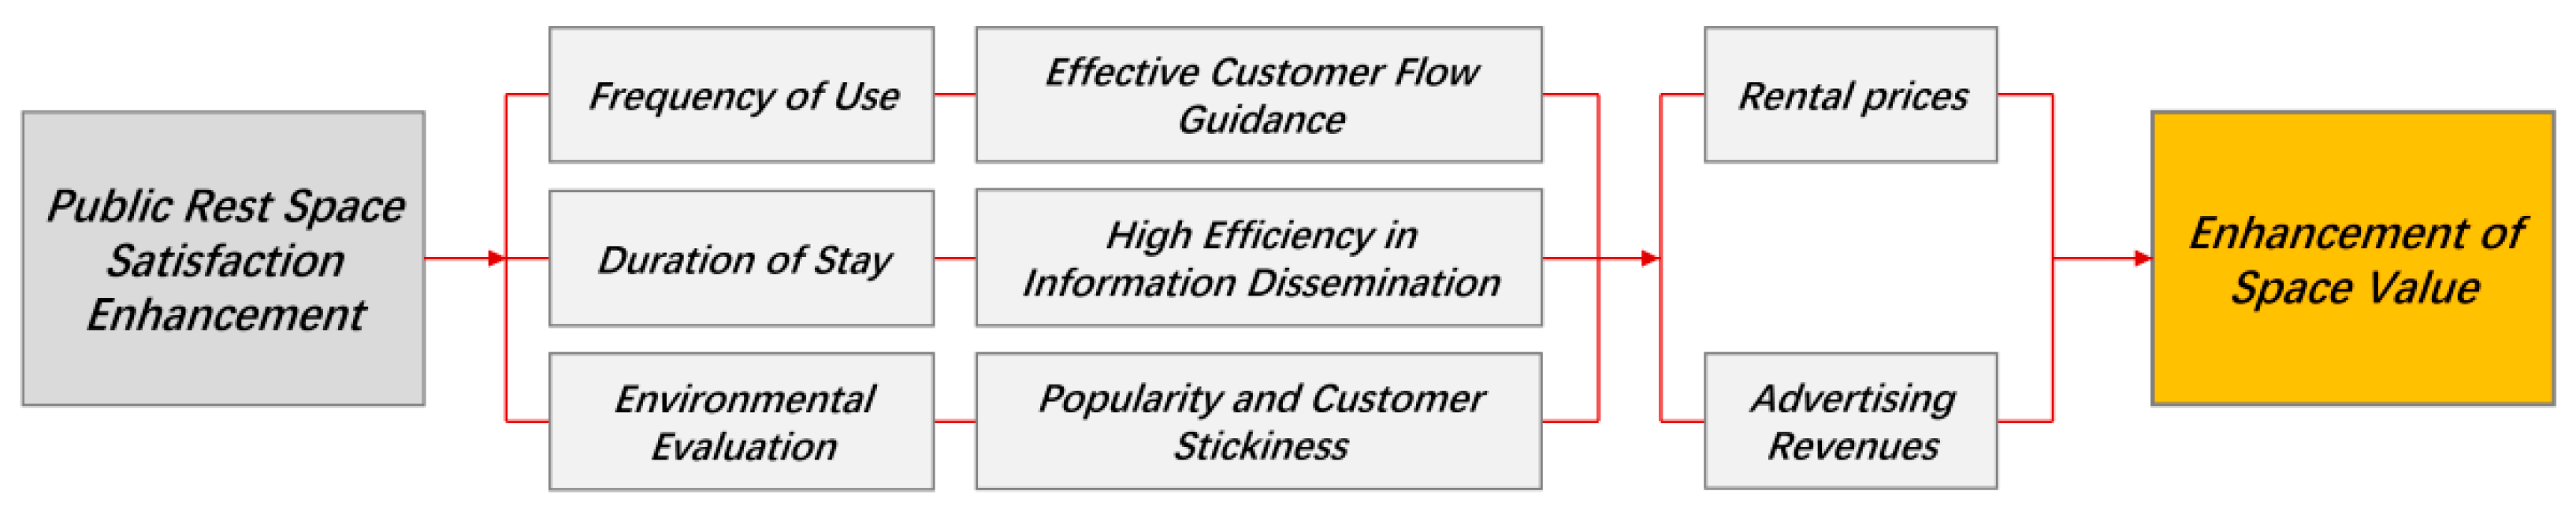
1.1. The Influence of User Satisfaction on the Economic Value of Shopping Malls
1.2. Literature Review of Virtual Reality Technology in the Field of Architecture
1.3. Research Gaps in Shopping Mall Interior Public Space Satisfaction
- (1)
- Constructed a satisfaction evaluation system and conducted an importance–performance questionnaire survey to screen the space evaluation indices to be optimized;
- (2)
- Combined VR experiments and statistical analysis methods to obtain the relationship between satisfaction and design elements of interior public space in a shopping mall;
- (3)
- Proposed an analysis method that integrates both quantifiable and unquantifiable indicators to deeply analyze the underlying mechanism of satisfaction.
2. Satisfaction Factors for Interior Public Spaces
2.1. Basic Behavior Needs
- Security requirements are the basic premise for users to feel protected and choose to stay and carry out activities in the space. The safety of facilities and site conditions are conducive to relaxation through sitting and restful activities.
- Comfort is a necessary condition for the public rest space to enable “effective recovery of physical strength and relaxation of body and mind”. The comfort of seats and the improvement of other shared service facilities are the main considerations for the comfort of rest spaces. A public rest space in a commercial complex is a service-oriented space for shopping and commercial activities.
- The convenience of its location and connection with other public spaces should also be considered necessary basic considerations to ensure the efficiency of space use.
2.2. Advanced Psychological Needs
- Compared to other activities, rest behavior is a relatively static and stable activity; therefore, users will have a sense of personal space and privacy needs for their environment.
- In modern commercial spaces characterized by entertainment experiences, people’s demand for social interaction and activity participation in public rest spaces is growing.
- A beautiful space can promote happy spiritual enjoyment, which represents the subjective aesthetic need of users during their stay and will affect people’s willingness to stay in the space and use time.
3. Methodology
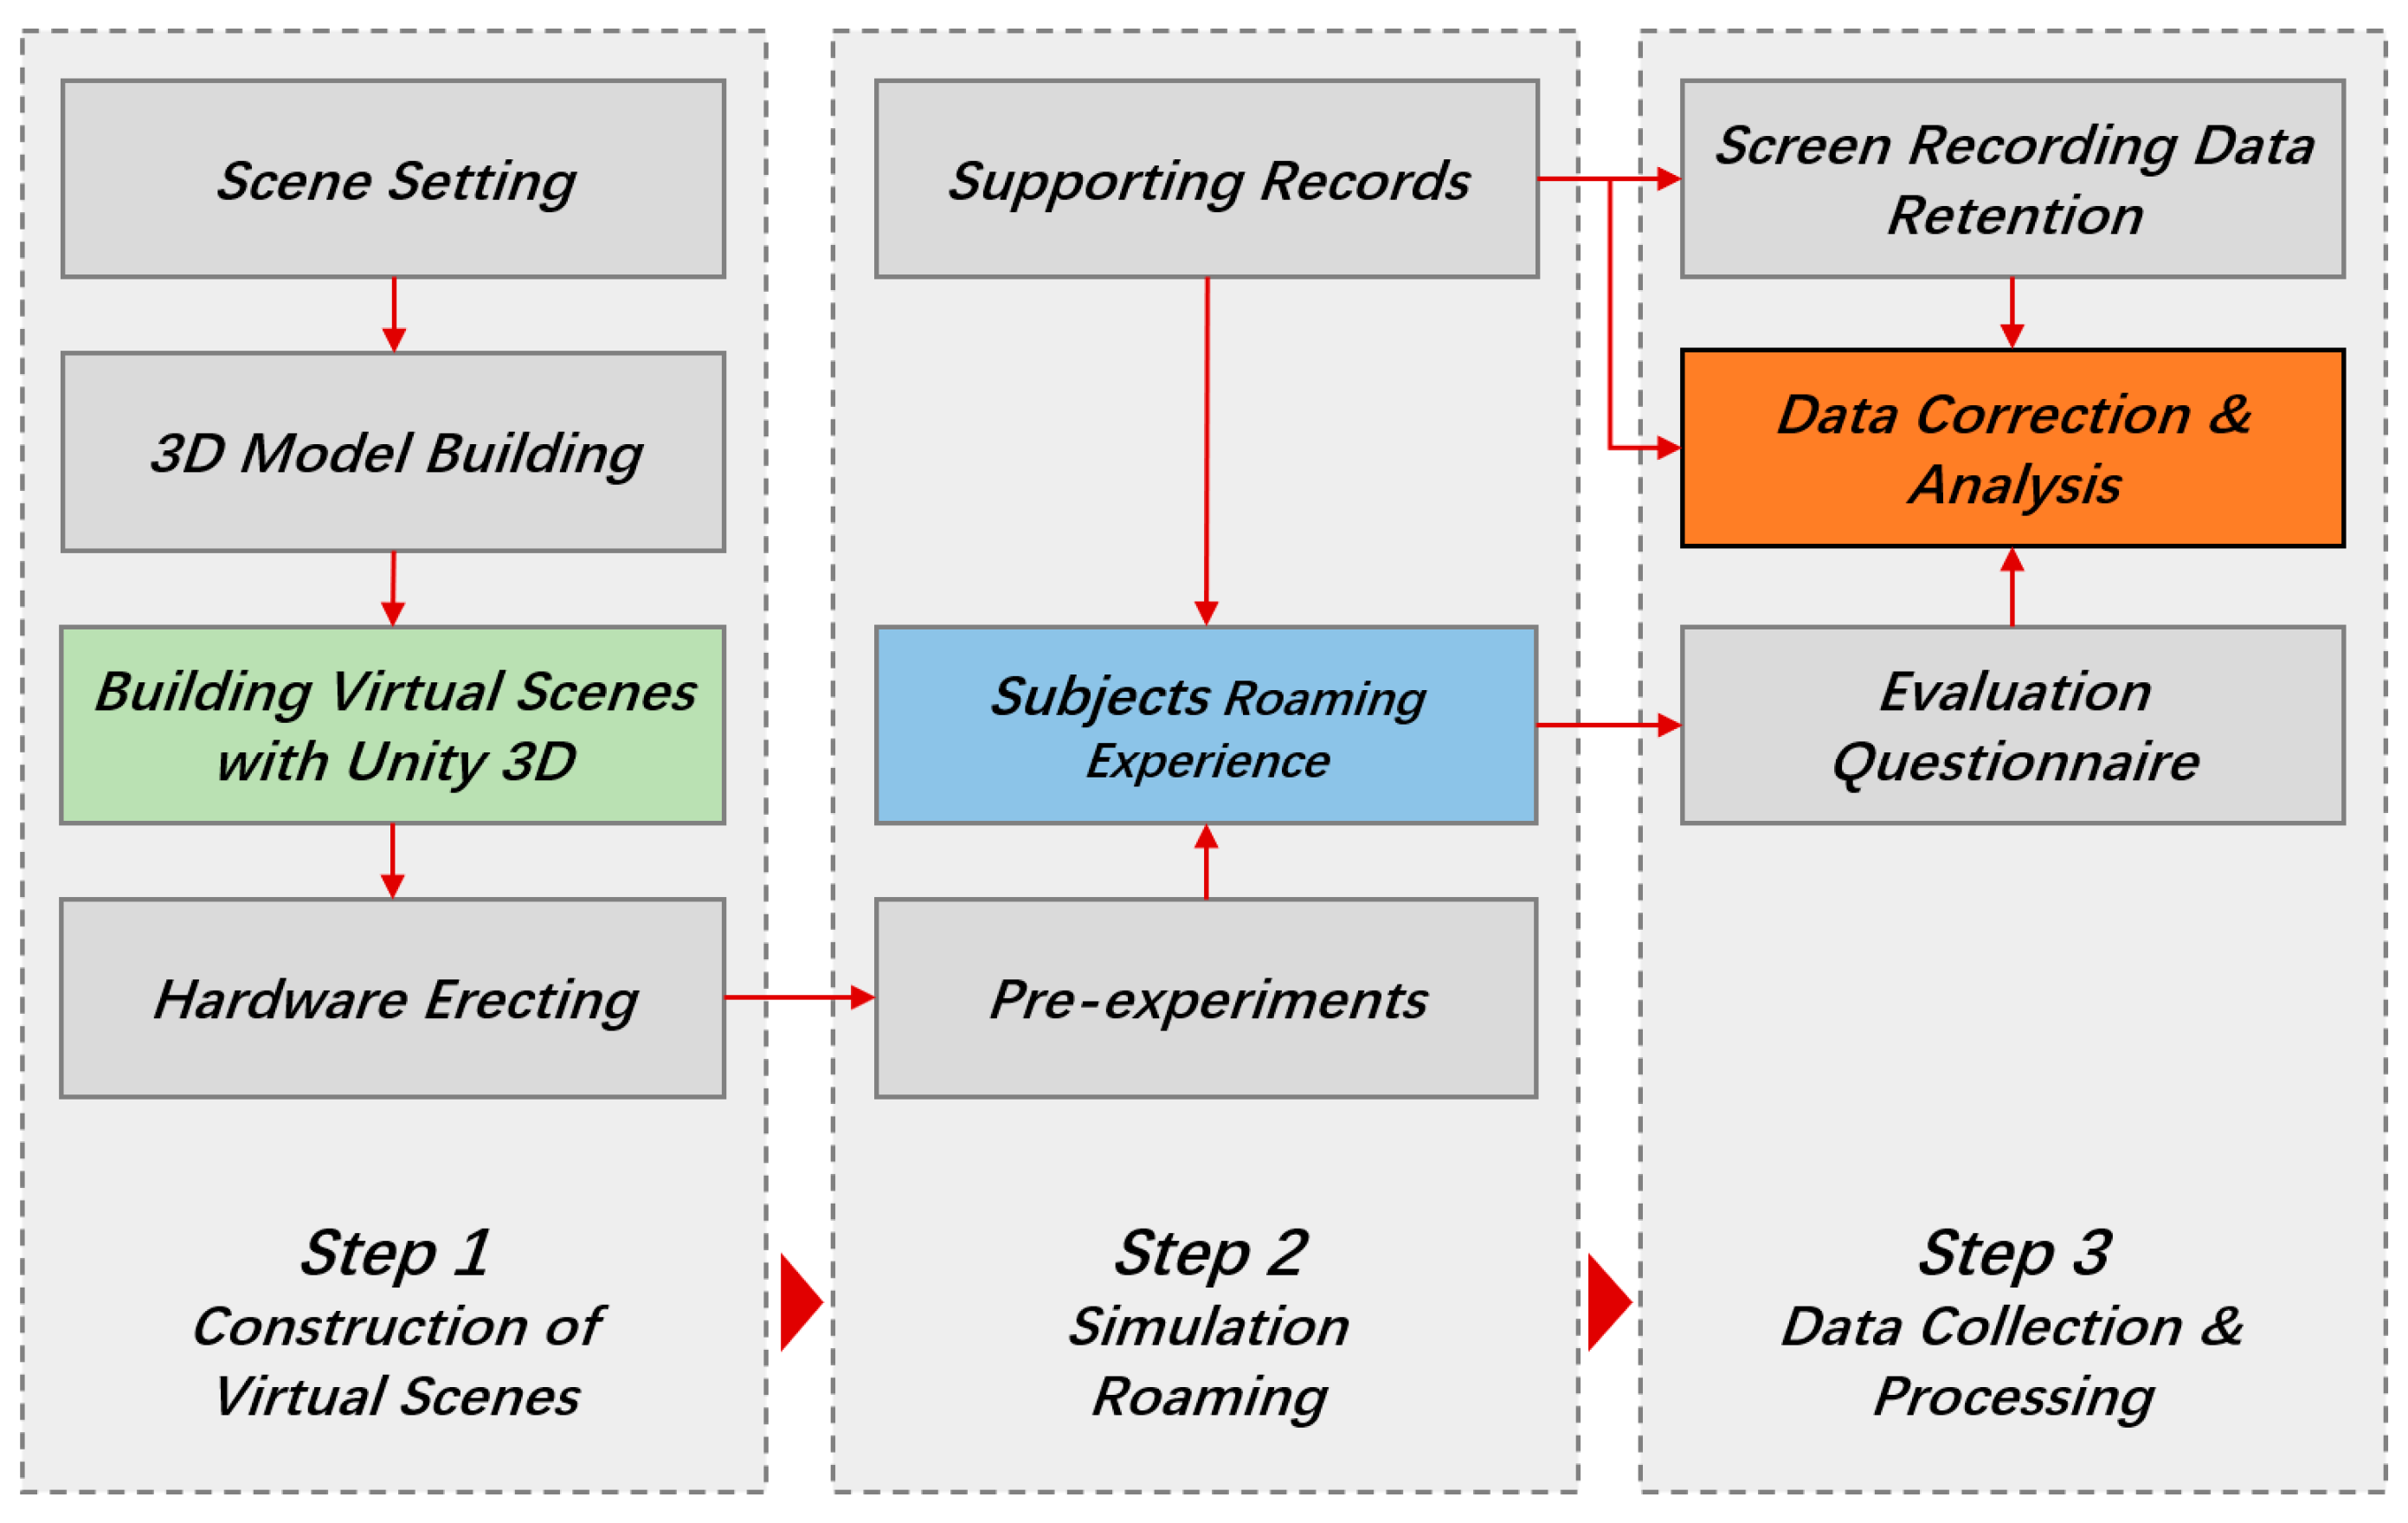
3.1. Work Flow
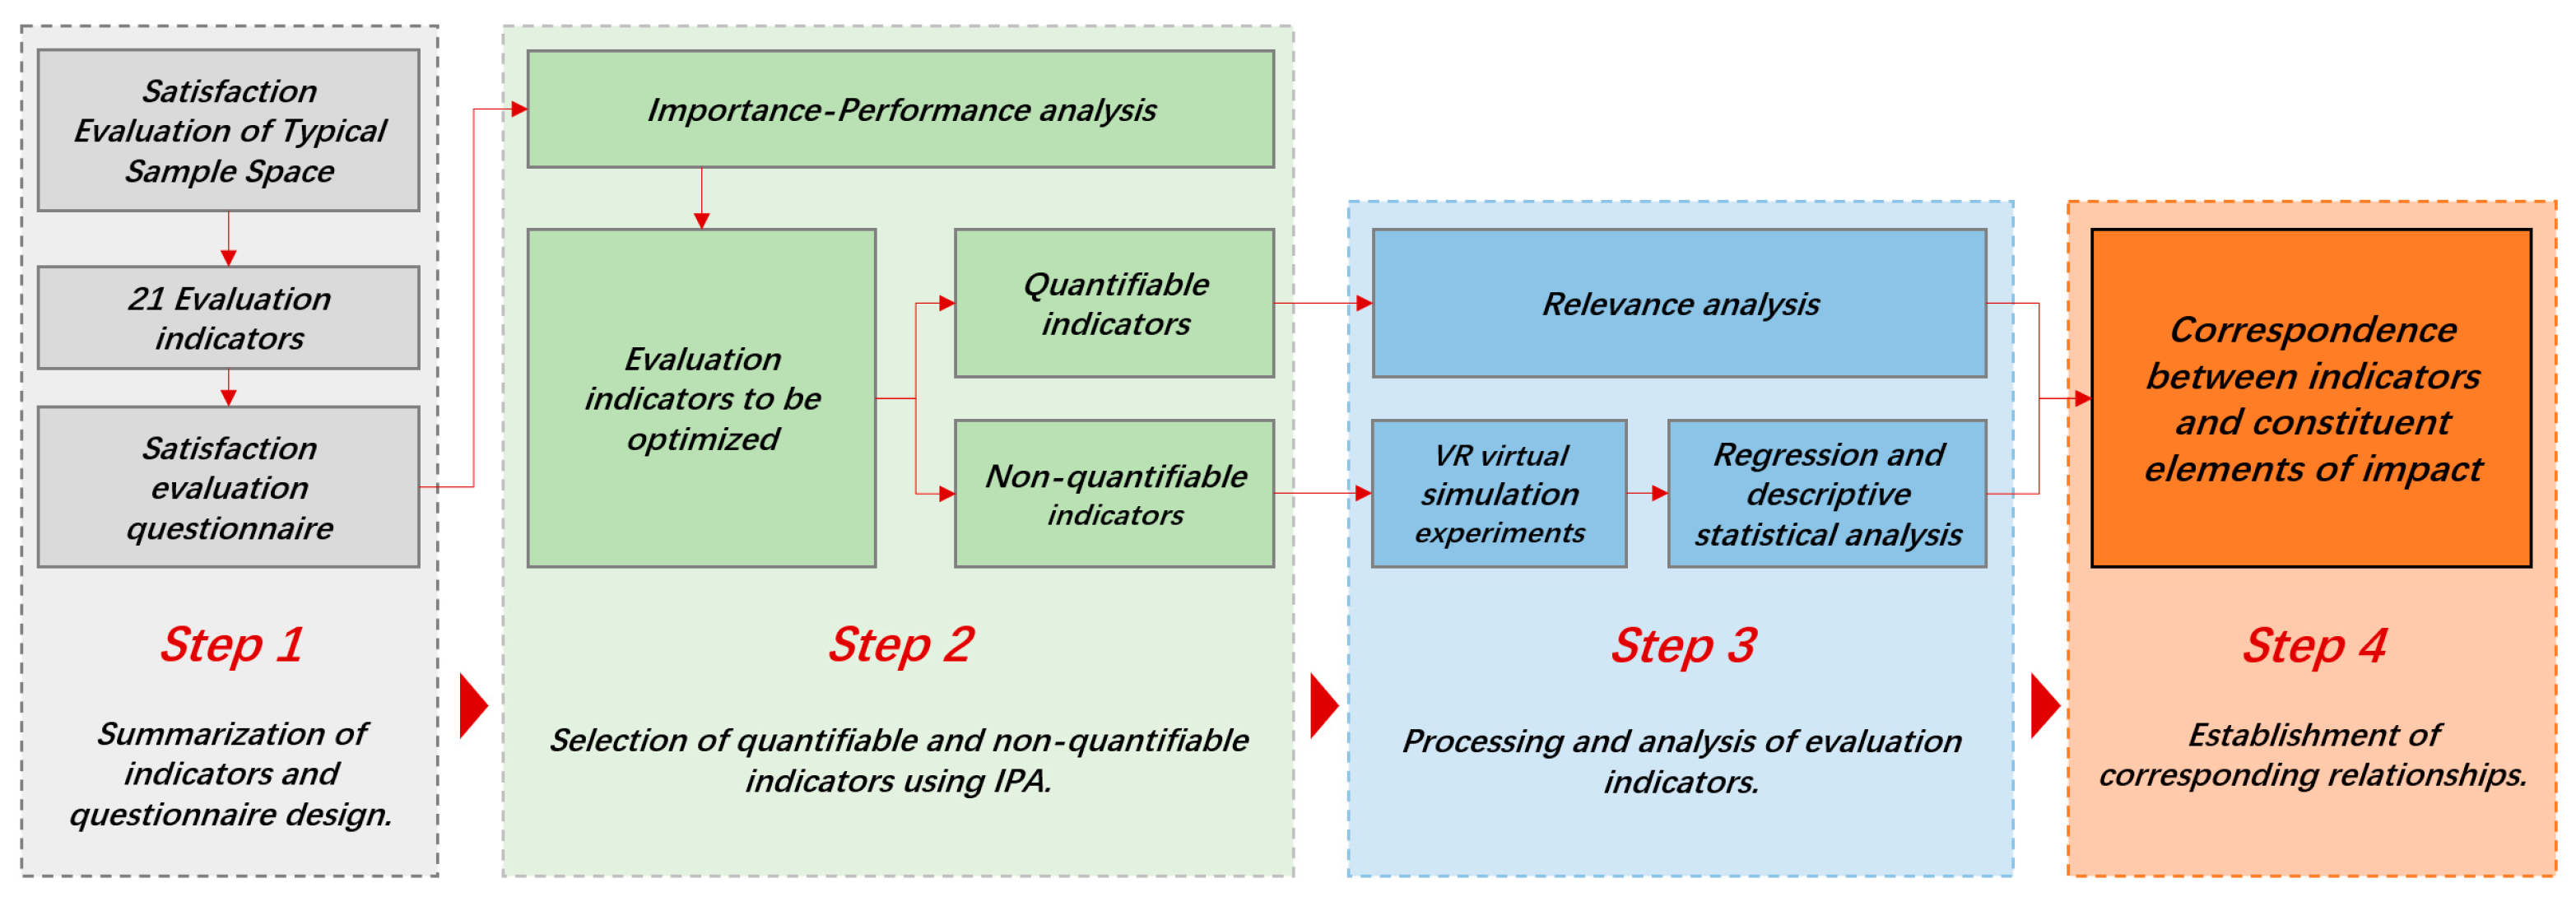
- Based on a comprehensive review of theoretical foundations, literature research, and field surveys, 21 evaluation indicators for the indoor public space of shopping malls were identified. Following this, a user questionnaire was designed to capture data on these indicators, assessing both their importance and performance, with responses measured using a Likert scale.
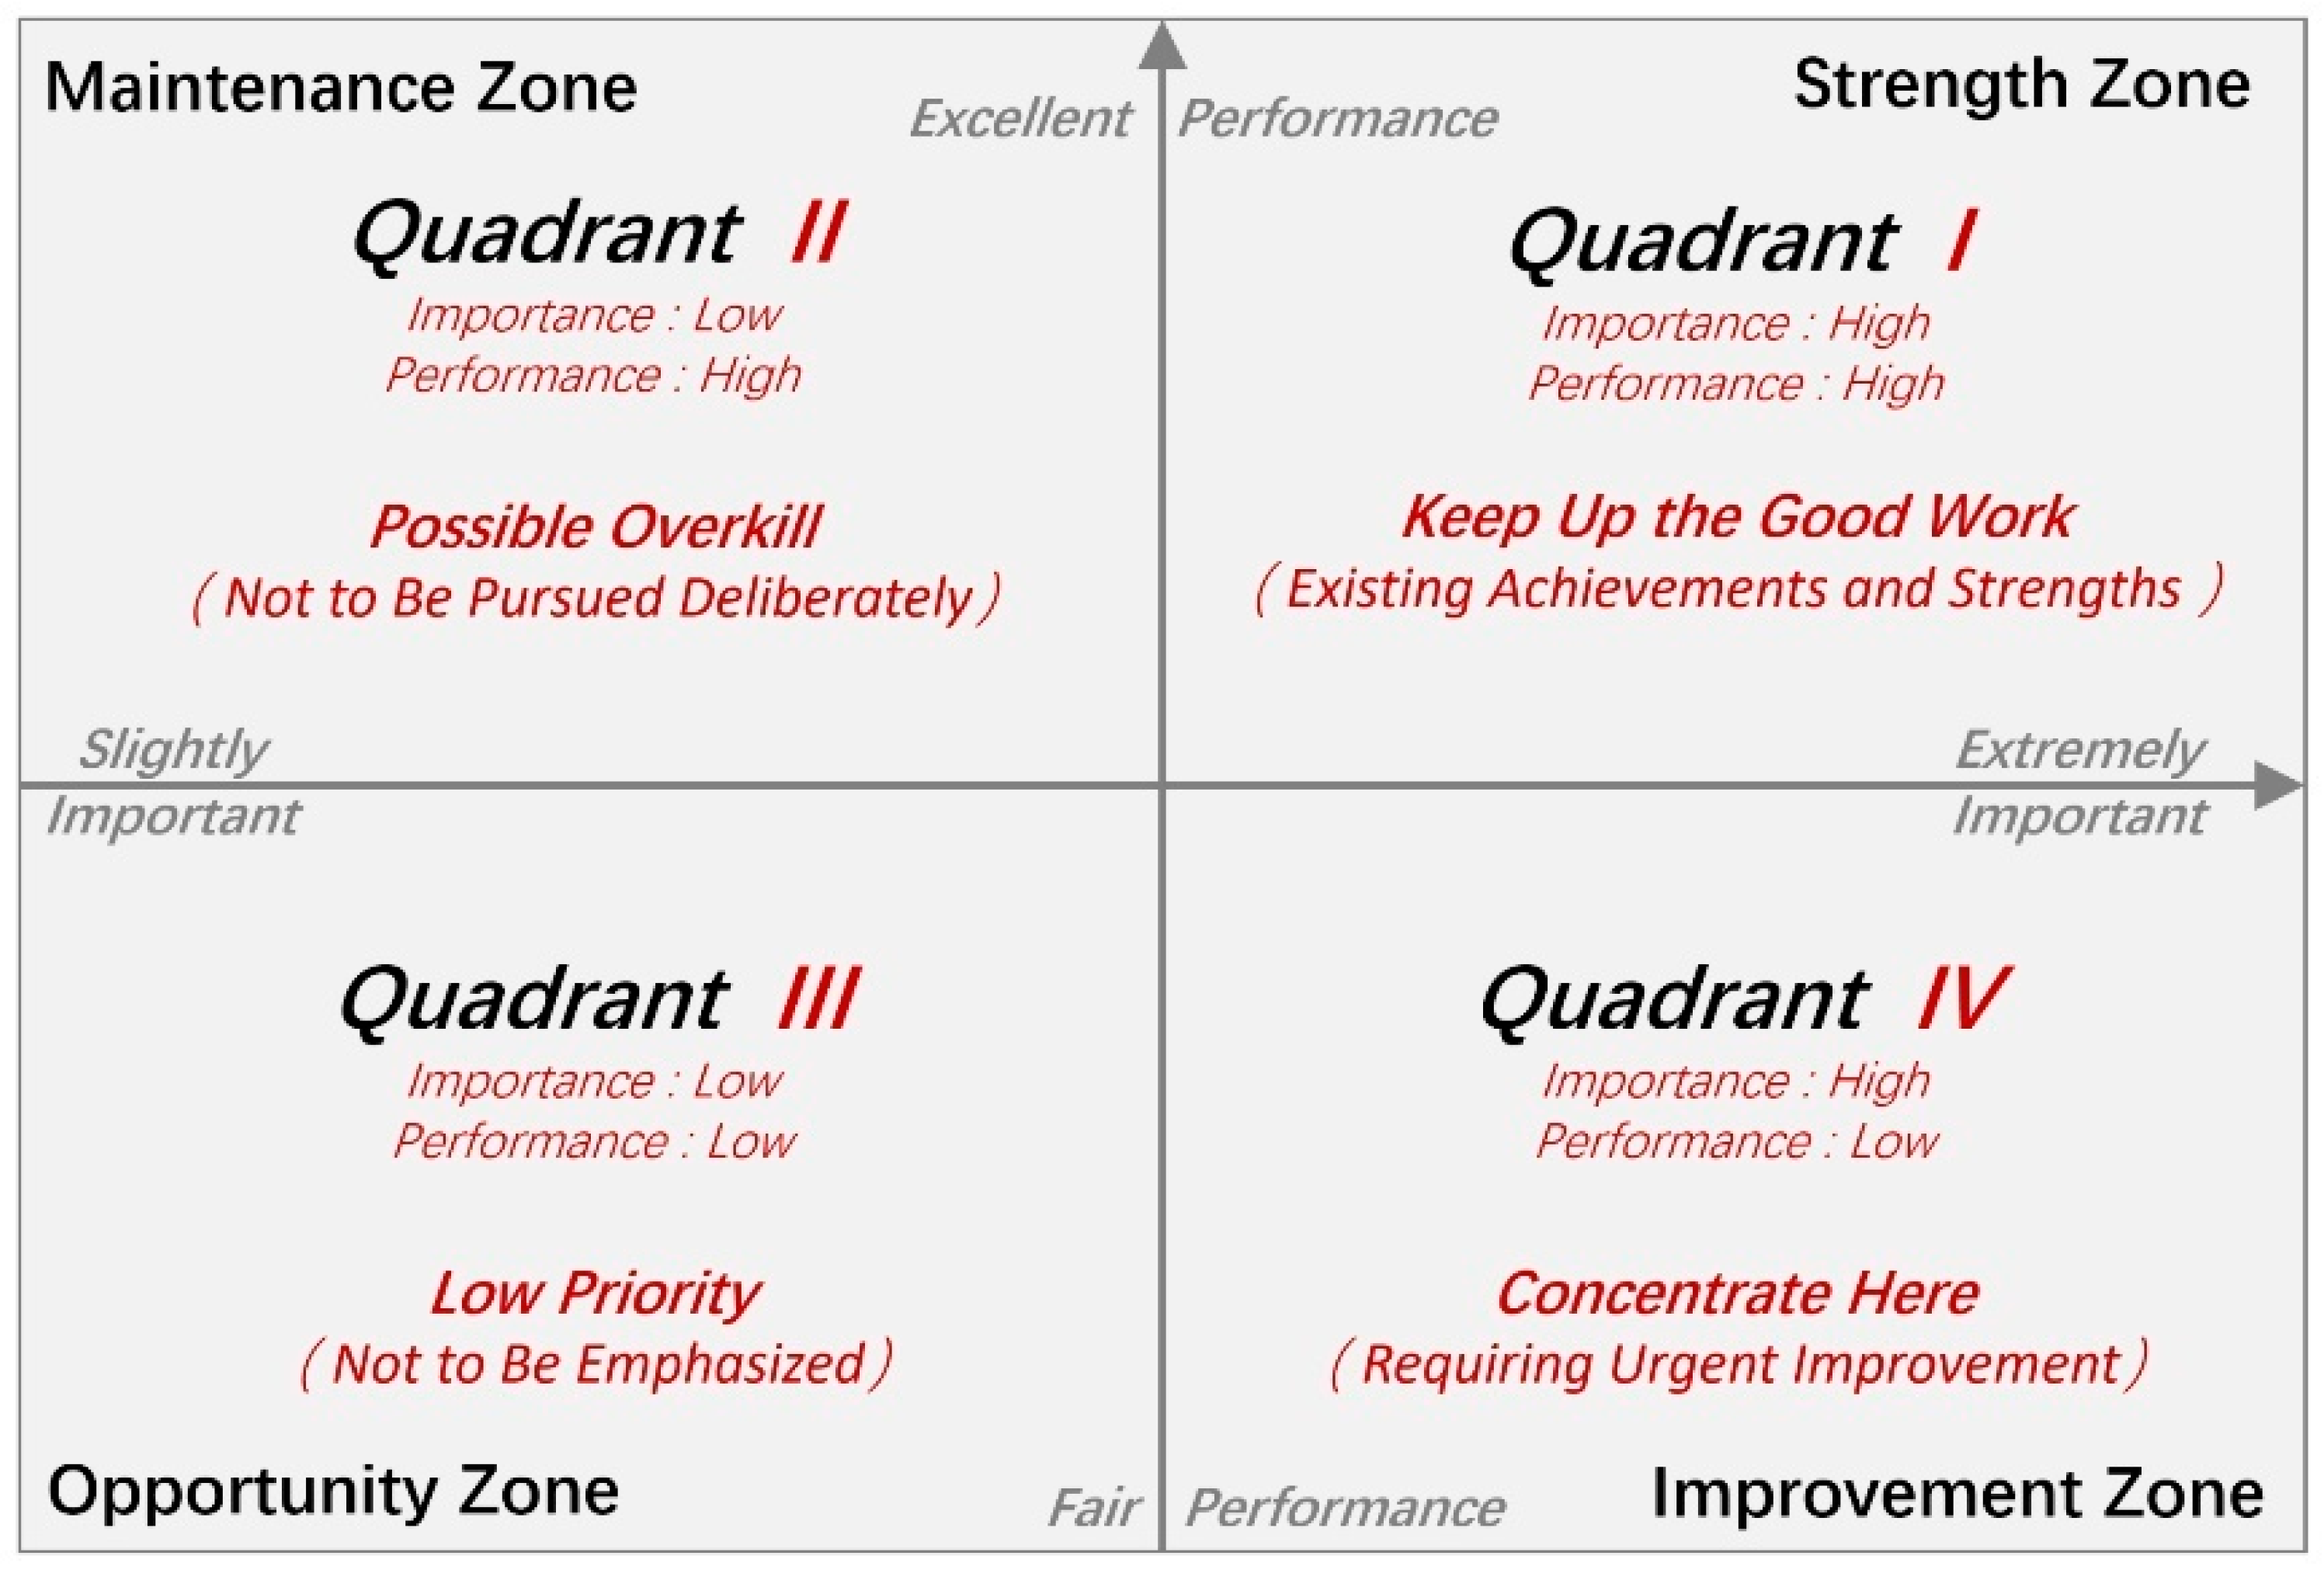
- Using importance–performance analysis, the results of the questionnaire were analyzed, and the evaluation indicators of indoor public spaces were screened and divided into quantifiable and unquantifiable indicators.
- Using correlation analysis to analyze quantifiable indicators, a VR simulation experiment was used to process the unquantifiable indicators, and regression and descriptive analyses were used for statistical analysis.
- Finally, this study established the corresponding relationship between indicators and influencing elements.
3.2. Field Survey
3.2.1. Materials
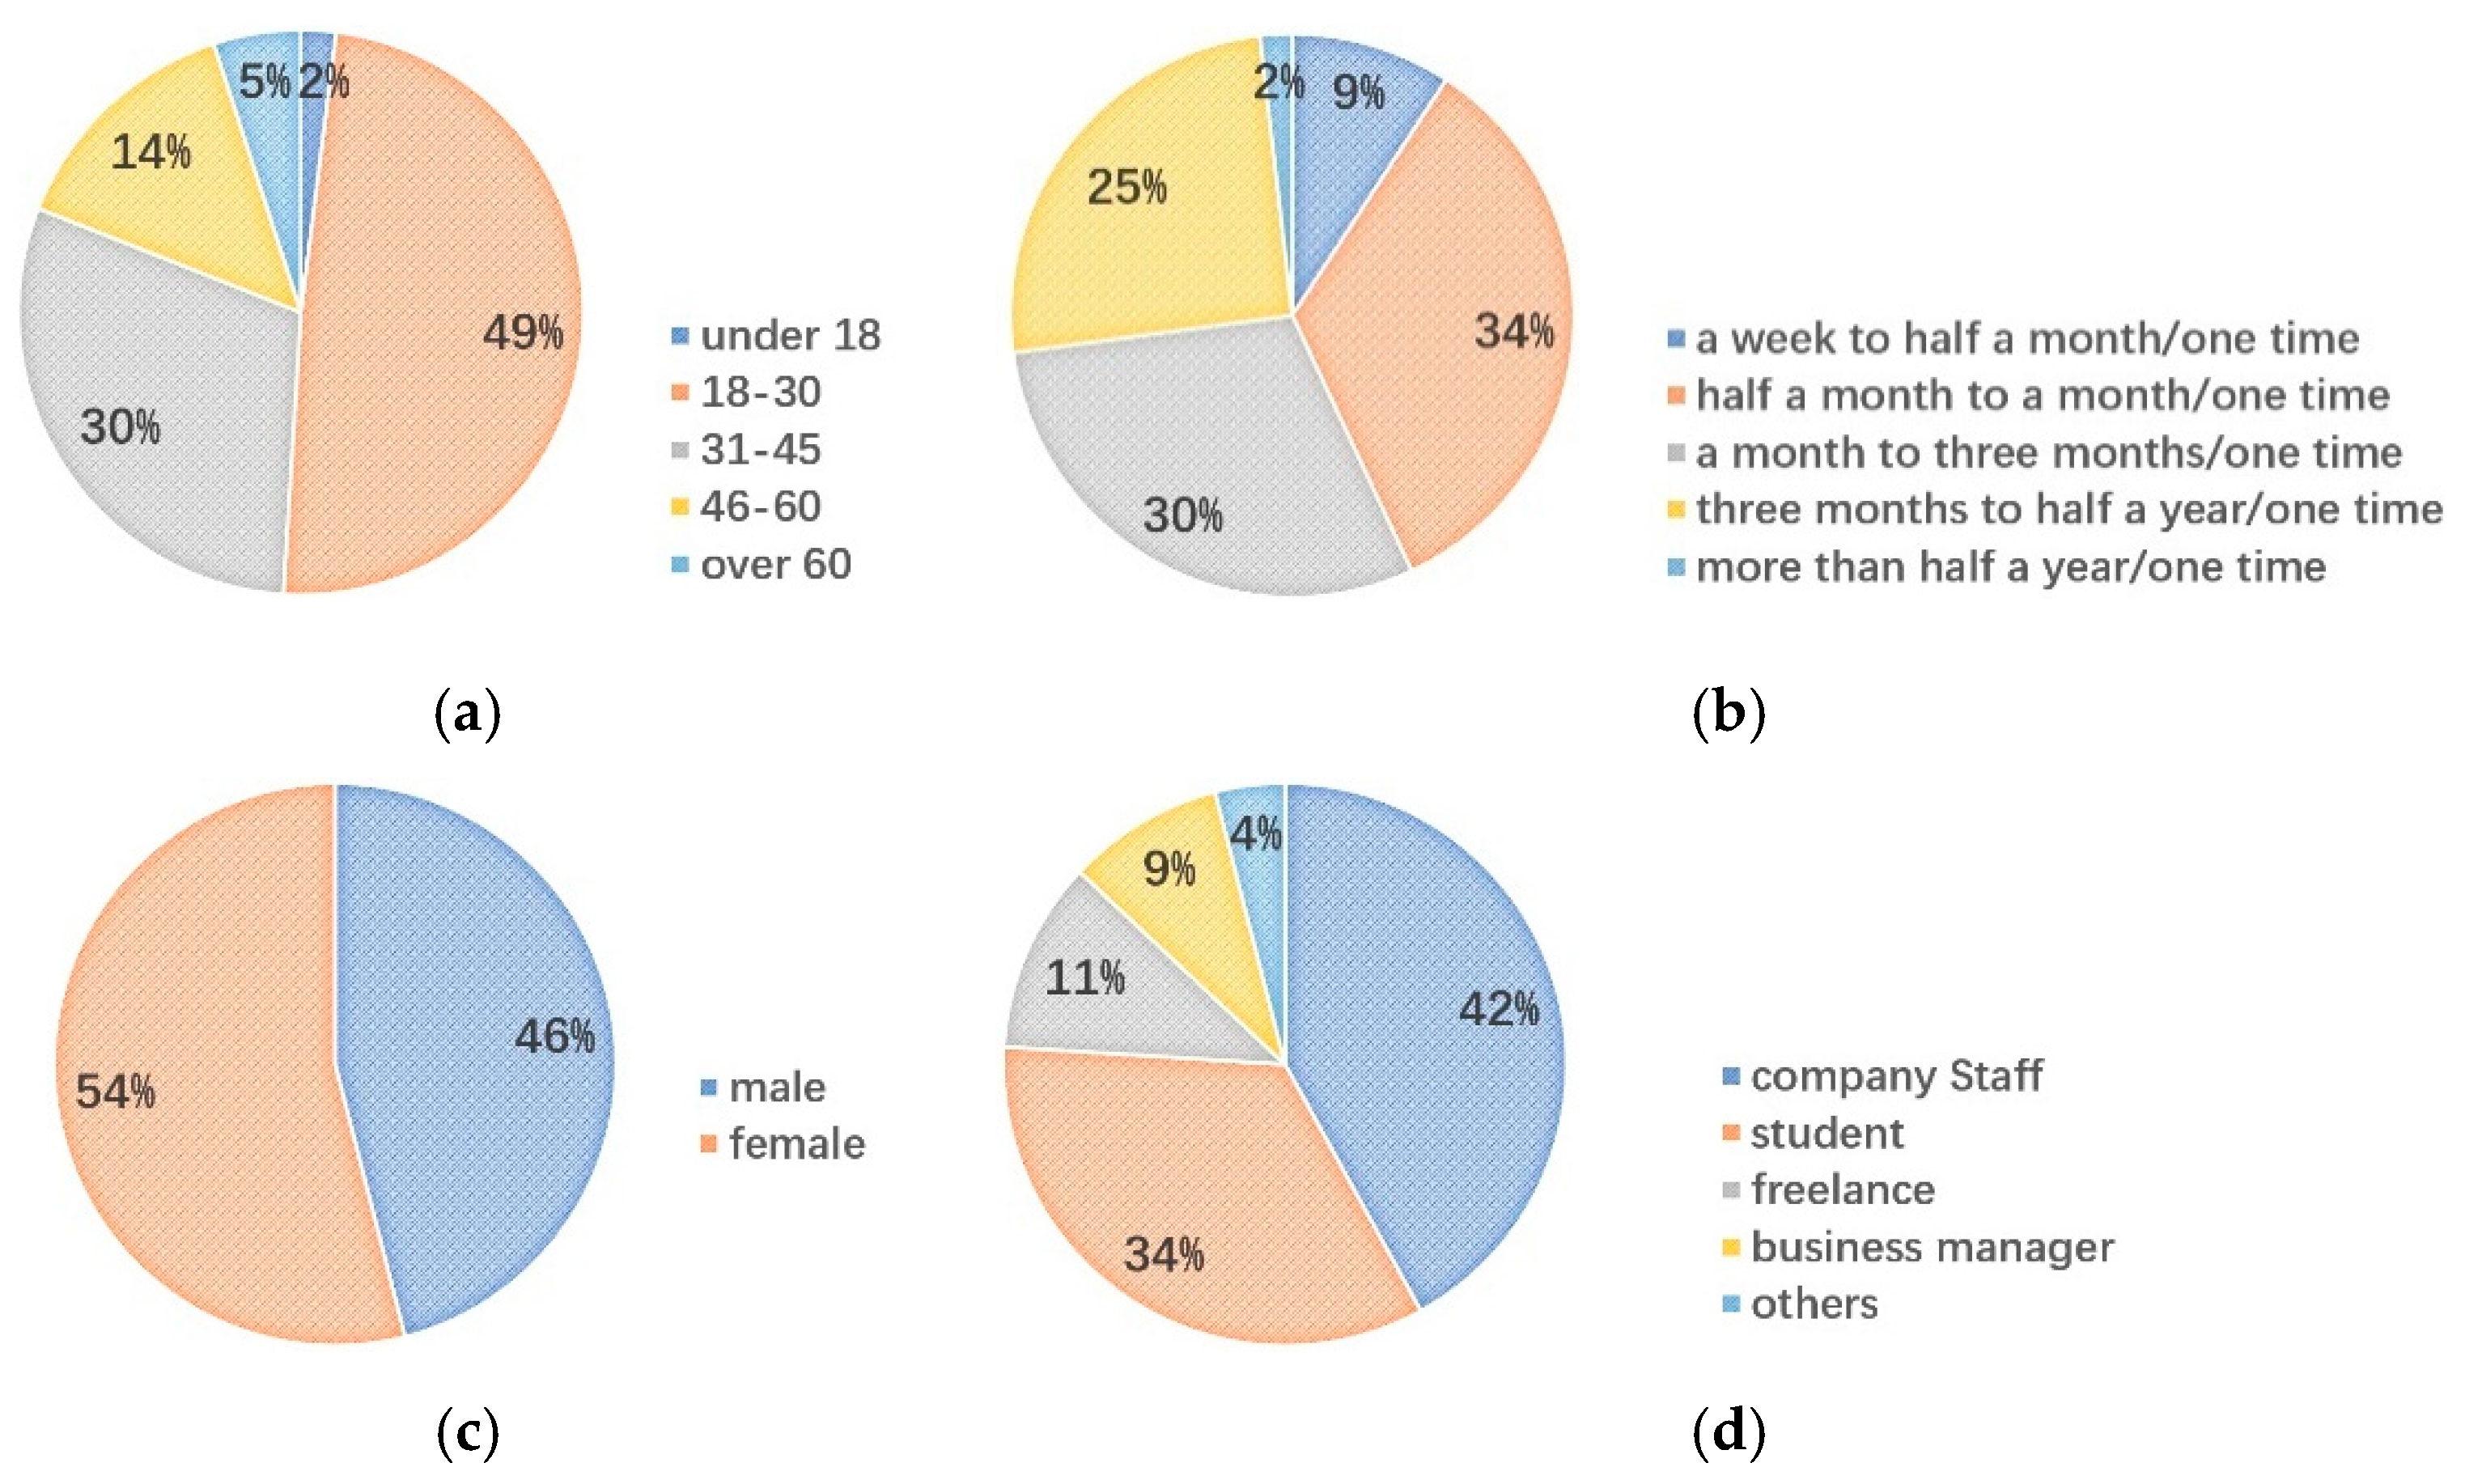
3.2.2. Procedure and Participants
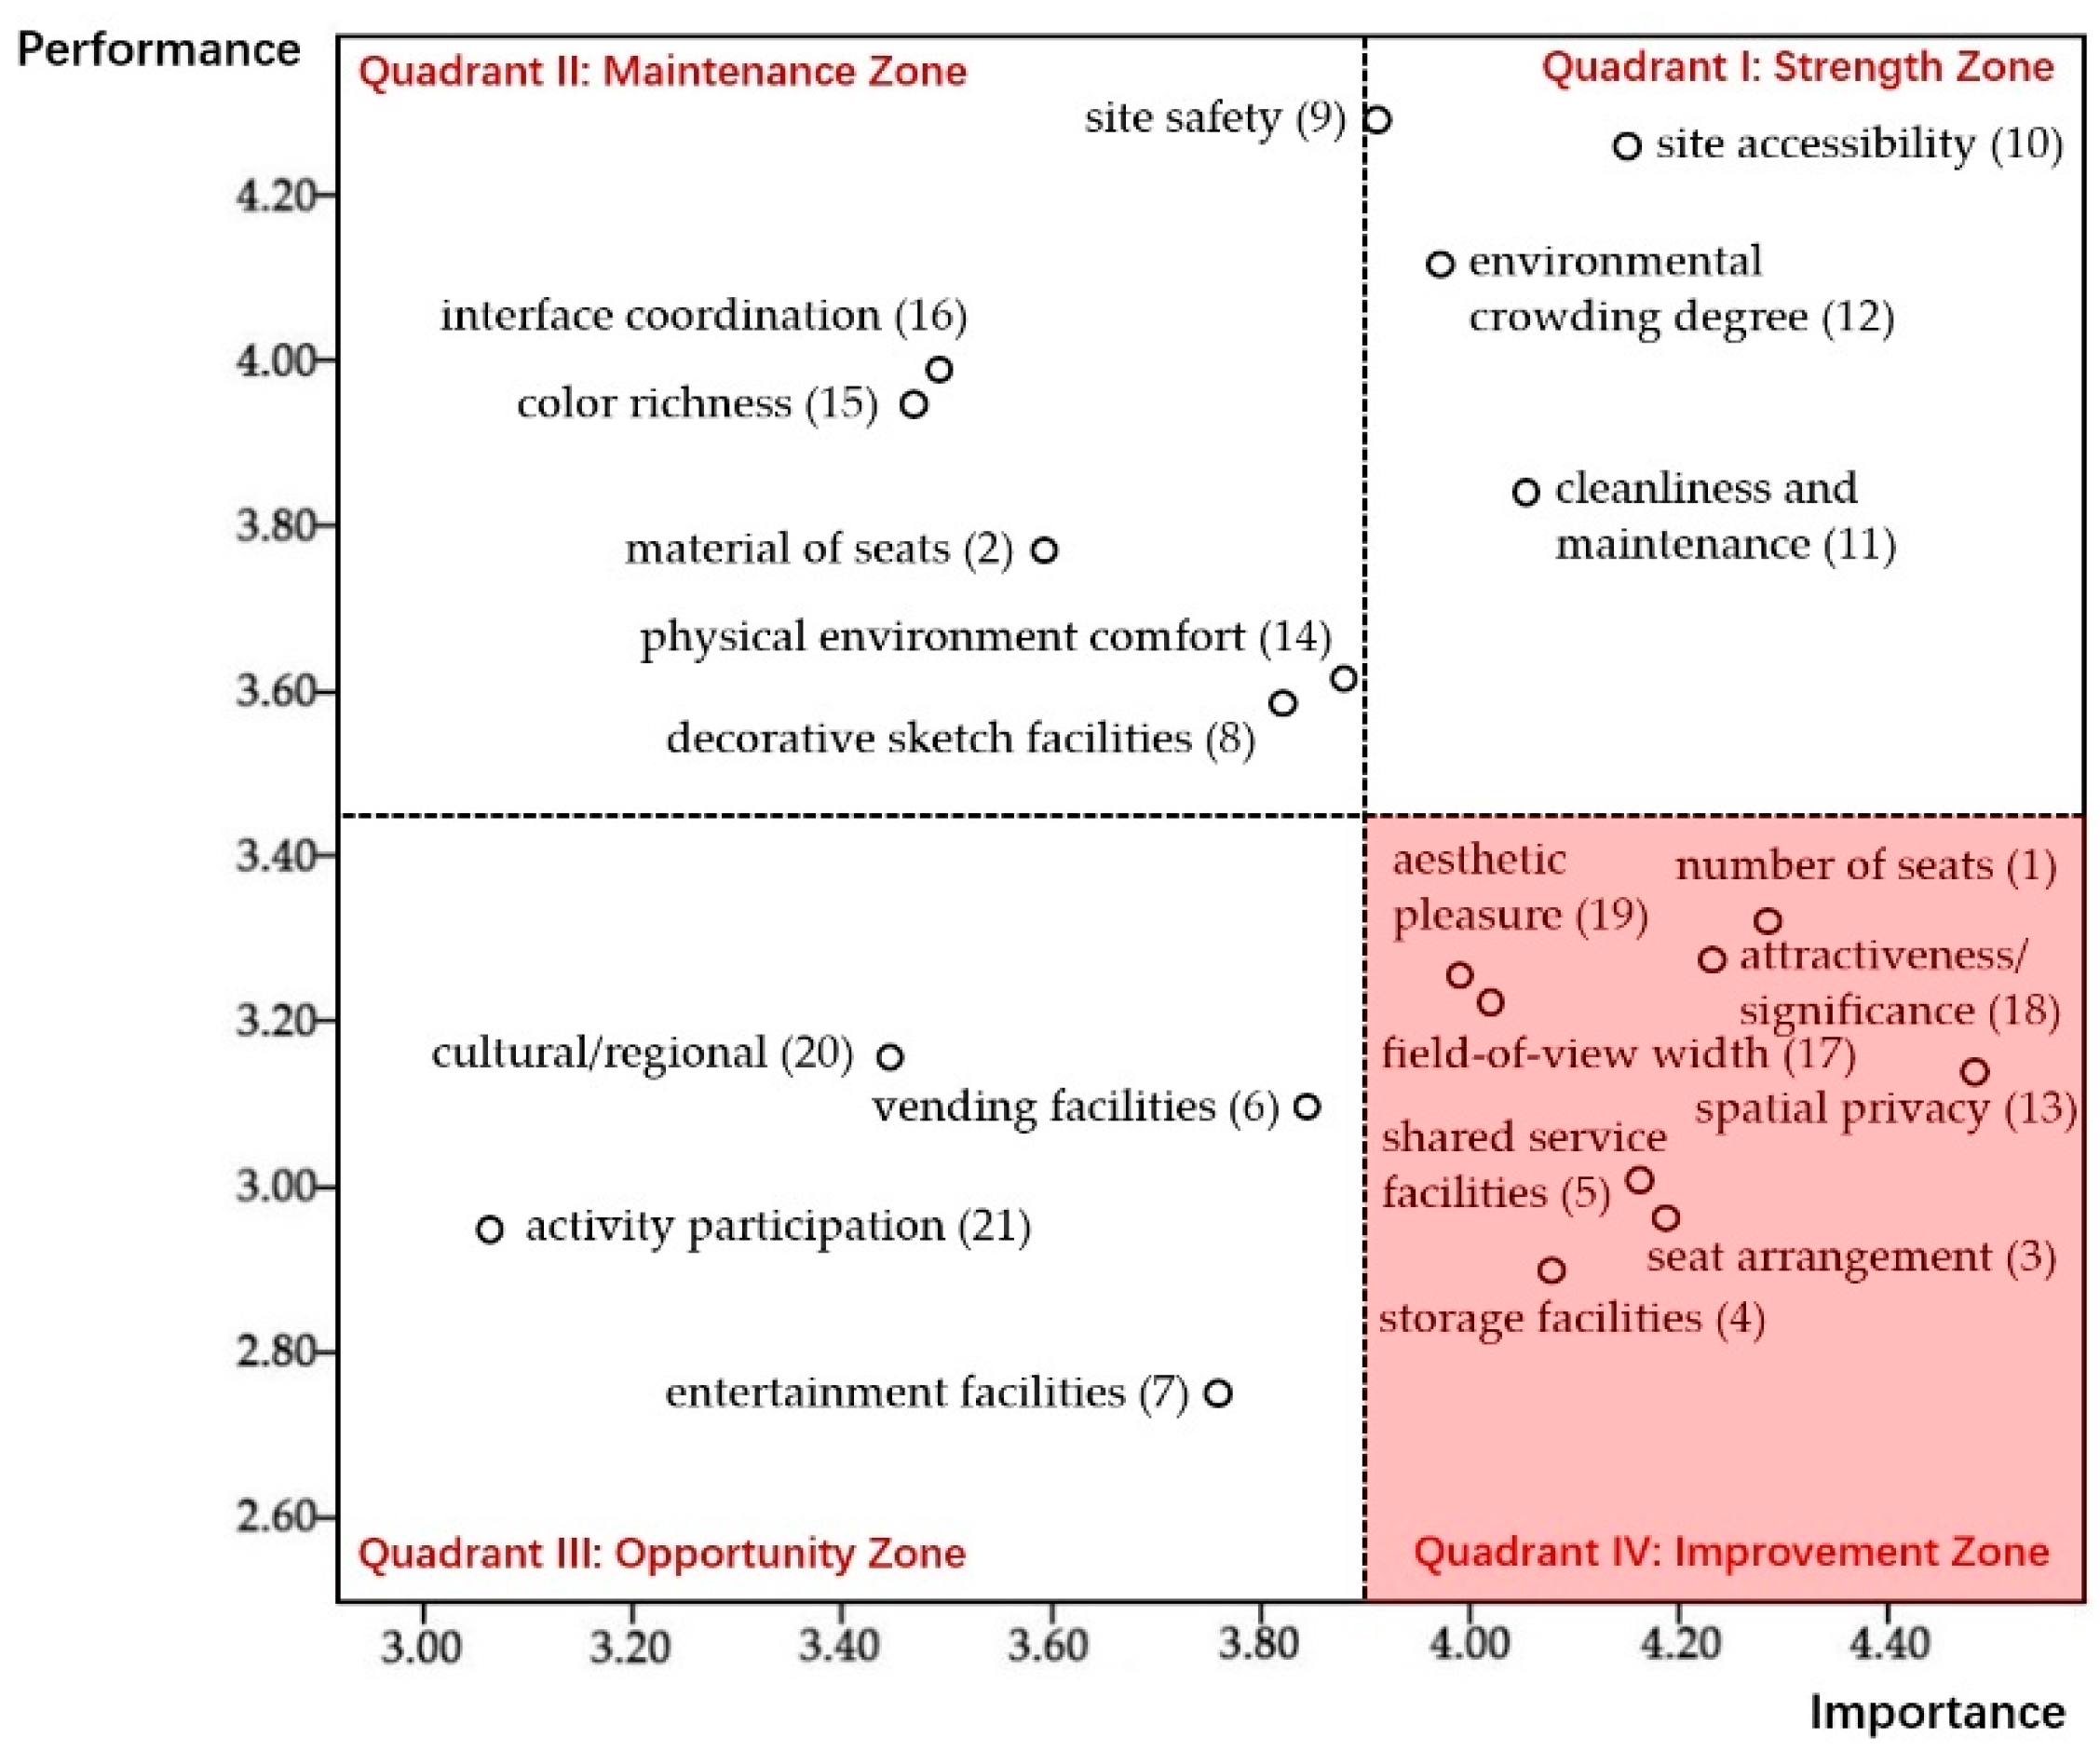
3.2.3. Significant Factor Filtering
- The combination of the two can focus more efficiently on the key points of the space from the perspective of rational allocation of resources, and increase the rationality and energy efficiency of the proposed optimization strategies.
- A two-dimensional graphical representation of importance and satisfaction can be used to analyze the current situation more clearly, and the combination of paired-sample t-tests and other data analysis methods can improve the interpretation of subjective evaluation data.
- The satisfaction scores corresponding to the evaluation indicators to be optimized are used for research analysis in the subsequent subsections, guaranteeing the continuity of the research process.
3.2.4. Quantitative Descriptions of Significant Factors
3.2.5. Influence Analysis
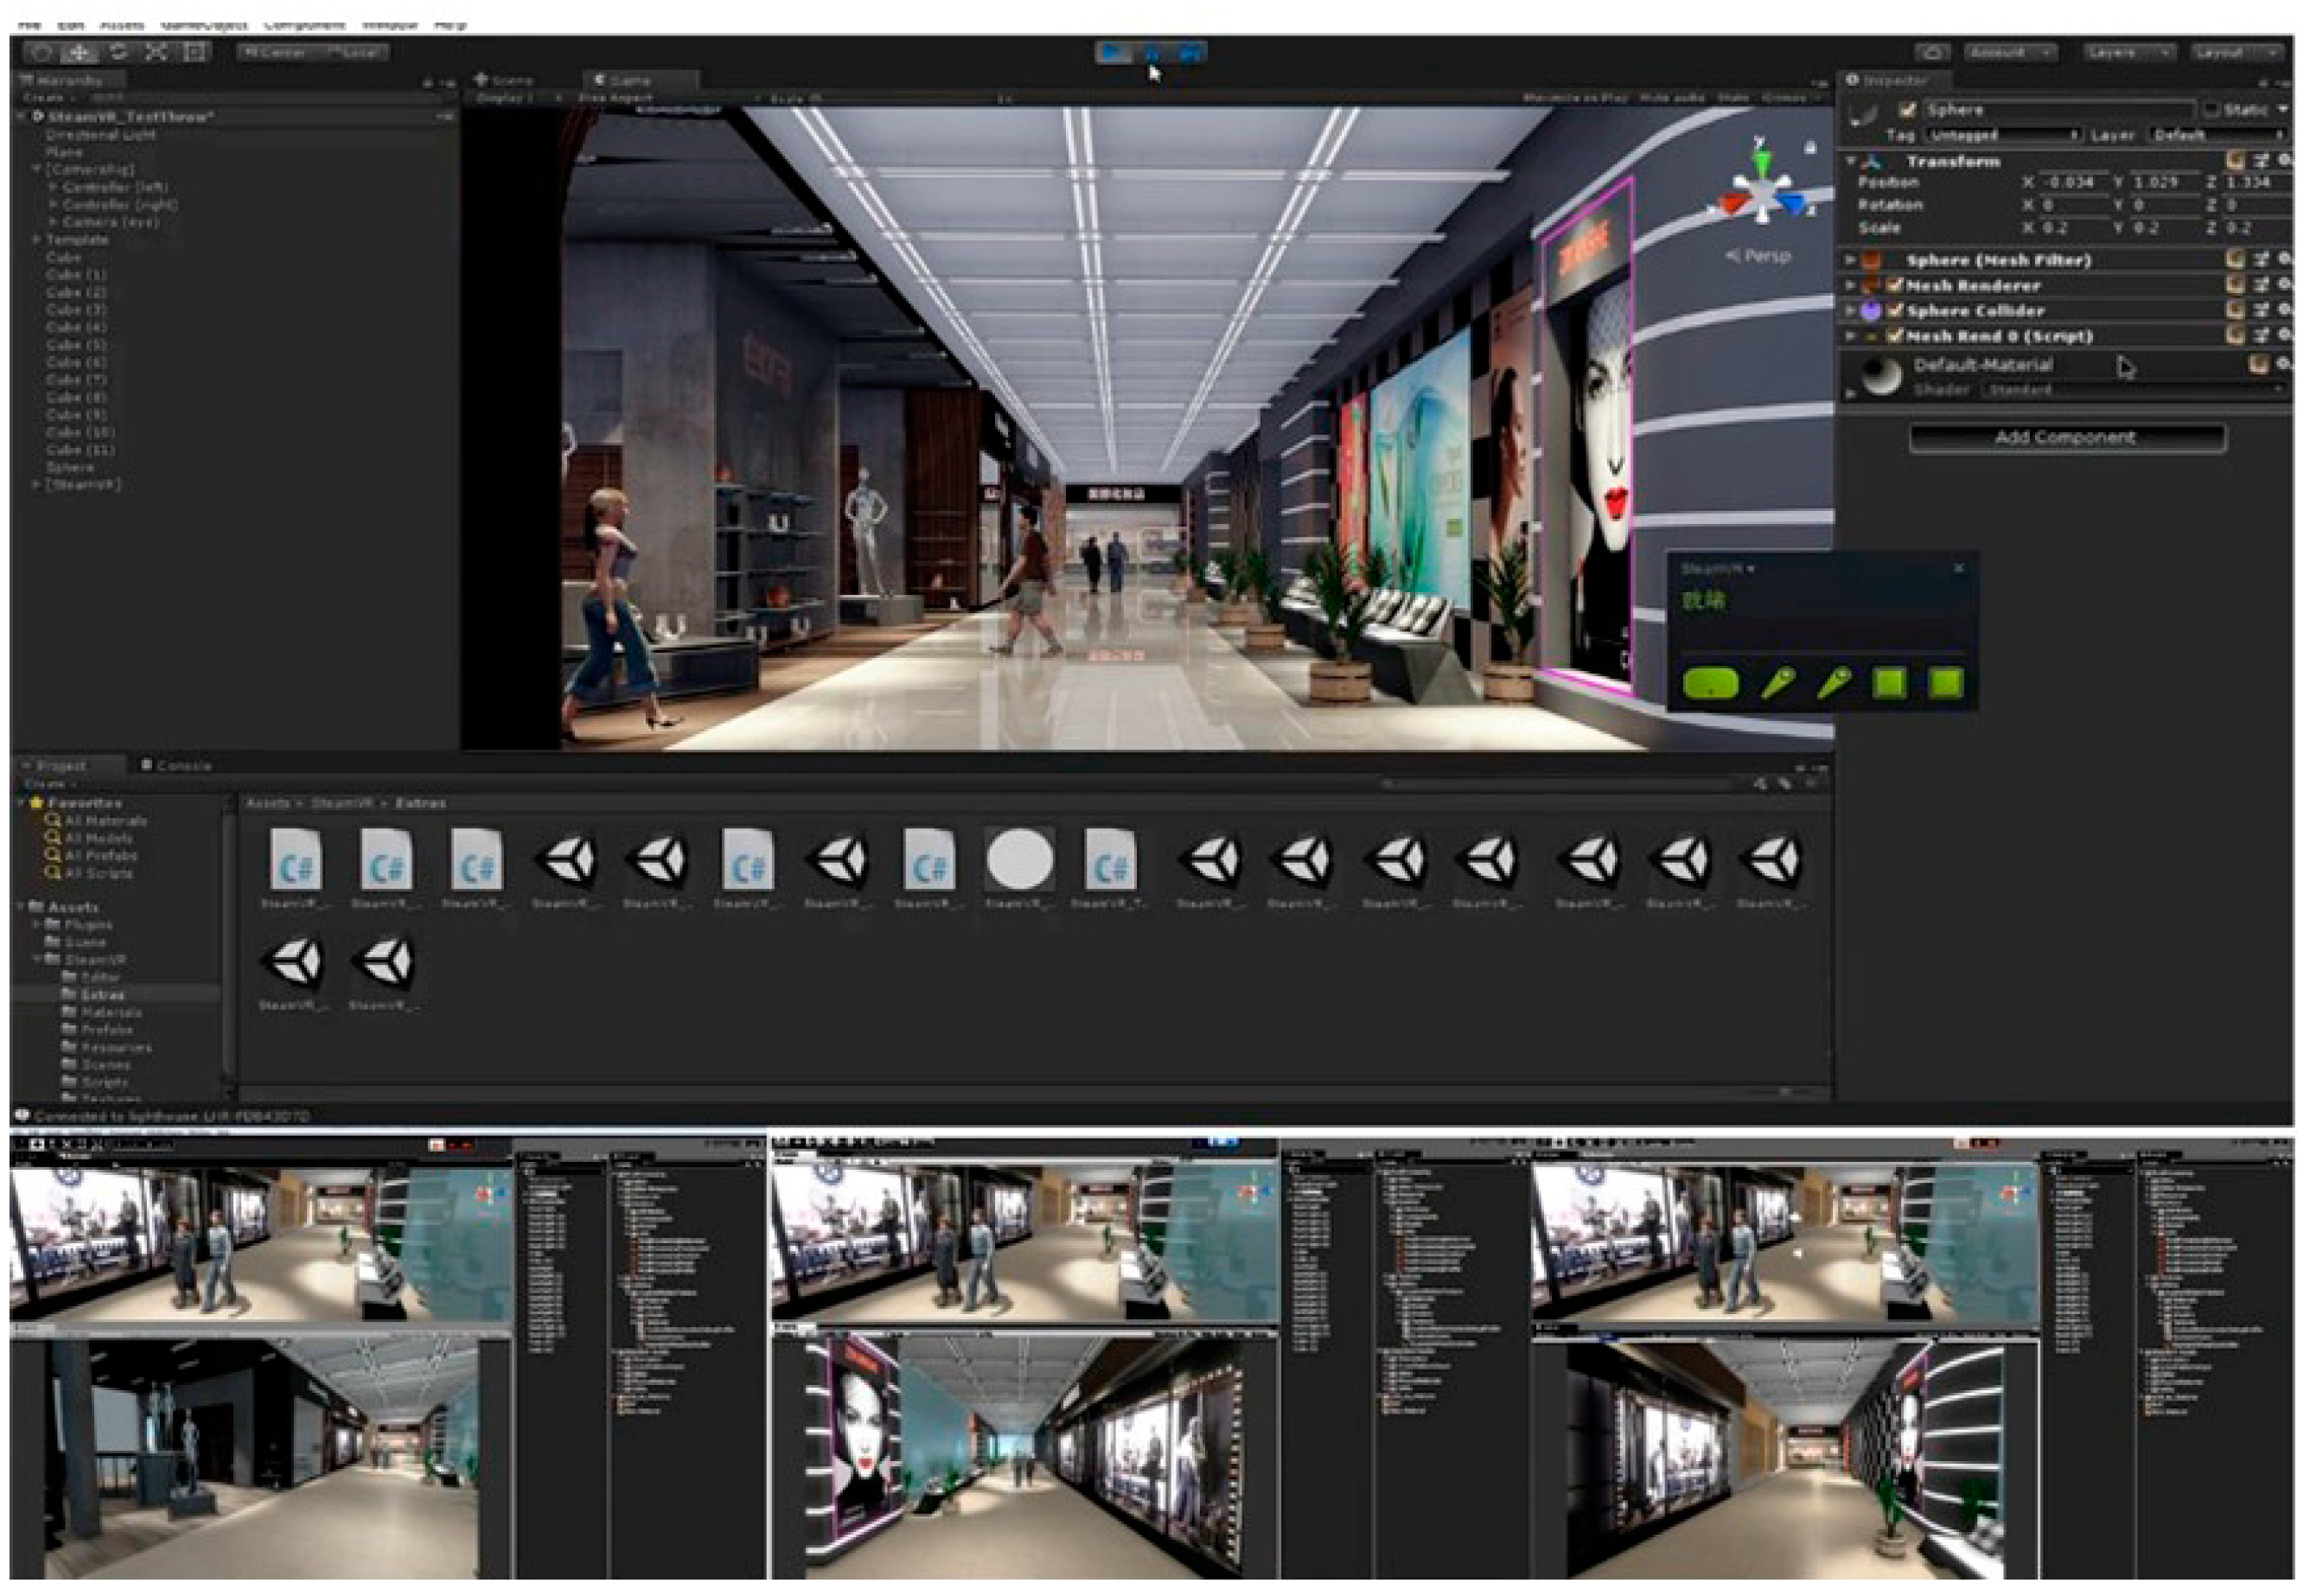
3.3. VR Experiments
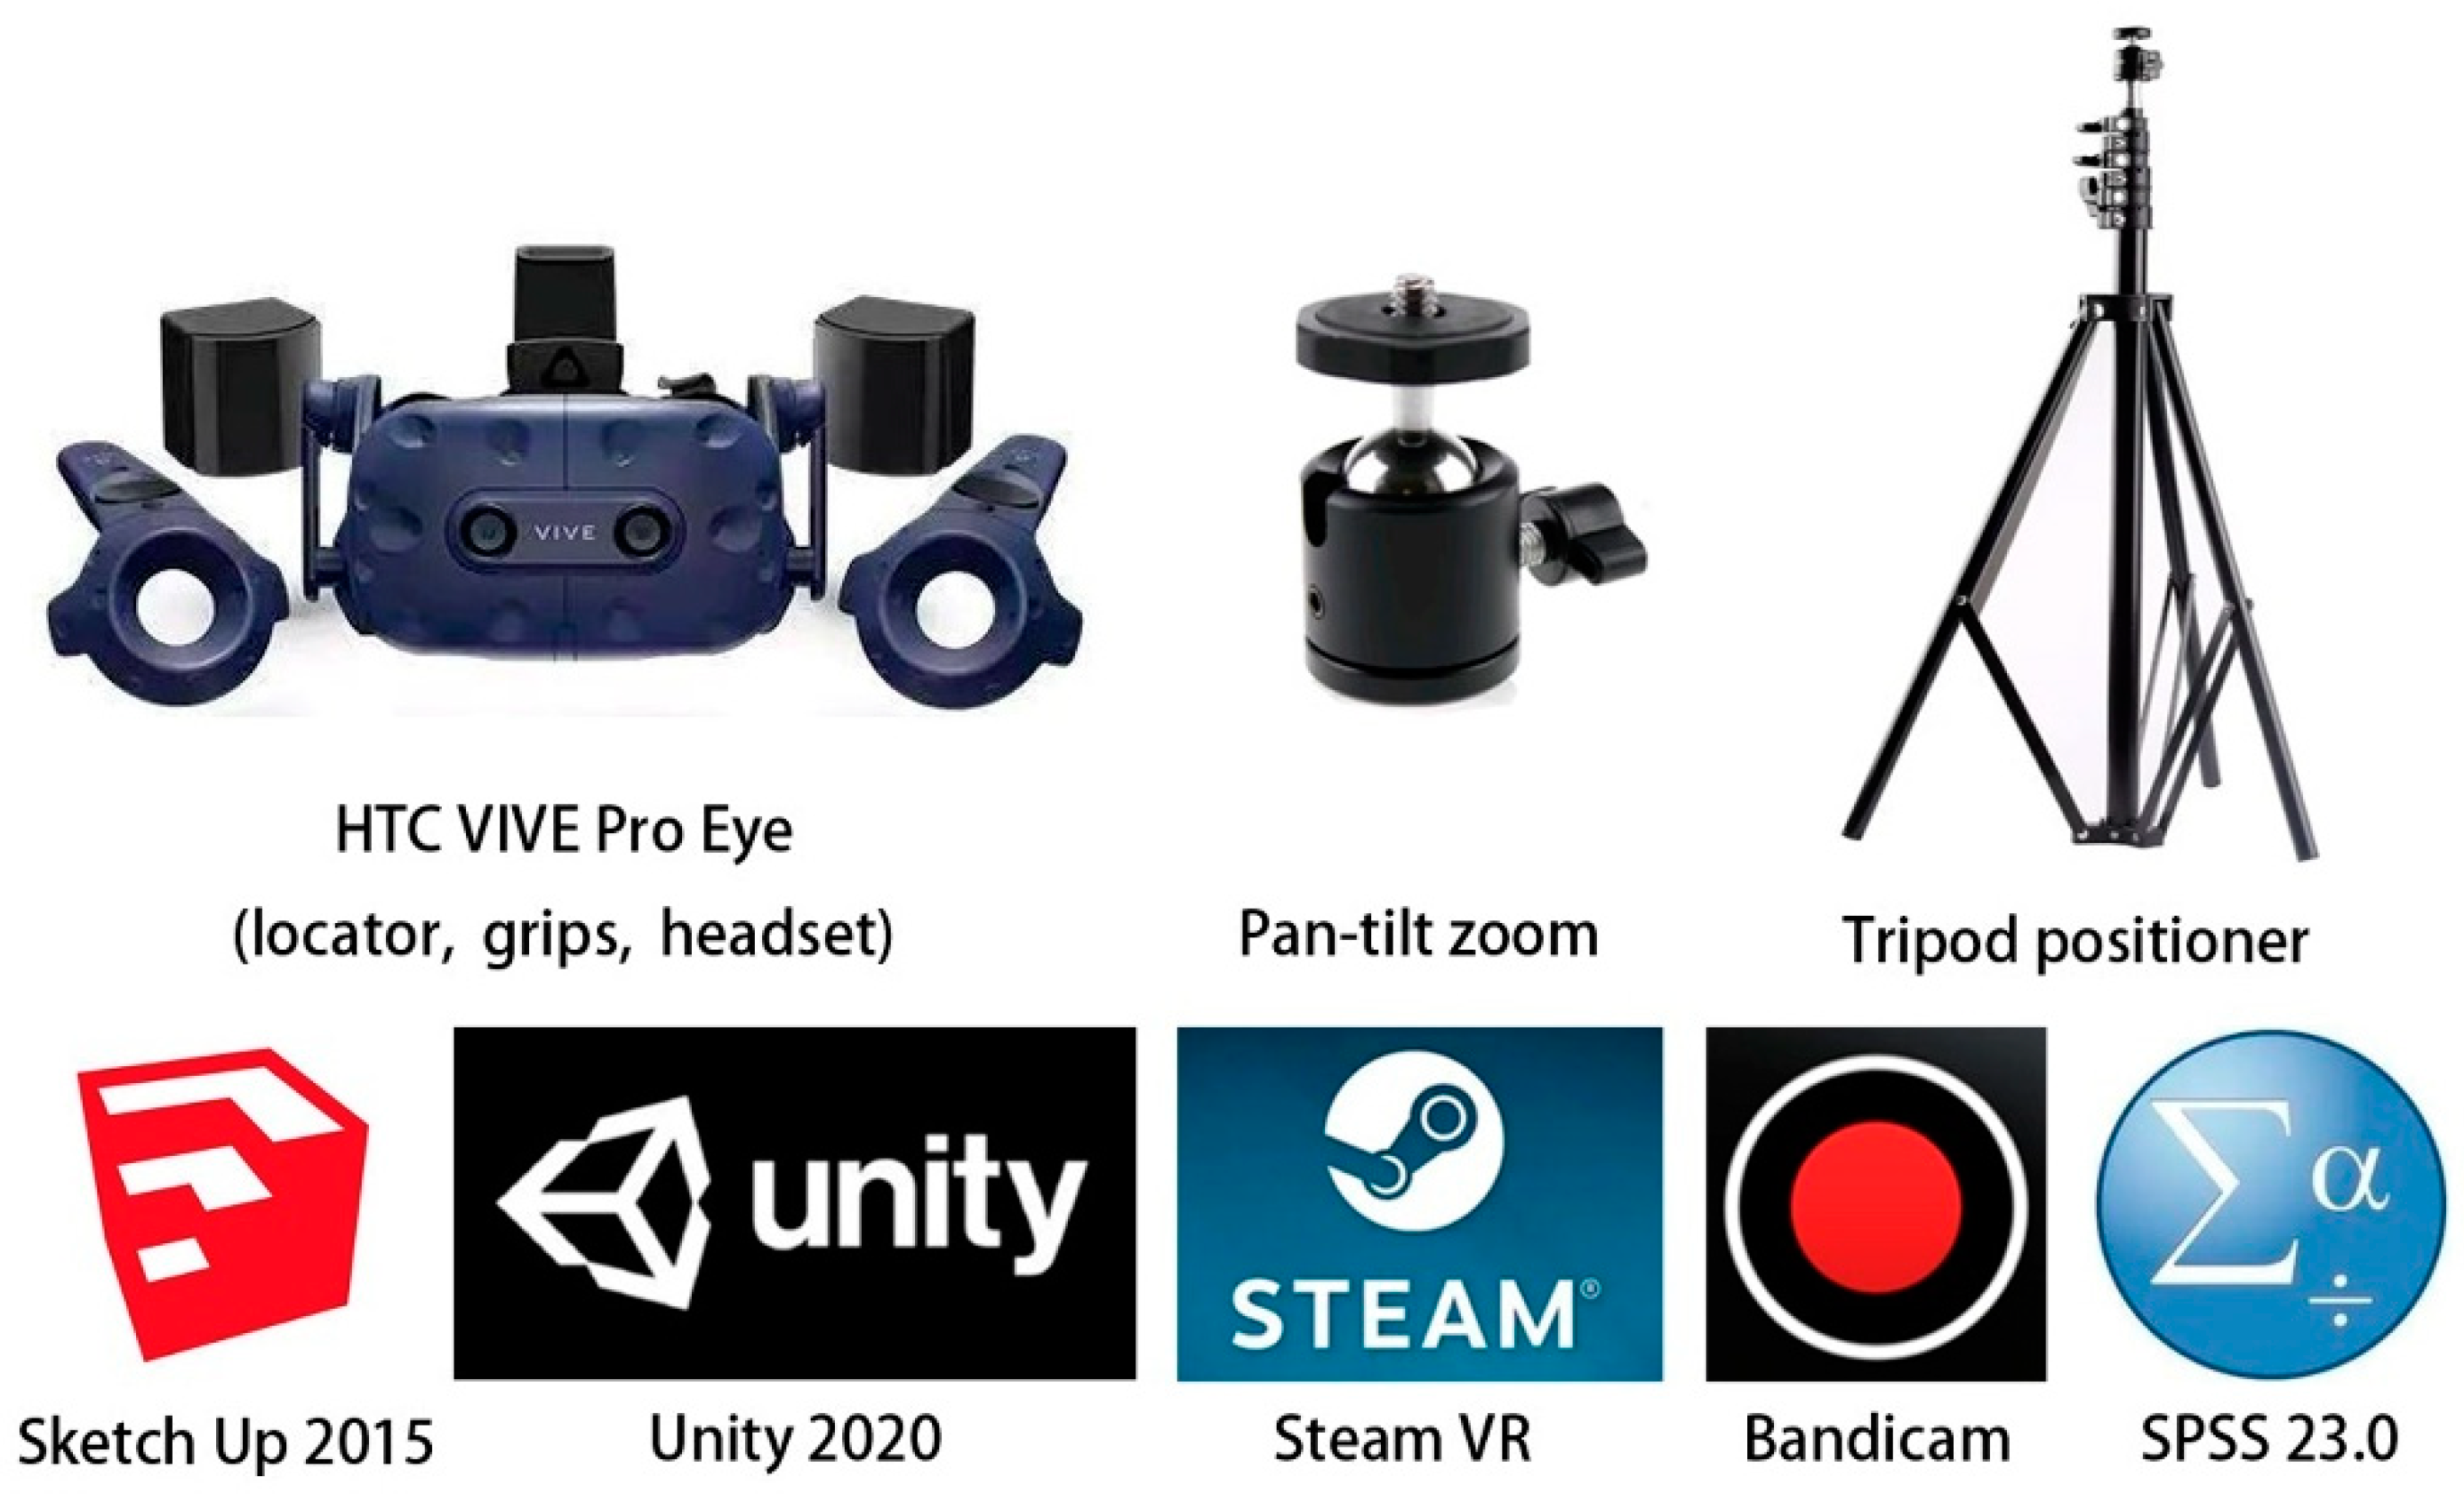
3.3.1. Materials
3.3.2. Procedure and Participants
3.3.3. Data Analysis
4. Results
4.1. Significant Influencing Factors
4.2. Influence Mechanisms of Quantifiable Factors
4.3. Influence Mechanisms of Unquantifiable Factors
4.3.1. Influence of Spatial Elements on Overall Satisfaction
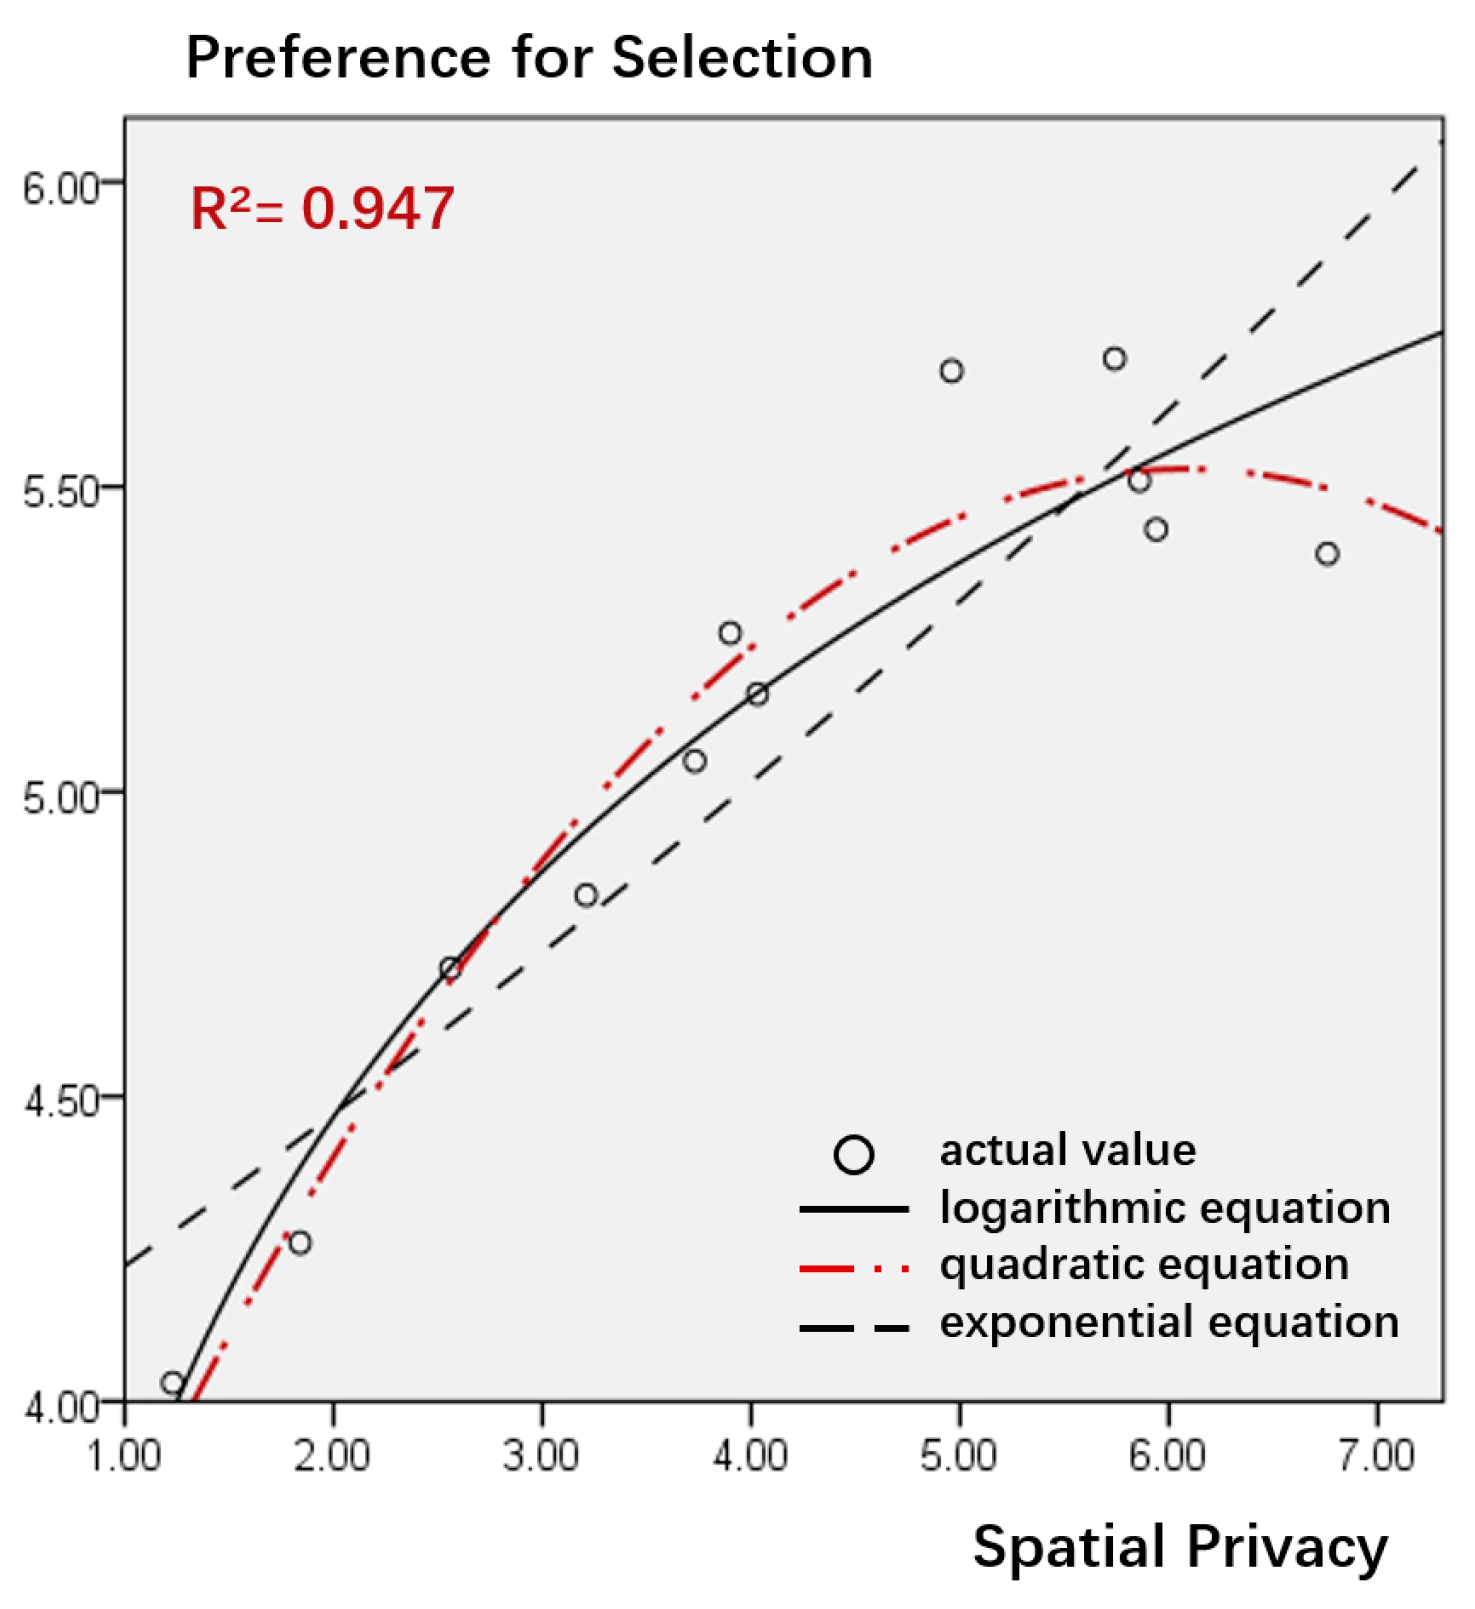
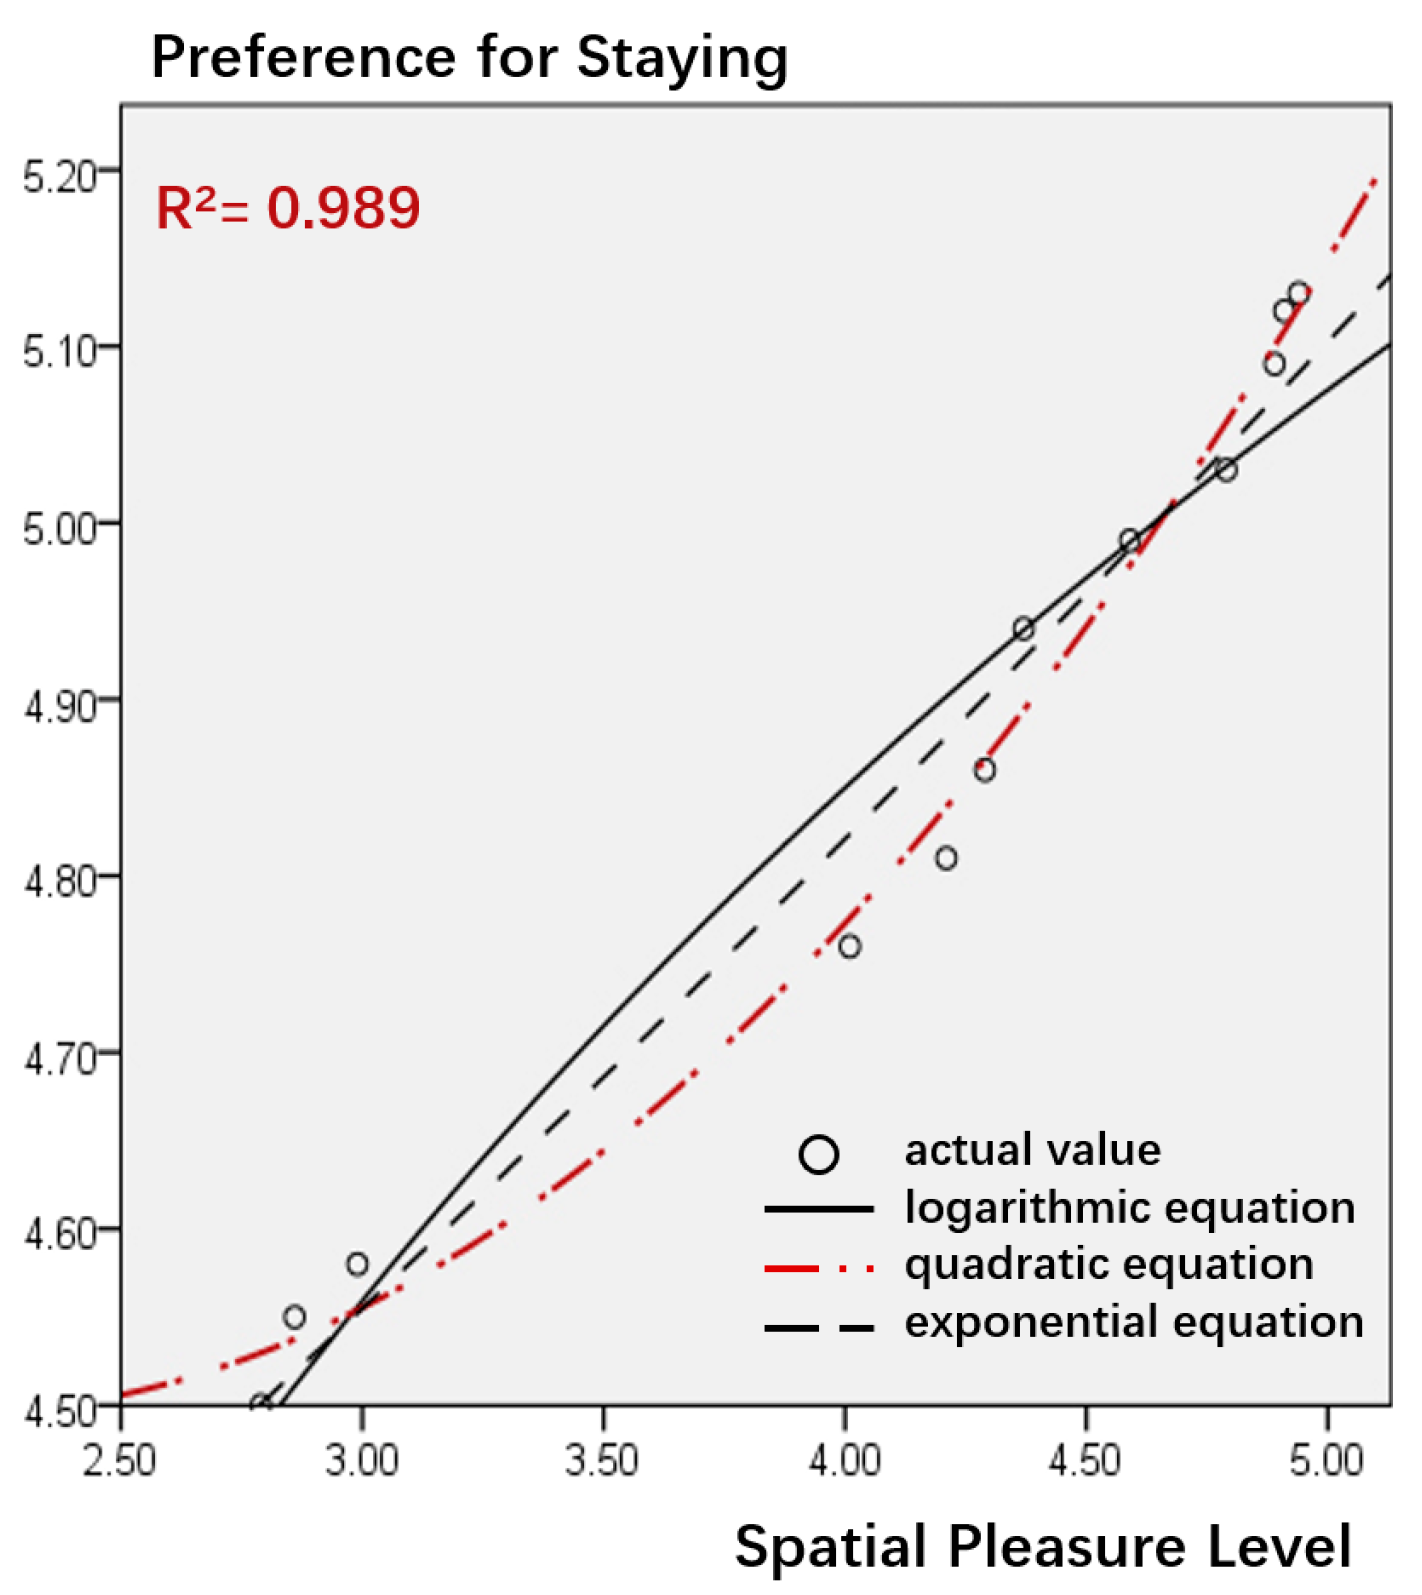
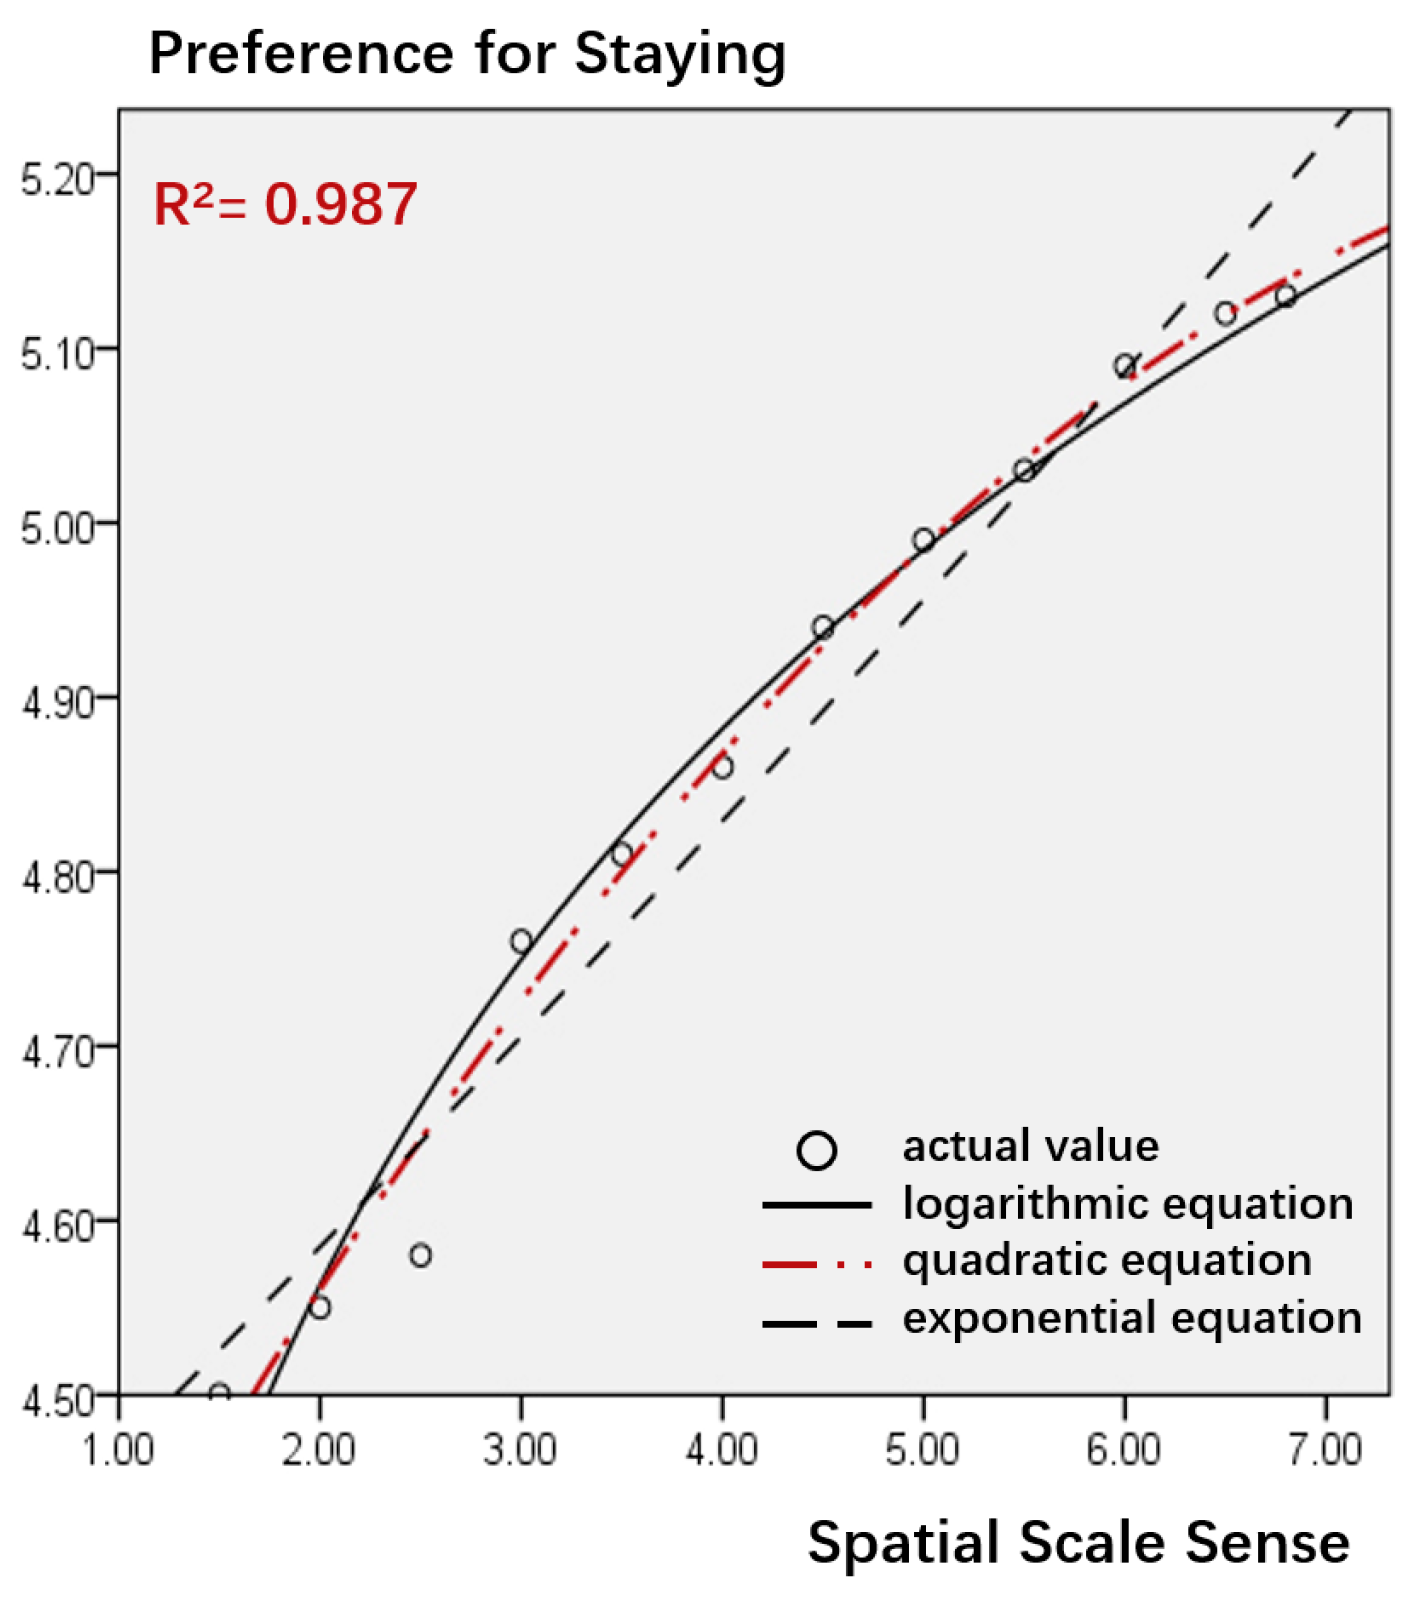
4.3.2. Influence of Spatial Elements on Preference for Selection and Staying
5. Discussion
5.1. Design Suggestions According to the Multiple Purposes of Facilities
5.2. Design Suggestions According to the Intensification of Boundaries
5.3. Design Suggestions According to the Complexity of Function
5.4. Design Suggestions According to the Integration of Resources
5.5. Benefits and Limitations
6. Conclusions
Supplementary Materials
Author Contributions
Funding
Data Availability Statement
Conflicts of Interest
References
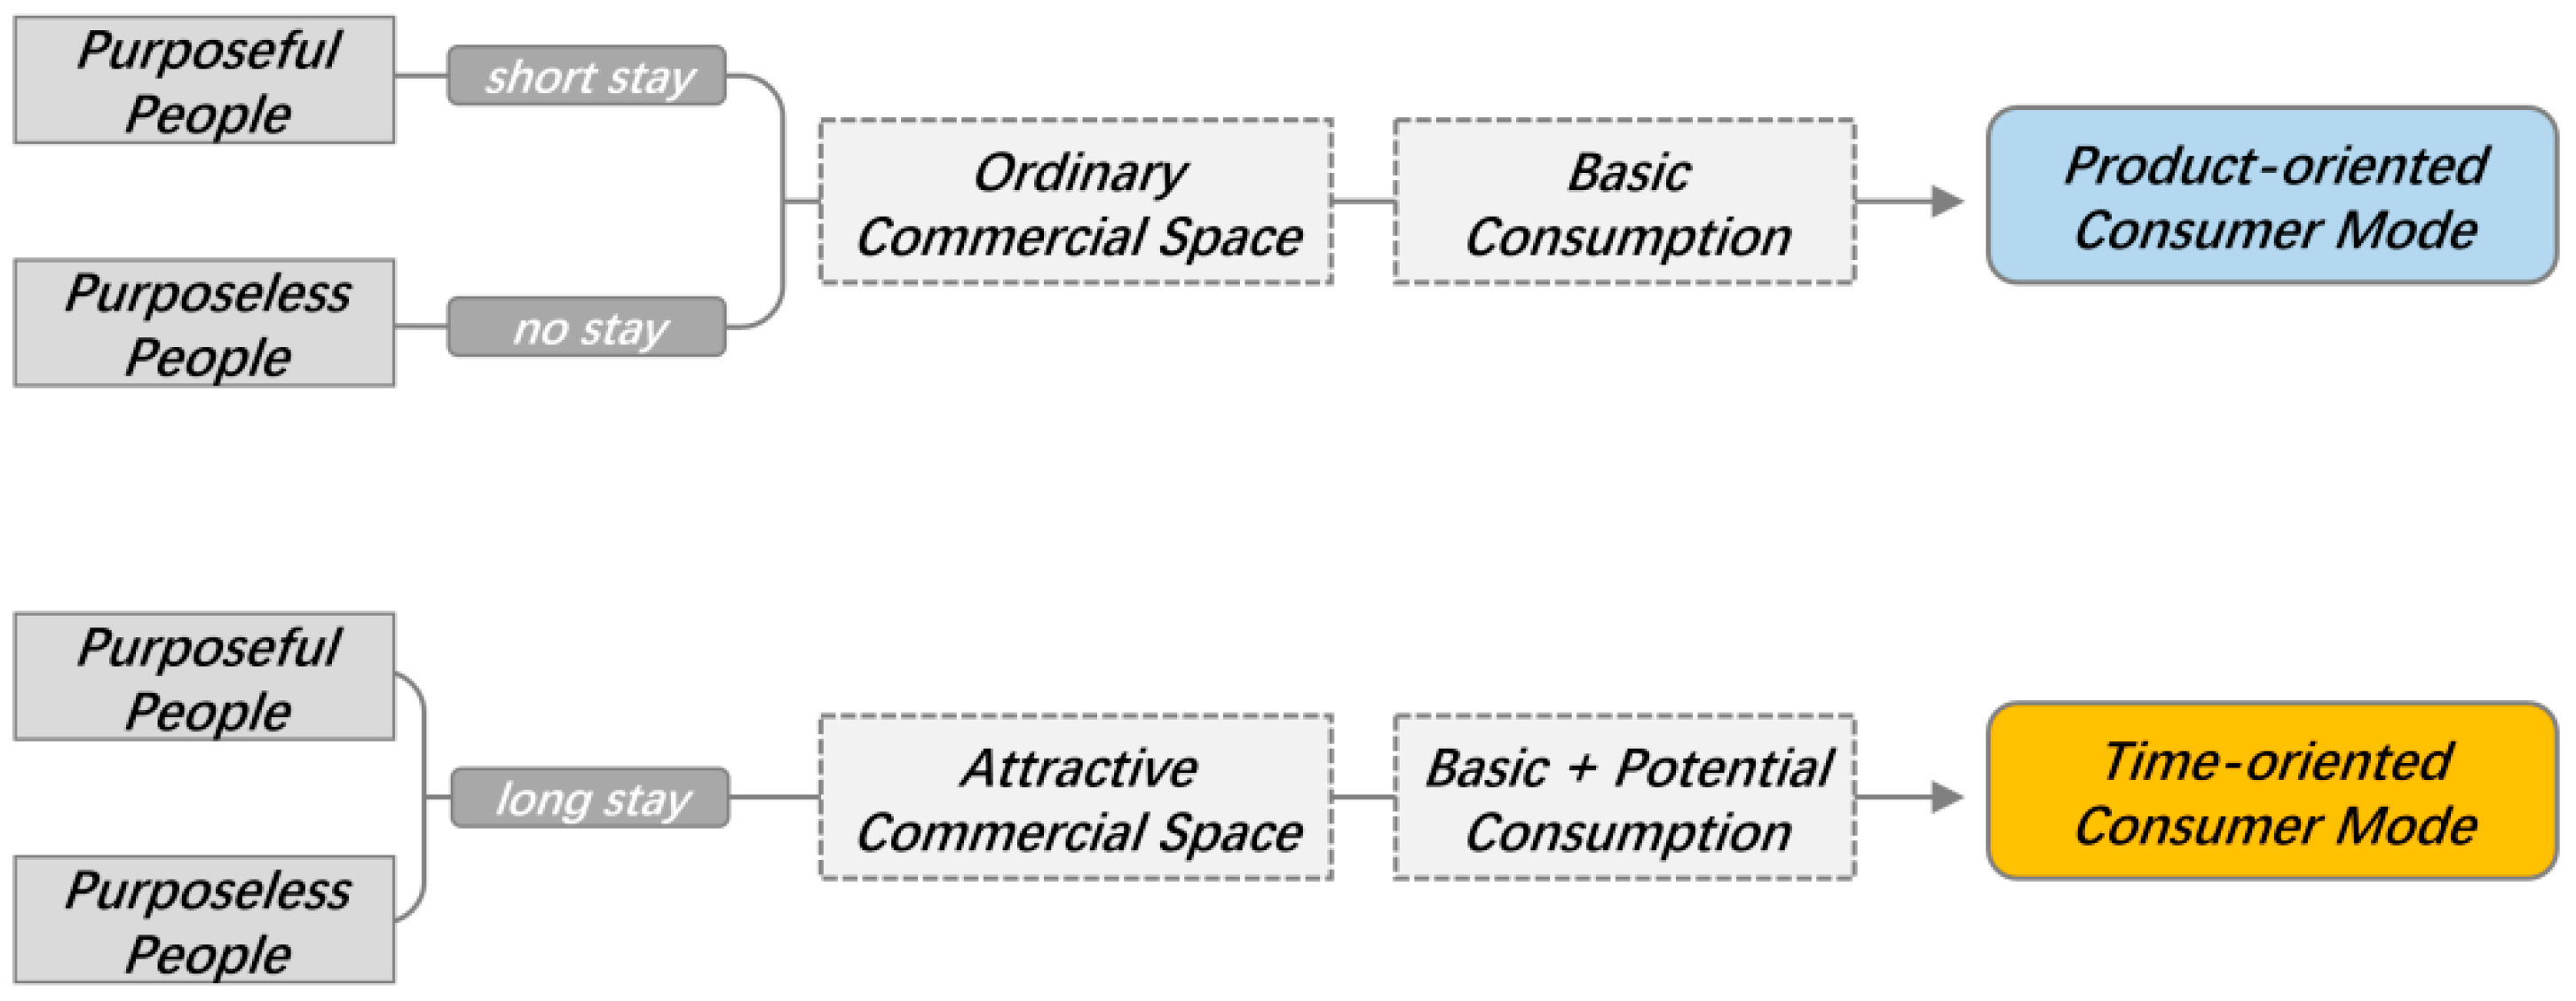
- Ohuchi, H. Time-oriented consumption and business innovation. Econ. Perspect. 1990, 9, 72–75. [Google Scholar]
- Ruddle, R.A.; Payne, S.J.; Jones, D.M. Navigating buildings in \“desk-top\” virtual environments: Experimental investigations using extended navigational experience. J. Exp. Psychol. Appl. 1997, 3, 143–159. [Google Scholar] [CrossRef]
- Bishop, I.; Ye, W.-S.; Karadaglis, C. Experiential approaches to perception response in virtual worlds. Landsc. Urban Plan. 2001, 54, 117–125. [Google Scholar] [CrossRef]
- Bishop, I.D.; Wherrett, J.R.; Miller, D.R. Assessment of path choices on a country walk using a virtual environment. Landsc. Urban Plan. 2001, 52, 225–237. [Google Scholar] [CrossRef]
- Zacharias, J. Exploratory spatial behaviour in real and virtual environments. Landsc. Urban Plan. 2006, 78, 1–13. [Google Scholar] [CrossRef]
- Meilinger, T.; Knauff, M.; Bülthoff, H.H. Working memory in wayfinding—A dual task experiment in a virtual city. Cogn. Sci. 2008, 32, 755–770. [Google Scholar] [CrossRef]
- Felnhofer, A.; Kothgassner, O.D.; Schmidt, M.; Heinzle, A.-K.; Beutl, L.; Hlavacs, H.; Kryspin-Exner, I. Is virtual reality emotionally arousing? Investigating five emotion inducing virtual park scenarios. Int. J. Hum.-Comput. Stud. 2015, 82, 48–56. [Google Scholar] [CrossRef]
- Deb, S.; Carruth, D.W.; Sween, R.; Strawderman, L.; Garrison, T.M. Efficacy of virtual reality in pedestrian safety research. Appl. Ergon. 2017, 65, 449–460. [Google Scholar] [CrossRef]
- Parsons, T.D.; Mcmahan, T. An Initial Validation of the Virtual of the Virtual Environment Grocery Store. J. Neurosci. Methods 2017, 291, 13. [Google Scholar] [CrossRef]
- Siegrist, M.; Ung, C.-Y.; Zank, M.; Marinello, M.; Kunz, A.; Hartmann, C.; Menozzi, M. Consumers’ food selection behaviors in three-dimensional (3D) virtual reality. Food Res. Int. 2019, 117, 50–59. [Google Scholar] [CrossRef]
- Cai, S. Application and Research of Immersive Virtual Reality Technology in the Interior Decoration of Folk Houses in Guanzhong. In Proceedings of the 4th International Conference on Culture, Education and Economic Development of Modern Society (ICCESE 2020), Moscow, Russia, 13–14 March 2020; pp. 119–123. [Google Scholar]
- Pérez, G.; Rodríguez, X.F.; Burgués, J.M.; Solé, M.; Coma, J. 3D immersive learning in architecture and construction areas = Aprendizaje inmersivo 3D en el campo de la arquitectura y construcción. Adv. Build. Educ. 2020, 4, 9–19. [Google Scholar] [CrossRef]
- Hao, L.; Wang, Q. Research progress on application of virtual reality technology in landscape architecture. In Proceedings of the 3rd International Conference on Computer Graphics, Image and Virtualization (ICCGIV 2023), Nanjing, China, 16–18 June 2023; pp. 404–409. [Google Scholar]
- Ma, B.; Luo, X.; An, X.; Guo, J.; Liu, P. An analytical research using image processing to create an architectural virtual scene. In Proceedings of the 2nd International Conference on Physics, Photonics, and Optical Engineering (ICPPOE 2023), Kunming, China, 10–12 November 2023. [Google Scholar]
- Kusumowidagdo, A.; Sachari, A.; Widodo, P. Visitors’ Perceptions on The Important Factors of Atrium Design in Shopping Centers: A Study of Gandaria City Mall and Ciputra World in Indonesia. Front. Archit. Res. 2016, 5, 52–62. [Google Scholar] [CrossRef]
- Ge, J.; Zhao, Y.; Zhao, K. Impact of a Non-Enclosed Atrium on the Surrounding Thermal Environment in Shopping Malls. J. Build. Eng. 2021, 35, 101981. [Google Scholar] [CrossRef]
- Fang, T.M.; Sun, L.; Xu, X.; Li, H.; Shao, Z. Exploring the Impacts of Spatial Morphology of Underground Shopping Mall Atriums on Natural Lighting Performance. Archit. Eng. Des. Manag. 2023, 20, 808–831. [Google Scholar] [CrossRef]
- Eckert, A.; He, Z.; West, D.S. An Empirical Examination of Clustering and Dispersion Within Canadian Shopping Centers. J. Retail. Consum. Serv. 2013, 20, 625–633. [Google Scholar] [CrossRef]
- Jäger, P.F. Where the whole city meets: Youth, gender and consumerism in the social space of the MEGA shopping mall in Aktobe, western Kazakhstan. Cent. Asian Surv. 2016, 35, 178–194. [Google Scholar] [CrossRef]
- Steins, K.; Goolsby, C.; Grönbäck, A.-M.; Charlton, N.; Anderson, K.; Dacuyan-Faucher, N.; Prytz, E.; Granberg, T.A.; Jonson, C.-O. Recommendations for Placement of Bleeding Control Kits in Public Spaces—A Simulation Study. Disaster Med. Public Health Prep. 2023, 17, e527. [Google Scholar] [CrossRef]
- Hami, A.; Moula, F.F.; Maulan, S. Public Preferences Toward Shopping Mall Interior Landscape Design in Kuala Lumpur, Malaysia. Urban For. Urban Green. 2018, 30, 1–7. [Google Scholar] [CrossRef]
- Plieninger, S.; Gebreiter, D.; Mühlberger, J.; Justiz, S. Die Netzschale der Jinji Lake Mall. Stahlbau 2015, 84, 101–110. [Google Scholar] [CrossRef]
- Chuanrong, C.; Hengliang, T. The Application of Digital Technology in Interior Design Education. In Proceedings of the 2016 Eighth International Conference on Measuring Technology and Mechatronics Automation, Macau, China, 11–12 March 2016; pp. 688–691. [Google Scholar]
- Freitas, M.; Ruschel, R. What is Happening to Virtual and Augmented Reality Applied to Architecture? Caadria 2013, 407, 10. [Google Scholar]
- Zhang, J.; Zhao, Y. Humanistic Design of Soft Space in Commercial Building. Adv. Inf. Sci. Serv. Sci. 2012, 4, 376–382. [Google Scholar]
- Garcia, B. Retailising space: Architecture, retail and the territorialisation of public space. Urban Des. Int. 2015, 20, 253–254. [Google Scholar] [CrossRef]
- Tang, H.; Ding, Y.; Singer, B.C. Post-occupancy evaluation of indoor environmental quality in ten nonresidential buildings in Chongqing, China. J. Build. Eng. 2020, 32, 101649. [Google Scholar] [CrossRef]
- Maslow, A.H. A Theory of Human Motivation. Psychol. Rev. 1943, 50, 370–396. [Google Scholar] [CrossRef]
- Rapoport, A. The Mutual Interaction of People and Their Built Environment. World Anthropol. 1973, 54, 550–560. [Google Scholar] [CrossRef]
- Mehrabian, A.; Russell, J.A. An Approach to Environmental Psychology; MIT: Cambridge, MA, USA, 1974. [Google Scholar]
- Gehl, J. Life between Buildings: Using Public Space; VAN Nosrand Reinhold: New York, NY, USA, 1987. [Google Scholar]
- Du, X.; Zhang, Y.; Lv, Z. Investigations and analysis of indoor environment quality of green and conventional shopping mall buildings based on customers’ perception. Build. Environ. 2020, 177, 106851. [Google Scholar] [CrossRef]
- Martilla, J.A.; James, J.C. Importance-performance analysis. J. Mark. 1977, 41, 77. [Google Scholar] [CrossRef]
- Ainin, S.; Hisham, N.H. Applying Importance-Performance Analysis to Information Systems: An Exploratory Case Study. J. Inf. Inf. Technol. Organ. 2008, 3, 95–103. [Google Scholar] [CrossRef] [PubMed]
- Tontini, G.; Picolo, J.D. Identifying the impact of incremental innovations on customer satisfaction using a fusion method between importance-performance analysis and Kano model. Int. J. Qual. Reliab. Manag. 2013, 31, 32–52. [Google Scholar] [CrossRef]
- Cao, J.; Cao, X. Comparing importance-performance analysis and three-factor theory in assessing rider satisfaction with transit. J. Transp. Land Use 2017, 10, 837–854. [Google Scholar] [CrossRef]
- Fang, K.T. Uniform Experimental Design. In International Encyclopedia of Statistical Science; Springer: Berlin/Heidelberg, Germany, 2011. [Google Scholar]
- Kaitai, F. Orthogonal and Uniform Experimental Design; Science Press: Beijing, China, 2001. [Google Scholar]
- Peterson, R.A. On the Use of College Students in Social Science Research: Insights from a Second-Order Meta-analysis. J. Consum. Res. 2001, 28, 450–461. [Google Scholar] [CrossRef]
- Allen, R.C.; Singer, M.J.; McDonald, D.P.; Cotton, J.E. Age Differences in a Virtual Reality Entertainment Environment: A Field Study. Proc. Hum. Factors Ergon. Soc. Annu. Meet. 2000, 44, 542–545. [Google Scholar] [CrossRef]
- Hong, J.-C.; Hwang, M.-Y.; Tai, K.-H.; Tsai, C.-R. Effects of Gender and Age on Learning Spatial Concepts from a Virtual Reality Game. In Proceedings of the 2018 IEEE International Conference on Teaching, Assessment, and Learning for Engineering (TALE), Wollongong, Australia, 4–7 December 2018; pp. 1206–1207. [Google Scholar]
- Chang, W.-T. The effects of age, gender, and control device in a virtual reality driving simulation. Symmetry 2020, 12, 995. [Google Scholar] [CrossRef]
- Huang, X.; Zhao, Q.; Liu, Y.; Harris, D.; Shawler, M. Learning in an Immersive VR Environment: Role of Learner Characteristics and Relations Between Learning and Psychological Outcomes. J. Educ. Technol. Syst. 2023, 53, 3–29. [Google Scholar] [CrossRef]
- Virtual Reality Statistics and Facts. Available online: https://www.enterpriseappstoday.com/stats/virtual-reality-statistics.html (accessed on 7 July 2024).
- Who’s Really Using VR These Days? Six Data-Driven Insights into Today’s VR User Demographic. Available online: https://medium.com/@annabell_37704/whos-really-using-vr-these-days-six-data-driven-insights-into-today-s-vr-user-demographic-422372a75c8c (accessed on 5 July 2024).
- Li, Z.; Du, S. Experimental Optimization Design and Statistical Analysis; Science Press: Beijing, China, 2010. [Google Scholar]


| Hierarchy of Needs | Indicator Dimension | Specific Evaluation Indicator (21) | Evaluation Perspective and Meaning |
|---|---|---|---|
| basic behavior needs | rest facilities | number of seats (1) | whether the number of rest seats meets the requirements |
| material of seats (2) | whether the rest seat material is comfortable and beautiful | ||
| seat arrangement (3) | position and layout of rest seats | ||
| auxiliary facilities | storage facilities (4) | whether the space has special storage facilities | |
| shared service facilities (5) | satisfaction with garbage cans and charging facilities | ||
| vending facilities (6) | whether the space has vending facilities or meets visitors’ needs | ||
| entertainment facilities (7) | satisfaction with the space entertainment and activity facilities | ||
| decorative sketch facilities (8) | variety and whether it creates visual attractiveness and enjoyment | ||
| place conditions | site safety (9) | safety and stability when resting or staying | |
| site accessibility (10) | space accessibility and convenience | ||
| cleanliness and maintenance (11) | whether the space is clean or has few traces left after use | ||
| advanced psychological needs | environmental perception | environmental crowding degree (12) | the feeling of being crowded/cramped/empty space during rest |
| spatial privacy (13) | whether the space can provide a rest space for being alone and undisturbed | ||
| physical environment comfort (14) | whether the light, temperature, and humidity are appropriate during the rest time | ||
| color richness (15) | the richness and harmony of the main color collocation in the space | ||
| interface coordination (16) | whether the composition and material of space interface form are coordinated | ||
| field-of-view width (17) | the openness of the overall visual environment of the space | ||
| spiritual experience | attractiveness/significance (18) | the characteristics and creativity of space design | |
| aesthetic pleasure (19) | whether the overall environmental vision is beautiful and pleasant | ||
| cultural/regional (20) | whether the space style has cultural and artistic flavor or regional characteristics | ||
| activity participation (21) | participation degree and willingness to engage in space activities |
| Index | Quantitative Evaluation | ||||
|---|---|---|---|---|---|
| level of importance | very unimportant | unimportant | average | relatively important | very important |
| level of satisfaction | very unsatisfactory | unsatisfactory | average | relatively satisfactory | very satisfactory |
| value | 1 | 2 | 3 | 4 | 5 |
| Data Category | Cronbach’s Alpha | Number of Variable Items |
|---|---|---|
| importance reliability | 0.892 | 21 |
| satisfaction reliability | 0.876 | 21 |
| Categories | Quantitative Indicators | Quantitative Approach |
|---|---|---|
| elements of the physical environment | interface transparency | (open interface × 1 + transparent interface × 0.75 + non-transparent interface × 0)/total length of side interface × 100% |
| density of leisure facilities | number of seats/area of public lounge space (pcs/m2) | |
| types of shared service facilities | types of facilities | |
| average distance of shared service facilities | ∑ distance to facilities/total number of facilities (m/per) | |
| density of decorative vignettes | total number of decorative vignettes/space area (pcs/m2) | |
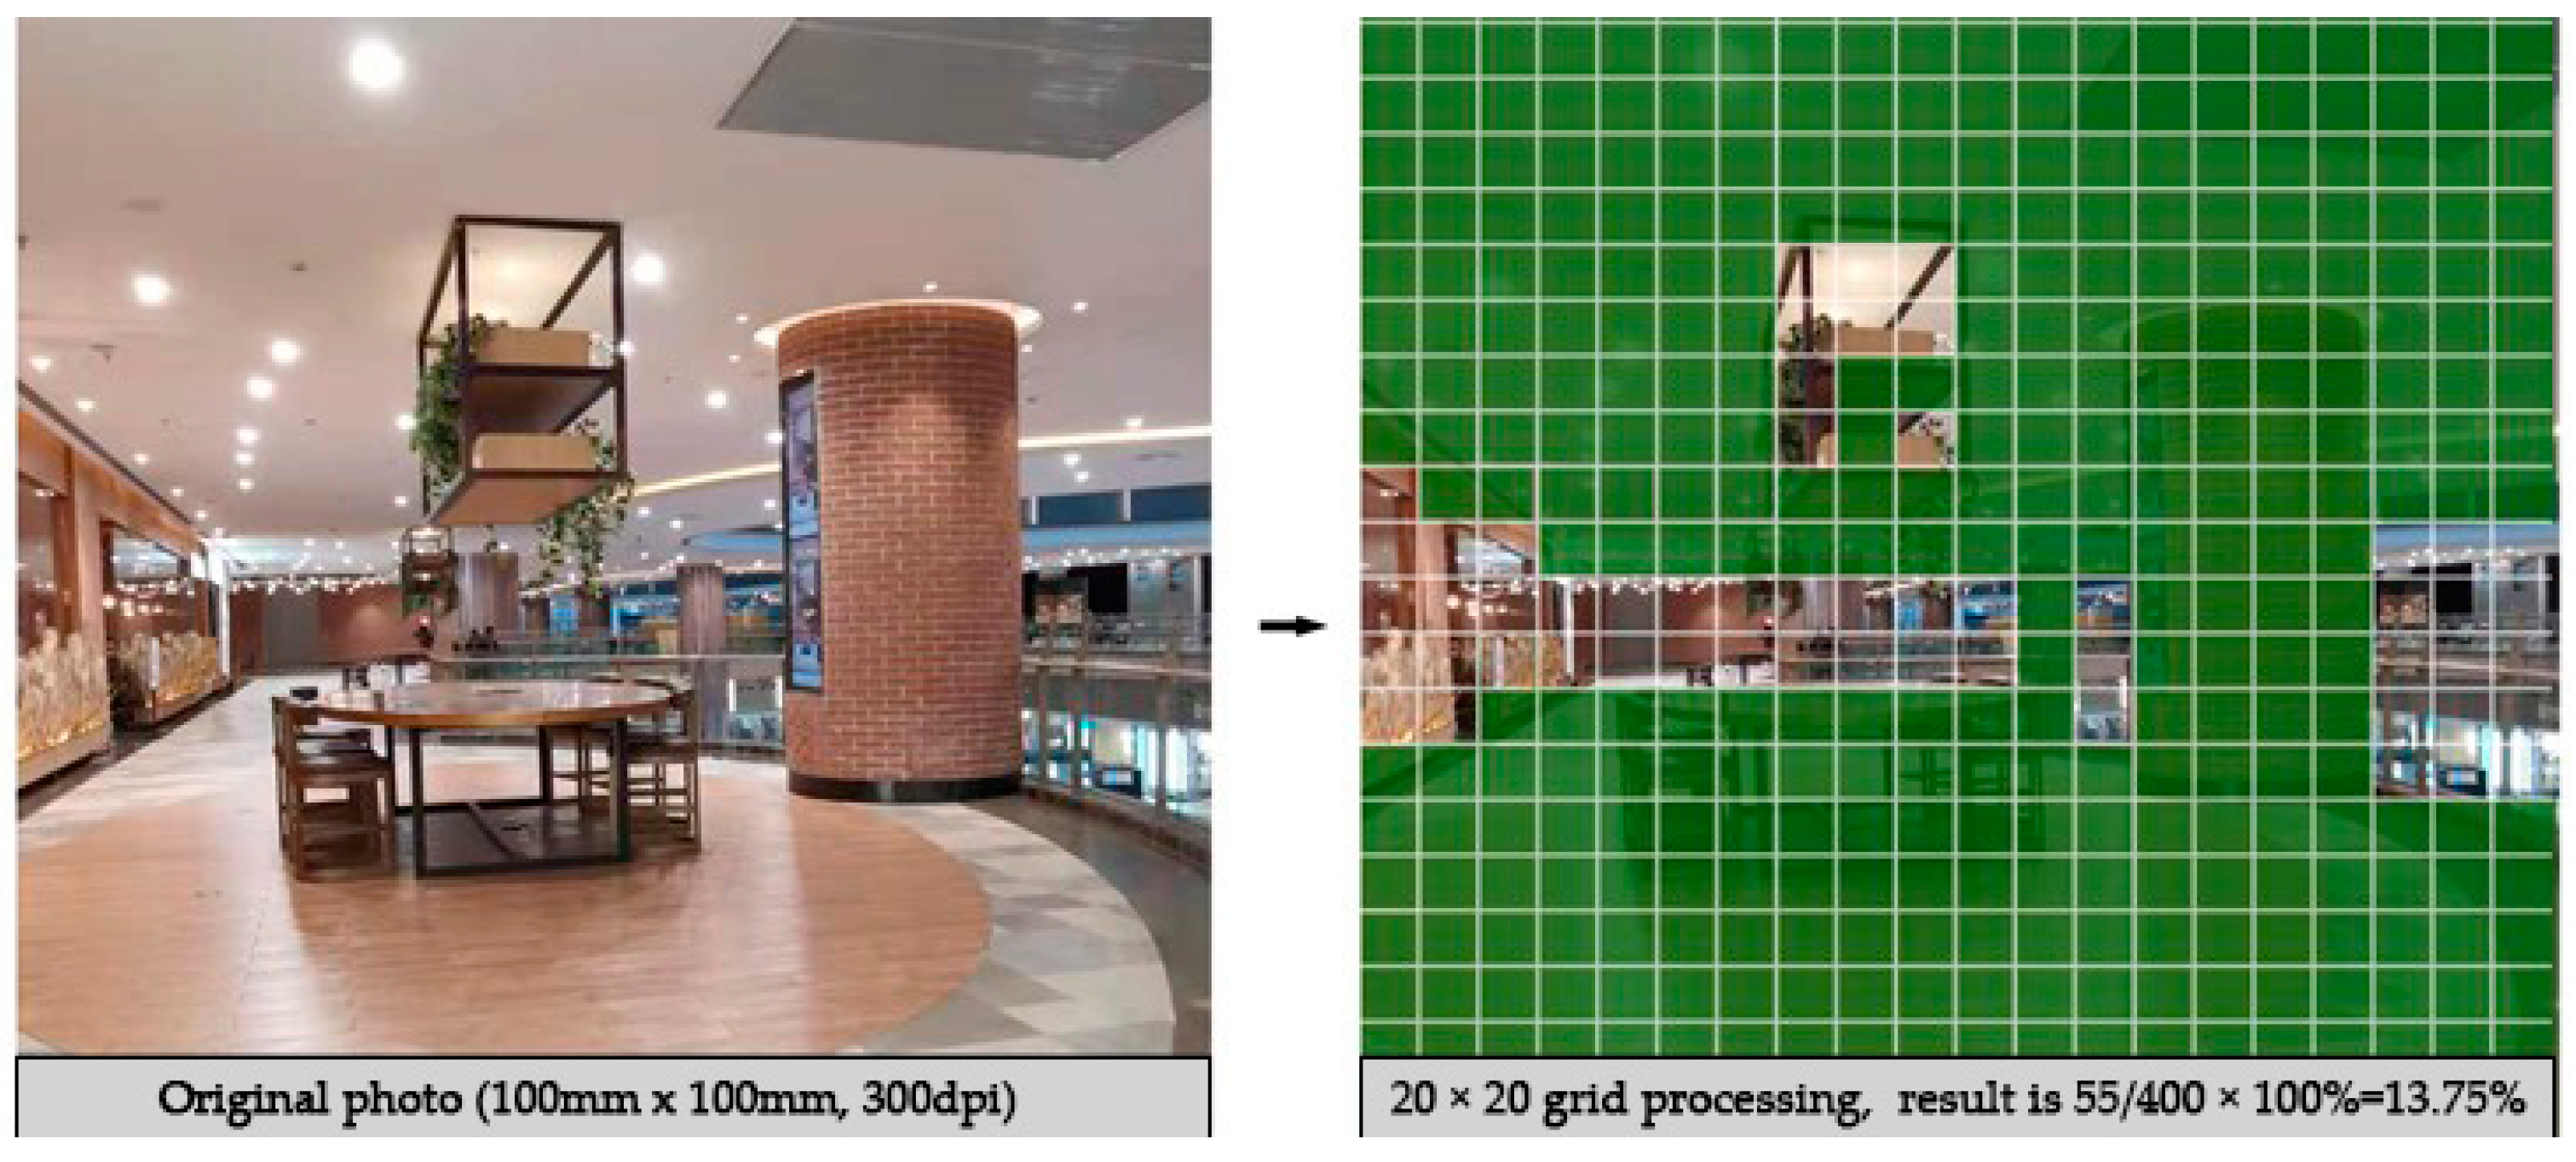
| elements of the perceptual experience | visual permeability | mean values of line-of-sight transmittance in all four directions of the photograph (%) |
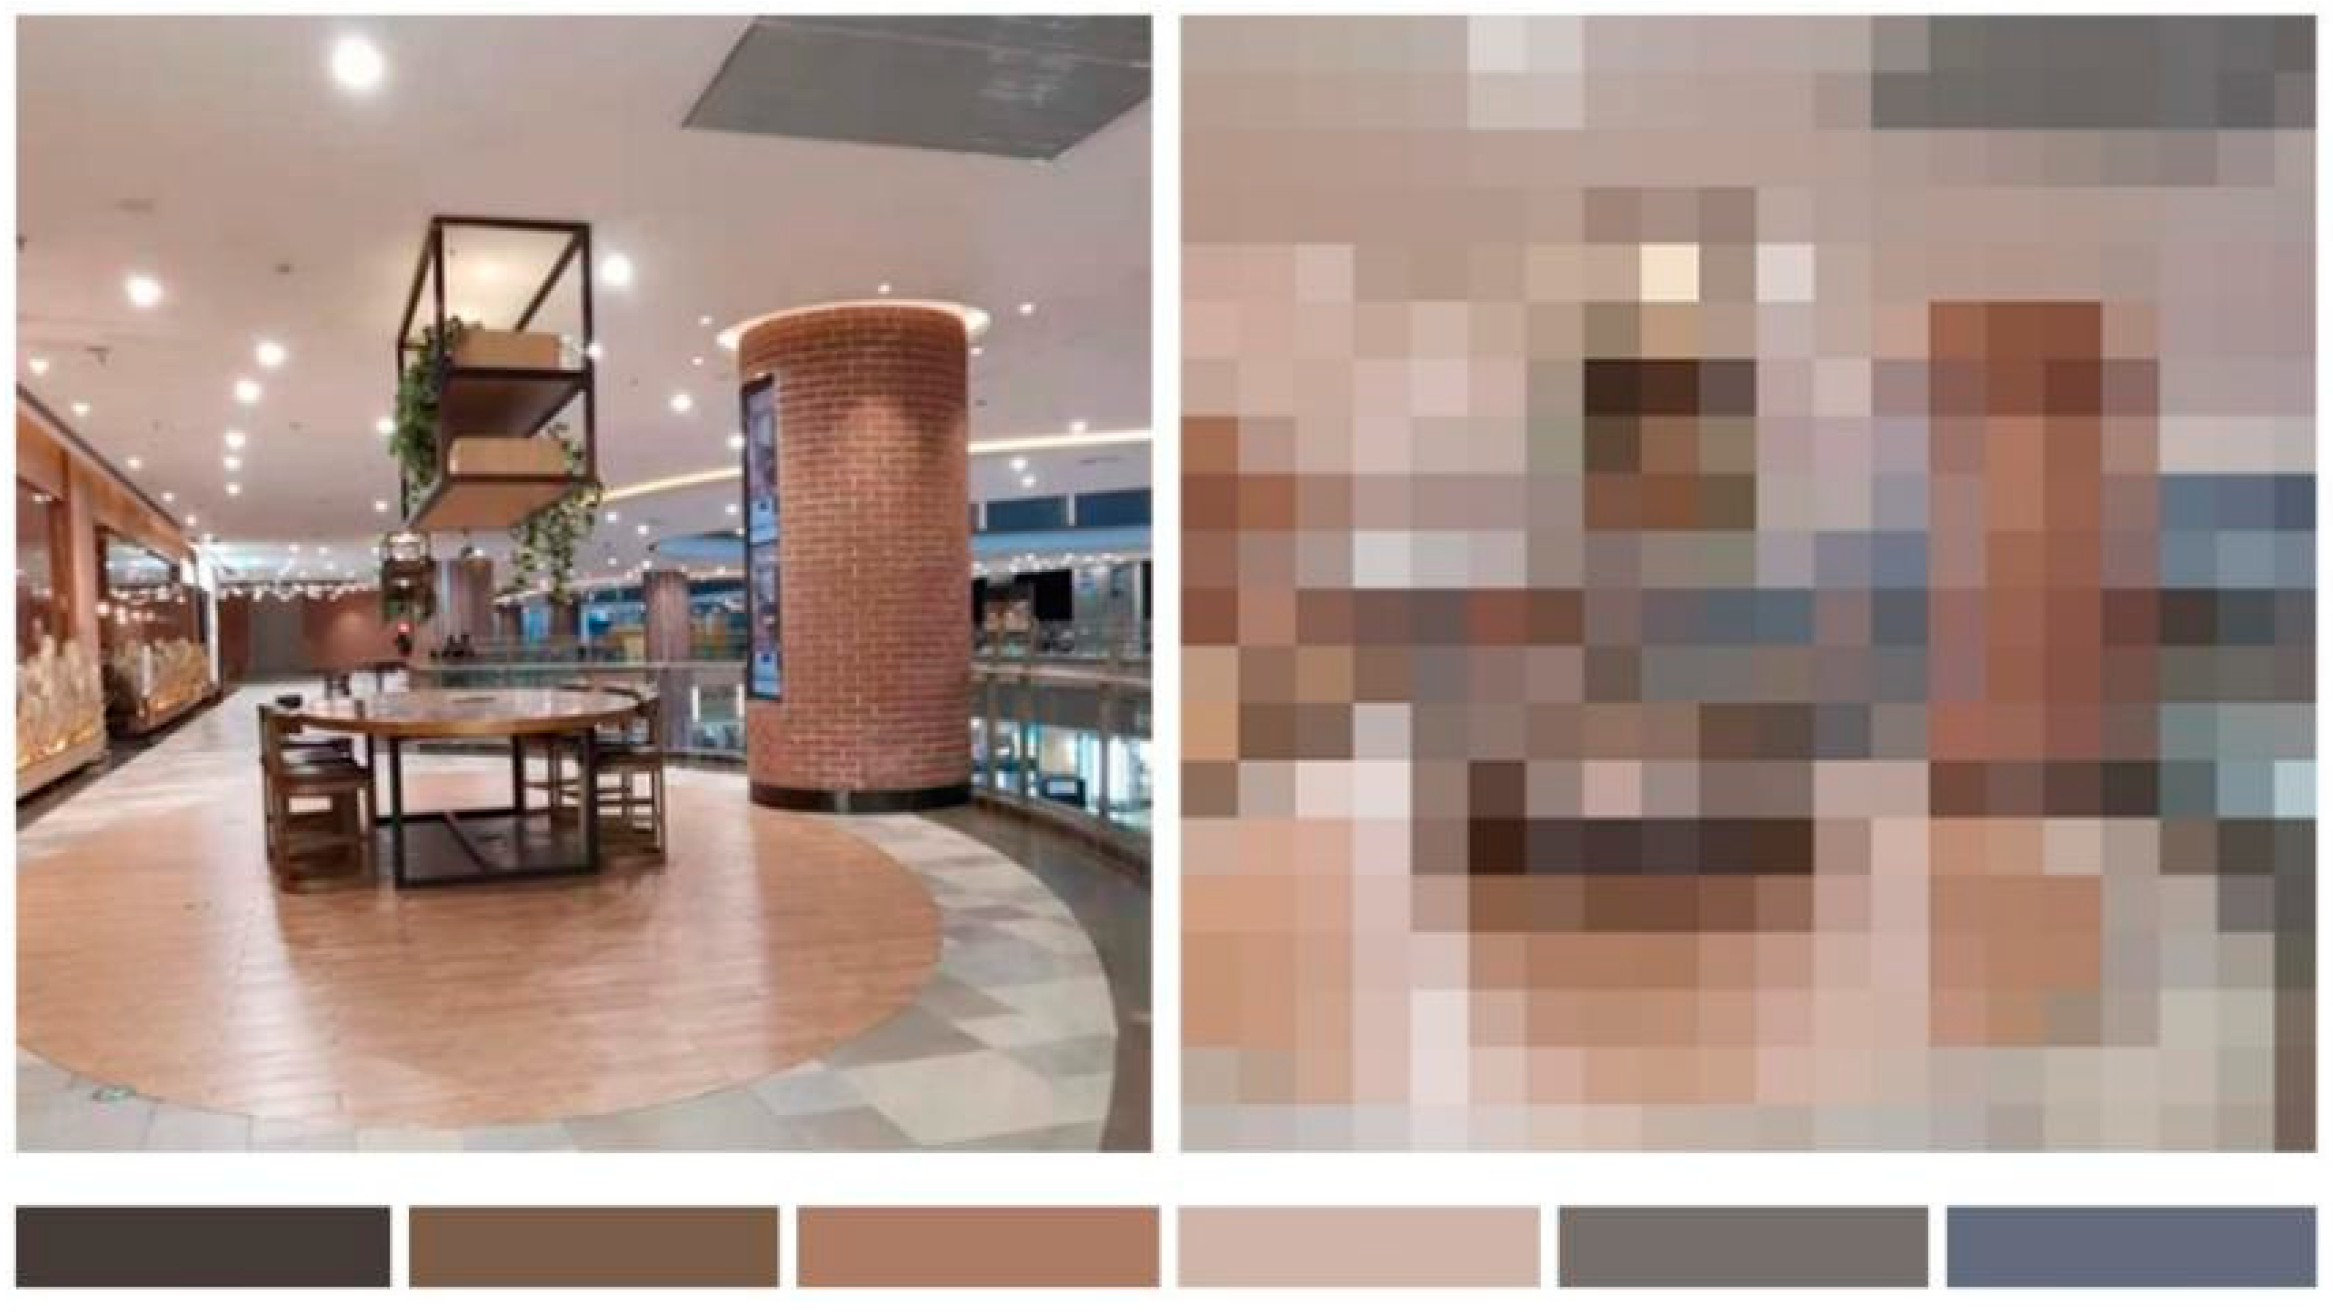
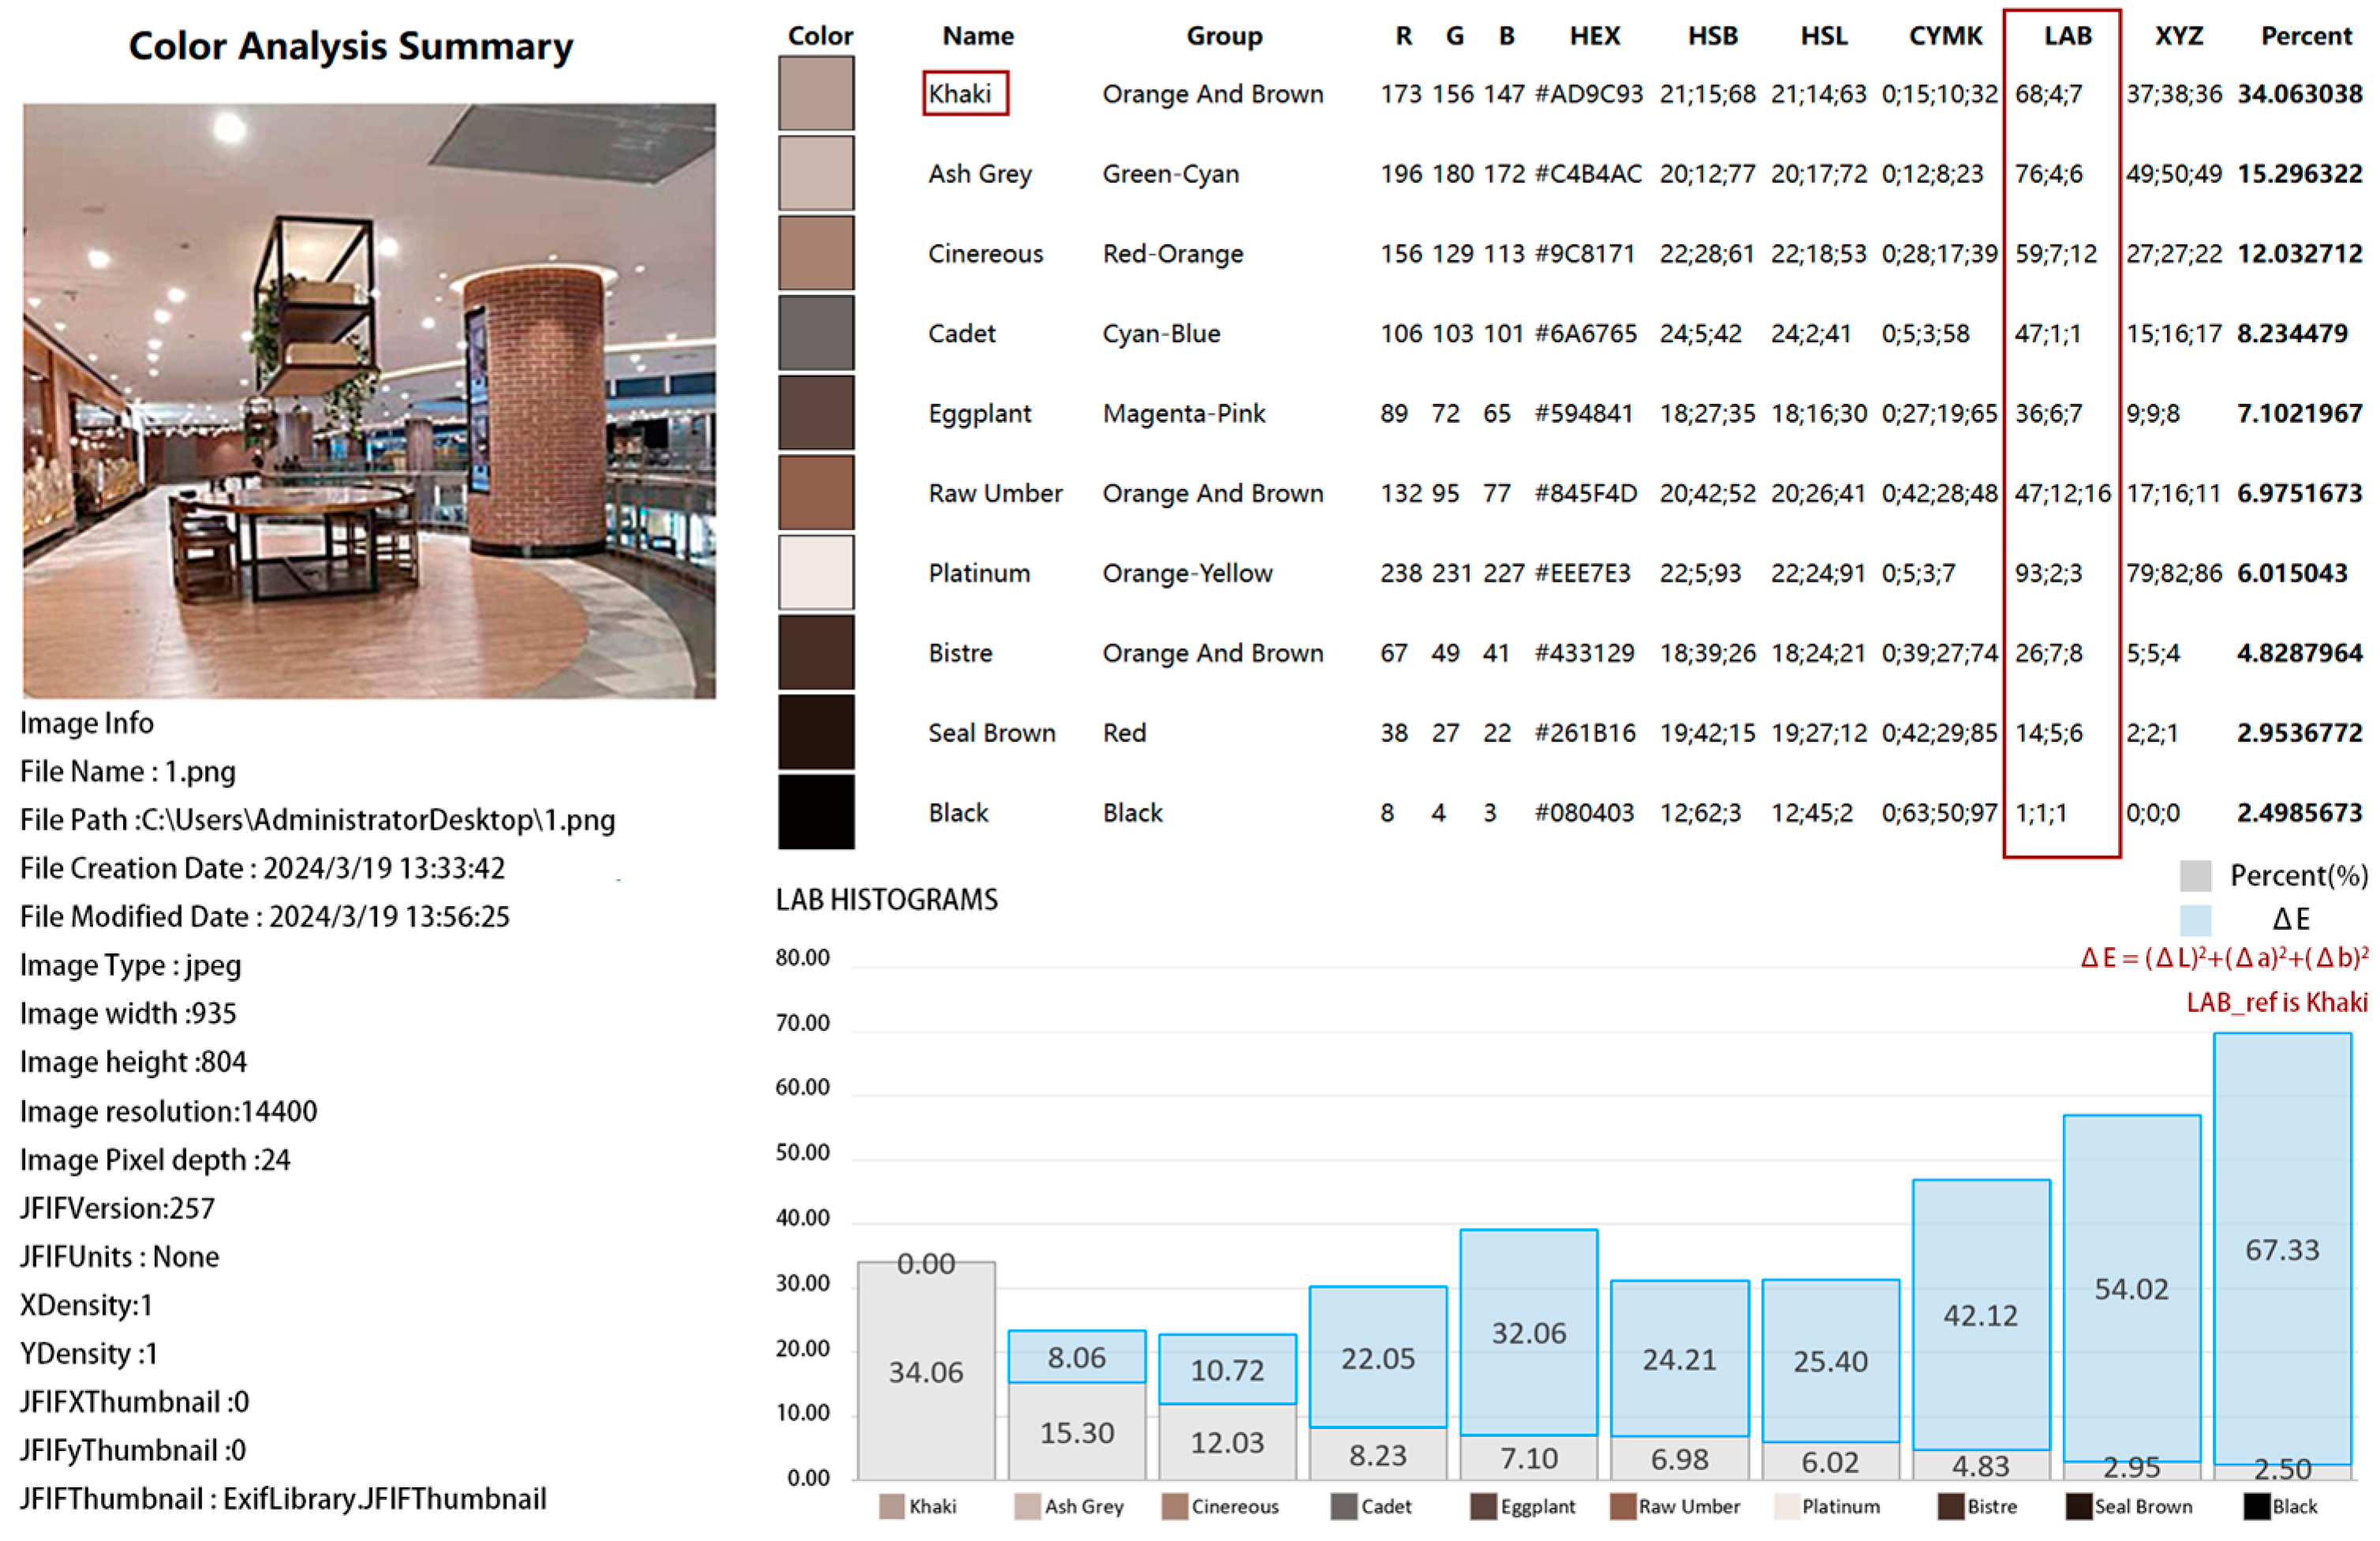
| number of main colors | number of subject colors obtained by photo extraction | |
| color difference value | LAB color space color difference formula | |
| functional density | ∑ type of function/area of selected range space (species/m2) | |
| shop density | ∑ amount of shops/area of selected range space (pcs/m2) |
| Classification | Equipment/Software | Specification Information | Application |
|---|---|---|---|
| virtual scene construction | modeling software | SketchUp Pro 2019 | construction of virtual 3D scenes |
| VR equipment | HTC VIVE Pro Eye (locator, interactive grip, virtual headset) | immersive roaming of virtual scenes | |
| auxiliary equipment | shooting stands and tripod heads | positioning and adjustment of equipment | |
| Unity 3D software platform | Unity 2020.3.7f1c1 | human–computer interaction settings | |
| interaction-driven software platform | SteamVR 1.26 | enabling virtual device control | |
| data collection and analysis | screen recording software | Bandicam 7.0 | recording behavior in video |
| statistical analysis software | SPSS 23.0 | data collation and analysis |
| No. | XI (Seat Density) | X2 (d1/d2) | X3 (Location) | X4 (Seat Type) |
|---|---|---|---|---|
| 1 | 6 (60.0%) | 3 (1:4) | 3 (shop + atrium intermediate) | 2 (domestic-oriented) |
| 2 | 4 (45.0%) | 1 (1:2) | 1 (midway between shops on both sides) | 3 (cluster type) |
| 3 | 1 (25.0%) | 1 (1:2) | 4 (shop + atrium single-sided type) | 2 (domestic-oriented) |
| 4 | 5 (52.5%) | 2 (1:3) | 5 (shop + exhibition wall single-sided type) | 1 (export-oriented) |
| 5 | 2 (32.5%) | 2 (1:3) | 2 (two side shops + atrium style) | 1 (export-oriented) |
| 6 | 3 (40.0%) | 3 (1:4) | 6 (shop + exhibition wall intermediate) | 3 (cluster type) |
| Evaluation Indicators | Importance–Performance Mean Difference | t-Value | p-Value |
|---|---|---|---|
| number of seats (1) | 0.96 | 37.621 | 0.000 |
| material of seats (2) | −0.18 | −5.736 | 0.000 |
| seat arrangement (3) | 1.22 | 35.297 | 0.000 |
| storage facilities (4) | 1.18 | 37.438 | 0.000 |
| shared service facilities (5) | 1.15 | 36.427 | 0.000 |
| vending facilities (6) | 0.74 | 19.945 | 0.000 |
| entertainment facilities (7) | 1.01 | 37.834 | 0.000 |
| decorative sketch facilities (8) | 0.24 | 5.473 | 0.000 |
| site safety (9) | −0.38 | −9.361 | 0.000 |
| site accessibility (10) | −0.11 | −3.733 | 0.000 |
| cleanliness and maintenance (11) | 0.21 | 6.252 | 0.000 |
| environmental crowding degree (12) | −0.15 | −3.026 | 0.003 |
| spatial privacy (13) | 1.34 | 34.066 | 0.000 |
| physical environment comfort (14) | 0.26 | 7.143 | 0.000 |
| color richness (15) | −0.48 | −10.465 | 0.000 |
| interface coordination (16) | −0.5 | −12.042 | 0.000 |
| field-of-view width (17) | 0.79 | 23.193 | 0.000 |
| attractiveness/significance (18) | 0.95 | 23.062 | 0.000 |
| aesthetic pleasure (19) | 0.74 | 20.300 | 0.000 |
| cultural/regional (20) | 0.28 | 6.859 | 0.000 |
| activity participation (21) | 0.11 | 3.145 | 0.002 |
| Interface Transparency | Seat Density | Shared Service Facility Types | Shared Service Facilities’ Distance | Decorative Vignettes | Seat Arrangement | Spatial Privacy | View Analysis | Attractiveness/ Significance | Aesthetic Pleasure | Cultural/ Regional | Activity Participation | |
|---|---|---|---|---|---|---|---|---|---|---|---|---|
| interface transparency | 1 | |||||||||||
| seat density | 0.822 | 1 | ||||||||||
| shared service facility types | −0.485 | −0.551 | 1 | |||||||||
| shared service facilities’ distance | 0.799 | 0.129 | −0.487 | 1 | ||||||||
| decorative vignettes | −0.170 | 0.212 | 0.439 | −0.717 | 1 | |||||||
| seat arrangement | −0.452 | −0.203 | 0.750 | −0.259 | 0.334 | 1 | ||||||
| spatial privacy | −0.057 | −0.652 * | 0.252 | −0.449 | 0.298 | 0.303 | 1 | |||||
| view analysis | 0.01 | −0.513 | 0.611 | 0.095 | −0.422 | 0.465 | 0.380 | 1 | ||||
| attractiveness /significance | −0.270 | 0.489 | 0.273 | 0.174 | 0.575 | 0.481 | 0.491 | 0.115 | 1 | |||
| aesthetic pleasure | 0.820 * | 0.705 | 0.376 | −0.046 | 0.514 * | −0.046 | 0.631 | 0.749 | 0.110 | 1 | ||
| cultural/regional | −0.771 * | 0.143 | 0.261 | 0.170 | 0.646 | 0.833 | −0.075 | 0.487 | 0.491 | 0.476 | 1 | |
| activity participation | 0.391 | −0.270 | 0.174 | −0.211 | 0.627 ** | 0.493 | −0.167 | 0.550 | 0.436 | 0.346 | 0.624 | 1 |
| Visual Permeability | Main Colors | Chromatism | Functional Density | Store Density | Seating Arrangement | Spatial Privacy | View Openness | Attractive-Ness/Significance | Aesthetic Pleasure | Cultural/ Regional | Activity Participation | |
|---|---|---|---|---|---|---|---|---|---|---|---|---|
| visual permeability | 1 | |||||||||||
| main colors | −0.823 | 1 | ||||||||||
| chromatism | −0.570 | 0.891 | 1 | |||||||||
| functional density | 0.649 | −0.468 | 0.702 | 1 | ||||||||
| store density | 0.598 | −0.534 | 0.366 | 0.468 | 1 | |||||||
| seat layout | −0.487 * | −0.840 | −0.032 | 0.329 | −0.187 | 1 | ||||||
| spatial privacy | 0.486 | −0.467 | 0.258 | 0.398 | 0.727 | 0.524 | 1 | |||||
| view openness | 0.563 | −0.713 | 0.243 | 0.524 | −0.412 | 0.398 | 0.389 | 1 | ||||
| attractiveness/significance | −0.619 * | −0.536 | −0.489 | 0.734 ** | 0.059 | 0.768 | 0.148 | 0.102 | 1 | |||
| aesthetic pleasure | 0.318 | 0.417 | 0.390 | 0.519 | −0.479 | −0.870 | 0.546 | 0.743 | 0.287 | 1 | ||
| cultural/regional | −0.857 | −0.757 * | 0.462 | 0.531 | 0.787 | 0.799 | 0.891 | 0.488 | 0.431 | 0.764 | 1 | |
| activity participation | 0.722 | −0.269 | 0.719 | 0.270 | 0.874 | 0.416 | 0.821 | 0.457 | 0.405 | 0.915 | 0.612 | 1 |
| Evaluation Indicators | Significant Spatial Elements |
|---|---|
| seat arrangement (3) | visual permeability |
| spatial privacy (13) | seat density |
| field-of-view width (17) | store density |
| attractiveness/significance (18) | visual permeability, functional density |
| aesthetic pleasure (19) | interface transparency, decorative vignettes |
| Model | Square Sum | df | Mean Square | F | p-Value | |
|---|---|---|---|---|---|---|
| 1 | regression | 21.984 | 4 | 5.496 | 8.100 | 0.000 b |
| residuals | 98.389 | 145 | 0.679 | |||
| aggregate | 120.373 | 149 | ||||
| Model | Unstandardized Coefficient | Standardized Coefficient | t | p-Value | ||
|---|---|---|---|---|---|---|
| B | Standard Error | Beta | ||||
| 1 | (constant) | 5.161 | 0.587 | 8.794 | 0.000 | |
| seat density | −0.009 | 0.007 | −0.117 | −1.250 | 0.213 | |
| d1/d2 | 0.163 | 0.052 | 0.311 | 3.153 | 0.002 | |
| location | −0.356 | 0.130 | −0.324 | −2.740 | 0.007 | |
| seat arrangement | −0.108 | 0.126 | −0.099 | −0.859 | 0.392 | |
| Evaluation Index Items to Be Optimized | Optimization Strategies | Optimization Goals |
|---|---|---|
| number of seats (1), storage facilities (4), shared service facilities (5) | multiple purposes of facilities | increase diversity of use patterns |
| seat arrangement (3), spatial privacy (13) | intensification of boundaries | restrict areas for sitting and resting places |
| attractiveness/significance (18) | complexity of functions | accommodate space–time sharing |
| field-of-view width (17), aesthetic pleasure (19) | integration of resources | enhance vitality induction |
Disclaimer/Publisher’s Note: The statements, opinions and data contained in all publications are solely those of the individual author(s) and contributor(s) and not of MDPI and/or the editor(s). MDPI and/or the editor(s) disclaim responsibility for any injury to people or property resulting from any ideas, methods, instructions or products referred to in the content. |
© 2024 by the authors. Licensee MDPI, Basel, Switzerland. This article is an open access article distributed under the terms and conditions of the Creative Commons Attribution (CC BY) license (https://creativecommons.org/licenses/by/4.0/).
Share and Cite
Zhang, Z.; Fei, T.; Wang, K. Analyzing the Impact of Interior Public Space on User Satisfaction in Shopping Malls Using Virtual Reality Simulation Experiments. Buildings 2024, 14, 3264. https://doi.org/10.3390/buildings14103264
Zhang Z, Fei T, Wang K. Analyzing the Impact of Interior Public Space on User Satisfaction in Shopping Malls Using Virtual Reality Simulation Experiments. Buildings. 2024; 14(10):3264. https://doi.org/10.3390/buildings14103264
Chicago/Turabian StyleZhang, Zhengwei, Teng Fei, and Kun Wang. 2024. "Analyzing the Impact of Interior Public Space on User Satisfaction in Shopping Malls Using Virtual Reality Simulation Experiments" Buildings 14, no. 10: 3264. https://doi.org/10.3390/buildings14103264
APA StyleZhang, Z., Fei, T., & Wang, K. (2024). Analyzing the Impact of Interior Public Space on User Satisfaction in Shopping Malls Using Virtual Reality Simulation Experiments. Buildings, 14(10), 3264. https://doi.org/10.3390/buildings14103264