Article

Chinese Household Carbon Footprint: Structural Differences, Influencing Factors, and Emission Reduction Strategies Analysis

1
College of Architecture and Urban Planning, Tongji University, Shanghai 200092, China
2
Key Laboratory of Ecology and Energy Saving Study of Dense Habitat (Tongji University), Ministry of Education, Shanghai 200092, China
3
Tongji Architectural Design (Group) Co., Ltd., Shanghai 200092, China
*
Author to whom correspondence should be addressed.
Buildings 2024, 14(11), 3451; https://doi.org/10.3390/buildings14113451
Submission received: 30 September 2024 / Revised: 19 October 2024 / Accepted: 24 October 2024 / Published: 30 October 2024

Abstract

:
The wide variation in household characteristics, such as household size, income, and age, can lead to significant differences in carbon footprints. Based on data from 1132 Chinese households in 2021, this study examines the structural differences, multiple influencing factors, and mitigation strategies of household carbon footprints (HCFs) in China. The results indicate that indirect emissions, primarily from energy and food consumption, account for the largest share of household carbon footprints, making up over 65% of total emissions. Households with lower carbon footprints are characterized by a per capita living area of less than 20 square meters, rural residences, and shared living arrangements. Carbon footprints for the elderly and minors are lower than adults, while households with higher monthly incomes have the highest carbon footprints. The Multivariate Analysis of Variance (MANOVA) reveals that the main factors influencing HCF include household size, income, and single status, with a more pronounced impact on affluent households than on average households. High-income households have the potential to reduce their carbon footprints through investments in energy-efficient technologies, whereas low-income households are more susceptible to the effects of household size and geographic location. It is recommended that policymakers adopt differentiated measures, such as setting higher reduction targets for larger and wealthier households while providing incentives and technical support to low-income households to achieve meaningful carbon reductions. More effective and equitable low-carbon policies can be formulated by addressing these structural disparities and leveraging the unique characteristics of different household types.

1. Introduction

The global climate is undergoing unprecedented changes, necessitating urgent measures to mitigate climate change [1]. The IPCC has indicated that greenhouse gases produced by human activities are the primary drivers of the observed climate changes [2], underscoring the urgency of reducing CO2 emissions. The 2023 Emissions Gap Report highlights that, to achieve the Paris Agreement goal of limiting global warming to 1.5 °C, greenhouse gas emissions must peak by 2025 at the latest and decrease by 43% by 2030 [3]. By 2030, the global CO2 emissions gap will be around 1.2–1.7 Gt CO2. Despite this stringent carbon budget, current mitigation policies and national contributions under the Paris Agreement have not aligned emissions with the 1.5 °C target pathway [4]. Global carbon emissions rose again in 2023 [5] and, given the current carbon reduction capabilities, achieving the Paris Agreement’s targets appears challenging. It necessitates urgent, large-scale international efforts to mitigate the worsening climate crisis [6,7]. Faced with such strict reduction targets, the household carbon footprint (hereinafter referred to as HCF) significantly contributes to greenhouse gas emissions, accounting for 72% of global emissions through household energy consumption [8]. Rising energy consumption in developing countries like China will likely increase household carbon emissions [9].
As the world’s largest energy consumer and greenhouse gas emitter since 2009, China’s carbon reduction efforts will significantly impact global mitigation efforts. China has pledged to peak carbon emissions by 2030 and achieve carbon neutrality by 2060 in its Nationally Determined Contributions (NDCs) [10]. Thus, China’s ability to reach its emission peak is crucial for the success of the Paris Agreement and sustainable development goals [11]. Over the past two decades, driven by economic growth and urbanization, households have become the second-largest consumer sector contributing to China’s carbon footprint, with significant variability in HCFs [12]. Given the stringent targets, households must be more proactive in reducing carbon footprints [13,14] and take hundreds of specific actions to promote a ‘green’ household lifestyle [15]. In this context, calculating the HCF is essential for devising effective, accurate, and reasonable carbon reduction policies for the household sector, a prerequisite for implementing climate change mitigation strategies.
Household carbon footprint, as a method for measuring the greenhouse gas emissions generated by households in daily life, encompasses both direct fossil fuel consumption by households and the carbon emissions indirectly caused by the use of products and services, typically calculated in terms of carbon dioxide equivalent (CO2e) [6]. Various methods, such as the Emission Coefficient Method (ECM), Life Cycle Assessment (LCA), Input–Output Analysis (IOA), and IPCC, have been developed by scholars to calculate household carbon footprints [6,16] (Table 1).
Research indicates that indirect carbon footprints often exceed direct HCFs [8,17], and urban HCFs are generally higher than rural HCFs [18]. Overall, HCFs are influenced by a variety of factors, including socio-economic characteristics (e.g., household income), household characteristics (e.g., age of household members, household size, and education level), and geographical factors (e.g., location of the household) [16]. Economic levels and policy requirements across different regions can further influence HCFs [19], and household behaviors, such as adopting sustainable lifestyles and consumption habits, can significantly reduce carbon emissions [20]. For example, using energy-efficient appliances [21], reducing single-use plastics [22], choosing local and seasonal foods [23], minimizing food waste [24], and reducing car ownership are sustainable practices that can substantially control HCFs. However, existing studies often focus on single factors influencing HCFs, focusing less on the combined effects of multiple factors. Therefore, it is necessary to explore the relationship between single and multiple factors and low-carbon household characteristics to identify key attributes of low-carbon households and their emission reduction potential.
Table 1. Standard Methods for Calculating Household Carbon Footprint.
MethodDescriptionCharacteristics
Emission Coefficient Method (ECM) [16]Calculates carbon footprint based on the greenhouse gas emissions per unit of activity.Simple, easy to use, suitable for large-scale applications, but has low accuracy.
Life Cycle Assessment (LCA) [25]Assesses carbon footprint by analyzing the environmental impact of a product or service throughout its lifecycle, from production to disposal.Comprehensive, considers all supply chain stages, but data collection is complex and time-consuming.
Input–Output Analysis (IOA) [26]Estimates indirect carbon emissions based on the input–output relationships of economic activities using national or regional economic data.It can assess indirect carbon footprint and is suitable for macroeconomic analysis but requires a lot of economic data.
IPCC Method [14]Calculates carbon footprint based on guidelines and default emission factors published by the Intergovernmental Panel on Climate Change (IPCC).Globally recognized, standardized methodology, reliable data sources, and frequently updated factors, but with low accuracy.
Integrated Assessment Model (IAM) [27]It uses a combination of climate, economic, and energy models to assess future carbon emissions and the effects of mitigation strategies.Comprehensive economic, environmental, and social considerations are required, but complex models require extensive data.
Geographically Weighted Regression (GWR) [28]Analyzes spatial variations in carbon footprint and its influencing factors using geographic data.It can capture spatial heterogeneity and is suitable for fine-grained regional analysis but requires precise spatial data.
In response to large-scale carbon emissions, China has proposed various carbon reduction strategies, such as improving energy efficiency in manufacturing, implementing carbon emissions trading schemes, and selecting pilot cities for energy-saving policies, achieving a 15.26% reduction in carbon emissions [29]. Nonetheless, policies targeting household carbon reduction remain limited. Against this backdrop, this paper attempts to calculate the structural differences, influencing factors, and mitigation strategies for Chinese households’ HCFs. Based on a survey of 1132 Chinese households, the study quantifies the carbon emissions for 2021 using the IPCC method, evaluates the promotion of carbon reduction through various factor combinations, and identifies influencing factors and reduction potentials for HCFs.
The novelty of this study lies in two aspects: First, it systematically compares the impact of different household characteristics and socio-economic levels on the carbon footprint of Chinese households. This topic has not been sufficiently discussed in the existing literature. Second, this study examines the effect of individual factors on low-carbon household footprints and analyzes the impact of multiple factor combinations, identifying the critical characteristics of low-carbon households and proposing targeted carbon reduction strategies. This research helps to fill the current gap in analyzing household carbon footprint influencing factors and reduction potential, providing a new perspective for future carbon reduction policies. In particular, it emphasizes assigning higher reduction targets to high-carbon households, which is crucial for mitigating climate change and promoting social equity.
The structure of the paper is as follows. After the introduction, Section 2 describes the methods for calculating HCFs, using Multifactor Analysis of Variance and data collection and processing techniques. Section 3 presents the results of the HCFs’ distribution, characteristics, and influencing factors. Section 4 discusses the implications of low-carbon policies for Chinese households. Finally, Section 5 concludes the paper.

2. Materials and Methods

2.1. Data Sources

The Intergovernmental Panel on Climate Change (IPCC) methodology was employed to analyze HCF data and evaluate the environmental impact. The IPCC method, recognized for its convenience and efficiency in calculating carbon footprints (IPCC 2006), is characterized by its ease of data collection, uniform calculation standards, broad applicability, and rapid updates (IPCC 2019). This approach converts the consumption of various products into standard coal equivalents, utilizing IPCC emission factors to derive corresponding carbon emission factors, which are then transformed into carbon footprints through a series of formulas. The IPCC method provides a unified, scientific, and transparent tool for global carbon footprint calculations, aiding in a better understanding of global greenhouse gas emissions and addressing the challenges of global climate change.
The original data for this study are based on the “Exploring HCF Potential” social practice project conducted by the College of Architecture and Urban Planning at the university. The study first received approval from the university, and an Ethical Statement is included at the end of the paper. The project was conducted from July to October 2022, with the authors publishing the HCF survey questionnaire publicly via the online platform Wenjuanxing, inviting respondents to participate. A total of 3839 respondents and 1132 households completed the HCF questionnaire, with 1099 valid responses. It is important to note that the traditional response rate cannot be calculated due to the open invitation nature of data collection. All data collected did not include sensitive information such as the respondents’ names, and only recorded daily household consumption patterns. All respondents provided informed consent before participating to ensure the survey met ethical standards.
Since the data were obtained through questionnaire surveys, a pilot survey was conducted during the questionnaire design phase to ensure its validity, and the questionnaire was revised based on the pilot study results. For example, the question “What is your household’s average monthly electricity consumption in kilowatt-hours (kWh)?” was initially presented as an open-ended question in the first version of the questionnaire. However, the pilot survey revealed the presence of invalid responses, which could affect data quality. Therefore, in the final version of the questionnaire, we provided respondents with four preset options based on statistical data on average household electricity consumption in China. We also recognized that suggestive wording could lead to bias and non-objective responses. Thus, when designing the questions, we sought to elicit factual information and ensured that no suggestive wording was used to avoid leading respondents. Detailed modifications can be found in the Supplementary Materials.
During the pilot study, we also discovered numerous missing values, prompting us to contact respondents by phone proactively before the formal survey. We encouraged respondents to check their household electricity bills before answering the questions to prevent arbitrary or incomplete responses and to ensure the accuracy and truthfulness of their answers. However, some respondents still provided abnormal responses during the telephone interviews, which were subsequently excluded from the statistical analysis. Furthermore, we recognized that respondents might choose environmentally friendly answers based on moral expectations or social approval rather than providing answers based on objective facts. This tendency could introduce bias into the data and potentially distort research outcomes. To alleviate potential concerns from readers, we conducted a data distribution check on questions that might elicit socially desirable responses, as detailed in the Supplementary Materials. The results showed a relatively even data distribution, with no evidence of obvious socially desirable answers.
The survey sample covered various regions in China, different income levels, household structures, and age groups, ensuring diversity and representativeness. Among them, 886 questionnaires were collected from urban areas, accounting for 81%, and 213 from rural areas, accounting for 19%, indicating a significant urban–rural disparity. The top three provinces with the highest number of questionnaires were Hebei (154), Shaanxi (129), and Shanghai (92). In contrast, western regions such as Tibet (2), Qinghai (5), and Gansu (7) had fewer responses, reflecting the uneven regional development in China. The higher number of questionnaires from eastern coastal provinces such as Shanghai, Guangdong, and Jiangsu is closely related to the region’s higher economic development.
The data collected through the questionnaire were divided into three main sections: The first section gathered basic household information and socio-economic status, including population, gender, age, and employment situation. The second section addressed the household’s direct and indirect carbon footprints, where the direct carbon footprint encompassed energy usages such as electricity, natural gas, and coal, and the indirect carbon footprint included consumption behaviors like food, clothing, and medical services. The third section collected information on household consumption preferences, covering daily lifestyle choices such as dietary habits, the percentage of organic food, frequency of dining out, use of disposable products, selection of reading materials, clothing purchases, and updating home appliances. This section also included carbon-neutral behaviors and carbon reduction awareness, such as the frequency of community promotion of low-carbon knowledge. Through the data collected by the questionnaire, this paper attempts to understand the awareness and daily behaviors of Chinese households regarding carbon neutrality and to explore the driving forces behind the transition to carbon neutrality among Chinese households.

2.2. HCF Calculation Formula

The computational formula presented in this article is as follows (Formula (1)):
HCF = Htcf + Hhcf + Hscf + Hfcf + Hecf + Hpcf = i n t i T i + i n h i T i + i n s i T i + i n f i T i + i n e i T i + i n p i T i
where HCF represents the HCF with the components Htcf (household transportation carbon footprint), Hhcf (household housing carbon footprint), Hscf (household service carbon footprint), Hfcf (household food carbon footprint), Hecf (household energy carbon footprint), and Hpcf (household product carbon footprint) constituting the total footprint, and the variables t, h, s, f, e, and p denote the consumption quantities of household transportation activities, housing, services, food, energy, and products, respectively. T represents the carbon emission factor for the respective consumption category, as provided by the coefficients from the Chinese Academy of Environmental Planning [30], indicating the quantity of CO2 emitted per unit of substance or energy consumed. i refers to the activity item, and n to the total number of activity items or components included, with the processes encompassed in the calculation depicted in Figure 1 and Table 2.

2.3. Factors Influencing the Carbon Footprint of Chinese Households

This study utilized the Pearson Correlation Analysis to identify critical factors influencing HCF, categorized into direct and indirect types. Data were processed and analyzed using SPSS Statistics 27 software to evaluate the correlation between various factors and HCF, determining the most significant contributors. Furthermore, given the potential for HCF to be influenced by multiple factors simultaneously, Multivariate Analysis of Variance (MANOVA) was employed to investigate the interactions among different factors. This statistical method is designed to assess the impact of multiple independent variables on one or more dependent variables and their interactions [37]. MANOVA assesses the effect of individual factors on HCF and reveals how these factors interact with each other. Thus, it provides a scientific basis for developing more effective carbon reduction strategies. Previous scholars have used the MANOVA method to analyze the multiple effects of different independent variables on low-carbon behavior [38]. For example, Velasco-Martínez et al. applied MANOVA to study the impact of climate change on environmental education in Spain [39], and Zhao found that the carbon reduction effect of green building policies on energy performance in low-income housing units in the United States is significant [40].
Specifically, the basic formula for Multivariate Analysis of Variance can be represented as follows (Formula (2)):
Y = μ + α1X1 + α2X2 + α1α2X1X2 + ϵ
where Y represents the dependent variable (which refers to HCF in this article), μ is the overall mean, X1 and X2 represent different independent variables (factors of influence), α1 and α2 are the main effects of each independent variable, α1α2 represents the interaction effect between the two factors, and ϵ denotes the error term.

3. Results

This section is divided by subheadings. It should provide a concise and precise description of the experimental results, their interpretation, and the experimental conclusions that can be drawn.

3.1. Quantitative and Structural Characteristics of Household Carbon Emissions

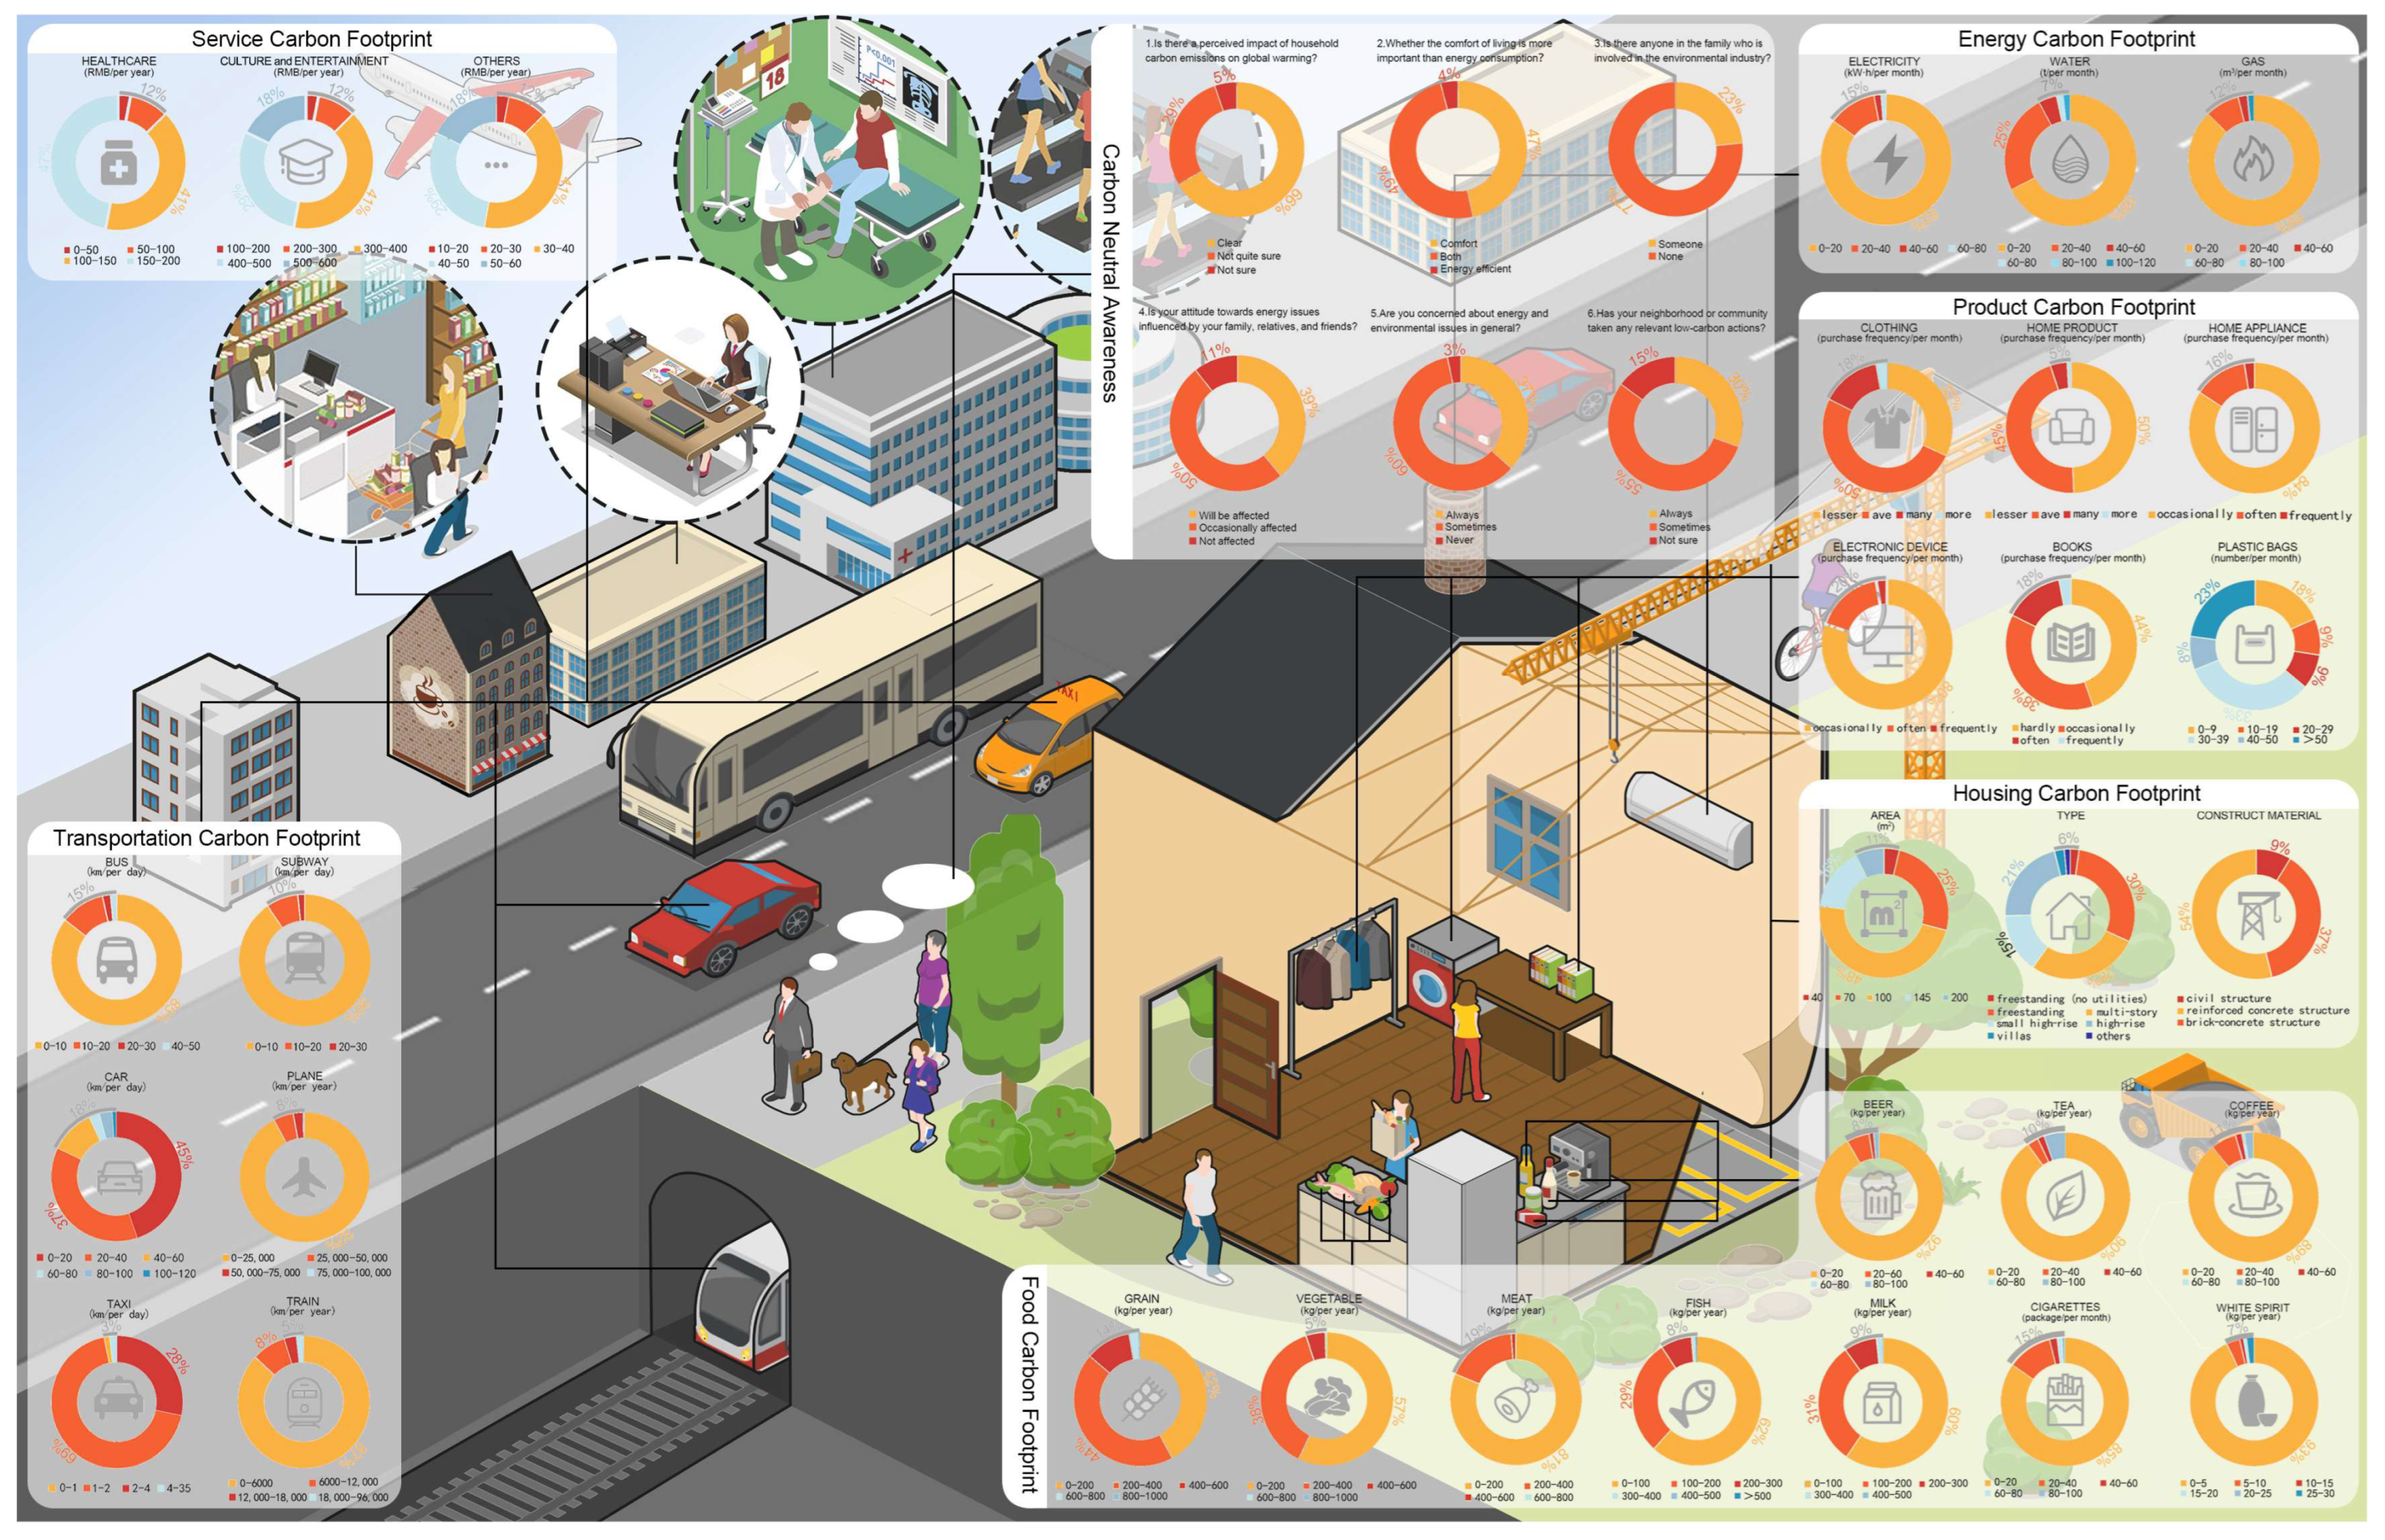
In Figure 2, the survey indicates that, within the transportation carbon footprint, most respondents (85%) prefer to use public transport for short distances (within 10 km), while nearly 60% opt for taxis or private cars for distances beyond 10 km and within 4 km. Regarding housing carbon footprints, most households (nearly 70%) reside in compact residences, predominantly in multi-story and high-rise buildings, with brick and concrete structures (54%) being the most common. It reflects the compactness and concentration of current Chinese household living arrangements, with most families choosing sturdy brick and concrete constructions. Regarding service carbon footprints, expenditures on culture and entertainment surpass those on health and services. Grain consumption accounts for one-third of the total food consumption, followed by vegetables (26.39%), with meat (16.75%) and fish (11.68%) consumption being similar. Average tea consumption exceeds that of coffee by 22%, and the average consumption of baijiu (a type of Chinese liquor) is 10% higher than that of beer.
Regarding energy carbon footprints, most households (85%) are conservative in using electricity and gas, with 68% consuming less than 20 tons of water. Regarding product carbon footprints, the overwhelming majority of households (over 80%) maintain moderation in their purchases of clothing, household items, electronics, and books, although nearly 60% frequently use disposable products. Compared to developed countries such as the United States and Japan, the energy consumption of Chinese households is lower [41,42].
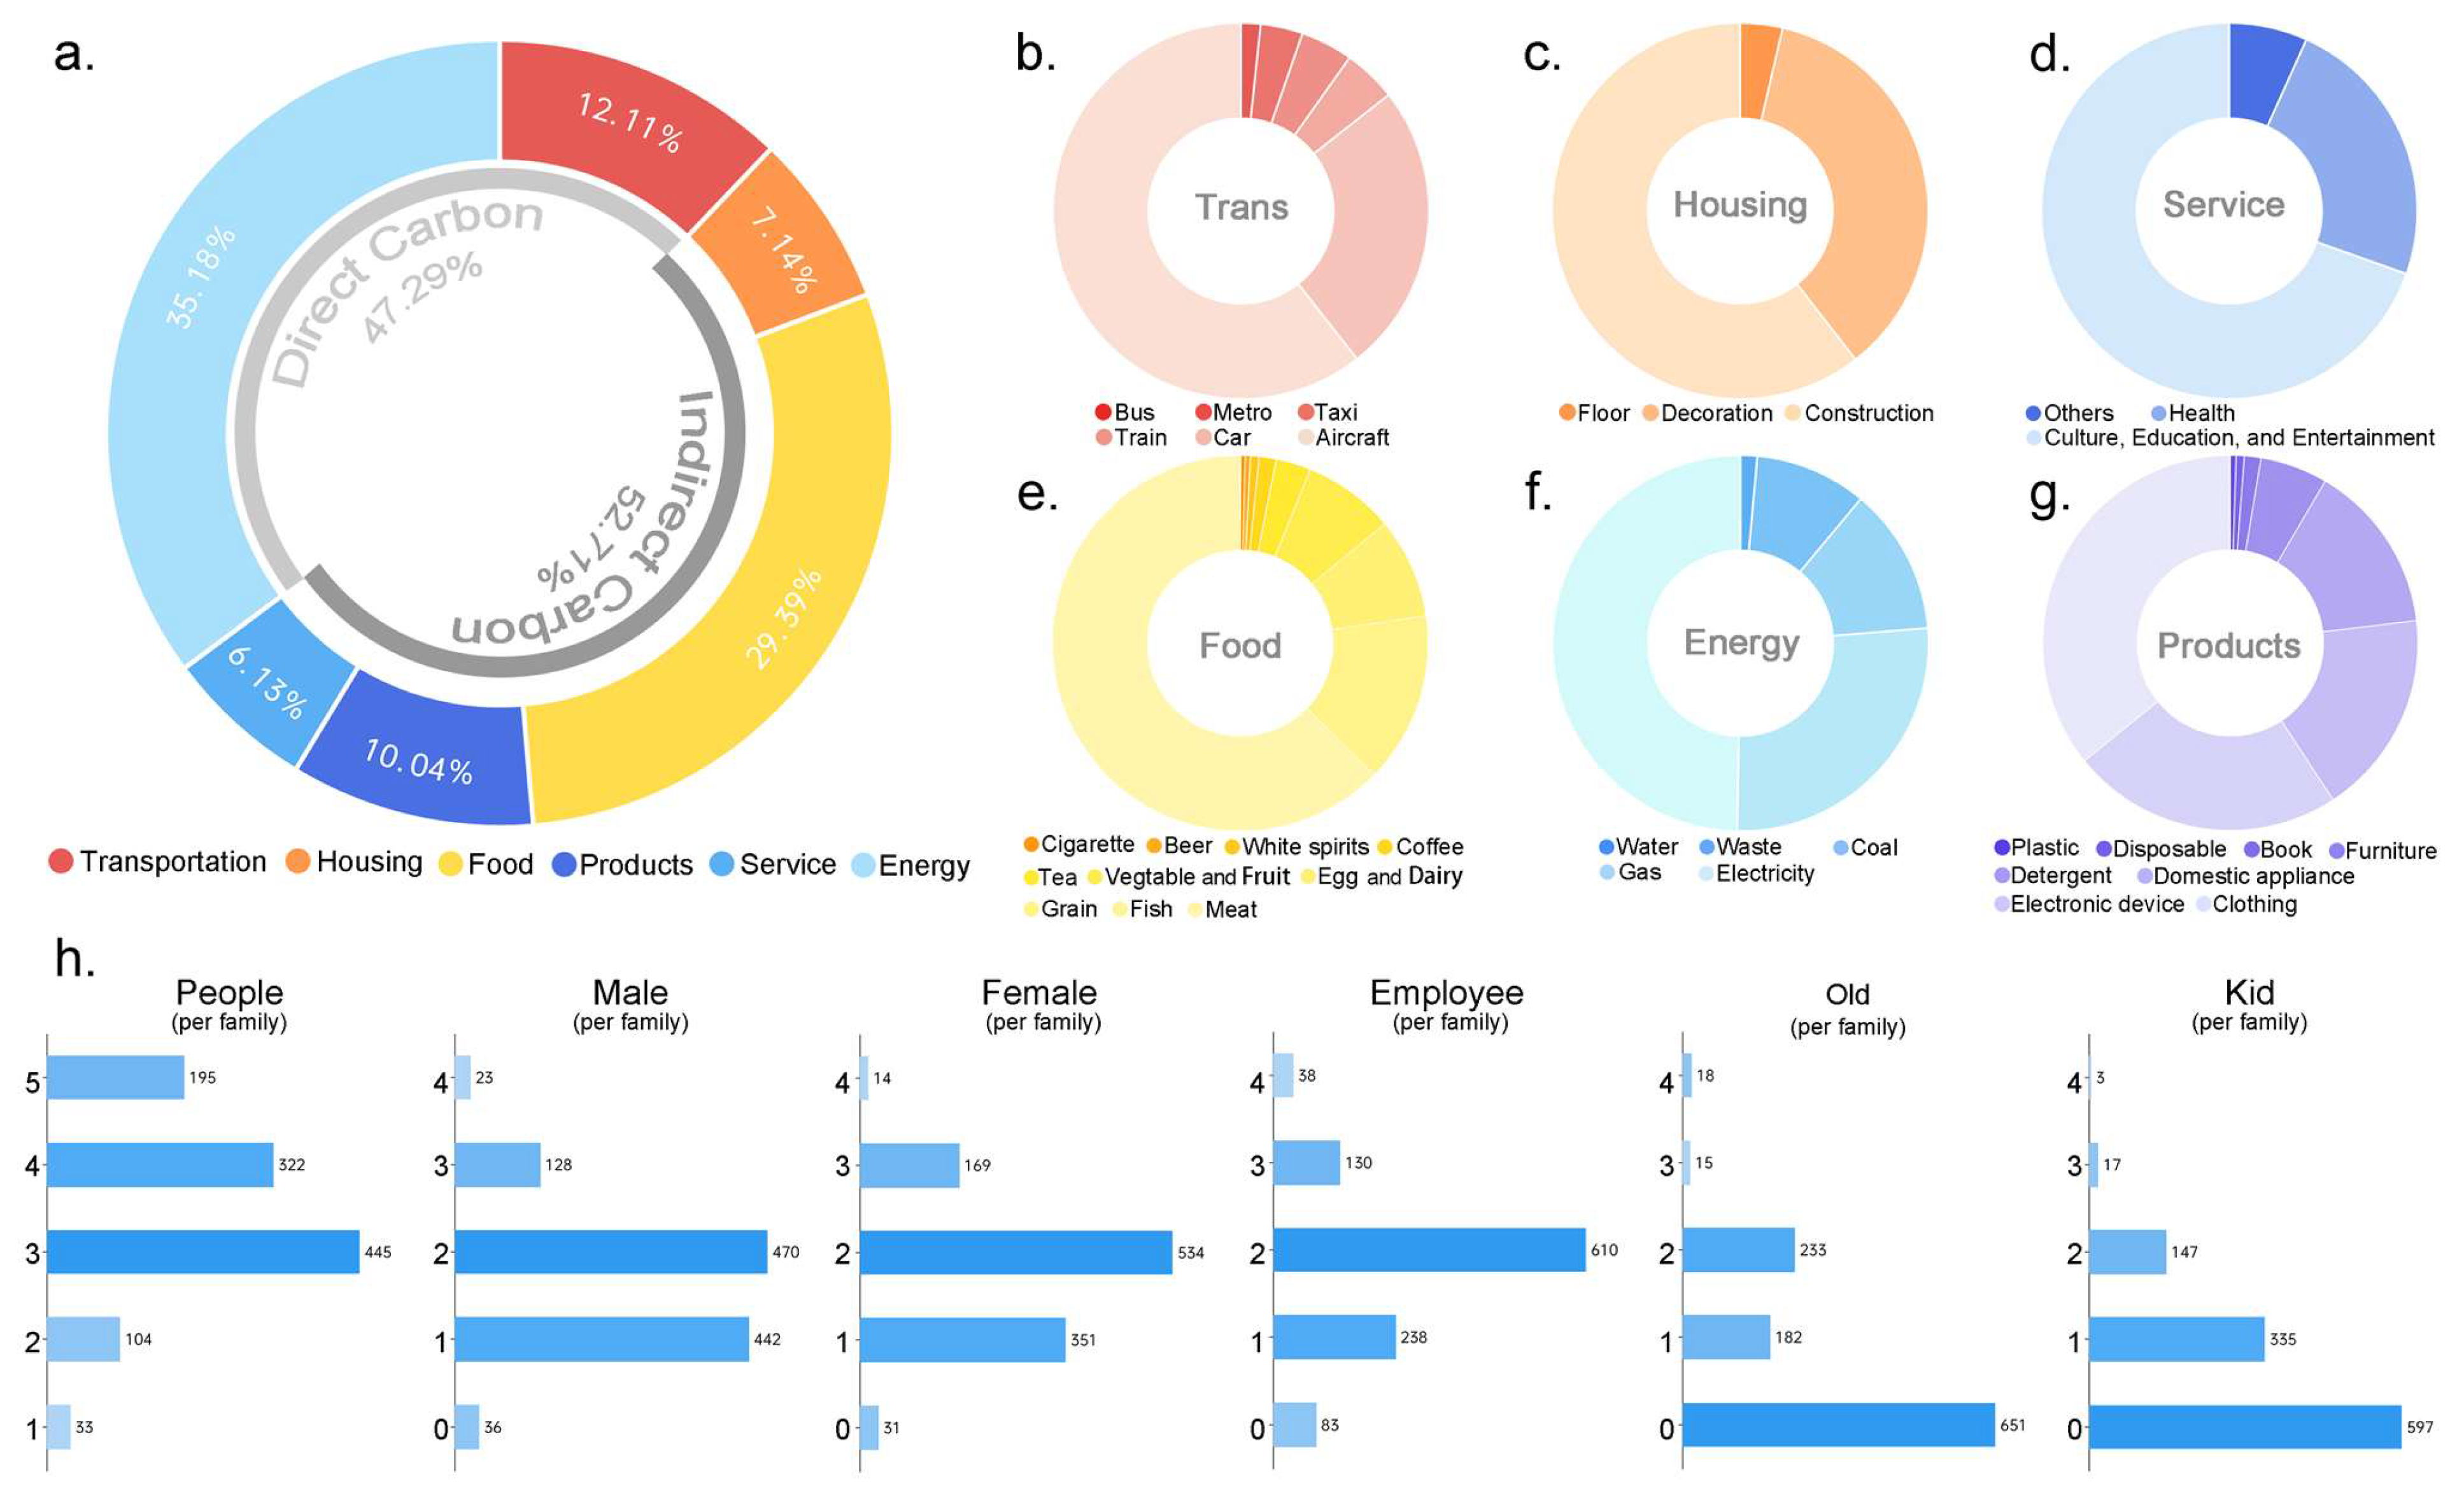
Figure 2 and Figure 3 present the fundamental results of this survey. Overall, in 2021, the per capita HCF in China was 2.82 tons per person per year, with an average HCF of 9.15 tons per household per year. This is slightly lower than the findings by Wang et al. [12], possibly due to the restrictions on household consumption during the COVID-19 outbreak in 2021. These values are generally lower than those reported for the US [41], the European Union [43], and the UK [44], yet approximate to the figures reported for Malaysia [45] and Pakistan [46]. Among the various categories, indirect carbon footprints account for a slightly more significant proportion (53%), with energy footprints being the largest at 35% of the total carbon footprint; food emissions account for 30%, and transportation emissions account for 12%. These results are consistent with the findings of Baiocchi et al. [44,47], suggesting that increasing the use of clean energy is the primary strategy for HCFs to reduce carbon emissions in the future [48]. Significant differences exist in carbon footprint amounts across different categories: air travel, construction, cultural, educational, and entertainment activities are the primary sources of carbon emissions in the transportation, residential, and service sectors, respectively.
Food consumption, meat consumption, electricity use, and clothing purchases are significant sources of carbon footprints, reflecting the impact of household economics, energy structure, and consumption habits on carbon footprints. Regarding household composition, families of three account for nearly 40% of the household structure, with an average household size of 3.5 people, including an average of 0.67 children, 0.74 elderly, and 1.85 working adults. Forty-six per cent of households have children, the average annual household income is 186,500 CNY, 70% of people reside within 20 kilometers of urban areas, and 57% live in spaces smaller than 100 m2.
Regarding carbon reduction awareness, 52% of households are familiar with the concept of carbon neutrality, 66% are aware of the impact of HCF on global warming, 37% regularly pay attention to energy and environmental issues, and 64% recognize the importance of individual action in carbon reduction. When purchasing electrical appliances, 63% of consumers consider energy-saving labels. However, 96% prioritize living comfort over energy savings, with only a minority willing to adopt a low-energy lifestyle. While 49% express willingness to participate in energy-saving and emission-reduction activities, only 30% of communities frequently promote low-carbon activities. It indicates that, despite a high awareness of carbon neutrality among Chinese households, there is a lack of willingness to act. Households mainly adopt simple low-carbon behaviors such as walking instead of driving and unplugging appliances, but pay less attention to more complex low-carbon actions like using handkerchiefs instead of paper towels, preventing energy waste, and recycling waste paper. It shows a preference for quick and direct carbon reduction methods, overlooking actions with more significant potential for emission reduction. Lifestyle, as one of the factors influencing HCF [49,50], necessitates enhancing environmental consciousness to encourage households to transition to low-carbon consumption patterns, thereby reducing HCF.

3.2. Differential Characteristics of Household Carbon Emissions

3.2.1. Household Characteristics

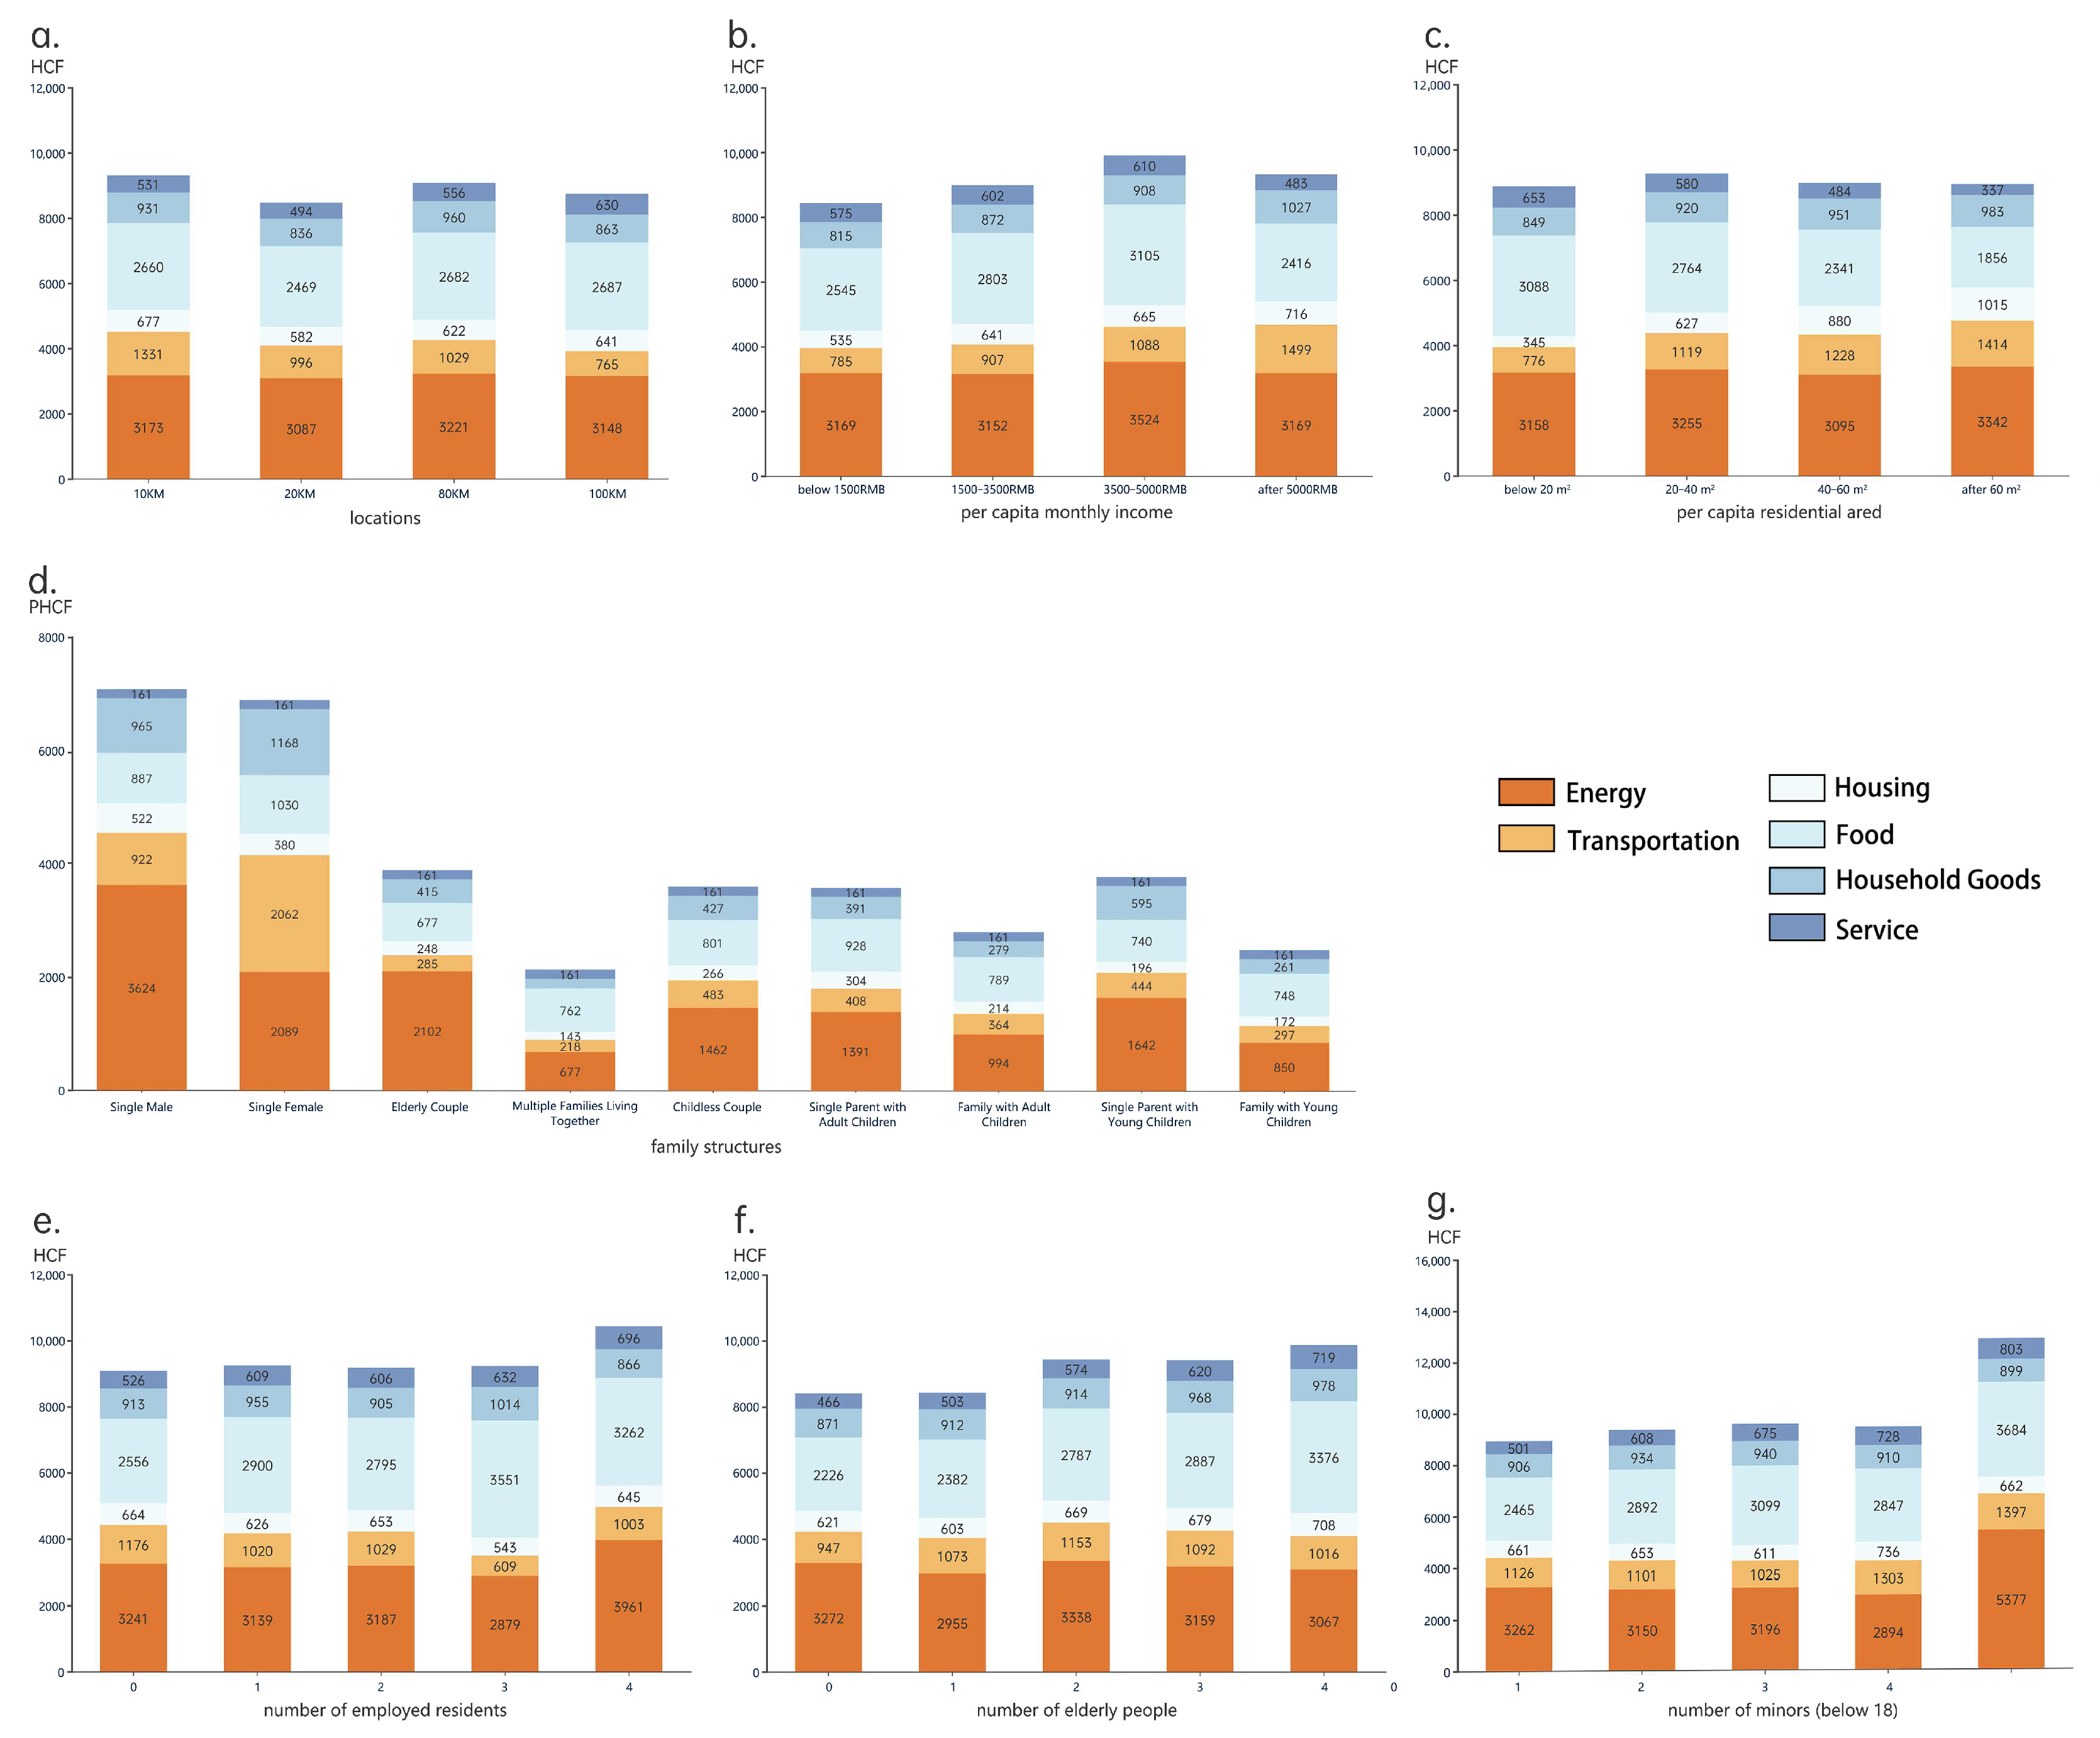
Location significantly influences HCF [51] (Figure 4a). We define distances of 10 km, 20 km, 80 km, and 100 km from the city center as the urban core, suburban areas, urban outskirts, and rural areas, respectively. Geographically, households closer to the city center have a higher total carbon footprint. Urban HCFs are generally higher than rural HCFs. Regarding direct carbon footprint, the further away the city center is from the transportation carbon footprint, the more it increases and decreases. Households within 10 km of the urban core have a transportation carbon footprint as high as 1331 kg CO2e, nearly twice that of rural areas 100 km away. It is likely because urban core residents rely more on private transportation, while suburban residents often use public transportation for daily commuting and activities. The transportation carbon footprint in urban core areas is nearly double that of rural areas, primarily due to daily commuting needs. Energy usage in rural areas is about 20% lower, possibly due to insufficient infrastructure, leading to the continued use of traditional burning methods and less use of high carbon footprint energy sources like gas and natural gas. This is consistent with Feng et al.‘s findings [17]. For indirect carbon footprints, urban households have higher emissions from housing, food, and household goods than rural households, reflecting the “gray” carbon emissions from the construction of houses. The carbon footprint of consumables such as food and household goods is also generally higher in urban areas than rural areas. It might be related to different living habits and consumption preferences, with urban areas having more developed transportation and higher food sourcing and consumption than less developed rural areas. With lower energy consumption, rural areas represent a potential direction for future low-carbon households.
Economically, both direct and indirect HCF increase significantly with higher per capita monthly income (Figure 4b). Households with a per capita monthly income of 3500–5000 RMB have a total carbon footprint nearly 1500 kg higher than those with a per capita monthly income below 1500 RMB, reflecting social inequalities in HCF consistent with the findings of Duarte et al. [52]. Regarding direct carbon footprints, households with higher per capita monthly incomes have an energy carbon footprint that is 300 kg higher than those with the lowest incomes. Survey data indicate that higher-income households frequently update electronic devices and possess more energy-consuming appliances. Transportation disparities are significant, particularly in air travel and private cars, while differences in public transportation (subways, buses, etc.) are minimal. Higher-income households prefer more comfortable and faster transportation modes like airplanes and private cars, whereas lower-income households have limited options, leading to transportation carbon footprint inequalities. For indirect carbon footprints, high-income households (more than 5000 RMB) have nearly 30% higher housing-related carbon footprints than the lowest-income households (below 1500 RMB). It reflects the larger housing areas and higher renovation-related carbon footprints of higher-income households, with other indirect carbon footprint differences being minimal. The disparity in direct carbon footprints highlights the differences in mobility among social groups; lower-income groups often have lower mobility and energy consumption. It is consistent with the research of Wiedenhofer et al. [19,53], showing that such trends are also evident in household expenditure and consumption patterns [17,54], where higher-income households spend more on less carbon-intensive goods and services. In summary, the higher the annual household income, the larger its carbon footprint.
As the per capita housing area increases, the total HCF initially decreases and then increases (Figure 4c). Households with medium-sized housing (20–40 square meters) have the highest total carbon footprint, reaching 9264 kg CO2e. In contrast, large households with over 60 square meters have a slightly lower footprint at 8946 kg CO2e, which is also slightly lower than small households with less than 20 square meters, at 8869 kg CO2e. As the housing area increases, the household’s transportation and energy carbon footprints gradually rise. Households with a less than 20 m2 per capita housing area have relatively low direct carbon footprints. This difference is closely related to household income, transportation habits, and energy usage patterns. Indirect carbon footprints show a decreasing trend in food and household goods carbon footprints for households with a more than 60 m2 per capita housing area, which may be related to larger households’ lifestyle and consumption preferences. These households tend to purchase larger packages of food and supplies, which can somewhat reduce the carbon footprint. However, as housing area increases, the carbon footprint from housing and renovations rises. Medium-sized households have the highest total carbon footprint, likely due to factors such as energy and transportation. Although larger households have higher carbon footprints in energy and transportation, they save on consumables and services, slightly reducing their overall carbon footprint. Overall, households with less than 20 m2 have the smallest indirect and total carbon footprints, with the lowest transportation consumption and adequate comfort, indicating that “small and beautiful” could become the trend for future low-carbon housing.
Household demographic structure significantly impacts the per capita carbon footprint (PHCF) (Figure 4d). Smaller households tend to have a markedly higher per capita CO2 footprint [55], while shared living arrangements within households can substantially reduce greenhouse gas (GHG) emissions. Based on survey data (see Supplementary Material), households were categorized as Single Male, Single Female, Elderly Couple, Multiple Families Living Together, Childless Couple, Single Parent with Adult Children, Family with Adult Children, Single Parent with Young Children, and Family with Young Children. The HCF per capita for individuals living alone is significantly higher than that of multi-person households (excluding families with adult children), reaching up to 3.3 times the lowest per capita carbon footprint. Single-parent households have higher per capita carbon footprints than two-parent households, with direct carbon emissions for minor children in single-parent households exceeding those in two-parent households. This pattern is also evident in multi-person households. As household size increases, the per capita direct carbon footprint from energy and transportation decreases by nearly 15 times compared to single-person households. It can be attributed to two main reasons: the unit price economy of bulk household products, typically cheaper per unit than smaller packages and with reduced packaging waste, and the potential for shared energy or private car use among more household members. As household size increases, the average number of cars per household rises, but not proportionally to the number of household members. Single-person households average 0.36 cars, two-person households 0.4 cars, three-person households 0.9 cars, and households with four or more members 1.1 cars. While larger households own more cars, the per capita transportation carbon footprint may not increase proportionally. This is because minors have lower travel needs, and resource sharing within the household mitigates the linear rise in transportation carbon emissions.
Moreover, larger households typically have higher incomes, leading to higher carbon footprints in housing and consumption. However, the per capita increase in carbon footprint might be less than the growth in household size. Overall, as household size increases, the total HCF slightly increases, with single males having a slightly higher per capita HCF than single females, reflecting a higher proportion of direct carbon footprint. Regarding indirect carbon footprint, the difference in food structure between households with two or more members and elderly couples can reach nearly 7%. Although multi-person households consume more food and services, the “economies of scale” result in a lower per capita carbon footprint for household products [56], highlighting household structure’s impact and potential savings on carbon footprint.
The gender and age of household members can also impact the HCF [57,58] (Figure 4e–g). Women’s direct and indirect carbon footprints are slightly lower than men’s. Specifically, in terms of direct carbon footprints, men consume more energy than women, while women have higher footprints in transportation, food, and household products. This aligns with the findings of Osorio et al. [59], suggesting that women may spend more time at home, whereas men spend more time working outside. Elderly individuals have significantly lower direct and indirect carbon footprints than adults, consistent with the research by Kim et al. [60,61]. Minors also consume less than adults, likely due to the smaller activity range and preference for smaller homes among the elderly, reducing per capita direct and indirect carbon footprints. Fewer elderly and working members can help lower the average carbon footprint, possibly because more income and better household infrastructure lead to higher energy efficiency. An increase in minors slightly raises the per capita HCF but, when the number of minors reaches four, the HCF increases significantly. Multi-person households tend to have the lowest per capita total carbon footprint.

3.2.2. Low-Carbon Awareness

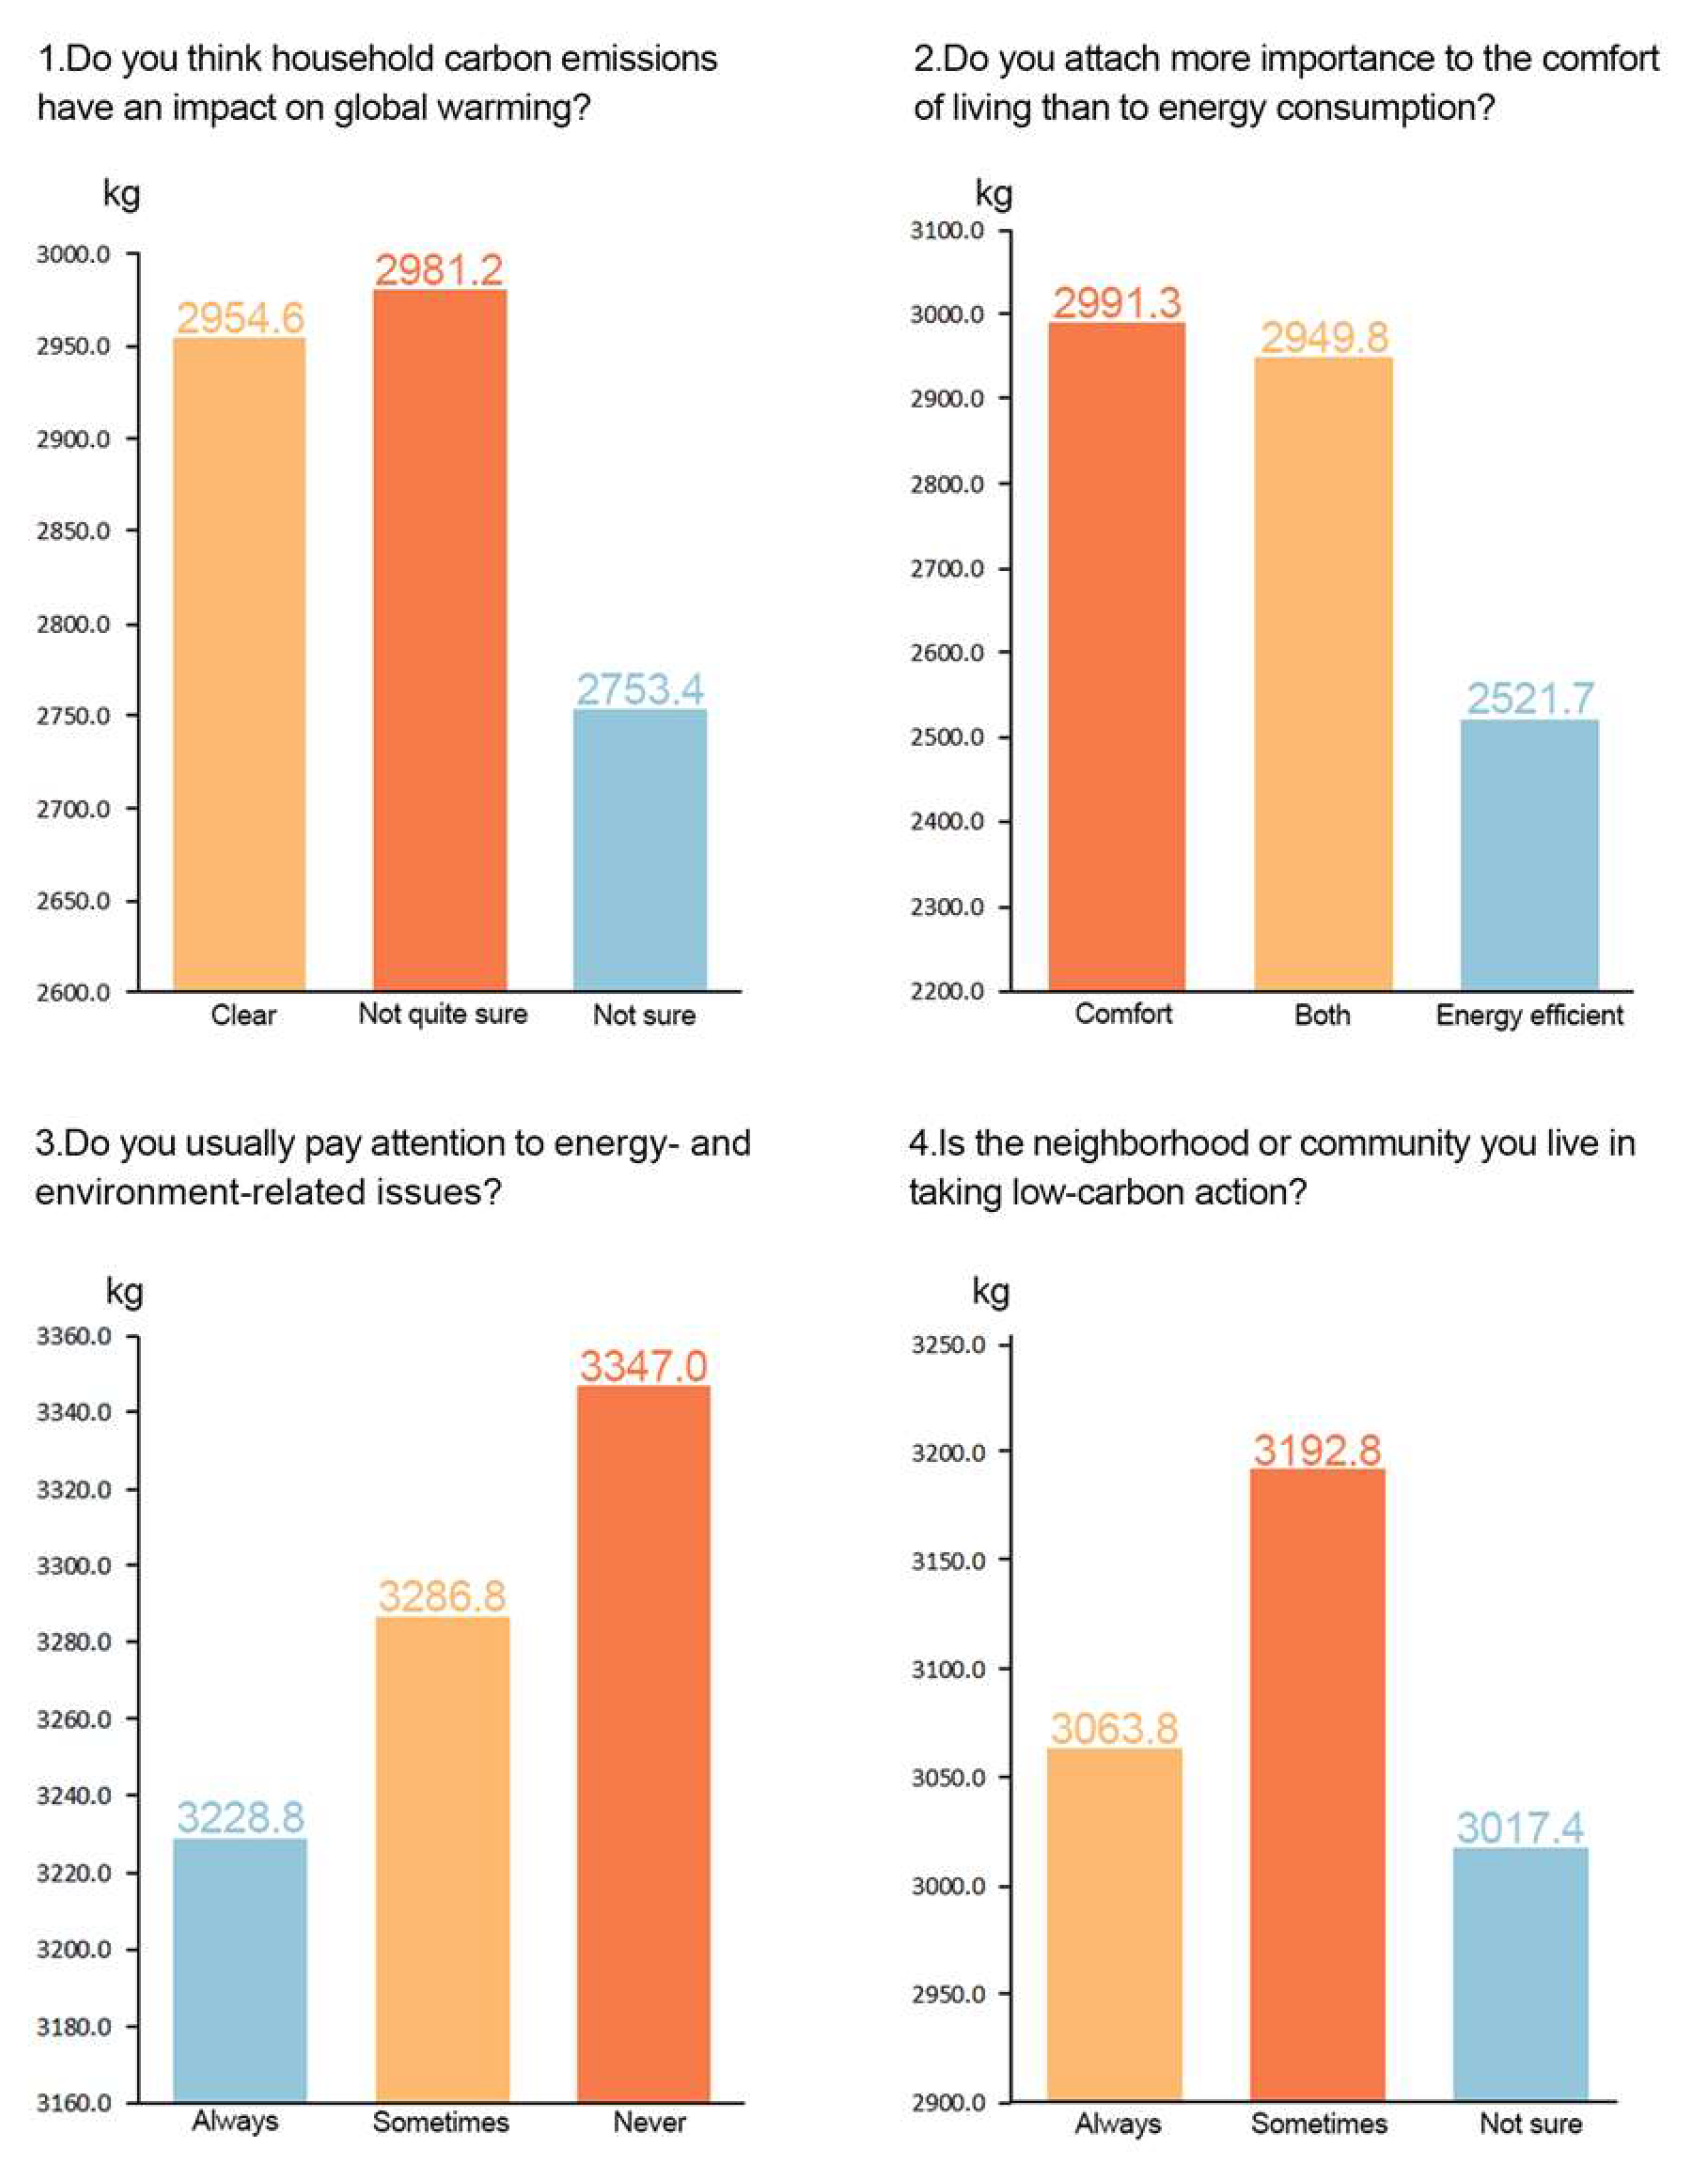
Household awareness of low-carbon practices significantly influences changes in carbon footprints, as depicted in Figure 5. Research indicates that a strong belief in climate change can reduce an individual’s carbon footprint [62]. The environmental awareness of a household directly impacts its carbon emissions [63]. Enhanced understanding of carbon footprints can modestly decrease emissions, with households actively engaging in low-carbon behaviors achieving further reductions. Households aware of the importance of carbon footprints emit 26 kg less CO2 than those less informed; those prioritizing energy saving over comfort reduce their carbon emissions by 18%; households participating in low-carbon activities emit nearly 200 kg less than those which are inactive; and those attentive to energy information save an additional 118 kg of CO2 emissions. Promoting low-carbon practices also enhances carbon reduction efforts, with communities actively disseminating low-carbon information, achieving a 4% higher reduction capability. However, overall, the measures taken by households are insufficient to halve future carbon footprints or to prevent a global temperature rise, necessitating more compulsory strategies for effective carbon reduction.

3.3. Factors Influencing the Carbon Footprint of Households

3.3.1. Main Influencing Factors

To further analyze the main factors affecting HCF, we employed the Pearson analysis to examine the impact of household characteristics (such as the number of family members, age of members, gender, and employment status) and socio-economic levels (including family income, geographic location, and housing size) on the per capita HCF (Table 3 and Figure 6). Figure 6 illustrates the primary factors influencing the carbon footprint volumes of different types of households. The significance levels (two-tailed) indicate whether these relationships are statistically significant, with all factors except for the elderly population and household housing size showing significant correlations (p-value < 0.05 or < 0.01).
The number of family members significantly impacts HCF, with correlation coefficients of 0.473 for direct carbon footprints and 0.464 for indirect carbon footprints, indicating a decline in per capita carbon footprints as family size increases. Gender plays a significant role, with women having a more pronounced effect on HCF than men. Demographic characteristics such as gender, age, and employment status negatively influence carbon footprints. A positive correlation exists between household income and carbon footprints, with higher incomes leading to increased carbon footprints, especially in indirect emissions. Therefore, differences in family size and income levels should be considered when formulating carbon reduction strategies. Encouraging multi-family living arrangements and addressing income disparities can contribute to a win-win situation for economic growth and environmental protection, fostering the development of a fair and sustainable society.

3.3.2. Multiple Influences

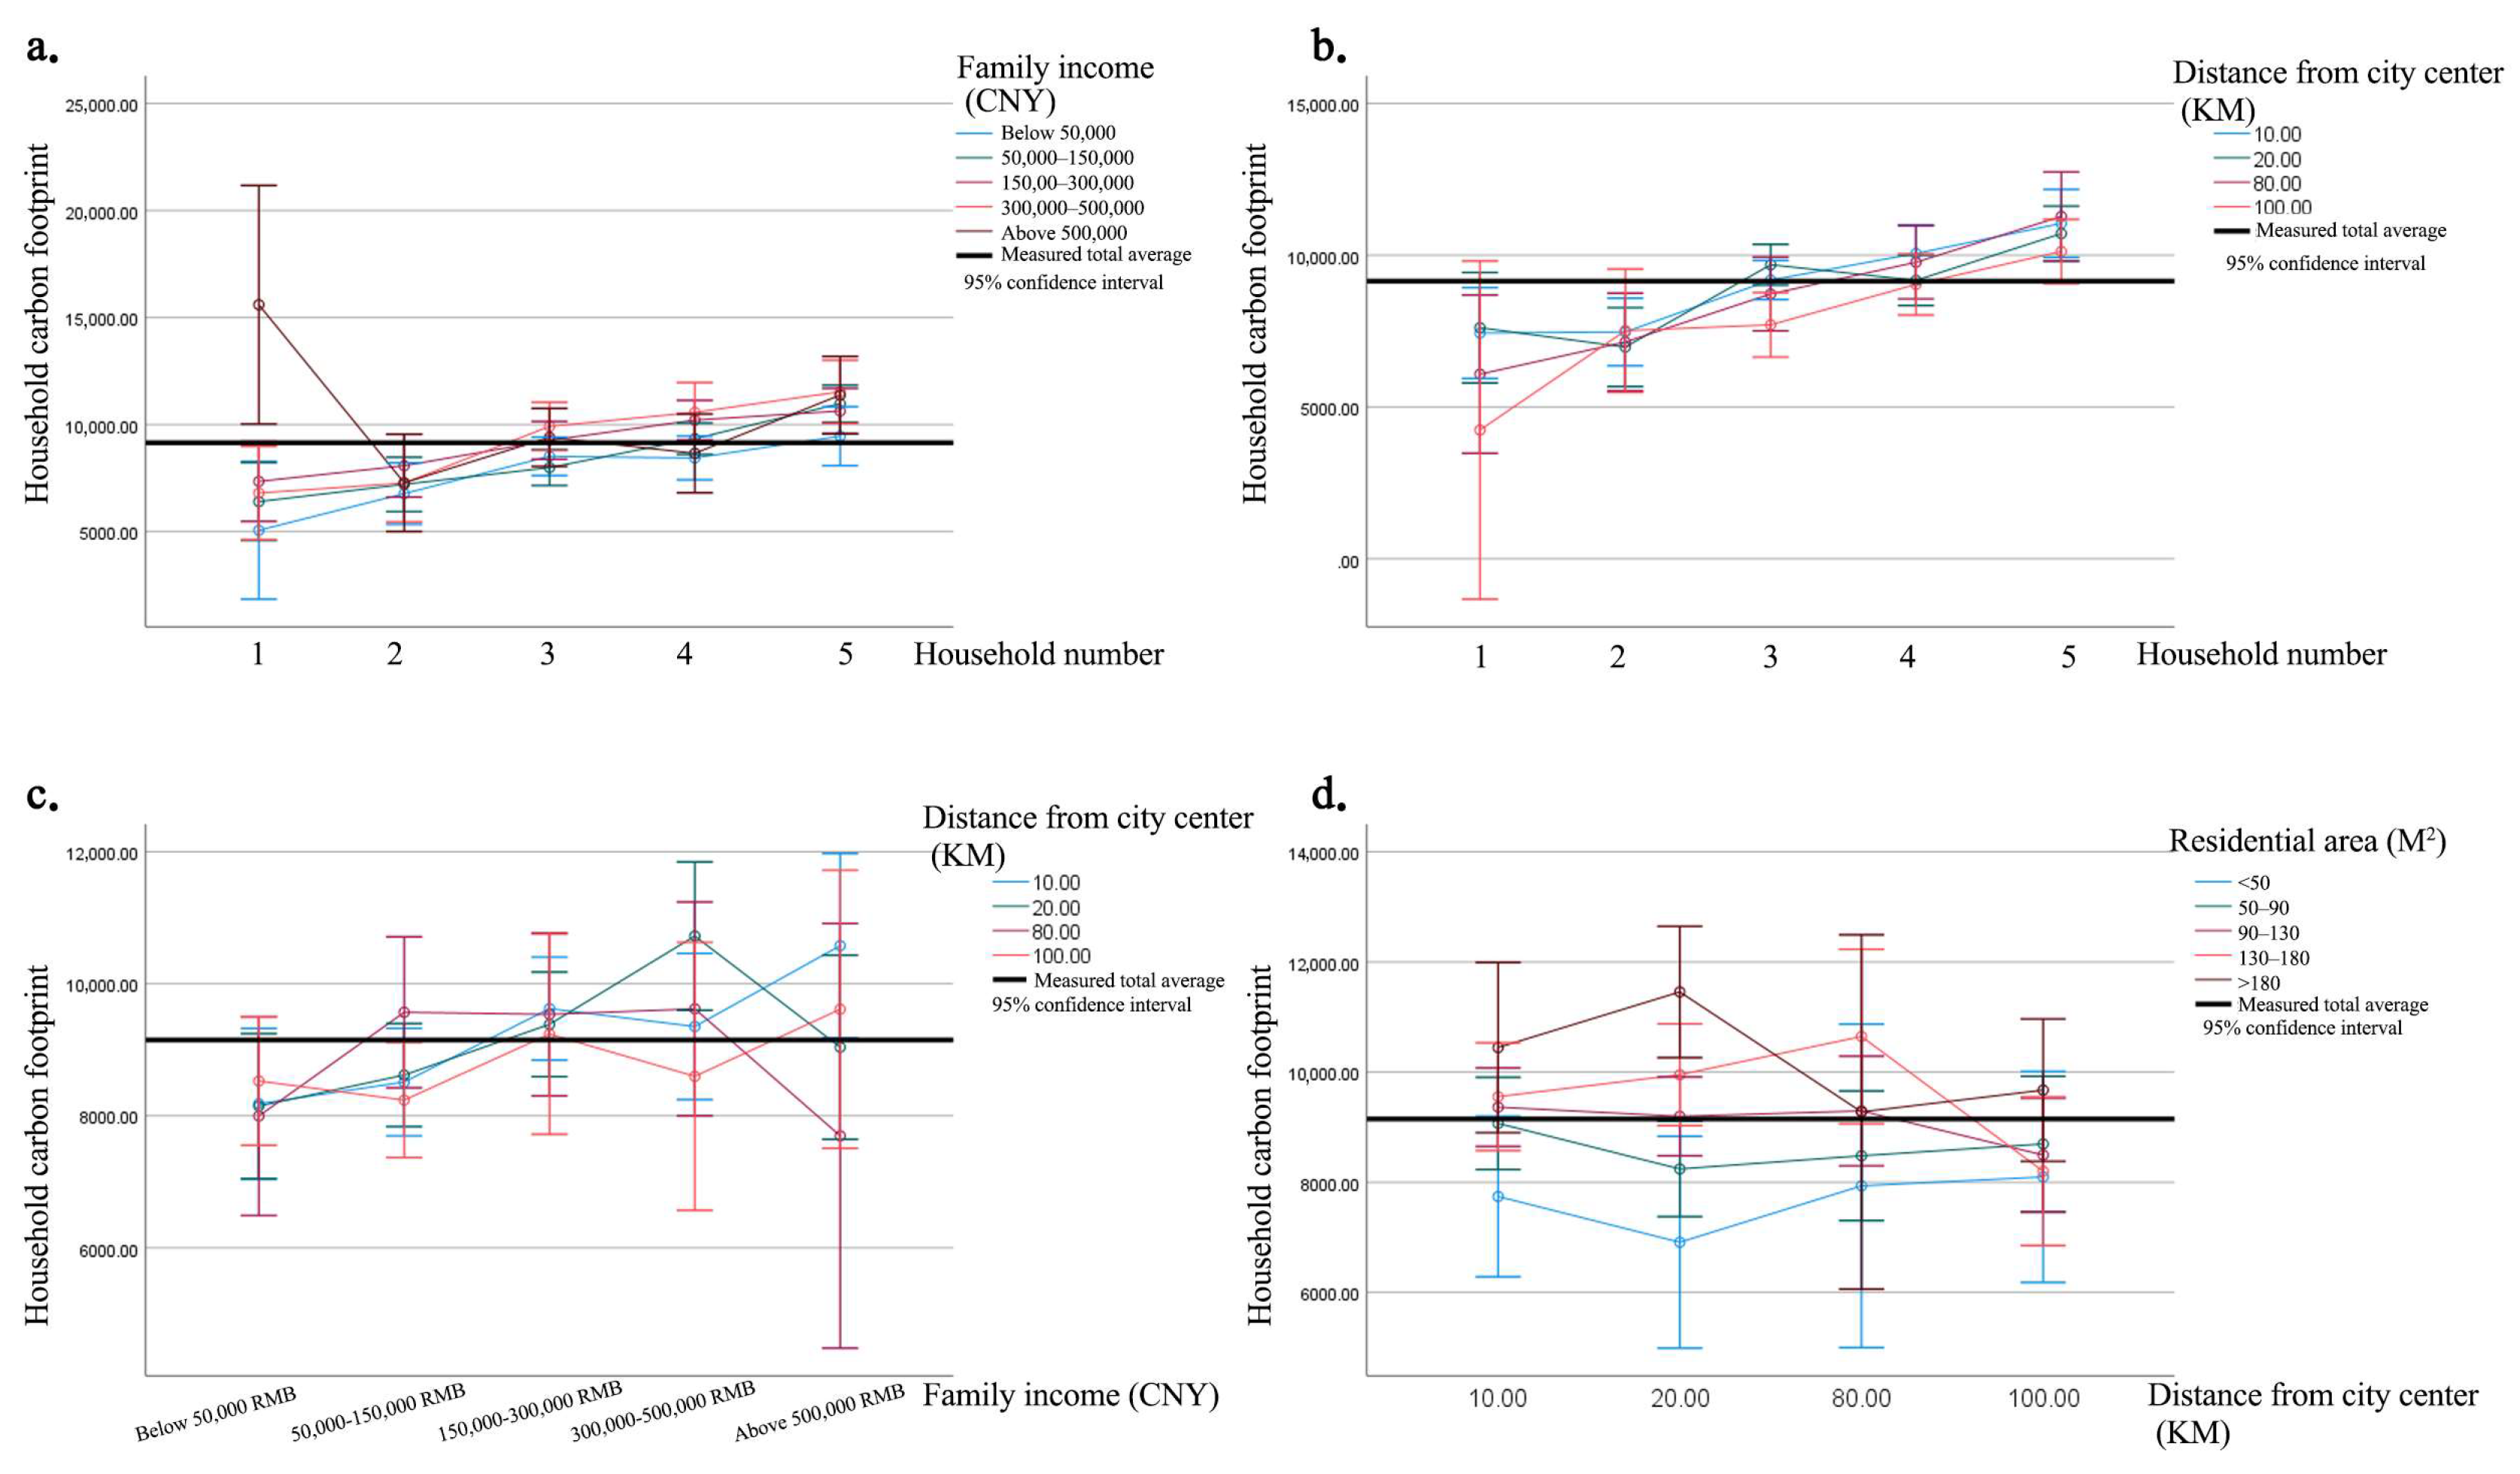
Considering the impact of multiple influencing factors on HCF, this paper uses MANOVA analysis to analyze the impact of multiple influencing factors on HCF, as shown in Figure 7.
As illustrated in Figure 7a, single-person households in affluent families significantly impact carbon footprints more than those in ordinary households. The overall carbon footprint of affluent single-person households is substantially higher than those of other household types, reflecting that high-income groups allocate more resources to the consumption of energy-intensive goods and services, thereby increasing their carbon footprints. As the number of household members increases, the HCF (household carbon footprint) generally rises for most households except the wealthiest ones. Interestingly, when household size increases from one to two people, the total carbon footprint of affluent families decreases and, as household size continues to grow, the carbon footprint growth rate of high-income families remains lower. This might indicate their capacity to invest in more energy-efficient technologies or suggest that consumption patterns of high-income households are less sensitive to changes in household size compared to lower-income households.
Figure 7b reveals, that as households move further from the city center, their total carbon footprint increases. Households with additional members located in the city center exhibit smaller increases in carbon footprint compared to those in other regions, emphasizing the importance of geographic location, particularly in promoting public transportation, non-motorized travel, or the adoption of efficient vehicles to reduce carbon footprints. Across different income levels, households in city centers generally have higher carbon footprints than rural areas (Figure 7c). Due to their flexibility in housing and transportation choices, high-income families tend to have more giant carbon footprints. Although living far from the city center, ultra-high-income families experience limited carbon footprint growth, possibly due to the adoption of efficient transportation or residence in eco-friendly communities. In contrast, low-income HCFs are less affected by residential location, with fixed transportation and energy consumption patterns, likely due to limited resources.
Larger residences tend to have higher total carbon emissions than smaller ones (Figure 7d). For households with total residential areas larger than 130 m2, the carbon footprint decreases as the distance from the city center increases, showing a significant effect. However, for residences smaller than 50 m2, the carbon footprint increases, while those between 50 m2 and 130 m2 exhibit only a moderate increase in carbon footprint with distance.
In conclusion, the diverse influencing factors of HCF reveal various strategies that can be adopted to reduce carbon footprints, fostering a more sustainable future. These multifaceted factors highlight the need to consider energy, food, transportation, and housing comprehensively to reduce household carbon footprints.

4. Discussion

4.1. Household Carbon Footprint Determinants and Implications

As influential stakeholders in low-carbon policies, households play a complex and meaningful role in shaping the future trajectory of emissions. Our analysis of the distribution of China’s HCFs in 2021 reveals that indirect carbon footprints constitute a more significant proportion (53%), with household energy and food being the most significant components of the household footprint.
Households with lower carbon footprints typically feature a per capita living area of less than 20 square meters, rural residency, and shared living arrangements. Regarding household area characteristics, residences with a per capita area of less than 20 m2 have the lowest total HCF, maximizing transportation and energy consumption reductions. However, considering the comfort of living spaces, international organizations like UN-Habitat suggest that the ideal per capita residential area should be between 30–50 square meters. This range can meet basic living needs while providing a suitable living environment and privacy for family members, thus enhancing the quality of life. Compact housing, characterized by its efficient use of space and concentrated layout, consumes fewer building materials, particularly that made from environmentally friendly materials like wood, which can reduce carbon emissions by up to 53% [64].
Additionally, smaller housing areas may encourage more sustainable lifestyles. Research shows that individuals living in smaller spaces tend to purchase fewer items, recycle more, and increase their consumption of local foods after moving to a smaller space [65]. Compact housing offers a promising solution to the affordable housing crisis, reducing the negative environmental impacts of development and addressing emissions related to supplying energy to larger homes [66]. Therefore, compact housing is a potential direction for developing future low-carbon households.
Many scholars have focused on fairness in household carbon reduction [6,19,67]. Households in urban core areas will be the primary drivers of carbon reduction in the future, with direct and indirect carbon footprints higher in urban areas than rural areas. The link between income equality and carbon footprints has been confirmed in developed [68] and developing countries [19]. Low-income households have higher proportions of food and energy consumption, often being less mobile and having higher food carbon footprints. The intensity of greenhouse gas emissions per unit of expenditure decreases with increasing income. Policy interventions are needed to improve living standards and encourage sustainable consumption [19]. Demographic structure, gender, and age also affect HCF. Smaller households significantly increase per capita CO2 footprint, while sharing within households can substantially reduce GHG emissions. Men’s carbon footprints slightly exceed women’s, and footprints for the elderly and minors are lower than for adults. The number of employed individuals in a household is inversely proportional to the household’s carbon footprint. Per capita carbon footprints decrease as household size increases, as housing, energy consumption, and transportation costs are distributed among more members, demonstrating “economies of scale.” Utilizing this “sharing economy” can help reduce carbon footprints in transportation and food.

4.2. Complex Interactions and Regional Differences

Achieving ambitious emission reduction targets consistent with the 1.5 °C goal requires strong carbon reduction efforts to reduce the global personal carbon footprint by 2 tons by 2050 to prevent global temperature rise. Understanding HCF can moderately reduce emissions, and proactive households can further reduce their carbon footprints. It emphasizes the need for robust and influential government policies to promote and facilitate transformative actions. Such policies might involve regulating the accessibility of high GHG-emission goods and services through bans, restrictions, or compulsory economic strategies (e.g., much higher carbon taxes on fuel) [69]. These should be balanced by making low-GHG alternatives more financially and structurally accessible [70].
Many complex factors influence household carbon footprint variations, including energy structure, consumption patterns, and policy frameworks. Firstly, regional differences in energy structure play a significant role in determining household carbon footprints. For instance, households in northern regions generally consume more energy due to heating needs than those in southern regions. Secondly, high-income households are more likely to purchase energy-intensive goods and services, such as private vehicles, imported foods, and luxury appliances, directly increasing their carbon footprints. In contrast, low-income households rely more on public transportation and locally sourced food, reducing emissions. Research by Cui and colleagues further highlights that poorer countries often bear a significant portion of carbon emissions transferred through global trade, exacerbating the global inequality in carbon emissions [71].
In summary, the relationship between income and carbon footprint is not linear but is affected by the interaction of multiple factors. Regional variations in energy structure and consumption patterns, differences in policy frameworks, and households’ responsiveness to these policies collectively contribute to the diversity of household carbon footprints. Therefore, future research and policy development should focus on these complex interactions to formulate more precise and effective carbon reduction strategies. For example, differentiated carbon reduction targets can be set for households of different income levels, with emission reduction goals for different household categories based on regional carbon footprint standards and caps adjusted according to specific regional requirements [72]. An annual cap can be set for carbon emissions from high-income households to further incentivize emission reductions, with carbon taxes imposed on emissions exceeding the cap.

4.3. Limitations and Future Research Directions

This study analyzed the carbon footprints of Chinese households in 2021, comparing the effects of different household characteristics (number of members, age, gender, and employment status) and socio-economic levels (household income, geographical location, and household size) on per capita carbon footprints. It further identified the key characteristics of low-carbon households. The study aimed to determine which combinations of factors can encourage households to adopt low-carbon lifestyles, providing valuable insights for balancing HCF reduction and climate change mitigation.
However, this study also has some limitations. First, given that the data collection was based on a questionnaire survey, respondents’ answers may be influenced by subjective factors, leading to under-reporting or over-reporting in specific consumption categories. It could result in biases in household expenditure and carbon footprint calculations, increasing household variance and standard deviation. Future research could consider incorporating more precise data collection methods, such as smart meter data, consumption records, or other tools that can accurately quantify energy use and consumption behavior. Second, the analysis of the economies of scale in households may be speculative. Although the results show that larger households have lower carbon footprints per capita in functional units, this calculation method may exaggerate the benefits of resource sharing within households [56]. Considering the long-term impact of population growth and household size on climate change, larger households may lead to higher total emissions. Therefore, concluding that larger households have lower carbon footprints has certain limitations. Lastly, when analyzing the relationship between income and carbon footprint, potential confounding variables such as education level and degree of urbanization also need to be considered. Education level may significantly affect a household’s environmental awareness and behavior, while urbanization directly influences energy use patterns and transportation choices. Future research should further explore the interaction between these factors and income to understand the drivers of household carbon footprints more comprehensively. Examining the potential impact of these factors on household carbon footprints in future studies could help further reveal the underlying drivers of household carbon footprints.

5. Conclusions

The rapid rise in CO2 levels has prompted countries worldwide to implement swift and large-scale policies to reduce greenhouse gas emissions and set emission reduction targets. As a significant component of the global carbon footprint, HCF requires strong carbon reduction measures in the future, necessitating policymakers to understand how to encourage households to adopt low-carbon lifestyles and technologies.
This paper calculates the carbon footprint of Chinese households in 2021. The results show that the per capita HCF in China is 2.82 tons per person per year, with an average HCF of 9.15 tons per household per year, primarily sourced from energy, food, and transportation. The number of people in a household exhibits an “economy of scale,” significantly influencing HCF, followed by household size and income. PHCF is positively correlated with household living area and income and negatively correlated with the number of household members and distance from the city center. Household awareness of low-carbon practices influences the variability of their carbon footprints. Understanding HCF can slightly reduce emissions, and specific household actions can further reduce their carbon footprints. “Small and beautiful” housing represents the future direction of low-carbon residential development. The carbon footprint in urban core areas and high-income households is relatively high, making them key targets for future carbon reduction policies. Considering that household size is the most significant negative factor affecting direct HCF (−0.473) and household income is the most significant positive factor affecting indirect HCF (0.183), high-income households can effectively control their higher carbon footprints through investments in efficient energy technologies.
In contrast, due to budget constraints, low-income households are more susceptible to household size, geographic location, and other variables. To reduce HCF, policymakers need to prioritize fairness and sustainability when formulating low-carbon policies, encouraging sustainable consumption, and providing economic incentives to promote the adoption of more environmentally friendly technologies and practices across all households. For example, the government can help households purchase energy-efficient appliances, install solar panels, or undertake energy-saving renovations through subsidies, tax reductions, or low-interest loans. However, the feasibility of implementing these policies must be considered in political, economic, and social contexts. Policy implementation may face challenges such as insufficient funding and low public acceptance. Economically, low-income households may struggle to bear the initial investment costs, while high-income households may lack interest in policy incentives.
Additionally, these policies could have unintended consequences, such as exacerbating social inequality. If high-income households take advantage of policy benefits to further reduce their carbon footprints while low-income households cannot access the same benefits, this could lead to an imbalance in carbon reduction outcomes and potentially deepen social divides. Therefore, when designing and implementing policies, it is crucial to consider the needs and capacities of different social groups to ensure fairness and feasibility in policy application.
To accelerate the achievement of the Paris Agreement’s carbon reduction goals, it is recommended that upcoming household carbon minimization strategies leverage economies of scale. Strategies include supporting using materials with lower carbon footprints, advocating for communal living models, and broadly adopting emission reduction measures. These methods aim to reduce costs and increase the efficiency of carbon reduction efforts, thereby enhancing affordability. Additionally, it is crucial to conduct engaging campaigns to raise awareness about the urgent need for carbon reduction. China’s implementation of policies to encourage low-carbon buildings, promote new energy vehicles, advocate for low-carbon lifestyles, and improve energy efficiency while utilizing new energy sources exemplifies this commitment. These initiatives aim to reduce HCFs, promote sustainable development, improve living standards, and significantly contribute to global climate governance and international cooperation. Such measures help drive global actions against climate change and guide the achievement of the strategic milestones of peaking carbon emissions by 2030 and achieving carbon neutrality by 2060. Future policy formulation should focus on aligning with household income levels, regional characteristics, and cultural habits. A diversified mix of policy tools should be employed to enhance the effectiveness and fairness of carbon reduction measures.

Supplementary Materials

The following supporting information can be downloaded at: https://www.mdpi.com/article/10.3390/buildings14113451/s1, Section S1. Reasonableness of the questionnaire; Questionnaire S1. Housing Carbon Footprint Questionnaire; Figure S1. Outlier Data Removal Example; Figure S2. Checks for socially expected answers.

Author Contributions

Data curation, Y.S.; Investigation, J.W. and M.P.; Methodology, J.F. and J.W.; Project administration, Z.Y.; Resources, N.A., Y.S. and M.P.; Software, Y.S.; Supervision, Z.Y. and J.Y.; Validation, J.F. and C.H.; Writing—original draft, N.A. and C.H.; Writing—review and editing, J.Y. All authors will be informed about each step of manuscript processing, including submission, revision, revision reminder, etc., via emails from our system or the assigned Assistant Editor. All authors have read and agreed to the published version of the manuscript.

Funding

This research was financially supported by the National Key Research and Development Program of China (2023YFC3806900), National Natural Science Foundation of China, under Grant NO. 52338004, Research fund of Tongji Architectural Design (Group) Co., Ltd. (2023J-JB04), and the Tongji University Theory Innovation Project.

Data Availability Statement

The original contributions presented in the study are included in the article. Further inquiries can be directed to the corresponding author.

Conflicts of Interest

Author Zhongqi Yu was employed by the company Tongji Architectural Design (Group) Co., Ltd. The remaining authors declare that the research was conducted in the absence of any commercial or financial relationships that could be construed as a potential conflict of interest.

References

  1. Kotz, M.; Wenz, L.; Stechemesser, A.; Kalkuhl, M.; Levermann, A. Day-to-Day Temperature Variability Reduces Economic Growth. Nat. Clim. Chang. 2021, 11, 319–325. [Google Scholar] [CrossRef]
  2. Masson-Delmotte, V.; Zhai, P.; Pirani, A.; Connors, S.L.; Péan, C.; Berger, S.; Caud, N.; Chen, Y.; Goldfarb, L.; Gomis, M.I.; et al. Climate Change 2021: The Physical Science Basis. Contribution of Working Group I to the Sixth Assessment Report of the Intergovernmental Panel on Climate Change; Cambridge University Press: Cambridge, UK, 2021. [Google Scholar]
  3. United Nations Environment. Emissions Gap Report 2023; United Nations Environment: Nairobi, Kenya, 2023. [Google Scholar]
  4. Millar, R.J.; Fuglestvedt, J.S.; Friedlingstein, P.; Rogelj, J.; Grubb, M.J.; Matthews, H.D.; Skeie, R.B.; Forster, P.M.; Frame, D.J.; Allen, M.R. Emission Budgets and Pathways Consistent with Limiting Warming to 1.5 °C. Nat. Geosci. 2017, 10, 741–747. [Google Scholar] [CrossRef]
  5. Friedlingstein, P.; O’Sullivan, M.; Jones, M.W.; Andrew, R.M.; Bakker, D.C.E.; Hauck, J.; Landschützer, P.; Le Quéré, C.; Luijkx, I.T.; Peters, G.P.; et al. Global Carbon Budget 2023. Earth Syst. Sci. Data 2023, 15, 5301–5369. [Google Scholar] [CrossRef]
  6. An, N.; Huang, C.; Shen, Y.; Wang, J.; Yu, Z.; Fu, J.; Liu, X.; Yao, J. Efficient Data-Driven Prediction of Household Carbon Footprint in China with Limited Features. Energy Policy 2024, 185, 113926. [Google Scholar] [CrossRef]
  7. Sala Benites, H.; Osmond, P.; Rossi, A.M.G. Developing Low-Carbon Communities with LEED-ND and Climate Tools and Policies in São Paulo, Brazil. J. Urban Plan. Dev. 2020, 146, 04019025. [Google Scholar] [CrossRef]
  8. Tian, X.; Geng, Y.; Dong, H.; Dong, L.; Fujita, T.; Wang, Y.; Zhao, H.; Wu, R.; Liu, Z.; Sun, L. Regional Household Carbon Footprint in China: A Case of Liaoning Province. J. Clean. Prod. 2016, 114, 401–411. [Google Scholar] [CrossRef]
  9. Liu, Z.; Guan, D.; Moore, S.; Lee, H.; Su, J.; Zhang, Q. Climate Policy: Steps to China’s Carbon Peak. Nature 2015, 522, 279–281. [Google Scholar] [CrossRef]
  10. Nationally Determined Contributions Registry. UNFCCC. Available online: https://unfccc.int/NDCREG (accessed on 4 June 2024).
  11. Fang, K.; Tang, Y.; Zhang, Q.; Song, J.; Wen, Q.; Sun, H.; Ji, C.; Xu, A. Will China Peak Its Energy-Related Carbon Emissions by 2030? Lessons from 30 Chinese Provinces. Appl. Energy 2019, 255, 113852. [Google Scholar] [CrossRef]
  12. Wang, K.; Cui, Y.; Zhang, H.; Shi, X.; Xue, J.; Yuan, Z. Household Carbon Footprints Inequality in China: Drivers, Components and Dynamics. Energy Econ. 2022, 115, 106334. [Google Scholar] [CrossRef]
  13. Capstick, S.; Lorenzoni, I.; Corner, A.; Whitmarsh, L. Prospects for Radical Emissions Reduction through Behavior and Lifestyle Change. Carbon Manag. 2014, 5, 429–445. [Google Scholar] [CrossRef]
  14. Dubois, G.; Sovacool, B.; Aall, C.; Nilsson, M.; Barbier, C.; Herrmann, A.; Bruyère, S.; Andersson, C.; Skold, B.; Nadaud, F.; et al. It Starts at Home? Climate Policies Targeting Household Consumption and Behavioral Decisions Are Key to Low-Carbon Futures. Energy Res. Soc. Sci. 2019, 52, 144–158. [Google Scholar] [CrossRef]
  15. Schanes, K.; Giljum, S.; Hertwich, E. Low Carbon Lifestyles: A Framework to Structure Consumption Strategies and Options to Reduce Carbon Footprints. J. Clean. Prod. 2016, 139, 1033–1043. [Google Scholar] [CrossRef]
  16. Zhang, X.; Luo, L.; Skitmore, M. Household Carbon Emission Research: An Analytical Review of Measurement, Influencing Factors and Mitigation Prospects. J. Clean. Prod. 2015, 103, 873–883. [Google Scholar] [CrossRef]
  17. Feng, Z.-H.; Zou, L.-L.; Wei, Y.-M. The Impact of Household Consumption on Energy Use and CO2 Emissions in China. Energy 2011, 36, 656–670. [Google Scholar] [CrossRef]
  18. Ivanova, D.; Stadler, K.; Steen-Olsen, K.; Wood, R.; Vita, G.; Tukker, A.; Hertwich, E.G. Environmental Impact Assessment of Household Consumption. J. Ind. Ecol. 2016, 20, 526–536. [Google Scholar] [CrossRef]
  19. Wiedenhofer, D.; Guan, D.; Liu, Z.; Meng, J.; Zhang, N.; Wei, Y.-M. Unequal Household Carbon Footprints in China. Nat. Clim. Chang. 2017, 7, 75–80. [Google Scholar] [CrossRef]
  20. Koide, R.; Lettenmeier, M.; Akenji, L.; Toivio, V.; Amellina, A.; Khodke, A.; Watabe, A.; Kojima, S. Lifestyle Carbon Footprints and Changes in Lifestyles to Limit Global Warming to 1.5 °C, and Ways Forward for Related Research. Sustain. Sci. 2021, 16, 2087–2099. [Google Scholar] [CrossRef]
  21. Dias, L.P.; Simões, S.; Gouveia, J.P.; Seixas, J. City Energy Modelling-Optimising Local Low Carbon Transitions with Household Budget Constraints. Energy Strategy Rev. 2019, 26, 100387. [Google Scholar] [CrossRef]
  22. Senturk, G.; Dumludag, D. The Relationship between Consumption of Single-Use Plastic Bags, Environmental Awareness, and Socio-Demographic Factors. J. Mater. Cycles Waste Manag. 2022, 24, 1494–1507. [Google Scholar] [CrossRef]
  23. Tantiwatthanaphanich, T.; Shao, X.; Huang, L.; Yoshida, Y.; Long, Y. Evaluating Carbon Footprint Embodied in Japanese Food Consumption Based on Global Supply Chain. Struct. Chang. Econ. Dyn. 2022, 63, 56–65. [Google Scholar] [CrossRef]
  24. Parashar, S.; Sood, G.; Agrawal, N. Modelling the Enablers of Food Supply Chain for Reduction in Carbon Footprint. J. Clean. Prod. 2020, 275, 122932. [Google Scholar] [CrossRef]
  25. Huang, L.; Yoshida, Y.; Li, Y.; Cheng, N.; Xue, J.; Long, Y. Sustainable Lifestyle: Quantification and Determining Factors Analysis of Household Carbon Footprints in Japan. Energy Policy 2024, 186, 114016. [Google Scholar] [CrossRef]
  26. Peng, S.; Wang, X.; Du, Q.; Wu, K.; Lv, T.; Tang, Z.; Wei, L.; Xue, J.; Wang, Z. Evolution of Household Carbon Emissions and Their Drivers from Both Income and Consumption Perspectives in China during 2010–2017. J. Environ. Manag. 2023, 326, 116624. [Google Scholar] [CrossRef] [PubMed]
  27. Pettifor, H.; Mastrucci, A.; Wilson, C.; van Ruijven, B.; Agnew, M.; Le Gallic, T. Endogenous Simulation of Low-Carbon Lifestyle Change in Global Climate Mitigation Pathways. Environ. Res. Lett. 2023, 19, 014016. [Google Scholar] [CrossRef]
  28. Wang, Y.; Zhao, M.; Chen, W. Spatial Effect of Factors Affecting Household CO 2 Emissions at the Provincial Level in China: A Geographically Weighted Regression Model. Carbon Manag. 2018, 9, 187–200. [Google Scholar] [CrossRef]
  29. Xu, T.; Kang, C.; Zhang, H. China’s Efforts towards Carbon Neutrality: Does Energy-Saving and Emission-Reduction Policy Mitigate Carbon Emissions? J. Environ. Manag. 2022, 316, 115286. [Google Scholar] [CrossRef]
  30. Chinese Academy of Environmental Planning; Beijing Normal University; China City Greenhouse Gas Working Group. China Products Carbon Footprint Factors Database (2022); Beijing, China, 2022. [Google Scholar]
  31. Renwei, C. Innovation Center for Energy and Transportation China Commercial Vehicle Electrification Development Research Report. Available online: https://www.efchina.org/Reports-zh/report-ctp-20220303-5 (accessed on 23 October 2024). (In Chinese).
  32. Gardezi, S.S.S.; Shafiq, N.; Khan, M.W.A. Relational Pre-Impact Assessment of Conventional Housing Features and Carbon Footprint for Achieving Sustainable Built Environment. Environ. Dev. Sustain. 2022, 24, 8441–8463. [Google Scholar] [CrossRef]
  33. Salazar, J.; Meil, J. Prospects for Carbon-Neutral Housing: The Influence of Greater Wood Use on the Carbon Footprint of a Single-Family Residence. J. Clean. Prod. 2009, 17, 1563–1571. [Google Scholar] [CrossRef]
  34. Bin, S.; Dowlatabadi, H. Consumer Lifestyle Approach to US Energy Use and the Related CO2 Emissions. Energy Policy 2005, 33, 197–208. [Google Scholar] [CrossRef]
  35. China: Power Generation Emission Intensity 2021. Available online: https://www.statista.com/statistics/1300419/power-generation-emission-intensity-china/ (accessed on 30 August 2022).
  36. Ministry of Ecology and Environment the People’s Republic of China. China’s Ecological and Environmental Statistics 2020; Ministry of Ecology and Environment the People’s Republic of China: Beijing, China, 2020.
  37. Tabachnick, B.G.; Fidell, L.S.; Ullman, J.B. Using Multivariate Statistics, 7th ed.; Pearson: New York, NY, USA, 2019; ISBN 978-0-13-479054-1. [Google Scholar]
  38. de Boer, J.; de Witt, A.; Aiking, H. Help the Climate, Change Your Diet: A Cross-Sectional Study on How to Involve Consumers in a Transition to a Low-Carbon Society. Appetite 2016, 98, 19–27. [Google Scholar] [CrossRef]
  39. Velasco-Martínez, L.-C.; Martín-Jaime, J.-J.; Estrada-Vidal, L.-I.; Tójar-Hurtado, J.-C. Environmental Education to Change the Consumption Model and Curb Climate Change. Sustainability 2020, 12, 7475. [Google Scholar] [CrossRef]
  40. Zhao, D.; McCoy, A.P.; Agee, P.; Mo, Y.; Reichard, G.; Paige, F. Time Effects of Green Buildings on Energy Use for Low-Income Households: A Longitudinal Study in the United States. Sustain. Cities Soc. 2018, 40, 559–568. [Google Scholar] [CrossRef]
  41. Center for Sustainable Systems. Carbon Footprint Factsheet; University of Michigan: Ann Arbor, MI, USA, 2023. [Google Scholar]
  42. Yu, F.; Dong, H.; Geng, Y.; Fang, A.S.; Li, H. Uncovering the Differences of Household Carbon Footprints and Driving Forces between China and Japan. Energy Policy 2022, 165, 112990. [Google Scholar] [CrossRef]
  43. Ottelin, J.; Heinonen, J.; Nässén, J.; Junnila, S. Household Carbon Footprint Patterns by the Degree of Urbanisation in Europe. Environ. Res. Lett. 2019, 14, 114016. [Google Scholar] [CrossRef]
  44. Baiocchi, G.; Minx, J.; Hubacek, K. The Impact of Social Factors and Consumer Behavior on Carbon Dioxide Emissions in the United Kingdom. J. Ind. Ecol. 2010, 14, 50–72. [Google Scholar] [CrossRef]
  45. Zen, I.S.; Al-Amin, A.Q.; Alam, M.M.; Doberstein, B. Magnitudes of Households’ Carbon Footprint in Iskandar Malaysia: Policy Implications for Sustainable Development. J. Clean. Prod. 2021, 315, 128042. [Google Scholar] [CrossRef]
  46. Adnan, M.N.; Safeer, R.; Rashid, A. Consumption Based Approach of Carbon Footprint Analysis in Urban Slum and Non-Slum Areas of Rawalpindi. Habitat Int. 2018, 73, 16–24. [Google Scholar] [CrossRef]
  47. Liang, L.; Chen, M.; Zhang, X.; Sun, M. Understanding Changes in Household Carbon Footprint during Rapid Urbanization in China. Energy Policy 2024, 185, 113928. [Google Scholar] [CrossRef]
  48. Zhang, X.; Wang, Y. How to Reduce Household Carbon Emissions: A Review of Experience and Policy Design Considerations. Energy Policy 2017, 102, 116–124. [Google Scholar] [CrossRef]
  49. Li, J.; Zhang, D.; Su, B. The Impact of Social Awareness and Lifestyles on Household Carbon Emissions in China. Ecol. Econ. 2019, 160, 145–155. [Google Scholar] [CrossRef]
  50. Zhang, H.; Shi, X.; Wang, K.; Xue, J.; Song, L.; Sun, Y. Intertemporal Lifestyle Changes and Carbon Emissions: Evidence from a China Household Survey. Energy Econ. 2020, 86, 104655. [Google Scholar] [CrossRef]
  51. Druckman, A.; Jackson, T. Household Energy Consumption in the UK: A Highly Geographically and Socio-Economically Disaggregated Model. Energy Policy 2008, 36, 3177–3192. [Google Scholar] [CrossRef]
  52. Duarte, R.; Mainar, A.; Sánchez-Chóliz, J. The Impact of Household Consumption Patterns on Emissions in Spain. Energy Econ. 2010, 32, 176–185. [Google Scholar] [CrossRef]
  53. Liu, L.-C.; Wu, G.; Wang, J.-N.; Wei, Y.-M. China’s Carbon Emissions from Urban and Rural Households during 1992–2007. J. Clean. Prod. 2011, 19, 1754–1762. [Google Scholar] [CrossRef]
  54. Zhao, X.; Li, N.; Ma, C. Residential Energy Consumption in Urban China: A Decomposition Analysis. Energy Policy 2012, 41, 644–653. [Google Scholar] [CrossRef]
  55. Jones, C.M.; Kammen, D.M. Quantifying Carbon Footprint Reduction Opportunities for U.S. Households and Communities. Environ. Sci. Technol. 2011, 45, 4088–4095. [Google Scholar] [CrossRef]
  56. Ala-Mantila, S.; Ottelin, J.; Heinonen, J.; Junnila, S. To Each Their Own? The Greenhouse Gas Impacts of Intra-Household Sharing in Different Urban Zones. J. Clean. Prod. 2016, 135, 356–367. [Google Scholar] [CrossRef]
  57. Golley, J.; Meng, X. Income Inequality and Carbon Dioxide Emissions: The Case of Chinese Urban Households. Energy Econ. 2012, 34, 1864–1872. [Google Scholar] [CrossRef]
  58. Streimikiene, D.; Volochovic, A. The Impact of Household Behavioral Changes on GHG Emission Reduction in Lithuania. Renew. Sustain. Energy Rev. 2011, 15, 4118–4124. [Google Scholar] [CrossRef]
  59. Osorio, P.; Tobarra, M.-Á.; Tomás, M. Are There Gender Differences in Household Carbon Footprints? Evidence from Spain. Ecol. Econ. 2024, 219, 108130. [Google Scholar] [CrossRef]
  60. Kim, J.; Lim, H.; Jo, H.-H. Do Aging and Low Fertility Reduce Carbon Emissions in Korea? Evidence from IPAT Augmented EKC Analysis. Int. J. Environ. Res. Public Health 2020, 17, 2972. [Google Scholar] [CrossRef]
  61. Long, Y.; Yoshida, Y.; Meng, J.; Guan, D.; Yao, L.; Zhang, H. Unequal Age-Based Household Emission and Its Monthly Variation Embodied in Energy Consumption—A Cases Study of Tokyo, Japan. Appl. Energy 2019, 247, 350–362. [Google Scholar] [CrossRef]
  62. Boucher, J.L. Culture, Carbon, and Climate Change: A Class Analysis of Climate Change Belief, Lifestyle Lock-in, and Personal Carbon Footprint. Soc. Ekol. Z. Für Umweltgedanken Und Soziologische Forsch. 2016, 25, 53–80. [Google Scholar] [CrossRef]
  63. Han, Y.; Duan, H.; Du, X.; Jiang, L. Chinese Household Environmental Footprint and Its Response to Environmental Awareness. Sci. Total Environ. 2021, 782, 146725. [Google Scholar] [CrossRef]
  64. Souaid, C.; ten Caat, P.N.; Meijer, A.; Visscher, H. Downsizing and the Use of Timber as Embodied Carbon Reduction Strategies for New-Build Housing: A Partial Life Cycle Assessment. Build. Environ. 2024, 253, 111285. [Google Scholar] [CrossRef]
  65. The Top 4 Environmental Benefits of Living in a Tiny Home—Miniopolis. Available online: https://miniopolisbuilders.com/the-top-4-environmental-benefits-of-living-in-a-tiny-home/ (accessed on 26 March 2024).
  66. Could Tiny Homes Be the Adorable, Affordable and Sustainable Housing That Our Planet Needs? Available online: https://ideas.ted.com/impact-of-tiny-homes-on-the-environment-and-affordable-housing/ (accessed on 23 October 2024).
  67. Gao, X.; Chen, X.; Liu, L.-C. Exploring the Determinants of the Evolution of Urban and Rural Household Carbon Footprints Inequality in China. Energy Policy 2024, 185, 113955. [Google Scholar] [CrossRef]
  68. Sommer, M.; Kratena, K. The Carbon Footprint of European Households and Income Distribution. Ecol. Econ. 2017, 136, 62–72. [Google Scholar] [CrossRef]
  69. Boyce, J.K. Carbon Pricing: Effectiveness and Equity. Ecol. Econ. 2018, 150, 52–61. [Google Scholar] [CrossRef]
  70. Geels, F.W.; Schwanen, T.; Sorrell, S.; Jenkins, K.; Sovacool, B.K. Reducing Energy Demand through Low Carbon Innovation: A Sociotechnical Transitions Perspective and Thirteen Research Debates. Energy Res. Soc. Sci. 2018, 40, 23–35. [Google Scholar] [CrossRef]
  71. Cui, Q.; Chen, B. Aviation Carbon Transfer and Compensation of International Routes in Africa from 2019 to 2021. Sci. Data 2023, 10, 306. [Google Scholar] [CrossRef]
  72. Miehe, R.; Scheumann, R.; Jones, C.M.; Kammen, D.M.; Finkbeiner, M. Regional Carbon Footprints of Households: A German Case Study. Environ. Dev. Sustain. 2016, 18, 577–591. [Google Scholar] [CrossRef]
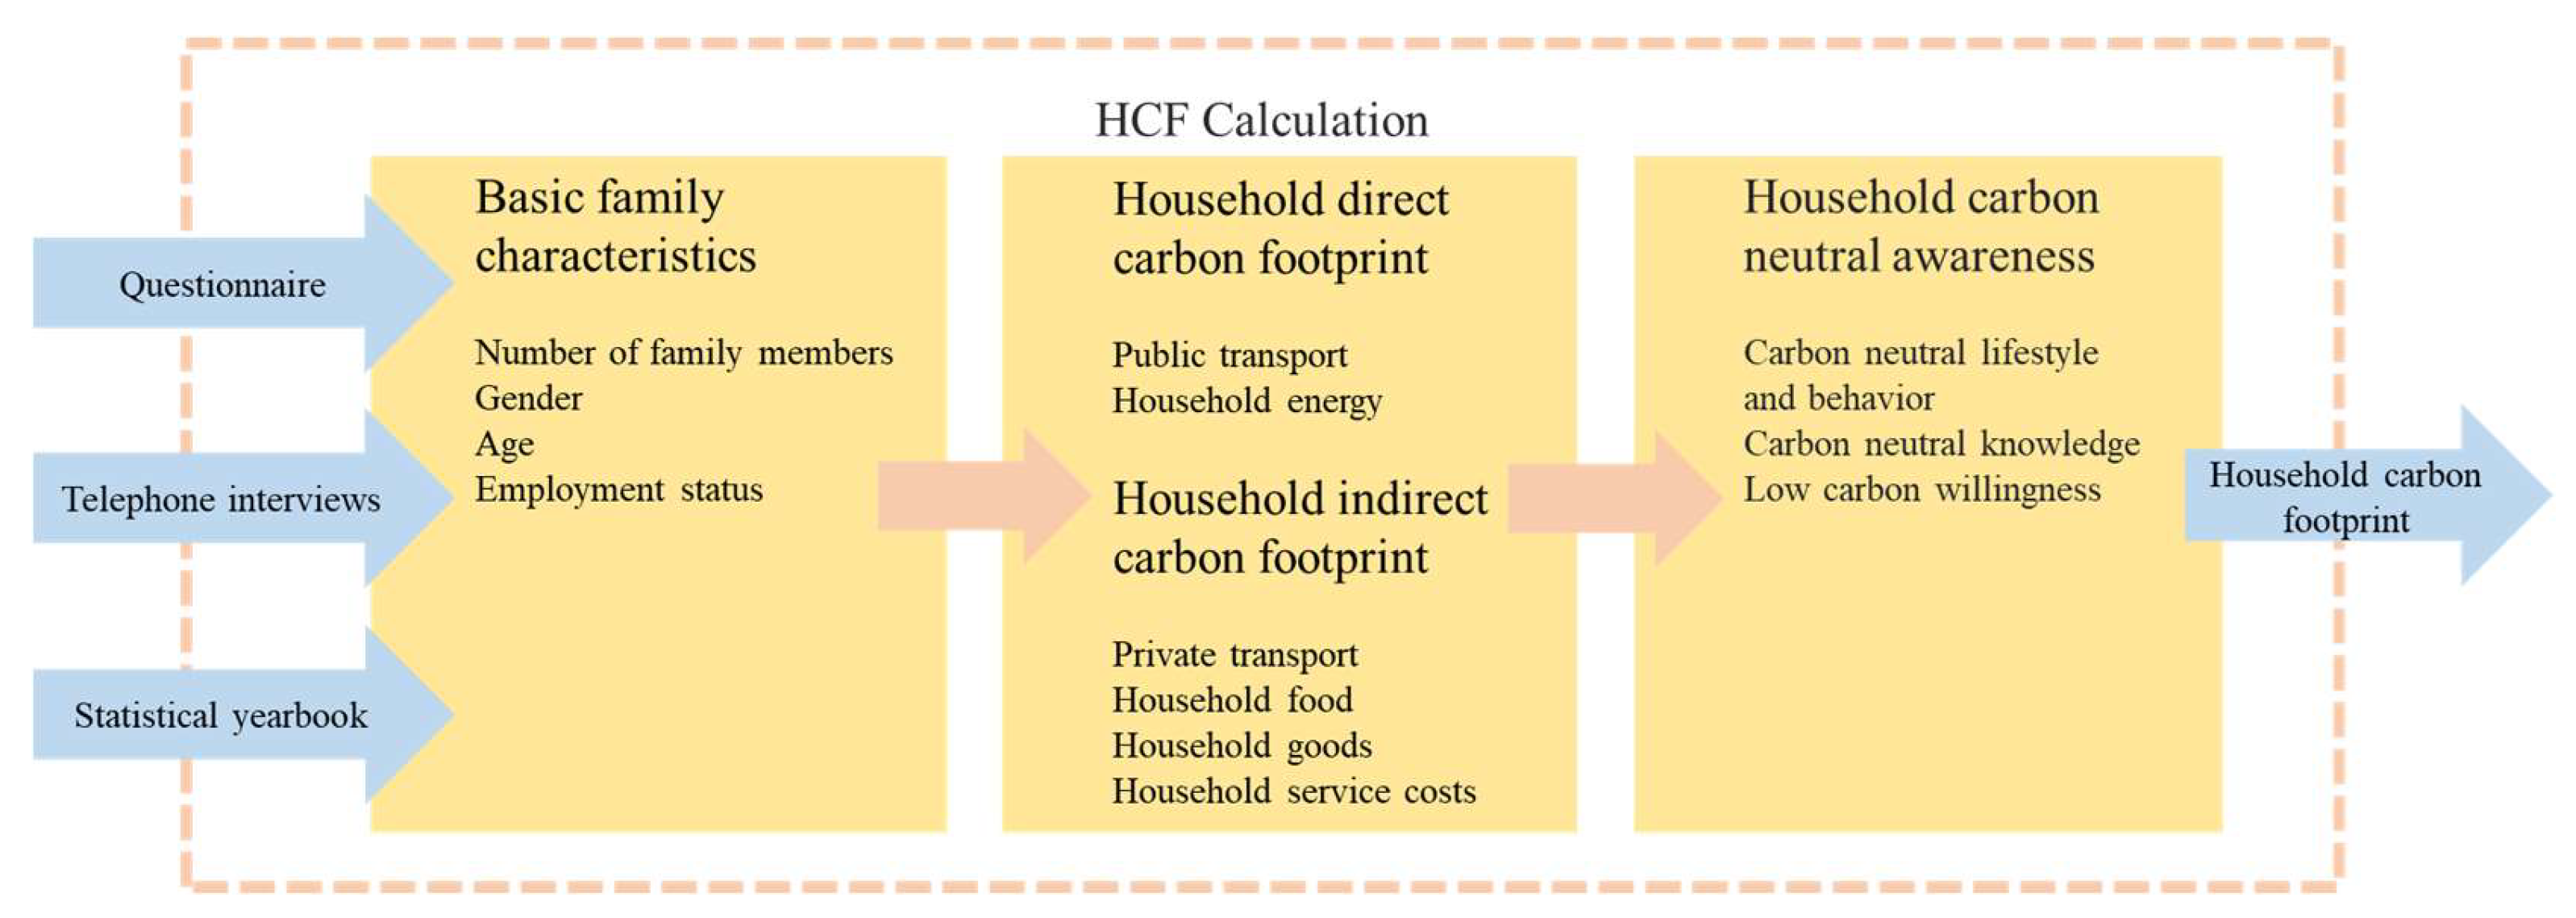
Figure 1. Carbon footprint calculation process.
Buildings 14 03451 g001
Figure 2. HCF questionnaire.
Buildings 14 03451 g002
Figure 3. Primary family information: (a) overall composition of HCF, (b) composition of transportation carbon footprints, (c) composition of housing carbon footprints, (d) composition of service carbon footprints, (e) composition of food carbon footprints, (f) composition of energy carbon footprints, (g) composition of product carbon footprints, and (h) HCF by different population structures.
Buildings 14 03451 g003
Figure 4. The carbon footprint of different household characteristics: (a) HCF by different locations, (b) HCF by different per capita monthly incomes, (c) HCF by different per capita residential areas, (d) PHCF (per household carbon footprint) by different household structures, (e) HCF by different numbers of elderly people, (f) HCF by different numbers of employed persons, and (g) HCF by different numbers of minors (below 18).
Buildings 14 03451 g004
Figure 5. HCF with different low-carbon awareness.
Buildings 14 03451 g005
Figure 6. Main factors influencing the carbon footprint of households. The asterisks (**) denote statistical significance at the 0.01 level, and a single asterisk (*) denotes statistical significance at the 0.05 level.
Buildings 14 03451 g006
Figure 7. Multiple influences on HCF. (a) Family income (CNY), Household number and HCF, (b) Distance from city center(KM), Household number and HCF, (c) Distance from city center(KM), Family income (CNY) and HCF, (d) Residential area (M2), Distance from city center(KM) and HCF.
Buildings 14 03451 g007
Table 2. HCF calculation method.
TypeContentsCalculation MethodData Sources
Transport carbon footprintMetroThe metro takes the middle of the mileage option and 1.5 km of metro kilometers per station.China Products Carbon Footprint Factors Database (2022) [30]
Private CarIn the carbon footprint of private cars, the number of kilometers driven per month by private cars is calculated by counting the monthly fuel cost of private cars, combined with the overall fuel price of RMB8.73/liter in July 2022, and the number of kilometers driven per month by private cars, combined with the displacement of the car.
BusesPublic transport carbon footprint calculation is based on electric buses [31].
TaxisThe 2014 China taxi subaverage distance of 7 km/ride was taken as standard.
Planes and trainsMedian train and airplane use travel hours multiplied by average train and airplane speeds in China.
Residential situationCarbon footprint of housing construction, building, and demolitionClassify the housing into three categories, civil, brick, and concrete, and research the size of the dwelling and combine it with the thesis to estimate [32,33].
WallpaperQuestionnaire statistics on house size and standard floor height of Chinese buildings (2.8 m).
FlooringQuestionnaire statistics on house size.
Dietary situationCereals, vegetables, fruit, meat, fish, eggs, and milkThe Chinese Dietary Guidelines suggest that the average adult consumes about 0.8 kg of food per day, and the questionnaire counts the proportion of various types of food in the household.
Cigarettes, liquor, beer, tea, and coffeeQuestionnaire statistics on household consumption, missing coefficients added by thesis factor.
Daily products situationLaundry DetergentQuestionnaire to count household consumption.
ClothesFrequency of questionnaire statistics, combined with the recycling rate of clothing in China (around 10%), the carbon emissions of clothing for households with a tendency to recycle clothing, combined with household take-back of 90%.
Household productsFrequency of questionnaire statistics, carbon emission data for flooring and wallpaper replacement calculated over 70 years of use for 100 m2, missing factors added by thesis factors.
Electronic equipmentFrequency of questionnaire statistics to calculate the replacement cycle of household appliances and electronic equipment based on a market study of the white goods industry in China and a report of replacement users in the Winning Smartphone market.
Reading preferencesThe questionnaire counts the frequency of paper books and online reading and considers the recycling rate of paper in China.
Disposable itemsPlastic bags and disposable chopsticks, based on the number of plastic bags and chopsticks consumed by households per month according to the questionnaire.
Service carbon footprintHealthcareHealth. Social Security and social welfare industry.Consumer Lifestyle Approach (CLA) calculations [17,34] combined with NSO’s Consumer Expenditure in 2021
Cultural, educational, and recreational goodsSporting goods, education, and recreation.
Other goods and servicesWholesale and retail, accommodation and catering, residential services, and other services
Energy situationElectricityQuestionnaire Statistics, Carbon Intensity of Electricity Generation in China in 2021 [35]China Products Carbon Footprint Factors Database (2022) [30]
and Annual Report on China’s Ecological and Environmental Statistics 2020 [36]
WaterQuestionnaire statistics
GasQuestionnaire statistics
Natural gasQuestionnaire statistics
Household wasteWaste of household water, waste, and sludge
The volume of sewage generated is the difference between the actual volume of sewage and the treated sewage, considering the maturity of sewage treatment technology.
Table 3. Main Factors Influencing HCF.
VariableDirect HCFSignificanceIndirect HCFSignificance
Household number−0.473 **0.000−0.464 **0.000
Male population−0.241 **0.000−0.245 **0.000
Female population−0.258 **0.000−0.261 **0.000
Minors−0.147 **0.000−0.189 **0.000
Elderly−0.086 **0.004−0.090 **0.003
Working population−0.126 **0.000−0.102 **0.001
Family income (CNY)0.107 **0.0000.183 **0.000
Distance from city center (in km)−0.136 **0.000−0.189 **0.000
Residential area (in square meters)−0.073 *0.0150.077 *0.011
The asterisks (**) denote statistical significance at the 0.01 level, and a single asterisk (*) denotes statistical significance at the 0.05 level.
Disclaimer/Publisher’s Note: The statements, opinions and data contained in all publications are solely those of the individual author(s) and contributor(s) and not of MDPI and/or the editor(s). MDPI and/or the editor(s) disclaim responsibility for any injury to people or property resulting from any ideas, methods, instructions or products referred to in the content.