Article

Research on the Theoretical Models of FRP-Confined Gangue Aggregate Concrete Partially Filled Steel Tube Columns

1
School of Civil Engineering and Architecture, Suqian University, Suqian 223800, China
2
Jiangsu Key Laboratory of Environmental Impact and Structural Safety in Engineering, China University of Mining and Technology, Xuzhou 221116, China
3
Suqian City Urban Construction Investment (Group) Co., Ltd., Suqian 223800, China
4
China Construction Fifth Engineering Bureau Co., Ltd., Changsha 410004, China
*
Author to whom correspondence should be addressed.
Buildings 2024, 14(11), 3516; https://doi.org/10.3390/buildings14113516
Submission received: 11 October 2024 / Revised: 28 October 2024 / Accepted: 31 October 2024 / Published: 4 November 2024

Abstract

:
FRP-confined gangue aggregate concrete partially filled steel tubes (CGCPFTs) can not only effectively enhance the performance of coal gangue concrete, but also fully exploit the elastic-plastic mechanical behavior of the steel tubes. However, research on theoretical models that can describe their mechanical properties is yet to be conducted. To fill this gap, theoretical models for structural design and analysis were proposed for CGCPFTs. For the analytical model, based on the available experimental data, a prediction method for the stress–strain behavior of the gangue aggregate concrete in CGCPFTs, which is confined only by FRP and partly confined by both FRP and the steel tubes, was first proposed. Additionally, the condition for the synergetic deformation of the two confined states of gangue aggregate concrete within the CGCPFT was proposed. Based on the condition, an iterative incremental process was developed which subsequently allows for the theoretical calculation of the load–displacement curve for the CGCPFT under monotonic axial compression. For the design model, by introducing the constraint contribution coefficient of the steel tube, the existing closed-loop calculation formula for the stress–strain relationship of FRP-confined concrete was revised. Furthermore, by expressing the axial and lateral stresses of the steel tube as a unified circumferential effect on the concrete, the calculation methods for the ultimate strength and strain in the closed-loop formula were redefined, thus achieving the prediction of the stress–strain behavior of CGCPFTs. The comparison with the test data obtained by the author and their team revealed that both the analysis and design models could provide accurate predictions.

1. Introduction

Coal gangue is a significant byproduct produced in the process of coal extraction, and it can be utilized as the aggregate in concrete for constructing infrastructure in mining regions. This not only addresses the issue of solid waste disposal of coal gangue, but also enables the use of locally sourced building materials [1,2]. However, gangue aggregate concrete (hereinafter referred as GAC) suffers from low strength and stiffness, with high brittleness, significantly limiting its practical engineering applications. In this study, a novel composite form, namely an FRP-confined gangue aggregate concrete partially filled steel tube (i.e., CGCPFT), is proposed. The main objective of this paper is to establish the theoretical models of CGCPFTs for analysis and design, thereby enabling subsequent nonlinear finite element analysis and guiding structural design. FRP cloth materials are characterized by their lightness, high strength, high elastic modulus, corrosion resistance, and linear elasticity [3,4,5]. They are primarily used for reinforcing structural components and can effectively enhance the mechanical behavior of GAC [6,7,8]. The embedded steel tube can not only improve the confinement effect of GAC, but also increase the vertical stiffness of the composite column. Additionally, the confining pressure exerted by the FRP can avert early-stage deformation of the steel tube and tackle longevity concerns including surface corrosion [9,10,11,12]. In order to facilitate the design of and subsequent research on this type of column, it is particularly important to develop a reasonable theoretical model to describe its mechanical properties.
Some scholars believe that the mechanical behavior of concrete in FRP–steel–concrete double-skin hollow columns (DSTCs) can be predicted using the model for FRP-confined concrete [13,14]. However, the mechanical behavior of concrete in FRP–steel–concrete composite columns exhibits significant differences due to them being doubly confined by FRP and the steel tube, necessitating a re-evaluation of the theoretical model based on the interaction mechanism [15]. Additionally, when considering whether the concrete is fully filled into the steel tube, these components can be classified into two types: an FRP-confined concrete fully filled steel tube (CCFFT), where all concrete is doubly confined, and an FRP-confined concrete partially filled steel tube (CCPFT), where only the concrete inside the steel tube is doubly confined, as shown in Figure 1.
The superposition method or confinement factor method had been utilized by many scholars [16,17,18,19,20,21,22] to predict the bearing capacity of CCFFTs. Regarding the stress–strain curve, the bidirectional stress of the steel pipe was clarified by Teng et al. [23] using the plastic flow rule. Subsequently, in conjunction with the model [24] for FRP-confined concrete, an analytical model for CCFFTs using an iterative incremental process was proposed, yielding satisfactory prediction results. For the convenience of engineering design, a design model for CCFFTs was proposed by Zhang et al. [25], who used the previously proposed models of steel tube-confined concrete [26] as the basic equation. Their approach also involved an estimation of the existing strength and strain models of CCFFTs [16,19,20,22,27,28].
Currently, research specifically focusing on CCPFTs is relatively scarce. Experimental research was conducted by the team of Zeng Junjie [29] through embedding a cylindrical high-grade steel pipe within a square CCPFT cross-section. The model for FRP-restrained concrete developed by Lam and Teng [30] was utilized to forecast the performance characteristics of the concrete, and it was found that the model generally underestimated the test curves in most cases. Experimental and theoretical analyses on circular CCPFTs with high-strength steel tubes were performed by Teng et al. [13]. Nevertheless, the stress–strain behavior of the concrete was simulated in a manner similar to that used for CCFFTs, due to the incorporation of a high-strength steel tube exhibiting low hoop strain.
The existing analysis model [29] for CCPFTs cannot accurately simulate the mechanical properties of GAC. Moreover, they do not clearly distinguish the mechanical differences between the concrete core and the concrete ring in Figure 1. Additionally, there is currently no research on design models specifically for CCPFTs or CGCPFTs. The study of CGCPFTs (FRP-confined gangue aggregate concrete partially filled steel tubes) is recognized as an urgent matter demanding resolution. Hence, this paper initially proposed a constitutive model for FRP-confined coal gangue concrete (i.e., FC-GAC). Subsequently, an analytical model was developed that can capture the parameter variations of the embedded steel tube in CGCPFTs and elucidate the interplay principle between FRP, concrete, and the steel tube. Concurrently, building upon the established classical design model for FRP-restrained concrete, a simplified design model that can reflect change in the parameters of the embedded steel tube was established.

2. Existing Models of CCFFT

2.1. Analysis-Oriented Model for CCFFT

2.1.1. The Axial Stress–Strain Equation of Concrete

Equation (1), originally proposed by Popovics [31] and later applied to FRP passively confined concrete by Jiang and Teng [32], was adopted by Teng et al. [23] and Wang [33] to characterize the stress–strain response of concrete in CCFFTs.
σ c f c c = ε c / ε c c r r 1 + ε c / ε c c r
where r is taken as a fixed value, primarily used to control the brittleness of the concrete, and can be obtained by Equation (2).
r = E c E c + f c c / ε c c

2.1.2. Ultimate Stress and Corresponding Strain

For natural aggregate concrete, Equations (3) and (4), developed by Jiang and Teng [32], were employed by Teng et al. [23] and Wang [33] to determine the ultimate stress and associated strain of concrete.
f c c f c o = 1 + 3.5 σ r f c o
ε c c ε c o = 1 + 17.5 σ r f c o
where σ r is the total lateral restraint stress experienced by the concrete, including the σ f generated by FRP and the σ r s , h generated by the steel tube, defined by Equation (5) in which the value of σ s , h is defined in the next section.
σ r = 2 σ s , h t s + 2 E f r p t f r p ε l D
It is worth noting that for CCPFTs, the concrete ring (as illustrated in Figure 1) is only restrained by FRP. When calculating the concrete ring, σ r = σ f and can be determined by Equation (6), while the confining stress of concrete core should be calculated using Equation (5).
σ r = σ f = 2 E f r p t f r p ε l D

2.1.3. The Constitutive Relationship of the Steel Tube

The biaxial stress in the steel pipe complied with the Hooke’s law, which was defined by Equation (7).
d σ s , a i d σ s , h i = E s 1 v 2 1 v v 1 d ε s , a i d ε s , h i
The von Mises criterion was frequently employed to assess whether the steel tube had attained the yield threshold [30], which was calculated using Equation (8).
f y = σ s , a 2 + σ s , h 2 σ s , a σ s , h
In the post-yield stage, the correlation between the changes in biaxial stress and strain was delineated according to the Prandtl flow principle [23,33], which was defined by Equations (9)–(14).
d σ s , a i d σ s , h i = E s 1 v 2 1 s a 2 / s c v s a s h / s c v s a s h / s c 1 s a 2 / s c d ε s , a i d ε s , h i
s a = σ s , a + v σ s , h
s h = σ s , h + v σ s , a
s c = σ s , a 2 + σ s , h 2 + 2 v σ s , a σ s , a
σ s , a = 1 3 2 σ s , a i 1 2 σ s , h i 1
σ s , h = 1 3 2 σ s , h i 1 2 σ s , a i 1
where σ s , a and ε s , a represent the axial stress and strain of the steel tube, respectively, while σ s , a and ε s , h denote the lateral stress and strain, respectively.

2.1.4. Axial Strain–Lateral Strain Model of Concrete

Equation (15) was derived by Teng et al. [23] by revising the relationship between the axial and hoop strains of FRP-restrained concrete.
ε c ε c o = 0.66 1 + 8 σ r f c o 1 + 0.75 ε l ε c o 0.7 e x p 7 ε l ε c o
Wang [33] considered the influence of concrete strength and d s / D for CCPFTs and proposed Equation (16) for the axial–lateral strain relationship.
ε c ε c o = 1.85 d s D + 2.14 f c o 30 1 + 8 σ r f c o 1 + 0.75 ε l ε c o 0.7 e x p 7 ε l ε c o
However, through analysis of her experimental data, the values of 1.85 d s D + 2.14 f c o 30 in Equation (16) were all distributed within the range of 0.65–0.74, which was similar to the coefficient 0.66 in Equation (15) proposed by Teng [23]. This suggests that the prediction results of the two equations are fairly similar. This is mainly because the high-strength steel tube was used in Wang’s test [33].

2.1.5. Generate the Load–Displacement Curve

For CCFFTs, the load–displacement relationship can be calculated by using the computed concrete stress–strain curve and the biaxial stress relationship of the steel tube, in conjunction with Equations (17) and (18).
N = σ c A c + σ s , a A s
U = ε c l
For CCPFTs, since there is concrete ring confined only by FRP and a concrete core with dual confinement from the FRP and steel tube, the axial load was obtained by Equation (19).
N = σ c , c A c + σ c , r A r + σ a , s
where σ c , c and A s are the axial stress and cross-sectional area of the concrete core, respectively, and σ c , r and A r are the axial stress and cross-sectional area of the concrete ring, respectively.

2.2. Design-Oriented Model for CCFFTs

The design model belongs to a closed-loop process, with simple calculation method that is convenient for guiding engineering design. The design model established by Zhang et al. [25] for CCFFTs has reasonable accuracy and has been recognized by peers. The stress–strain expression in the design model adopted the equation proposed by Wei et al. [22]. To achieve the closed-loop calculation, this design model incorporates both peak stress and strain, as well as ultimate stress and strain. These two sets of data are used to compute parameters for the curve’s first and second segments before the FRP fractures.
The calculation process for the design model is as follows:
① Calculate the peak stress and strain, and ultimate strength and strain based on the basic mechanical parameters of the concrete and the FRP confinement effect;
② Substitute the calculation results from step ① into the stress–strain equation proposed by Wei et al. [22] to calculate the key parameters that control the trend of the curve;
③ Based on step ②, input an axial strain and calculate the corresponding concrete stress through the stress–strain equation of Wei et al. [22]. Set a reasonable increment step, and the full stress–strain curve can be obtained through an iterative process;
④ When the FRP is fractured, Equation (1) is used instead of the above stress–strain equation for calculation.
So far, there has been no report on the design model of CCPFTs. The main issue is that the steel tube in CCPFTs separates the concrete into two parts, making it complicated to determine the strength of concrete. Especially when GAC is used, i.e., in CGCPFTs, the mechanical response becomes more complex. This paper will focus on solving this problem in the following chapters. It is worth noting that Zhang et al.’s design model [25] fully considered the curve after FRP fracture, which is the stage where the steel tube filled with concrete carried the load independently. In contrast, Teng et al.’s analysis model [23] took the FRP fracture as the terminal point. In the author’s previous experimental research [34] on CGCPFTs, it was found that significant local deformation had already occurred in the internal steel tube when the test was terminated after FRP fracture, due to the smaller diameter of the steel tube in the CGCPFT compared to CCFFTs. Therefore, the subsequent research in this paper also takes the FRP fracture as the termination point of the curve.

3. Proposal and Establishment of Analysis-Oriented Model of a CGCPFT

3.1. The Stress–Strain Relationship of Gangue Aggregate Concrete Restrained by FRP

3.1.1. Basic Description

As the foundation for the theoretical model research of CGCPFTs, it is particularly important to define the stress–strain response of FRP-confined gangue aggregate concrete (i.e., FC-GAC). In the author’s previous study [34] on the axial compression behavior of FC-GAC, the stress–strain relationship of the confined GAC closely resembled that of natural concrete, but with better hardening behavior. This is mainly because the coarse aggregate in GAC has a lower strength than ordinary crushed stone, causing the coarse aggregate to be crushed. Subsequently, its overall stiffness is relatively lower compared to ordinary concrete. Ultimately, when confined by FRP, GAC exhibits significant “volumetric compression behavior”.

3.1.2. Axial Stress–Strain Equation

Since the confined GAC exhibited similar patterns to ordinary concrete, the stress–strain equations still adopt the equations proposed by Popovics [31], and Equations (1) and (2).

3.1.3. Axial Strain–Lateral Strain Equation

Taking into account the “volumetric compression behavior”, the authors [34] proposed Equation (20) based on Teng’s equations [32].
ε c ε c o = 0.98 1 + 12 ρ k ρ ε 1 + 0.75 ε l ε c o 0.7 e x p 7 ε l ε c o
where ρ k and ρ ε represent the constraint stiffness ratio and the strain ratio, respectively, Teng [35] has provided their specific expressions as Equations (21) and (22), respectively.
ρ k = 2 E f r p t f c o / ε c o D
ρ ε = ε f r p , r u p ε c o
For the consistency of parameters in subsequent research, by adopting Equations (21) and (22), Equation (20) can be transformed into the expression form of Equation (23).
ε c ε c o = 0.98 1 + 12 σ l f c o 1 + 0.75 ε l ε c o 0.7 e x p 7 ε l ε c o
Equation (23) reflects the relationship between the axial strain and hoop strain of confined GAC, where the hoop strain is largely influenced by the confinement strength of FRP. Therefore, Equation (23) can effectively capture the interaction between FRP and GAC.

3.1.4. Ultimate Stress and Strain

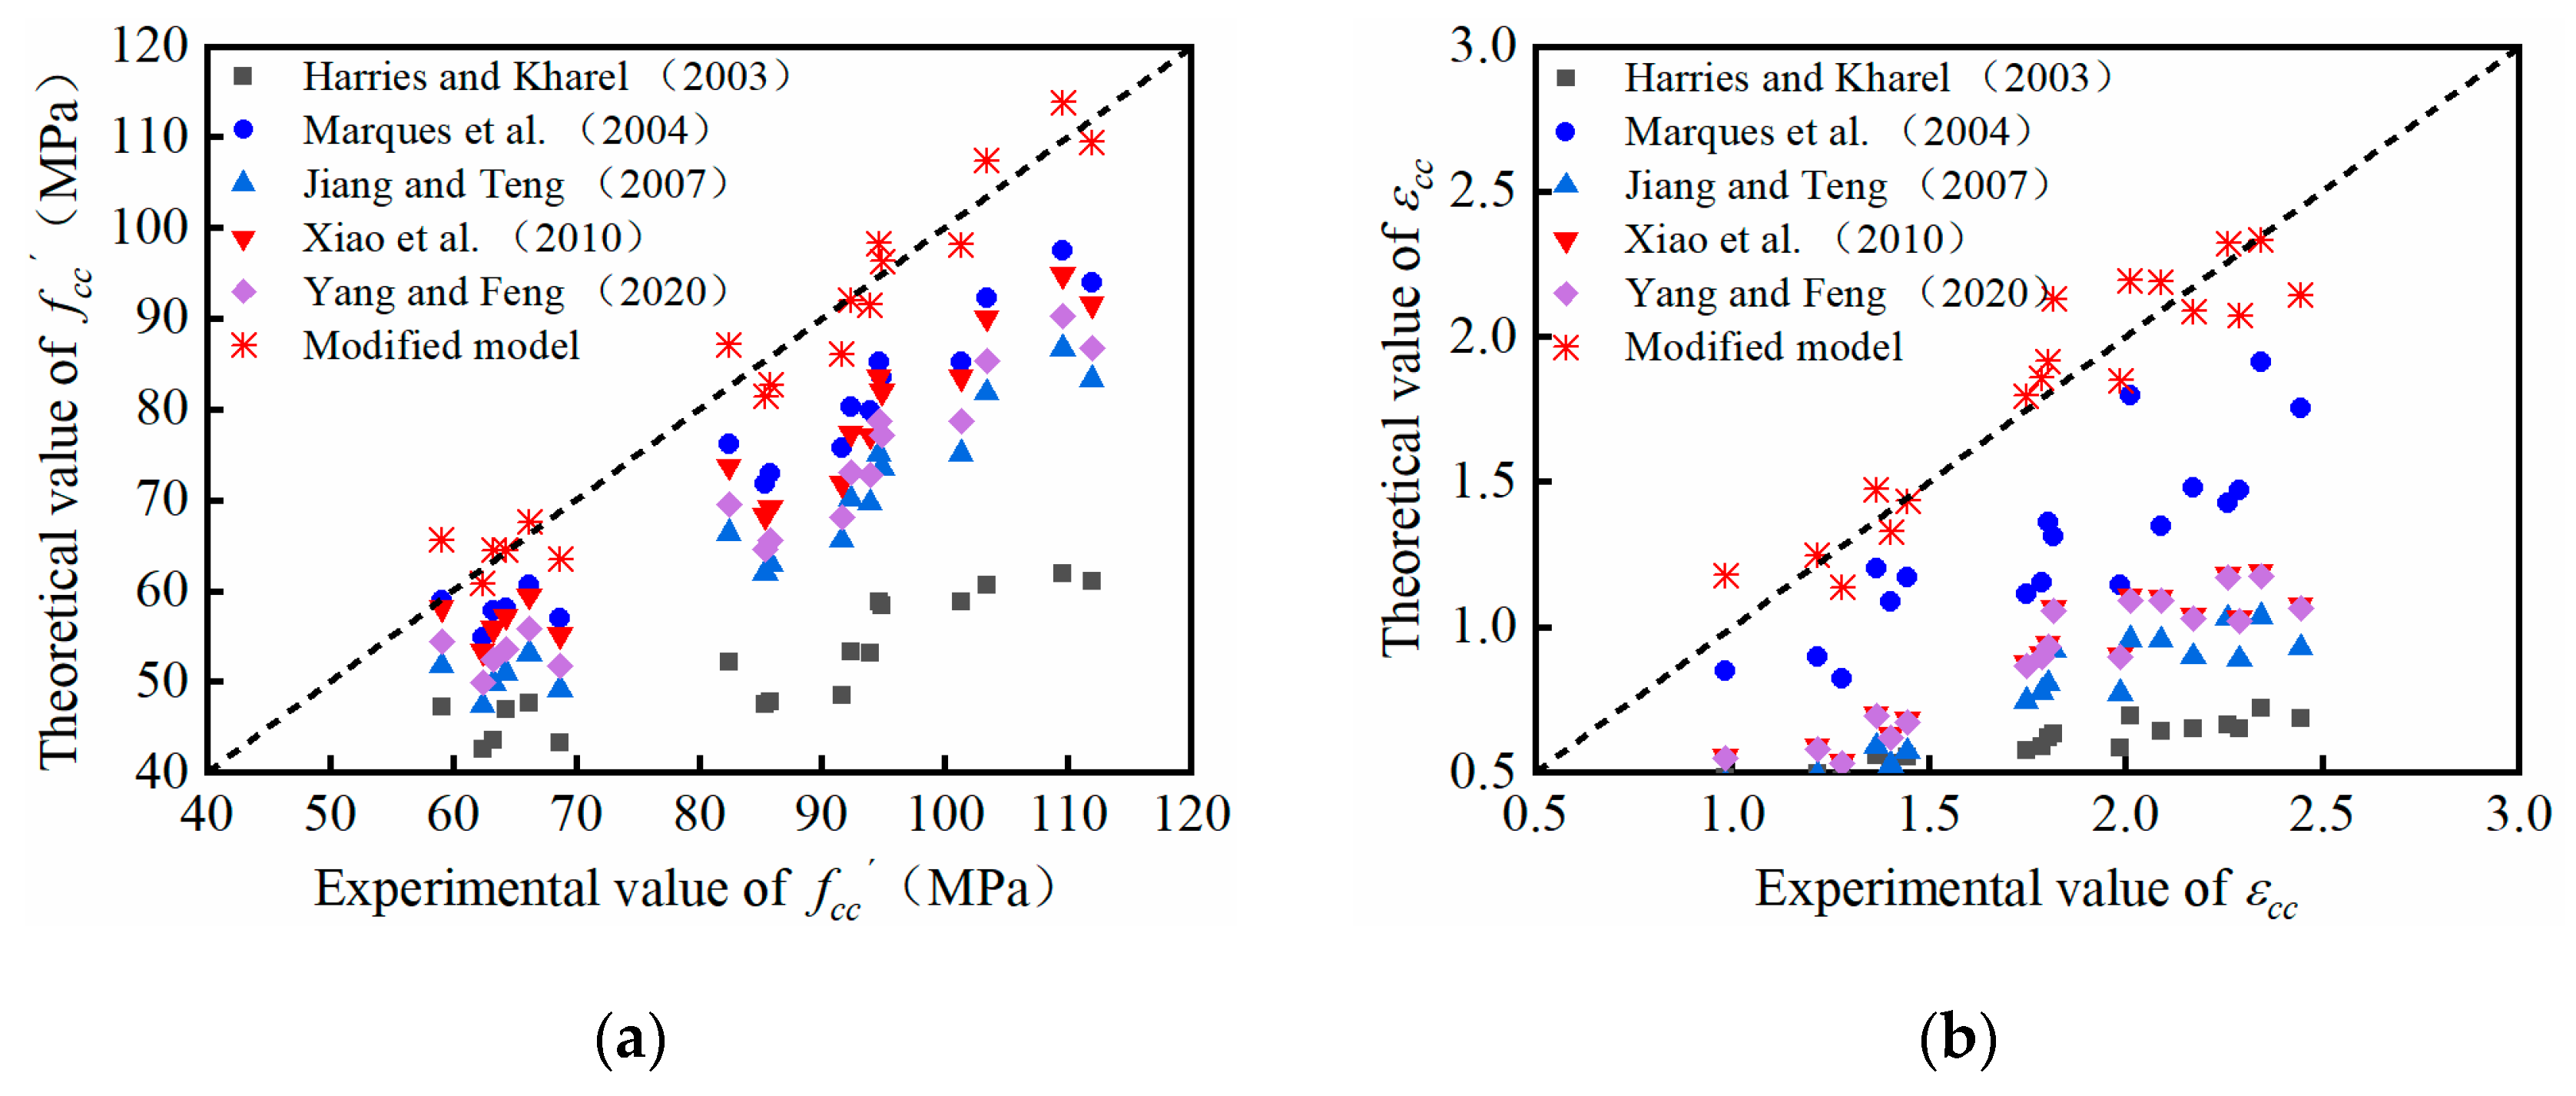
The existing 88 ultimate models of FRP-restrained concrete were evaluated by Ozbakkaloglu et al. [36], and the representative ultimate models are summarized in Table 1. Figure 2 illustrates the predicted results of the test data in Table 2 using the models in Table 1. The existing commonly used models underestimated the test results, and this underestimation is more pronounced for the peak strain. The main reason for this is the previously mentioned “volume compression” behavior of the confined GAC. Further analysis revealed that the predicted values of the models by Marques et al. [37], Xiao et al. [38], and Jiang and Teng [32] are relatively close to each other, with the former two models being closer to the test values, particularly in the model by Marques et al. [37] which shows a better response to the test values of peak strain. However, the ultimate strength model by Marques et al. [37] is more complex and difficult to achieve without dimensions of the experimental values. Therefore, this paper aims to modify the model by Xiao et al. [38] with the existing experimental data [34] to achieve precise prediction of the ultimate strength of FC-GAC.
The formulas for the ultimate stress and strain of FC-GAC were obtained as Equations (24) and (25), respectively.
f c c f c o = 1 + 4.43 σ l f c o 0.8
ε c c ε c o = 1 + 27.3 σ l f c o 0.8
Figure 2 demonstrates that Equations (24) and (25) are effective in estimating the ultimate stress and strain of GAC confined by FRP.

3.2. Discussion on Stress–Strain Model of GAC in CGCPFT

3.2.1. Bond Condition Assumption

Teng et al. [23] proposed the perfect bond condition for the CCFFT, assuming that the axial strain and lateral strain of the FRP, concrete, and steel pipe are all equal. However, for the CGCPFT studied in this paper, since the GAC ring and the GAC core are subjected to different confinement strengths (namely, the GAC ring is only confined by FRP, while the GAC core is dually restrained by both FRP and the steel pipe), it is unknown whether the perfect bond condition can be used for the hoop strain of the GAC ring and the GAC core.
Figure 3 is from the author’s previous experimental research [41]. The naming convention for the specimens is exemplified by M111F1-1, where “M” represents the unconfined GAC strength of 37.5 MPa, the specification ‘111’ denotes a steel tube with an external diameter of 111 mm, “F1” indicates one layer of CFRP, and the last Arabic numeral represents the first of two identical specimens.
The confining stress of the FRP was calculated using Equation (6), and the confining stress of the steel tube was calculated using Equation (26).
σ l , s = 2 σ s , h t s D s 2 t s
As shown in Figure 3, in the loading phase, the significant confining stress from the steel tube compared to the FRP is considerable and cannot be neglected. The reason primarily lies in the fact that the steel tube and the CFRP tube discussed in this study exhibit comparable elastic modulus values, and the steel tube features a lower diameter-to-thickness ratio (The thickness of one layer of CFRP is merely 0.167 mm). Therefore, during the early phase of loading, the confining stress in the steel tube increases more rapidly. After steel tube reaching the yield stress, it enters plastic flow stage, and the confining stress no longer increases (similarly to active confinement). Nevertheless, the confinement stress in the horizontal stage is still not negligible compared to the FRP. As a result, for a specific axial strain, the GAC core will exhibit a smaller lateral strain, meaning that the GAC core has a greater confinement stiffness.
Therefore, the following boundary condition assumptions are proposed for CCPFT:
① The axial strains of the steel tube, GAC ring, and GAC core are consistent, and the axial stiffness of the FRP tube is ignored;
② The lateral strains of the FRP and GAC ring are equivalent, while those of the steel tube and GAC core are also be considered constant. Both the GAC ring and the GAC core are under uniform confinement;
③ The lateral strains in the steel tube and GAC core are lower compared to FRP and GAC ring due to the dual confinement.

3.2.2. Stress–Strain Model of GAC Ring

In Wang’s study [33] on CCPFTs, it was assumed that the concrete ring was confined solely by the FRP and its mechanical performance aligned with the behavior of concrete confined by FRP. However, the study employed high-strength steel tube in the CCPFT, which provided significantly higher axial stress than lateral confinement stress, resulting in a minor influence on the overall confinement stiffness. Figure 4 presents the stress–strain curves of the GAC ring calculated using Equation (23) and the test axial strain–hoop strain curve from the author’s previous experimental study [41]. Their stress–strain basic equation, ultimate strength model, and ultimate strain model are all consistent, which are given by Equations (1), (24) and (25), respectively.
As shown in Figure 4, except for the two groups of specimens L74F1 and L111F1, the stress–strain curves of the GAC ring determined by Equation (23) overestimate the results obtained from the test axial strain–hoop strain curve. This is mainly due to the higher overall confinement stiffness of CGCPFTs, resulting in less lateral expansion compared to FC-GAC. Despite this, the stress–strain curves calculated using the Equation (23) still show good prediction accuracy. Therefore, for the uniformity of the calculation, Equation (23) is used to predict the expansion behavior of the GAC ring in the CGCPFT. Furthermore, it is feasible to use the model of the FC-GAC from the previous section (Equations (1), (2) and (23)–(25)) to predict the stress–strain behavior of the GAC ring in the CGCPFT.

3.2.3. Stress–Strain Model of GAC Core

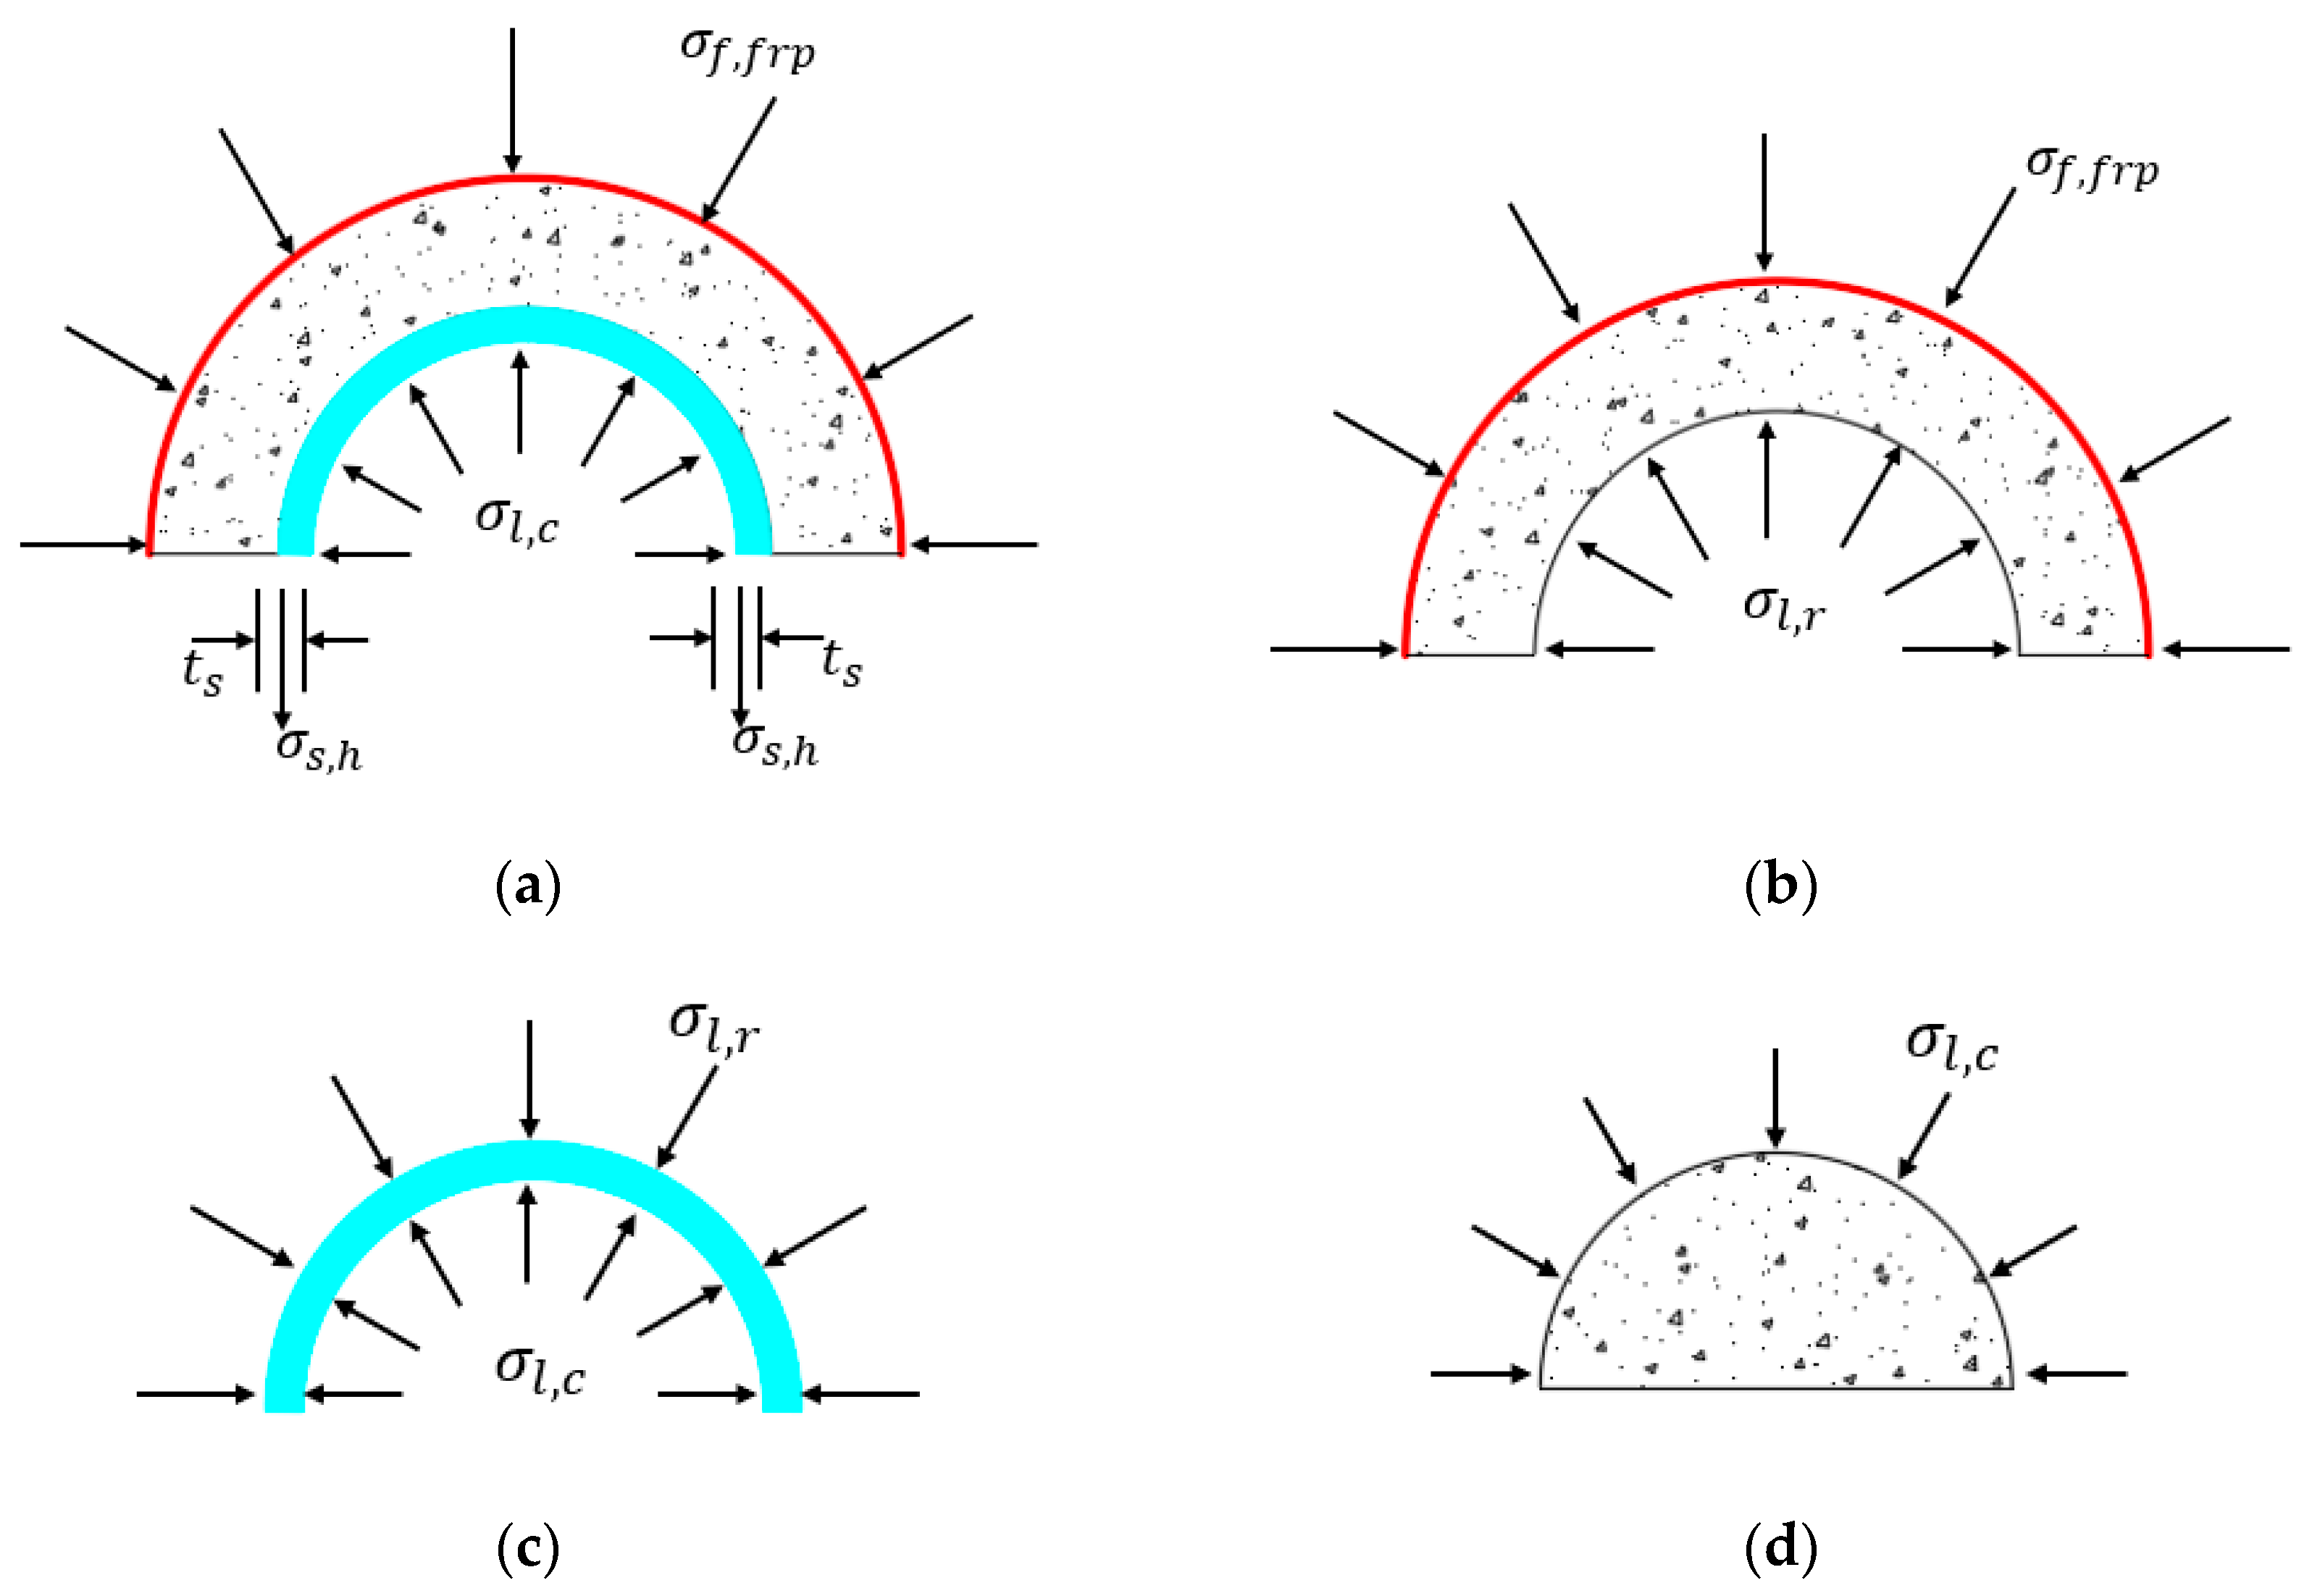
Figure 5 illustrates the schematic diagram of the static equilibrium condition for the CGCPFT. As illustrated in Figure 5b, the GAC ring is primarily subjected σ l , f r p from the FRP and the stress σ l , r transmitted to the GAC ring by the steel tube. Due to the low tensile strength and modulus of GAC, the hoop stress of the GAC ring can be neglected. Furthermore, in this paper, it is assumed that the GAC ring is subjected to uniform confinement. Therefore, σ l , f r p and σ l , r are in the relationship of action and reaction force, and σ l , f r p = σ l , r when the direction of stress is not considered. As illustrated in Figure 5c, the built-in steel tube simultaneously experiences confinement stress σ l , r provided by the GAC ring and stress σ l , c transmitted by the GAC core. Since the steel tube is an isotropic material, it experiences significant hoop stress during the loading process (Figure 5a). As a result, σ l , r and σ l , c are no longer in a simple relationship of action and reaction force. Based on the static equilibrium condition of the cross-section, Equation (27) can be derived.
σ l , c D s 2 t s = = σ l , r D s 2 t s + 2 σ s , h t s
By substituting σ l , f r p = σ l , r into Equation (27), the confinement stress experienced by the GAC core in the CGCPFT can be obtained, as shown in Equation (28).
σ l , c = σ l , f r p D s 2 t s + 2 σ s , h t s D s 2 t s
It is important to mention that the hoop constraint stress σ s , h is positive in the above equation. In summary, the ultimate strength, ultimate strain, and axial strain–hoop strain of the GAC core can be calculated by Equations (29)–(31).
f c c f c o = 1 + 4.43 σ l , c f c o 0.8
ε c c , c ε c o = 1 + 27.3 σ l , c f c o 0.8
ε c ε c o = 0.98 1 + 12 σ l , c f c o 1 + 0.75 ε l ε c o 0.7 e x p 7 ε l ε c o
where f c c , c and ε c c , c represent the ultimate strength and corresponding strain of the GAC core, respectively, σ l , c is the confinement stress experienced by the GAC core.

3.3. Generate Axial Load–Displacement Curve

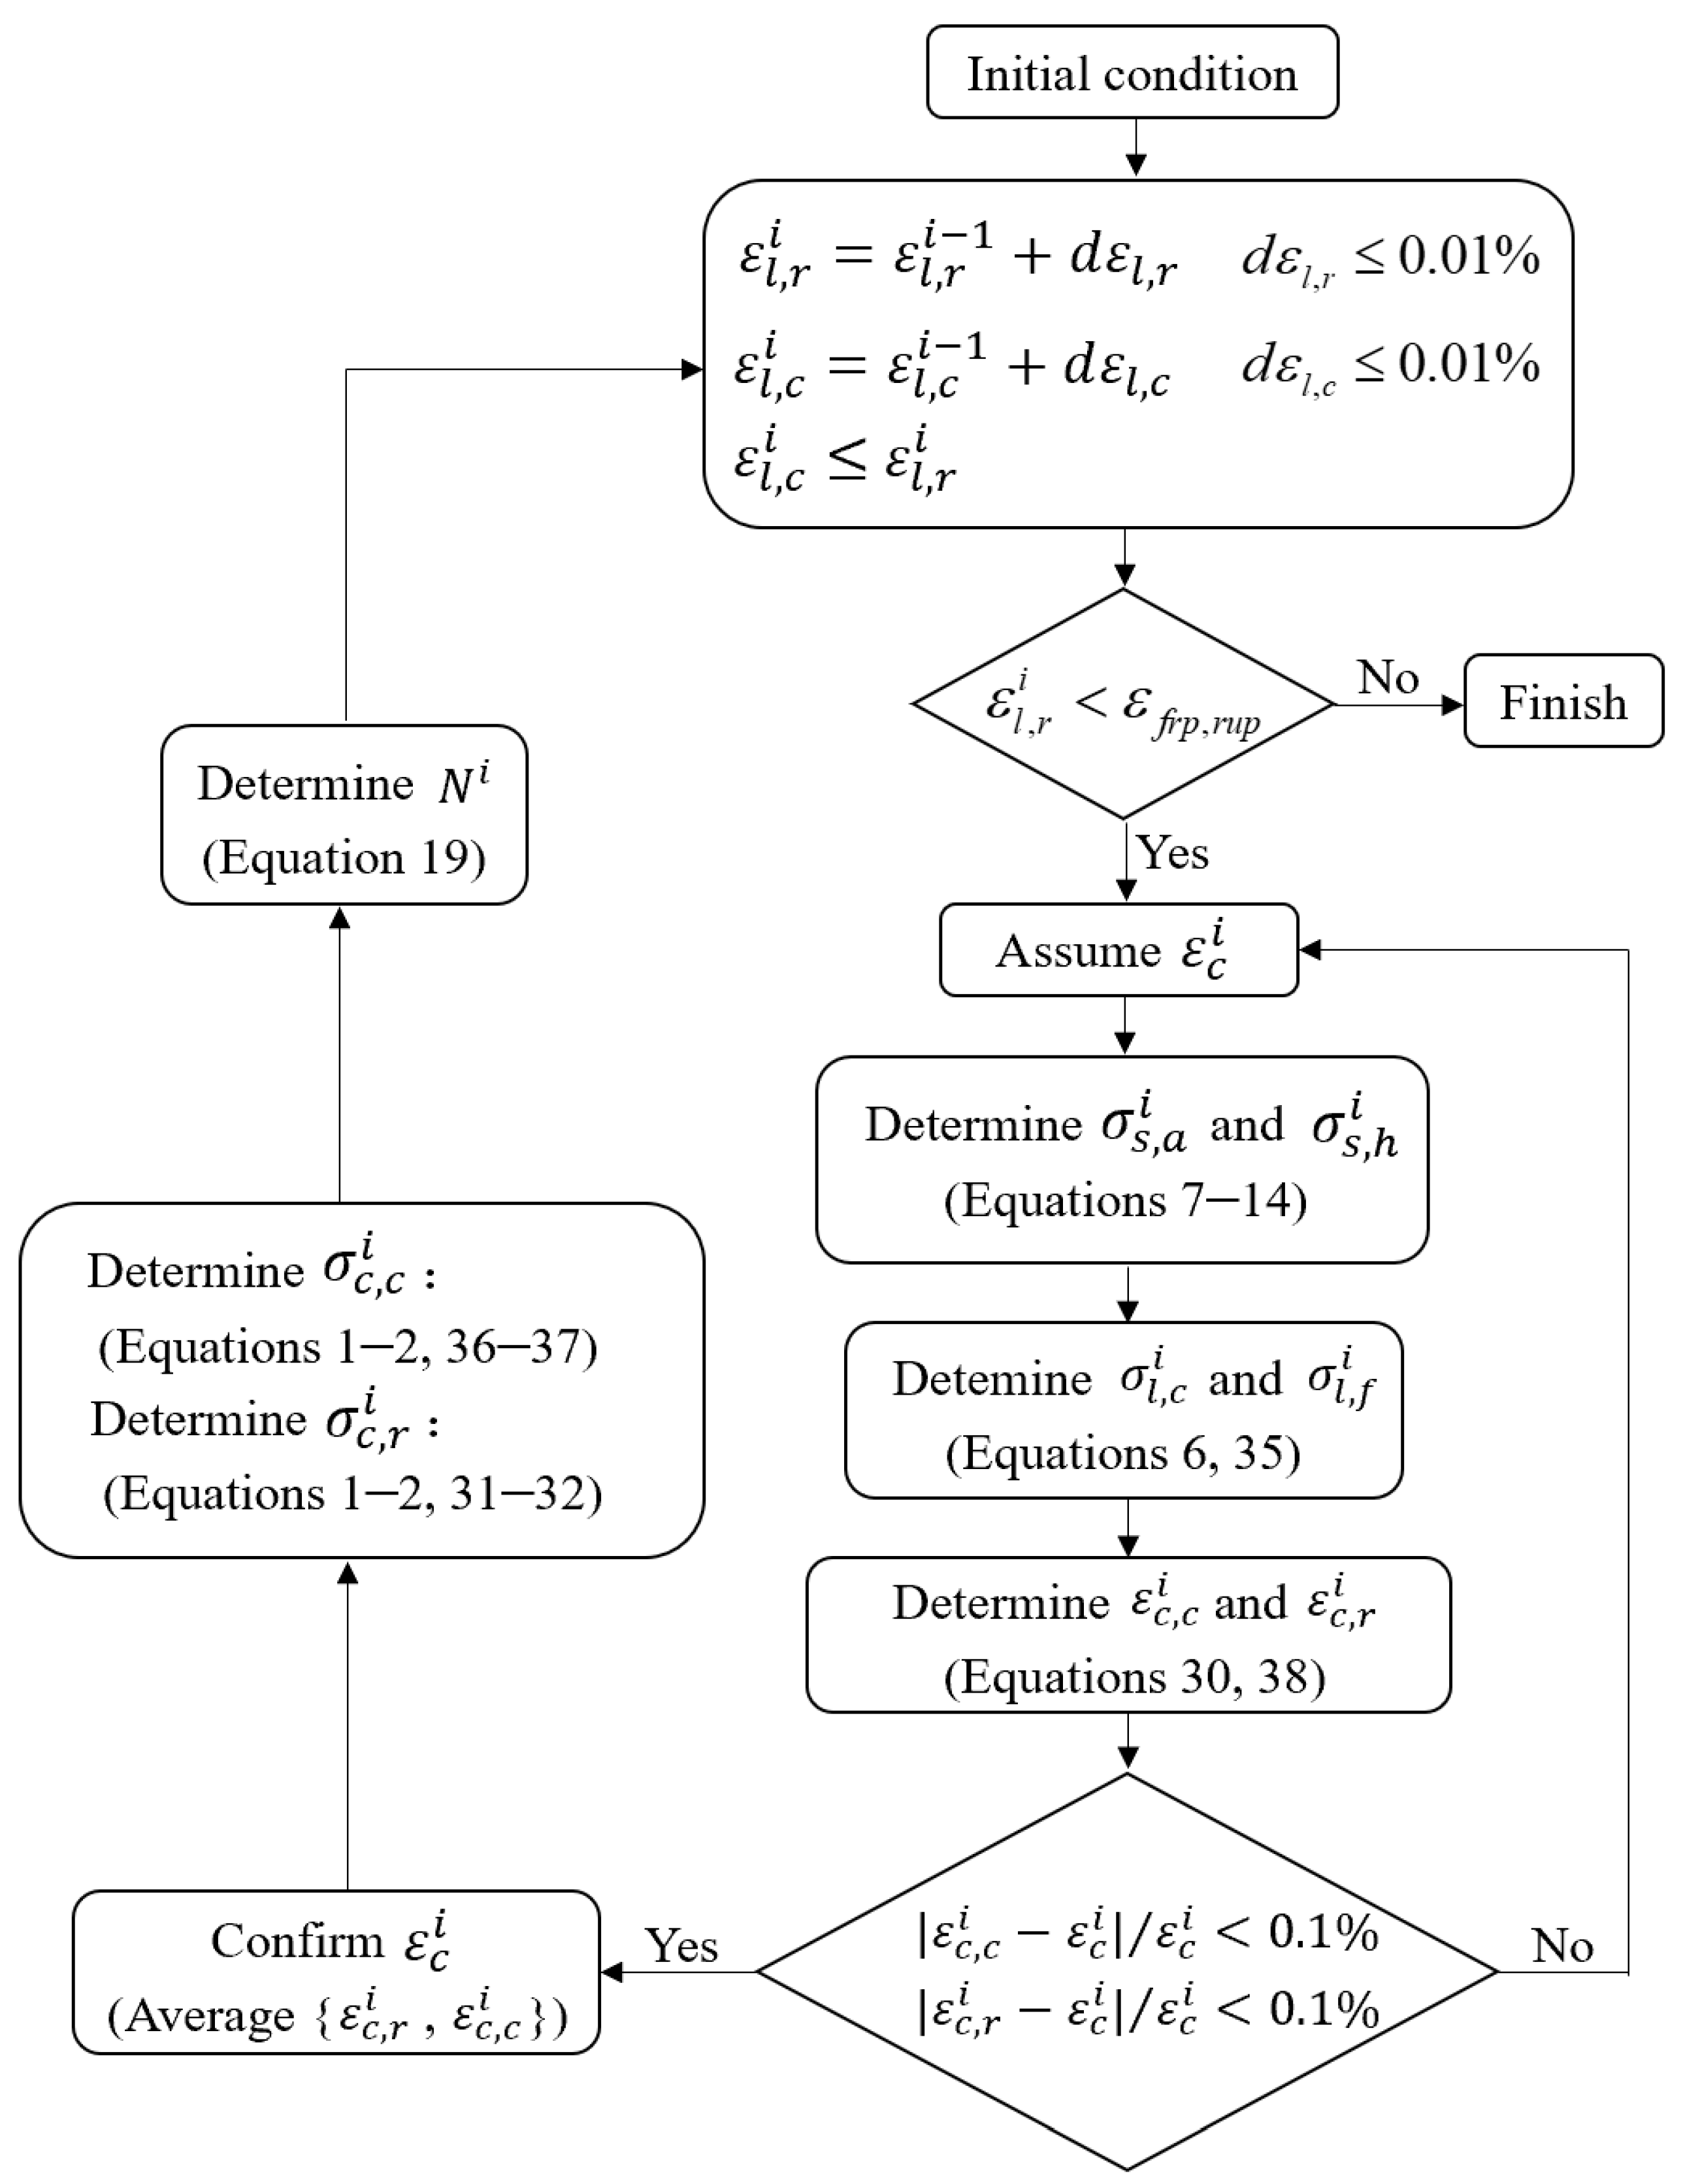
The assumptions of the boundary conditions mentioned above enable the incremental iterative process shown in Figure 6 to be realized. It is important to note that, according to assumptions ② and ③, the initial condition of the incremental iterative process must provide the hoop strains for the GAC core and GAC ring, respectively, and these conditions need to satisfy the assumptions stated in Section 3.2.1. Based on the assumption of boundary condition ①, the values of ε c , c i and ε c , r i calculated through Equations (23) and (31), respectively, should be equal. However, due to the initial condition assumption, the two values may be quite close. Therefore, this paper sets the criterion that when the calculated values of ε c , c i and ε c , r i deviate from the assumed value by no more than 0.1% simultaneously, they are considered to meet the requirement and their average value is taken as the final calculated axial strain ε c i . The applicability of this model for GAC strengths outside the range of 30–50 MPa has yet to be verified. Future test data can be used to refine the parameters of this model for the ultimate strength and strain of confined GAC, thereby expanding the application range of the model. The ds/D value is limited to the range of 0 to 1, exclusive of 0 and 1. Additionally, if steel tubes with a yield strength greater than 400 MPa are used, the applicability of this model needs to be further determined.

4. Propose the Design-Oriented Model of CGCPFT

4.1. General

Unlike the analytical model, the design-oriented model is characterized by a closed-loop calculation process without incremental iteration, allowing for a more straightforward determination of the stress–-strain curve, which facilitates engineering design. However, in the case of CCPFTs or CGCPFTs that use GAC, the bidirectional stress in the steel tube during the loading process exhibits typical elastic-plastic behavior, making it challenging to depict the mechanical properties of CGCPFTs using closed-loop formulas. Therefore, addressing the contribution of the built-in steel tube is crucial to developing a design model for the CGCPFT.

4.2. Ultimate Strength

The axial load-bearing capacity of a CGCPFT is primarily provided by the GAC ring, the GAC core under dual confinement, and the axial mechanical component of the steel tube. Currently, there are few reports on methods for determining the axial bearing capacity of CGCPFTs. However, Zhang and Wei [25] summarized the calculation methods for the ultimate strength of a CCFFT, as seen in Table 3.
In Table 3, ξ s and ξ f r p are the confinement contribution index of the steel tube and the FRP in the composite column, respectively. Zhang and Wei [25] uniformly defined them as Equations (32) and (33).
ξ s = A s f y A c f c o
ξ f r p = A f r p f f r p A c f c o
When the FRP only provides hoop confinement and its axial stiffness is not considered, Equation (33) can be expressed in the form of Equation (34).
ξ f r p = 2 E f r p t f r p ξ f r p , r u p f c o D
where A s , A f r p , and A c are the cross-sectional areas of the steel tube, FRP tube, and concrete, respectively; A y and A f r p are the yield strength of the steel tube and the hoop confinement strength of the FRP tube, respectively.
None of the models in Table 3 consider the axial stress contribution of the steel tube separately, but instead use the confinement factor to characterize the role of the steel pipe. Therefore, for CGCPFTs composed of different materials, there is the potential to evaluate the axial bearing capacity using a strength indicator. Figure 7 shows the predicted results of the CGCPFT test data in reference [41] using the models from Table 3.
As the model proposed by Dong et al. [28] needs to consider the influence of lateral confinement stiffness and is relatively complex to calculate, its calculation results are not included in Figure 7. As shown in Figure 7, compared to the model of Tao et al. [16], the predicted values of the models by Wei et al. [22], Lu et al. [18], and Che et al. [42] are closer to the experimental values, but there is still considerable dispersion. This is mainly because the three models have a similar form. Although the steel tube’s constraint contribution index ξs can reflect the impact of the steel tube’s diameter-to-thickness ratio, since the relative diameter ratio of the steel tube to the FRP tube is 1 (i.e., ds/D = 1), it is unable to accurately describe the impact brought on by the change in ds/D.
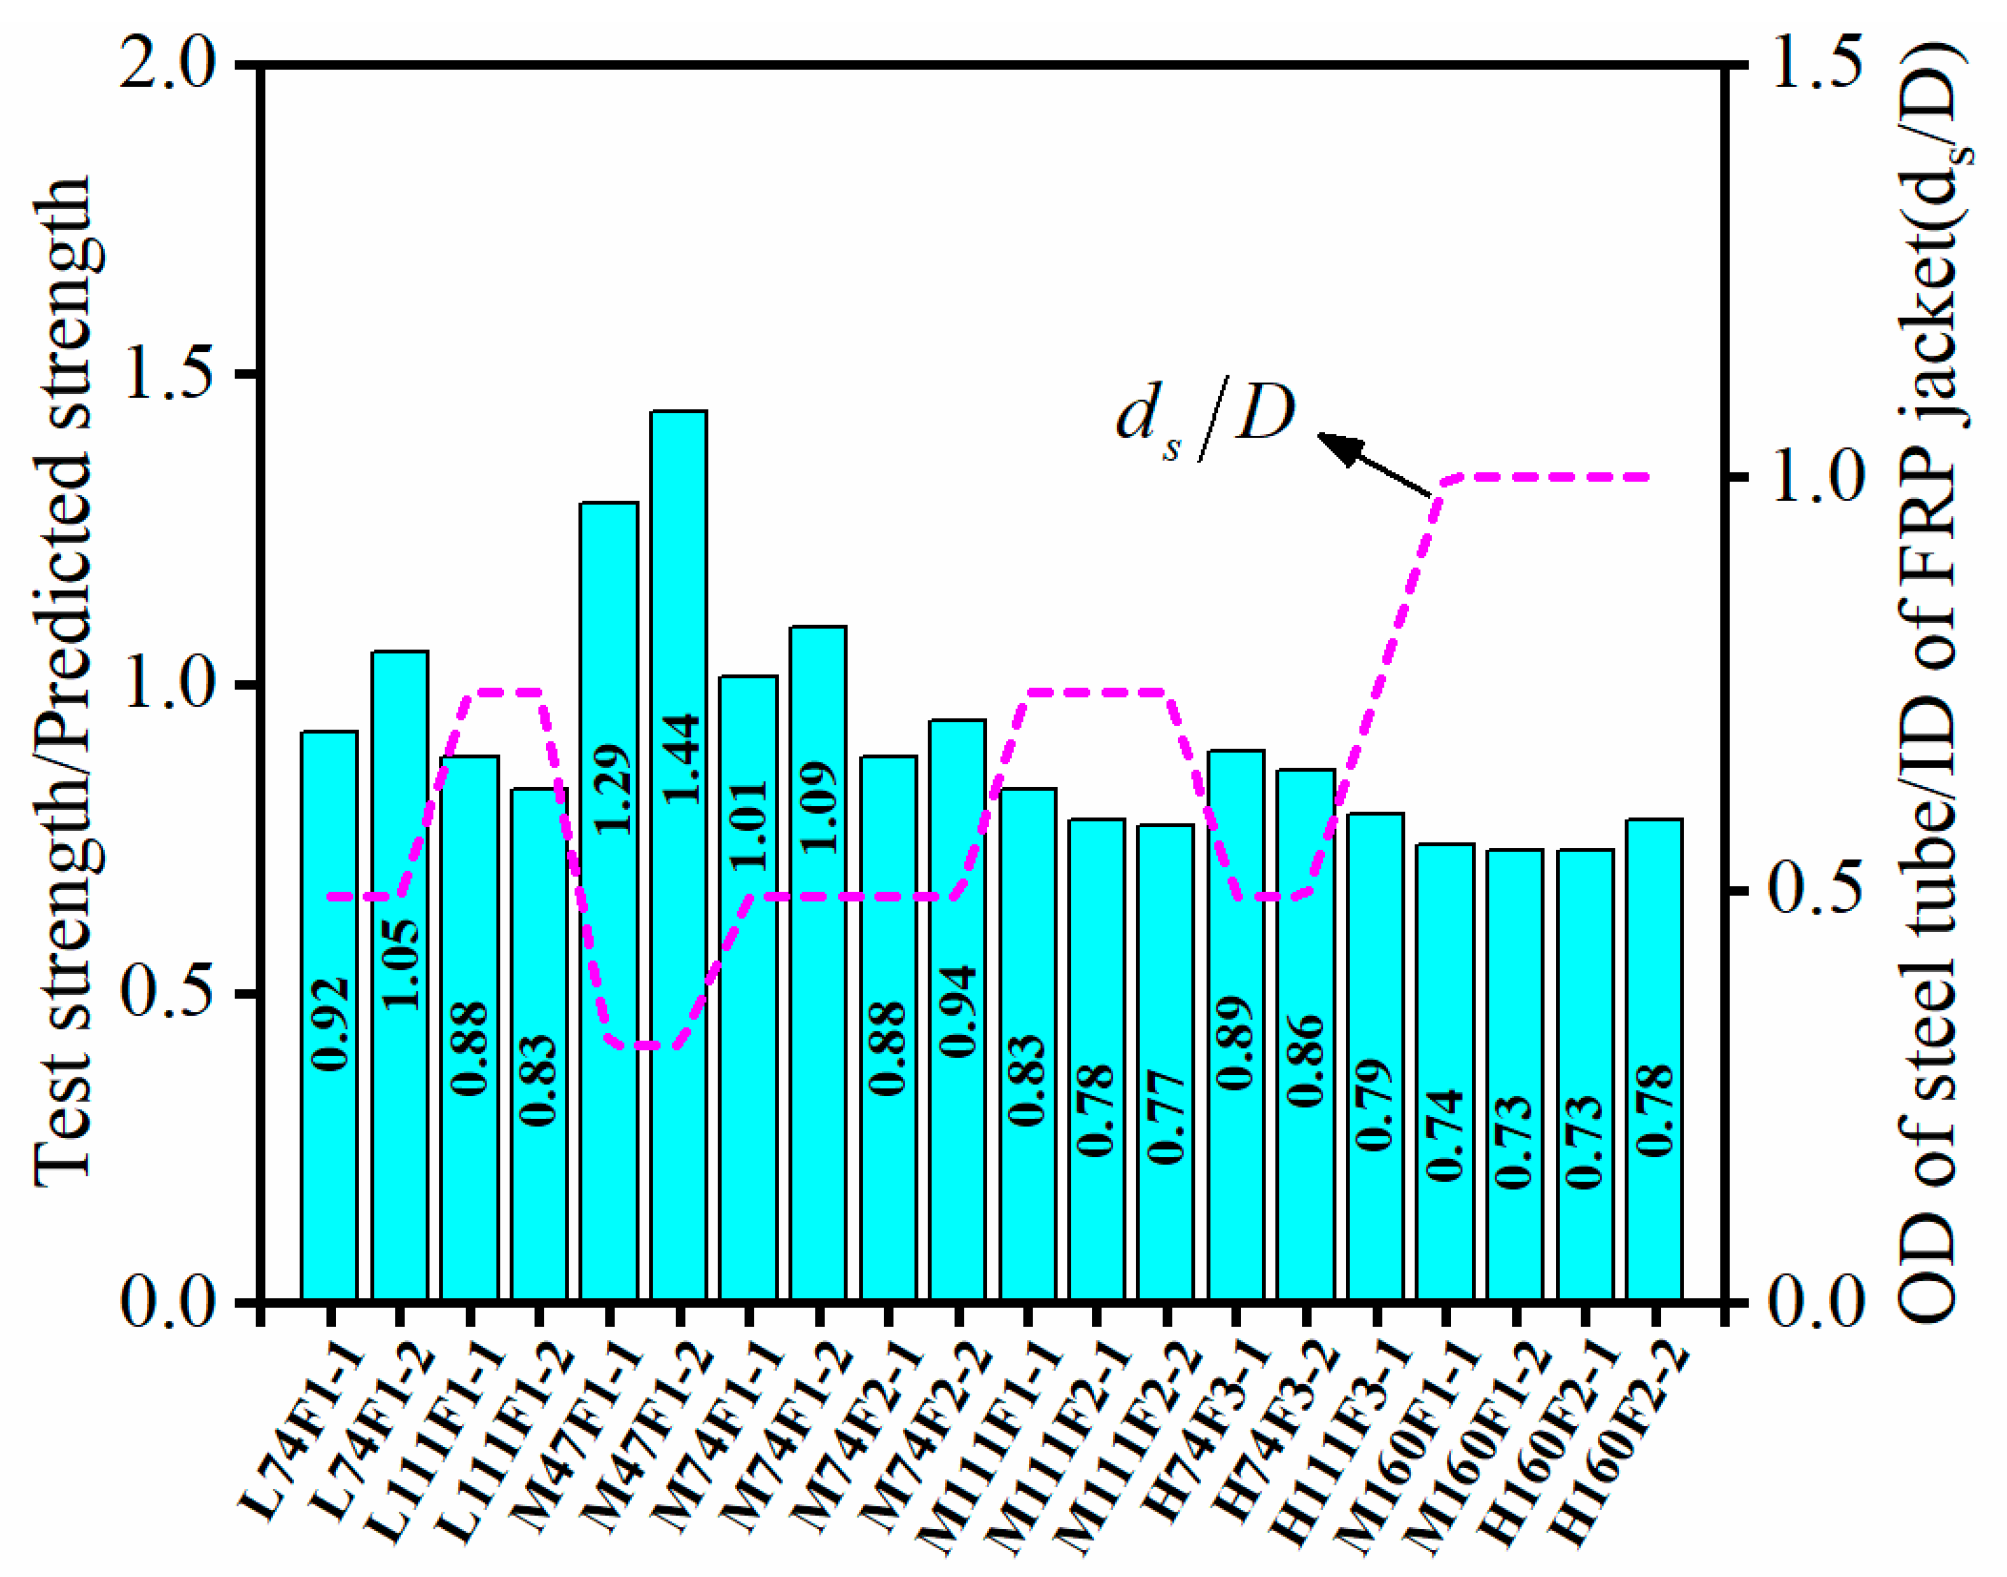
To investigate the influence of ds/D, Figure 8 depicts the analytical results of the model established by Che et al. [42], with the data used for the analysis sourced from reference [38]. When the ds/D of the test data [41] is 1 (specimens M160F1, H160F2), the predicted values are relatively stable (with predicted/experimental values ranging from 0.729 to 0.783), but they generally underestimate the experimental values [41]. This is mainly because, with the matching level of plain concrete strength and the confinement level, the strength increase ratio of GAC exceeds that of natural aggregate concrete, as discussed in Section 3.1.
As shown in Figure 8, when ds/D < 1, which is the case for CGCPFTs, ds/D is inversely proportional to the ratio of the test values to the predicted values. This means that as ds/D increases, the test values are continuously smaller compared to the predicted values and as ds/D decreases, the test values are continuously larger compared to the predicted values. This indicates that there is a clear pattern in the influence of ds/D on the accuracy of prediction.
From the above analysis, it is evident that the existing CCFFT strength models have difficulty in accurately predicting the ultimate strength of the CGCPFT. The primary causes can be attributed to the following two factors: (a) the mechanical properties of the confined GAC differ from those of the natural aggregate concrete, and (b) the existing strength models do not consider the influence of ds/D. This study assumes the following mechanical model to investigate the influence of these variables on the ultimate strength:
① The GAC ring is solely restrained by the FRP tube, and its mechanical behavior is consistent with that of FC-GAC (i.e., FRP-confined gangue aggregate concrete);
② The GAC core is concurrently restricted by both the FRP and the steel tubes, neglecting the effect of the confinement stiffness of the GAC core;
③ Both the GAC ring and the GAC core are assumed to have an ideally uniform confinement;
④ Drawing from assumptions ①–③, the axial load-carrying capacity of the GAC core is divided into two components: the axial load-carrying capacity of the GAC core confined by FRP and the hoop effect provided by the steel tube (convert the contribution of the steel tube entirely into the hoop effect) to the GAC core, as detailed in Figure 9.
Based on the above assumptions, the ultimate strength of the GAC in the decomposed FC-GAC section can be directly calculated using Equation (35).
f c u , c f c o = 1 + 4.43 ξ f r p 0.8
where f c u , c represents the ultimate strength of the GAC confined by FRP in Figure 9.
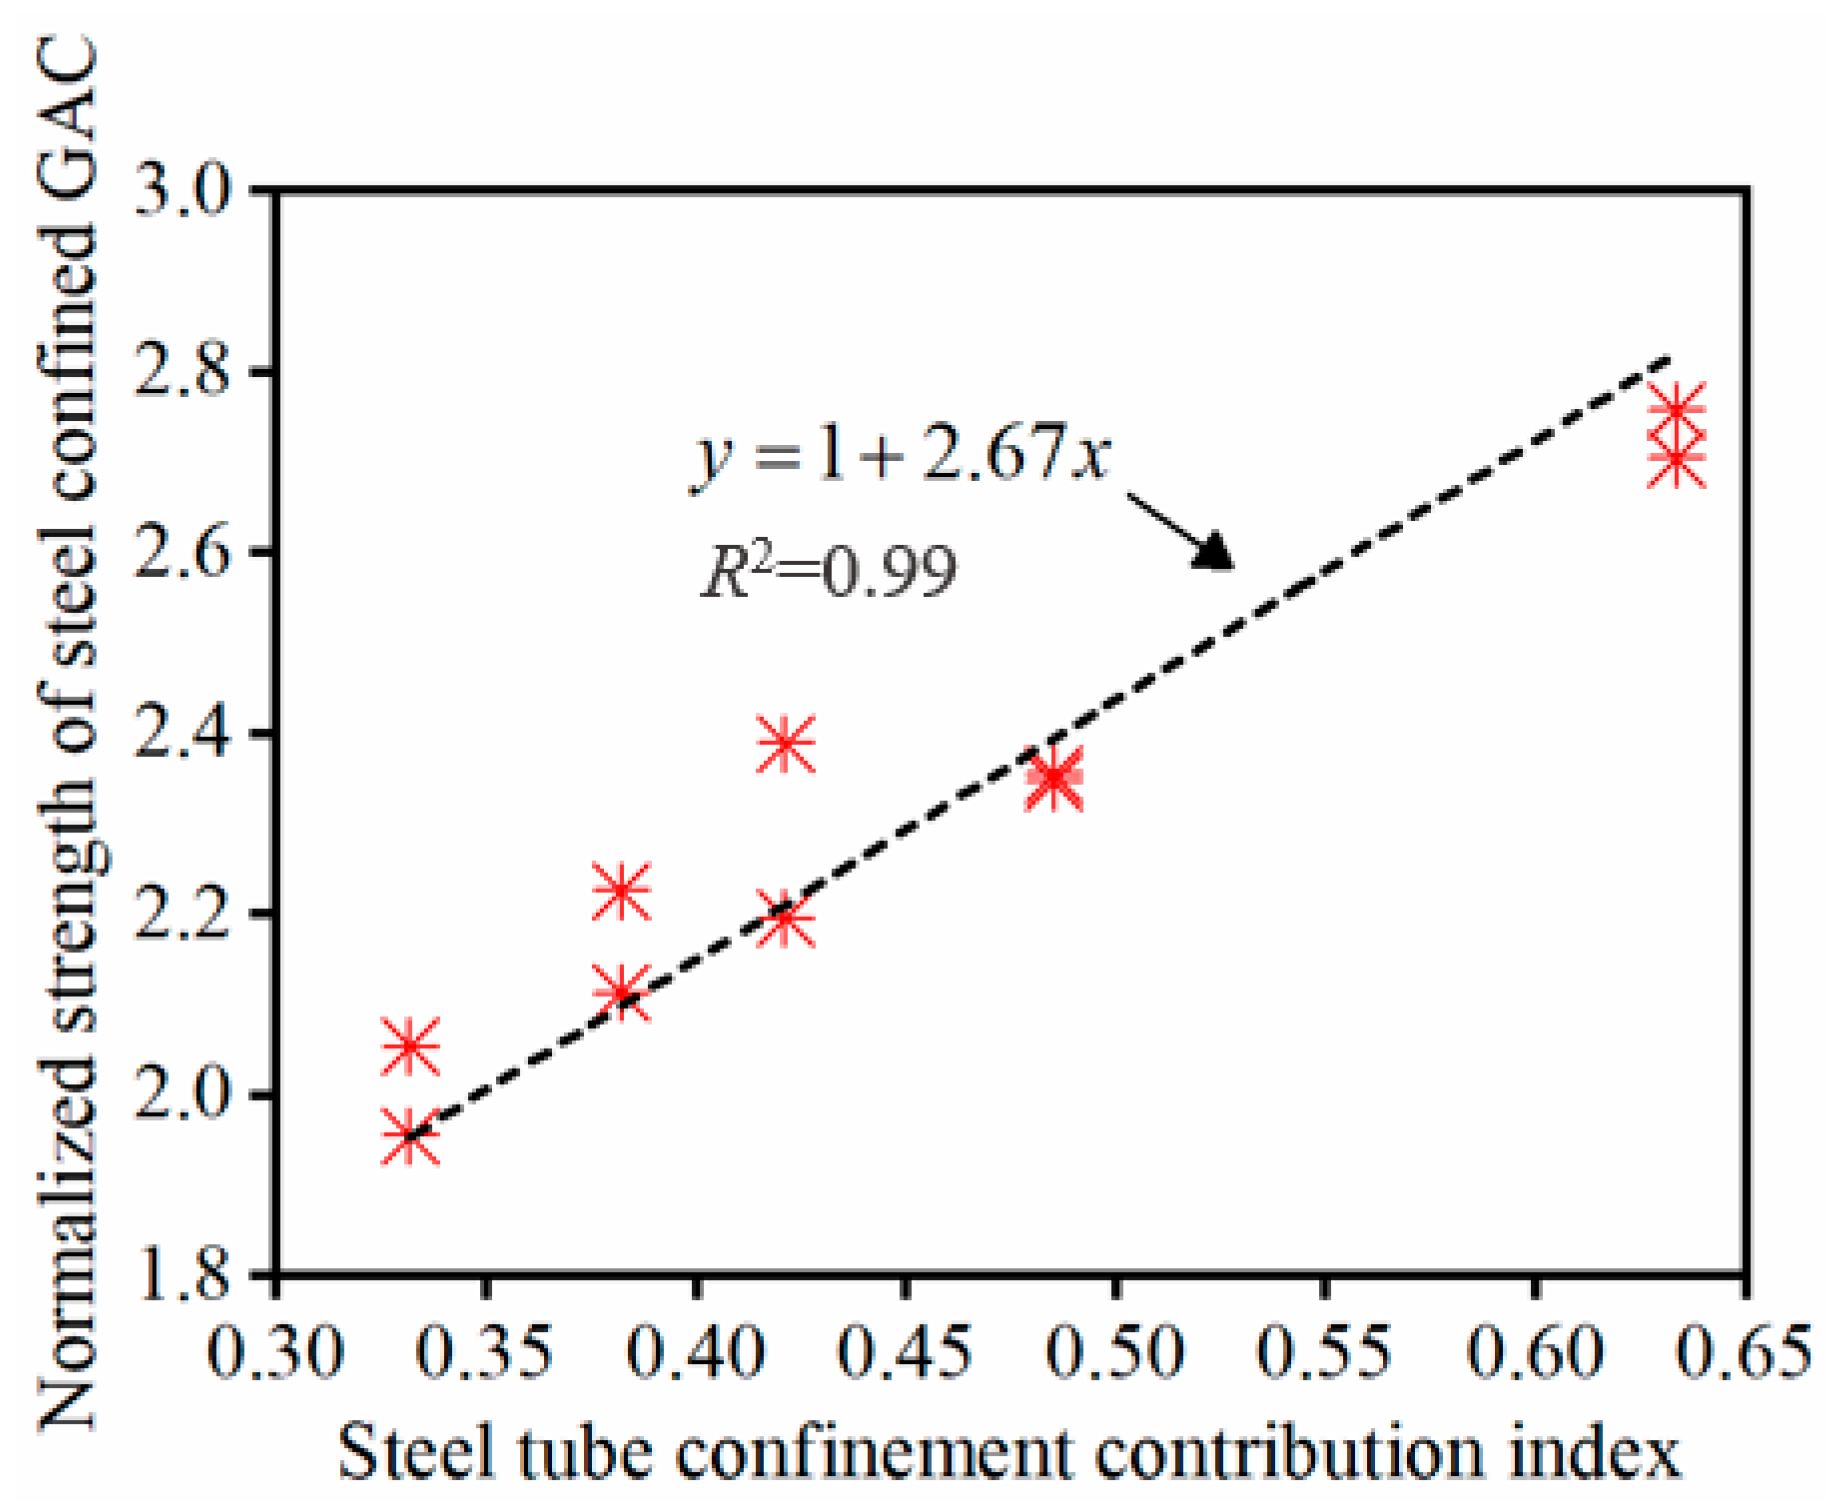
The decomposed hoop effect provided by the steel tube on the GAC core (as shown in Figure 9) can be obtained using the hoop coefficient method. Table 4 presents the key parameters of steel tube-confined GAC from the author’s previous experiments, which belong to the same batch of tests in reference [41] and adopt the same test method. Among them, the restriction contribution index ξs of the steel tube was calculated using Equation (32).
The normalized strength of GAC confined by a steel tube can be expressed in the form of Equation (36).
f c u , s f c o = P c u , s A c , c f c o
where P c u , s represents the load-carrying capacity of GAC restrained by a steel tube and f c u , s represents the strength of GAC confined by a steel tube.
Figure 10 illustrates the regression analysis of the relationship between f c u , s / f c o and ξ s using the data from Table 4. Therefore, Equation (36) can be rewritten as Equation (37) using the steel tube contribution index ξ s .
P c u , s = A c , c f c o ( 1 + 2.67 ξ s )
It is noteworthy that according to the technical specification for concrete-filled steel tube structures [43] in China, when the steel tube contribution index ξ s < 1 / α 1 2 , P c u , s is linearly related to ξ s . Here, α is an index related to the strength grade of the concrete, and when f c o C 50 , the value of α is taken as 2. That is, when ξ s 1 , P c u , s is linearly related to ξ s . Since there is currently no code that defines the relationship between the strength grade of GAC and coefficient α , this paper directly adopts the value of α from the code [43]. In this paper, the ξ s for all CGCPFTs is less than 1 [41], therefore the linear relationship in Equation (37) meets the requirements of the existing code [43]. However, further research is needed for the case of f c o > C 50 .
In summary, the axial load Pcu of the CGCPFT can be calculated using Equation (38).
P c u = A c f c u , c + P c u , s A c , c f c o = A c f c o + 4.43 ξ f r p 0.8 A c f c o + 2.67 ξ s A c , c f c o
Subsequently, the formula for calculating its ultimate strength can be defined using Equation (39).
f c u f c o = 1 + 4.43 ξ f r p 0.8 + 2.67 ξ s A c , c A c
where A c , c / A c is the ratio of the cross-sectional area of the GAC core to the total cross-sectional area of the CGCPFT, it can be replaced by Equation (40).
A c , c / A c = π t s 2 4 / π D 2 4 = d s D 2
The ultimate strength model of a CGCPFT that can reflect the different influence of ds/D is determined by Formula (41).
f c u f c o = 1 + 4.43 ξ f r p 0.8 + 2.67 ξ s d s D 2
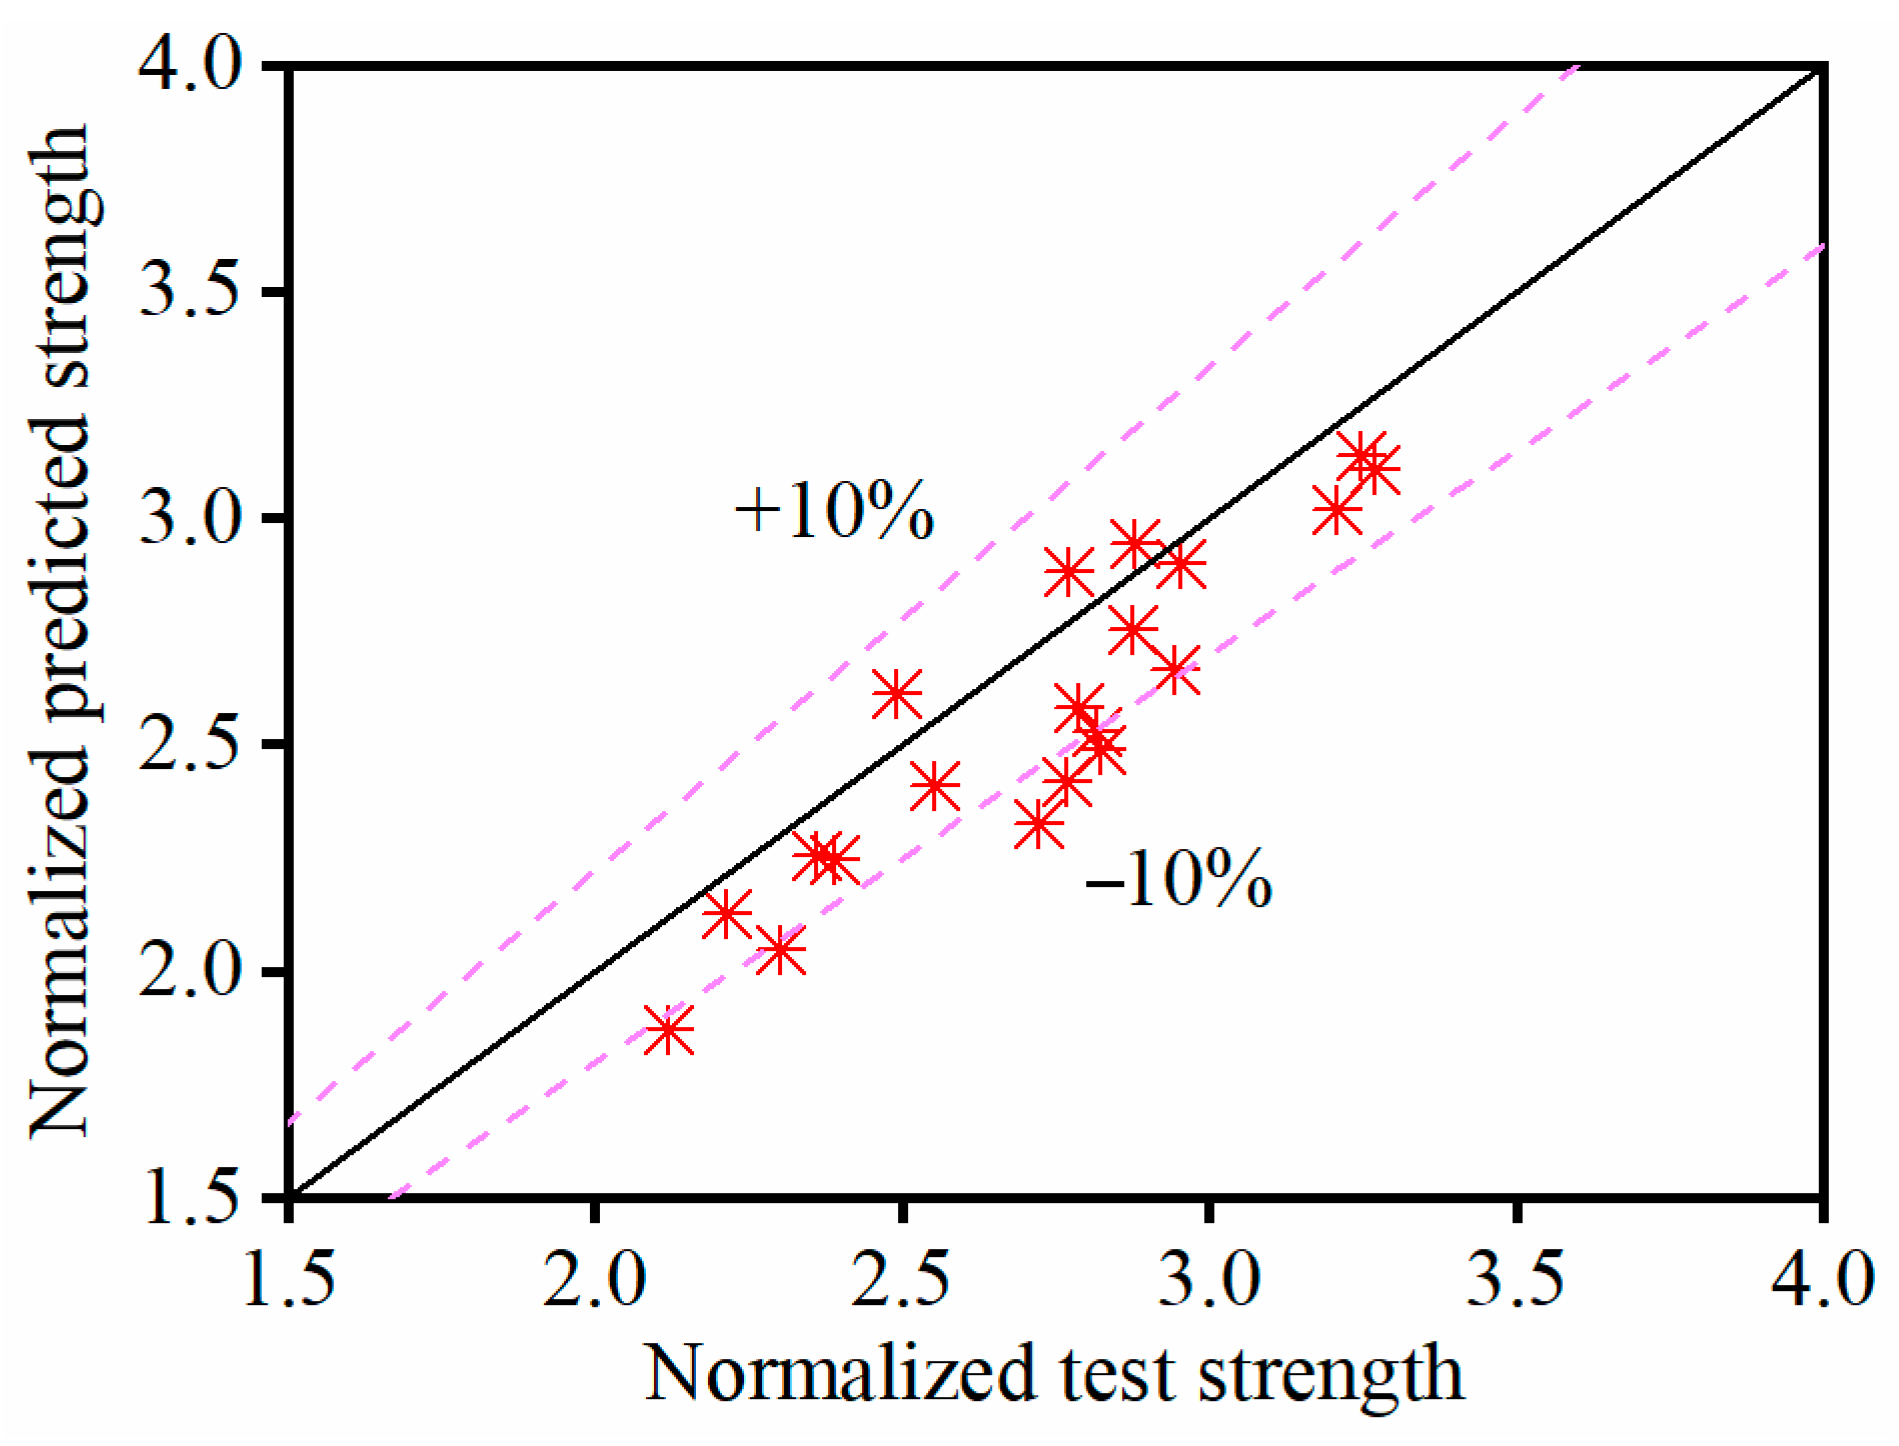
As depicted in Figure 11, the predicted values calculated using Equation (41) are relatively close to the experimental values [41]. It is worth noting that due to the lack of peer test data, when the steel tube confinement contribution index ξ s 1 , P c u , s and ξ s in Equation (37) may not yet follow a linear relationship, which implies that the linear expression of 2.67 ξ s φ 2 in Equation (41) may need to be revised.

4.3. Ultimate Strain

In the author’s previous experimental study [41], it was found that the built-in steel tube could enhance ductility; hence, the influence of the steel tube must be incorporated into the ultimate strain formulation. For the ultimate strain of CCFFTs studied by Zhang and Wei [25], they directly applied the ultimate strain model corresponding to FRP-restrained concrete to calculate the influence of FRP on concrete, while the effect of the steel tube was realized through the confinement contribution index ξ s of the steel tube. Similarly, in this paper, the ultimate strain model (Equation (25)) of FC-GAC in Section 3.1.4 is adopted to describe the influence of FRP on the ultimate strain of GAC. As for the influence of the steel tubes, two parameters are simultaneously introduced to achieve this: the confinement contribution index ξ s and the relative diameter ratio ds/D. Through regression analysis of the experimental data [41] and by substituting Equation (34) into Equation (25), Equation (42) is finally determined to calculate the ultimate strain.
ε c u ε c o = 1 + 27.3 ξ f r p 0.8 + 2.67 ξ s d s D 2
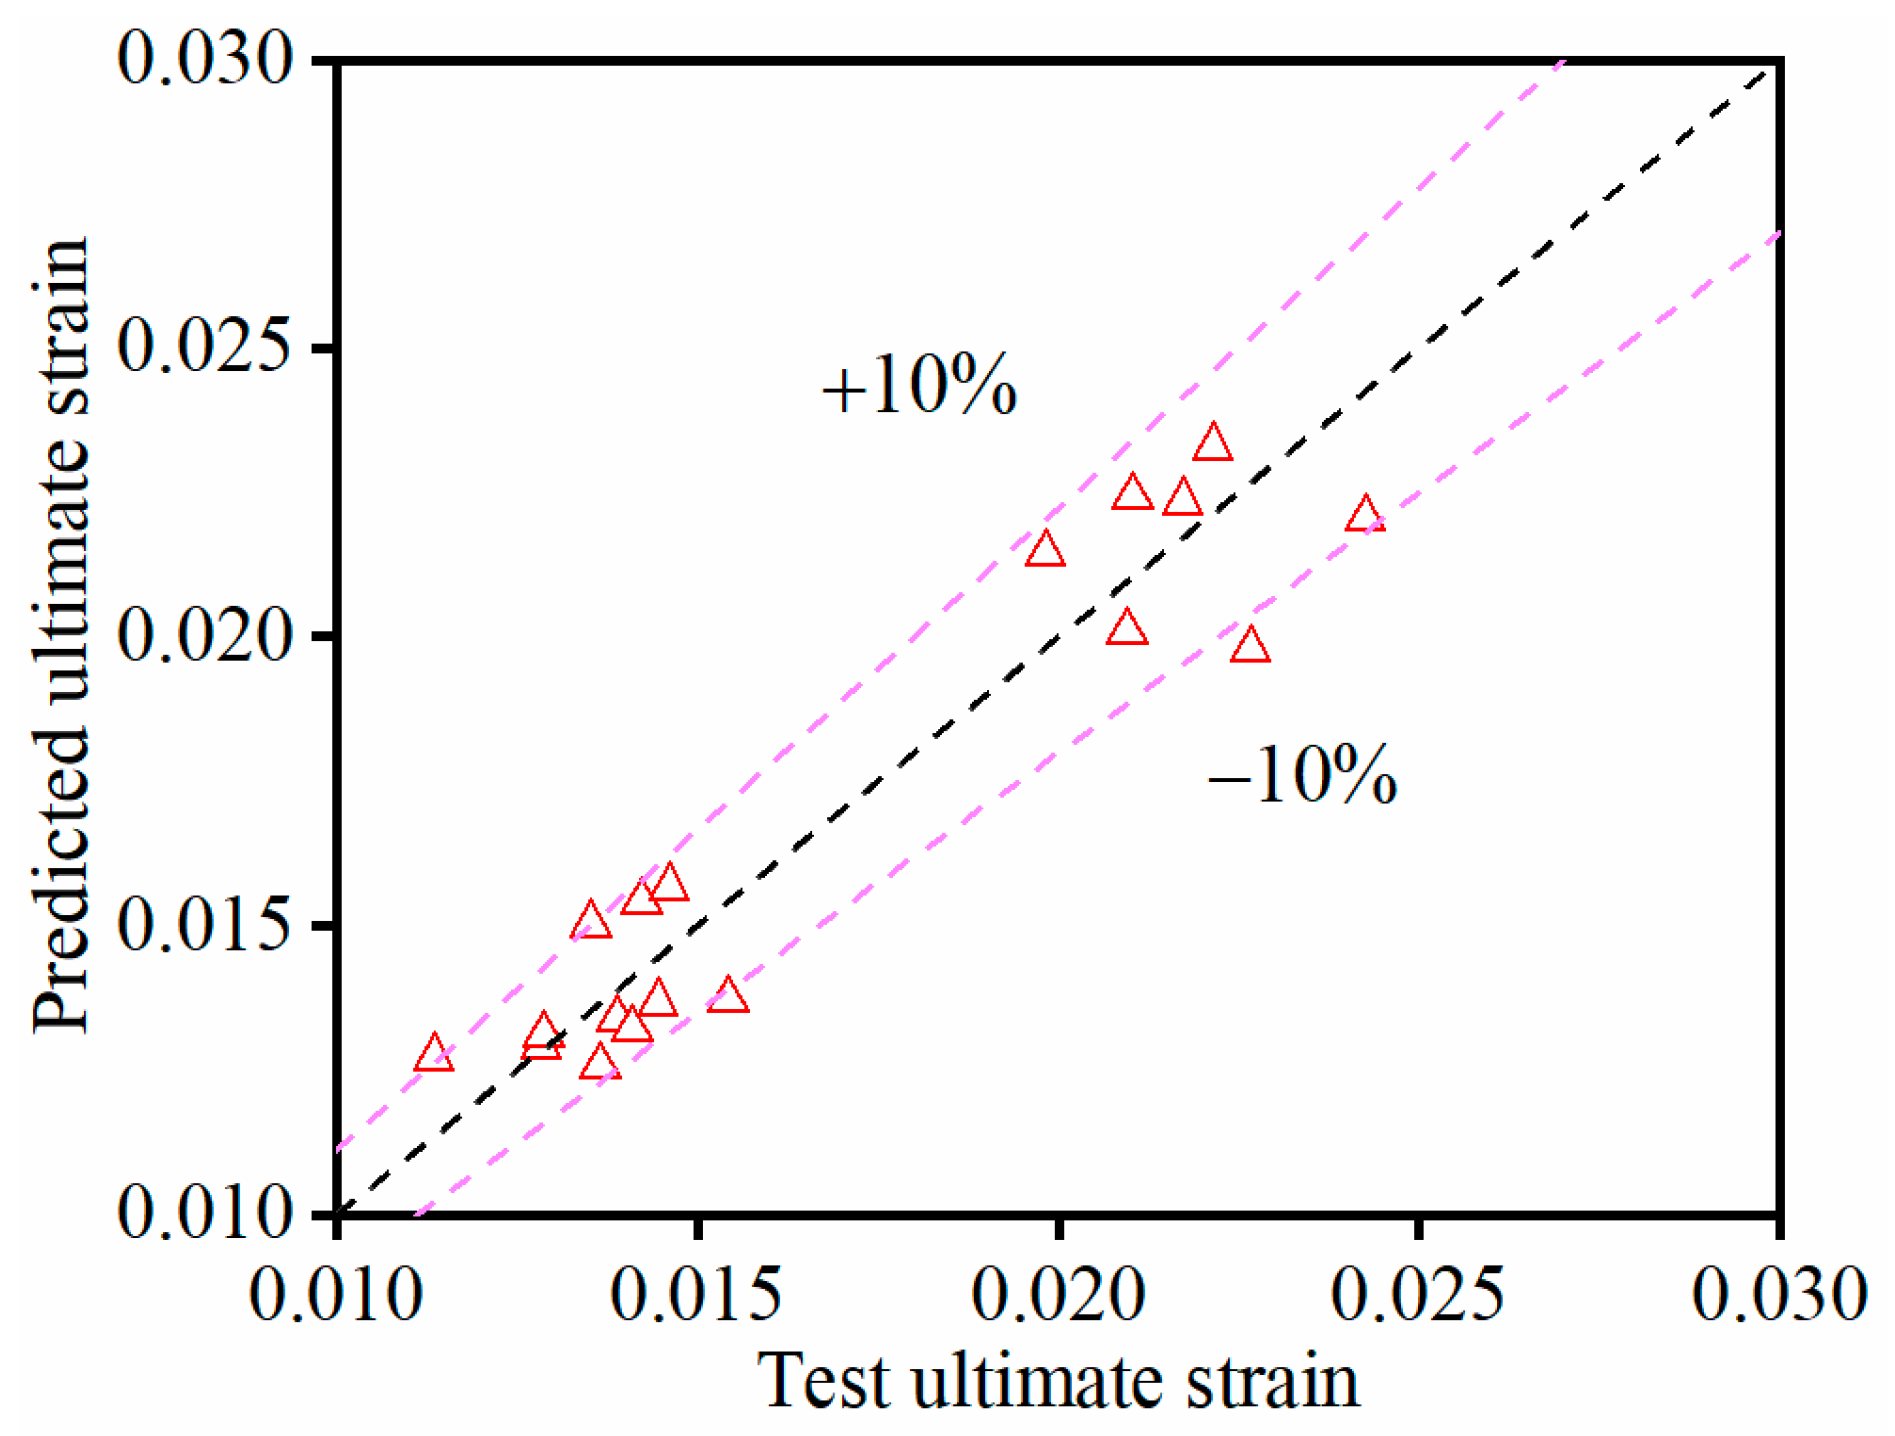
Figure 12 shows the relationship between the calculated values using Equation (42) and the experimental data [41], which can meet the prediction requirement for the ultimate strain of CGCPFTs.

4.4. Axial Stress–Axial Strain Relationship

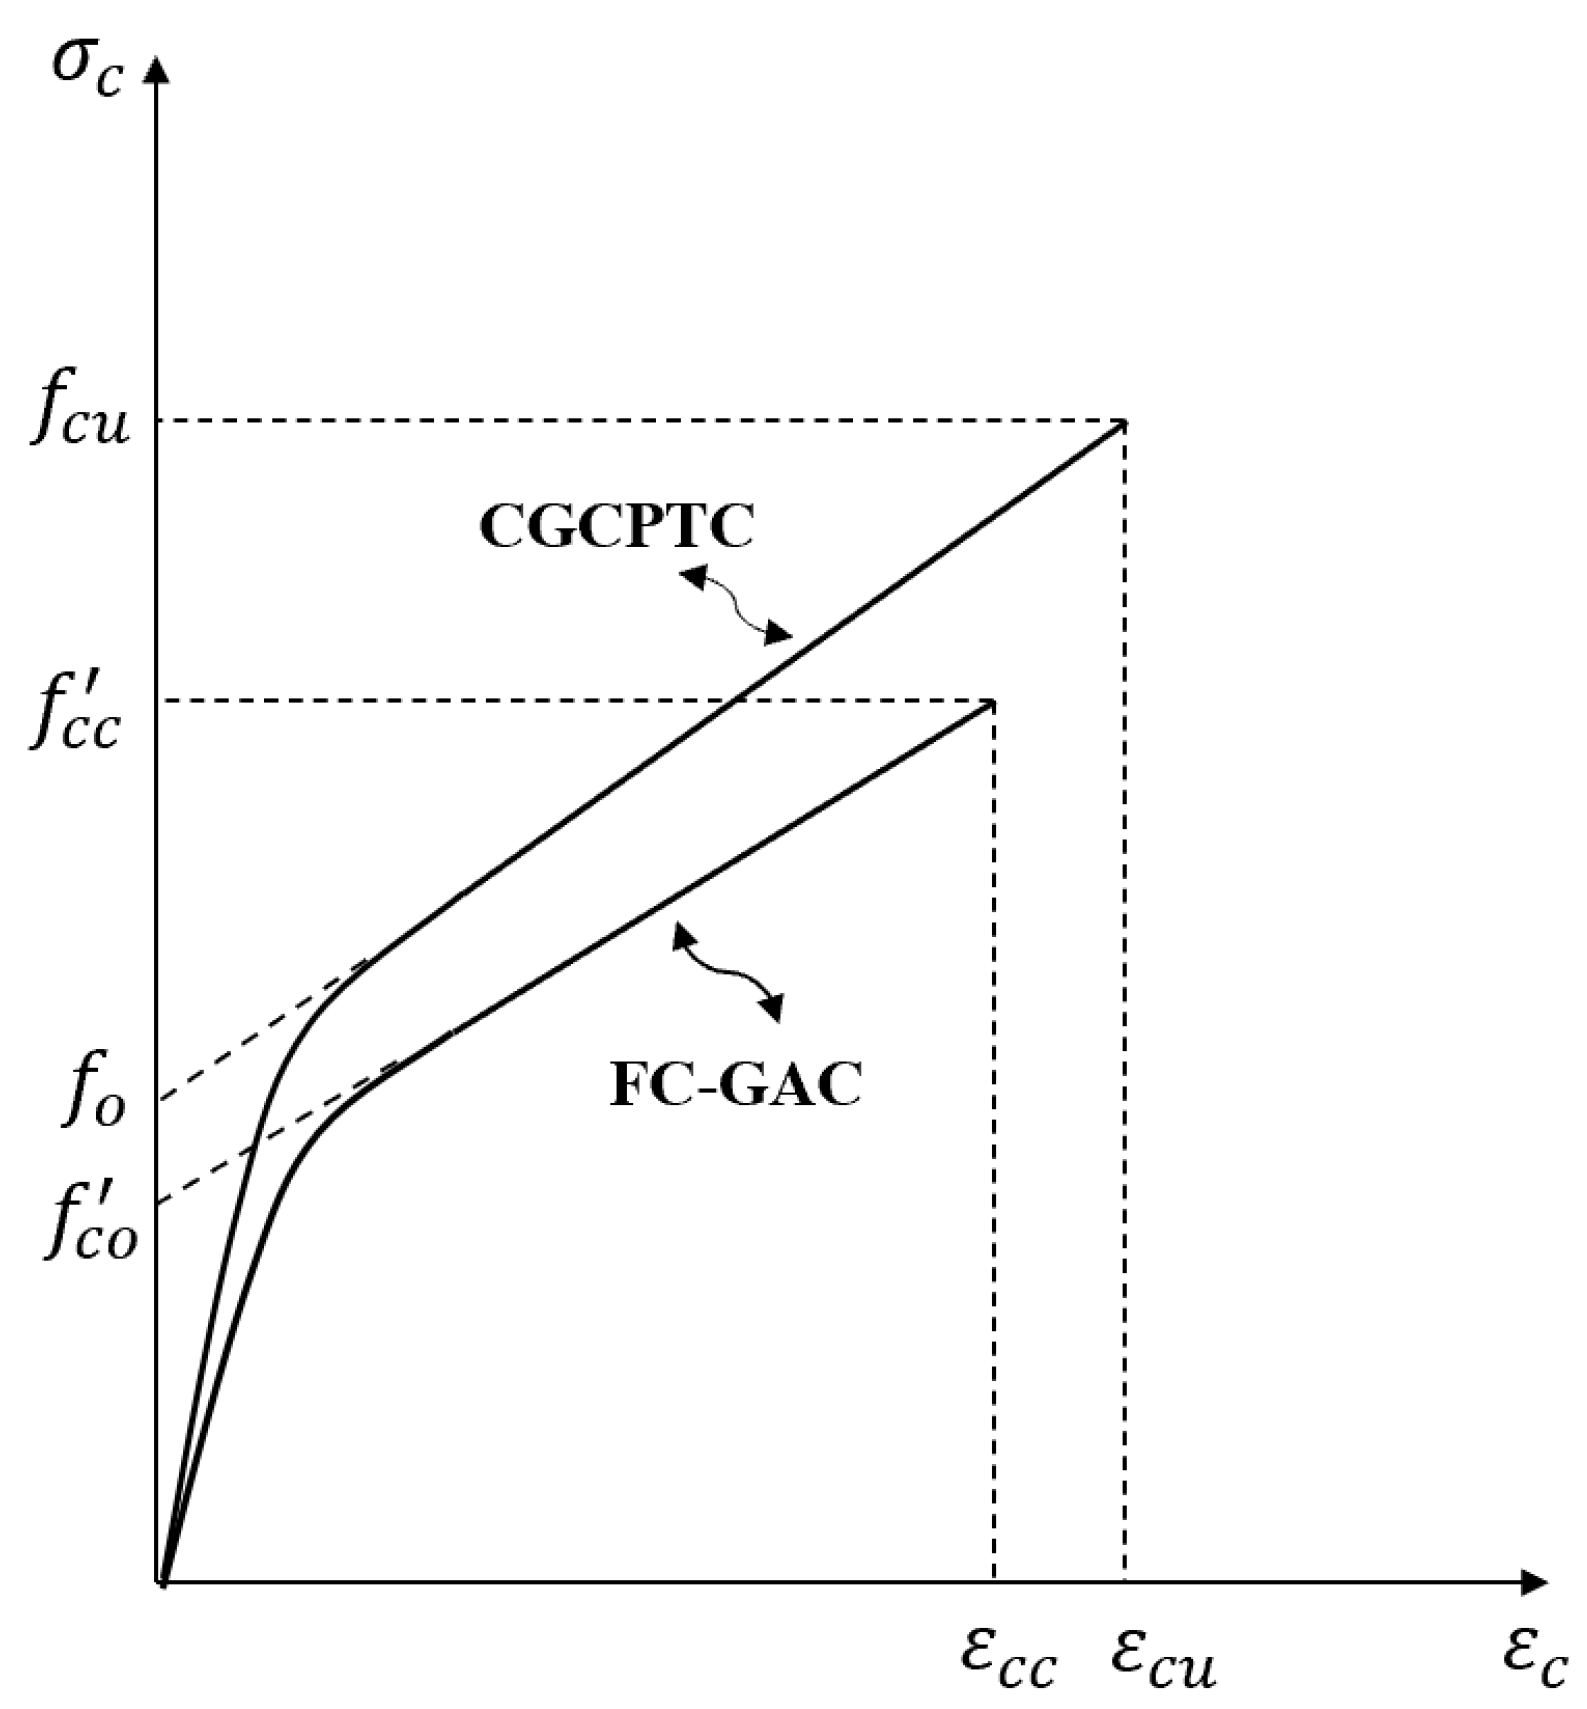
For models that cater specifically to the design of FRP-constrained concrete, the closed-loop equation developed by Lam and Teng [35] is relatively concise and widely recognized. Based on the model, the current study had achieved accurate prediction for FC-GAC. Unlike the existing design-oriented model for CCFFTs, the research on the design model for the CGCPFT in this paper still adopts the basic equation by Lam and Teng [35], making the calculation process more convenient. However, due to the built-in steel tube, significant changes have occurred in the ultimate and strain, the stiffness of the first segment, and the location of the transition point of the GAC, as shown in Figure 13. The ultimate strength and strain can be calculated using Equations (41) and (42), respectively. Among these, the stiffness of the first segment and the location of the transition point on the stress–strain curve of GAC are the key issues that need to be addressed.
As depicted in Figure 13, due to the presence of the built-in steel tube, the tangent modulus in the first segment increases significantly. In the literature [44,45], Equation (43) is used to describe the first segment’s tangent modulus for CCFFTs.
E d = E s A s + E c A c A c
In this paper, Equation (43) is also adopted for the CGCPFT, with the tangent modulus E c from the Lam and Teng [35] model being equivalently substituted as E d .
Similarly, as illustrated in Figure 13, the steel tube also results in an upward shift of point f o , which is the intersection of the extension line of the second segment of the stress–strain curve with the stress axis. The influence of the steel tube can be expressed using its confinement contribution index ξ s . As shown in Figure 14, through regression analysis of the experiment data [41] for f o with the steel tube’s confinement contribution index ξ s , it was found that they approximately follow a linear relationship. Therefore, the stress f o can be calculated using Equation (44).
f o = f c o 1 + 1.974 ξ s
In summary, the design-oriented model for CGCPFTs with different values of ds/D can be determined by Equations (45)–(48).
σ c = E d ε c E d E 2 2 4 ε c 2                                         0   ε c < ε t
σ c = f o + E 2 ε c                                                                                   ε t   ε c < ε c u
E 2 = f c u f o ε c u
ε t = 2 f o E c E 2
where f c u can be determined by Equation (41), ε c u can be determined by Equation (42), E d can be determined by Equation (43), and f o can be calculated by Equation (44). The axial load of the CGCPFT can be determined by Equation (49).
P c u = σ c A c

5. Model Validation

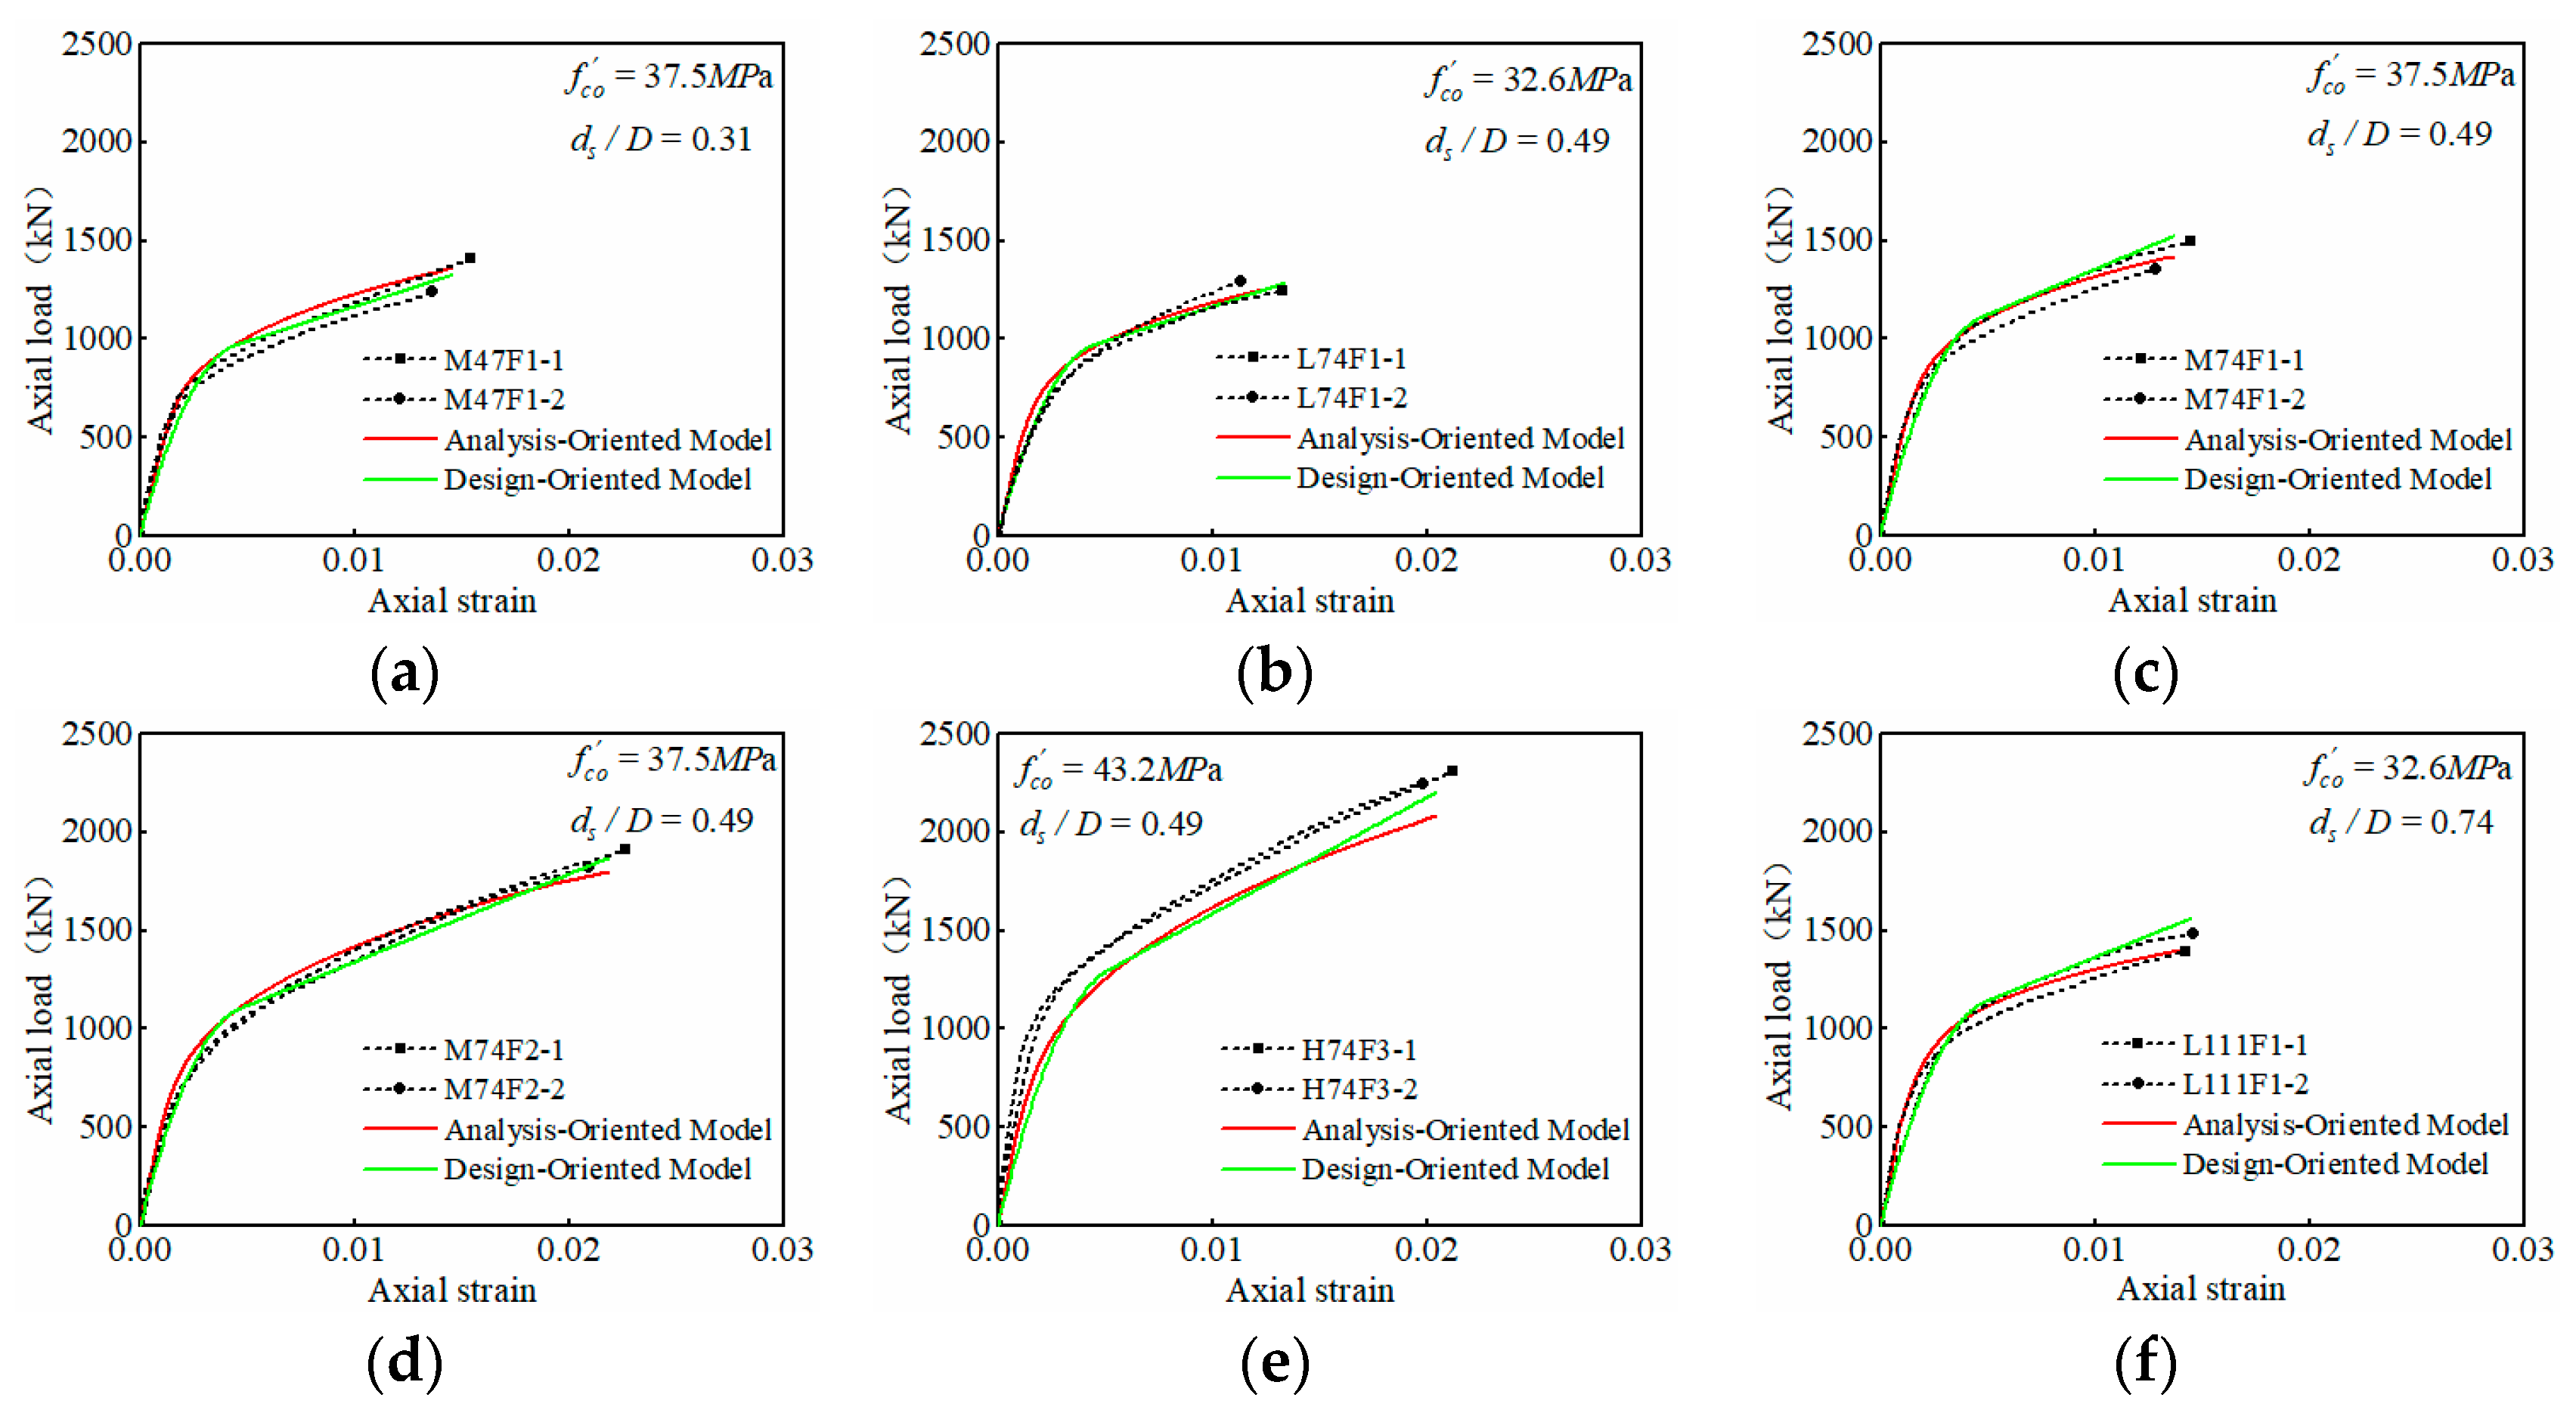
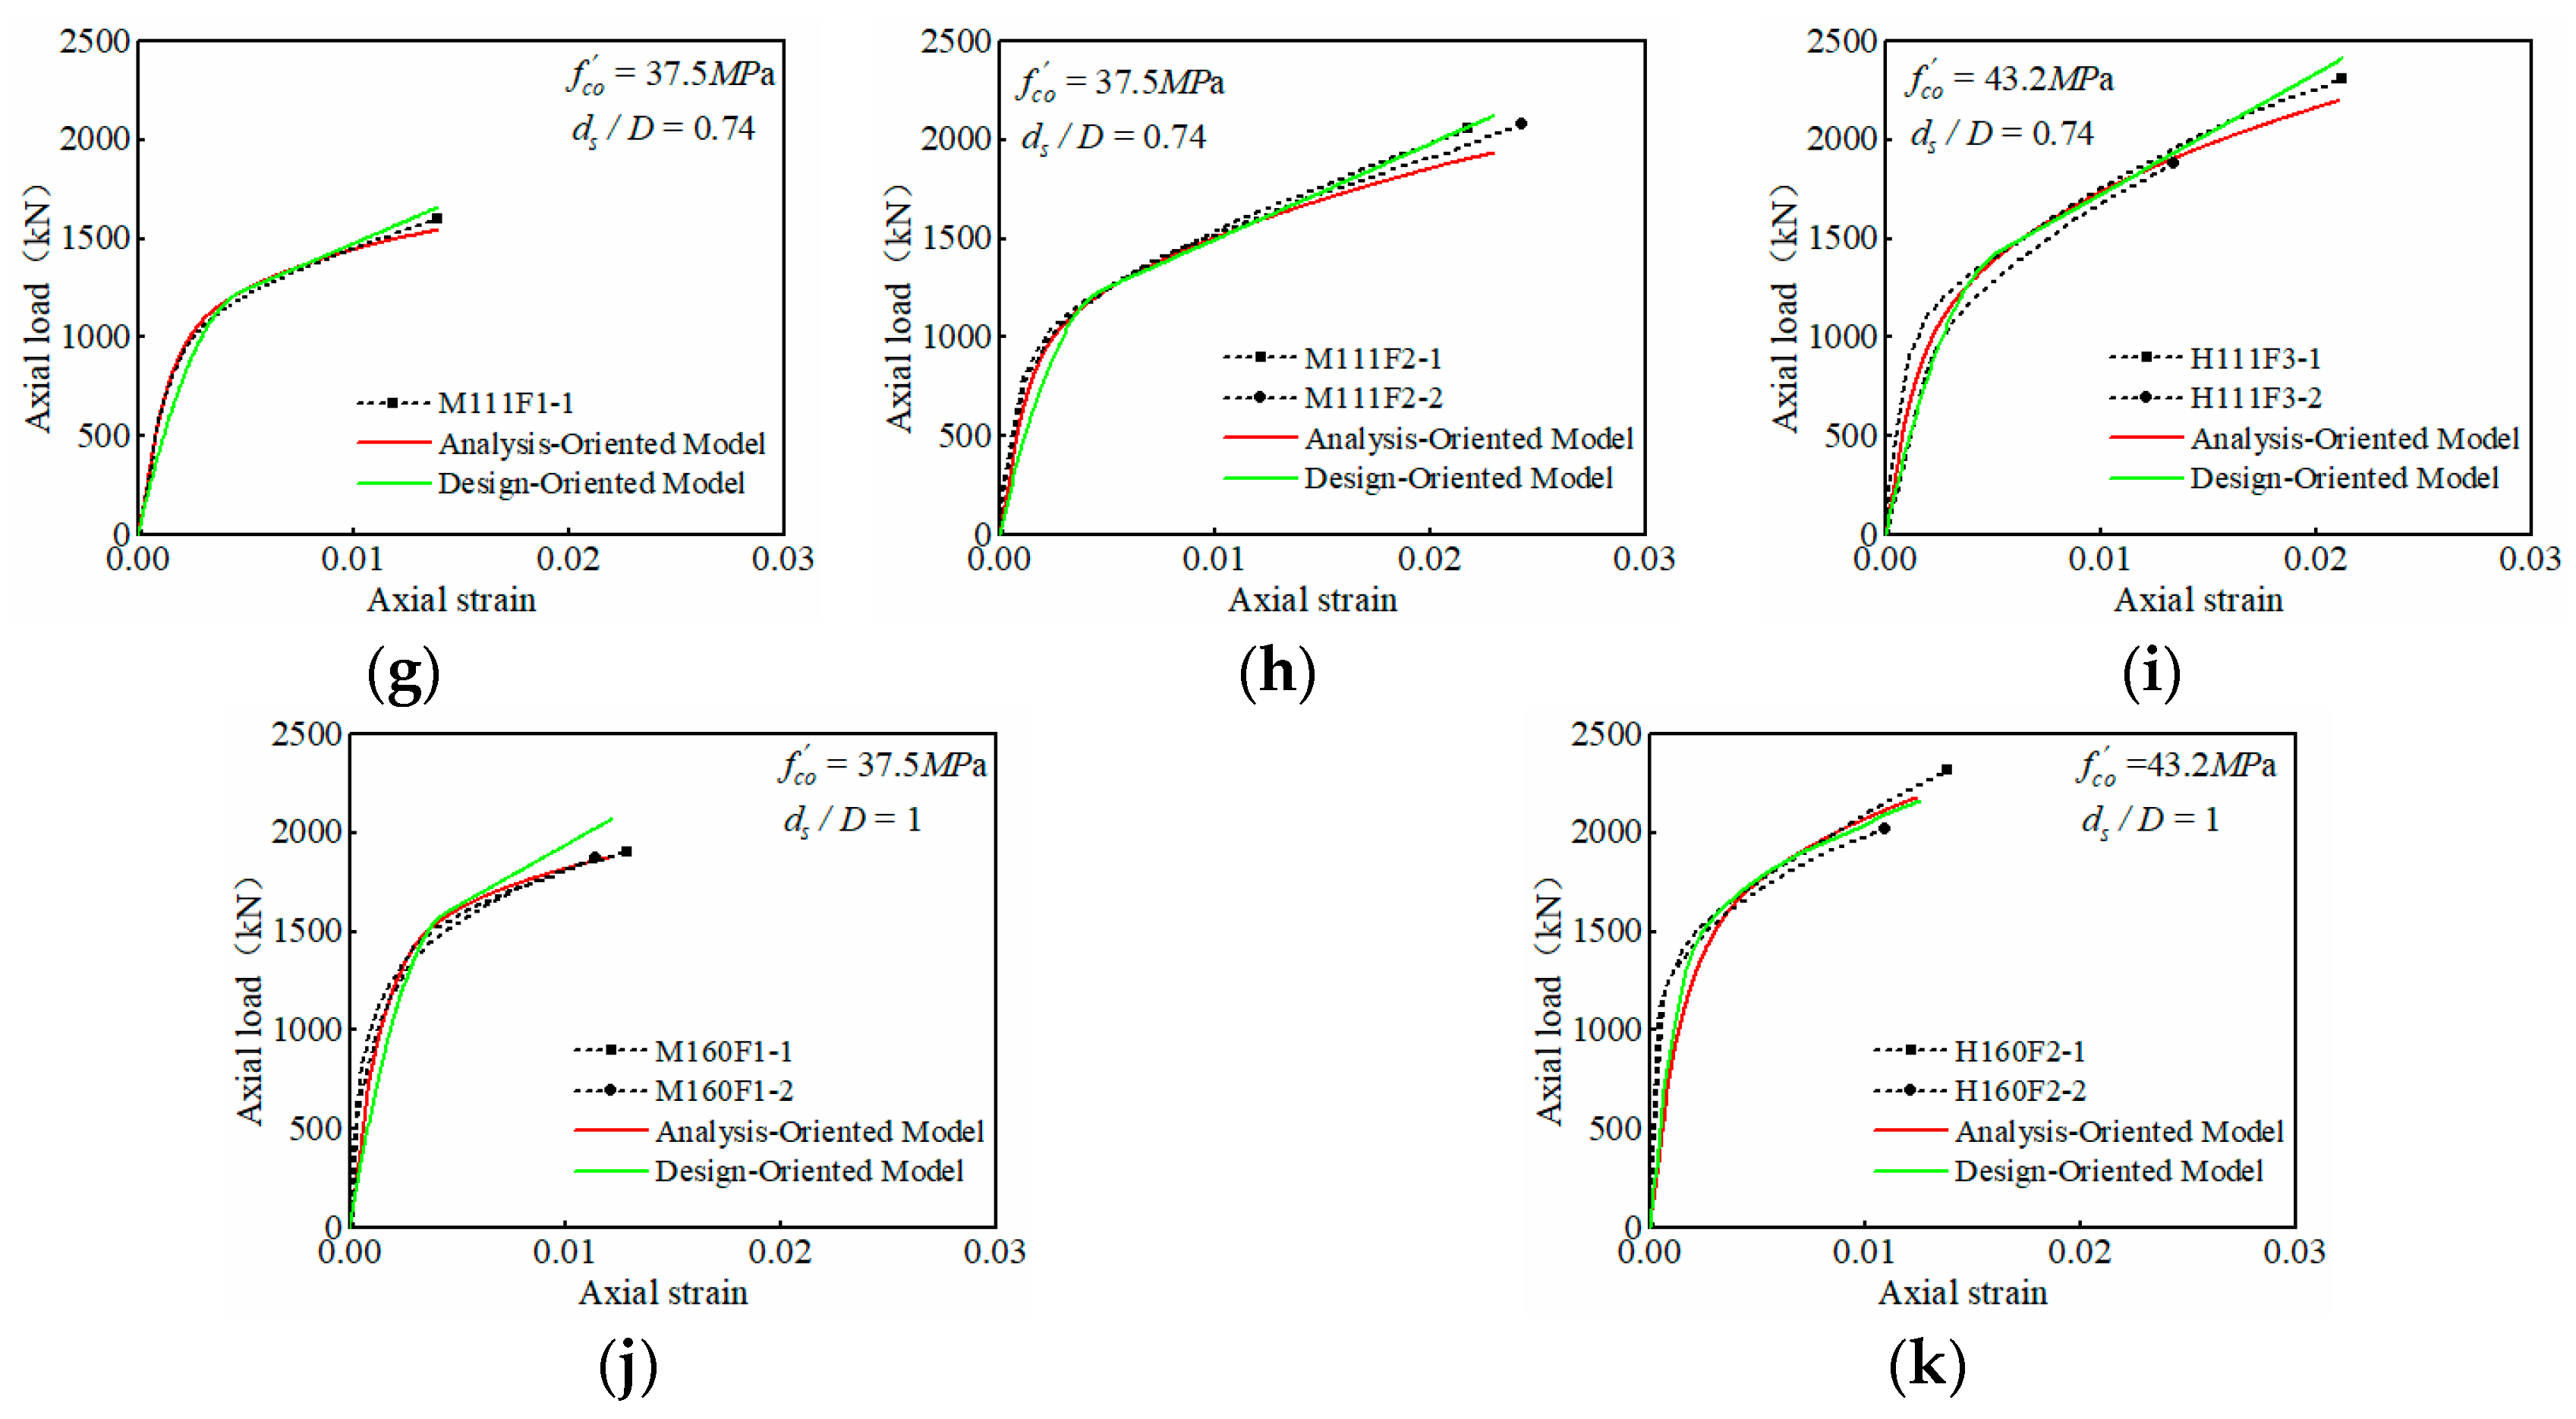
The experimental data for the FRP–steel–GAC composite column utilized in this study primarily encompass variations in parameters, including the GAC’s strength, the FRP’s thickness, and the steel tube’s outer diameter/FRP tube’s inner diameter (ds/D). The strength of the GAC ranges from 32.6 MPa to 43.2 MPa, while the FRP thickness varies at 0.167 mm, 0.334 mm, and 0.501 mm. The variation amplitudes of ds/D are 0.31, 0.49, 0.74, and 1. For the test specimens with different above ds/D values, the steel tube’s yield strength is 254 MPa, 261 MPa, 267 MPa, and 276 MPa, respectively. Furthermore, the elastic modulus of the FRP is 242 GPa. It is worth noting that due to the limited research reports on CGCPFTs, the above test data are mainly derived from the work of the author and their team. Detailed information about the test setup, loading conditions, and specimen preparation can be found in the references [34,41]. The detailed parameters are presented in Table 5.
Figure 15 presents the prediction results using the analytical model and design model proposed in this study. Due to the lack of established formulas, the peak strain ε c o and elastic modulus E c of the GAC were directly adopted from the test data. Both prediction models were terminated at the average ultimate strain of the companion specimens. For the H111F3 series specimens, since H111F3-2 experienced stress concentration failure, the prediction model was sterminated at the ultimate strain of H111F3-1. As shown in Figure 15, both the analytical model and design model developed in this paper can reasonably predict the test data. Due to the scarcity of research on this type of composite column, there is a lack of peer test data to evaluate this model. The author will continue to pay attention to peer research and revise the model. However, this study provides a reliable method for predicting models of similar composite columns.

6. Conclusions

FRP-confined gangue aggregate concrete partially filled steel tubes (i.e., CGCPFTs) can significantly improve the mechanical characteristics of gangue aggregate concrete, on the basis of effective utilization of solid waste, and expand the application scenarios of coal gangue concrete. Based on the existing research on the theoretical model of a CCFFT, this paper proposed a method for implementing the analytical model and design theoretical models of CGCPFTs and accurately predicted the load–strain curve of a CGCPFT. The primary findings of this study are summarized as follows:
(1) The mechanical models proposed by Teng et al. and Zhang et al. for CCFFTs have good prediction accuracy. However, considering the parameter change of the steel tubes in a CGCPFT (mainly referring to the change of ds/D), especially for gangue aggregate concrete (i.e., GAC), there is still uncertainty in their models’ predictions of the ultimate strength and strain of GAC. Additionally, there are some differences in the generation method of the load–strain curve. Nonetheless, they provide a solid theoretical foundation for the model study of CGCPFTs.
(2) Similarly to natural aggregate concrete, the stress–strain relationship of the GAC ring in CGCPFTs can also be expressed using the FRP-confined GAC model under monotonic axial compression. The hoop strain of the GAC core, which is simultaneously confined by both the FRP and the built-in steel tube, is relatively smaller than that of the GAC ring, and due to the deformation compatibility condition, their axial strains should remain consistent. Based on the proposed new boundary condition assumptions, the existing stress–strain iteration process for the concrete in CCFFTs was improved, establishing a method for generating the analysis-oriented load–strain curve of CGCPFTs under monotonic axial compression, which successfully predicted the test data of the CGCPFTs by the author and their team.
(3) The ultimate strength and corresponding strain model of a CGCPFT was established by equating all contributions of the steel tube to the hoop effect, and the prediction results can be maintained within ±10%. This expression consists of the FRP contribution index and the steel tube contribution index. By introducing the parameter ds/D, ranging between 0 and 1, it is able to reflect the influence of different steel tube outer diameter/FRP inner diameter parameters. Considering the impact of the steel tube contribution index, the FRP-confined concrete design-oriented model proposed by Teng et al. was revised, establishing a design-oriented model for CGCPFTs and successfully predicting the test data of CGCPFTs by the author and their team.
(4) The analytical model and design models for CGCPFTs were proposed in the paper, and this methodology is also applicable to CCPFTs. Since there are currently few reports on peer data for CCPFTs and CGCPFTs, the model will continue to be refined based on subsequent test data. However, the experimental data from the author and their team have demonstrated the feasibility of this approach. In subsequent work, the authors will pay more attention to studying the mechanical properties of CGCPFTs as pier columns in underground mines. More importantly, in future research, we aim to quantify the respective effective confinement zones of FRP and steel tubes, as well as the confinement effect of large-diameter composite columns.

Author Contributions

All authors of this paper have made objective contributions within the scope of their respective job responsibilities, as detailed below: Conceptualization, J.X. and J.W.; methodology, J.W., C.S. and S.Z.; validation, S.Z.; Formal analysis, C.S.; Investigation, J.C.; Supervision, J.D.; resources, J.W. and J.X.; data curation, J.C.; writing—original draft preparation, J.W.; writing—review and editing, J.D.; project administration, J.W.; funding acquisition, J.W. and J.X. All authors have read and agreed to the published version of the manuscript.

Funding

This research was funded by the Science and Technology Plan Project of Suqian, grant number K202343; the Doctoral Research Initiation Fund of Suqian University, grant number 2022XRC065; the National Natural Science Foundation of China, grant number 52074270; the National Natural Science Foundation of China’s Regional Joint Key Project, grant number U23A20598; the natural science research project of Jiangsu Province higher education institutions, grant number 23KJA560007, supported by Suqian Science and Technology Program, grant number H202313 and the APC was funded by Jian Wang.

Data Availability Statement

The data presented in this study are available on request from the corresponding author and some of the data will be used subsequently for analyzing other research questions.

Acknowledgments

This article especially acknowledges the contributions of all the authors in the conception, data collection and analysis, and the writing process of this article.

Conflicts of Interest

We affirm that this paper, in its entirety or in part, has not been previously published or accepted for publication elsewhere. It is not under consideration by another journal. There are no conflicts of interest pertaining to the submission of this document, and all co-authors consent to the submission.

References

  1. Dong, Z.; Xia, J.; Fan, C.; Cao, J. Activity of calcined coal gangue fine aggregate and its effect on the mechanical behavior of cement mortar. Constr. Build. Mater. 2015, 100, 63–69. [Google Scholar] [CrossRef]
  2. Zhou, M.; Dou, Y.; Zhang, Y.; Zhang, Y.; Zhang, B. Effects of the variety and content of coal gangue coarse aggregate on the mechanical properties of concrete. Constr. Build. Mater. 2019, 220, 386–395. [Google Scholar] [CrossRef]
  3. Xian, G.; Bai, Y.; Zhou, P.; Wang, J.; Li, C.; Dong, S.; Guo, R.; Tian, J.; Li, J.; Zhong, J.; et al. Long-term properties evolution and life prediction of glass fiber reinforced thermoplastic bending bars exposed in concrete alkaline environment. J. Build. Eng. 2024, 91, 109641. [Google Scholar] [CrossRef]
  4. Li, C.; Xian, G. Novel wedge-shaped bond anchorage system for pultruded CFRP plates. Mater. Struct. 2018, 51, 162. [Google Scholar] [CrossRef]
  5. Zhao, H.; Ren, T.; Remennikov, A. Behaviour of FRP-confined coal reject concrete columns under axial compression. Compos. Struct. 2021, 262, 113621. [Google Scholar] [CrossRef]
  6. Zhao, H.; Ren, T.; Remennikov, A. Behaviour of FRP-confined coal rejects based backfill material under compression. Constr. Build. Mater. 2020, 268, 121171. [Google Scholar] [CrossRef]
  7. Teng, J.G.; Lam, L. Behavior and Modeling of Fiber Reinforced Polymer-Confined Concrete. J. Struct. Eng. 2004, 130, 1713–1723. [Google Scholar] [CrossRef]
  8. Wilt, J.; Liang, R.; GangaRao, H.; Mostoller, J.; NSF I UCRC For Integration Of Composites Into Infrastructure And Constructed Facilities Center. Structural responses of FRP sheet piles under cantilever loading. Sustain. Struct. 2023, 3, 000021. [Google Scholar] [CrossRef]
  9. Li, Y.; Zhao, X.; Singh, R.R.; Al-Saadi, S. Experimental study on seawater and sea sand concrete filled GFRP and stainless steel tubular stub columns. Thin-Walled Struct. 2016, 106, 390–406. [Google Scholar] [CrossRef]
  10. Li, Y.-L.; Zhao, X.-L. Hybrid double tube sections utilising seawater and sea sand concrete, FRP and stainless steel. Thin-Walled Struct. 2020, 149, 106643. [Google Scholar] [CrossRef]
  11. Li, Y.; Zhao, X.; Raman, R.S. Load-strain model for concrete-filled double-skin circular FRP tubes under axial compression. Eng. Struct. 2019, 181, 629–642. [Google Scholar] [CrossRef]
  12. Li, Y.; Teng, J.; Zhao, X.; Raman, R.S. Theoretical model for seawater and sea sand concrete-filled circular FRP tubular stub columns under axial compression. Eng. Struct. 2018, 160, 71–84. [Google Scholar] [CrossRef]
  13. Teng, J.-G.; Wang, Z.; Yu, T.; Zhao, Y.; Li, L.-J. Double-tube concrete columns with a high-strength internal steel tube: Concept and behaviour under axial compression. Adv. Struct. Eng. 2018, 21, 1585–1594. [Google Scholar] [CrossRef]
  14. Yu, T.; Teng, J.G.; Wong, Y.L. Stress-Strain Behavior of Concrete in Hybrid FRP-Concrete-Steel Double-Skin Tubular Columns. J. Struct. Eng. 2010, 136, 379–389. [Google Scholar] [CrossRef]
  15. Long, Y.-L.; Li, W.-T.; Dai, J.-G.; Gardner, L. Experimental study of concrete-filled CHS stub columns with inner FRP tubes. Thin-Walled Struct. 2018, 122, 606–621. [Google Scholar] [CrossRef]
  16. Tao, Z.; Han, L.-H.; Zhuang, J.-P. Axial Loading Behavior of CFRP Strengthened Concrete-Filled Steel Tubular Stub Columns. Adv. Struct. Eng. 2007, 10, 37–46. [Google Scholar] [CrossRef]
  17. Liu, J.; Xu, T.; Guo, Y.; Wang, X.; Chen, Y.F. Behavior of circular CFRP-steel composite tubed high-strength concrete columns under axial compression. Compos. Struct. 2019, 211, 596–609. [Google Scholar] [CrossRef]
  18. Lu, Y.; Li, N.; Li, S. Behavior of FRP-Confined Concrete-Filled Steel Tube Columns. Polymers 2014, 6, 1333–1349. [Google Scholar] [CrossRef]
  19. Ding, F.-X.; Lu, D.-R.; Bai, Y.; Gong, Y.-Z.; Yu, Z.-W.; Ni, M.; Li, W. Behaviour of CFRP-confined concrete-filled circular steel tube stub columns under axial loading. Thin-Walled Struct. 2018, 125, 107–118. [Google Scholar] [CrossRef]
  20. Park, J.; Hong, Y.; Hong, G.; Kim, J.; Choi, S. Design Formulas of Concrete Filled Circular Steel Tubes Reinforced by Carbon Fiber Reinforced Plastic Sheets. Procedia Eng. 2011, 14, 2916–2922. [Google Scholar] [CrossRef]
  21. Hu, Y.M.; Yu, T.; Teng, J.G. FRP-Confined Circular Concrete-Filled Thin Steel Tubes under Axial Compression. J. Compos. Constr. 2011, 15, 850–860. [Google Scholar] [CrossRef]
  22. Wei, Y.; Wu, G.; Li, G. Performance of circular concrete-filled fiber-reinforced polymer-steel composite tube columns under axial compression. J. Reinf. Plast. Compos. 2014, 33, 1911–1928. [Google Scholar] [CrossRef]
  23. Teng, J.; Hu, Y.; Yu, T. Stress–strain model for concrete in FRP-confined steel tubular columns. Eng. Struct. 2013, 49, 156–167. [Google Scholar] [CrossRef]
  24. Teng, J.G.; Huang, Y.L.; Lam, L.; Ye, L.P. Theoretical Model for Fiber-Reinforced Polymer-Confined Concrete. J. Compos. Constr. 2007, 11, 201–210. [Google Scholar] [CrossRef]
  25. Zhang, Y.; Wei, Y.; Bai, J.; Zhang, Y. Stress-strain model of an FRP-confined concrete filled steel tube under axial compression. Thin-Walled Struct. 2019, 142, 149–159. [Google Scholar] [CrossRef]
  26. Wu, Y.-F.; Wei, Y. General Stress-Strain Model for Steel- and FRP-Confined Concrete. J. Compos. Constr. 2015, 19, 04014069. [Google Scholar] [CrossRef]
  27. Choi, K.-K.; Xiao, Y. Analytical Model of Circular CFRP Confined Concrete-Filled Steel Tubular Columns under Axial Compression. J. Compos. Constr. 2010, 14, 125–133. [Google Scholar] [CrossRef]
  28. Dong, C.; Kwan, A.; Ho, J. Effects of external confinement on structural performance of concrete-filled steel tubes. J. Constr. Steel Res. 2017, 132, 72–82. [Google Scholar] [CrossRef]
  29. Zeng, J.-J.; Lv, J.-F.; Lin, G.; Guo, Y.-C.; Li, L.-J. Compressive behavior of double-tube concrete columns with an outer square FRP tube and an inner circular high-strength steel tube. Constr. Build. Mater. 2018, 184, 668–680. [Google Scholar] [CrossRef]
  30. Lam, L.; Teng, J. Design-oriented stress–strain model for FRP-confined concrete. Constr. Build. Mater. 2003, 17, 471–489. [Google Scholar] [CrossRef]
  31. Popovics, S. A numerical approach to the complete stress-strain curve of concrete. Cem. Concr. Res. 1973, 3, 583–599. [Google Scholar] [CrossRef]
  32. Jiang, T.; Teng, J. Analysis-oriented stress–strain models for FRP–confined concrete. Eng. Struct. 2007, 29, 2968–2986. [Google Scholar] [CrossRef]
  33. Wang, Z.H. Experimental Study and Theoretical Analysis of FRP-Concrete-High Strength Steel Solid Double-tube Columns. Ph.D. Thesis, Zhejiang University, Hangzhou, China, 2017. [Google Scholar]
  34. Wang, J.; Xia, J.; Chang, H.; Han, Y.; Yu, L. The axial compressive experiment and analytical model for FRP-confined gangue aggregate concrete. Structures 2021, 36, 98–110. [Google Scholar] [CrossRef]
  35. Teng, J.G.; Jiang, T.; Lam, L.; Luo, Y.Z. Refinement of a Design-Oriented Stress–Strain Model for FRP-Confined Concrete. J. Compos. Constr. 2009, 13, 269–278. [Google Scholar] [CrossRef]
  36. Ozbakkaloglu, T.; Lim, J.C.; Vincent, T. FRP-confined concrete in circular sections: Review and assessment of stress–strain models. Eng. Struct. 2013, 49, 1068–1088. [Google Scholar] [CrossRef]
  37. Marques, S.P.C.; Marques, D.C.d.S.C.; da Silva, J.L.; Cavalcante, M.A.A. Model for Analysis of Short Columns of Concrete Confined by Fiber-Reinforced Polymer. J. Compos. Constr. 2004, 8, 332–340. [Google Scholar] [CrossRef]
  38. Xiao, Q.G.; Teng, J.G.; Yu, T. Behavior and Modeling of Confined High-Strength Concrete. J. Compos. Constr. 2010, 14, 249–259. [Google Scholar] [CrossRef]
  39. A Harries, K.; Kharel, G. Experimental investigation of the behavior of variably confined concrete. Cem. Concr. Res. 2003, 33, 873–880. [Google Scholar] [CrossRef]
  40. Yang, J.-Q.; Feng, P. Analysis-oriented models for FRP-confined concrete: 3D interpretation and general methodology. Eng. Struct. 2020, 216, 110749. [Google Scholar] [CrossRef]
  41. Wang, J.; Xia, J.; Chang, H.; Han, Y.; Yu, L.; Jiang, L. Experimental Study on Axial Compressive Behavior of Gangue Aggregate Concrete Filled FRP and Thin-Walled Steel Double Tubular Columns. Coatings 2021, 11, 1404. [Google Scholar] [CrossRef]
  42. Che, Y.; Wang, Q.L.; Shao, Y.B. Compressive performances of the concrete filled circular CFRP-steel tube (C-CFRP-CFST). Adv. Steel Constr. 2012, 8, 331–358. [Google Scholar]
  43. Cha, X.X.; Yu, M.; Zhong, S.T. Study on the consistency of bearing capacity formulas in the “Technical Code for Concrete Filled Steel Tubular Structures”. J. Build. Struct. 2013, 34, 11–20. [Google Scholar]
  44. Xiong, M.; Lan, Z.; Chen, G.; Lu, Y.; Xu, Z. Behavior of FRP-HSC-steel tubular columns under axial compression: A comparative study. Compos. Struct. 2021, 261, 113566. [Google Scholar] [CrossRef]
  45. Xiong, M.; Xu, Z.; Chen, G.; Lan, Z. FRP-confined steel-reinforced recycled aggregate concrete columns: Concept and behaviour under axial compression. Compos. Struct. 2020, 246, 112408. [Google Scholar] [CrossRef]
Figure 1. Schematic diagram of FRP–steel–concrete composite column section.
Buildings 14 03516 g001
Figure 2. Prediction results of different ultimate stress and strain models [32,37,38,39,40]: (a) Ultimate stress, (b) Ultimate strain.
Buildings 14 03516 g002
Figure 3. Evaluation of the constraining stress supplied by FRP versus steel tube [41]: (a) Considering different ds/D, (b) Considering different confinement strength.
Buildings 14 03516 g003
Figure 4. Verification of the stress–strain model for GAC ring [41]: (a) The first group specimens, (b) The second group specimens.
Buildings 14 03516 g004
Figure 5. Schematic diagram of static force equilibrium conditions of CGCPFT: (a) Cross-sectional schematic diagram, (b) GAC ring, (c) Built-in steel tube, (d) GAC core.
Buildings 14 03516 g005
Figure 6. Incremental iteration flow chart of analysis model of DTC-GAC.
Buildings 14 03516 g006
Figure 7. Evaluation of existing models with test data [16,18,20,22,43].
Buildings 14 03516 g007
Figure 8. Model predicted value of Che et al./experimental value [41].
Buildings 14 03516 g008
Figure 9. Mechanical model of ultimate strength.
Buildings 14 03516 g009
Figure 10. Hooping effect regression analysis of steel tube-confined GAC.
Buildings 14 03516 g010
Figure 11. Accuracy analysis of ultimate strength prediction model.
Buildings 14 03516 g011
Figure 12. Accuracy analysis of ultimate strain prediction model.
Buildings 14 03516 g012
Figure 13. Schematic diagram of stress–strain curve of CGCPTC.
Buildings 14 03516 g013
Figure 14. Regression analysis of f o / f c o .
Buildings 14 03516 g014
Figure 15. Model validation of the load–strain relationship curve: (a) M47F1, (b) L74F1, (c) M74F1, (d) M74F2, (e) H74F3, (f) L111F1, (g) M111F1, (h) M111F2, (i) H111F3, (j) M160F1, (k) H160F2.
Buildings 14 03516 g015aBuildings 14 03516 g015b
Table 1. Typical ultimate strength and strain models of concrete confined by FRP.
ModelsPeak Strength ModelsCorresponding Strain Models
Harries and Kharel [39] f c c f c o = 1 + 4.269 f l f c o 0.587 f c o 0.413 ε c c ε c o = 1 + 21.345 f l f c o 0.587 f c o 0.413
Marques et al. [37] f c c f c o = 1 + 6.7 f l f c o 0.83 f c o 0.17 ε c c ε c o = 1 + 1340 f l f c o 0.83 f c o 1.17
Jiang and Teng [32] f c c f c o = 1 + 3.5 f l f c o ε c c ε c o = 1 + 17.5 f l f c o 1.2
Xiao et al. [38] f c c f c o = 1 + 3.24 f l f c o 0.8 ε c c ε c o = 1 + 17.4 f l f c o 1.06
Yang and Feng [40] f c c f c o = 1 + 3.33 f l f c o 0.9 ε c c ε c o = 1 + 17.4 f l f c o 1.07
Table 2. Experimental data of FRP-confined GAC from reference [34].
Specimen f c o E c ε c o t f c c ε c u ε h , r u p f c c f c o ε c u / ε c o
(MPa)Avg.(GPa)Avg.(%)Avg.(mm)(MPa)Avg.(%)Avg.(%)Avg.Avg.Avg.
L0-129.032.617.417.30.1830.211/////////
L0-235.7 17.3 0.214 // / / //
L0-333.1 17.1 0.235 // / / //
L1-1//////0.16763.364.81.3671.4060.9170.8621.9886.672
L1-2/ / / 0.16762.4 1.404 0.787
L1-3/ / / 0.16768.7 1.446 0.881
L2-1//////0.33491.687.62.3442.3330.8750.8202.68711.073
L2-2/ / / 0.33485.4 2.444 0.779
L2-3/ / / 0.33485.8 2.011 0.805
M0-137.737.520.320.20.2050.203/////////
M0-235.4 20.1 0.195 // / / /
M0-339.4 20.2 0.208 // / / /
M1-1//////0.16759.163.20.9831.1600.7560.7661.6855.723
M1-2/ / / 0.16766.2 1.217 0.824
M1-3/ / / 0.16764.3 1.280 0.717
M2-1//////0.33482.489.51.8032.0880.7670.8292.38710.301
M2-2/ / / 0.33493.9 2.29 0.855
M2-3/ / / 0.33492.3 2.172 0.864
H0-143.243.221.4210.2050.209/////////
H0-244.1 20.6 0.214 // / / /
H0-342.4 21.0 0.209 // / / /
H2-1//////0.33494.696.91.7861.8400.8460.8312.2438.779
H2-2/ / / 0.334101.3 1.987 0.841
H2-3/ / / 0.33494.9 1.748 0.807
H3-1//////0.501109.6108.32.2612.0560.7680.7202.5079.809
H3-2/ / / 0.501111.9 2.090 0.709
H3-3/ / / 0.501103.4 1.818 0.682
Note: All data in Table 2 are reproduced with permission from ELSEVIER’s copyright.
Table 3. Summary of ultimate strength models of CCFFT.
AuthorsUltimate Strength Models
Wei et al. [22] f c u f c o = 1.27 + 1.27 ξ s + 1.28 ξ f r p
Lu et al. [18] f c u f c o = 1 + 1.8 ξ s + 1.15 ξ f r p
Che et al. [42] f c u f c o = 1.27 + 1.27 ξ s + 1.28 ξ f r p
Tao et al. [16] N c u f c o = 1 + 1.02 ξ s A s c + 1.15 ξ f r p A c
Park et al. [20] f c u f c o = 1 + 2.86 f l f c o
f l = 2 t s f y D + 2 t y f y D
Dong et al. [28] N u = 0.95 + f 1 + m i n f 2 , f 3 A c f c o + A s f f r p
f 1 = 0.49 ξ s 0.51
f 2 = 0.00085 E l 0.8 f c o 0.29
f 3 = 0.6 E l ε f r p , f r p 0.86 f c o 0.59
E l = 2 E f r p t f r p D
Table 4. Key parameters of steel tube-confined GAC [41].
Specimen P c u , s (kN)ds (mm)ts (mm) f c o (MPa) ξ s
M111-F0-18511111.837.50.485
M111-F0-28541111.837.50.485
M160-F0-115921601.837.50.382
M160-F0-216771601.837.50.382
H74-F0-1502741.843.20.634
H74-F0-2512741.843.20.634
H111-F0-19171111.843.20.421
H111-F0-29981111.843.20.421
H160-F0-11782160243.20.332
H160-F0-21697160243.20.332
Table 5. Key test results of CGCPFTs from research [41].
Specimens P c o
(kN)
P c u
(kN)
P c u P c o ε c o
(%)
ε c u
(%)
ε c u ε c o
L74F1-157615032.610.2111.3536.41
L74F1-257612932.240.2111.1365.38
L111F1-157613932.420.2111.4246.75
L111F1-257614862.580.2111.4616.92
M47F1-166214092.130.2031.5437.60
M47F1-266212401.870.2031.3666.73
M74F1-166214932.260.2031.4457.12
M74F1-266213562.050.2031.2846.33
M74F2-166219082.880.2032.26611.16
M74F2-266218232.750.2032.09610.33
M111F1-166215972.410.2031.3896.84
M111F1-2 b662//0.203//
M111F2-166220573.110.2032.17310.70
M111F2-266220793.140.2032.42511.95
H74F3-176322122.900.2092.10410.07
H74F3-276322442.940.2091.9839.49
H111F2-1 a76316052.100.2090.9174.39
H111F2-2 a76317052.230.2091.1295.40
H111F3-176323043.020.2092.21410.59
H111F3-2 a76318772.460.2091.3366.39
M160F1-175418742.490.2031.1415.62
M160F1-275419062.530.2031.2886.34
H160F2-1 a86823142.670.2091.3826.61
H160F2-2 a86820202.330.2091.0935.23
Note: The superscript “a” indicates that the specimen experienced failure of the CFRP jacket at the column end due to stress concentration and did not reach the designed ultimate bearing capacity; the superscript “b” indicates that a fault occurred in the loading machine during the test, preventing the normal collection of relevant data.
Disclaimer/Publisher’s Note: The statements, opinions and data contained in all publications are solely those of the individual author(s) and contributor(s) and not of MDPI and/or the editor(s). MDPI and/or the editor(s) disclaim responsibility for any injury to people or property resulting from any ideas, methods, instructions or products referred to in the content.