Abstract
With the gradual increase in public awareness of ecological environmental protection, how to manage the increasingly tight supply of natural ecological energy and resources and the more evident greenhouse effect, how to properly treat and deal with the relationship between people, engineering and the ecological environment during the construction phase of engineering projects as well as how to evaluate the degree of environmental friendliness and sustainable development ability of engineering projects will become an urgent issue. Stakeholders in engineering projects must seriously consider these vital issues. Existing studies on the evaluation of engineering–ecology sustainable development capacity mainly focus on the regional and industry levels, with less research focusing on the sustainability of individual engineering projects; furthermore, they are primarily concentrated on the qualitative evaluation perspective. In order to refine these shortcomings, based on the viewpoint of the ecosystem of construction projects, this paper integrates the concept of whole life cycle with the ecological footprint measurement model and defines the notion of the ecological footprint of the whole life cycle of construction projects. Subsequently taking the above concept as the foundation and making the ecological footprint of various activities throughout the life cycle of a construction project a specific study object, the research establishes the ecological footprint measurement model of the whole life cycle of the project, and comprehensively evaluates the impacts on the surrounding environment, which include the consumption of energy resources, CO2 and the absorption of solid wastes across the whole life cycle of the project. We then measure the sustainable development ability of engineering projects by comparing the ecological footprint with the ecological carrying capacity of a certain surrounding region. Finally, the practicability and reliability of the model is verified through the example’s application. Thus, the results of the study have significant theoretical and practical implications: (1) the introduction of the ecological footprint addresses the gap about the quantitative evaluation of the sustainability of individual engineering projects from a micro perspective; (2) it compensates for the shortcomings of other evaluation methods that only evaluate a single element, such as only CO2, resources, energy or solid waste and so on; and (3) stakeholders can use the measured model to quantitatively assess the sustainability of new projects or urban renewal projects, providing strong support for project feasibility studies and project-establishment.
1. Introduction
The Chinese construction industry, guided by the new development concepts of innovation, coordination, greenness, openness and sharing, has been optimizing its industry structure and regional layout, consolidating its position as a pillar industry and playing a significant role in economic and social growth, urban and rural development and the improvement of people’s livelihoods. China’s economic development model is currently undergoing a transformation, and the construction engineering sector must actively adapt to the new normal of sustainable and green growth at both the national level and at industry levels. As a result, a number of issues, including the guiding concept, specific development model and impact evaluation mechanism for construction sector transformation, must be addressed urgently. To further renew the development concept, seek the appropriate development mode and expedite the transformation of the construction industry, many experts and scholars at home and abroad have conducted a lot of research on the sustainable development ability of engineering from various angles. Some specialists have undertaken relevant studies on green building, such as its definition, present status, future development direction and evaluation system. In the course of long-term research on green building, scholars have gradually formed a consensus that green building is one of the most important measures to alleviate ecological pressure and realize the sustainable development of buildings. However, there are many challenges when implementing green building technology, including conceptual changes, evaluation system, incentive policy and the professional quality of practitioners. In order to foster the development of the green building industry, many scholars have attained remarkable achievements, such as the establishment of a scientific green building evaluation system (ESGB, LEED and BREEAM), a talent cultivation system and a green building materials and green construction technology system, from different perspectives [1,2,3]. Available research on the sustainability of the construction industry and the ecological environment can be summarized into two levels and directions: (1) the internal technical level and (2) the external management level. At the external level, it mainly evaluates, conducts long-term planning and manages the sustainable development of the industry and the ecology from a macro perspective. Its emphasis on research mainly concerns policy formulation and management system construction [4,5,6,7]. Therefore, several scholars have explored strategies to ensure engineering’s long-term development through the perspectives of government regulation, circular economy, construction waste management, realization tools and paths. As for the internal level, the study on the sustainability of engineering projects is mainly carried out from the micro-entity level, which primarily manifests as construction materials and construction technology. Based on this consideration, a number of scholars are interested in conducting research at the level of building materials by studying the selection, manufacturing, use, physical and chemical characterization and effectiveness evaluation of green building materials, in the hope that the application of green materials can meet the requirements of low-carbon environmental protection and sustainability in engineering projects [6,8,9].
To summarize, although there are many studies on the relationship between engineering projects and ecosystems both domestically and internationally, the content and direction of these studies are mainly focused on the construction of evaluation index systems and the macro study of the impact of engineering projects on the ecological environment, including the effects on river flow, hydrological situation, organisms, the environment, the soil and the atmosphere, among others. Secondly, scholars typically focus on the interaction between engineering projects and the ecological environment across the entire life cycle of the project, qualitatively discussing this relation, or detailing the mechanisms and extent of impact at specific stages of the project life cycle. However, few scholars have quantitatively examined the interaction between engineering projects and the ecological environment system.
Given the existing research results, quantitative research to analyze the interaction of the human–engineering–ecological environment in the entire life cycle of engineering projects is actually rare. Because of its correctness and objectivity, the method should be the primary issue that practitioners and related scholars in the building engineering business should consider and investigate. Therefore, this paper defines a quantitative evaluation model from the perspective of project ecosystem and ecological footprint to quantitatively evaluate the interaction between the project and the surrounding ecosystem in order to reflect the project’s sustainable development ability and provide new evaluation criteria and practical guidance for the green development transformation of the construction industry.
This article is organized into seven sections, including an introduction. Following this part, a literature review is presented to outline the background to this research and the current state of investigation regarding ecological footprint, biocapacity, green building and related topics. Section 3 delineates the research methodology and theoretical basis, including the route and framework, thereby clarifying the content, and lays a robust foundation for the study. From the ecological perspective, the project ecosystem is established and analyzed based on the interaction of the elements contained in the system detained in Section 4. Section 5 constructs and details a modified ecological footprint measurement model and highlights its innovative features, including established ideas, principles, selected parameters and so on. Section 6 presents a case study to validate the usability and accuracy of the measurement model, and uses a building area of 58,000 square meters and located in Quzhou City, Zhejiang Province. Finally, the concluding remarks and future works are presented in Section 7.
2. Literature Review
As global awareness of environmental protection increases, experts and scholars have carried out a series of studies on the interaction between engineering projects and the surrounding ecological environment throughout their whole life cycle. Zhou [10] applied symbiosis theory to construct engineering and ecological environment harmonization standards and investigated the method of substance circulation, and the energy exchanges and information transfer between (2008). Shao et al. [11] evaluated the effectiveness of ecological protection in the Sanjiangyuan region by constructing an ecological effectiveness evaluation system based on the analysis of ecosystem structure-service dynamic process trends and the research implied the specific chronicity and difficulty of ecological restoration in certain regions (2017). Xu et al. [12] examined the impacts of inter-basin water transfer projects on aquatic ecosystems using a technical model that integrates hydrological quality, aquatic organisms and ecological–economic compensation encompassing chemical, biological, physical, social and humanities aspects. The conclusion emphasizes that the construction process of water transfer projects should comprehensively consider the complex environmental problems that may occur in different regions (2018). To comprehensively and accurately assess the impact of the ecological environment in highway construction, Zhang et al. [13] developed a new model to combine improved group AHP and FCE that contained six main factors and twenty-two sub-factors from three aspects of the social, ecological and natural environment and displayed the kinds of ecological issues occurring during the construction phase (2020). Liu and Wang [14] combed several problems faced in the development process of China’s green building design standard system and proposed many suggestions to promote the comprehensive development of green buildings (2023).
Some scholars have analyzed the current status and problems of the ecological environment at home and abroad from a macro view and put forward targeted improvement measures and suggestions. Yuan et al. [15] systematically sorted out the concepts, mechanism design and effect assessment of foreign ecological compensation and believed that incentive activities are the key point of ecological compensation, which is also the direction that needs to be concentrated on and researched when designing the ecological compensation mechanism in the future in China (2014). On the basis of more than 30 years of statistical data, He et al. [16] summarized the managerial achievements of typical ecological engineering technologies, analyzed the principles and application of each type of treatment and, meanwhile, determined that mature ecological engineering technologies play a significant role in the prevention and treatment of intense gravitational erosion (2017). Xie et al. [17] considered that as a result of industrialization, urbanization and rapid growth in the overall size of the economy, China is currently facing critical ecological security issues, including ecosystem degradation, serious environmental pollution, resource constraint and so on. After analyzing the basic national conditions of large ecological fragility and serious ecological degradation in China, they proposed relevant suggestions and measures to maintain China’s ecological health, for example, establishing a specific pattern for national ecological security, improving the rule of law system and enhancing natural ecosystem restoration (2018). Li et al. [18] took the Huaqiao water conservancy hub project as an example, systematically analyzed the impact of the construction process on the ecological environment and accordingly proposed reasonable and feasible ecological protection measures (2021). Lv and Liu [19] believe that the establishment of a scientific and reasonable ecological compensation mechanism is an important way to promote China’s ecological environmental protection and coordinate regional development (2023).
Numerous surveys have been carried out to investigate the interaction between engineering projects and the ecological environment through various perspectives including the use of quantitative methods to assess material exchange and energy flow relationships, the amount of resource consumption during a certain stage and the disposal methods of solid wastes (hazardous substance) generated over the whole life cycle of engineering projects, among other factors. Zhang et al. [20] compared the existing carbon emission calculation methods from different perspectives, and identified a more precise approach known as carbon emission coefficients for the relevant calculations (2012). Du et al. [21] analyzed the current situation and potential of the utilization of solid waste in China, highlighting that improper handling of solid waste will bring about problems of resource waste and environmental pollution. Their research scientifically planned a significant path for the classification and resource utilization of solid waste in China (2017). Chen et al. [22] pointed out the deficiencies of China’s solid waste resource treatment system, which involves utilization management mode, legal system construction, economic regulation measures, technology and the industrial market. Considering these deficiencies, they innovatively presented a comprehensive overview of how to carry out the waste resource treatment in the future for our country (2017). From three aspects (databases, models and platforms) Li et al. [23] indicated the advantages and limitations of current urban building energy calculation methods and tools and, after reviewing a large number of publications, proposed some applicable approaches to improve the operational energy-consumption calculation method for urban buildings (2020). Ren and Li [24] calculated China’s inter-provincial building carbon emissions from 2011 to 2019 by the social network analysis method through the whole life cycle perspective, and elaborated the evolution of the spatial correlation network of carbon emissions and its influencing factors (2024).
Currently, the ecosystem carrying capacity is under threat, and the renewable capacity of resources and energy has been further weakened. Consequently, research on sustainable development capacity is garnering increasing attention from experts and scholars. BCL Yin et al. [4] explored the present situation of construction industry sustainability in Singapore and discovered a widespread awareness within the industry of the importance of sustainable construction and its impact on the environment; meanwhile, implied government regulatory and incentive programs may be able to drive positive change (2018). Plenty of resources are consumed and a great deal of solid wastes are generated during the construction phase of engineering projects. LB Jayasinghe and D Waldmann [25] proposed a Building Information Modeling (BIM)-based system to enhance the sustainability of the construction industry by storing information about the materials and components of buildings and effectively managing the recycling of materials and the reuse of components (2020). From a technological point of view, SA Khan et al. [26] applied 3D-printed concrete structure technology to enhance the sustainability of construction projects, and this offers unlimited potential for material flexibility, cost savings, labor costs, design flexibility and operational flexibility (2021).
Based on existing research findings, the current research on the relationship between engineering development and ecological protection is mainly embodied in three aspects: (1) establishing specific environmental indicator evaluation systems to qualitatively analyze the adverse impacts on the ecological environment caused by construction projects and to propose rational measures for protecting or restoring ecosystem accordingly, but this kind of research placed emphasis on qualitative evaluation, and allocated insufficient attention to quantitative analysis; (2) attempting to adopt quantitative methods to count the total amount of carbon emissions, solid wastes and energy resources consumed during the construction or operation of engineering projects, so as to demonstrate their environmental impact. However, these studies mainly focus on a certain stage of the project, such as the construction or operation period, and there are inadequate research studies on the interaction between the whole life cycle of the project and the ecological environment, and an even fewer number of control indicators are introduced to verify the degree of effect of carbon and pollutant emissions on the environment at a certain stage of the project and (3) under the influence of resource constraints, ongoing research into sustainability are gradually deepening, but the research studies mainly concentrate on the sustainable development of the industry and the region layer, with scant attention being given to the sustainability of individual buildings or complexes. In light of these gaps, this paper, from an engineering ecological standpoint, develops an ecological footprint measurement model for individual engineering projects based on the whole life cycle. It calculates the ecological footprint of the whole life cycle of a certain project, and measures the degree of sustainable development of individual projects by comparing them with the indicators of ecological carrying capacity in the specific surrounding area.
3. Research Methodology and Theoretical Basis
3.1. Research Framework
Based on engineering ecology, this paper introduces an evaluation methodology for quantitatively assessing the sustainability of engineering projects. In order to comprehensively and objectively elucidate the interaction between the project and the surrounding environment, it is essential to define the model components and the study’s scope within both the temporal and spatial dimensions during the modeling process.
From the temporal dimension, the magnitude of the model needs to be investigated throughout the entire life cycle of the project in order to minimize computational errors as much as possible. The human–engineering–ecological ecosystem, analogous to a natural ecosystem, comprises the model’s material entity base, data information, assessment indexes and other components. Figure 1 depicts the research technical route and framework.
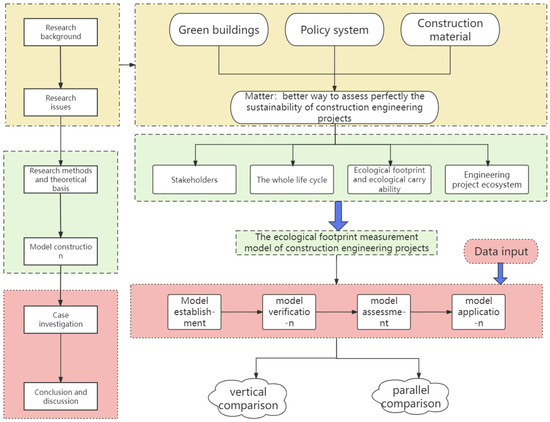
Figure 1.
The research route and framework.
The technology route and framework is comprised of three major parts: (1) research background and research questions: identifying research gaps by summarizing and demonstrating the current status of research on sustainability in the construction industry with the aim of proposing an evaluation method that can quantify the degree of sustainability of an individual construction project; (2) theoretical foundation, methodology and model development: drawing upon the outcomes of prior research, this part establishes an ecological footprint assessment model for individual construction projects from the perspectives of stakeholders, the whole life cycle, ecological footprint and engineering ecology and (3) case application and result analysis: validating the applicability and precision of the measurement model through practical case applications, and at the same time, due to the depth of the investigation, putting forward the current limitations of the thesis as well as the direction of future research.
3.2. Construction Project Stakeholders
Building on existing stakeholder studies [22,27,28,29], this paper concentrates on the functions, rights and behaviors of stakeholders and their influence on the project, according to the direct degree of a stakeholder’s involved in the project and their degree of importance. This paper categorizes the project’s stakeholders into two groups (dominant stakeholders and auxiliary stakeholders), and totals 11 types of engineering project stakeholders, as shown in Table 1. The abbreviation “SH” is used to denote stakeholder. As can be seen from Table 1, there are five types of dominant stakeholder (those who interact “face-to-face” with the construction project) directly involved in the various stages of the project in different work activities. During the stage of conception, construction, operation and demolition, these stakeholders play an extremely important or even decisive role in the individual or group organization. There are six types of auxiliary stakeholder (those who exert influence on the construction project indirectly).

Table 1.
Classification of stakeholders in construction projects.
As depicted in Table 1, different stakeholders have various meanings and roles in the whole life cycle of a construction project. Among the dominant stakeholders, the investment unit represents the investor, the developer or the owner serving as the project’s initiator and primary force; the survey and design unit executes the survey and design work in accordance with the engineering design requirements given by the developers, the relevant industry norms and the national laws and regulations; the construction unit predominantly undertakes the construction tasks in the process of engineering and construction, including the concrete works, utility installation, decorations and so on; the supervision unit, a professional firm appointed by the owner, supervises, manages and guides the construction process; the operating unit, a specialized team, is accountable for the monitoring, maintenance, management and optimization of the project’s utilization; the relevant government departments, involving a series of governmental departments such as Urban Construction and Administration, the Planning Bureau, Transportation Bureau, etc., which are responsible for the acceptance inspection and management of the project within the scope of their respective responsibilities; material and equipment suppliers are in charge of providing construction materials, energy resources and specialized equipment for the construction and operation phase; environmental protection departments and consulting and assessment agencies are mainly responsible for monitoring, assessing, rectifying and repairing the negative environmental impacts arising from the construction and operation of the project and, finally, the general public and the news media refer to social groups with a heightened interest in the project’s entire life cycle.
3.3. Ecological Footprint and Ecological Carrying Capacity Theory
3.3.1. Ecological Footprint Theory
The ecological footprint is the biologically productive space that can supply resources or absorb waste, typically defined as the area of land with varying biological productivity that sustains the population of a region and absorbs waste [30,31]. (Here, biological productivity is measured in terms of production per unit area of land).
The premise of the ecological footprint calculation is based on two assumptions: firstly, the resources, energy and waste generated by human consumption can be retained and measured and, secondly, that the factors consumed by humans can be equated to biologically productive land areas that provide these energy and resources and absorb waste. Bioproductive land denotes the spatial expanse of biological productivity, which is customarily classified based on its biological productivity. The land may be divided into six primary categories: arable land, grassland, forested land, fossil fuel land, construction land and water area. The ecological footprint is significant for assessing whether people can achieve sustainable development by relying on natural supplies [32,33]. Its purpose is to quantify the rationality of the relationship between human demands and the capacity of the natural environment to supply these demands. This metric aims to inform and direct human development for the present and the future.
3.3.2. Equalization and Yield Factors
The utilization of ecological footprint methods to assess the ecological status and future sustainability of a region or country begins by identifying different types of biologically productive land and their areas within the region [34,35,36]. Generally, different types of biologically productive land have different biological productivity. Consequently, the area of biologically productive land that is required for the consumption of all energy, resource or waste cannot be simply aggregated horizontally to obtain the ecological footprint due to the disparities in each area’s biological productivity. Therefore, it is essential to apply an equalization factor and a yield factor to transform the areas of the six types of biologically productive land into a standard area based on national or global average bioproductivity. This standardized area can then serve as the basis for horizontal summation to determine the ecological footprint of the region.
The equalization factor, denoted as r, is defined by the ratio of the average productivity of a type of biologically productive land in a region to the global or national average productivity of various types of biologically productive land. The equalization factor addresses the challenge that different types of biologically productive land in the same country or region cannot be directly aggregated horizontally due to differences in their respective biological productivity.
The formula for its calculation is as set out below:
where is the total average productivity of biologically productive land in a region of , is the national average productivity of all types of biologically productive land and j is the j type of biological productive land in a certain area.
The value of the equalization factor is not set in stone, but it is relatively straightforward to calculate and measure; thus, it can be directly applied according to the mature studies already conducted by experts and scholars. The equalization factors for the six biologically productive types of land are presented in Table 2 below.
Table 2.
Values of the six biologically productive land equalization factors [37].
The yield factor, denoted as y, is primarily employed to address the problem of differences in ecological productivity among biologically productive land areas of the same type across different countries or regions by introducing the concept of “world average ecological productivity”, which serves as a uniform quantitative benchmark and allows for the direct aggregation of biologically productive lands of the same type from various countries and enhances the accuracy of the results of the calculation outcomes [38,39].
The formula for its calculation is presented as set out below:
where is the national or regional average productivity of biologically productive land in category j, is the global average productivity of biologically productive land in category j and j is the j type of biological productive land in a certain area.
3.3.3. Ecological Footprint Measurement
In general, the ecological footprint model [33,40,41,42] is utilized to measure the area of biologically productive land required for the population of a region or country, and which can afford resources and energy and absorb the various types of waste. After specifying the six types of biologically productive land and introducing the concepts of an equalization factor and a yield factor, the process of calculating the ecological footprint of a region is delineated below:
where is the total population of an area, is the area of biologically productive land in category j required for human survival in a given area, is the equalization factor of the jth category of biologically productive land in a certain area and is the per capita ecological footprint of a region.
The following mathematic model is carried out with a clear general formula:
where is the per capita area of biologically productive land in category j required for consumption item i in a given area, is the per capita expenditure of consumption item i in a given area and is the national or world average productivity for consumption item i.
where is the total production of consumption item i in a given region, is the total imports of the ith consumption item in a given region and is the total exports of consumption item i in a given region.
The following formulas are obtained by mixing the above equations:
3.3.4. Calculation of Ecological Carrying Capacity
When calculating the ecological carrying capacity of a region, it is essential to determine the area of various types of biologically productive land in the region. According to the relevant statistical data for the country or region, we can incorporate the equalization factor and the yield factor into the calculation. This allows the ecological carrying capacity of the region to be quantitatively expressed in terms of the area of biologically productive land [43,44,45].
The ecological carrying capacity of an area is calculated by the following formula:
where is the total area of biologically productive land of type j in a given area, is the yield factor of the jth type of biologically productive land in a given area, is the total population of an area and is the per capita ecological carrying capacity of an area.
3.3.5. Ecological Deficit and Ecological Redundancy
Experts and scholars widely agree that sustainable development must be based on sustainable ecological carrying capacity, which is more in line with the main direction of this study [46,47,48]. Measuring the ecological footprint of a region and comparing it with its ecological carrying capacity can reveal the current ecological status: ecological redundancy or ecological deficit. So, it is significant to calculate the extent of impact on the ecological environment caused by the consumption of resources and energy as well as the elimination of wastes, and this can help people to employ targeted methods for the protection of the ecological environment.
When there is a difference between the ecological footprint and the ecological carrying capacity, the region will show an ecological deficit or ecological redundancy, which is specifically manifested in the following: when the ecological footprint is larger than the ecological carrying capacity, the region shows an ecological deficit, whereas, in the opposite situation, it shows the ecological redundancy condition.
where is ecological deficit in an area, is the ecological redundancy in a region, is the ecological footprint of a region and is the ecological carrying capacity of an area.
According to the relevant standards, we can evaluate whether the ecological environment of a region is in a state of sustainable development. And another indicator, called the ecological pressure index of the region, which is generally expressed as the ratio of the per capita ecological footprint to the per capita ecological carrying capacity, reflects the degree of pressure on the ecological environment of the region.
where EFI is the ecological pressure index of the region and ef is the per capita ecological footprint.
From the relevant literature, it can be found that when > 0.8, the ecological condition of the area will be in an unsafe state [44].
Ecological redundancy indicates that a region’s ecological capacity is adequate to support the survival of the people in the region, and the supply of biologically productive land in the region is greater than the demand for human consumption, which not only specifies that the ecological capacity of the region is in the healthy state, but implies that the region will have a robust capacity for sustainable development over a foreseeable period. Ecological deficit, on the other hand, indicates that the ecological load of a region has exceeded its ecological capacity, meaning that the area of biologically productive land provided is not enough to satisfy the demands placed on it to ensure people’s survival. So, in this case, there are two measures to choose: one is to compensate for the current ecological capacity shortfall by importing external energy flows, the other is to exploit additional natural resources to make up for the deficit. When a region is in ecological deficit, the ecological environment is unhealthy and its capacity for sustainable development is compromised.
4. Analysis of Internal Relations in Engineering Projects Based on the Ecological Perspective
4.1. Division and Analysis of the Whole Life Cycle Stages of Engineering Projects
According to the two types of stakeholders identified in Table 1, five types of dominant stakeholders can be considered as the main trunk, while six types of auxiliary stakeholders can be seen as the branches. In accordance with the principle that different stakeholders enter and exit at different stages of a construction project, the whole life cycle of a construction project is segmented into five sections: the investment and decision-making phase, the design planning phase, the construction phase, the operation and maintenance phase and the dismantling and recycling phase, as depicted in Figure 2.
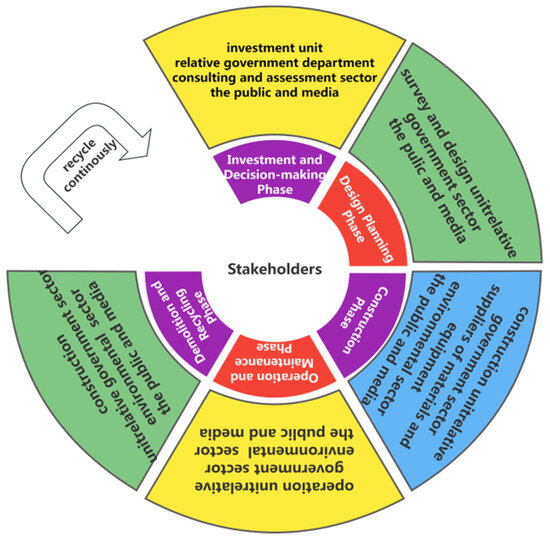
Figure 2.
Distribution of stakeholders in each phase of the whole life cycle of construction projects.
It is crucial to note that the division of engineering project stakeholders into “dominant” and “auxiliary” is not fixed, and will evolve across different life stages. The dominant stakeholders in one stage may become auxiliary stakeholders in the next stage, for example, the survey and design unit is the dominant stakeholder in the design planning stage, but in the construction stage, it only plays an auxiliary role in advising and guiding the process and sequence of construction and procurement of engineering equipment. Consequently, in order to facilitate the division of the whole life cycle stages and to make the conclusions clearer and more straightforward to present in the study, the specific tasks at each stage of the project’s life cycle are centered around a dominant stakeholder as the core.
Human initiative will always have an impact on the project and its surrounding ecological environment in all aspects, such as project quality, schedule, cost and ecological and environmental friendliness, among others. This paper examines the interplay between humans, engineering and the environment and the impact of humans through engineering on the ecological environment at each stage of the whole life cycle of engineering projects. The ecological impacts of dominant stakeholders at different stages of the engineering life cycle are detailed in Table 3, while Table 4 details the impacts of auxiliary stakeholders.
Table 3.
Ecological impacts of dominant stakeholders at different stages of the whole life cycle.
Table 4.
Ecological impacts of auxiliary stakeholders at different stages of the whole life cycle.
4.2. Analysis of Construction Project Ecosystems and Their Internal Framework
In the case of the natural ecosystem, it is a composite system comprising organisms and their habitats, similarly, in a construction project, humans, engineering and the ecological environment form the engineering project ecosystem. For the project ecosystem, it could be established by means of a comparison with the ecological view of the natural ecosystem of the material cycle, which means energy flow, information transfer and other ecological functions being an analogy for an engineering project ecosystem’s various work content, the ecological level being an analogy for the project ecological hierarchy and components being an analogy for the project ecosystems of the main body involved [49]. The method of analogy is employed to visualize the engineering project ecosystem. Therefore, according to the concept of project ecosystems in a broad sense, the construction project entity, project stakeholders and the surrounding ecological environment constitute the project ecosystem. The conflict, mutual help and symbiosis between them are also the focus of this paper.
Stakeholders are given the corresponding necessary survival conditions by the natural ecological environment. Construction projects, while fulfilling stakeholder requirements through functional objectives, will cause some interference to the natural ecological environment or may discharge certain hazardous pollutants into the ecological environment at the same time. The ecological environment is not only supplying the material conditions for stakeholders and construction but affording double environmental damage pressure from two factors. The specific performance of relationships among the main entities of the construction ecosystem is shown in Figure 3.
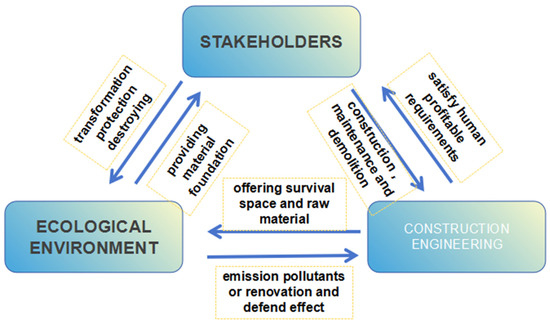
Figure 3.
Composition and interrelationships in construction project ecosystem.
5. Ecological Footprint Measurement Model for the Whole Life Cycle of Engineering Projects
5.1. Model Construction Ideas
By combining the definitions of project life cycle and ecological footprint [50,51], we obtain the definition of a project’s whole life cycle ecological footprint: within the whole life cycle, the area of biologically productive land required for the consumption of energy and resources and wastes elimination (mainly construction wastes and CO2) of a certain project. This includes the energy and resources consumed during the whole process of a project from the investment decision stage to the demolition and recycling stage. Consequently, aligning with the definition of the ecological footprint measurement of the whole life cycle of the project, the paper, based on the project’s ecosystem, comprehensively considers the ecological footprint of the whole life cycle of the project in terms of various types of energy, resources, CO2 emissions and the consumption of various wastes. So, the research aims to develop a relatively specialized, standardized and quantitative ecological footprint measurement model.
In prior research by scholars and specialists, the role of stakeholders within the ecosystem of engineering projects was not sufficiently emphasized, and the research outcomes were inadequate. In actuality, stakeholders, referred to as the “human” element in the ecosystem of engineering projects, have far-reaching effects on the success or failure of engineering projects, the protection of the ecological environment and even the degree of sustainable growth of the region [52]. Therefore, this paper maintains that the ecological footprint measurement of project ecosystems should be divided into two levels: the first is the ecological footprint measurement of project ecosystems, the second seeks to incorporate the influence of stakeholder factors, which stands for optimizing the original model by taking people as an influencing factor.
5.2. Basic Framework of the Model
Three phases are employed to compose an ecological footprint measurement model for the whole life cycle of engineering projects: (1) calculation of the overall ecological footprint of the engineering ecosystem, (2) calculation of the ecological footprint at each life stage of engineering projects and (3) optimization of the model by incorporating the coordination factors of stakeholders. The construction process is detailed as below:
a. The total life cycle measurement model for the project:
where is the total ecological foot print of the whole life cycle of the project, is the ecological footprint of the investment decision stage of the project, is the ecological footprint of the design planning stage of the project, is the ecological footprint of the construction phase of the project, is the ecological footprint of the operation and maintenance phase of the project and is the ecological footprint of the dismantling and recycling phase of the project.
b. Calculating the several life stages of the project: .
c. Considering stakeholder factors in each stage and adding coordination factors to optimize original model.
From the fundamental concept and structure of the ecological footprint measurement model for the whole life cycle of engineering projects, it can be seen that the model is applicable not only to individual construction projects but also to a range of construction projects including water conservancy projects, municipal projects, and railroad projects. The difference between different types of construction projects is that the involvement of various stakeholders at different optimization stages may result in distinct coordination factors, which may lead to variations in the ultimate optimization outcomes.
5.3. Project Life Cycle Ecological Footprint Measurement Model
5.3.1. Coordination Factor Coefficient
There is no precedent for introducing “human” as a coordination factor into the ecological footprint measurement model of engineering projects. This is due to the fact that humans are dynamic organisms influenced by a broad spectrum of internal and external factors that may affect both their work efficiency and attitude toward the ecological environment, such as psychological, work attitude, work motivation, work incentives, remuneration and feelings. The research on the role of “human” in this paper represents an effort to transition relevant studies from a qualitative to a quantitative domain. The construction project analyzed in this paper is only one kind of construction project. Therefore, to ensure the objectivity of the optimized model to a high degree, the research defines the influence of stakeholders on the ecosystem of engineering projects in the form of quantitative intervals when conducting specialized research.
According to the universal standard, when the attitude of stakeholders to ecological protection is at the normal level, which means individuals do not actively maintain or destroy the surrounding environment, and complete their own tasks in a step-by-step manner, the coordination factor can be set as = 1, which serve as the dividing line between positive and negative impact values. Through the statistical analysis and summarization of extensive data, when stakeholders have a positive impact on the sustainable development of engineering projects and ecological environment protection, the value interval is [0.1, 1), while conversely, the value range is (1, 5].
When both dominant and auxiliary stakeholders have a positive influence, the coefficient is 0.1. If the dominant stakeholder behaves positively and the auxiliary stakeholder behaves normally, the coefficient is 0.3. When the dominant stakeholder behaves terribly and the auxiliary stakeholder behaves normally, the coefficient can be regarded as 3.5, and when both dominant and auxiliary stakeholders behave negatively, it can be taken as 5. Although the project involves several stakeholders simultaneously, the paper only considers the significant influence of the dominant stakeholder. As for the auxiliary stakeholders who have positive or negative influence, the range of coordination factor coefficients and the method of selection may remain consistent with this approach but more complex, as well as the specific value undergoing more in-depth discussion and investigation based on the actual situation in future study.
5.3.2. Equalization Factor Matching
From the definition of ecological footprint, we understand that the essence of ecological footprint is the area of biologically productive land and water required for human consumption of resources and energy and the disposal of human-generated wastes. Applying the ecological footprint methodology to engineering projects, the energy consumed by people can be attributed to fossil fuels, the resources consumed can be sourced from construction materials and water resources and the wastes generated can originate from construction wastes and CO2.
Generally speaking, the equalization factors for different energies, resources and wastes are determined by those sources corresponding to a certain type of bioproductive land or by which type of bioproductive land is needed for its absorption. For example, CO2 could be absorbed by forest land, so its equalization factor will be equated to the one for the forest land. The specific correspondence between the resources, the energy consumed and the wastes generated throughout the project’s whole life cycle and the six types of biologically productive land, as well as the their per unit land area required, are detailed in Table 5 below.
Table 5.
Correspondence between energy, resources and construction waste and bioproductive land [53,54,55,56].
One of the fundamental principles of ecological footprint analysis is that the volume of resources, energy consumed and waste emitted by human beings can be translated into the area of biologically productive land that produces or absorbs them. Therefore, when calculating the ecological footprint of a project, the initial step is to ascertain the primary types of energy, resources and waste consumed and their correspondence with the six types of biologically productive land. This paper determines the correspondence between substances and land types in accordance with the categorization guidelines outlined in the technical manual of the China Ecological Footprint Report [53], and combines the results of existing research to identify the unit biologically productive land area corresponding to each substance.
5.3.3. Ecological Footprint Measurement Model for Each Stage of the Whole Life Cycle of a Construction Project
(1) The Ecological Footprint Measurement Model in the Investment Decision Stage
The consumption of energy and resources (primarily fossil energy consumption) and the generation of major wastes (CO2) in this stage constitute a minor portion of the project’s entire life cycle, and the corresponding ecological footprint is also comparatively small. Therefore, we can employ a proportional value of the ecological footprint from the construction phase to represent it. Under the circumstance, it is straightforward to calculate without ignoring the impact of its ecological footprint on the whole life cycle of the project. This proportionality coefficient is called the conversion factor [55,57], and is denoted by the symbol θ.
The ecological footprint in the investment and decision-making stage is calculated by the following formula:
where is the conversion factor for the ecological footprint of the investment decision phase relative to one of the construction phases, and is taken to be 0.55% [58,59].
Due to the limitations of the calculation method and the depth of the study, the research only conducts a preliminary discussion when adding the stakeholder factors in the calculation process. Concurrently, in order to increase the accuracy and objectivity of the results, and to reflect the extent of the difference, based on the aforementioned discussion, four working conditions are selected ( = 0.1, = 0.3, = 3.5 and = 5) to optimize the ecological footprint measurement model.
The first working condition: = 0.1:
The second working condition: = 0.3:
The third working condition: = 3.5:
The fourth working condition: = 5:
In order to reflect the variability of the final data, the data were selected to be more differentiated, but still within a reasonable range.
(2) The Ecological Footprint Model for the Design Planning Stage
The calculation of this phase is similar to the investment and decision-making stage. Therefore, its calculation model is:
where is a conversion factor for the ecological footprint of the design planning phase relative to the ecological footprint of the construction phase, which takes the value of 0.55% [58,59].
With the import of the human coordination factor, other phases will be optimized in a similar way to the investment and decision-making stage and will not be discussed here.
(3) Ecological Footprint Measurement Model for the Construction Phase
This phase is a crucial stage in the whole life cycle, consumes the most energy and resources, and the corresponding demand for ecological carrying capacity is also greater. The ecological footprint of the construction phase primarily consists of the energy consumed in the production, transportation and processing of building materials (called the source energy of building materials), the consumption of energy and resources in the execution process, the absorption of CO2 and the construction land. The calculation formulas are as follows:
refers to the ecological footprint of energy consumption during the construction phase of a building, means the ecological footprint of resource consumption during the construction phase, refers to the ecological footprint of CO2 consumption during the construction phase and refers to the ecological footprint of the land used for construction during the construction phase.
where n is the amount of resources consumed, k is the amount of implementation activity during the construction phase, is the area of land per unit of bioproductive land required for energy consumption in the extraction, production and transportation of the type i resource. is the total amount of consumption of the ith resource, is the equalization factor of the energy consumption in the extraction, production and transportation of the ith resource, is the per unit energy consumption in the extraction, production and transportation of resource type i, is the per unit area of biologically productive land demanded by the energy that the kth type of construction activity utilized during the construction phase of the building, is the volume of the kth type of construction activity during the construction phase of a building, is the unit amount of energy consumed by the kth type of construction activity and is the equalization factor for the energy consumed by the kth construction activity.
where is the area of land per unit of biologically productive land required for the consumption of resource type i during the construction phase and is the equalization factor for the biologically productive land required for the consumption of resource i during the construction phase.
where is the area of land per unit of biologically productive land required for the elimination of CO2, is the equalization factor for the type of biologically productive land needed to absorb CO2, is the total volume of the kth type of construction activity, is the carbon emission factor of the energy used in the extraction and transportation of the ith resource during the construction phase and is the carbon emission factor of the energy used in the kth type of construction activity during the construction phase.
where is the total area of land used for construction during the construction phase and is the equalization factor that indicates the construction land.
With the introduction of the human factors coordination factor, the model is optimized in a similar way to the investment decision stage and will not be discussed here.
(4) Ecological Footprint Measurement Model for Operation and Maintenance Phase
The ecological footprint of the operation and maintenance phase primarily originates from three aspects: (1) maintaining the normal operational functions of the construction project, which includes all kinds of machinery, electrical equipment and specialized engineering subsystems such as refrigeration systems and signaling systems, with electricity being the primary energy source; (2) the personnel’s consumption of water resources and the management of domestic waste and (3) the absorption of CO2 resulting from energy consumption. Thus, the ecological footprint of the operation and maintenance phase is calculated as detailed below:
where is the ecological footprint of energy consumption during the operation and maintenance phase, is the ecological footprint of resource consumption during the operation and maintenance phase, is the ecological footprint of the CO2 absorbed during the operation and maintenance phase and N: is the number of years the building has been in operation.
where is the area of biologically productive land occupied per unit energy consumption of type i during the operation and maintenance phase, is the total amount of energy called type i in the operation and maintenance phase, is the equalization factor for the type of biologically productive land corresponding to energy source i in the operation and maintenance phase and n is the number of types of energy consumed in the operation and maintenance phase.
where is the area of per unit biologically productive land required for the consumption of resource i during the operation and maintenance phase, is the total amount of resource type i consumed during the operation and maintenance phase, is the equalization factor for the biologically productive land required for the consumption of resource type i during the operation and maintenance phase, is the area of per unit biologically productive land required to dispose of waste during the operation and maintenance phase, is the total amount of waste generated per year during the operation and maintenance phase and is the equalization factor for the biologically productive land required to dispose of waste during the operation and maintenance phase.
where is the carbon emission factor of the ith energy source in the operation and maintenance phase.
With the introduction of the human factors coordination factor, the model is optimized in a similar way to the investment decision stage and will not be discussed here.
(5) Ecological Footprint Measurement Model for the Demolition and Recycling Phase
In this phase, the ecological footprint is mainly generated from three aspects: firstly, the energy consumption of large-scale mechanical equipment and transportation tools such as excavators and trucks used in the demolition; secondly, the CO2 emissions resulting from the combustion of fossil fuels and, thirdly, the accumulation area of non-recyclable construction waste following demolition. Since the consumption of resources and energy in the demolition and recycling phase is relatively small, and the statistical process is cumbersome, for the sake of a simple calculation and relatively accurate calculation results, the ecological footprint of the demolition and recycling phase is similar to the ecological footprint calculation of the investment and decision-making phase, and also incorporates a conversion factor. The detailed calculation method is outlined below:
where is the conversion factor for the ecological footprint of the demolition and recycling phase of a building project relative to the construction phase, which takes the value of 0.06% [58,59].
With the introduction of the coordination factor, the model is optimized in a similar way to the investment and decision-making stage and will not be discussed here.
5.4. Model Characteristic Analysis
The model takes into account the ecological footprint of each stage from the project ecosystem perspective in a more comprehensive way, which is based on the whole life cycle. It quantitatively demonstrates the relationship between the project’s demand and the supply available in surrounding ecological environment. At the same time, the introduction of the stakeholder equalization factor tries to further optimize the ecological footprint measurement model. In the process of optimization, a range of values for these coordination coefficients is provided, which can be selected for optimization in different types of projects. This significantly enhances the accuracy and objectivity of the calculation outcomes.
The purpose of the model is to encourage project managers (investors or owners) to focus not only on the function, economic and social benefits of the project, but also on the ecological optimization of the whole project ecosystem. By comparing the ecological footprint of the project with the ecological carrying capacity of the project site at different levels and analyzing the optimization of the model through the equalization factor, the model can provide guidance and reference for stakeholders at all stages to judge whether to take targeted measures to reduce the ecological footprint.
6. Case Studies and Analysis
6.1. Research Objective
Quzhou sports center is the world’s largest earth-covered building complex, with a total land area of 482 acres, including “one stadium and three halls”, the ”one stadium” being a 30,000-seat stadium and the “three halls” containing a 10,000-seat gymnasium, a 2000-seat swimming pool, a comprehensive training hall, an underground parking lot, a sports park and outdoor engineering. The research study takes Quzhou stadium as its case. Quzhou stadium has a total construction area of about 58,000 square meters, with the substruction having adopted a frame-shear wall structure and being covered with a complete ring-shaped steel canopy, which is supported by only nine support points resting on the lower concrete sheet wall. The construction of the project was implemented in PPP mode, which means the cooperation model between government and private capital, with a total investment of about 3.54 billion yuan, and a preparation period of 3 years, a construction period of 2 years, completion recorded on 30 September 2021 and an operation period of 20 years [60].The geographical location of Quzhou city is shown in Figure 4 below.
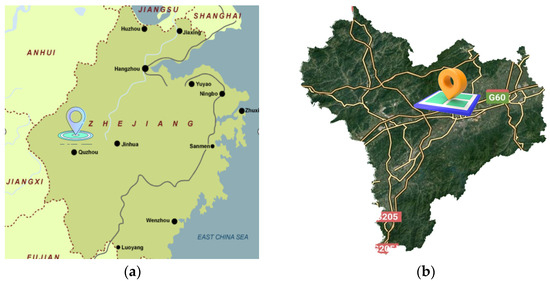
Figure 4.
(a) Location of Quzhou City and (b) location of Quzhou sports center.
6.2. Model Parameters
During the construction of the Quzhou stadium, over 60 different types of building materials and raw materials were utilized, according to the statistical data, and six kinds of building materials and resources consumed on a large scale are selected for calculation. The specific quantities of the total amounts of consumed materials and resources are shown in Table 6 below:
Table 6.
Consumption of Six Main Resources for the Quzhou Stadium.
During the construction phase of the stadium, in addition to the consumption of resources, the ecological footprint also stems from the energy consumed during the production and transportation of building materials (usually called the source-energy of building materials), energy consumption during the construction process, the absorption of CO2 and construction waste, as well as from the land used for construction, details of which are presented in Table 7 and Table 8 below.
Table 7.
Per unit energy consumption of various construction activities during the construction phase of the stadium [61].
Table 8.
Source-generated energy of major building materials during the construction phase of the stadium [62].
The carbon emission factor denotes the amount of carbon-containing substances emitted per unit of energy consumption from a specific energy source during its utilization. Generally, following the IPCC protocol, the carbon emission factor of a certain energy can be considered to be unchanged during the relevant calculation process. The two phases (construction phase and operation and maintenance phase), consume significant amounts of energy and resources, and concurrently, generate substantial carbon-containing substances, primarily in the form of CO2. Therefore, the prerequisite for measuring the carbon emission of engineering projects is to ascertain the carbon emission factor of the energy and resources consumed by buildings. The variety of resources and energy used during the construction phase of a project makes it challenging to account for and to measure them comprehensively. Thus, according to the research results of previous researchers, the carbon emission factor of energy and resources, which are cited in this study, are presented in Table 9 below.
Table 9.
Carbon emission factors of major energy sources and resources [63,64,65].
The ecological footprint during the operation and maintenance phase of the project mainly stems from the various types of energy and resources consumed in order to maintain the normal use of the project functions, as well as the CO2 and domestic waste generated. For the calculation period, all kinds of consumption and outputs are counted on an annual basis. According to the relevant statistics, the consumption and outputs of resources and energy in the phase are shown in Table 10 below.
Table 10.
Total resource and energy consumption and waste generated during the operation and maintenance phase of the stadium.
6.3. The Whole Life Cycle Ecological Footprint Calculation and Analysis
The total ecological footprint, as well as the ecological footprint for each phase of Quzhou stadium can be obtained by inputting the relevant data into the ecological footprint calculation model. The results are shown in Table 11 below:
Table 11.
Ecological footprint of Quzhou stadium in various stages of the whole life cycle.
The data above indicate that the ecological footprint is largest during the construction phase, followed by the operation and maintenance phase, with the dismantling and recycling phase having the smallest impact. From Figure 5, we can recognize the variation tendency of the whole ecological footprint, which initially increases and then declines, peaking during the construction stage. This phenomenon can be analyzed from two dimensions: (1) the spatial component, which involves the elements of the ecological footprint and (2) the temporal component, which pertains to the duration of each phase. Through the first perspective, the construction phase uses substantial energy and resources and produces significant CO2 and waste, thus, resulting in a larger footprint. The composition of the ecological footprint of the operation phase is similar to that of the construction phase, although its operation cycle period is longer, but its ecological footprint within the operation cycle is still not higher than that of the construction phase, which may be due to the fact that the amount of resources used in the construction phase (especially the building materials) generates more ecological footprints. Therefore, improving the utilization of building materials and developing new green building materials is one of the key measures to improve the sustainability of the project. From a temporal standpoint, the key reason that the first two phases have a higher ecological footprint than the recycling and dismantling phase is the extended duration of project planning, design and construction (3 years), compared to the much shorter dismantling phase (approximately 2–3 months). The extended period results in a higher ecological footprint, so there is a requirement to improve the level of technology and management in the early stages of the project, which in turn improves efficiency and shortens the preparation period.
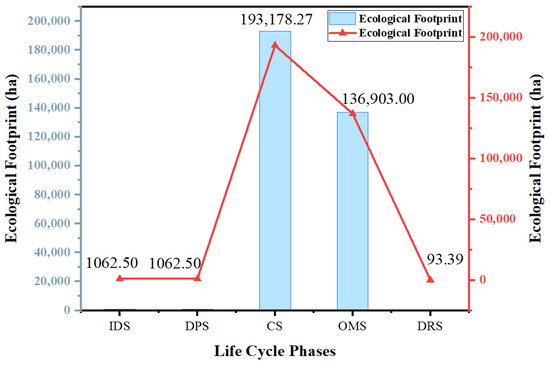
Figure 5.
The variation in ecological footprint at each life stage.
During the construction phase, the ecological footprint of energy consumption is 15,699.46 nha, the ecologial footprint of resource consumption is 175,978.93 nha, the ecological footprint generated by the absorption of CO2 is 1281.9 nha and the ecological footprint of the construction land is 217.98 nha. In this phase, the ecological footprint from resource consumption constitutes the largest share, approximately 91.1%, which includes of six main building materials, as depicted in Figure 6.
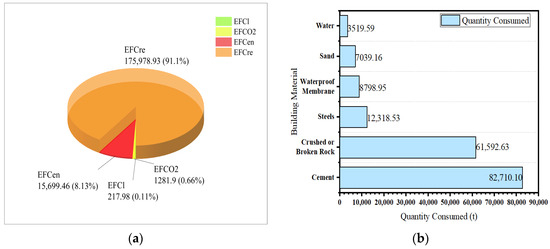
Figure 6.
(a) The proportion of ecological footprint in the construction phase and (b) the ecological footprint of six main building materials in the construction phase.
The ecological footprints of the six primary materials during the construction phase are shown in Figure 6b, with cement having the largest ecological footprint, followed by crushed or broken rock and steel. According to the analysis of the figures, the following conclusions can be drawn: (1) despite the quantity of crushed stone exceeding that of cement, its total ecological footprint is smaller, which is mainly due to two factors: firstly, the amount of cement is not so small and, secondly, cement possesses a higher “source energy”. Therefore, regulating the dosage of cement or utilizing new green cement materials in the future construction process can effectively reduce the ecological footprint of the project’s construction phase. (2) Apart from steel, the dosage of waterproofing membrane is smallest, but its ecological footprint is even higher than that of sand and water, likely due to the production efficiency of this material being relatively low now and (3) sand and water exhibit a lower ecological footprint since they are readily available and can be used without further processing. Obviously, improving the manufacturing efficiency of various types of building materials and developing innovative green building materials are pivotal in reducing the ecological footprint of the construction phase.
The ecological footprint of resource consumption, energy consumption and absorption of CO2 during the operation and maintenance phase are 42,735 nha, 759.5 nha and 93,408.5 nha, respectively, as illustrated in Figure 7 below. Notably, the ecological footprint of energy consumption in this phase exceeds that in the construction phase.

Figure 7.
The proportion of ecological footprint in the operation and maintenance phase.
This phenomenon is mainly due to the fact that all types of energy consumption reach their peak in the operation phase. The conclusion is in line with the research of some experts and scholars [66,67,68], further validating the correctness of the practical application of the measurement model. The ecological footprint generated by energy consumption and CO2 absorption constitutes 99% of the total ecological footprint in this phase, indicating that project operators ought to pay more attention to the development of scientific operation programs, energy-saving and CO2 emission-reduction programs, which can substantially decrease the ecological footprint of the operation and maintenance phase. The resources consumed in the operation and maintenance phase are mainly water resources, and the ecological footprint generated by the resource consumption in this stage has notably decreased, mainly because the construction phase consumes a large amount of building materials, which bring out a good deal of ecological footprint. Relying on the above analysis results, we can identify effective strategies to minimize the ecological footprint during the operation stage: (1) focus on conserving energy use during the operation process, particularly electric energy, and enhance the utilization of clean energy sources such as solar and wind power; (2) emphasize energy saving and emission reduction design in the initial stages of the project to reduce the project’s ecological footprint at its source and (3) further develop new building material technologies and green, low-pollution and low-energy building materials.
6.4. Comparative Analysis of the Ecological Footprint of the Project and the Local Ecological Carrying Capacity
According to the data from relevant statistical yearbooks, the per capita annual ecological carrying capacity of Quzhou City and Zhejiang Province based on the national average ecological space can be found. Through these related literature [69,70,71], the per capita annual ecological footprint of urban areas in Zhejiang Province has increased rapidly over the last two decades, with an average annual growth rate of 7.34%, while the per capita annual ecological carrying capacity has increased at a much slower pace, with only an average annual growth rate of 2.03%.
The Quzhou stadium, as a stadium project, accommodates a maximum volume of 30,000 people. Considering the operational conditions, it is estimated that an average of 4500 people use the facility daily. The official website indicates that the investment and decision-making stage, as well as and the design planning stage, lasted for three years, and the construction cycle lasted two years. Then, the per capita annual ecological footprints of the project at each stage are shown in Table 12 below:
Table 12.
Comparative analysis of the per capita annual ecological footprint of the Quzhou stadium.
The data presented in Table 12 and Figure 8 demonstrate that the per capita annual ecological footprint of Quzhou stadium is lower than that of Quzhou City, which is 1.632 ha, and also lower than that for Zhejiang Province, which is 3.338 ha. The peroration indicates that the consumption of energy resources and the output of CO2 of the stadium is lower than the average level in Quzhou City, which is probably related to the fact the venue has adopted a green design scheme and consciously carried out energy conservation and emission reduction at the stages of investment and decision-making and design planning. And the design solutions of the project have also been certified by some green building research organizations [72]. In terms of the whole life cycle, the value of the ecological footprint is not small for the investment decision-making phase, design planning phase and demolition and recycling phase, and is dependent on the characteristics of the stadium-type building itself, which covers a large area and serves a small population. This feature results in a high ecological footprint during those phases compared with that of other population-intensive buildings, such as residential areas and educational institutions. In the construction phase, the per capita annual ecological footprint exceeds that of Quzhou City, primarily due to increased consumption of energy (mainly including electricity and fossil energy) and resources (mainly containing building materials), along with the brief duration of this phase. During the stage, the ecological footprint generated by the construction land is also taken into account, which contributes to the peak of the ecological footprint within a short period. The per capita ecological footprint during the operation and maintenance phase is lower than that of Quzhou City, signifying that the total amount of energy and resources consumed during the daily operation of the stadium is lower, which is advantageous compared to the overall average of Quzhou City.
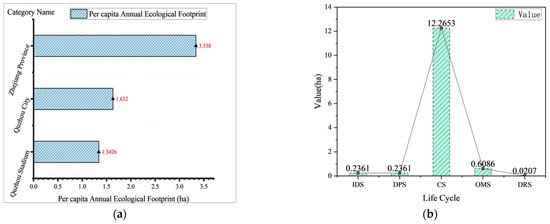
Figure 8.
(a) The value of per capita annual ecological footprint of specific areas and (b) the value of the per capita annual ecological footprint of Quzhou stadium during each life phase.
According to prior literature, both the ecological footprint and ecological carrying capacity have shown continuous growth over the past few decades [73,74], but the annual average increase for the former is greater than that for the latter, with rates of 5% and 0.44%, respectively. Moreover, along with the ecological footprint rising rapidly, Zhejiang Province’s ecosystem is confronted with a critical situation. The fluctuating trends of the per capita annual ecological carrying capacity in Quzhou City over the last decade are depicted in Figure 9.
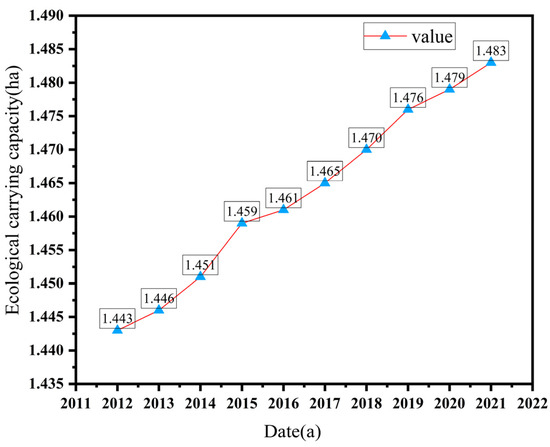
Figure 9.
The trend of the per capita annual ecological carrying capacity of Quzhou City during recent ten years.
In comparison with these data, the results demonstrate that the Quzhou stadium maintains a sustainable level of ecological health, with an ecological footprint value of 1.3426 and a carrying capacity of 1.483, as calculated using Formula (9). To delve into the sustainable development of the stadium, a detailed analysis can be conducted from two key perspectives: (1) a life cycle analysis and (2) a regional spatial analysis.
From the view of each life cycle stage, the per capita ecological footprint of all stages, with the exception of the construction stage, has not surpassed that of Quzhou City. The per capita annual ecological footprint explodes during the construction phase, which is because of the increased consumption of energy (primarily including electricity and fossil energy) and resources (mainly building materials), along with the brief duration of this phase. However, this phenomenon is not long-lasting, and by the end of the construction phase the level of its per capita annual ecological footprint rapidly plummets back within the ecological carrying capacity of the region. From the whole life cycle perspective, the project’s ecological footprint does not exceed the local ecological carrying capacity, due to a series of energy saving and environmentally friendly measures that have been proactively taken, including energy-saving and emission-reduction design solutions, cleaner energy sources and innovative materials and technologies, etc.
In terms of the spatial dimensions, according to the calculation results, the stadium is currently in a sustainable development stage within Quzhou City. But the per capita ecological footprint of Quzhou City has already surpassed its per capita ecological carrying capacity, indicating the ecosystem is currently in a state of ecological deficit. And if a degradation of the ecological carrying capacity of the area happens in the future, the sustainability of the project could be at risk. Consequently, additional measures to mitigate the ecological footprint, such as the use of more clean energy and recyclable resources, the reduction in waste generation, etc., will be required to ensure the long-term sustainability of the project.
7. Conclusions and Future Work
This study, grounded in the ecosystem of engineering projects, conducts a qualitative analysis of the interrelationships among its components and subsequently develops a comprehensive ecological footprint measurement model for the entire life cycle of engineering projects. Utilizing this model, stakeholders can quantitatively assess the interaction mechanisms between humans, engineering and ecological environments, and further explore strategies for sustainable development of a project’s ecosystem.
Throughout the research process, this paper has accomplished two significant tasks:
(1) It has expanded the application scope of the ecological footprint theory. Traditionally, ecological footprint is used to calculate the bioproductive land area for specific regions or nations. However, this paper extends the application to micro-level analysis by quantifying the ecological footprint at each life stage of individual engineering projects based on their entire life cycle, a departure from previous research that focused on broader scales.
(2) It has quantified the sustainability of a particular engineering project and offered practical recommendations for policymakers and decision makers. And the calculative results (ecological footprint of certain project) will be compared with the ecological carrying capacity of the specific region. These comparative data comprehensively manifest the supply and demand relationship between the engineering projects and the surrounding ecological environment. The degree of sustainable development and ecosystem stabilization of the engineering projects may be gauged by the conclusion. At the same time, it can provide scientific planning and guidance for decision makers to take targeted measures to reduce the burden at each stage of the engineering process.
Certainly, this paper also has some limitations, which also point the ways and directions for future research, mainly in two aspects:
(1) Quantifying the impact of stakeholder factors on the ecological footprint of engineering projects and determining the range of values and specific data for the stakeholder coordination factors from a multidimensional perspective. Subsequent studies can further explore the impacts of stakeholders on the model.
(2) Setting the value of the conversion factor. The determination of conversion factors for different types of projects also requires further study, thereby enhancing the accuracy of the model calculation results. And the research outcomes can guide stakeholders in formulating appropriate behavioral codes to preserve the equilibrium of the engineering project ecosystem and foster sustainable development.
Author Contributions
Methodology, J.J. (Jinli Jiang) and X.L. (Xiaojuan Li); Formal analysis, J.J. (Jinli Jiang) and X.L. (Xian Liang); Investigation, X.L. (Xiaojuan Li) and J.J. (Jianqiang Jin); Resources, L.Y.; Data curation, J.J. (Jinli Jiang) and J.J. (Jianqiang Jin); Funding acquisition, J.J. (Jinli Jiang) and L.Y. All authors have read and agreed to the published version of the manuscript.
Funding
This research was funded by the Basic Public Welfare Research Program of Zhejiang Province (No.LGF22G030009) grant number (No.LGF22G030009); Science and Technology Bureau Foundation of Quzhou City (No.2023K208) grant number (No.2023K208) and Zhejiang Provincial Department of Education Scientific Research Funding Program (Y202456087). And the APC was funded by all of them.
Data Availability Statement
Data are contained within the article. Further inquiries can be directed to the corresponding author.
Conflicts of Interest
The authors declare no conflict of interest.
References
- Ding, Z.; Fan, Z.; Tam, V.W.Y.; Bian, Y.; Li, S.; Illankoon, I.M.C.S.; Moon, S. Green building evaluation system implementation. Build. Environ. 2018, 133, 32–40. [Google Scholar] [CrossRef]
- Zhang, Y.; Wang, H.; Gao, W.; Wang, F.; Zhou, N.; Kammen, D.M.; Ying, X. A Survey of the Status and Challenges of Green Building Development in Various Countries. Sustainability 2019, 11, 5385. [Google Scholar] [CrossRef]
- Zuo, J.; Zhao, Z.Y. Green building research–current status and future agenda: A review. Renew. Sustain. Energy Rev. 2014, 30, 271–281. [Google Scholar] [CrossRef]
- Yin, B.C.L.; Laing, R.; Leon, M.; Mabon, L. An evaluation of sustainable construction perceptions and practices in Singapore. Sustain. Cities Soc. 2018, 39, 613–620. [Google Scholar] [CrossRef]
- Sfakianaki, E. Management of environmental quality: An international journal critical success factors for sustainable construction: A literature review article information. Manag. Environ. Qual. Int. J. 2019, 30, 176–196. [Google Scholar] [CrossRef]
- Mohammed, M.; Shafiq, N.; Abdallah, N.A.W.; Ayoub, M.; Haruna, A. A review on achieving sustainable construction waste management through application of 3R (reduction, reuse, recycling): A lifecycle approach. IOP Conf. Ser. Earth Environ. Sci. 2020, 476, 012010. [Google Scholar] [CrossRef]
- Hossain, M.U.; Ng, S.T.; Antwi-Afari, P.; Amor, B. Circular economy and the construction industry: Existing trends, challenges and prospective framework for sustainable construction. Renew. Sustain. Energy Rev. 2020, 130, 109948. [Google Scholar] [CrossRef]
- Hoxha, E.; Habert, G.; Lasvaux, S.; Chevalier, J.; Le Roy, R. Influence of construction material uncertainties on residential building LCA reliability. J. Clean. Prod. 2017, 144, 33–47. [Google Scholar] [CrossRef]
- Cengiz, A.A.E.; Aytekin, B.O.; Ozdemir, B.I.; Kusan, B.H.; Cabuk, A.A. A Multi-criteria Decision Model for Construction Material Supplier Selection. Procedia Eng. 2017, 196, 294–301. [Google Scholar] [CrossRef]
- Zhou, H. Research on the Symbiotic Interaction between Large-scale Engineering and Ecology. Sci. Technol. Prog. Policy 2008, 10, 44–47. [Google Scholar]
- Shao, Q.; Cao, W.; Fan, J.; Huang, L.; Xu, X. Ecological Effect Evaluation of the First Phase of the Sanjiangyuan Ecological Protection and Construction Project. J. Geogr. Sci. 2017, 27, 183–204. [Google Scholar] [CrossRef]
- Xu, X.; Ni, Z.; Shen, Z.; Wang, N.; Liu, B. Study on the Ecological Environmental Impact and Evaluation Indicator System of Inter-Basin Water Transfer Projects in the Water Source Area. Ecol. Econ. 2018, 34, 174–178. [Google Scholar]
- Zhang, D.; Yang, S.; Wang, Z.; Yang, C.; Chen, Y. Assessment of ecological environment impact in highway construction activities with improved group AHP-FCE approach in China. Environ. Monit. Assess. 2020, 192, 451. [Google Scholar] [CrossRef]
- Liu, J.; Wang, Y.; Wang, Y.; Wang, D. Problems and Suggestions on the Development of Green Building Design Standard System. Sci. Found. China 2023, 37, 360–363. [Google Scholar]
- Yuan, W.; Zhou, X. Overview of Research Progress on Ecological Compensation Abroad. China Popul. Resour. Environ. 2014, 24, 76–82. [Google Scholar]
- He, S.; Wang, D.; Fang, Y.; Lan, H. Guidelines for integrating ecological and biological engineering technologies for control of severe erosion in mountainous areas—A case study of the Xiaojiang River Basin, China. Int. Soil Water Conserv. Res. 2017, 5, 335–344. [Google Scholar] [CrossRef]
- Xie, G.D. Research on the Construction of National Ecological Security Maintenance Mechanism. Environ. Prot. 2018, 46, 13–16. [Google Scholar]
- Li, L.; Lu, Y.C. Analysis of Ecological Environmental Protection in the Construction of the Huaqiao Water Conservancy Hub Project. People’s Yellow River 2021, 43, 242–243. [Google Scholar]
- Lü, J.W.; Liu, B. Preliminary Discussion on Establishing a Forest Carbon Sink Ecological Compensation Mechanism in China. Agric. Econ. 2023, 8, 116–117. [Google Scholar]
- Zhang, T.; Wu, J.J.; Le, Y. Calculation Method for Total Life Cycle CO2 Emissions of Building Materials. J. Eng. Manag. 2012, 26, 23–26. [Google Scholar]
- Du, X.W.; Qian, Y.; Chen, Y.; Ling, J.; Liu, X.L.; Yang, B.; Jiang, L.L.; Ge, Q.; Huo, H.T.; Liu, X.; et al. Strategic Research on the Classification and Resource Utilization of Solid Waste in China. Chin. Eng. Sci. 2017, 19, 27–32. [Google Scholar]
- Chen, Y.; Hu, N.; Teng, J.J.; Liu, X.; Li, Y.; Ling, J. Research on the Resource Utilization Strategy for Industrial Solid Waste in China. Chin. Eng. Sci. 2017, 19, 109–114. [Google Scholar]
- Li, Z.; Lin, B.; Zheng, S.; Liu, Y.; Wang, Z.; Dai, J. A review of operational energy consumption calculation method for urban buildings. Build. Simul. 2020, 13, 739–751. [Google Scholar] [CrossRef]
- Ren, X.S.; Li, Z.R. Evolution and Influencing Factors of Spatial Correlation Network of Construction Carbon Emission in China from the Perspective of Whole Life Cycle. Huanjing Kexue 2024, 45, 1243–1253. [Google Scholar]
- Jayasinghe, L.B.; Waldmann, D. Development of a BIM-Based Web Tool as a Material and Component Bank for a Sustainable Construction Industry. Sustainability 2020, 12, 1766. [Google Scholar] [CrossRef]
- Khan, S.A.; Koc, M.; Al-Ghamdi, S.G. Sustainability assessment, potentials and challenges of 3D printed concrete structures: A systematic review for built environmental applications—ScienceDirect. J. Clean. Prod. 2021, 303, 127027. [Google Scholar] [CrossRef]
- He, Z.; Wang, B.; Huang, D.; Fang, J. Stakeholder Conflict Amplification of Large-Scale Engineering Projects in China: An Evolutionary Game Model on Complex Networks. Complexity 2020, 2020, 9243427. [Google Scholar] [CrossRef]
- Lu, Y.; Zhang, Y. Toward a Stakeholder Perspective on Safety Risk Factors of Metro Construction: A Social Network Analysis. Complexity 2020, 2020, 8884304. [Google Scholar] [CrossRef]
- Mitchell, R.K.; Agle, B. Toward a Theory of Stakeholder Identification and Salience: Defining the Principle of who and What Really Counts. Acad. Manag. Rev. 1997, 22, 853–886. [Google Scholar] [CrossRef]
- Xu, Z.M.; Cheng, G.D.; Zhang, Z.Q. Theoretical Analysis of the Ecological Footprint Method. China Popul. Resour. Environ. 2006, 6, 69–78. [Google Scholar]
- Kitzes, J.; Wackernagel, M. Answers to common questions in Ecological Footprint accounting. Ecol. Indic. 2009, 9, 812–817. [Google Scholar] [CrossRef]
- Niccolucci, V.; Galli, A.; Reed, A.; Neri, E.; Wackernagel, M.; Bastianoni, S. Towards a 3D National Ecological Footprint Geography. Ecol. Model. 2011, 222, 2939–2944. [Google Scholar] [CrossRef]
- Niccolucci, V.; Bastianoni, S.; Tiezzi, E.B.P.; Wackernagel, M.; Marchettini, N. How deep is the footprint? A 3D representation. Ecol. Model. 2009, 220, 2819–2823. [Google Scholar] [CrossRef]
- Li, Z.F.; Gao, J.; Zhong, Y. Research on the Ecological Security Assessment of Grasslands in Tibet: Based on an Improved Ecological Footprint Model with Ecosystem Service Value. Arid Zone Resour. Environ. 2023, 37, 9–19. [Google Scholar]
- Guo, H.; Dong, S.W.; Wu, D.; Pei, S.X.; Xin, X.B. Calculation of Equilibrium Factors and Yield Factors in the Ecological Footprint Model Based on Ecosystem Service Value. Acta Ecol. Sin. 2020, 40, 1405–1412. [Google Scholar]
- De Alvarenga, R.A.F.; Da Silva Júnior, V.P.; Soares, S.R. Comparison of the ecological footprint and a life cycle impact assessment method for a case study on Brazilian broiler feed production. J. Clean. Prod. 2012, 28, 25–32. [Google Scholar] [CrossRef]
- Zhang, H.Y.; Liu, W.D.; Wang, S.Z.; Shan, N.N.; Liang, H.M. Calculation of Equilibrium Factors and Yield Factors in the “Provincial Hectare” Ecological Footprint Model: A Case Study of Zhejiang Province. J. Nat. Resour. 2009, 24, 82–92. [Google Scholar]
- Liu, Y.Z.; Zhou, X.; Chen, Y.; Zhang, Z.; Zhou, L.L. Ecological footprint-based environmental impact assessment of structural adjustment objectives for overall land utilization planning. J. Anim. Plant Sci. 2015, 25, 99–106. [Google Scholar]
- Zhang, X.X.; Zeng, H. Dynamic Changes and Driving Force Analysis of the Three-Dimensional Ecological Footprint in the Pearl River Delta Urban Agglomeration. J. Environ. Sci. 2017, 37, 771–778. [Google Scholar]
- Zhang, J.H.; Zhang, J. Advances and Insights in Domestic Ecological Footprint Model Research. Reg. Res. Dev. 2007, 2, 90–96. [Google Scholar]
- Salvo, G.; Simas, M.S.; Pacca, S.A.; Guilhoto, J.J.M.; Tomas, A.R.G.; Abramovay, R. Estimating the human appropriation of land in Brazil by means of an Input–Output Economic Model and Ecological Footprint analysis. Ecol. Indic. 2015, 53, 78–94. [Google Scholar] [CrossRef]
- Cano-Orellana, A.; Delgado-Cabeza, M. Local ecological footprint using Principal Component Analysis: A case study of localities in Andalusia (Spain). Ecol. Indic. 2015, 57, 573–579. [Google Scholar] [CrossRef]
- Ke, Z.C.; Lian, H.F.; Chen, Y.; Chen, S.M.; Lin, X.Y. Spatiotemporal Dynamics of Per Capita Ecological Footprint and Per Capita Ecological Carrying Capacity in Fujian Province from 2009 to 2018. J. Fujian Agric. For. Univ. (Nat. Sci. Ed.) 2021, 50, 677–685. [Google Scholar]
- Zhang, J.R.; Shi, Q.G. Comparative Study on the Ecological Carrying Capacity Differences in Urban Agglomerations in the Middle Reaches of the Yangtze River. Resour. Environ. Yangtze Basin 2020, 29, 1694–1702. [Google Scholar]
- Wood, R.; Garnett, S. An assessment of environmental sustainability in Northern Australia using the ecological footprint and with reference to Indigenous populations and remoteness. Ecol. Econ. 2009, 68, 1375–1384. [Google Scholar] [CrossRef]
- Liu, L.L.; Wei, L.X.; Xu, Y.; Xin, X.G.; Xiao, C. Estimation of the Impact of Climate Change on Ecological Runoff in the Yellow River Basin. Adv. Water Sci. 2021, 32, 824–833. [Google Scholar]
- Mostafa, M.M. A Bayesian approach to analyzing the ecological footprint of 140 nations. Ecol. Indic. 2010, 10, 808–817. [Google Scholar] [CrossRef]
- Wiedmann, T.; Lenzen, M. On the conversion between local and global hectares in Ecological Footprint analysis. Ecol. Econ. 2007, 60, 673–677. [Google Scholar] [CrossRef]
- Ma, L.; Liu, H.; Peng, J.; Wu, J.S. Progress in Research on the Supply and Demand of Ecosystem Services. Acta Geogr. Sin. 2017, 72, 1277–1289. [Google Scholar]
- López-Malest, A.; Gabor, M.R.; Panait, M.; Brezoi, A.; Veres, C. Green Innovation for Carbon Footprint Reduction in Construction Industry. Buildings 2024, 14, 374. [Google Scholar] [CrossRef]
- Yan, J.; Lu, Q.; Tang, J.; Chen, L.; Hong, J.; Broyd, T. Digital tools for revealing and reducing carbon footprint in infrastructure, building, and city scopes. Buildings 2022, 12, 1097. [Google Scholar] [CrossRef]
- Shadram, F.; Mukkavaara, J. Improving life cycle sustainability and profitability of buildings through optimization: A case study. Buildings 2022, 12, 497. [Google Scholar] [CrossRef]
- World Wide Fund for Nature. “China Ecological Footprint Report 2012” Released. Environ. Prot. Circ. Econ. 2012, 32, 33. [Google Scholar]
- Qian, K. Evaluation of Ecological Footprint of Construction Projects Based on Energy Consumption. Master’s Thesis, Tsinghua University, Beijing, China, 2010. [Google Scholar]
- Wu, S.H. Calculation and Evaluation of Ecological Footprint for Green Buildings. Master’s Thesis, Xi’an University of Architecture and Technology, Xi’an, China, 2011. [Google Scholar]
- Zang, P.; Shao, B.L. Study on Evaluation Methods of Green Building from an Ecological Perspective. J. Build. Sci. 2014, 30, 19–23. [Google Scholar]
- Chen, H.Y.; Teng, J.Y.; Wang, Y.Y.; Wu, X.G.; Qin, Y.W. Research on Ecological Benefit Evaluation of Construction Projects Based on Ecological Footprint. J. Eng. Manag. 2017, 31, 107–111. [Google Scholar]
- Jiang, X.X. Low Carbonization Benefit Evaluation of Rural Residential Construction. Master’s Thesis, Huazhong University of Science and Technology, Wuhan, China, 2011. [Google Scholar]
- Li, B. Research on Low Carbon Building Technology Systems and Carbon Emission Calculation Methods. Ph.D. Thesis, Huazhong University of Science and Technology, Wuhan, China, 2012. [Google Scholar]
- Wang, H.L.; Zhuang, Q.H.; Mao, W.J. Quzhou Sports Stadium: Marching Towards a New Era with the City. Quzhou Daily, 30 June 2023; p. 4. [Google Scholar]
- Zhong, P. Research on Energy Consumption and Environmental Impact of Building Life Cycle. Master’s Thesis, Sichuan University, Chengdu, China, 2005. [Google Scholar]
- Bessa, V.M.T.; Prado, R.T.A. Methodology of CO2 emissions evaluation in the life cycle of office building façades. Environ. Impact Assess. Rev. 2012, 33, 41–47. [Google Scholar]
- Wei, J.X.; Geng, Y.B.; Shen, L.; Cen, K.; Mu, Y. Calculation of Carbon Emission Factors Based on the Current Status of Cement Production in China. China Environ. Sci. 2014, 34, 2970–2975. [Google Scholar]
- Ge, J.C.; Huang, J.; Lai, Y.N.; Xue, F.; Chen, X.T. Analysis of Calculation Standards and Specifications for Carbon Emission Factors in Domestic and International Power Grids. Glob. Energy Interconnect. 2024, 1–13. [Google Scholar]
- Luo, P.-Y. Research on Carbon Emission Factors in Building Construction. Master’s Thesis, Guangdong University of Technology, Guangzhou, China, 2016. [Google Scholar]
- Chen, H.Y.; Teng, J.Y.; Wang, Y.Y.; Wu, X.G.; Qin, Y.W. A Calculation Model for the Ecological Footprint of Construction Projects Throughout the Entire Life Cycle. J. Civ. Eng. Manag. 2018, 35, 130–134. [Google Scholar]
- Teng, J.Y.; Wu, X.G.; Ran, L.Y.; Qin, Y.W.; Liu, H.T. Evaluation of Ecological Sustainability of Construction Projects Based on Ecological Footprint. Civ. Archit. Environ. Eng. 2016, 38, 104–108. [Google Scholar]
- Cui, P.; Li, D.Z.; Ang, S.L.; Li, Q.M. Study on the Measurement Method of Ecological Efficiency in the Whole Life Cycle of Residential Buildings. Constr. Econ. 2013, 11, 96–99. [Google Scholar]
- Jing, P.R.; Guo, L.D. Study on the Coordinated Development of Water Resources Utilization and Economic in Zhejiang Province Based on Ecological Footprint. Water Resour. Hydropower Eng. (Chin. Engl.) 2021, 52, 42–51. [Google Scholar]
- Si, G.J.; Zou, Y.J.; Kong, J.H. Analysis of Urban Resilience and Its Spatiotemporal Changes in Zhejiang Province. J. Ningbo Univ. (Sci. Eng. Ed.) 2023, 36, 113–120. [Google Scholar]
- Ma, S.; Xue, M.; Ji, S.; Powe, D.N.; Willis, D.K.; Page, G.B. An improved emergy ecological footprint method f or ecological security assessment and quantitative analysis of influencing factors: A case study of Zhejiang Province. J. Environ. Plan. Manag. 2023, 66, 2878–2902. [Google Scholar] [CrossRef]
- Gang, Y. Planning Study of Public Sports Facilities in the Central Urban Area of Quzhou City. Master’s Thesis, Xi’an University of Architecture and Technology, Xi’an, China, 2018. [Google Scholar]
- Li, G.Z. Study on the Spatiotemporal Differences and Factor Decomposition of Ecological Footprint in Zhejiang Province. J. East China Norm. Univ. (Nat. Sci. Ed.) 2018, 4, 147–158. [Google Scholar]
- Shen, W.T.; Hu, Q.G. Calculation of Ecological Footprint in Zhejiang Province and Analysis of Its Spatiotemporal Differentiation Characteristics. Sci. Manag. 2017, 19, 7–13+24. [Google Scholar]
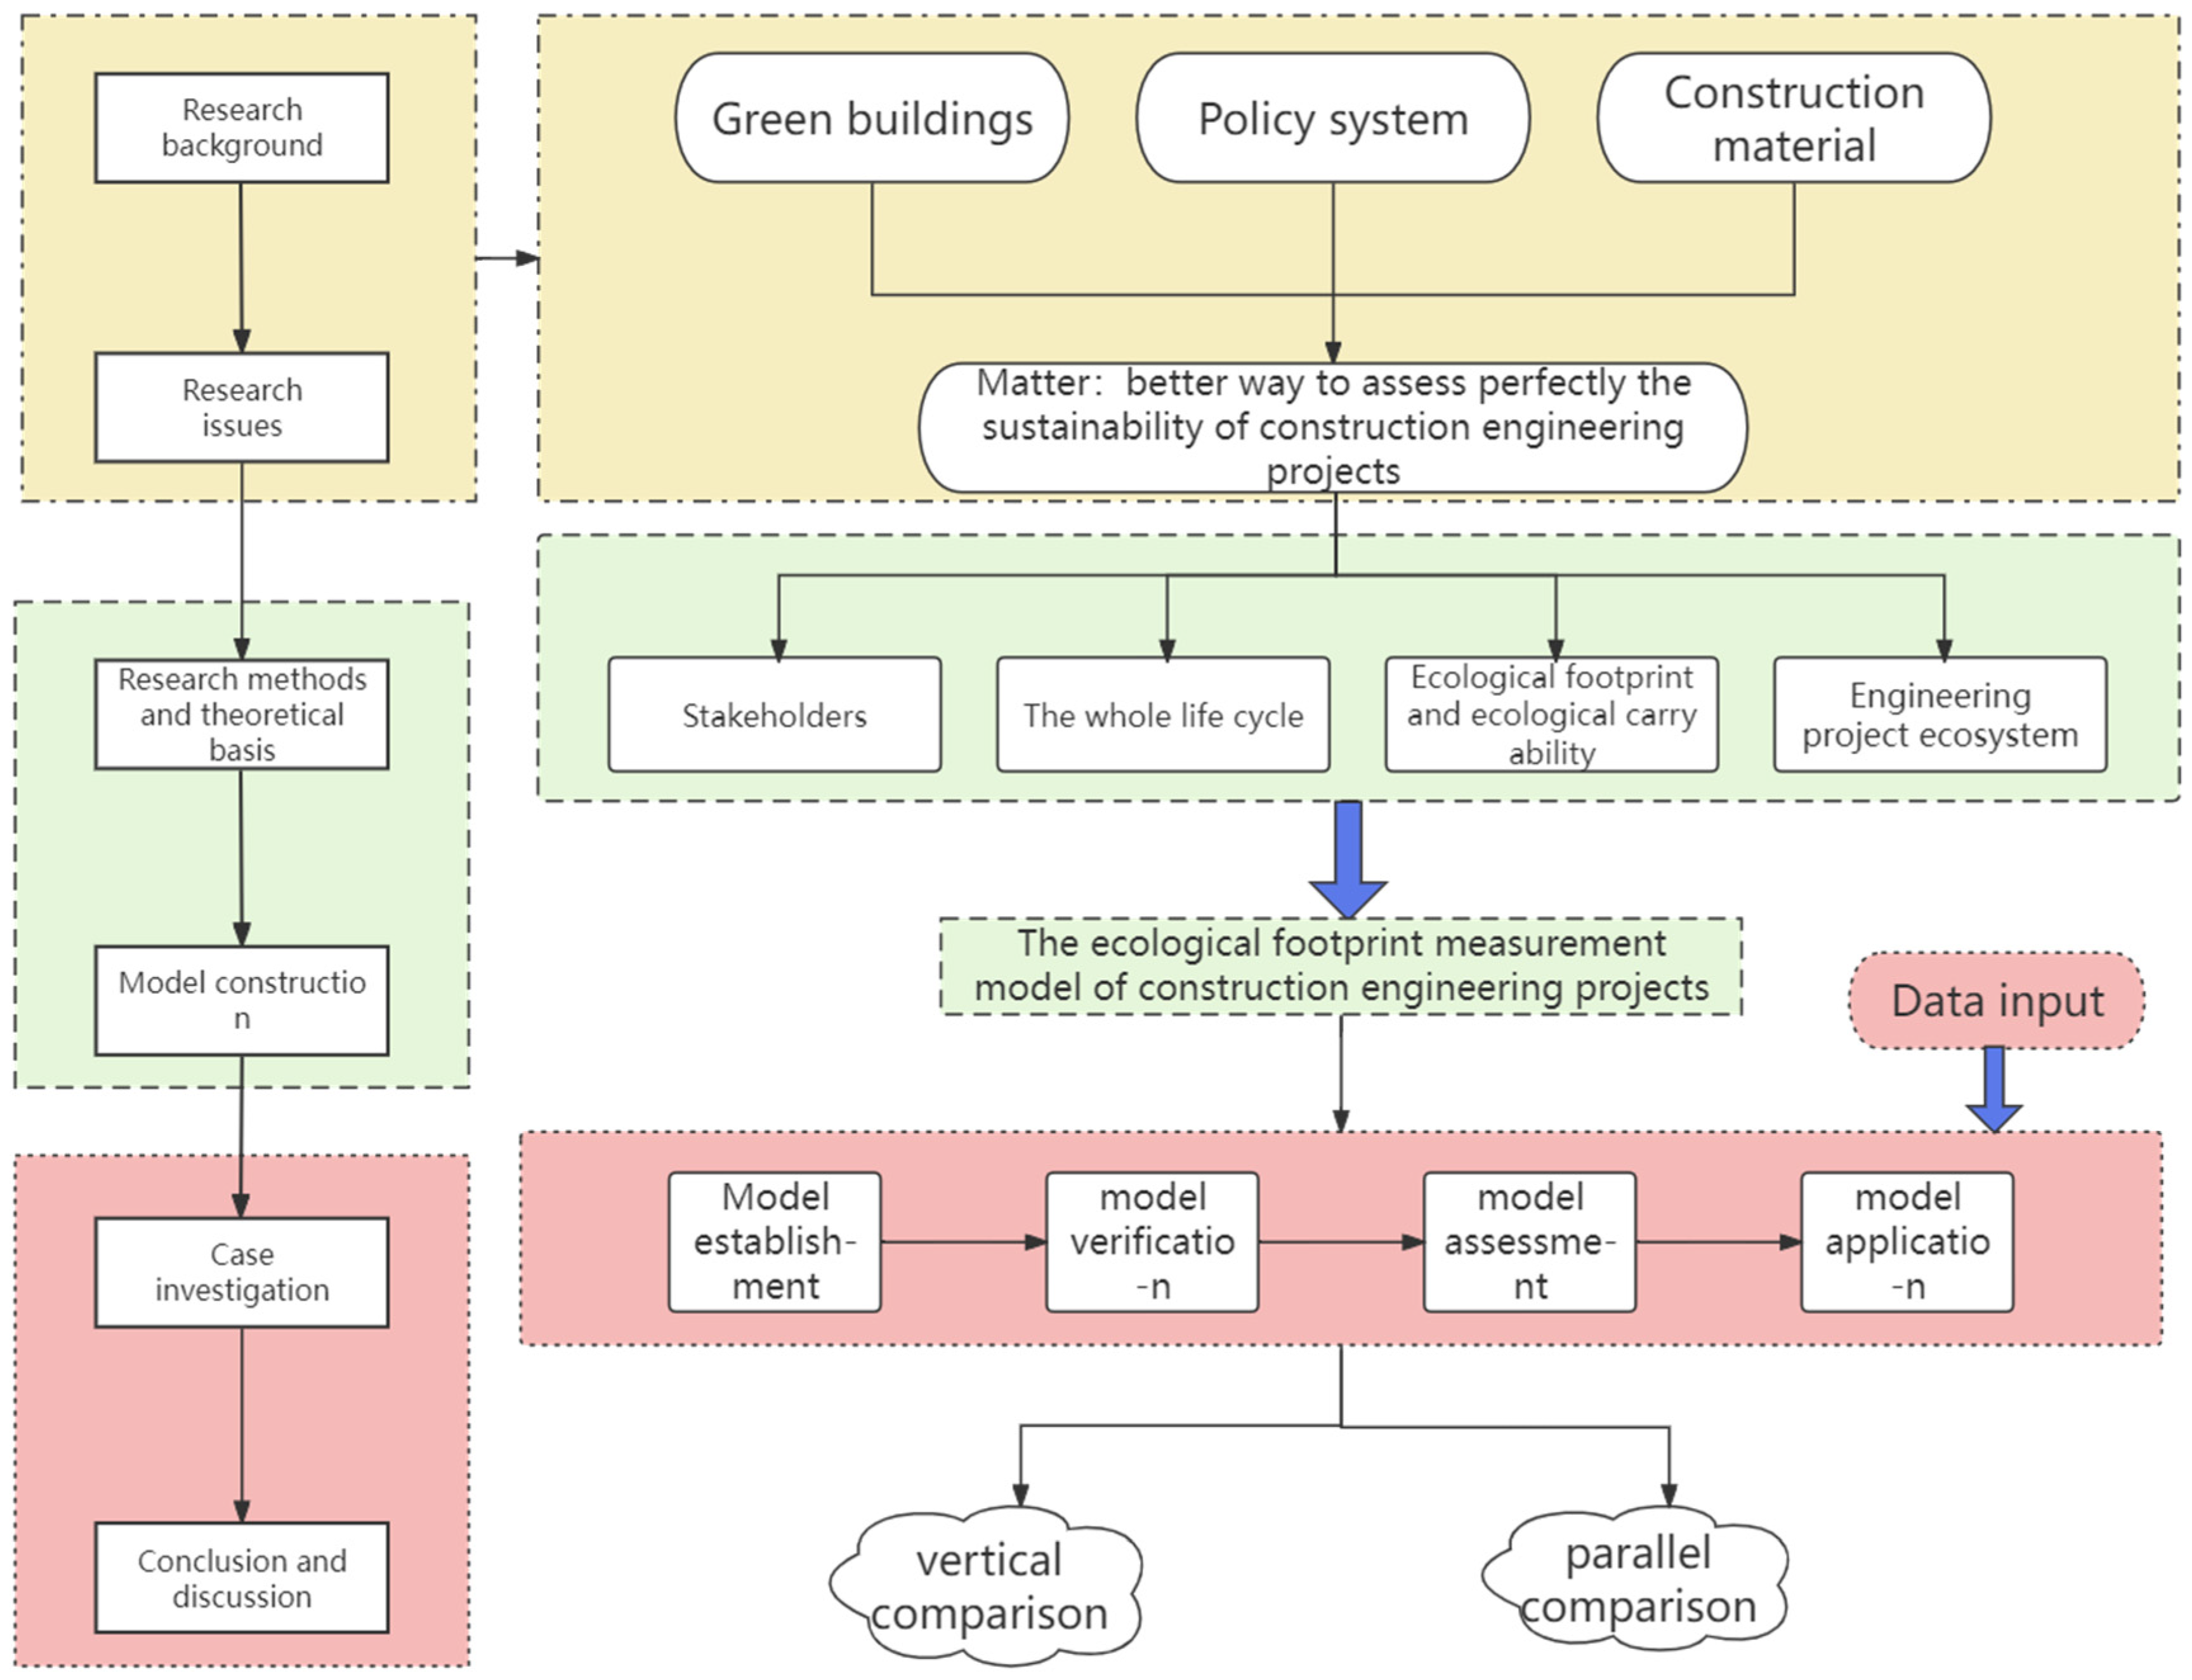

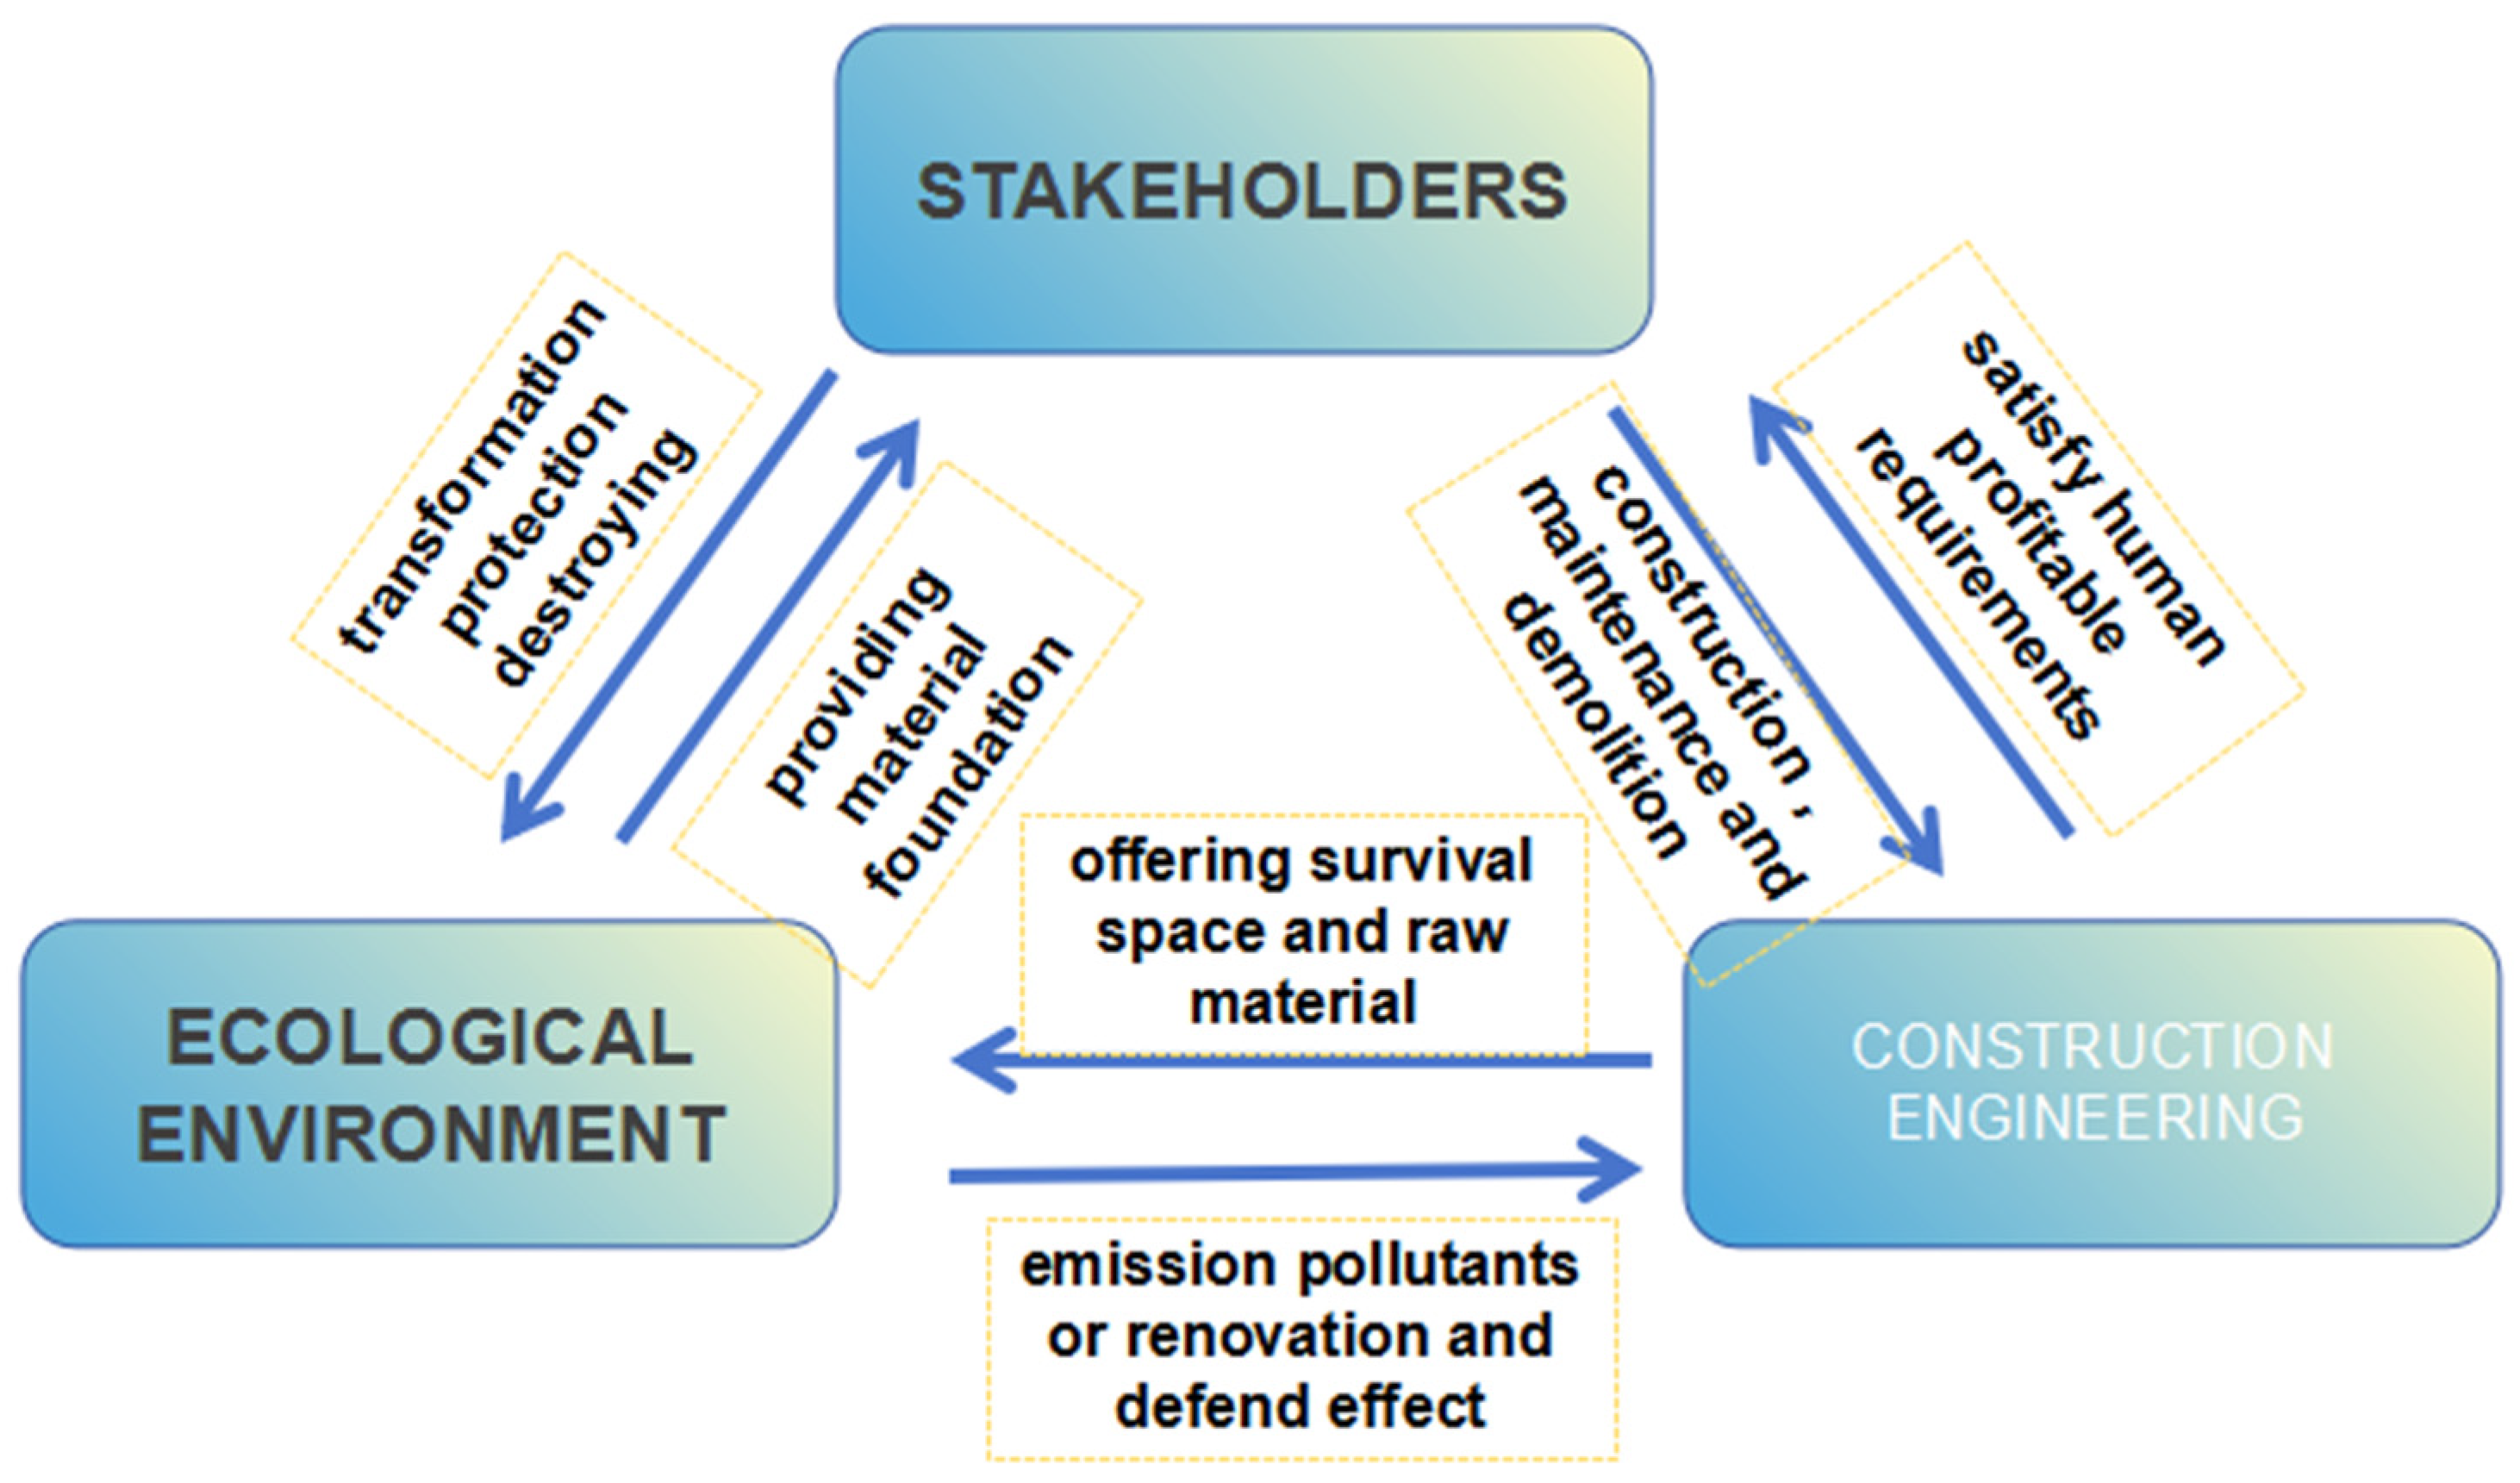

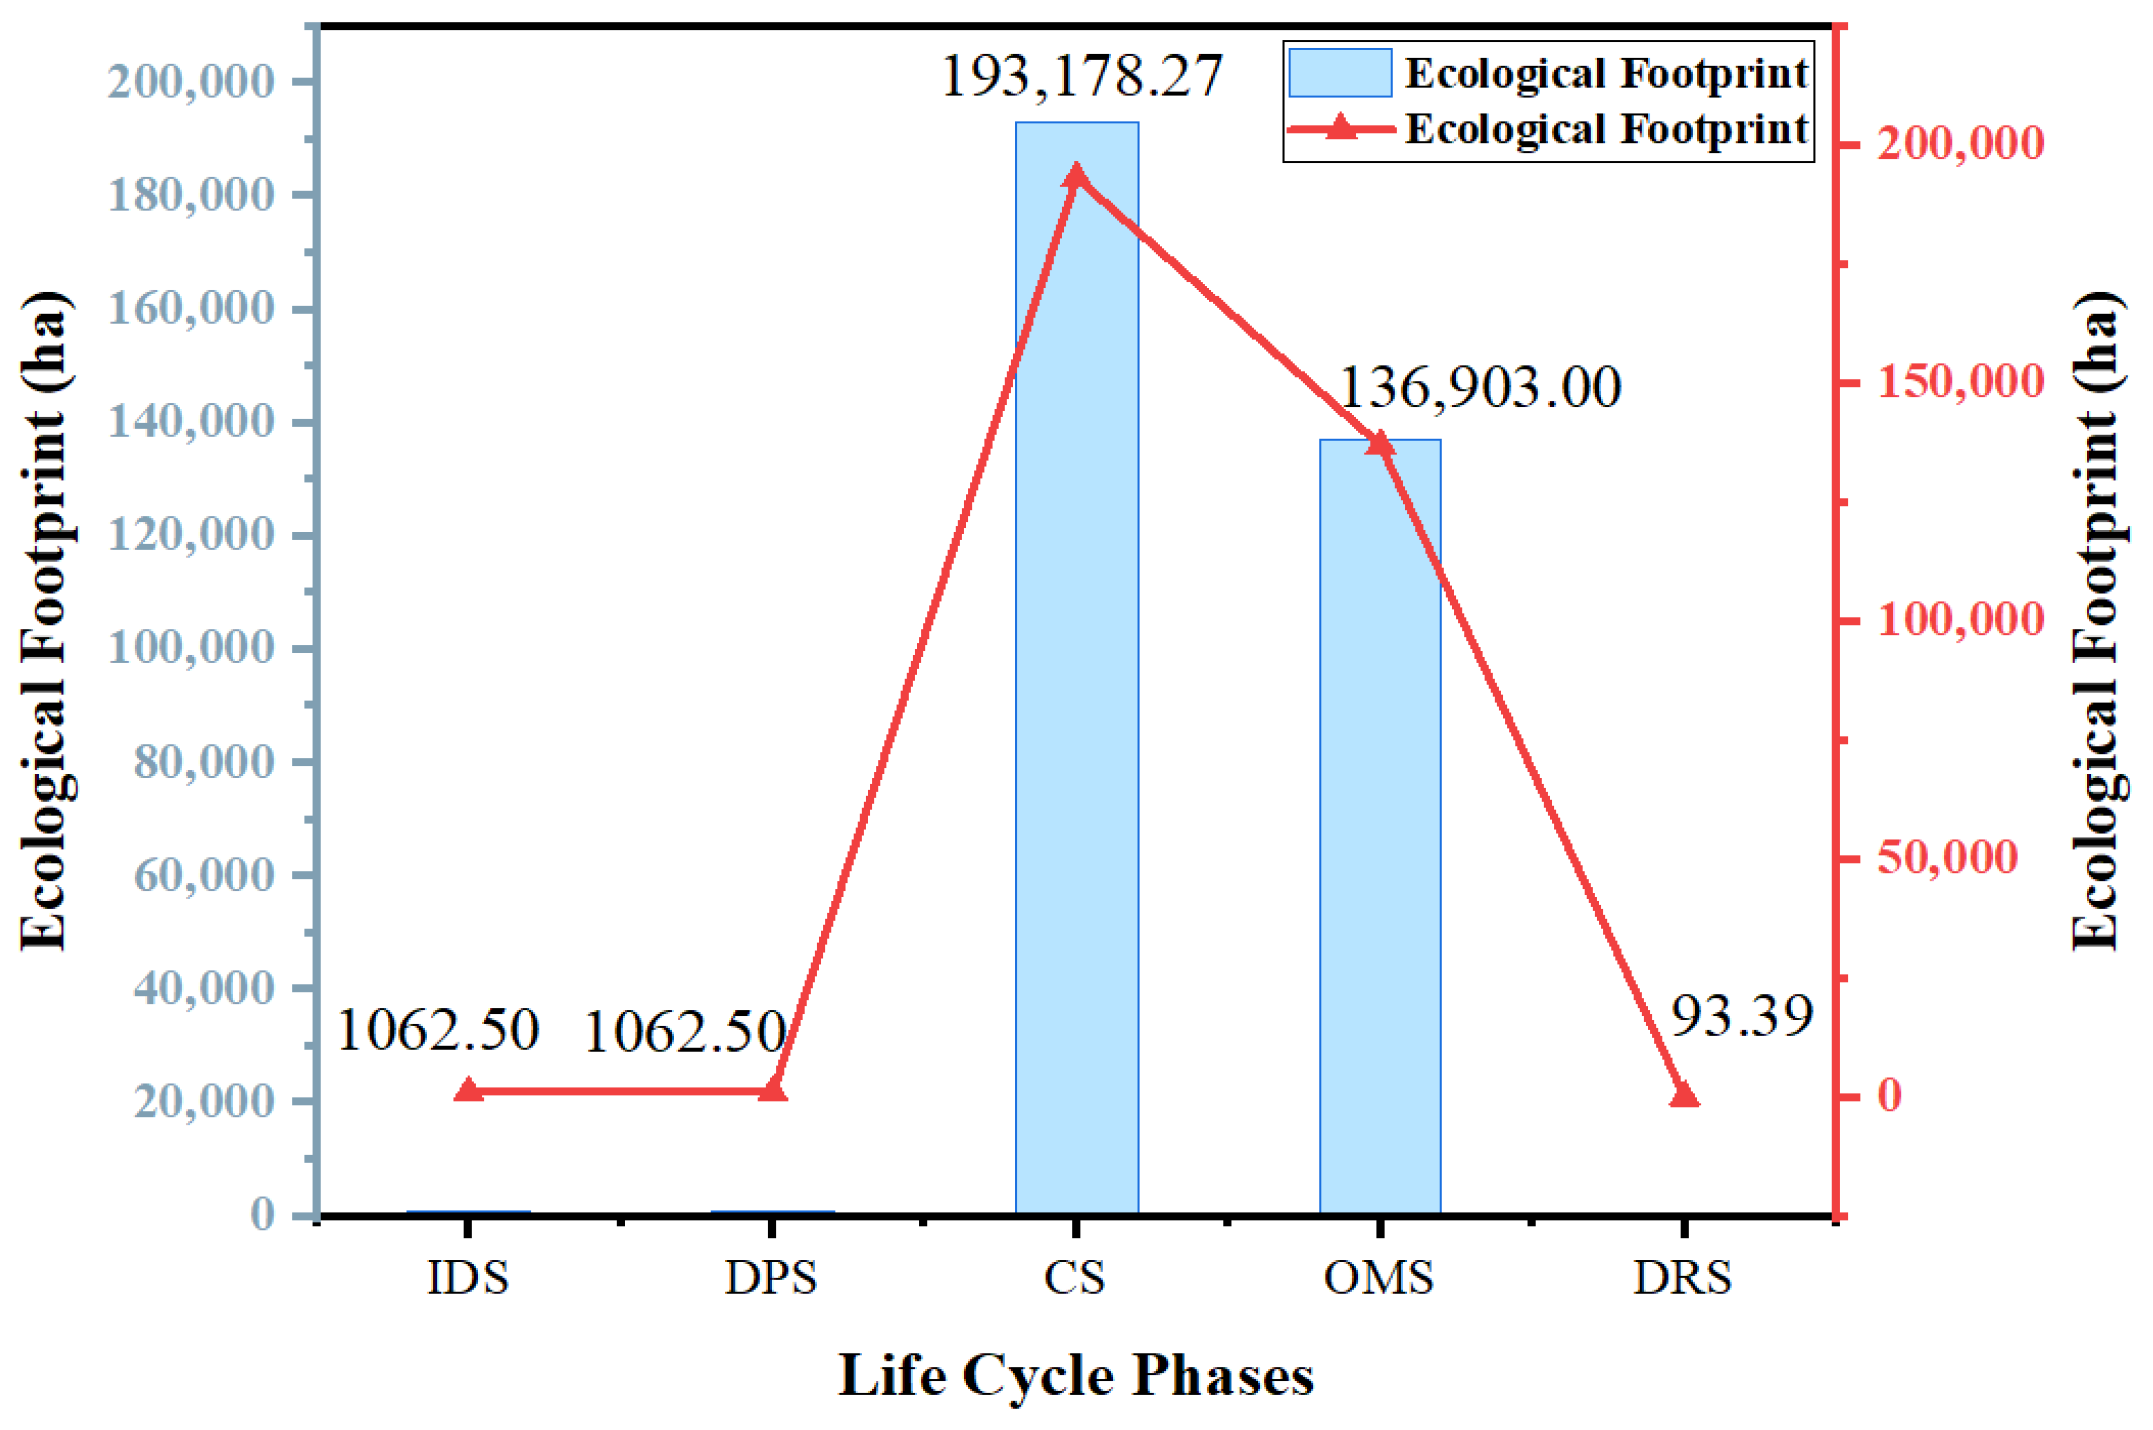

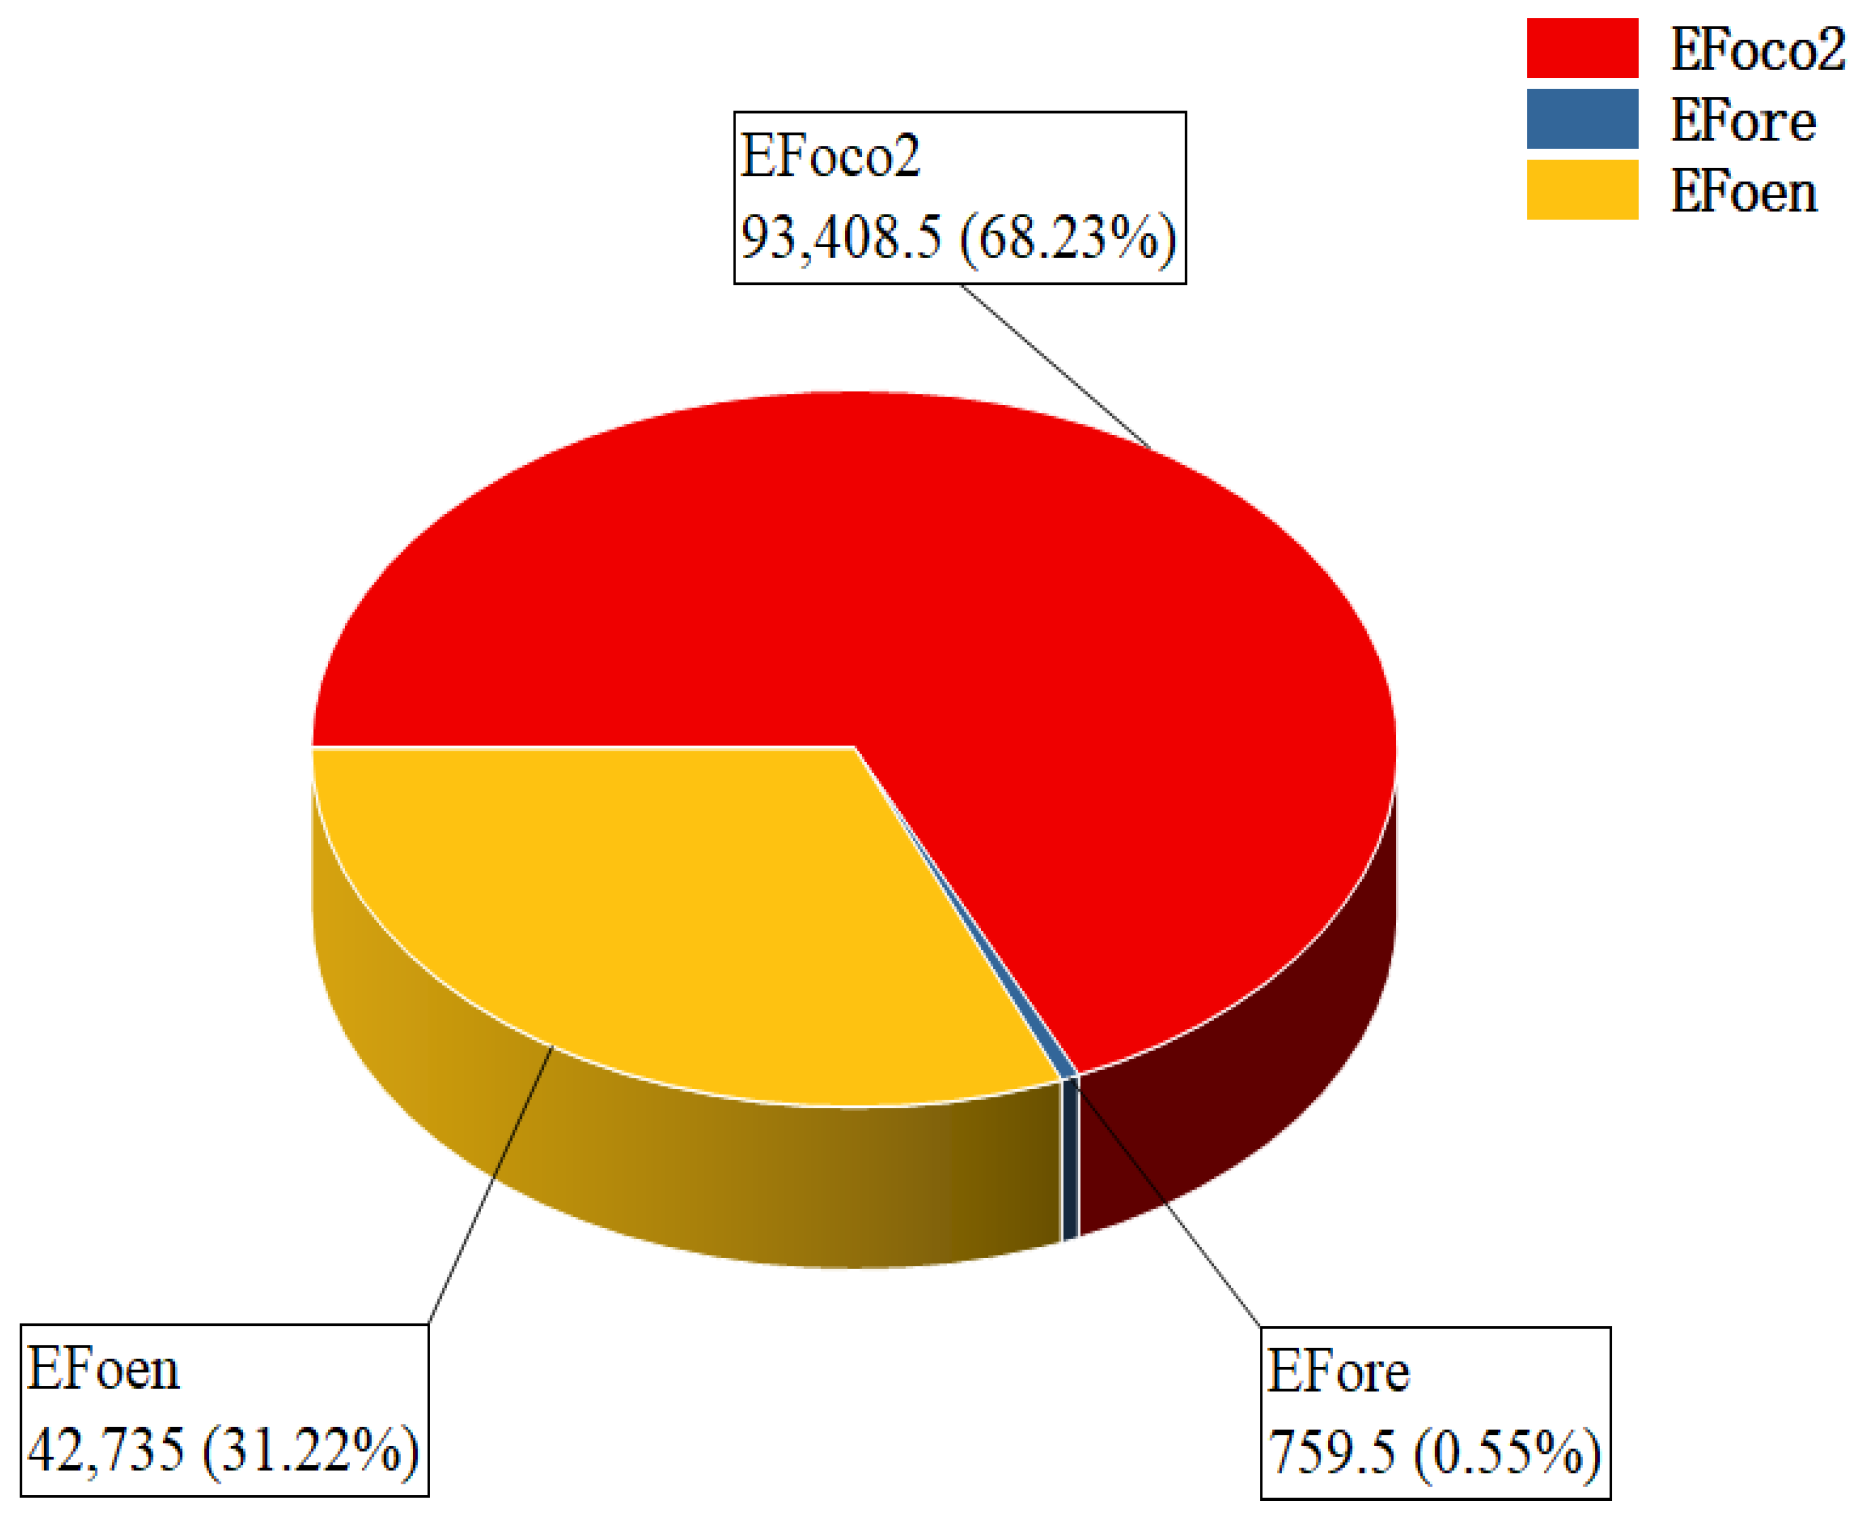

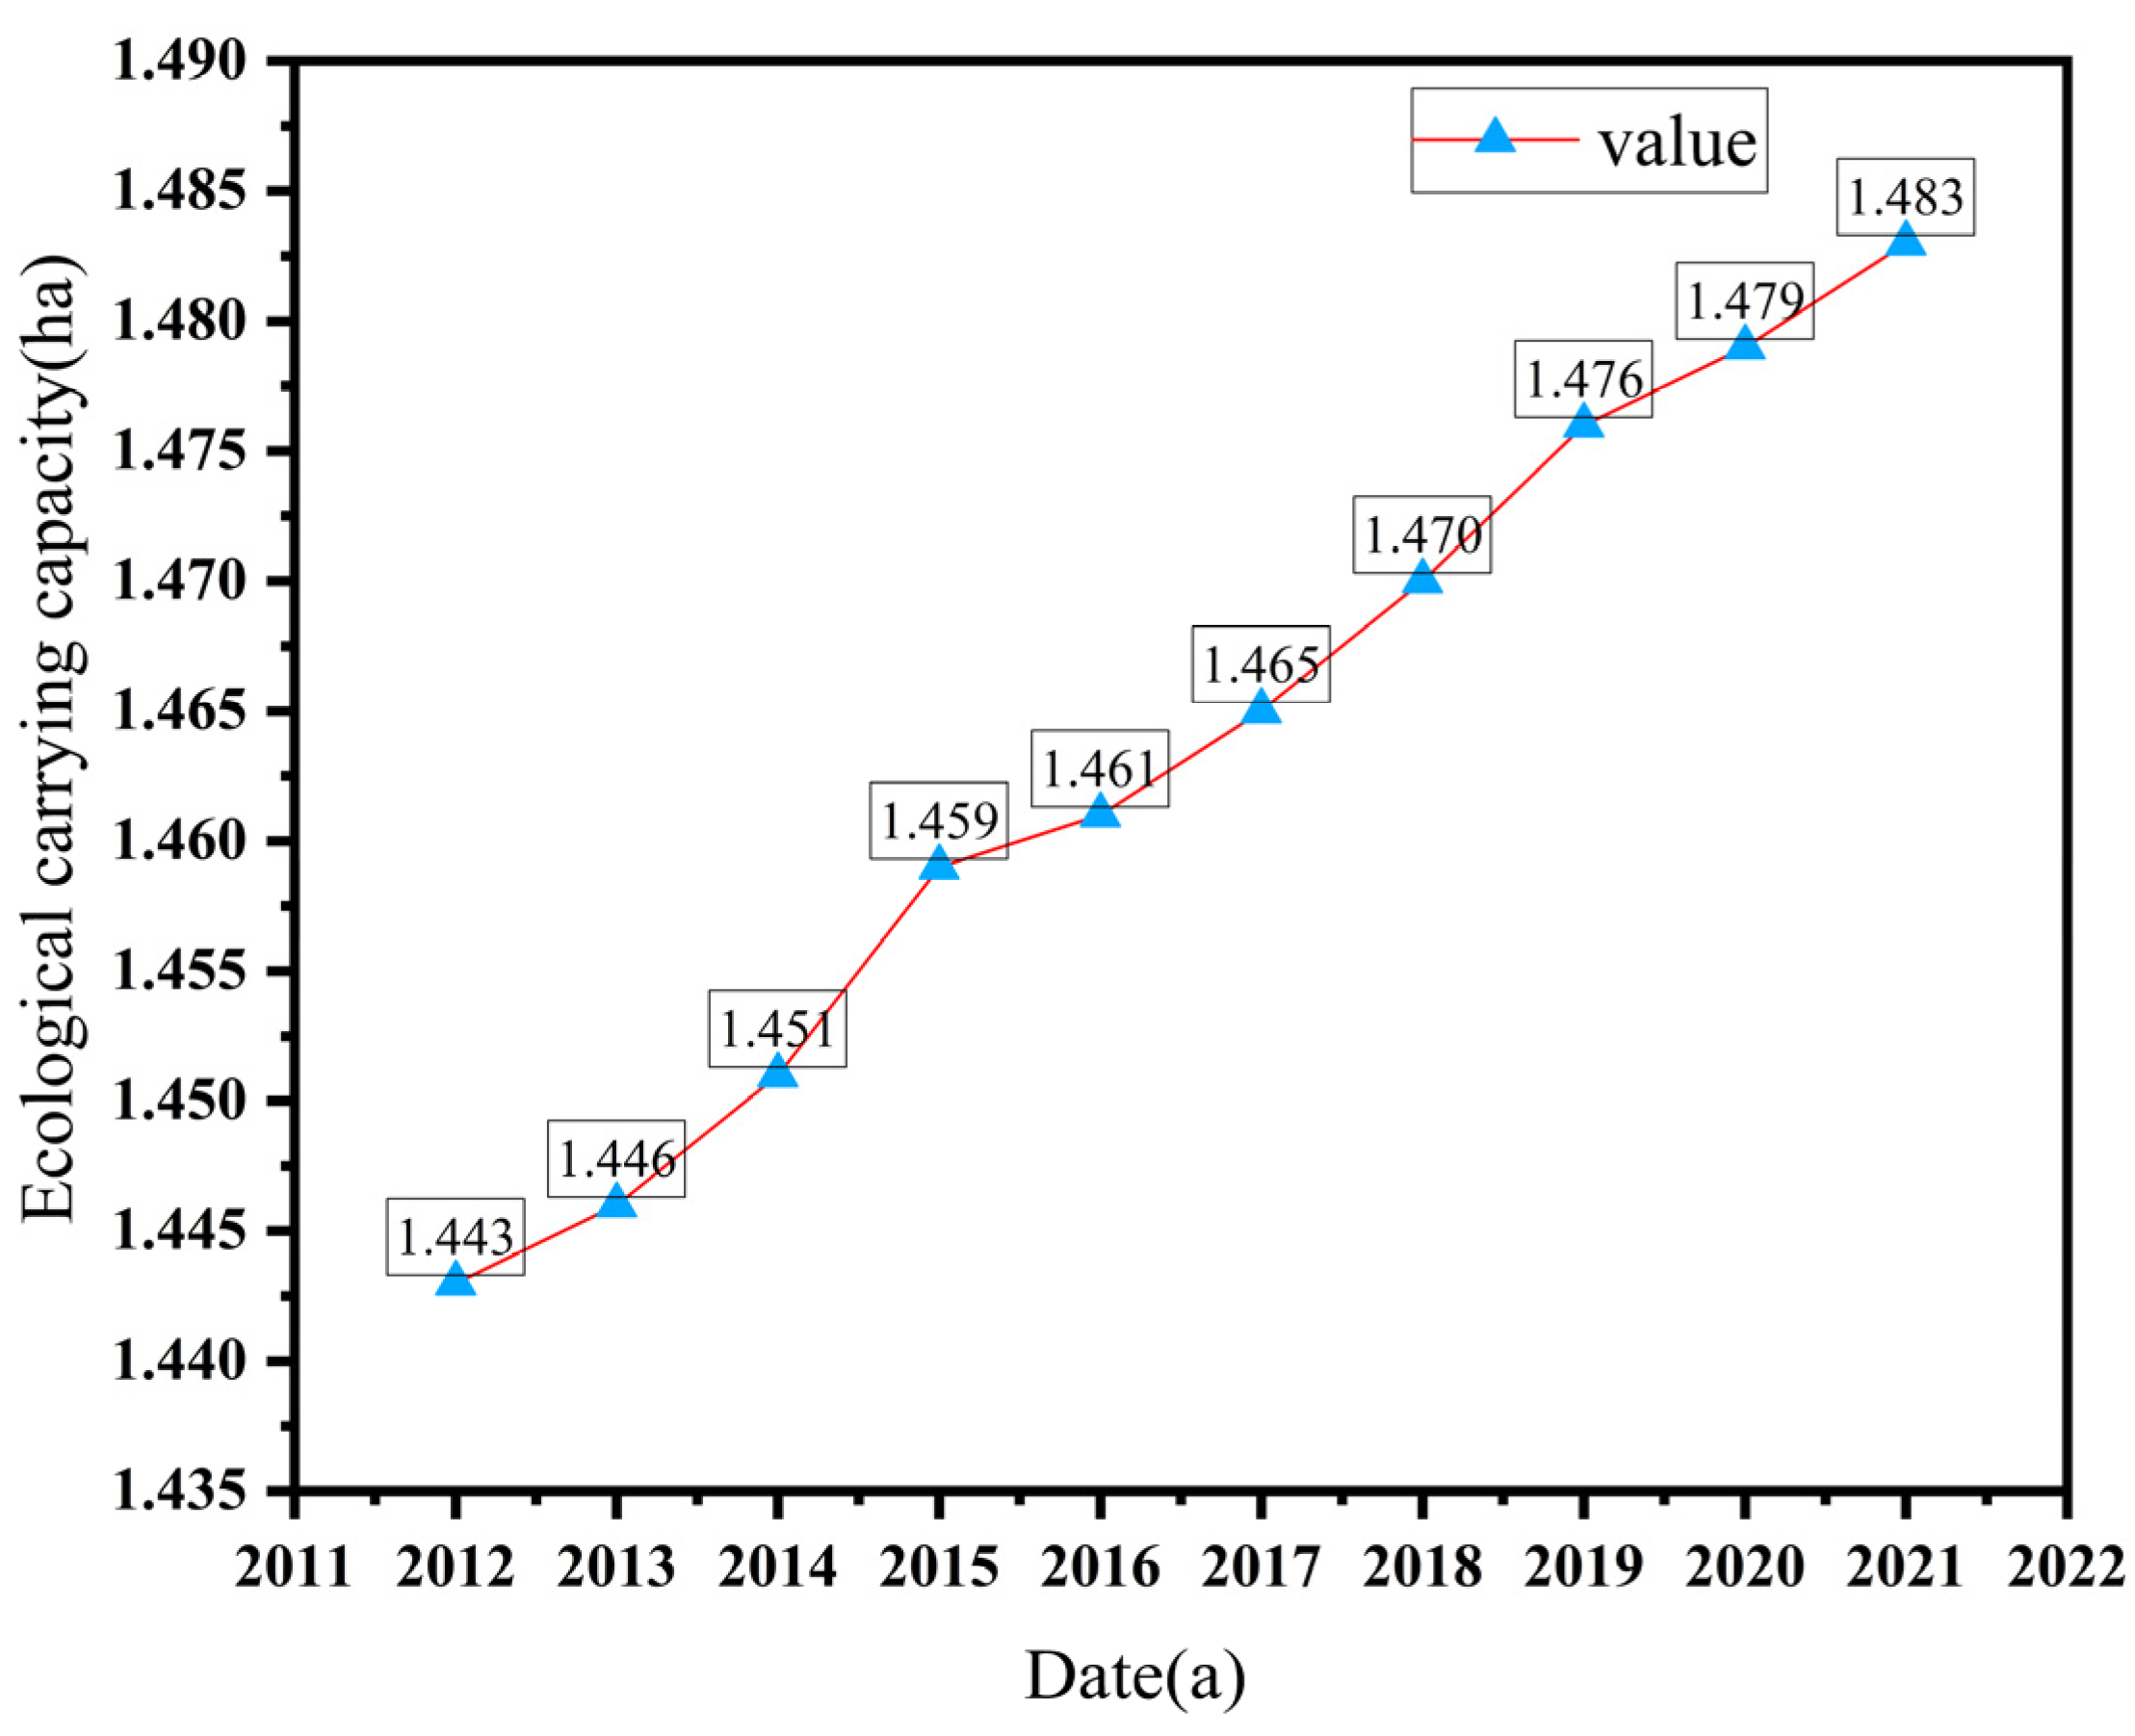
Disclaimer/Publisher’s Note: The statements, opinions and data contained in all publications are solely those of the individual author(s) and contributor(s) and not of MDPI and/or the editor(s). MDPI and/or the editor(s) disclaim responsibility for any injury to people or property resulting from any ideas, methods, instructions or products referred to in the content. |
© 2024 by the authors. Licensee MDPI, Basel, Switzerland. This article is an open access article distributed under the terms and conditions of the Creative Commons Attribution (CC BY) license (https://creativecommons.org/licenses/by/4.0/).