Article

An Investigation of the Ventilation Systems of Whole-Indoor Urban Substations

1
Shandong Electric Power Engineering Consulting Institute Corp., Ltd., Jinan 250013, China
2
School of Thermal Engineering, Shandong Jianzhu University, Jinan 250101, China
*
Author to whom correspondence should be addressed.
Buildings 2024, 14(12), 3749; https://doi.org/10.3390/buildings14123749
Submission received: 23 September 2024 / Revised: 30 October 2024 / Accepted: 3 November 2024 / Published: 25 November 2024

Abstract

:
The electricity load increases significantly with the development of the economy, which raises the issue of scarce land resources; therefore, the application of whole-indoor urban substations has become more and more extensive. However, both the closed environment of indoor substations and their unreasonable ventilation systems mean that the heat dissipation of the equipment cannot be discharged in time. In this study, a combination of natural and mechanical ventilation systems is developed to solve the problem of high indoor temperatures, and corresponding studies are conducted via both numerical simulation and experimental research. Firstly, the ventilation and heat dissipation problem of the whole-indoor urban substation was investigated using numerical simulation technology, and then the feasibility of the ventilation system was determined. Secondly, the experimental platform (including the heat dissipation equipment and ventilation system) was set up, the heat dissipation of the reactor room was analyzed, and the system was tested experimentally. Afterward, the noise generated by the experimental platform was measured and predicted. Finally, via the numerical simulation analysis, it was found that the ventilation effect would be improved regardless of the heat dissipation and that reducing the outdoor temperature or increasing the ventilation volume would reduce the indoor temperature, which could be controlled within 40 °C. The results of this study provide a reference basis and technical guidance for the engineering projects of ventilation systems for indoor substations, which can effectively solve the problem of excessive indoor temperature caused by heat dissipation from substation equipment while providing a favorable guarantee for sustainable operation of the substation.

1. Introduction

With the increase in urban power load and the decrease in land resources, whole-indoor urban substations have gradually become the first choice for urban power grids [1,2]. However, the substations continue to dissipate heat during operation, and the closed environment of indoor substations leads to a gradual increase in indoor temperature. The high-temperature environment makes the equipment in the substation age rapidly and makes it difficult for personnel to work [3,4,5]. Therefore, a reasonable ventilation system is needed to remove the dissipated heat. At the same time, this is not conducive to the integrated development of the city, and noise is generated because both the electrical equipment and the fans are in continuous operation. Accordingly, to achieve reasonable ventilation and cooling, it is also necessary to make the system meet the requirements of both energy saving and noise reduction.
Focusing on the ventilation system of an indoor substation, Haomai Zhang et al. [6] employed CFD to investigate the performance of ventilation and heat dissipation under natural ventilation conditions. Their study analyzed how various inlet design parameters impact the airflow distribution, temperature distribution, and cooling efficiency. Wenxiong Mo et al. [7] were the first to analyze the current state of transformer ventilation and heat dissipation in indoor substations through practical examples. They proposed an optimization plan that laid the groundwork for addressing ventilation and heat dissipation issues in these settings. Hong Wang et al. [8] analyzed the difficulties and deficiencies in the ventilation design of whole-household substations, and they put forward suggestions of natural ventilation schemes with louver-gate air intake and roof skylight air exhausts. Chaojun Chen et al. [9] investigated issues such as ineffective ventilation and noise pollution in indoor substations using practical examples. They implemented intelligent temperature control and noise reduction techniques for ventilation fans to address these problems. Qian Dong et al. [10] employed SoundPLANnoise 9.0 to predict and analyze how major sound sources affect the acoustic environment outside the station. Xueping Gao et al. [11] pioneered the use of numerical simulation to study indoor substation ventilation design. They analyzed how the intake area and location affect the indoor temperature, offering valuable insights for improving ventilation design. Haibin Xing et al. [12], using numerical simulation technology, proposed a solution to enhance heat transfer efficiency by incorporating a baffle at the air inlet. Wenhui Qin et al. [13] investigated various ventilation methods for indoor substations and determined that the combination of natural air intake, mechanical air intake, mechanical air exhaust, and natural air exhaust provided the most effective ventilation. Jin Jin et al. [14] demonstrated through simulation that the temperatures around the transformer and radiator were the highest, resulting in the poorest ventilation effect in those areas. Their findings suggest that increasing the inlet area and optimizing the inlet location could improve the ventilation performance of the substation. Mohamad K. et al. [15] simulated the ventilation and heat dissipation of a substation across seven ventilation modes and found that the cooling effect improved as the height of the exhaust fan was reduced. Saipul A.F.B. et al. [16] proposed that carefully selecting appropriate locations for air inlets and outlets could help prevent overheating around the transformer. Hasini et al. [17] studied different substations and found that the requirements below 10.8 kW could meet the indoor temperature requirements through natural ventilation alone.
At present, most scholars analyze the current situation of whole-indoor substations through examples and adopt numerical simulation technology to optimize the ventilation systems, but no actual platform has been built for testing. Compared with numerical simulation, experimental verification is more reliable. Therefore, this study adopted the method of combining experimental and numerical simulation, set up a reasonable ventilation system through a theoretical model for simulation and analysis, and set up an experimental platform in Dezhou, Shandong Province, for experimental verification of the system to ensure that the ventilation system could meet the requirement of controlling the indoor temperature within 40 °C. We also conducted a test study on the noise of the system. At the same time, based on the theoretical model, other main factors affecting indoor temperature were studied, such as the ventilation volume, heat dissipation, and outdoor temperature.

2. The Theoretical Models

2.1. The Mathematical Models

The airflow within the entire indoor substation adheres to the principles of continuity, momentum conservation, and energy conservation, as represented by Equations (1), (2) and (3), respectively [18].
The continuity equation asserts that the mass flow rate of incoming and outgoing materials is equal over a given unit of time. This relationship is expressed in Equation (1):
ρ t + ρ u x + ρ v y + ρ w z = 0
where t is the time of gas flow in the whole indoor substation, s; u, v, and w are the velocity components of the fluid in the x, y, and z directions, respectively, m/s; and ρ is the indoor gas density, kg/m3.
The law of conservation of momentum states that the rate of change of momentum of a fluid is equal to the sum of the external forces acting on elements within the flow field. The momentum equations for the x, y, and z directions are presented in Equation (2):
ρ u t = τ x x x + τ y x y + τ z x z p x + S x ρ v t = τ y y y + τ x y x + τ z y z p y + S y   ( ρ w ) t = τ z z z + τ x z z + τ y z y p z + S z  
where τ i j is the stress component of the fluid on (i, j), Pa; p is the fluid pressure, N; and S x , S y , S z is the volume force of the microelement.
The energy conservation equation is consistent with the first law of thermodynamics, as shown in Equation (3):
ρ c d T d t = · K T + τ x x u x + τ x y u y + τ x z u z + τ y x v x + τ y y v y + τ y z v z + τ z x w x + τ z y w y + τ z z w z + S i
where T is the indoor gas temperature, °C; K is the heat transfer coefficient, W/(m2·K); c is the specific volume of gas, m3/kg; and S i is the newly defined source term associated with the user-defined volume heat.

2.2. The Physical Models

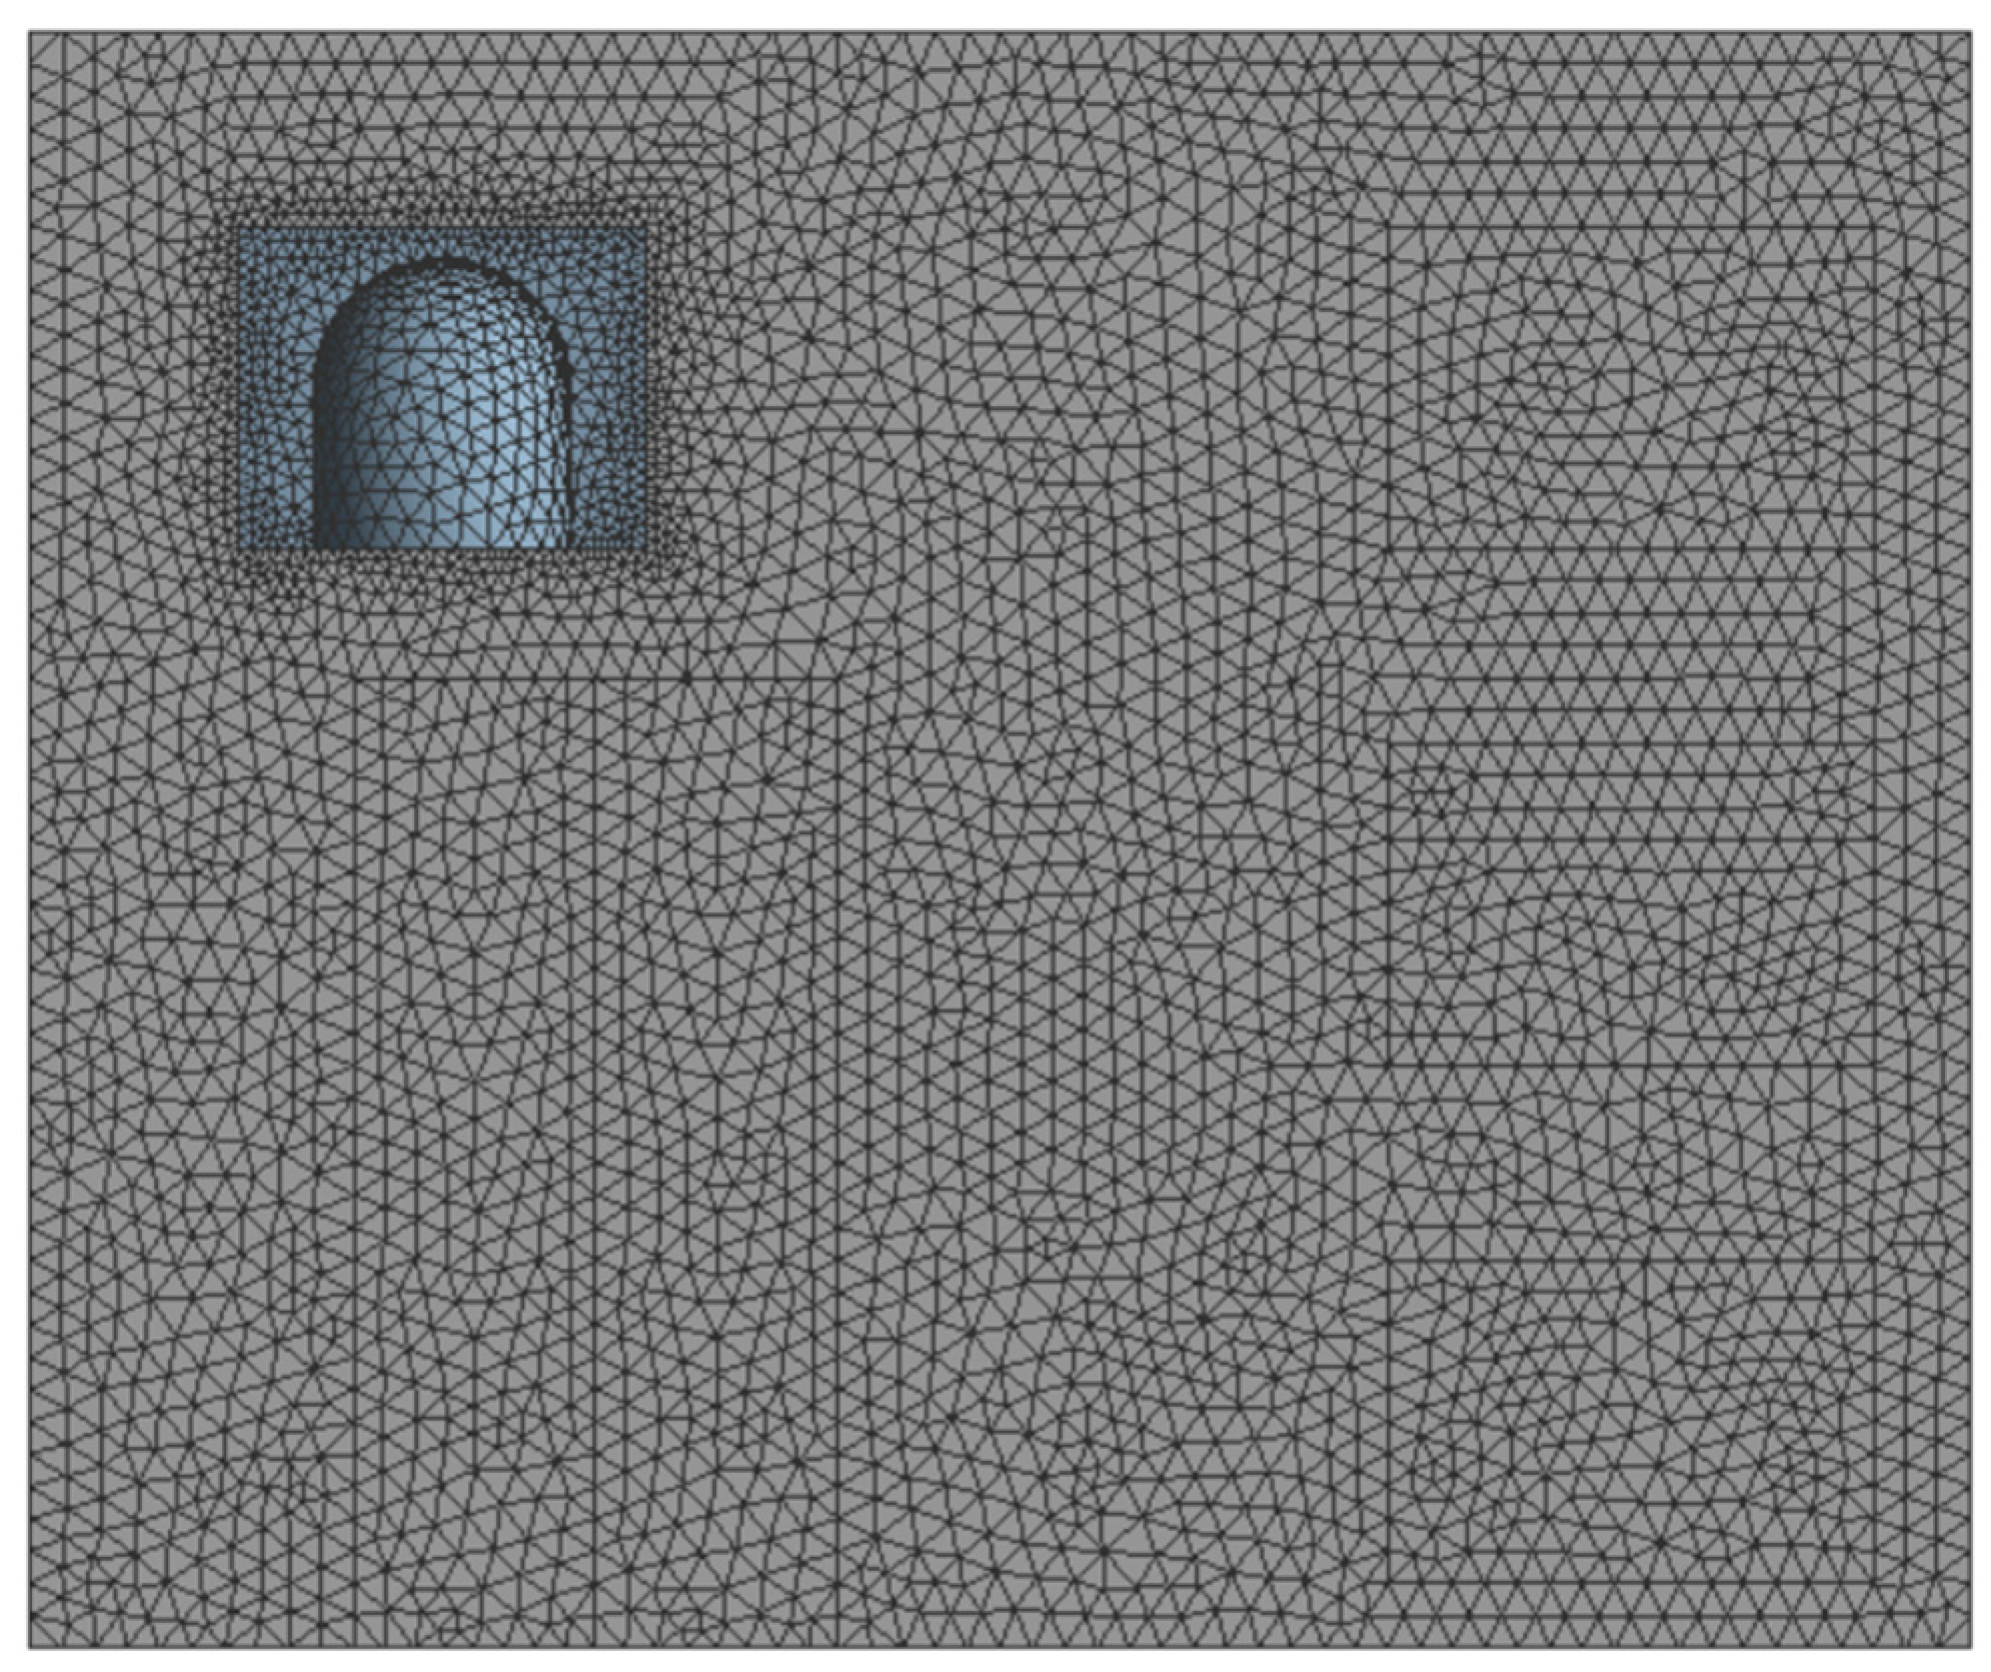
Firstly, the physical model of the reactor room and its ventilation system of the whole indoor substation is established. The reactor room size is set as 6 m × 4.5 m × 5 m. To simplify calculations, the heat dissipation equipment is simplified into a cuboid with a size of 2.5 m × 1.5 m × 1.4 m, and the maximum heat dissipation of the heat dissipation equipment can reach 50 kW. Three electric regulating louvers and fan outlet are arranged on the south wall. The size of the electric regulating louvers is 1.5 m × 1 m. The elbow of the fan outlet is 0.8 m and is connected with the air duct. The air duct configuration includes a square tube with a side length of 1 m, a round tube with a diameter of 1 m, and another round tube with a diameter of 0.8 m. The observation window is set on the east wall to facilitate the observation of the room. The observation window size is 1 m × 1 m. The physical model diagram is shown in Figure 1. The geometric model is meshed, and the meshing area is divided into solid (heat dissipation equipment) and fluid (indoor air), as shown in the model meshing diagram in Figure 2.

2.3. The Boundary Conditions

In this simulation, the energy equation is opened, and the k-epsilon standard wall function is used for viscosity model [19]. The SIMPLE algorithm based on the principle of pressure coupling was used to solve the indoor flow field [20]. The boundary conditions of electric regulating louvers and outlets are set according to the ventilation mode. When the indoor temperature is lower than 30 °C, only the enclosure is used for heat dissipation. When the indoor temperature exceeds 30 °C, the three electrically adjustable shutters are opened to achieve natural ventilation. When the indoor temperature exceeds 35 °C, the fan and the fan inlet are opened, the electric regulating louvers remain open, and natural air intake and mechanical air exhaust are carried out. Meteorological parameters from Dezhou, Shandong Province, are utilized in this study. The average wind speed in summer is 2.1 m/s, and the summer ventilation outdoor design temperature is 30.6 °C. The average wind speed in winter is 2.2 m/s, and the winter ventilation outdoor design temperature is −2.4 °C. The extreme maximum temperature in summer is 39.4 °C [21]. The effective ventilation coefficient for the electrically regulated louvers is 0.6. The boundaries of the model include three types: entrance, exit, and wall.
(1)
The south wall and the roof of the room are in contact with the external environment, while the remaining three walls are adjacent to other rooms. Consequently, heat transfer through these three walls to the outside is not considered. Therefore, only the south wall and the roof are set as the convection heat transfer boundary conditions, with a convection heat transfer coefficient of 1.85 W/(m2·K) [22]. Other walls are set to adiabatic conditions (no sliding solid wall constant temperature boundary condition).
(2)
For natural ventilation, electrically adjustable shutters are set to speed inlet and pressure outlet boundary conditions.
(3)
For natural air inlet combined with mechanical exhaust, the electric regulation shutter and fan outlet are set to the speed inlet boundary condition; the inlet speed is positive, and the outlet speed is negative (indicating that the airflows to the outside). The inlet wind speed and temperature are based on meteorological parameters from Dezhou, Shandong Province. Additionally, the mechanical exhaust speed is determined using the exhaust air volume.
(4)
The wall of the air duct is set as the adiabatic boundary, and the fan inlet is located inside the fluid area, so it is set as the internal boundary condition (interior).
(5)
The wall of the heat dissipation equipment is set as the constant heat flux boundary, and the heat flux value is calculated according to the heat dissipation capacity of the equipment.
(6)
The thermal physical properties of air are set as constant, the density is 1225 kg/m3, the specific heat is 1006.43 J/(kg·K), the thermal conductivity is 0.0242 W/(m·K), and the viscosity is 1.7894 × 10⁻⁵ kg/(m·s).

3. The Simulation Result

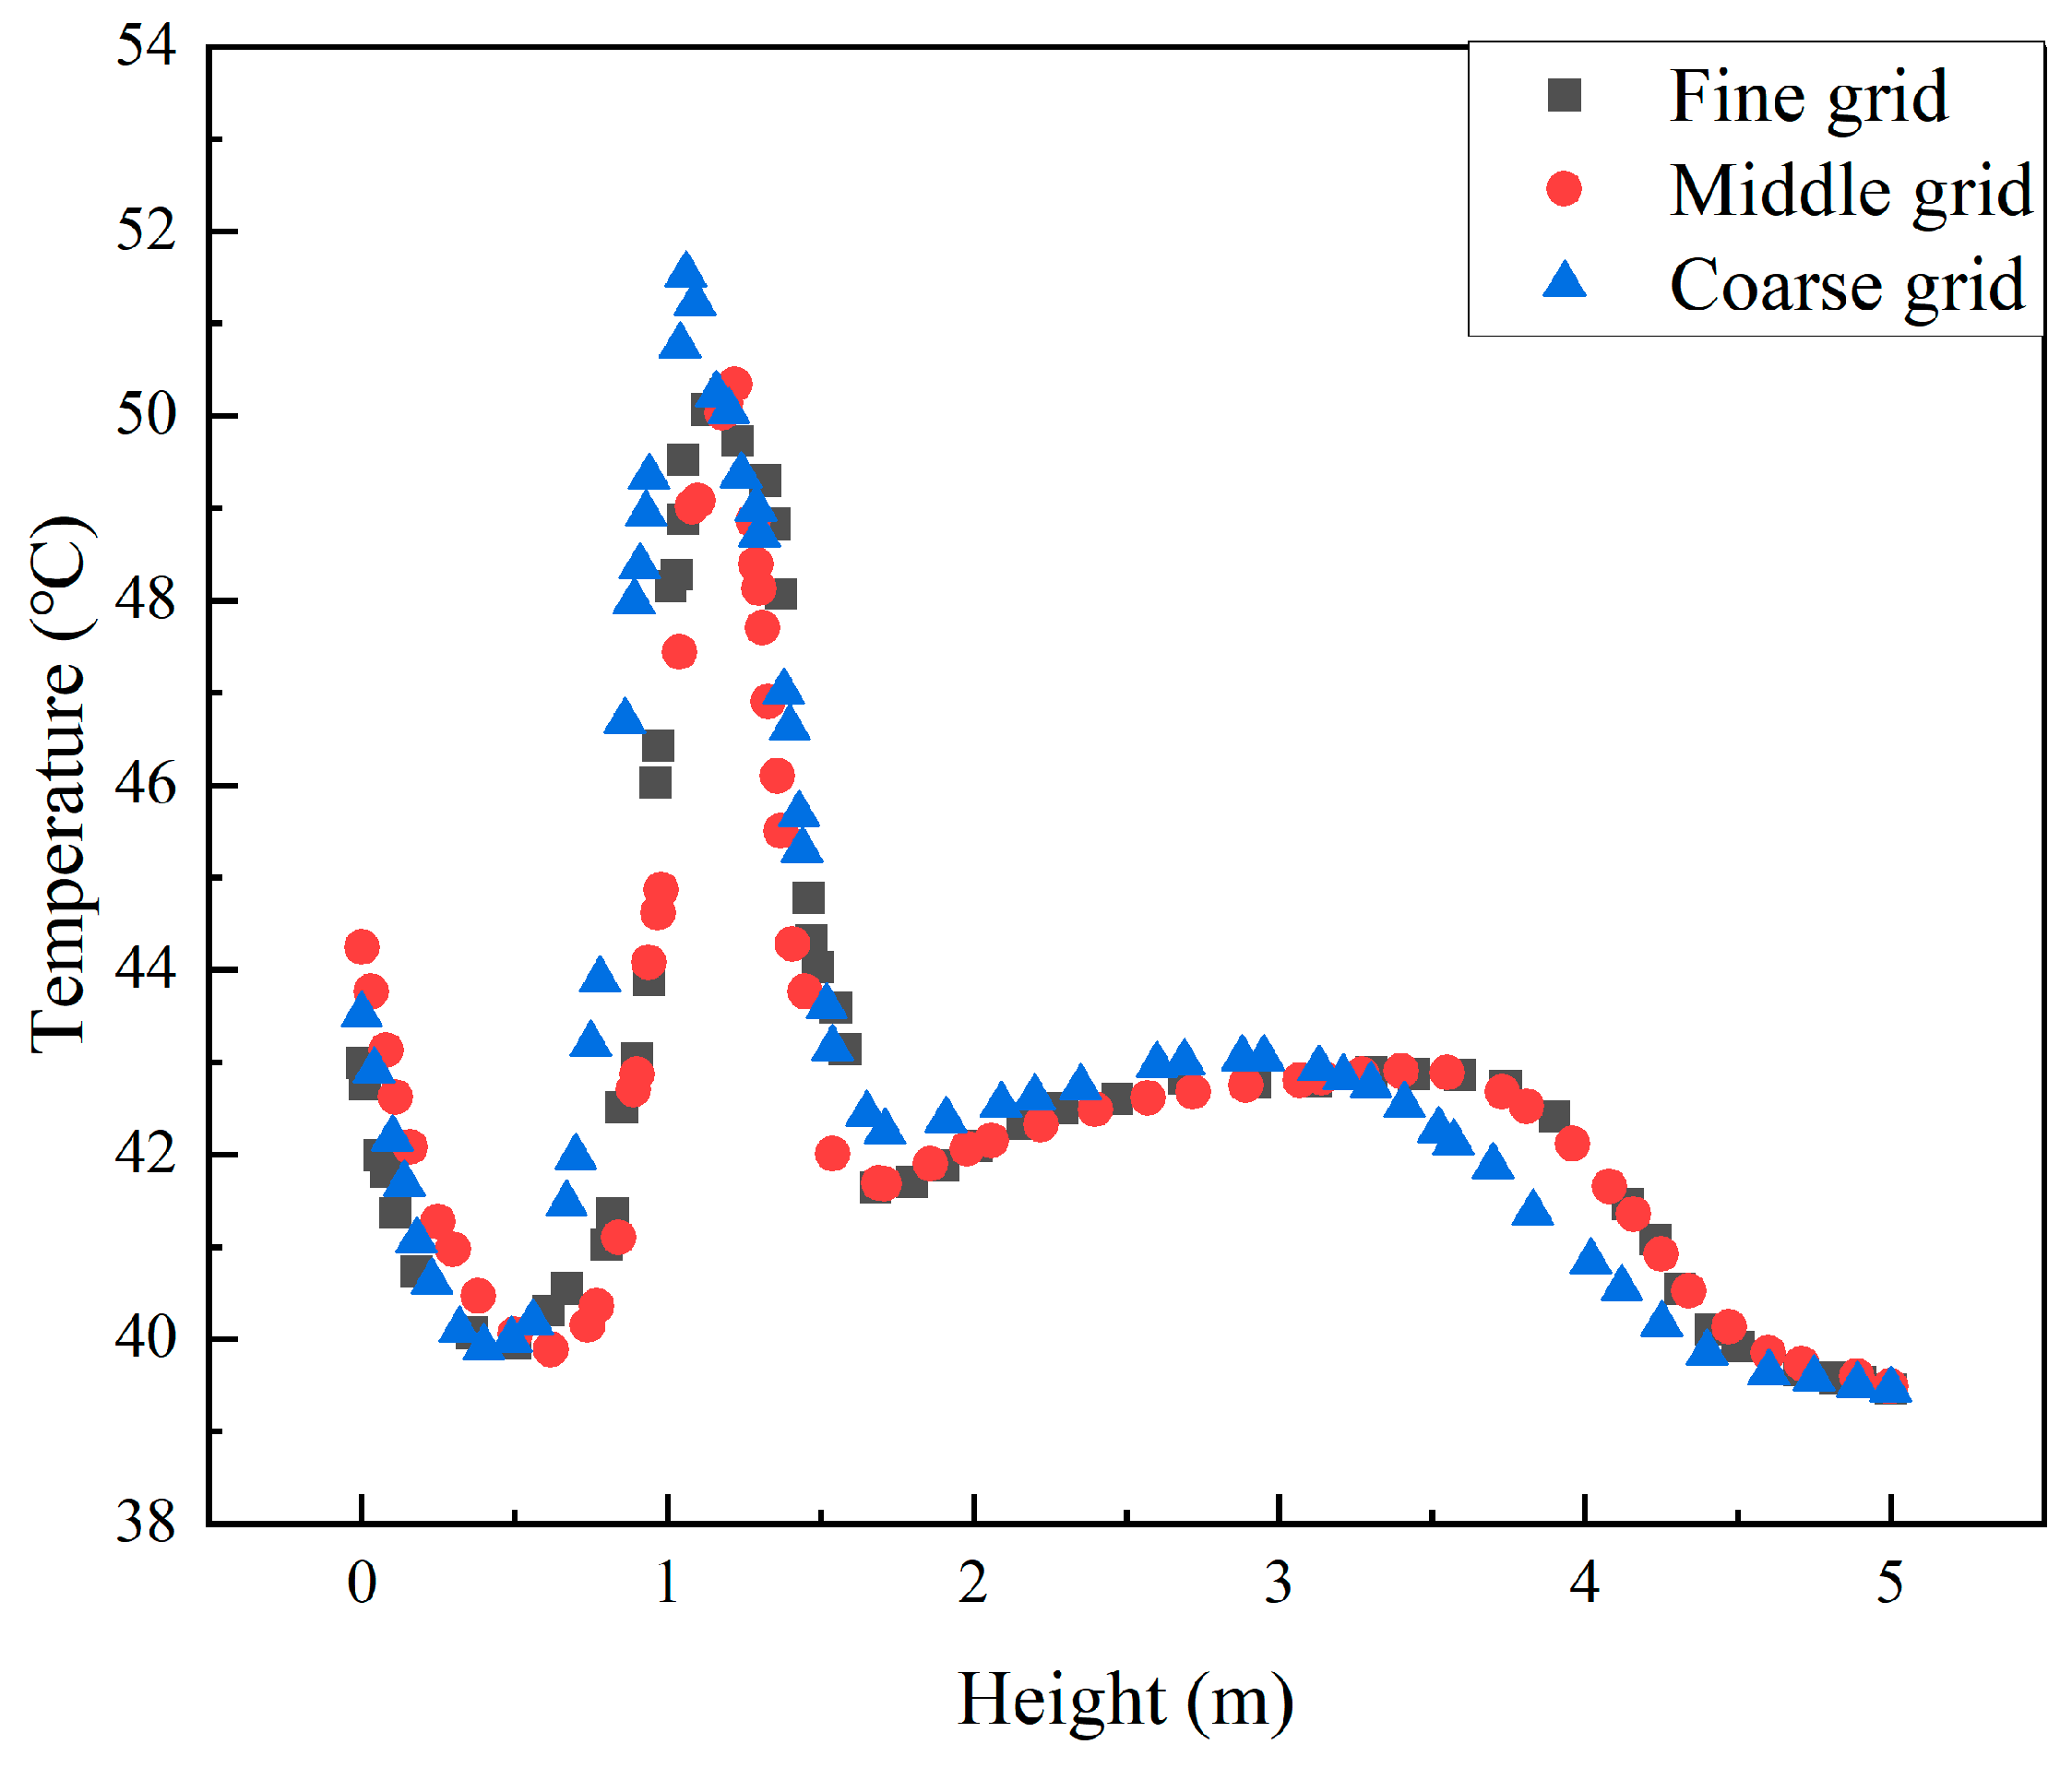
In view of the operation of an indoor substation ventilation system, the use of a mathematical model and physical model can reasonably reflect the heat transfer situation. Thus, the simulation analysis can be based on the model, and the change law of the temperature field can be more clearly displayed. FLUENT 20.2.0 is used to simulate the ventilation effects in the reactor room of the whole indoor substation. In the analysis of the grid independence (see Figure 3), the predicted temperature values are basically the same in the medium and fine grids. This indicates that grid independence was achieved. Therefore, considering the calculation time cost, a medium grid size is selected in this study.
The summer ventilation outdoor design temperature in Dezhou area of Shandong Province is 30.6 °C, and the maximum the heat dissipation capacity of the reactor is 50 kW. In order to observe the ventilation in the most unfavorable environment, the outdoor temperature is set at 30.6 °C and the heat dissipation capacity is 50 kW. According to the ventilation quantity calculation in Equation (4) [23], the theoretical ventilation quantity of mechanical ventilation under these working conditions can be calculated as 15,799.45 m3/h.
L = Q 0.28 × c × ρ a v × ( t e x t i n )
where L is the ventilation required for heat removal, m3/h; Q is the heat dissipation capacity of reactor, W; c is the specific heat capacity of air, c = 1.01 kJ/ (kg·°C); ρav is the average density of air inlet and exhaust air, kg/m3; and tin, tex is inlet and exhaust air temperature, respectively, tex = 40 °C.
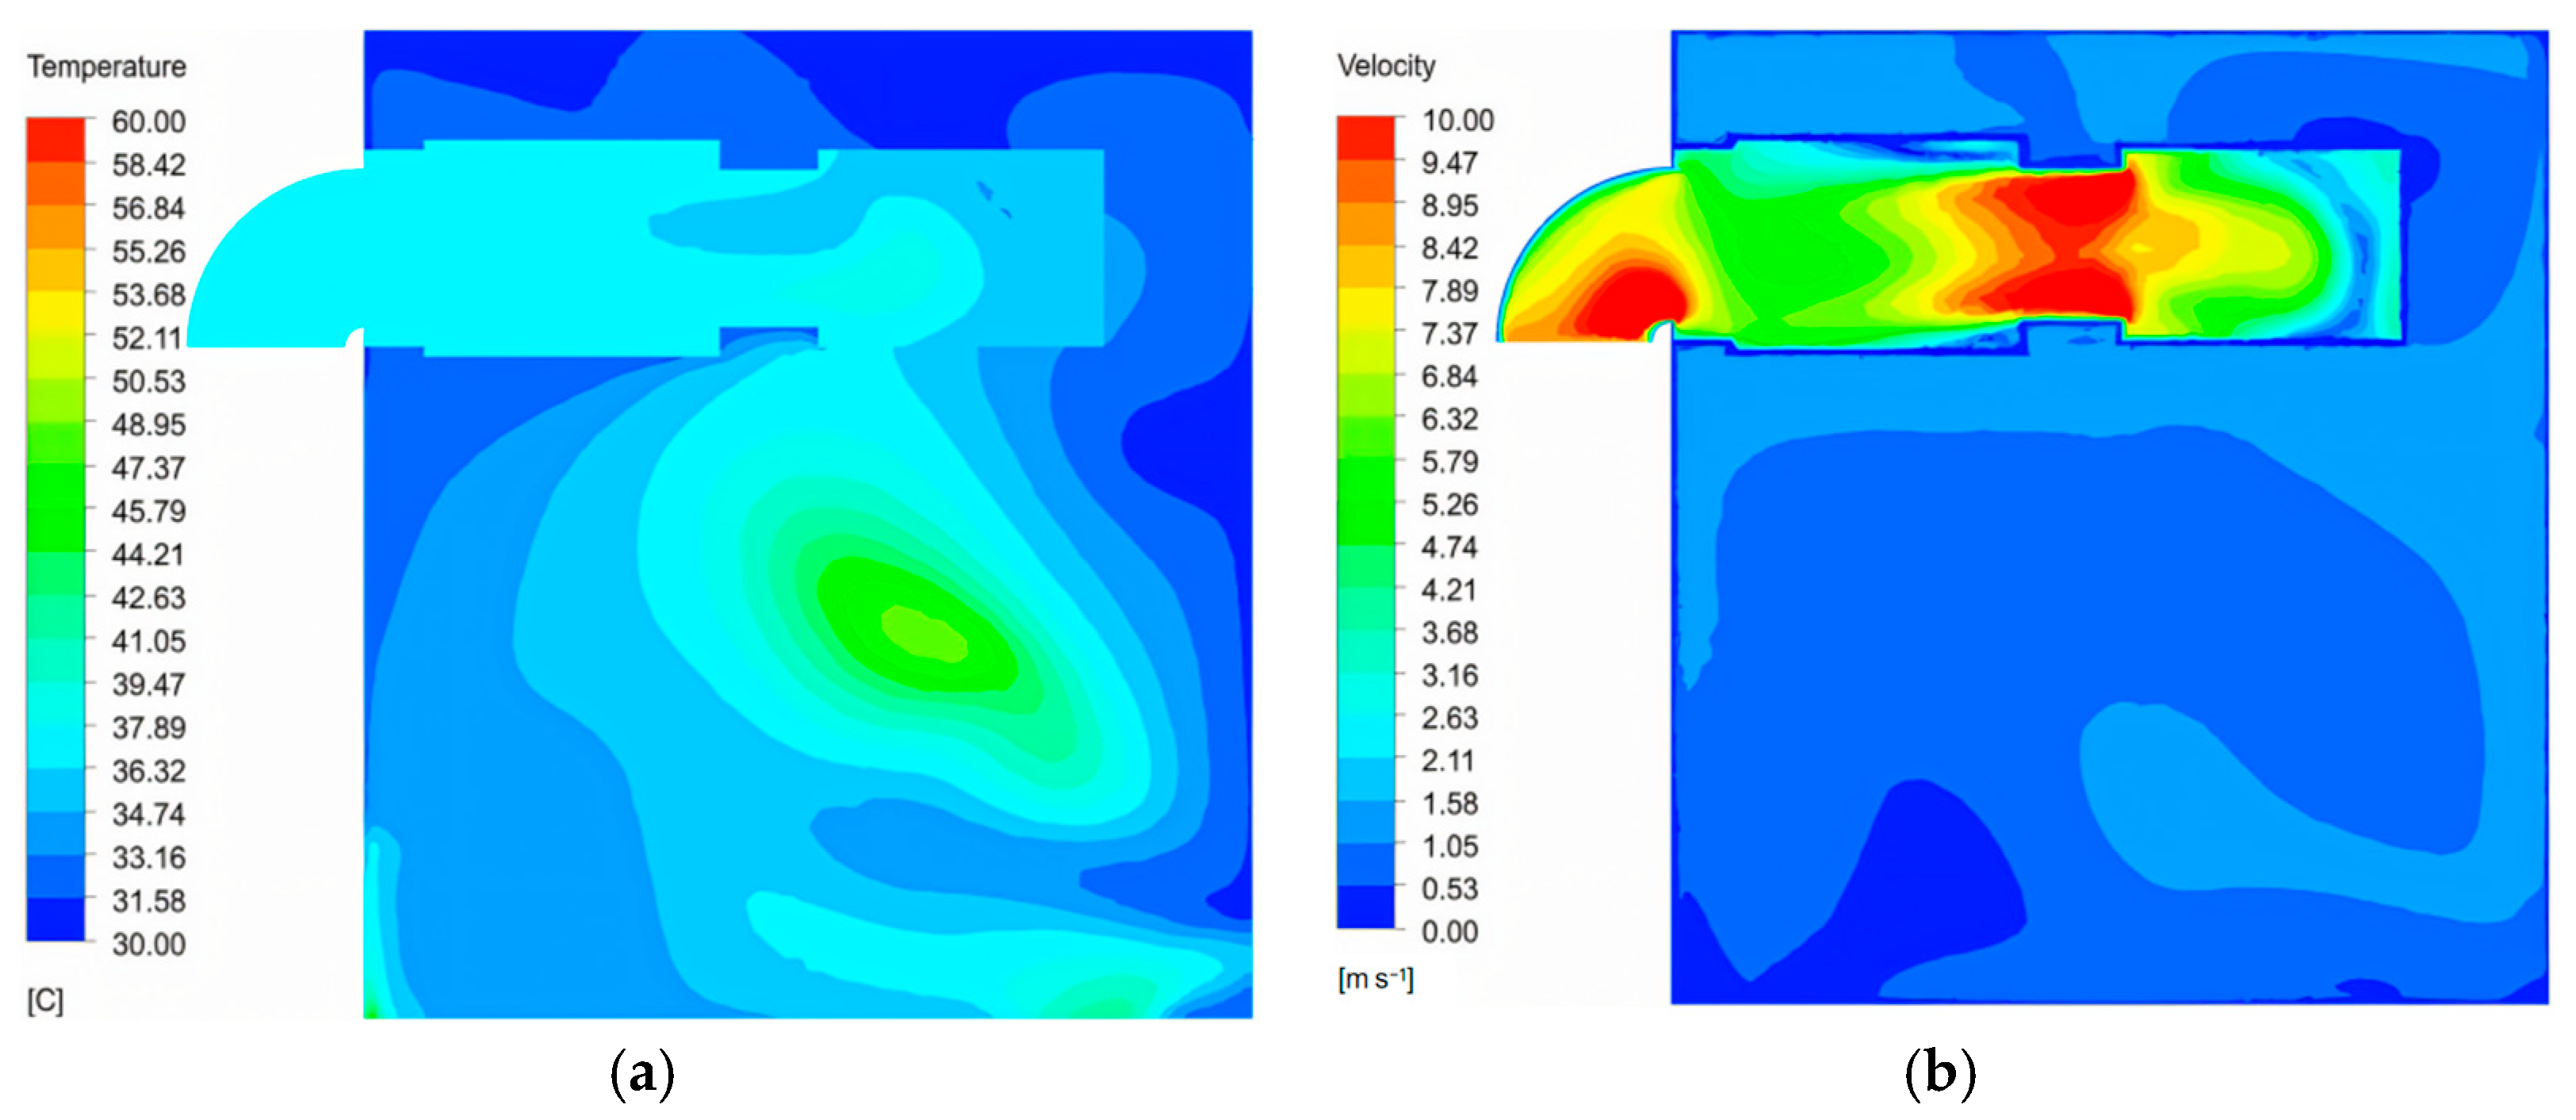
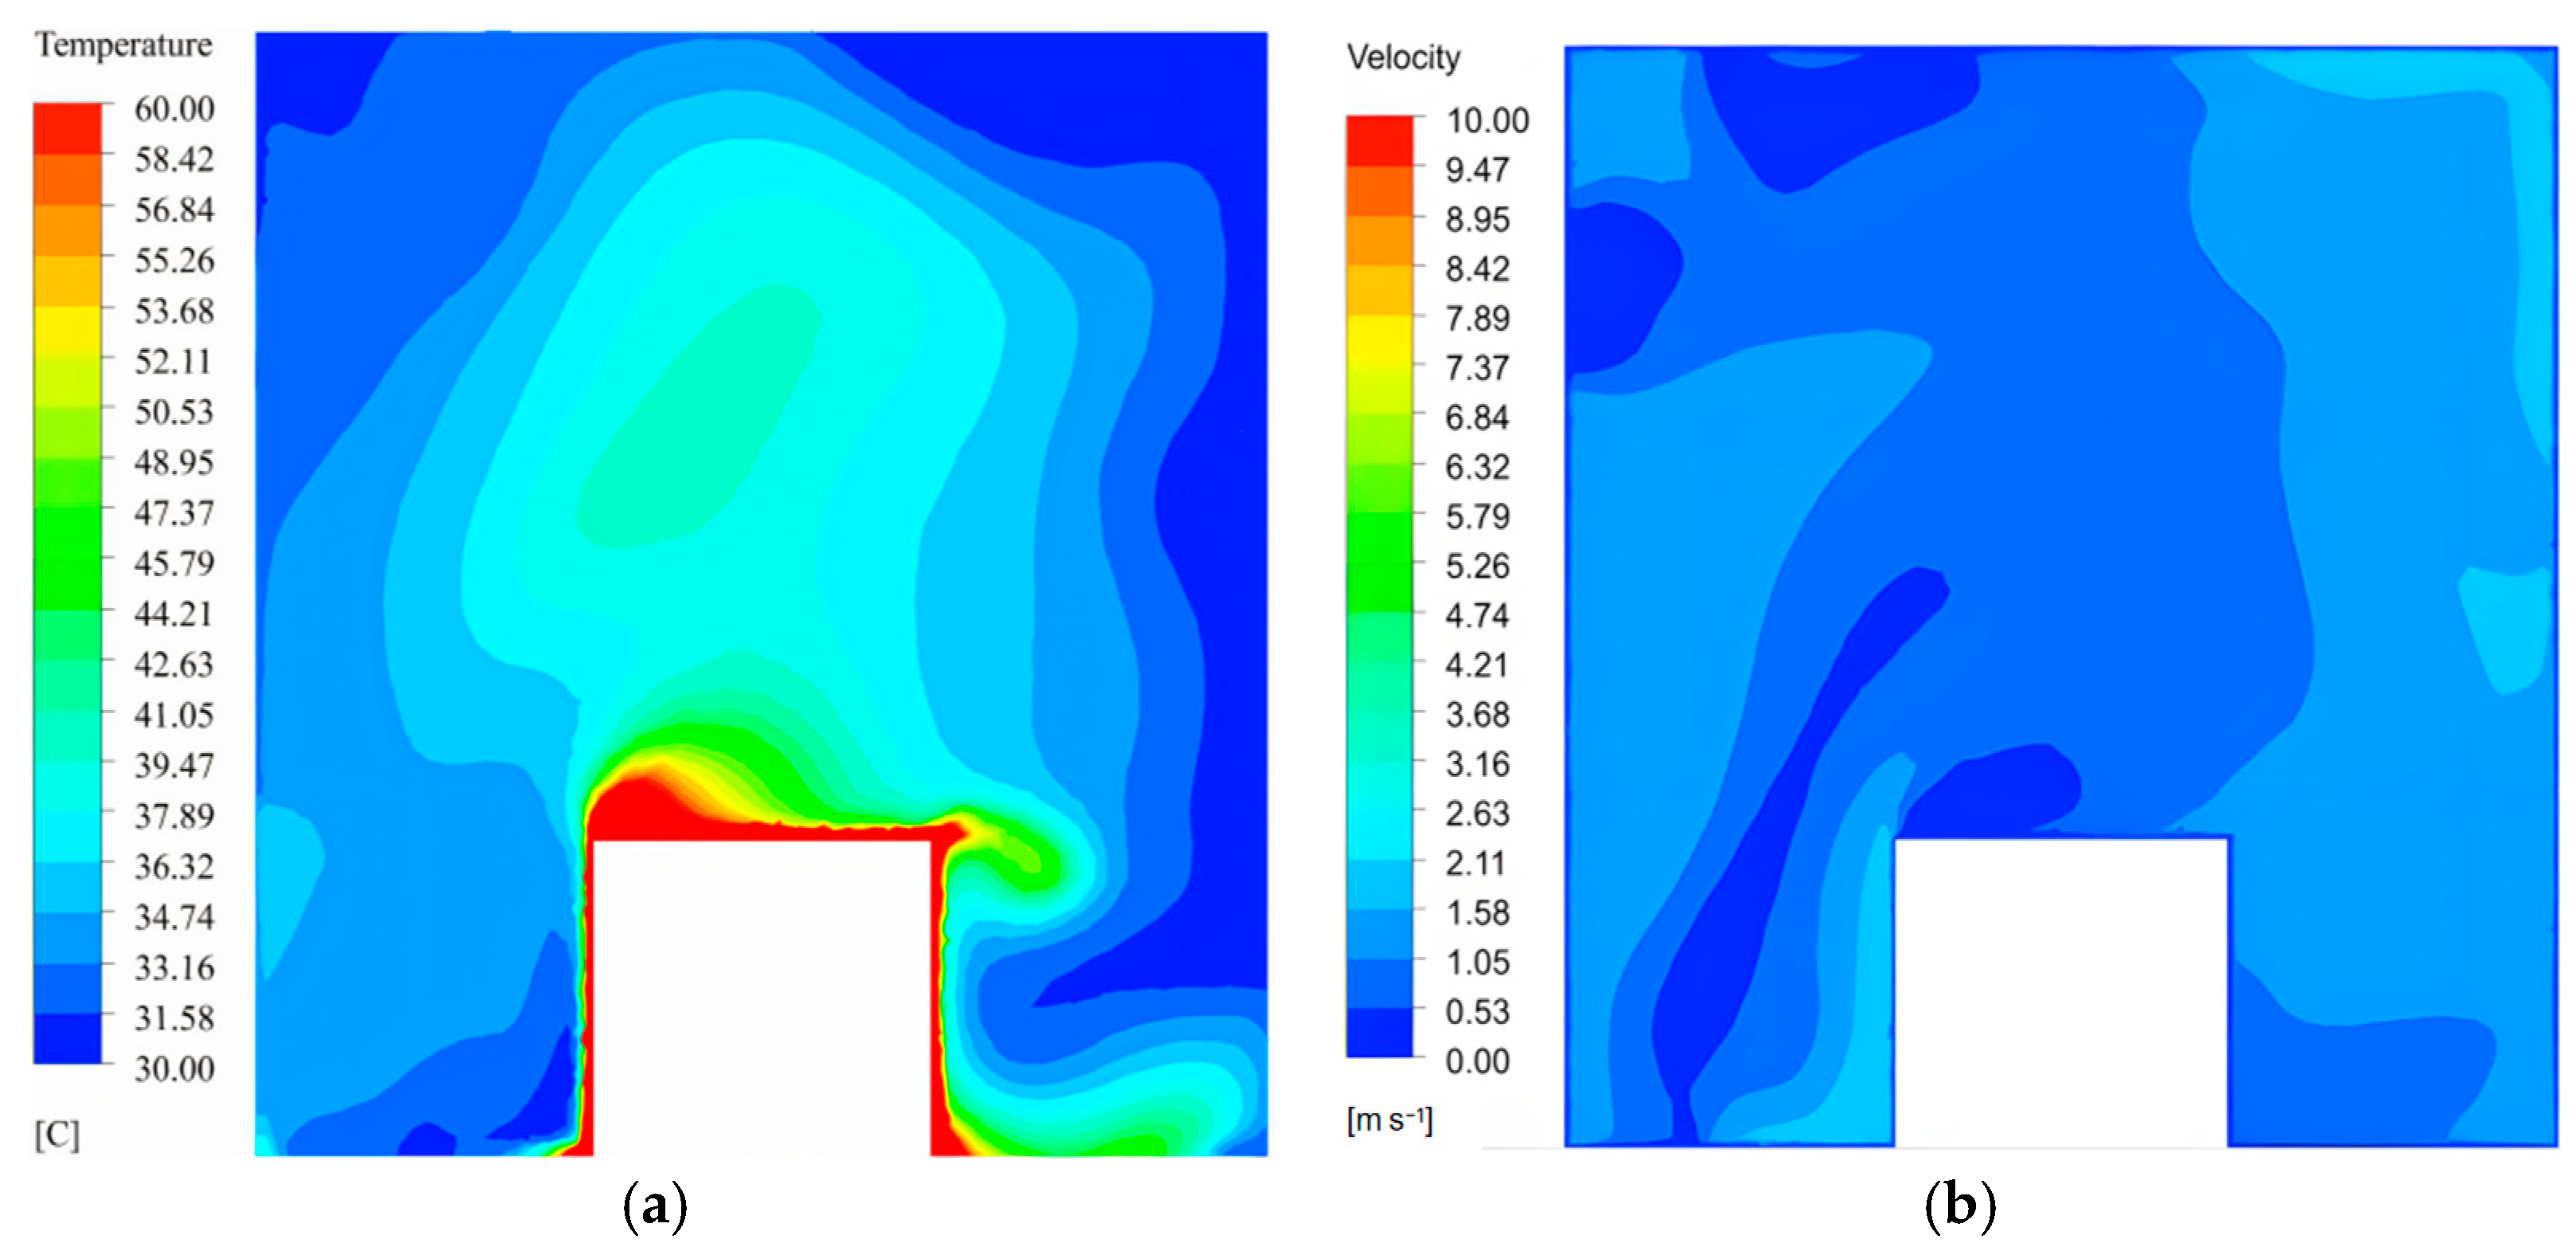
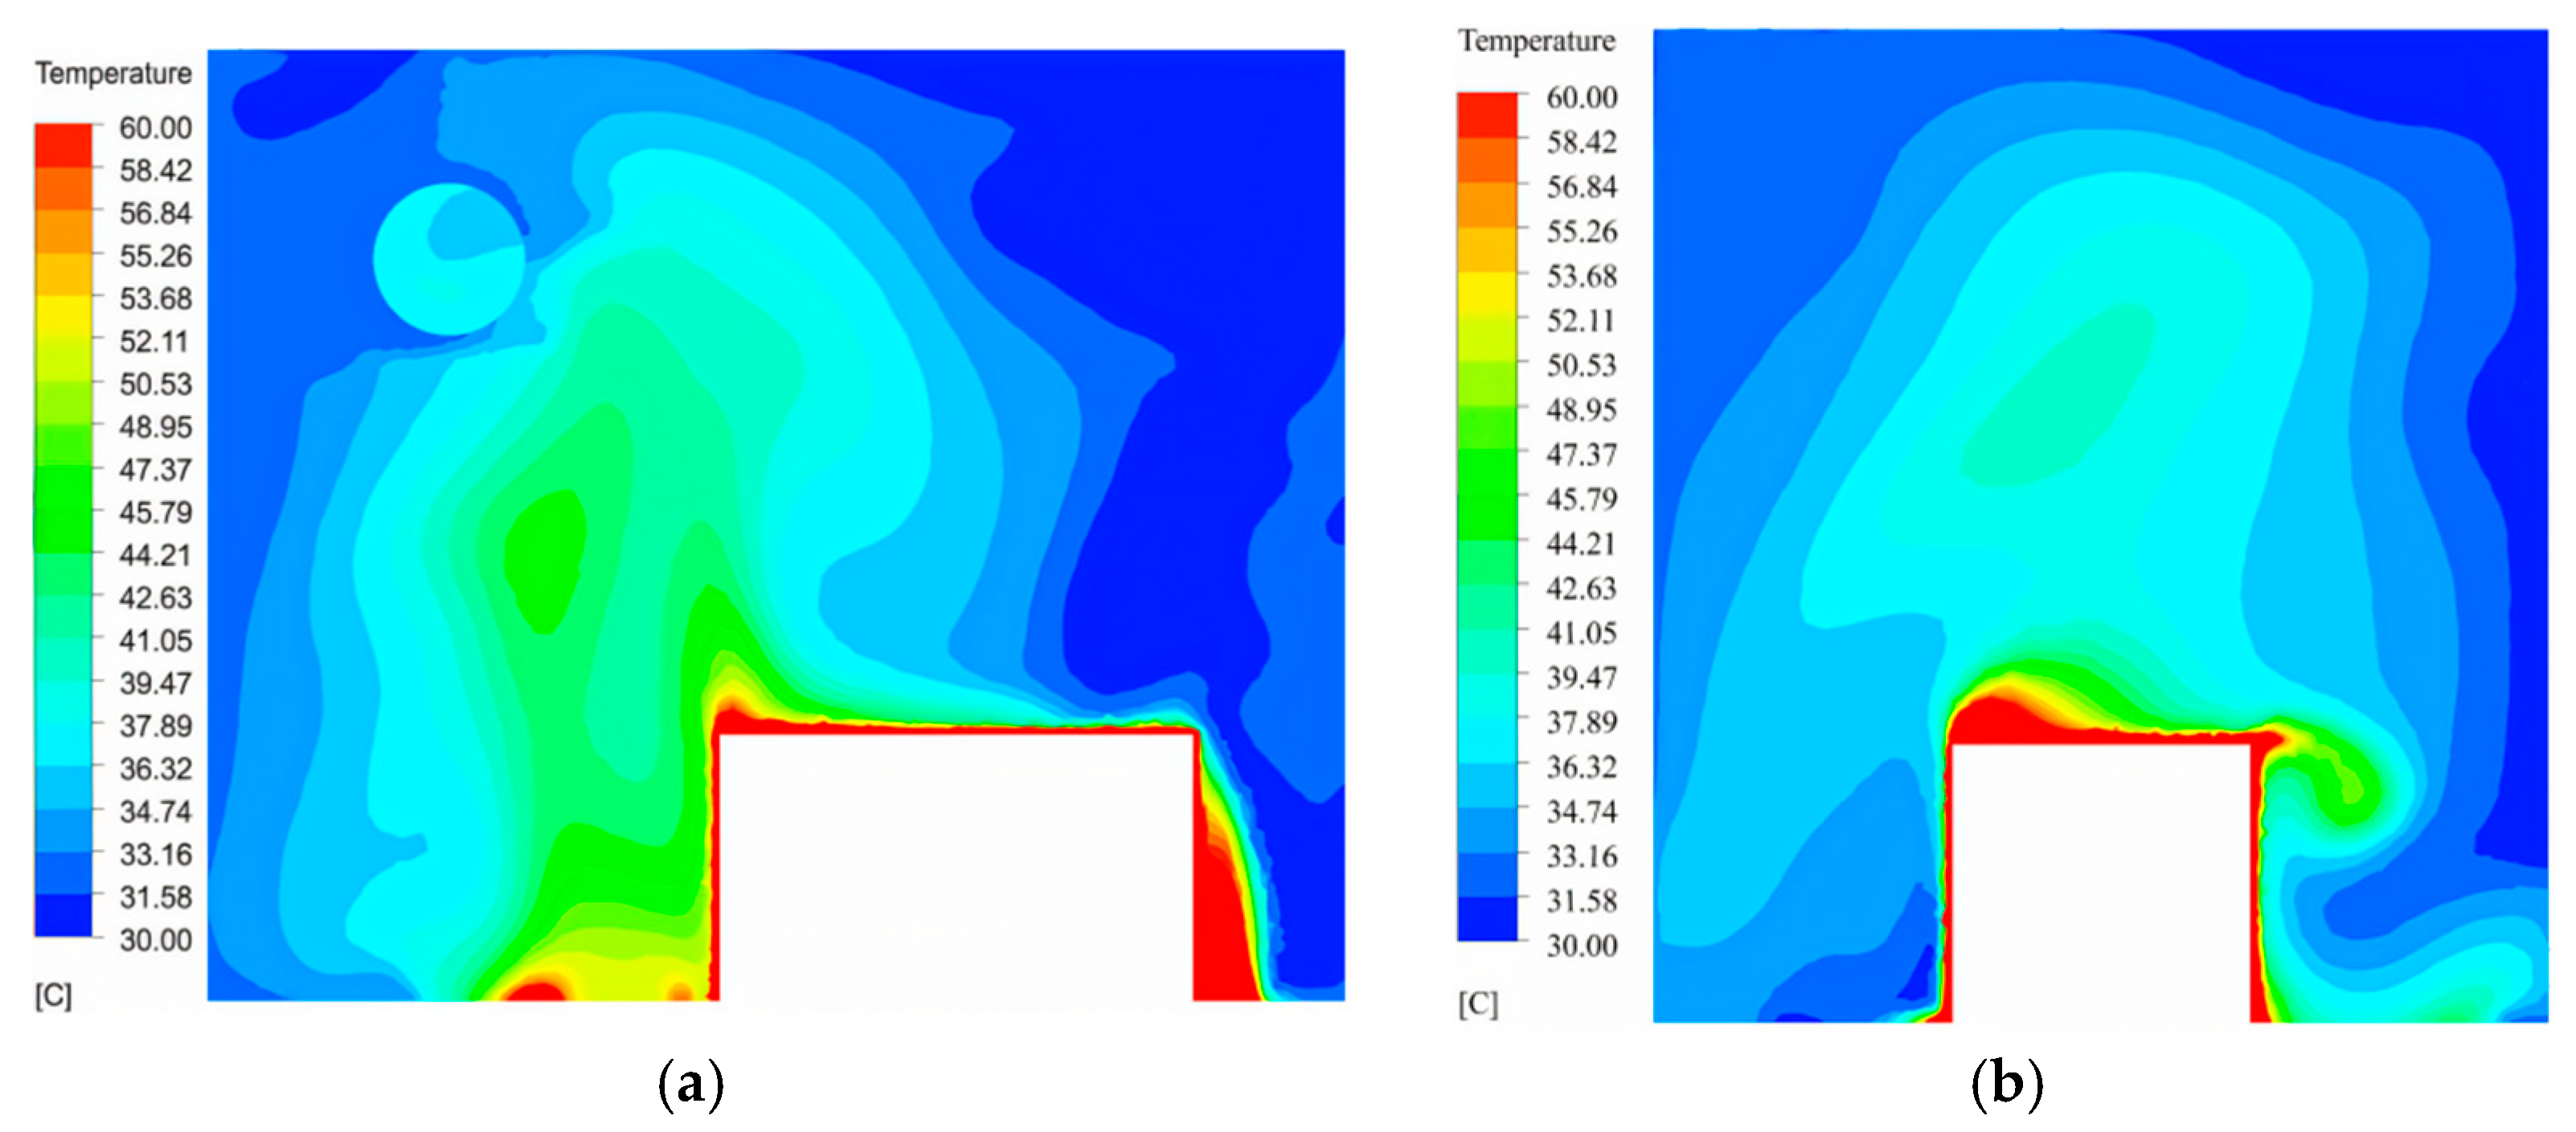
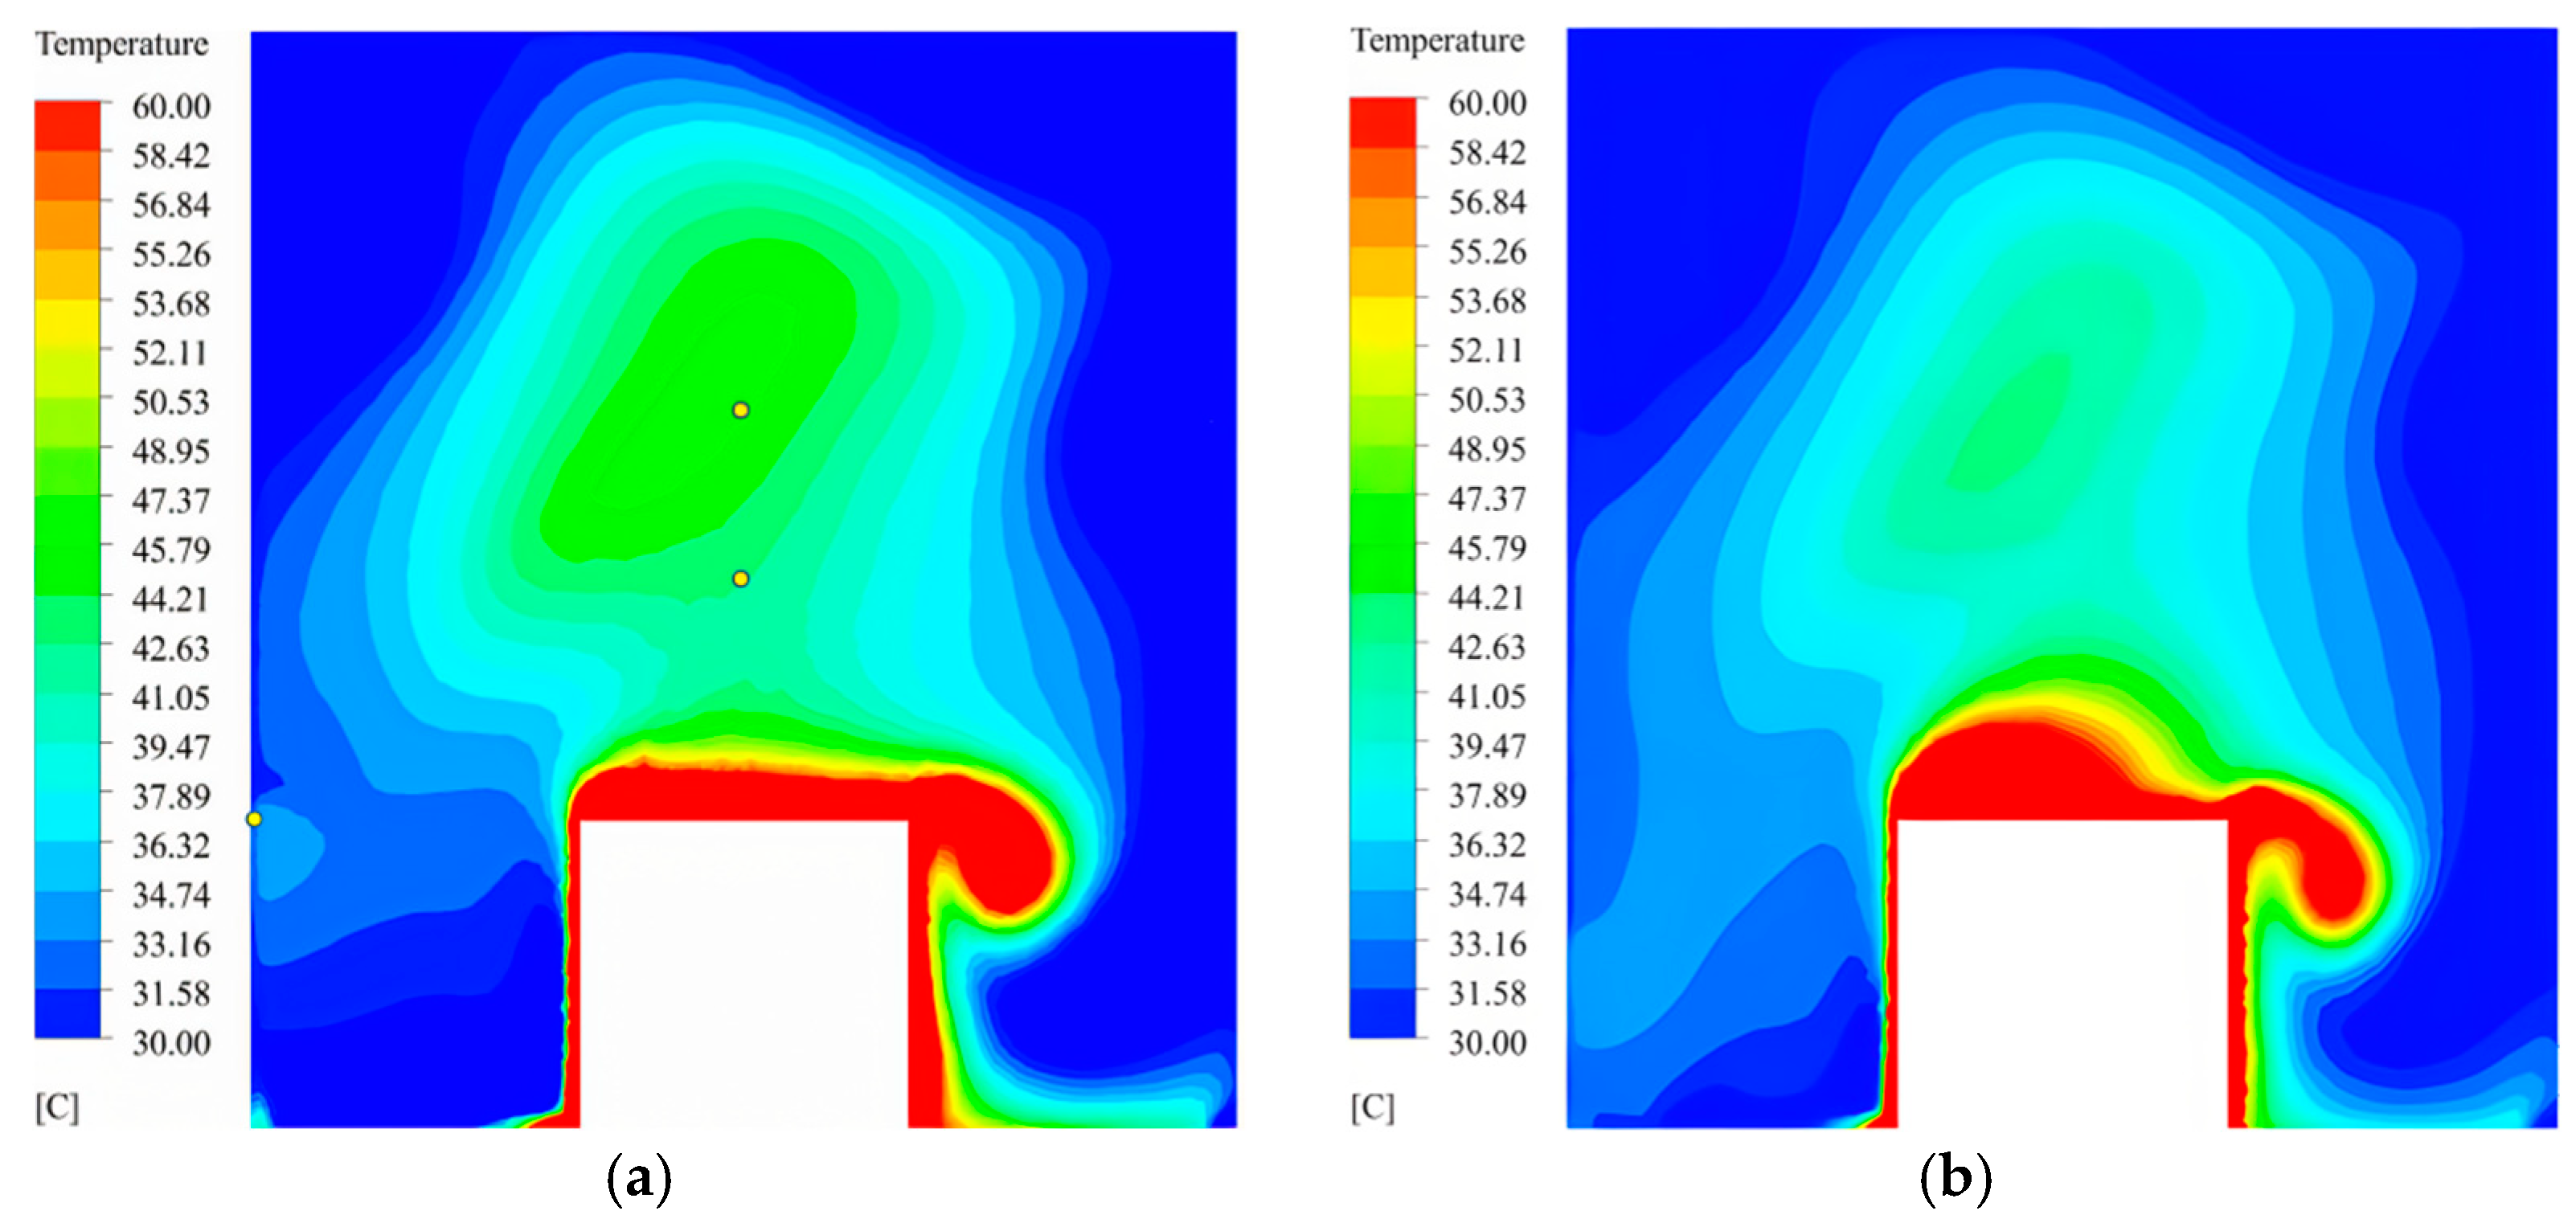
The simulation under the working condition with an outdoor temperature of 30.6 °C and the heat dissipation capacity of 50 kW aimed to analyze how these factors impact the indoor environment. Since x = 3 m was located in the center of the room and x = 1.3 m was located in the center of the air duct, the cross-sections at x = 1.3 m and x = 3 m were, respectively, used for analysis. Figure 4 and Figure 5 show the distribution diagram of indoor temperature and wind speed at x = 1.3 m and x = 1.3 m, respectively.
By observing the temperature distribution diagram in Figure 4 and Figure 5, it can be seen that the temperature in most areas of the room is below 37.89 °C. Since the air duct and fan are above the side of the heat dissipation device, the airflows from the air inlet through the heat dissipation device to the fan entrance, so the temperature above the heat dissipation device is relatively high, ranging from 37.89 °C to 41.05 °C. It is shown in Figure 4a that there is a high-temperature area under the duct. Combined with Figure 4b, the wind speed under the duct is low, and there is less airflow. This continuous heat dissipation from the equipment leads to heat accumulation and temperature rise in the area with poor airflow, but the indoor temperature can basically meet the target temperature (40 °C) below, indicating that the ventilation system can basically meet the indoor temperature control of the reactor room of the whole indoor substation.

4. The Experimental Research

4.1. The Construction of the Experimental Platform

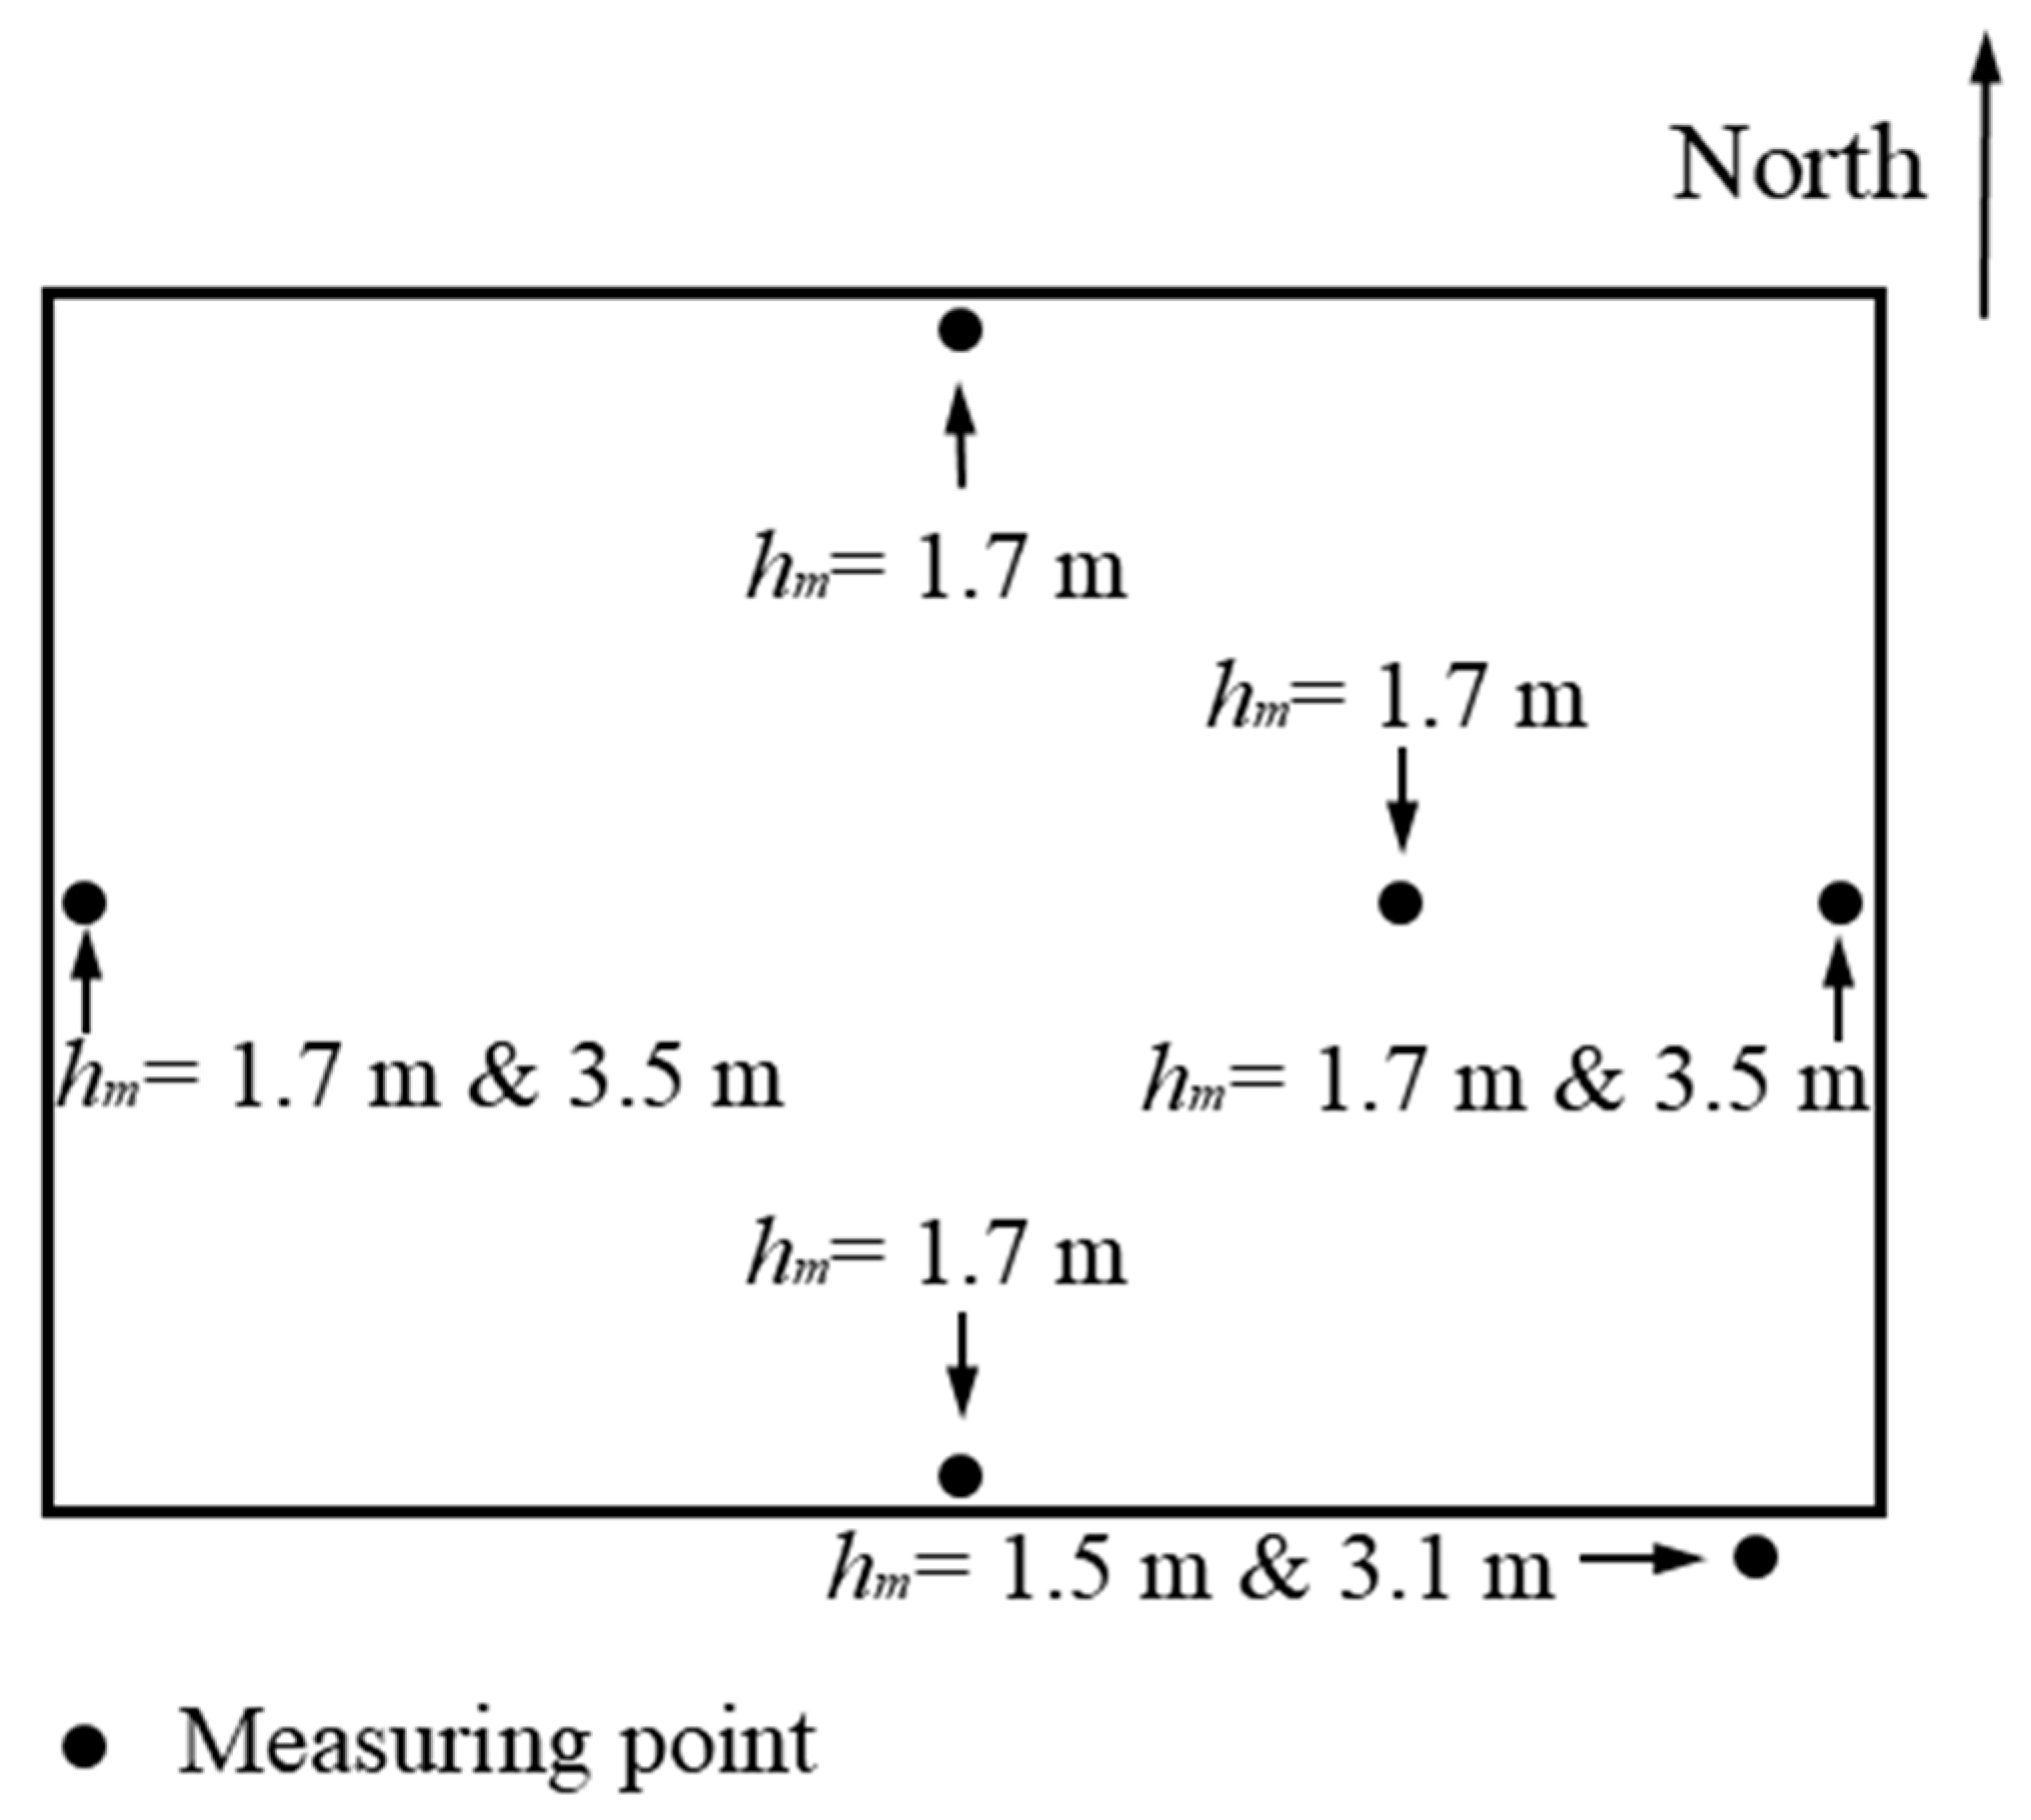
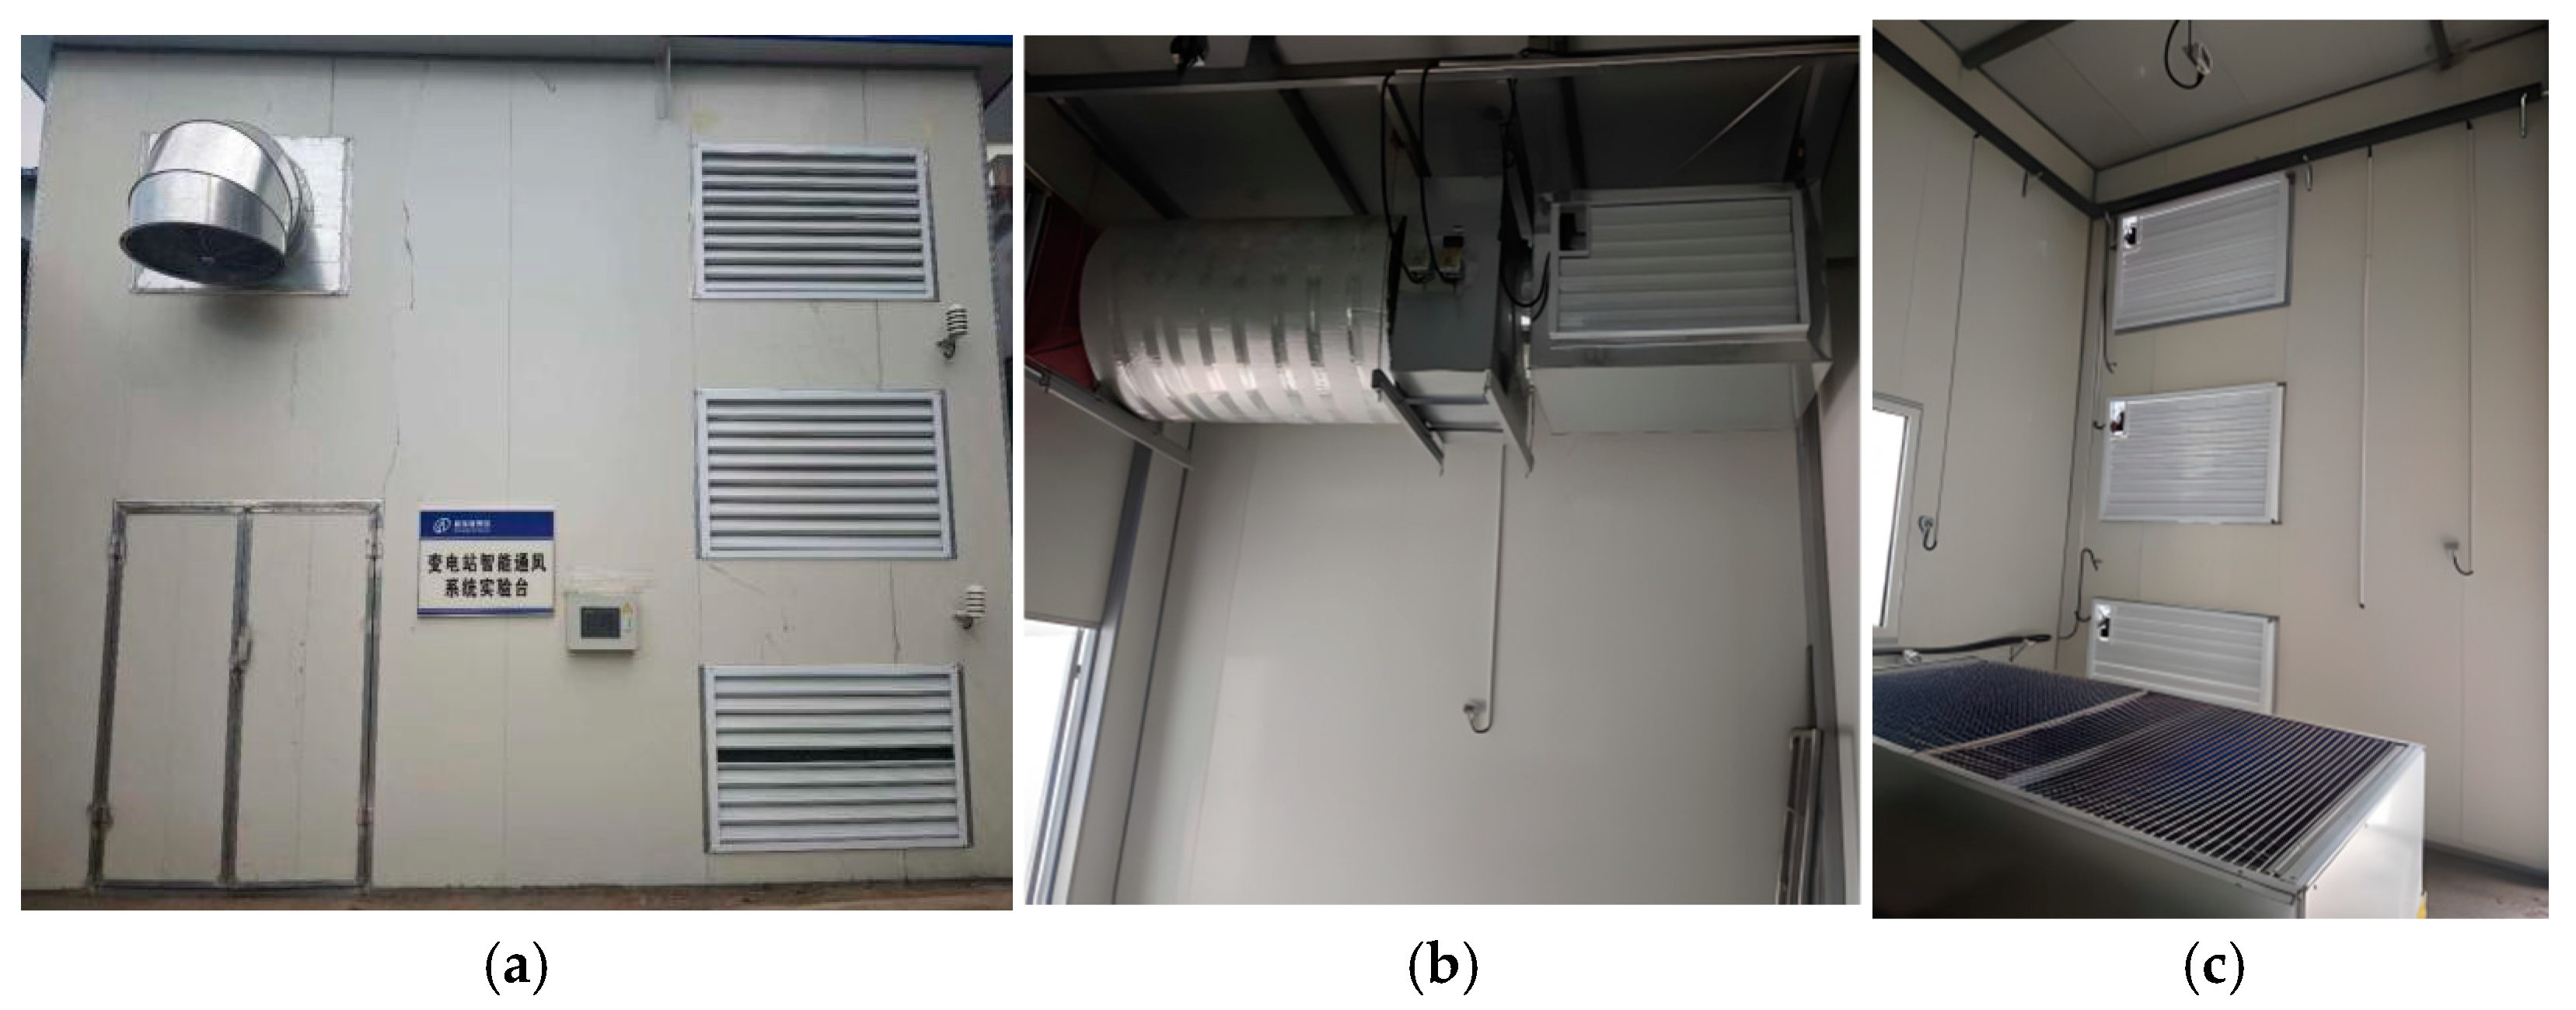
To validate the accuracy of the theoretical research, an experimental platform was built for testing. The experiment was carried out in Dezhou, Shandong Province. This experimental platform is equipped with an adjustable electric heating module to simulate the heat dissipation of the reactor. The south wall is equipped with three automatically controlled electric regulation shutters. The fan entrance is an electric tuyere that can be controlled in linkage with the fan, the fan exit is a bend, the fan entrance and exit are connected by air pipes, the east wall is equipped with an observation window, the roof is made of 50 mm thick rock wool board, and the wall is made of 50 mm thick silica rock board. A total of nine temperature sensors are arranged indoors and outdoors, of which two temperature sensors are arranged outdoors, located in the middle of the rainproof shutters, and the other seven temperature sensors are arranged indoors, located 1.7 m from the ground in the center of the surrounding walls and 3.5 m from the ground in the center of the east and west walls. The heat dissipation equipment is 2.5 m from the ground. As shown in Figure 6, the south wall is equipped with a display screen, which can control the ventilation mode and fan frequency, as well as the display of indoor and outdoor temperatures. The field test bench is shown in Figure 7. Wenhui Qin et al. [13] conducted measurements in the main transformer room of their substation, but the ventilation system of their substation is set up with the ventilation mode of natural air supply and mechanical air supply and natural air exhaust and mechanical air exhaust. The automatic control system set in this study automatically changed the ventilation mode and adjusted the ventilation volume according to the indoor and outdoor temperatures, which was different from the ventilation mode set by Wenhui Qin et al. In addition, the experiment outlined in this paper mainly studies the effect of indoor ventilation and heat dissipation under different outdoor temperatures and different heat dissipation, and the test is more comprehensive.

4.2. Setting of Working Conditions

The heat dissipation capacity set in this experiment was 20 kW, 30 kW, 40 kW, and 50 kW, respectively. When the outdoor temperature was set to different values, the indoor temperature changes caused by different heat dissipation capacities were tested. In order to test the ventilation conditions in different environments, we selected four outdoor temperatures of 21 °C, 24 °C, 27 °C, and 31 °C. The test was carried out twice. The first time, the experiment was conducted from 15 May to 20 May in spring, and the outdoor temperatures were, respectively, 21 °C, 24 °C, and 27 °C. For the second time, the experiment was conducted from 10 July to 11 July in summer, and the outdoor temperature was 31 °C. There were 16 working conditions in total. The ventilation required by different working conditions was calculated according to the ventilation calculation Equation (4). The results of the working condition settings and the corresponding ventilation volume calculations are shown in Table 1.

4.3. The Experimental Tests

4.3.1. The Wind Speed Measurement

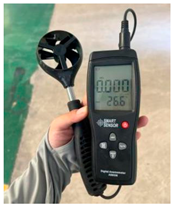
In this experiment, a T35 axial fan with a flow rate of 17,567 m3/h was selected as the fan for this experiment. In the actual operation process, the air duct, tuyere, and other equipment produce the resistance loss and local resistance loss. In order to obtain the actual wind volume, we tested the wind speed. During the full frequency operation of the fan, nine measuring points were selected for each tuyere to test the wind speed of three inlet shutters and the fan entrance. The supplied air volume and exhaust air volume were calculated according to Equation (5). During the test, the wind speed was measured using an AS8336 anemometer, which was manufactured by Shenzhen Huaqing Instrument Co., Ltd., Shenzhen, Guangdong, China. The instruments and performance parameters are shown in Table 2. The measurement data and calculation results of ventilation volume are shown in Table 3.
L = 3600 × v × F × Φ
where L is the air volume of the tuyere, m3/h; v is the tuyere speed, m/s; F is the tuyere area, m2; and Φ is the effective ventilation coefficient.
As shown in Table 3, the supply air volume calculated based on wind speed is approximately 13,716 m3/h, while the exhaust air volume is about 13,352 m3/h. However, during the actual measurement process, due to the errors caused by the environment, instruments, readings, and other problems, the supply air volume and exhaust air volume can be approximately seen as equal. The ventilation volume of the fan, when operating at full frequency, is taken as the average of the supply air volume and exhaust air volume, which is 13,534 m3/h.
Table 1 demonstrates that the ventilation required by working condition 16 is the largest, which is 17,274.69 m3/h. According to the test results of the wind speed of the fan in Table 3, the actual exhaust air volume of the fan at full frequency (50 Hz) is approximately 13,534 m3/h. Therefore, the path resistance and local resistance in the ventilation system may hinder the actual air volume from reaching the fan’s rated capacity. This indicates that the fan selection may be inadequate. The T35 axial fan with a flow rate of 23,624 m3/h was re-selected, and the ventilation system after fan replacement was tested, which was consistent with the above test method. The measured data and calculation results of the ventilation volume of the new fan were obtained, as shown in Table 4.
Table 4 shows that the supply air volume calculated based on wind speed is approximately 17,460 m3/h, while the exhaust air volume is around 17,150 m3/h. The theoretical calculations indicate that after the fan replacement, the system’s air volume can maintain the indoor temperature within 40 °C. During full-frequency operation, the fan’s ventilation volume is the average of the supply and exhaust air volumes, which is 17,305 m3/h.

4.3.2. Working Condition Tests

The heat dissipation equipment can be turned on, and therefore, the heat is released into the indoor air. The electric regulation shutters should be opened manually when the indoor temperature exceeds 30 °C. When the indoor temperature exceeds 35 °C, the shutters are kept open while opening the fan to achieve natural air intake and mechanical exhaust. The 16 operating conditions outlined in Table 1 were tested, and the average values from seven temperature measurement points were used to analyze the indoor temperature. The results are outlined below.
Figure 8 shows the test results of 16 working conditions—that is, the curve of indoor temperature change over time under different outdoor temperatures when the heat dissipation capacity is 20 kW, 30 kW, 40 kW, and 50 kW, respectively. Figure 8d, as an example, demonstrates the test results for a heat dissipation capacity of 50 kW when the heat dissipation equipment is activated. It can be observed that as the heat dissipation equipment operating time increases, the indoor temperature continues to rise. When the fan is turned on, there is a noticeable decline in indoor temperature, which stabilizes after several fluctuations, ultimately remaining below 38 °C. It is evident that the system effectively expels indoor heat, maintains the average indoor temperature within 40 °C, and meets the indoor ventilation and cooling requirements of the whole indoor substation.

4.3.3. Comparison Between Experiment and Simulation

The working condition labeled as condition 16 (where the outdoor temperature is 31 °C and the heat dissipation capacity is 50 kW) was simulated, and the screenshots at z = 2.25 m and x = 3 m were used for analysis. Table 5 presents data after the indoor temperature stabilized under experimental test condition 16, with a total of seven temperature points measured in the room.
Figure 9 illustrates the indoor temperature distribution under working condition 16, showing that most areas of the room have temperatures below 39.47 °C. Due to the mechanical exhaust outlet being positioned in the upper left corner of the room, the airflow moves upward to the left. Consequently, the temperature above and to the left of the heat dissipation equipment is elevated, ranging from 41.05 °C to 52.11 °C. The large heat dissipation capacity leads to continuous heat accumulation, and high-temperature areas around the heat dissipation equipment are above 60 °C. The temperature around the walls of the room is below 36.32 °C. P1–P6 is located on the wall of the room, and the temperature measured in the experiment is below 37 °C. P7 is located 2.5 m above the ground above the heat dissipation equipment, which is the highest temperature measured in the experiment, and the temperature obtained at this point is 41.26 °C. Figure 9 reveals the cases wherein the simulated temperatures obtained by P1–P6 are all below 36.32 °C. The simulated temperature of P7 is between 37.89 °C and 39.47 °C. During the experiment, variations in outdoor temperature, wind speed, and other factors could introduce errors. However, disregarding these errors, the experimental results are generally consistent.

5. The Noise Test

This study adopts the ventilation mode of natural air intake and mechanical air exhaust, which produces significant noise during the operation of the fan. With the increase in the voltage level, the noise and sound power of some fan equipment are increased differently, and the noise problem of electrical equipment is also more serious. The noise propagation range is further, which may cause noise nuisance. In order to solve the problem of significant noise, a layer of 0.2 m eggshell cotton and a layer of 0.15 m silenced rock wool were arranged in the air duct of the ventilation system, and a layer of 0.2 m eggshell cotton was arranged outside the fan. Noise tests were conducted on a test bench equipped with these noise mitigation measures. Four measurement points were established: 0.2 m (height 3.5 m) outside the fan, 1.5 m (height 3.5 m) outside the fan, 5 m (height 1 m) outside the test bench, and 10 m (height 1 m) outside the test bench, as shown in Figure 10.
A field noise test was carried out on the experimental platform, and a GM1357 noise meter was used for the test (Shenzhen, China). The instrument and its performance parameters are shown in Table 6. In the absence of fan operation, the field background noise is 50 dB(A). After the fan is turned on, the noise values measured by the four measuring points on site are shown in Table 7. It can be seen in the table that the noise value at 0.2 m outside the fan is 88 dB; the noise value at 1.5 outside the fan is 78 dB, with both measurements taken at a height of 3.5 m. The noise value of the position 5 m away from the experimental platform is 66 db; the noise value of the position 10 m away from the experimental platform is 62 db. Both were taken at a height of 1 m. These results clearly demonstrate that the amount of noise generated by the fan is significantly high.
SoundPLANnoise 9.0, an international noise prediction and evaluation software, was adopted for the prediction and simulation analysis of fan noise [24,25,26,27]. The geometric acoustic simulation included the ray tracing method and sector method. In general, the sector algorithm is accurate and can cover all the areas around the receiving point, while the ray method ignores the part between the rays. The calculation principle of SoundPLANnoise 9.0 is to use the sector model to calculate the sound field. The height of the noise calculation area was 1.2 m above the ground, and the calculation was conducted within a range of 20 m from the experimental platform. According to the location characteristics of the experimental system, the noise emission of the ventilation system was predicted and analyzed. The resulting noise region diagram, generated based on the defined parameters, is illustrated in Figure 11.
The measured and predicted noise values were compared to validate the accuracy of the tests conducted. The measured and predicted noise values of the four prediction points on site are shown in Table 8.
In comparing the results, it was found that the predicted results fit well with the measured results, and the noise value has little difference from the measured results. The maximum error is 0.3%, which verifies the correctness of the noise value. For substations in residential areas, low-noise fans or mufflers can be preferentially selected.

6. The Simulation Analysis

This section aims to investigate the impact of various factors on the indoor temperature of the whole indoor substation by simulating the indoor environment under different ventilation volumes, heat dissipation rates, and outdoor temperatures. This section aims to investigate the impact of various factors on the indoor temperature of the whole indoor substation by simulating the indoor environment under different ventilation volumes, heat dissipation, and outdoor temperatures and analyze the indoor temperature distribution in winter and extremely high-temperature weather in summer through simulation. Jinhui Tang [28] and Jian Wang et al. [19] also simulated the ventilation and heat dissipation of the substation under different working conditions but with a focus on different ventilation modes, such as altering the position of the tuyere. Tianguang Xu et al. [29] simulated the ventilation and heat dissipation of the substation with different air intake positions and different ventilation volumes, but our subjects were different. We studied the reactor room, and they studied the main transformer room, and they did not explain the heat dissipation capacity. This study employs a sensitivity analysis methodology in its research [30]. When other factors remain unchanged, only one factor is changed for research. When the heat dissipation capacity is the same as the outdoor temperature, the ventilation volume is changed, and the influence of changing the ventilation volume on the indoor temperature is studied. When the ventilation volume is the same as the outdoor temperature, the heat dissipation capacity is changed, and the influence of changing the heat dissipation on the indoor temperature is studied. When the ventilation volume and the heat dissipation capacity are the same, the outdoor temperature is changed, and the influence of the changing outdoor temperature on the indoor temperature is studied.

6.1. Influence of Different Ventilation Volumes on Indoor Temperature

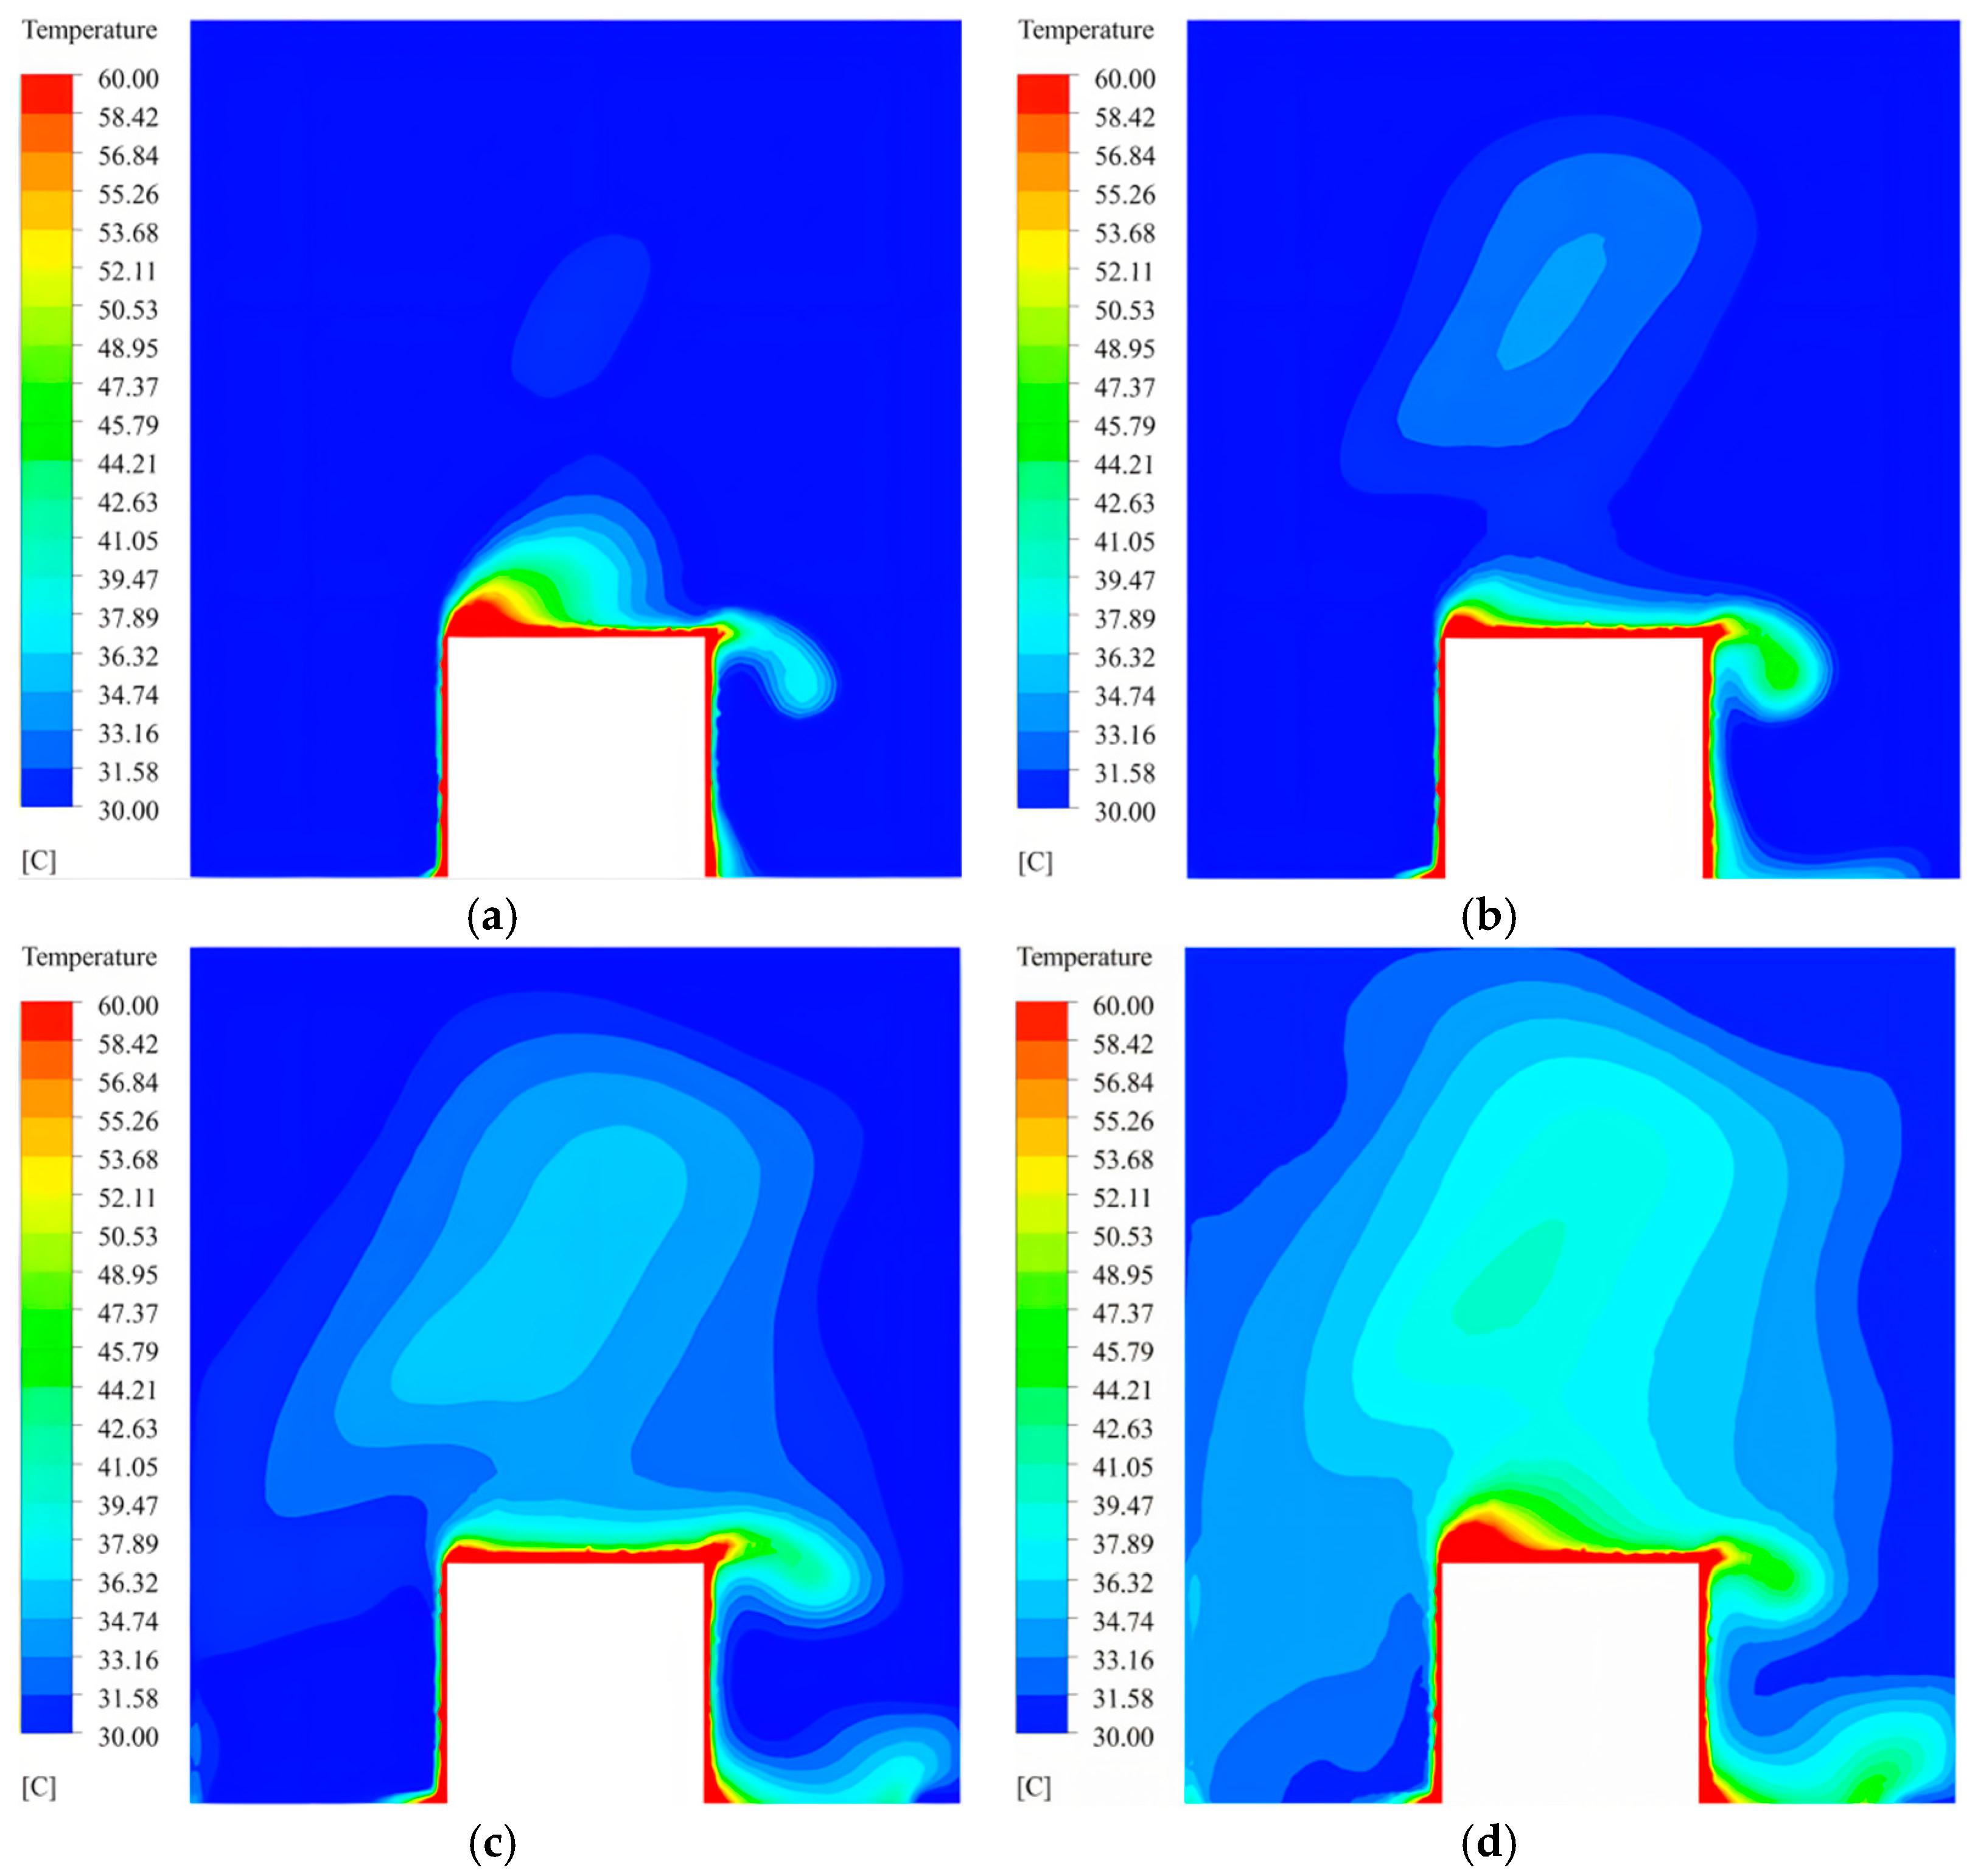
This section mainly analyzes the influence of different ventilation volumes on the indoor temperature of the whole indoor substation. Four distinct working conditions are established in this study, and the influence of changing ventilation volumes on indoor temperature when the outdoor temperature is 27 °C and the heat dissipation capacity is 50 kW is studied. According to Equation (4), when the outdoor temperature is 27 °C and the heat dissipation capacity is 50 kW, the theoretical ventilation volume is 11,897.65 m3/h. Therefore, according to the ratio of 0.6, 0.8, 1, and 1.2, four ventilation volumes were set as 7138.59 m3/h, 9518.12 m3/h, 11,897.65 m3/h, and 14,277.18 m3/h, respectively, for simulation. The cross-section at x = 3 m was used for analysis. Figure 12 shows the indoor temperature distribution at x = 3 m under different ventilation volumes.
As can be seen in the indoor temperature distribution diagram of the whole household substation under the four ventilation volumes in Figure 12, the indoor temperature changes significantly with the change in ventilation volume. In the case of the same heat dissipation capacity and outdoor temperature, the ventilation volume is too small, the tuyere speed is too slow, and the airflow is slow, resulting in the heat emitted by the heat dissipation device not being discharged in time and the heat accumulating above the heat dissipation device. As the ventilation volume increases, the overall indoor temperature decreases, and the extent of the high-temperature areas diminishes. According to Figure 12a,b, there are more indoor high-temperature areas (40 °C) and poor indoor airflow. It can be observed that ventilation volumes of 7138.59 m3/h and 9518.12 m3/h fail to meet the requirements for adequate indoor ventilation and heat dissipation. The indoor temperature in Figure 12c,d is basically within 40 °C, with only a small fraction exceeding 40 °C, which can basically meet the requirements. As can be seen in Figure 12a, the temperature around the heat dissipation equipment is the highest, and the temperature at 3.3 m above the ground above the equipment is higher and exhibits obvious changes. Meanwhile, since the air inlet is located on the left wall of the heat dissipation equipment, the temperature here exhibits obvious changes. Therefore, under different working conditions, the temperature at a height of 2.5 m and 3.3 m above the ground directly above the heat dissipation equipment and 1.4 m above the ground on the left wall of the heat dissipation equipment are plotted in a line chart, where the temperature points are marked as yellow points in Figure 12a. The line chart is shown in Figure 13.
As shown in Figure 13, with the outdoor temperature and heat dissipation capacity remaining constant, the indoor temperature decreases as the ventilation volume increases. The greater the ventilation volume, the lower the indoor temperature, indicating a better ventilation effect. However, with the increase in ventilation volume, the decreasing trend of the indoor temperature becomes slower and slower, indicating that when the ventilation volume reaches a certain value, the influence of the ventilation volume on the indoor temperature decreases. Therefore, in order to achieve the goal of saving energy, it is necessary to choose a reasonable ventilation volume. Compared with Figure 12, the indoor temperature changes between Figure 12a–c are very obvious. In contrast, the indoor temperatures in Figure 12c,d do not exhibit a great change, but the ventilation volume increases by 2379.53 m3/h, which is not conducive to saving energy. Therefore, the optimal ventilation volume is 11,897.65 m3/h when the outdoor temperature is 27 °C and the heat dissipation capacity is 50 kW.

6.2. Influence of Different Heat Dissipation on Indoor Temperature

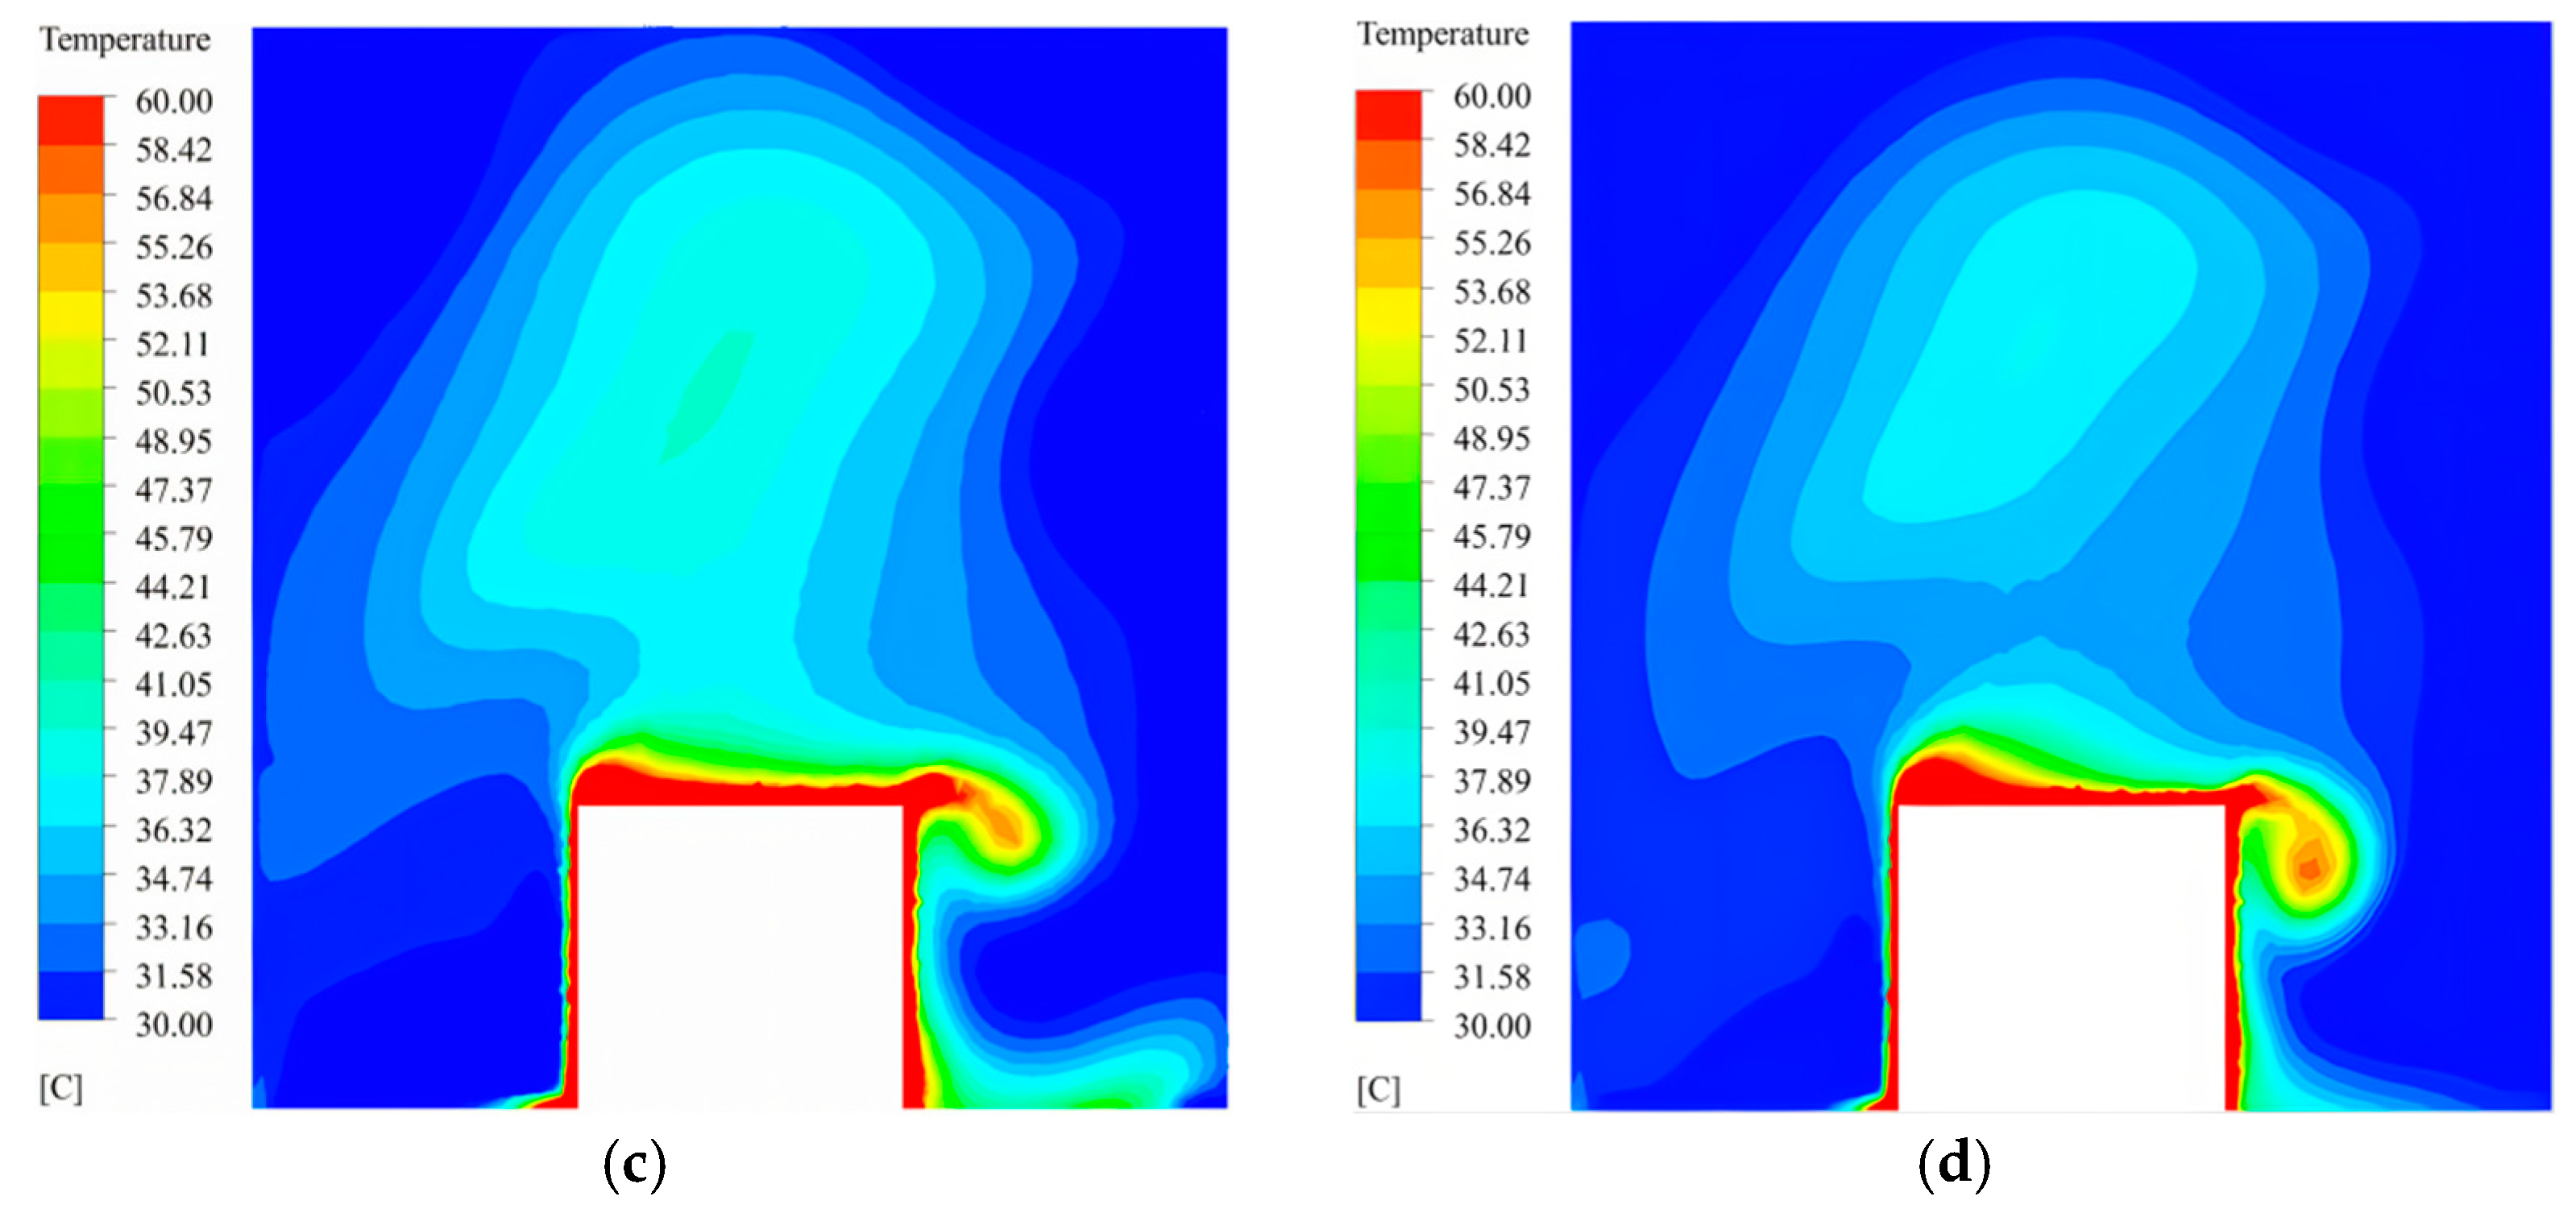
This section mainly analyzes the influence of different heat dissipation capacities on the indoor temperature of the whole indoor substation. In this study, four working conditions were established to simulate the influence of different heat dissipation capacities on the indoor temperature when the outdoor temperature was 27 °C and the ventilation volume was 11,897.65 m3/h. The heat dissipation equipment has a maximum capacity of 50 kW, so the heat dissipation capacity was 20 kW, 30 kW, 40 kW, and 50 kW, respectively, for simulation. The cross-section at x = 3 m was used for analysis. Figure 14 shows the indoor temperature distribution at x = 3 m under different heat dissipation capacities.
Figure 14 shows that as the heat dissipation capacity increases, the indoor temperature rises, and the extent of high-temperature areas expands. When the heat dissipation capacity is 20 kW, the surface temperature of the heat removal equipment and the indoor temperature is below 34.74 °C. When the heat dissipation capacity is 30 kW, a temperature between 34.74 °C and 37.89 °C is observed above the heat dissipation equipment. When the heat dissipation capacity is 40 kW, temperatures between 37.89 °C and 39.47 °C are observed above the heat dissipation equipment, but the range is small. When the heat dissipation capacity is 50 kW, the area of high-temperature regions above the heat dissipation equipment increases significantly, as do the high-temperature areas surrounding the equipment, compared to the previous working conditions of 20 kW, 30 kW, and 40 kW. However, it can be seen that the indoor temperature under these four working conditions is within 40 °C. A comparison of the four working conditions clearly demonstrates that increased heat dissipation capacity leads to greater heat accumulation, resulting in elevated indoor temperatures. As in the previous section, the same three points were used to study the trend of the influence of heat dissipation on the indoor temperature, and the line chart is shown in Figure 15.
As shown in Figure 15, when the ventilation volume and outdoor temperature are kept constant, the indoor temperature increases as the heat dissipation capacity rises. The greater the heat dissipation capacity, the higher the indoor temperature. By comparing the line 2.5 m and 3.3 m above the ground above the heat dissipation equipment and the line 1.4 m above the ground on the left wall of the heat dissipation equipment, it is found that the temperature at 2.5 m and 3.3 m above the ground of the heat dissipation equipment is always higher than that 1.4 m above the left wall. This indicates that, with the same ventilation equipment and ventilation volume, continuous heat dissipation causes heat to accumulate above the heat dissipation equipment and near the exhaust vents. Consequently, the heat is not discharged efficiently, leading to an increase in indoor temperature.

6.3. Influence of Different Outdoor Temperatures on Indoor Temperatures

This section mainly analyzes the influence of different outdoor temperatures on the indoor temperature of the whole indoor substation. According to the ventilation design parameters in Dezhou, the summer ventilation outdoor design temperature is 30.6 °C. When the outdoor temperature is 30.6 °C and the heat dissipation capacity is 50 kW, the theoretical ventilation volume calculated by Equation (4) is 15,799.45 m3/h. Therefore, four working conditions were established for this study. When the heat dissipation capacity is 50 kW and the ventilation volume is 15,799.45 m3/h, the influence of different outdoor temperatures on the indoor temperature was simulated from low to high at 21 °C, 24 °C, 27 °C and 30 °C, respectively. The cross-section at x = 3 m was used for analysis. Figure 16 shows the indoor temperature distribution at x = 3 m under different outdoor temperatures.
As shown in Figure 16, an increase in the outdoor temperature leads to a corresponding rise in the indoor temperature and a decrease in ventilation effectiveness. High-temperature areas are mainly concentrated on the surface of the heat dissipation device and the upper and back of the heat dissipation device (that is, the right side of the heat dissipation device in this analysis). The results show that the system can meet the requirements of ventilation and heat dissipation under different outdoor temperatures and control the indoor temperature within 40 °C. As in the previous section, the same three points were used to study the trend of the influence of heat dissipation on the indoor temperature. A line chart is shown in Figure 17.
As shown in Figure 17, with a constant heat dissipation capacity and ventilation volume, the indoor temperature rises as the outdoor temperature (inlet air temperature) increases. The lower the outdoor temperature, the lower the indoor temperature. With the increase in the outdoor temperature, it can be seen that the indoor temperature rises faster. This suggests that a higher outdoor temperature corresponds to a smaller temperature differential between the inlet air temperature and indoor temperature, a worse ventilation heat transfer effect, and a faster indoor temperature rise. Therefore, the change in the outdoor temperature has a great influence on the indoor temperature, and the smaller the difference between the outdoor temperature and the control temperature (40 °C), the smaller the influence on the indoor temperature.

6.4. Indoor Temperature Distribution Under Extreme Maximum Temperatures in Winter and Summer

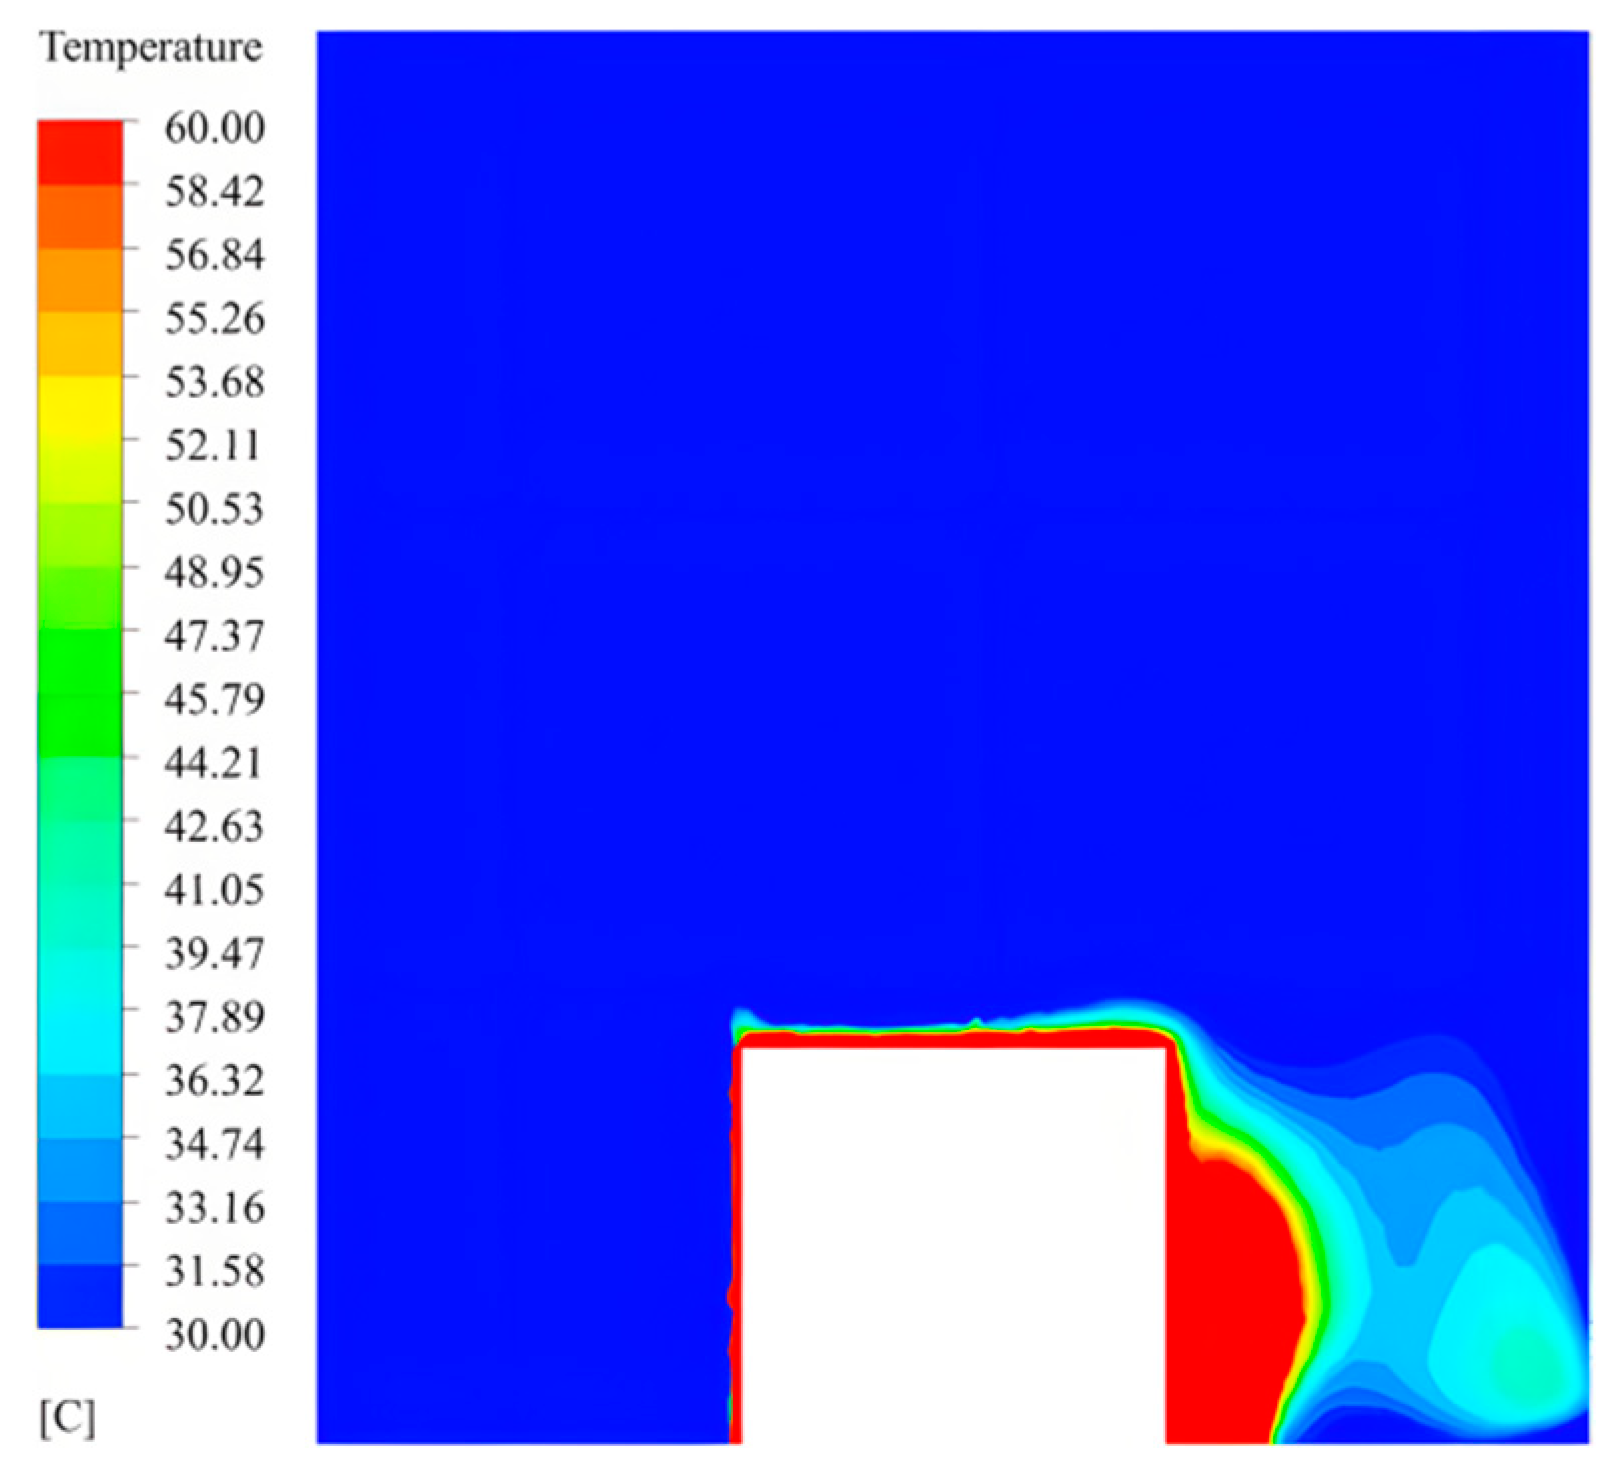
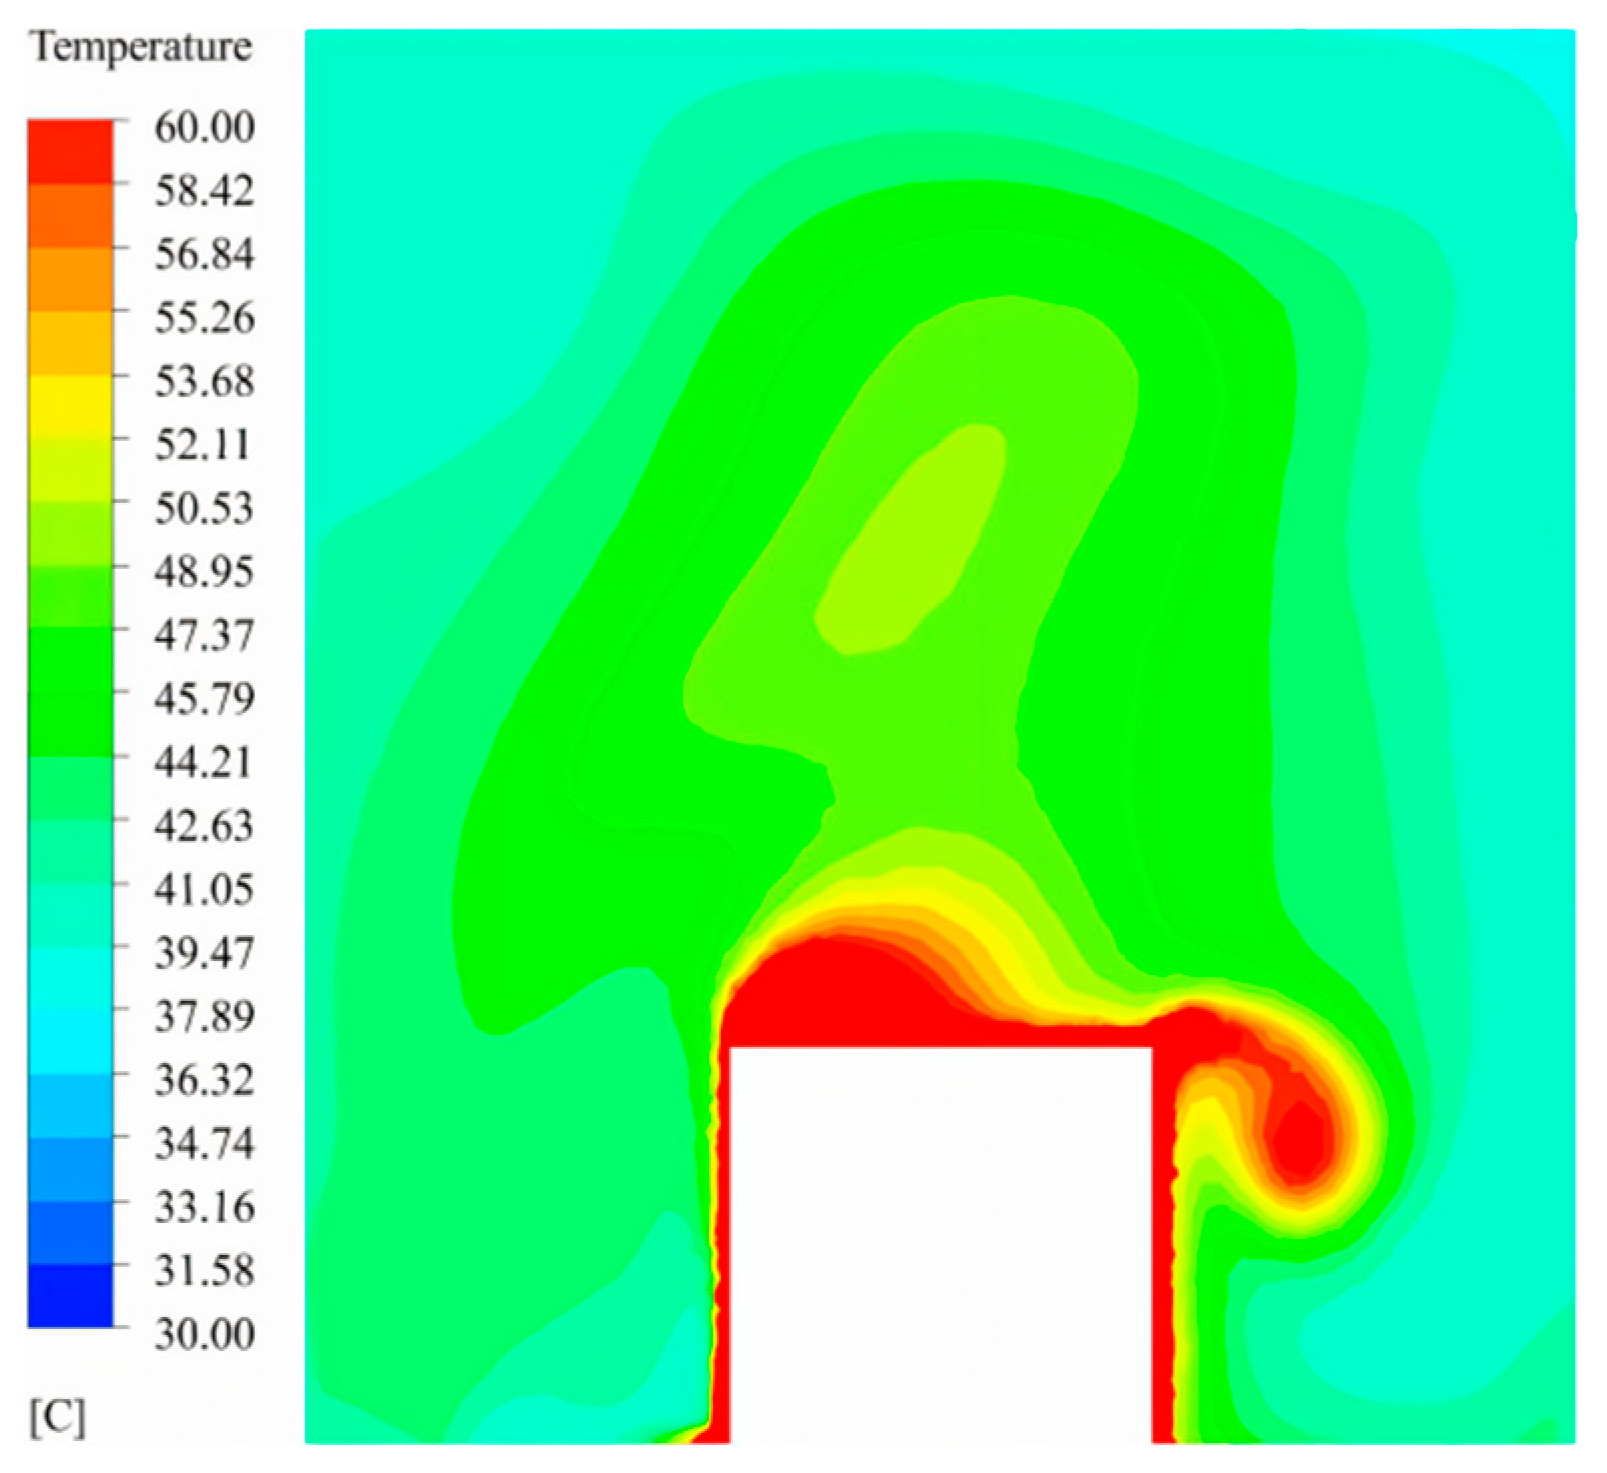
According to the ventilation design parameters of Dezhou City, it can be found that the outdoor calculated temperature in winter is −2.4 °C, and the extreme maximum temperature in summer is 39.4 °C. Because it takes longer to determine temperatures in winter and extreme maximum temperatures in summer to conduct experiments, this study analyzed the indoor temperature distribution of the entire indoor substation under the temperature in winter and the extreme maximum temperature in summer through simulation. In order to observe the distribution of the indoor temperature in the substation under the most unfavorable conditions, the heat dissipation capacity of the heating dissipation equipment was set to 50 kW, and the ventilation amount was calculated using Equation (4) and then simulated. The cross-section at x = 3 m was used for analysis. Figure 18 and Figure 19 show the indoor temperature distribution under the temperature in winter and extreme maximum temperature in summer, respectively.
During the simulation process, it is found that when the outdoor temperature is −2.4 °C, the requirements for ventilation and heat dissipation can be met through natural ventilation alone, so the system can choose the appropriate ventilation mode under different working conditions, saving energy. As can be seen in Figure 18, the temperature of most indoor areas is below 30 °C, and only the back of the heat dissipation device (i.e., the right side of the heat dissipation device in the figure) has a high-temperature area. Because only natural ventilation is performed in this working condition and the air inlet is on the left wall, the wind speed on the left side of the heat dissipation device is larger, and the wind speed on the right side of the heat dissipation device is smaller, so the temperature on the back of the heat dissipation device is higher than that in other areas, but the indoor temperature around the heat dissipation device does not exceed 40 °C.
When the outdoor temperature is 39.4 °C, it is higher than the temperature value when opening mechanical ventilation (35 °C), so natural air inlet mechanical exhaust is directly carried out. Figure 19 shows the indoor temperature distribution diagram after mechanical exhaust using a natural air inlet machine when the outdoor temperature is 39.4 °C. It can be seen in Figure 19 that the indoor temperature ranges from 39.47 °C to 53.68 °C, with most areas below 47.37 °C, and the temperature above the heat dissipation equipment can reach about 53.68 °C. The simulation results show that the indoor temperature can be controlled below 47.37 °C, and the highest temperature is 53.68 °C under extremely high-temperature weather in summer after ventilation and heat dissipation via the ventilation system.

7. Conclusions

This study investigates an indoor substation equipped with a ventilation system. Firstly, the ventilation and heat dissipation problem of the indoor substation were studied using numerical simulation technology, and a ventilation system combining natural ventilation and mechanical ventilation was developed. Secondly, an experimental platform was constructed to test the developed ventilation system, and the noise produced by this platform was both measured and predicted. Finally, the impact of various factors on indoor temperature was analyzed using numerical simulations, leading to the following specific conclusions:
(1)
A hybrid ventilation system combining natural and mechanical ventilation was proposed. When the indoor temperature is below 30 °C, heat dissipation occurs solely through the enclosure structure. When the indoor temperature reaches 35 °C, the natural air inlet mechanical exhaust mode is used.
(2)
The mathematical and physical model of the entire indoor substation’s ventilation system was established, with relevant conditions set for simulation and analysis. The results indicate that the system effectively maintains the indoor temperature within 40 °C.
(3)
An experimental platform of the ventilation system combining natural ventilation and mechanical ventilation was established, and a T35 axial fan with a flow rate of 23,624 m3/h was selected using experimental tests. At the same time, the system was verified in experiments and compared with the simulation results, and the feasibility of the ventilation system was verified in experiments.
(4)
The noise of the experimental platform was studied, and noise reduction measures such as eggshell cotton and silent rock wool were arranged. The noise values of outdoor 5 m and 10 m were 66 dB and 62 dB, respectively, during actual measurement, and the accuracy of the noise values was determined using measurement and prediction.
(5)
The influence of the outdoor temperature, ventilation volume, heat dissipation, and other factors on the indoor temperature of the indoor substation was simulated. The results indicate that when other factors remain unchanged, the lower the outdoor temperature, the larger the ventilation volume, the smaller the heat dissipation capacity, and the lower the indoor temperature. The smaller the difference between the outdoor temperature and indoor temperature, the smaller the influence on the indoor temperature. In addition, energy savings should also be taken into account during ventilation and cooling. According to the simulation results obtained in this study, the calculated ventilation volume is more reasonable.
(6)
The indoor temperature distribution under winter and extreme maximum temperature in summer was obtained via simulation. In winter, only natural ventilation can meet the indoor temperature requirements, so the system can choose the appropriate ventilation mode under different working conditions, thereby saving energy. Under extreme maximum-temperature weather in summer, the ventilation volume calculated at the outdoor temperature of 30.6 °C was simulated. The indoor temperature was basically 47.37 °C, and the highest was 53.68 °C.

Author Contributions

Conceptualization, D.X. and W.Z.; methodology, L.Z.; software, K.W.; validation, D.X., L.Z. and H.W.; formal analysis, L.Z.; investigation, D.X.; resources, H.W.; data curation, K.W.; writing—original draft preparation, D.X.; writing—review and editing, L.Z.; visualization, H.W.; supervision, K.W.; project administration, W.Z.; funding acquisition, D.X. All authors have read and agreed to the published version of the manuscript.

Funding

This research received no external funding.

Data Availability Statement

All the data presented in this study are available upon request from the corresponding author due to the uniqueness of the research work. The research data indicate a valuable result; we are willing to share the data with researchers who need them.

Conflicts of Interest

Authors Dakun Xu, Lei Zhang and Hao Wang were employed by the company Shandong Electric Power Engineering Consulting Institute Corp., Ltd. The remaining authors declare that the research was conducted in the absence of any commercial or financial relationships that could be construed as a potential conflict of interest.

Nomenclature

ttime of gas flow throughout the house (s)
u, v, wthe velocity component of the fluid in the x, y, and z directions (m/s)
ρindoor gas density (g/m3)
τ i j the stress component of the fluid at (i, j) (Pa)
pfluid pressure (N)
S x , S y , S z the volume force of a microelement (°C)
Tindoor gas temperature (°C)
Kheat transfer coefficient (W/(m2·K))
S i newly defines a source term associated with a user-defined volume heat
Lamount of ventilation required for heat removal (m3/h)
Qthe reactor dissipates heat (W)
cspecific heat capacity of air (KJ/(kg·℃))
ρav average   density   of   inlet   and   exhaust   air ( kg/m3)
tin, texinlet and exhaust air temperature (°C)
Lair volume of tuyere (m3/h)
vtuyere velocity (m/s)
Ftuyere area (m2)
Greek
ρdensity (kg/m3)
τtime (s)
Subscripts
x, y, zserial number along the rectangular coordinate system
i, jthe serial number of the node along radial and vertical directions
avaverage
in, exinlet air, exhaust air

References

  1. Ding, B.; Liu, J.; Jia, Y. Research and simulation on building energy use of indoor substation. Build. Energy Effic. 2021, 49, 85–90. [Google Scholar] [CrossRef]
  2. Cheng, Z. A Brief discussion on building energy saving and noise reduction design of urban all-household substation. Low Carbon World 2016, 10, 35–36. [Google Scholar] [CrossRef]
  3. Xu, H. Thoughts on heat dissipation and ventilation of main transformer room in indoor substation. Sci. Technol. Wind. 2011, 12, 197. [Google Scholar] [CrossRef]
  4. Zhang, F.; Huang, X.; Ding, J. Numerical Simulation and Optimization Analysis of Ventilation Heat Transfer in Indoor Substation. Fluid Mach. 2016, 44, 76–80. [Google Scholar] [CrossRef]
  5. Zhang, R. Architectural Design Research of Urban Indoor Substation. Master’s Thesis, Beijing University of Civil Engineering and Architecture, Beijing, China, 2017. CNKI:CDMD:2.1018.041811. [Google Scholar]
  6. Zhang, H.; Wang, L. Optimizing air inlet design for enhanced natural ventilation in indoor substations: A numerical and CFD simulation study. Case Stud. Therm. Eng. 2024, 59, 104408. [Google Scholar] [CrossRef]
  7. Mo, W.; Zeng, W. Analysis and Countermeasures of Ventilation and Heat dissipation of indoor substation Main transformer. Guangdong Power Transm. Transform. Technol. 2004, 5, 27–31. [Google Scholar] [CrossRef]
  8. Hong, W.; Jia, L. Improvement of ventilation design of 110kV whole-household urban substation. J. Distrib. Util. 2009, 26, 46–48. [Google Scholar] [CrossRef]
  9. Chen, C. Research on improvement of ventilation noise reduction technology in old indoor substation. Environ. Sci. Technol. 2022, 28, 44–49. [Google Scholar] [CrossRef]
  10. Dong, Q.; Wei, Y.; Guo, L. Noise control analysis of 330kV/110kV co-built indoor substation. Sichuan Environ. 2022, 9, 206–211. [Google Scholar] [CrossRef]
  11. Gao, X.; Li, W.; Song, H.; Zhang, S. Influence of Air Inlet on Ventilation effect of transformer chamber. Civ. Archit. Environ. Eng. 2012, 34, 117–122. [Google Scholar]
  12. Xing, H. Numerical Simulation of Ventilation and Heat Transfer in Indoor Substation and Its Countermeasures. Master’s Thesis, Chongqing University of Technology, Chongqing, China, 2013. [Google Scholar] [CrossRef]
  13. Qin, W.; Huang, Y.; Xia, Z. Measurement and simulation of ventilation and cooling in main transformer room of 110 kV indoor substation. Energy Res. Util. 2018, 1, 31–34. [Google Scholar] [CrossRef]
  14. Jin, J.; Wei, L.; Po, H.; Guo, Z.; Wen, B.; Jiang, N. Simulation and Optimization of ventilation and noise reduction in indoor substation. J. Wuhan Univ. 2015, 48, 495–501. (In Chinese) [Google Scholar] [CrossRef]
  15. Mohamad, K.; Khaled, C. CFD study of ventilation for indoor multi-zone transformer substation. Int. J. Heat Technol. 2018, 36, 88–94. [Google Scholar] [CrossRef]
  16. Saipul, A.F.B.; Hasril, H. Flow and Heat Dissipation Analysis in Transformer Substation with Minimal Ventilation using CFD. Int. J. Eng. Technol. 2018, 7, 327–332. [Google Scholar] [CrossRef]
  17. Hasini, H.; Shuaib, N.H.; Yogendran, S.B.; Toh, K.B. Flow and heat distribution analysis of different transformer sub-stations. In Proceedings of the 2nd International Conference on Mechanical Engineering Research (ICMER 2013), Kuantan, Malaysia, 1–4 July 2013. IOP Conference Series: Materials Science and Engineering. [Google Scholar] [CrossRef]
  18. Wu, J. Study on the Influence of Building Openings on Indoor Natural Ventilation in Office Buildings. Master’s Thesis, Nanjing Normal University, Nanjing, China, 2014. [Google Scholar] [CrossRef]
  19. Wang, J.; Zhang, F.; Xing, H. Indoor substation based on CFD ventilation heat transfer numerical simulation and optimization design. J. Mech. Des. Manuf. 2016, 3, 45–47. [Google Scholar] [CrossRef]
  20. Han, Z.; Wang, J.; Lan, X. Fluent: Examples and Applications of Fluid Engineering Simulation; Beijing Institute of Technology Press: Beijing, China, 2004. [Google Scholar]
  21. GB50736-2012; Code for Design of Heating, Ventilation and Air Conditioning for Civil Buildings. National Standards of the People’s Republic of China: Shenzhen, China, 2012.
  22. Qin, W. Numerical Simulation and Optimization of Ventilation and Heat Dissipation in 110 kV Indoor Substation. Master’s Thesis, Southeast University, Nanjing, China, 2019. [Google Scholar] [CrossRef]
  23. GB 50229-2019; Design Manual for Heating, Ventilation and Air Conditioning in Thermal Power Plants and Substations. National Standards of the People’s Republic of China: Shenzhen, China, 2019.
  24. Cui, X.; Xie, L.; Li, L. Substation noise prediction based on SoundPLAN. Shandong Electr. Power Technol. 2022, 49, 64–69. [Google Scholar] [CrossRef]
  25. Xie, D.; Yang, Z.; Zeng, X. The wind farm based on SoundPLAN noise simulation analysis and optimization. J. Audio. Technol. 2023, 47, 32–34. [Google Scholar] [CrossRef]
  26. Liu, J. Discussion on the application of SoundPLAN in a substation noise influence and its control measures. Environ. Dev. 2018, 30, 113. [Google Scholar] [CrossRef]
  27. Liao, Q. Research on Noise Characteristics and Control Measures of UHV Substation. Master’s Thesis, Lanzhou Jiaotong University, Lanzhou, China, 2016. [Google Scholar] [CrossRef]
  28. Tang, J.; Wu, F.; Zhi, Y. Optimization design of ventilation noise reduction in Indoor Substation based on deep reinforcement Learning. Power China 2023, 56, 96–105. [Google Scholar] [CrossRef]
  29. Xu, T.; Wang, Y.; Zhang, Y. Numerical Simulation and Optimization of Air Intake in transformer room of a Substation. Electr. Power Sci. Eng. 2019, 35, 37–43. [Google Scholar] [CrossRef]
  30. Yuan, L.; Yu, J.; Kang, Y. Sensitivity analysis of thermal insulation performance of external walls and Windows in indoor thermal environment of natural ventilation buildings. J. Donghua Univ. 2019, 46, 128–133. [Google Scholar] [CrossRef]
Figure 1. The physical model of an indoor substation with ventilation system.
Buildings 14 03749 g001
Figure 2. The grid division diagram.
Buildings 14 03749 g002
Figure 3. The grid independence analysis.
Buildings 14 03749 g003
Figure 4. The indoor temperature and the wind velocity distribution at x = 1.3 m cross-section in summer. (a) The temperature profile; (b) the wind velocity profile.
Buildings 14 03749 g004
Figure 5. The indoor temperature and the wind velocity distribution at x = 3 m cross-section in summer. (a) The temperature profile; (b) the wind velocity profile.
Buildings 14 03749 g005
Figure 6. The measuring point position mark map.
Buildings 14 03749 g006
Figure 7. The photos of the experimental platform. (a) Outdoor view; (b) fan view; (c) indoor view.
Buildings 14 03749 g007
Figure 8. Test result diagram of manual control. (a) The heat dissipation capacity is 20 kW. (b) The heat dissipation capacity is 30 kW. (c) The heat dissipation capacity is 40 kW. (d) The heat dissipation capacity is 50 kW.
Buildings 14 03749 g008
Figure 9. Indoor temperature distribution in working condition 16. (a) Where z = 2.25 m; (b) where x = 3 m.
Buildings 14 03749 g009
Figure 10. The location of the noise test.
Buildings 14 03749 g010
Figure 11. Noise area (1.2 m height).
Buildings 14 03749 g011
Figure 12. Indoor temperature distribution at x = 3 m cross-section under different ventilation volumes. (a) Ventilation volume of 7138.59 m3/h. (b) Ventilation of 9518.12 m3/h. (c) Ventilation volume of 11,897.65 m3/h. (d) Ventilation of 14,277.18 m3/h.
Buildings 14 03749 g012aBuildings 14 03749 g012b
Figure 13. Trend of influence of ventilation volume on indoor temperature.
Buildings 14 03749 g013
Figure 14. Indoor temperature distribution at x = 3 m under different heat dissipation capacities. (a) 20 kW; (b) 30 kW; (c) 40 kW; (d) 50 kW.
Buildings 14 03749 g014
Figure 15. Trend of influence of heat dissipation on indoor temperature.
Buildings 14 03749 g015
Figure 16. Indoor temperature distribution at x = 3 m cross-section under different outdoor temperatures. (a) The outdoor temperature is 21 °C. (b) The outdoor temperature is 24 °C. (c) The outdoor temperature is 27 °C. (d) The outdoor temperature is 30 °C.
Buildings 14 03749 g016
Figure 17. Variation of indoor temperature with outdoor temperature.
Buildings 14 03749 g017
Figure 18. Indoor temperature distribution at x = 3 m cross-section in winter.
Buildings 14 03749 g018
Figure 19. Indoor temperature distribution at x = 3 m cross-section under extreme maximum temperatures in summer.
Buildings 14 03749 g019
Table 1. Research conditions and ventilation calculation table.
Working ConditionHeat Dissipation Capacity (kW)Inlet Air Temperature (°C)Ventilation Volume (m3/h)
120213222.87
220243846.84
320274759.06
420316909.88
530214834.31
630245770.26
730277138.59
8303110,364.82
940216445.74
1040247693.67
1140279518.12
12403113,819.75
1350218057.18
1450249617.09
15502711,897.65
16503117,274.69
Table 2. Performance parameters of AS8336 anemometer.
Physical DrawingItemArgument
Buildings 14 03749 i001Measuring range0.3~45 m/s
Measuring accuracy±3% ± 0.1 dgt
resolution0.1 m/s
Temperature measurement range0~45 °C
Temperature measurement error±2 °C
Table 3. Measurement value of wind speed and result table of ventilation volume.
MeasurementAir Inlet 1 Wind Speed (m/s)Air Inlet 2 Wind Speed (m/s)Air Inlet 3 Wind Speed (m/s)Fan Inlet Wind Speed (m/s)
12.82.52.95.3
21.21.21.75.4
31.61.41.44.2
42.82.01.58.9
51.21.52.16.6
60.81.20.35.4
711.31.98.3
80.61.51.26.0
900.504.2
Air supply volume: 13,716 m3/hExhaust air volume: 13,352 m3/h
Table 4. Measurement of wind speed and ventilation volume of the new fan.
MeasurementAir Inlet 1 Wind Speed (m/s)Air Inlet 2 Wind Speed (m/s)Air Inlet 3 Wind Speed (m/s)Fan Inlet Wind Speed (m/s)
12.32.22.06.5
22.01.81.96.8
32.12.01.87.2
42.22.11.510
52.11.91.78.5
61.91.61.88.8
72.02.01.07.1
81.71.81.97.4
91.11.01.17.5
Air supply volume: 17,460 m3/hExhaust air volume: 17,150 m3/h
Table 5. Indoor temperature under test of condition 16.
Working Conditiont1/°Ct2/°Ct3/°Ct4/°Ct5/°Ct6/°Ct7/°CMean Temperature (°C)
1636.9634.7435.7634.9836.7636.9141.2636.78
Table 6. Performance parameters of GM1357 noise meter.
Physical DrawingItemArgument
Buildings 14 03749 i002Measurement range30~130 dB
Accuracy±1.5 dB
Digit and resolution5 digits, 0.1 dB
Frequency response31.5 Hz~8.5 KHz
Frequency weighting characteristicsA (simulated human ear) and C (mechanical noise)
Table 7. Noise values of measuring points.
Station NumberStation PositionActual dB(A)
Measuring Point 1Outside, 0.2 m (height of 3.5 m)88
Measuring Point 2Outside, 1.5 m (height of 3.5 m)78
Measuring Point 3Experimental platform outside, 5 m (height of 1 m)66
Measuring Point 4Experimental platform outside, 10 m (height of 1 m)62
Table 8. Comparison table of measured and predicted noise values at predicted points.
Station NumberStation PositionMeasured Noise dB(A)Predicted Noise Value dB(A)Deviation
Measuring Point 1Outside, 0.2 m (height of 3.5 m)8887.9−0.1%
Measuring Point 2Outside, 1.5 m (height of 3.5 m)7878.00.0%
Measuring Point 3Experimental platform outside, 5 m (height of 1 m)6666.20.3%
Measuring Point 4Experimental platform outside, 10 m (height of 1 m)6261.9−0.2%
Disclaimer/Publisher’s Note: The statements, opinions and data contained in all publications are solely those of the individual author(s) and contributor(s) and not of MDPI and/or the editor(s). MDPI and/or the editor(s) disclaim responsibility for any injury to people or property resulting from any ideas, methods, instructions or products referred to in the content.