
Field Measurement and Numerical Simulation of Sound Insulation Characteristics of Buildings Along Elevated Urban Rail Lines

Abstract
1. Introduction
1.1. Sources and Characteristics of Noise from Elevated Urban Rail Lines
1.2. Research Progress on Sound Insulation of Buildings
1.3. Structure of This Paper
2. Field Measurement
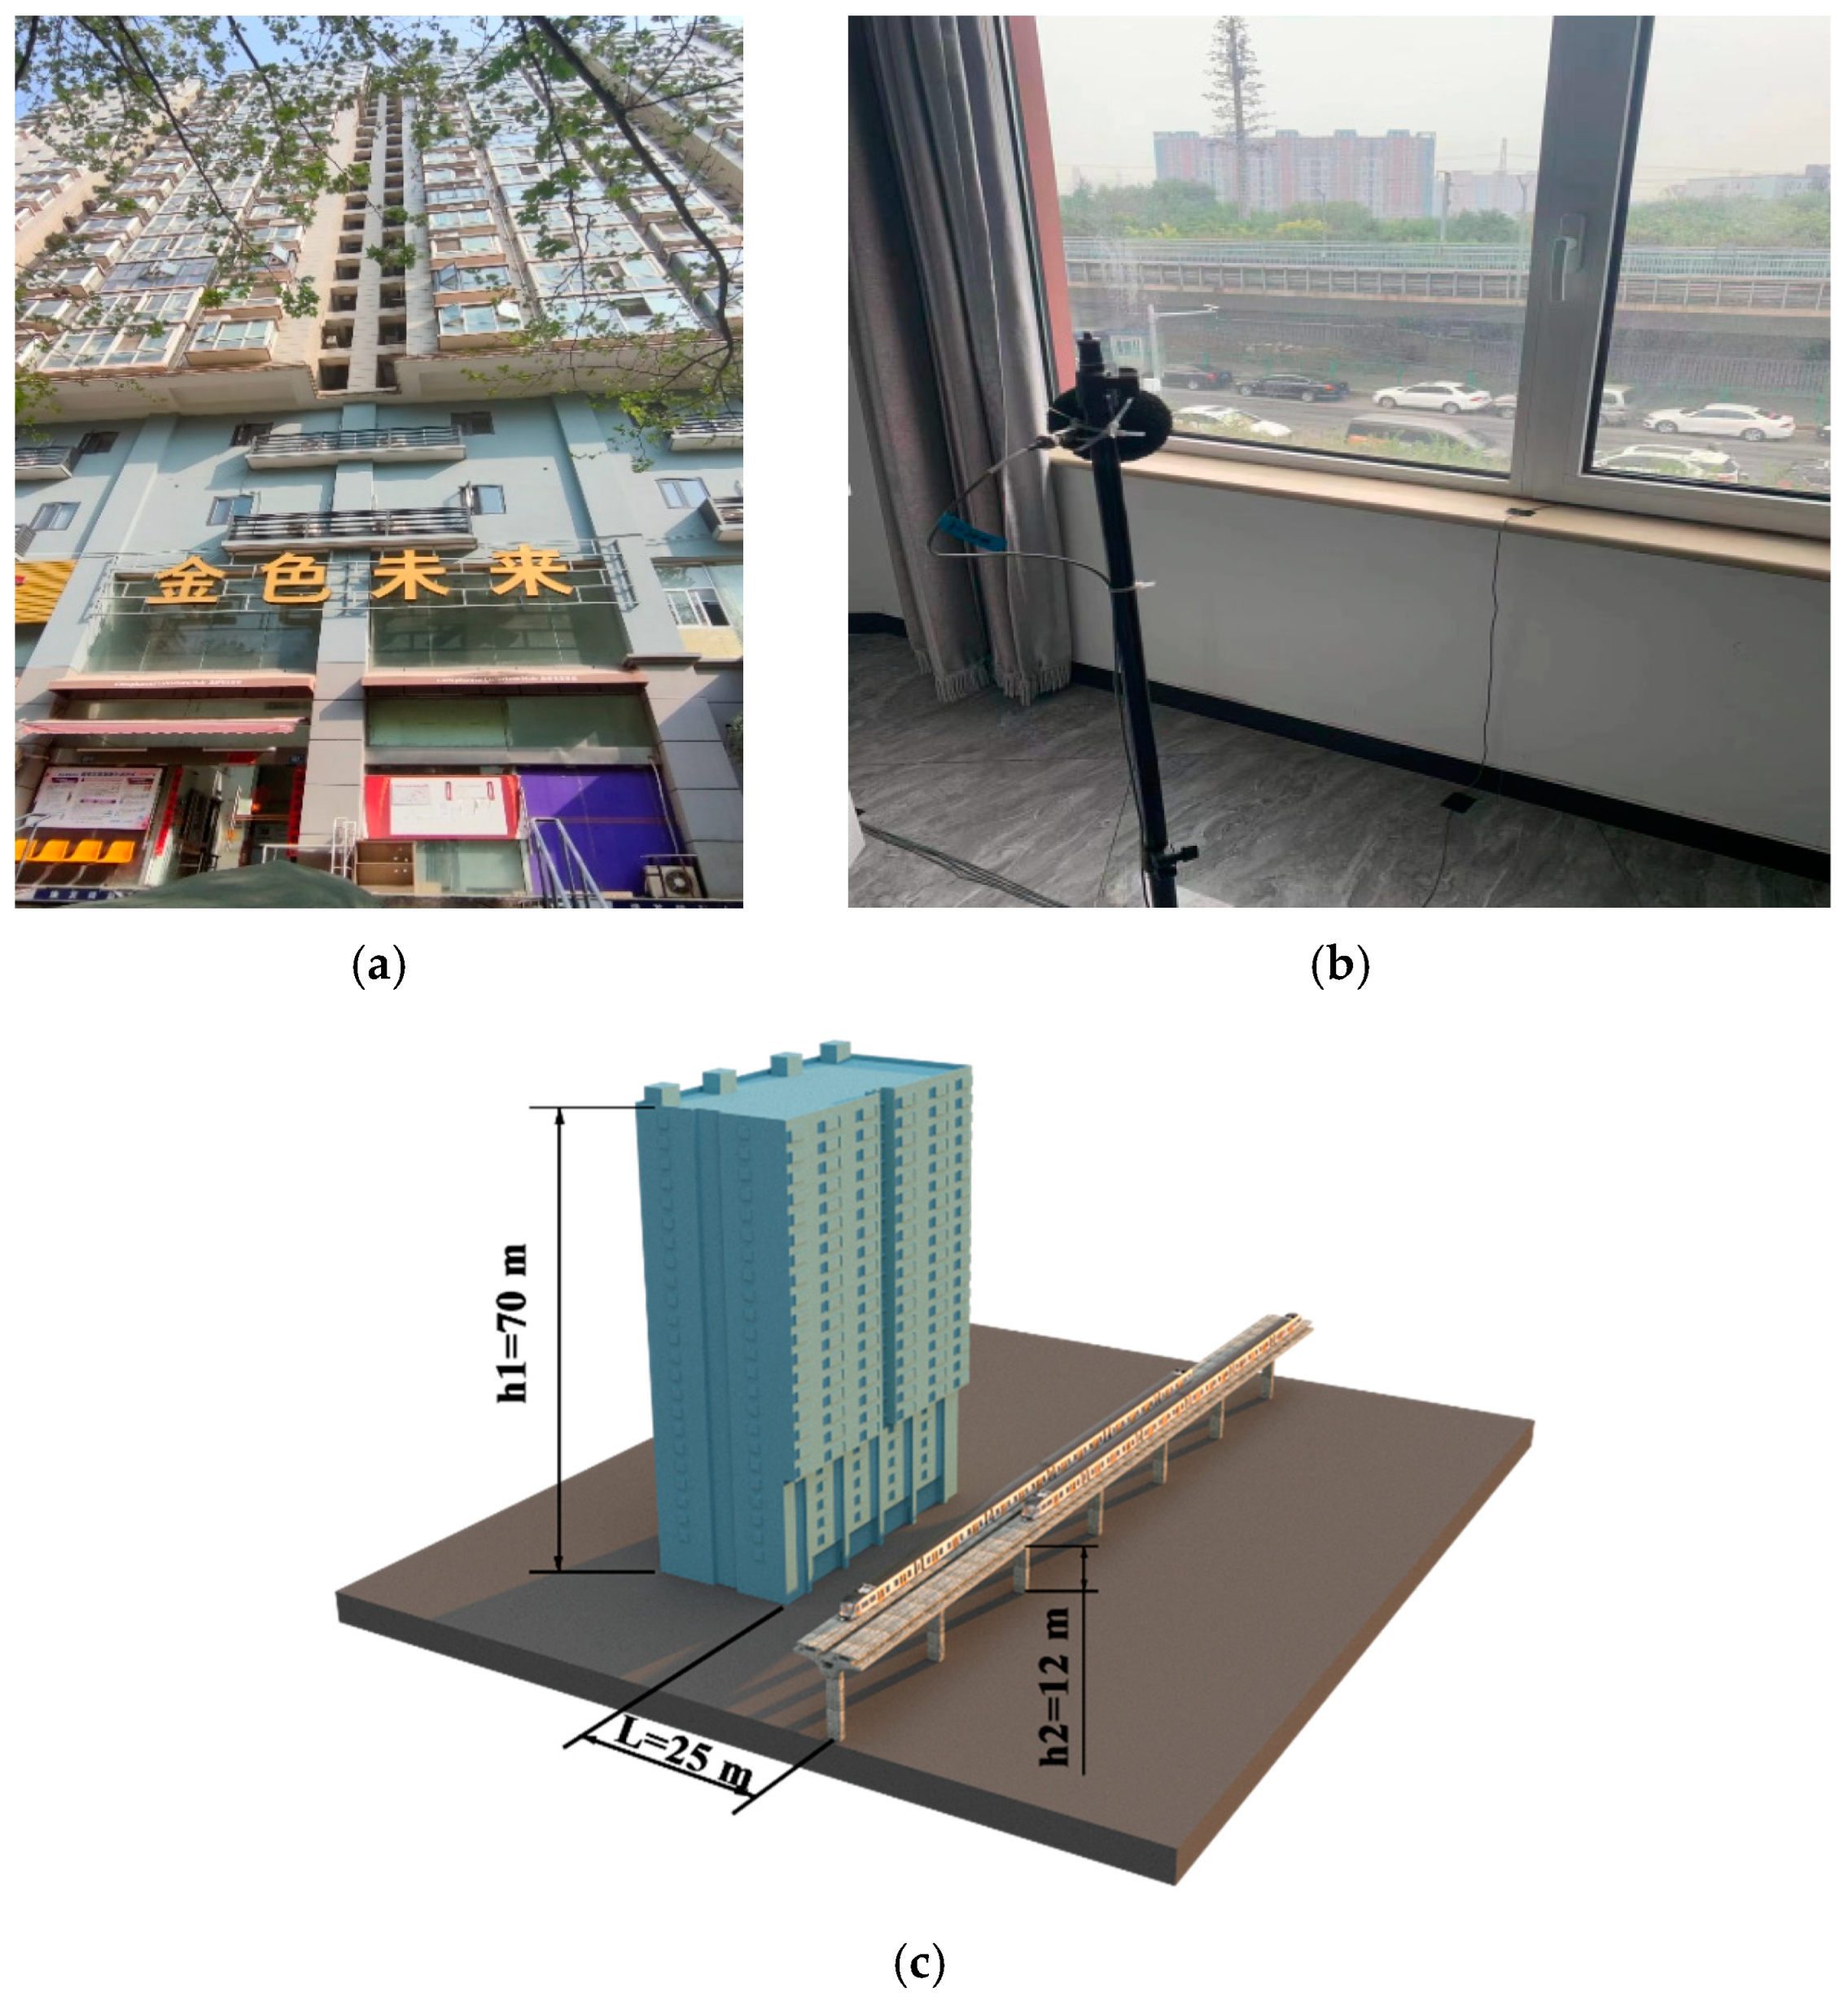
2.1. Description of Test Site
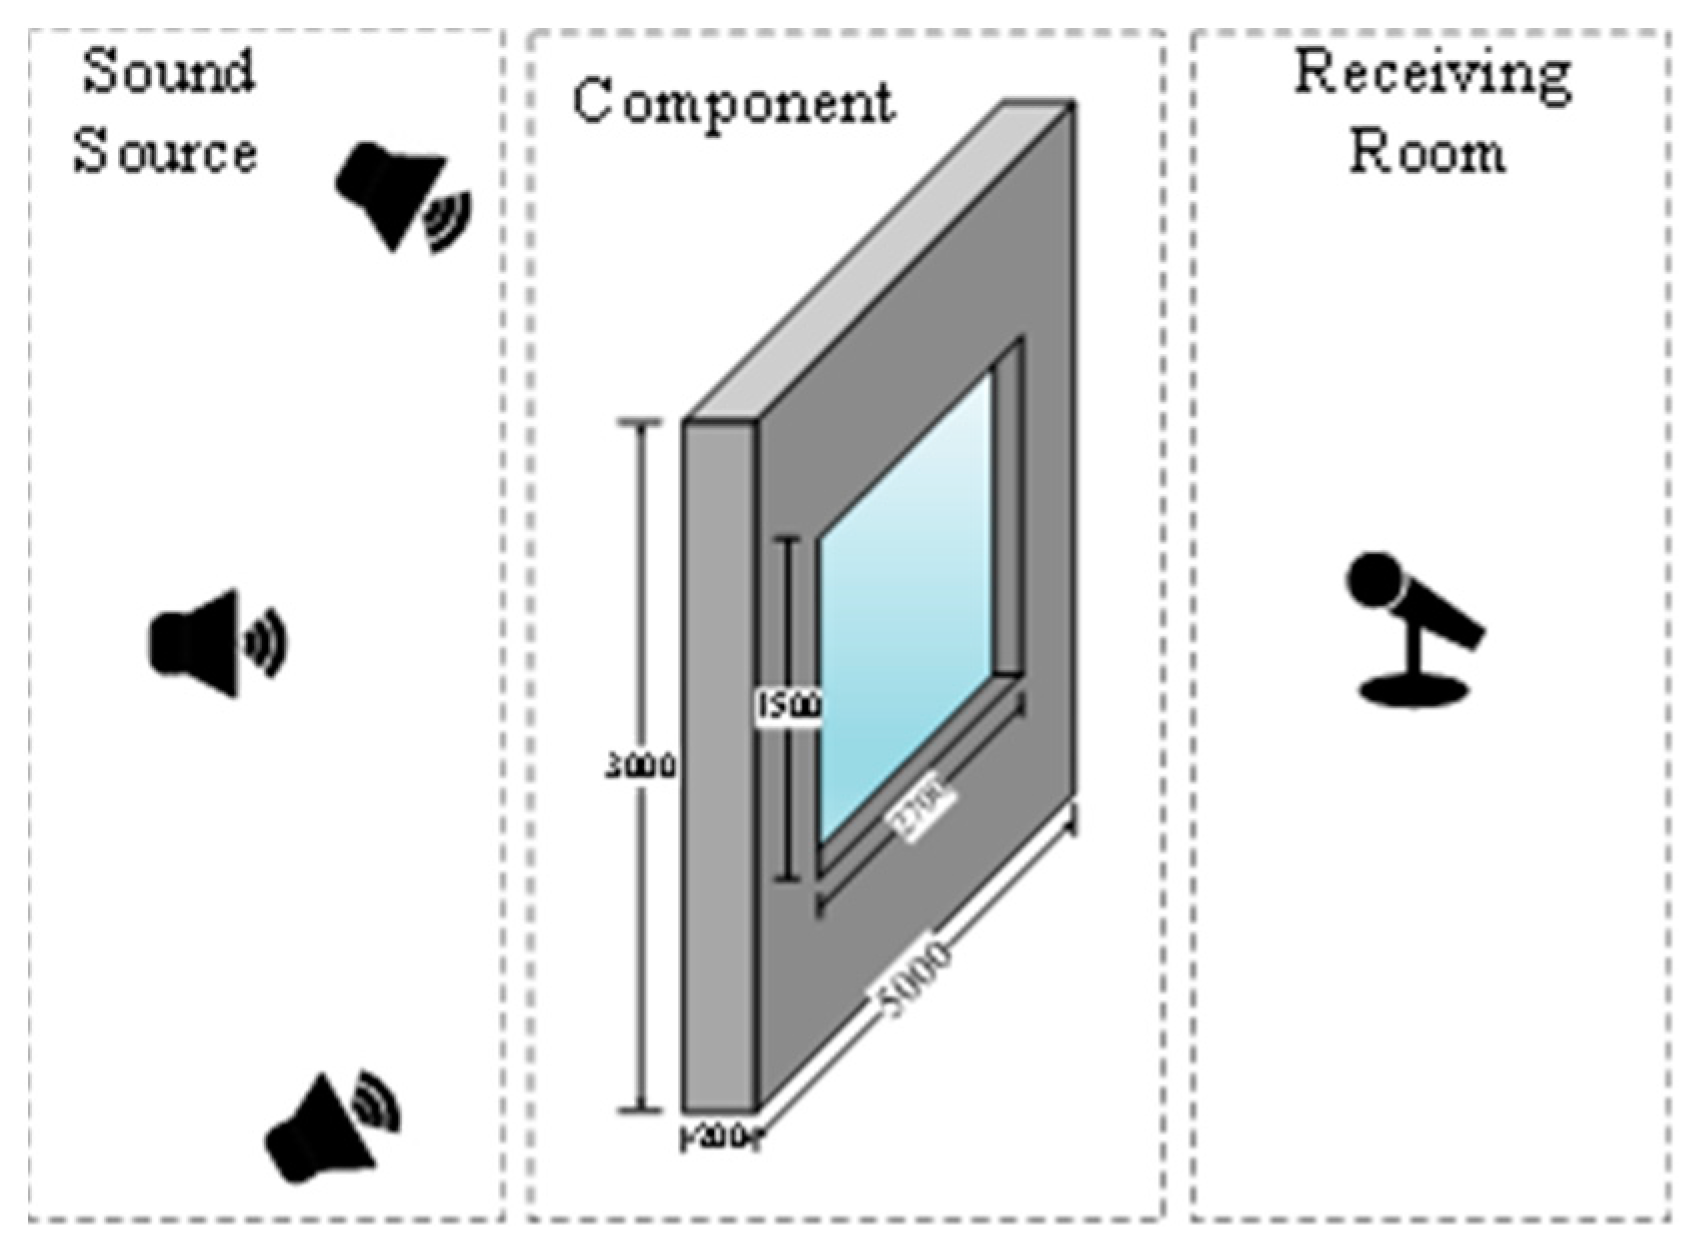
2.2. Test Setup
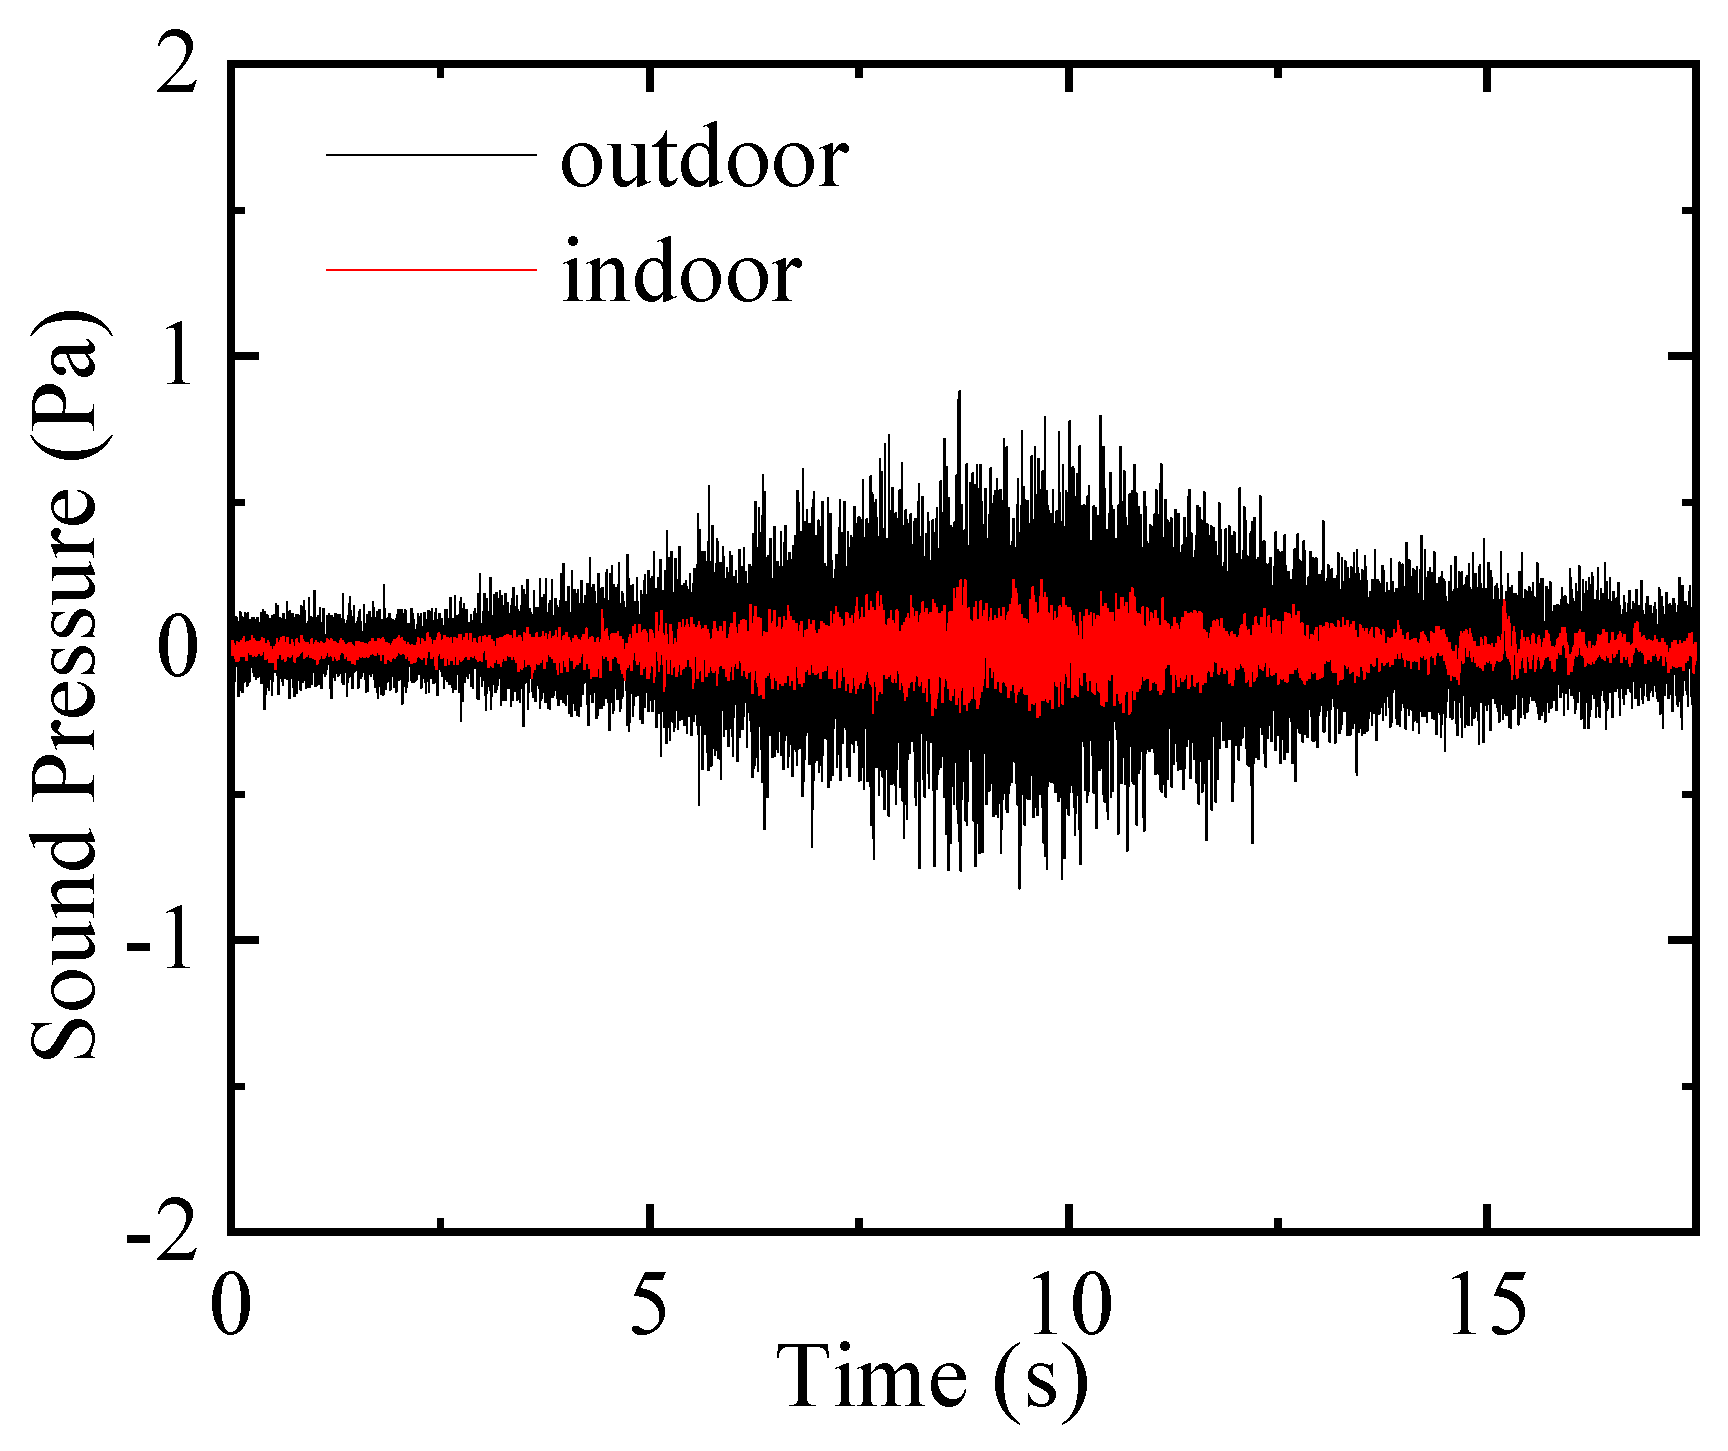
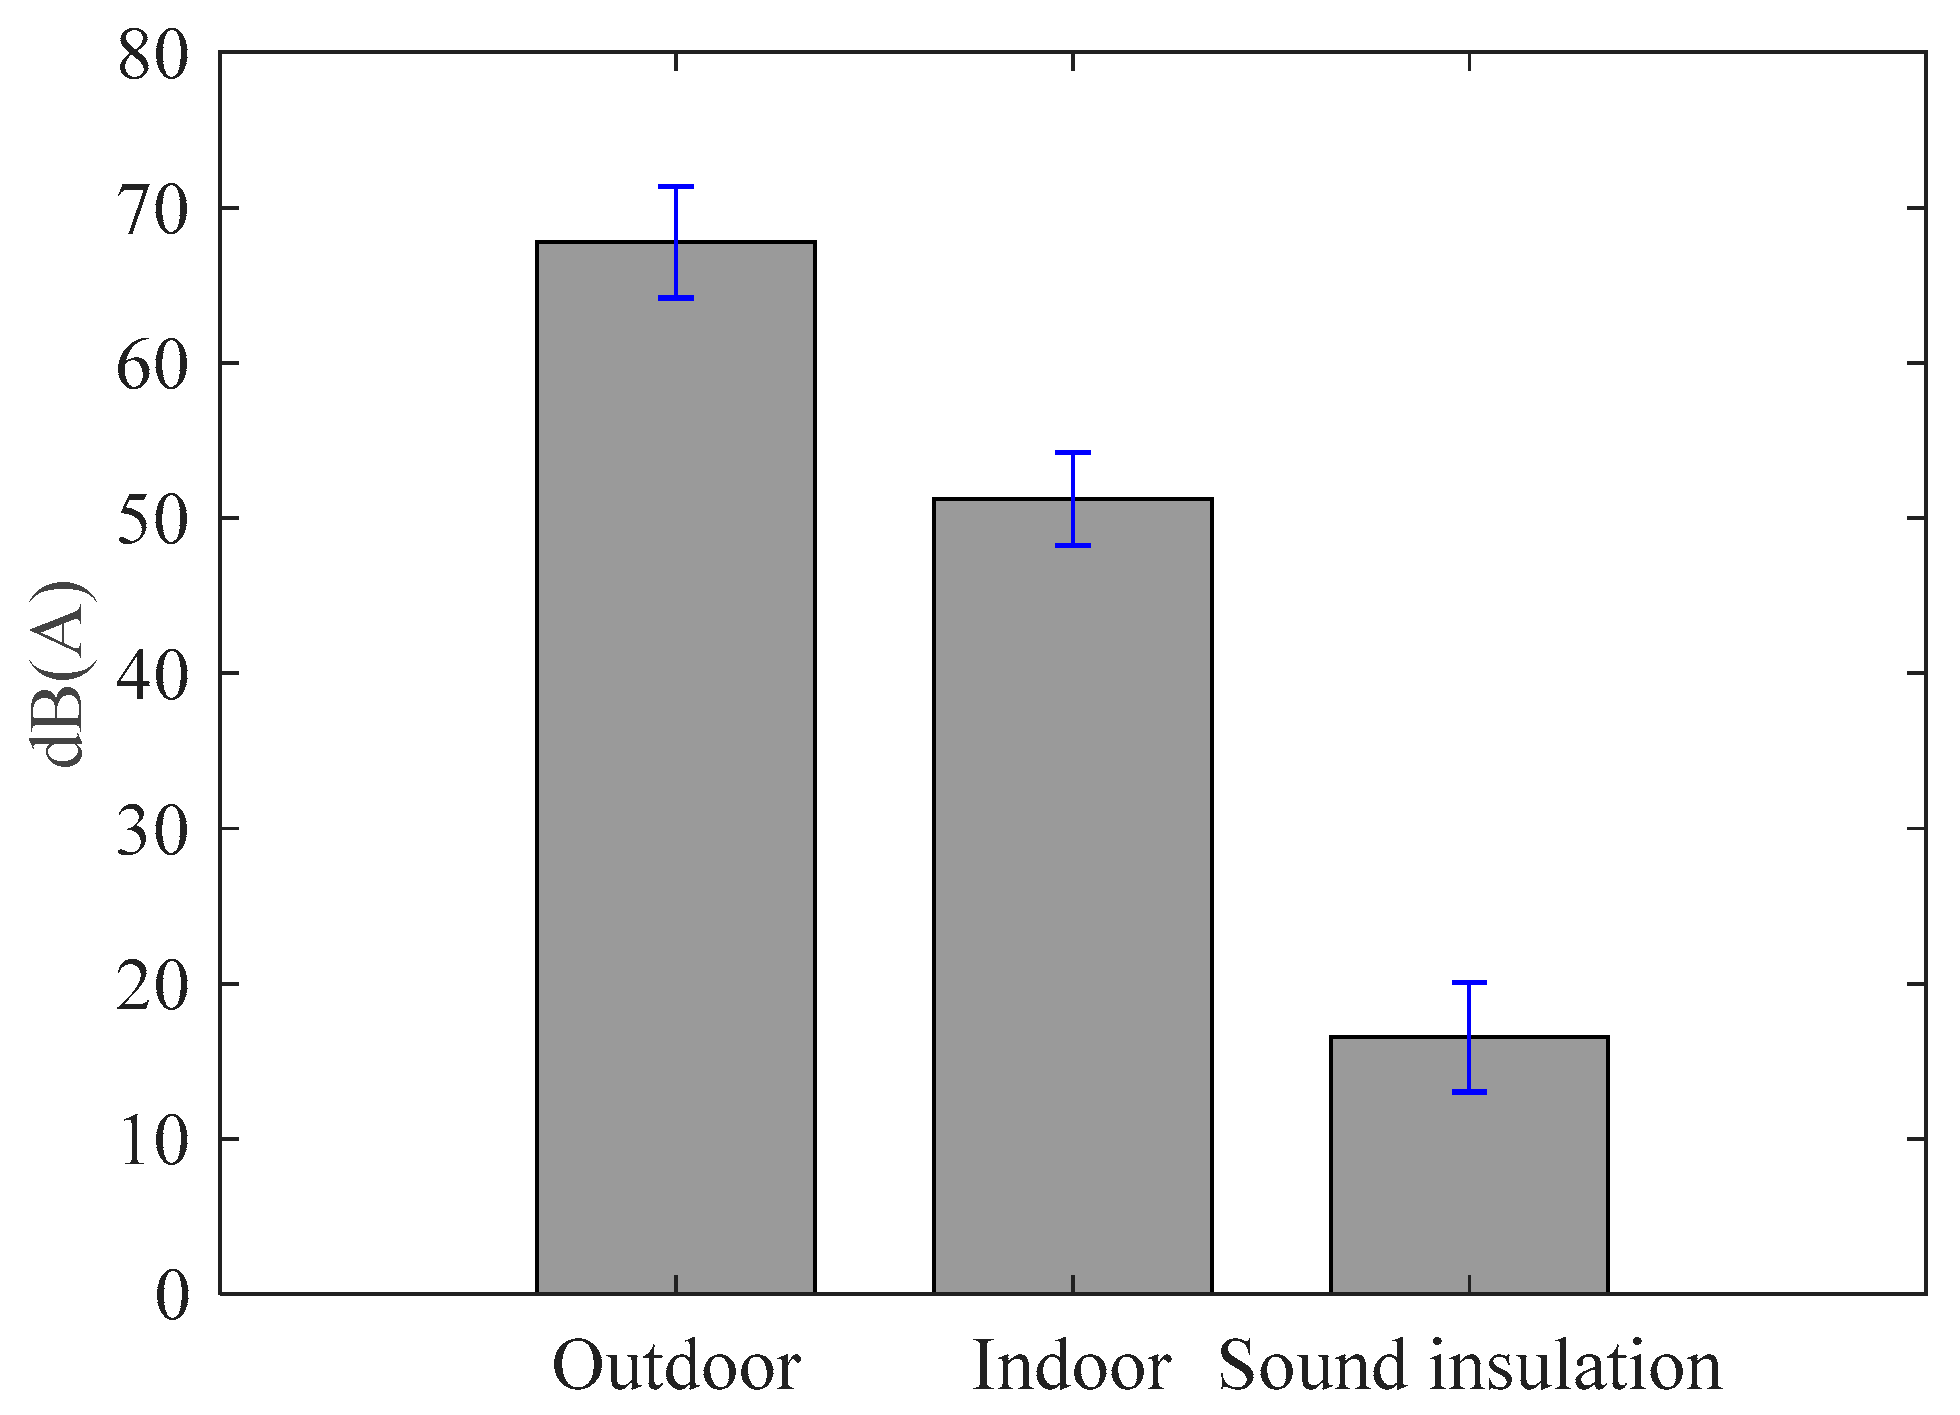
2.3. Test Results
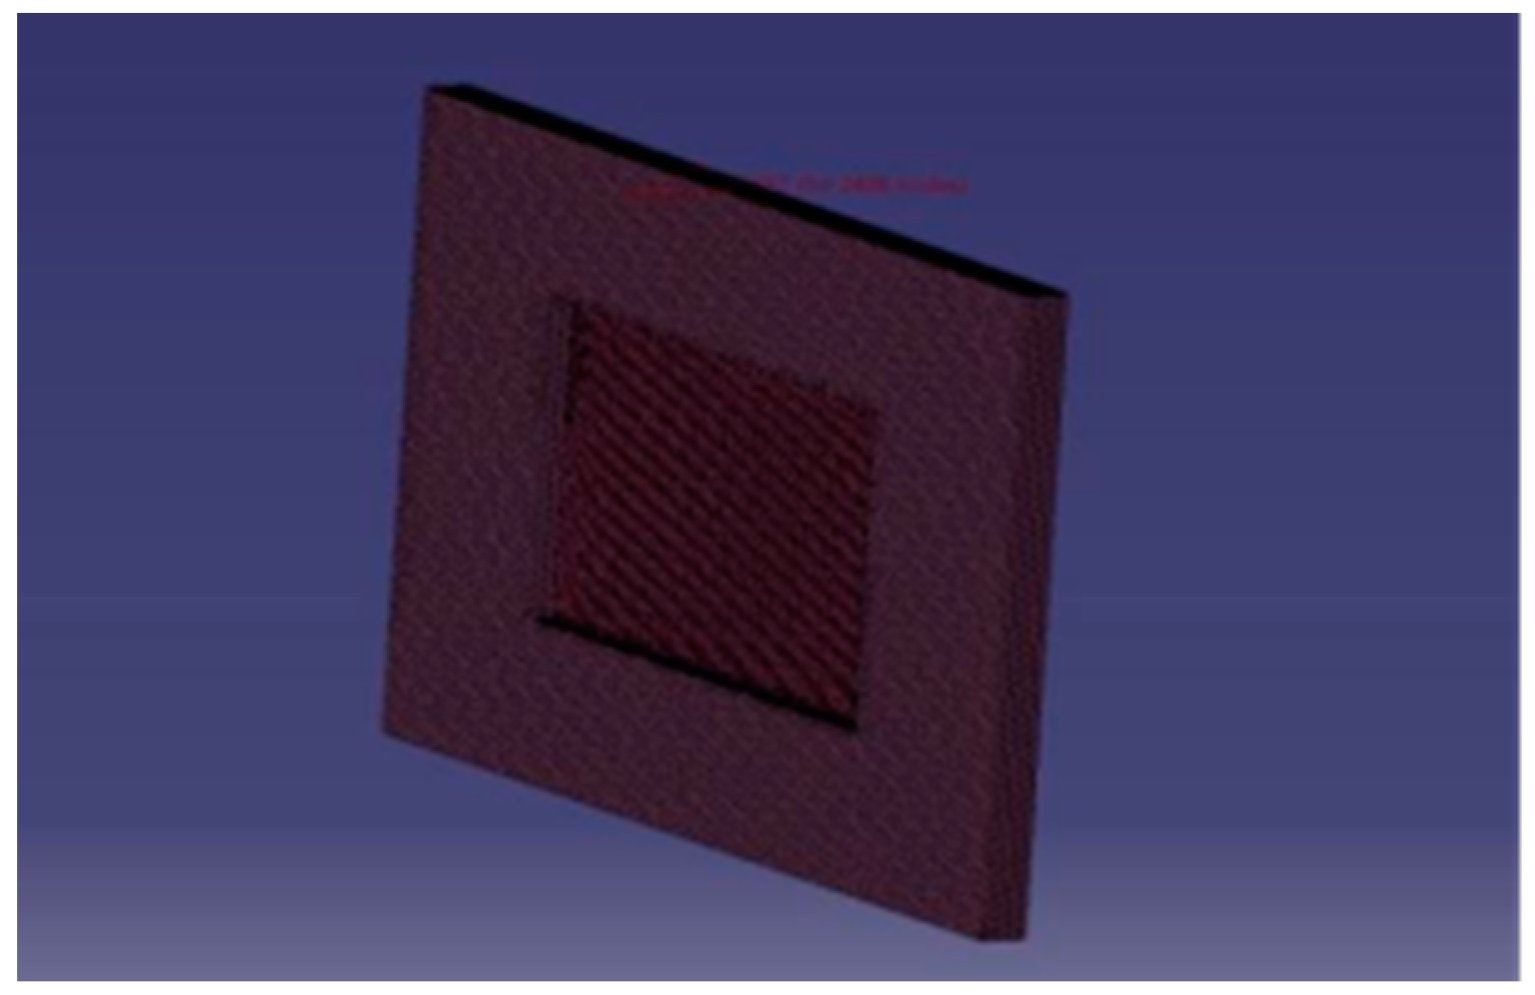
3. Numerical Simulation of Acoustic Insulation Performance Based on the Window-Wall Assembly Model
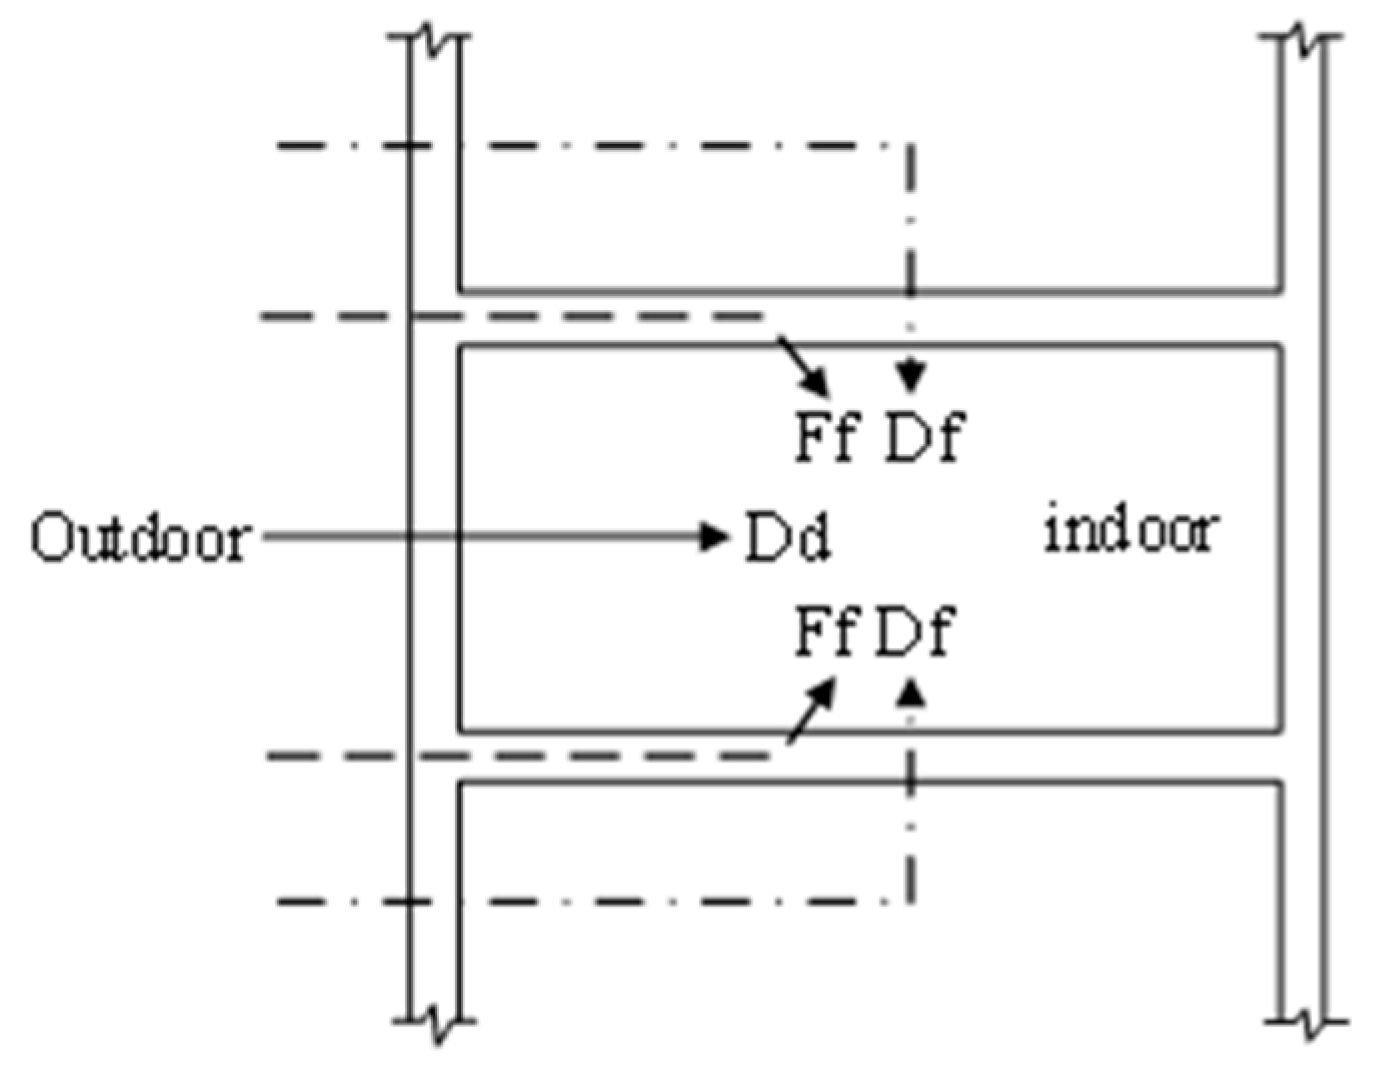
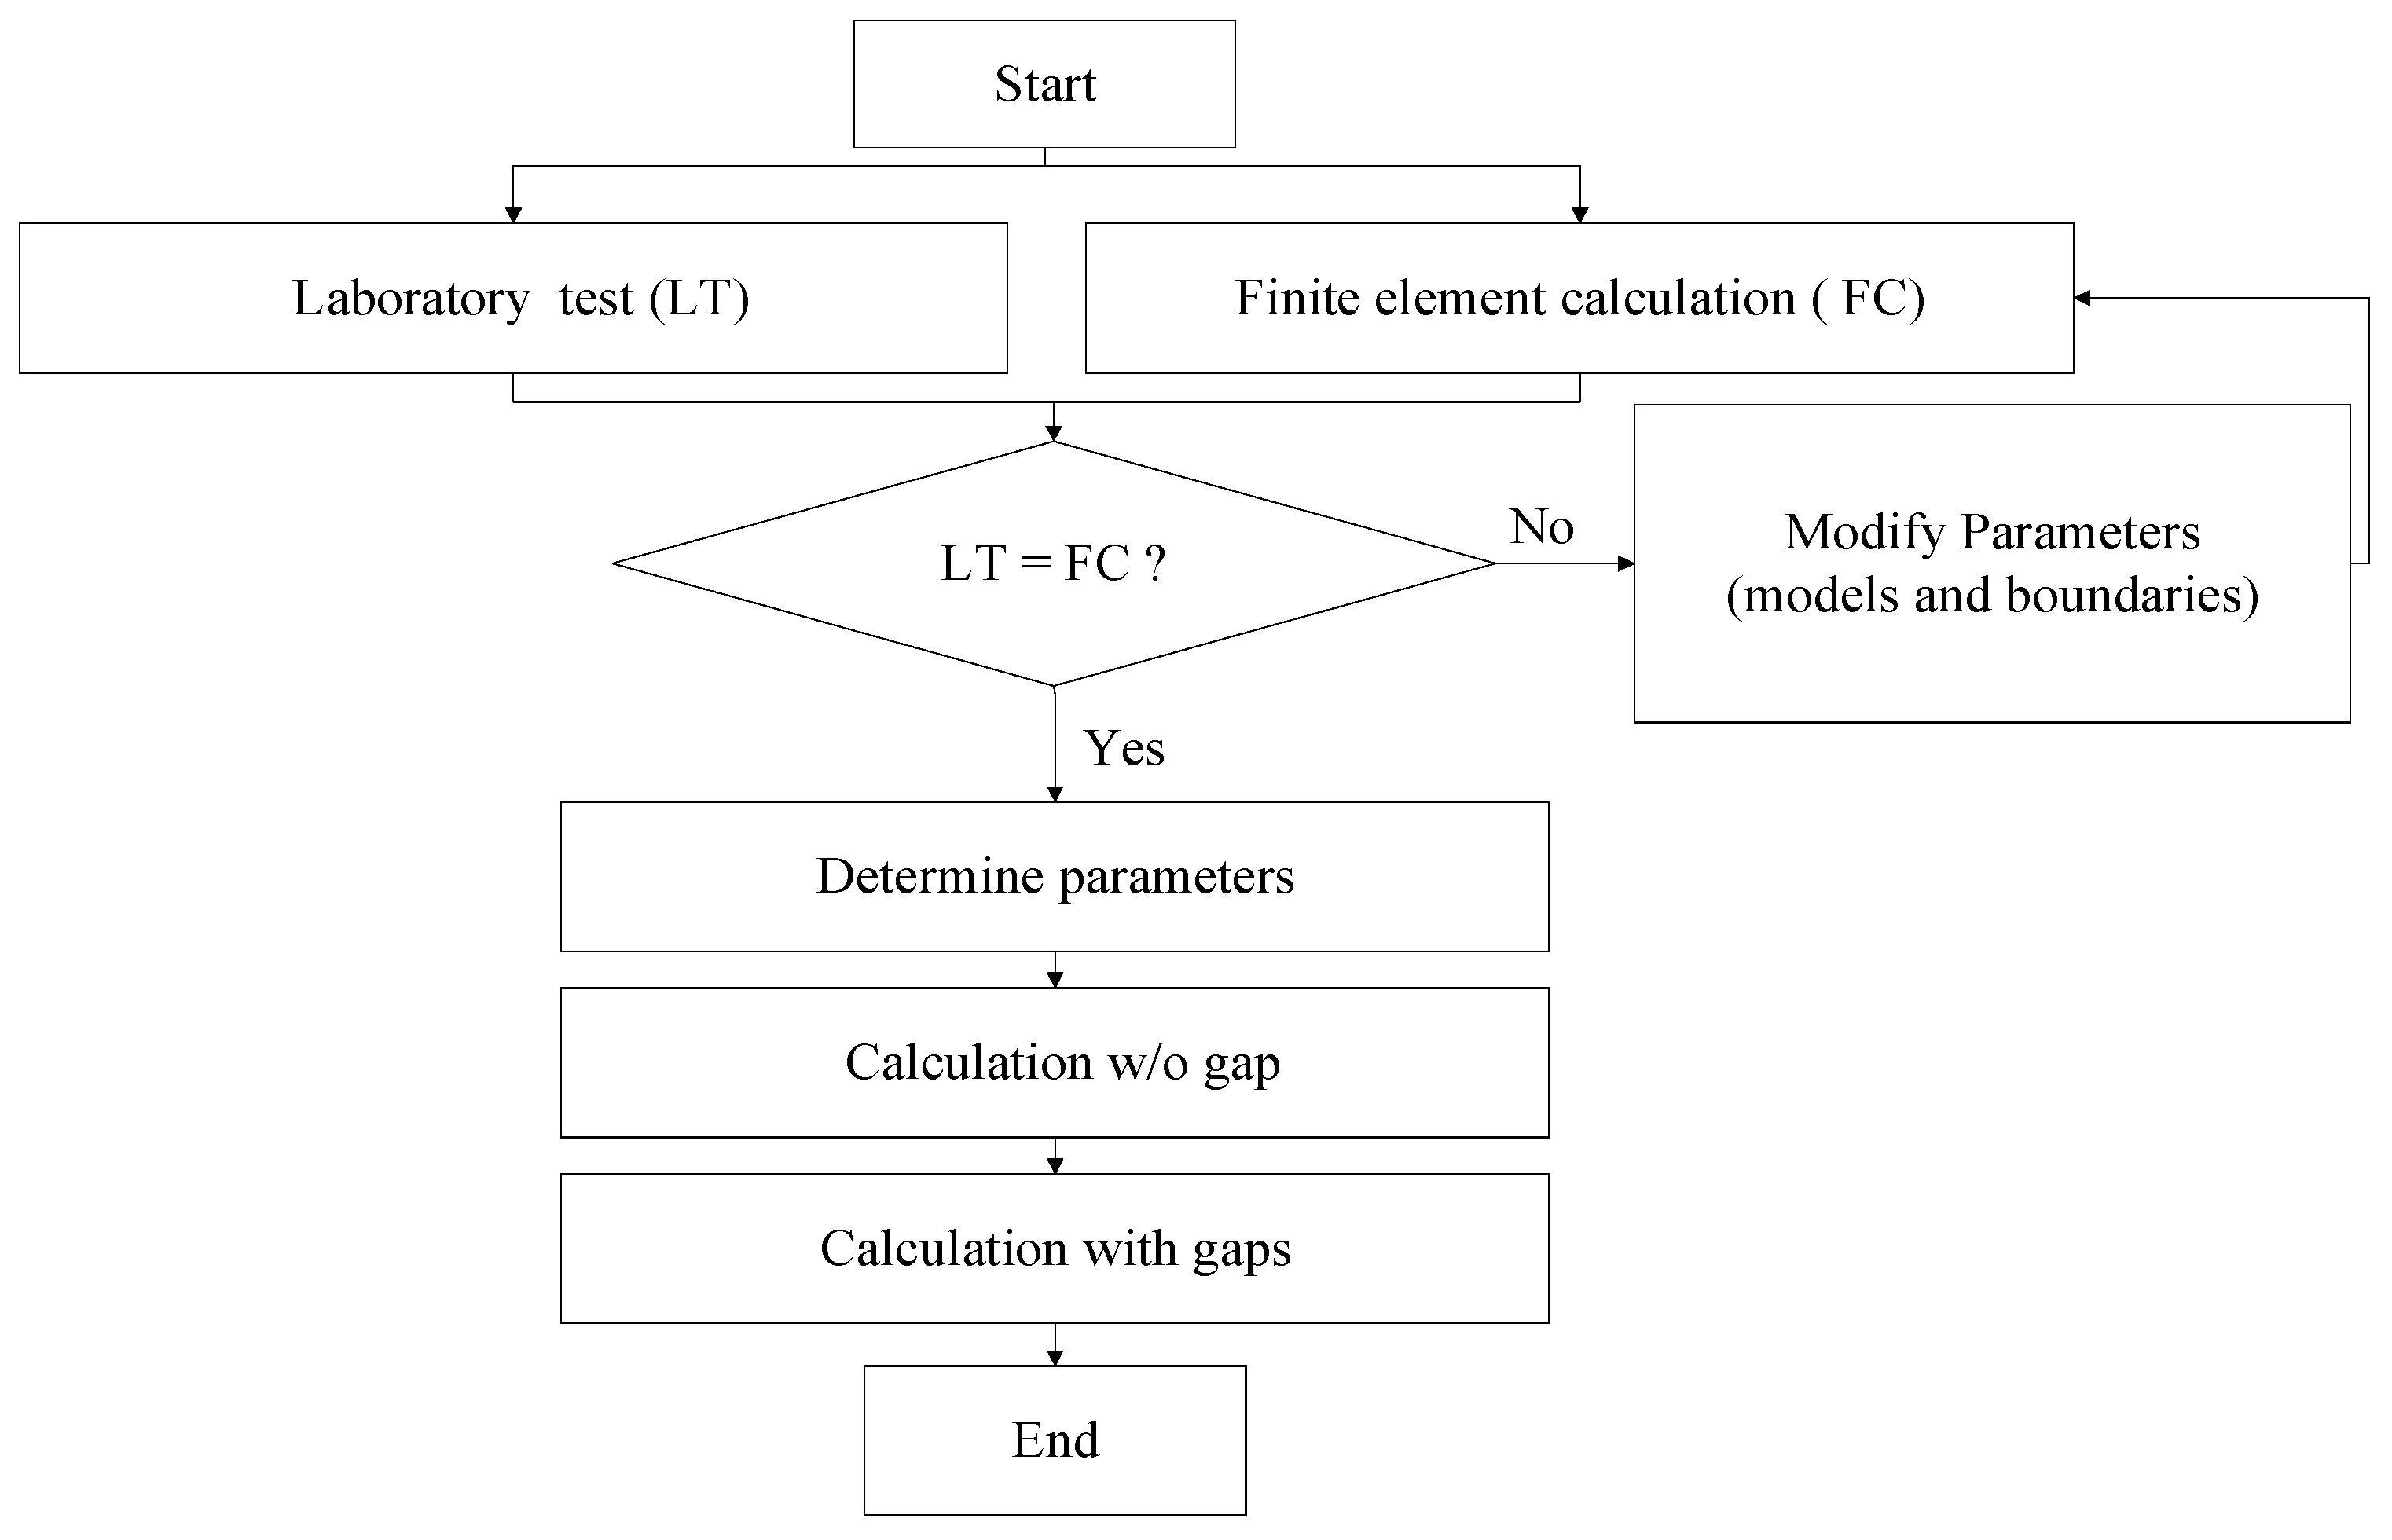
3.1. Principles and Assumptions of the Numerical Model
3.2. Parameters for Acoustic Calculations
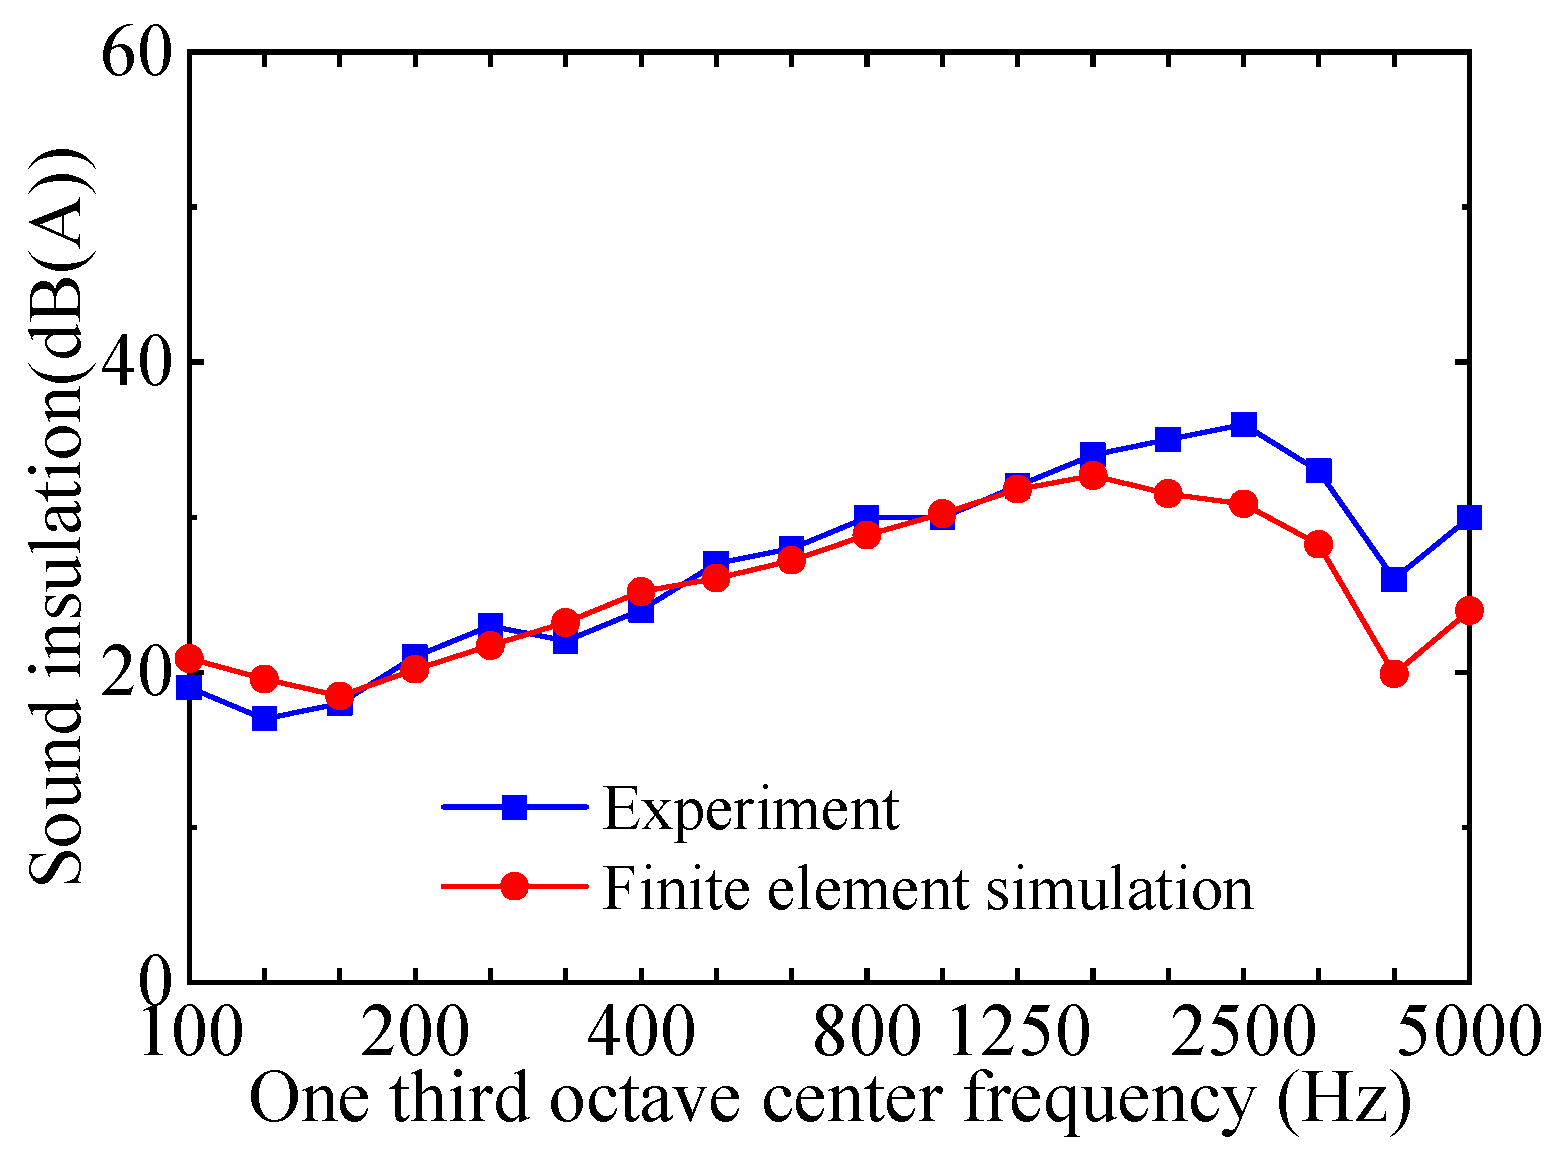
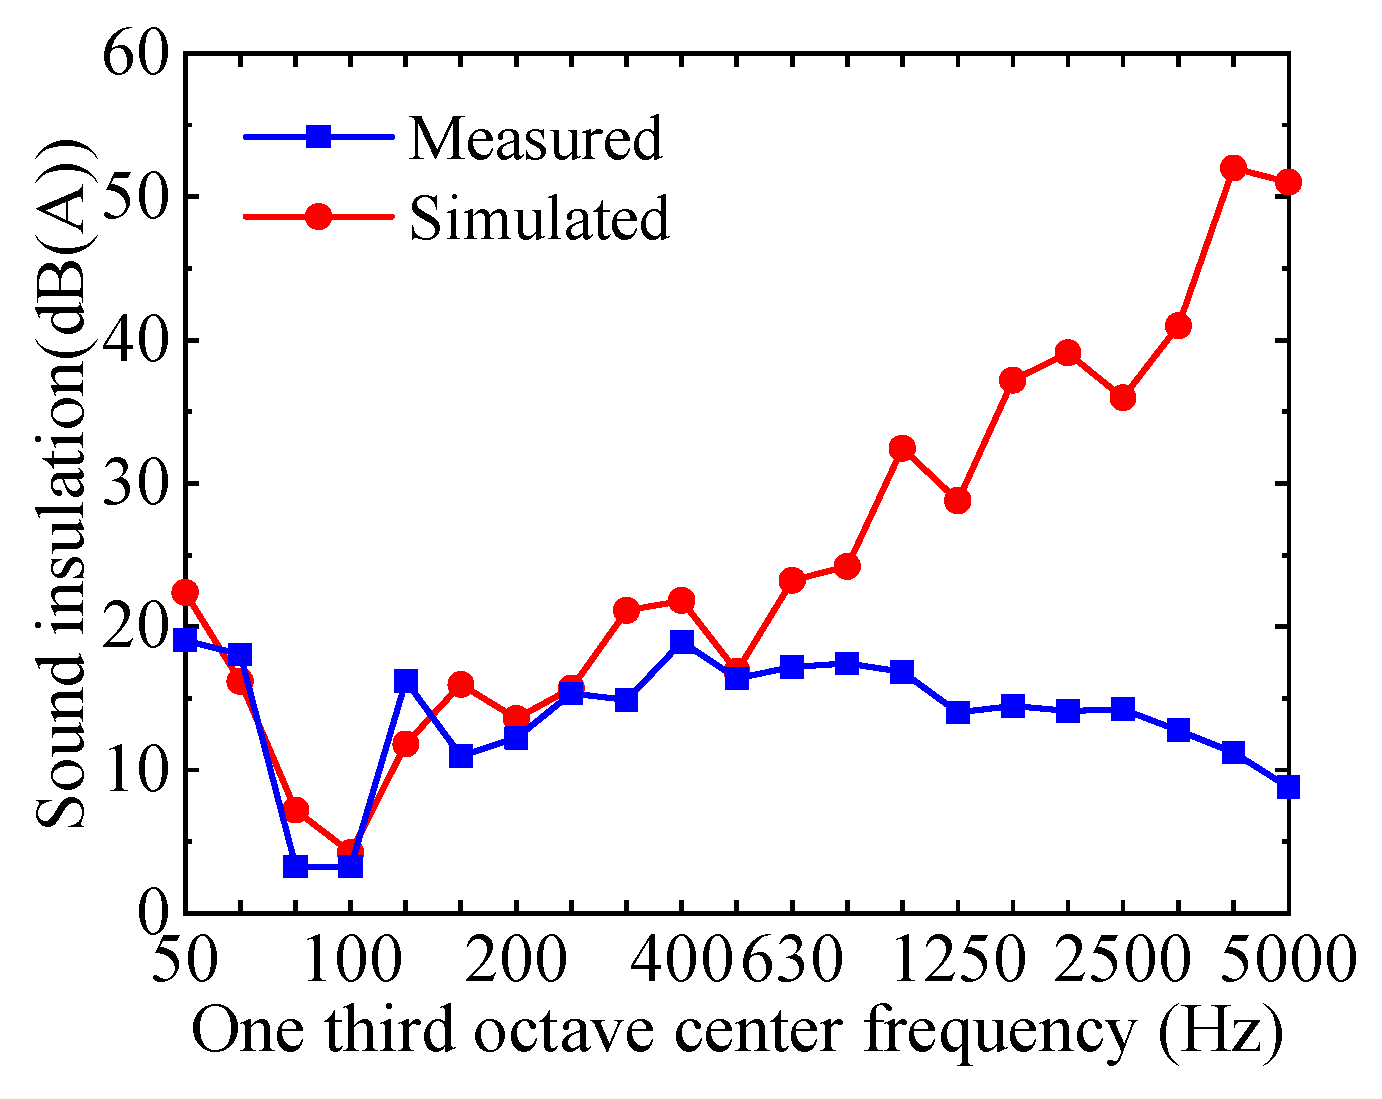
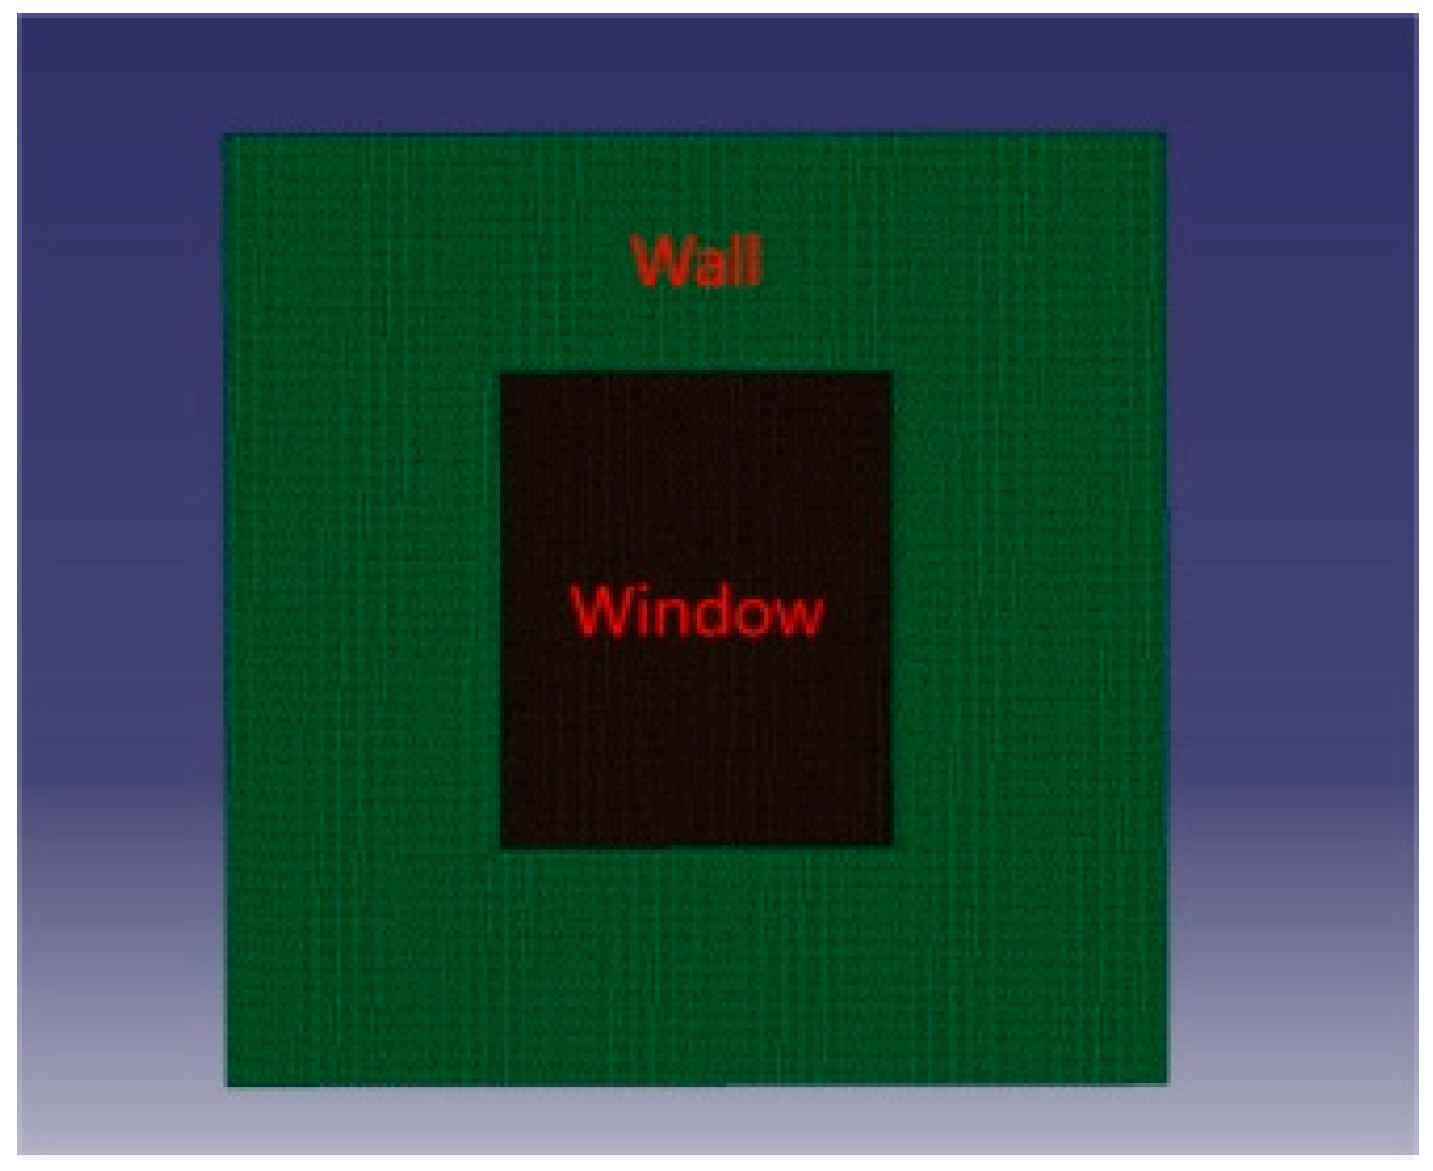
3.3. Sound Insulation Analysis Using the Window-Wall Assembly Model
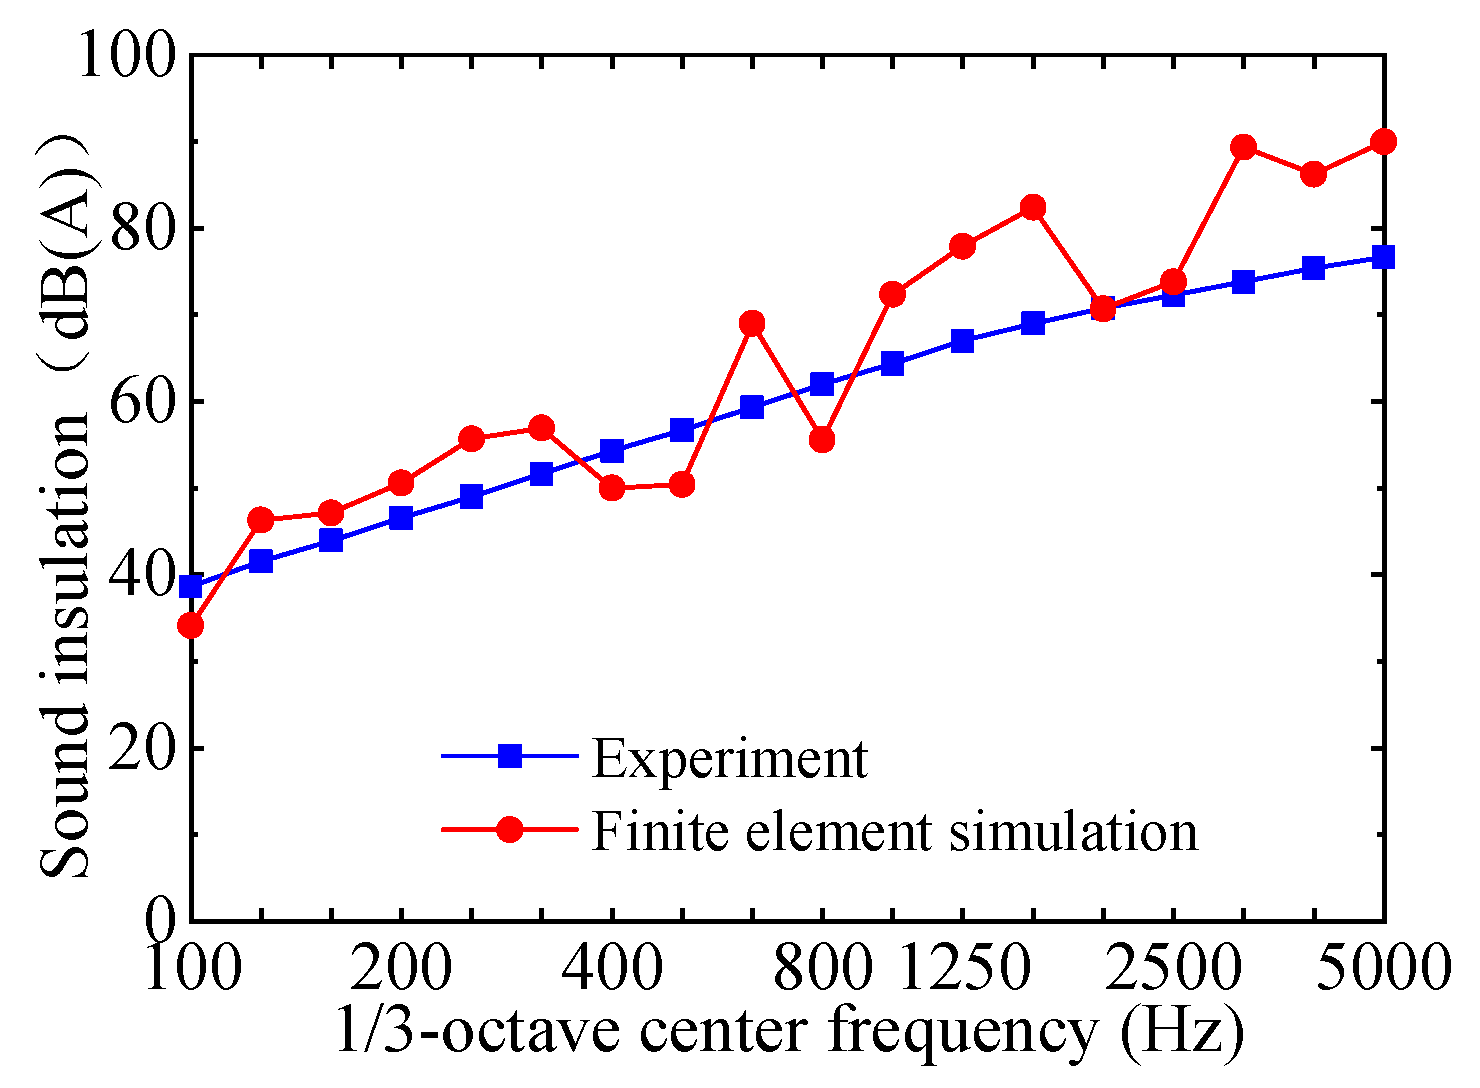
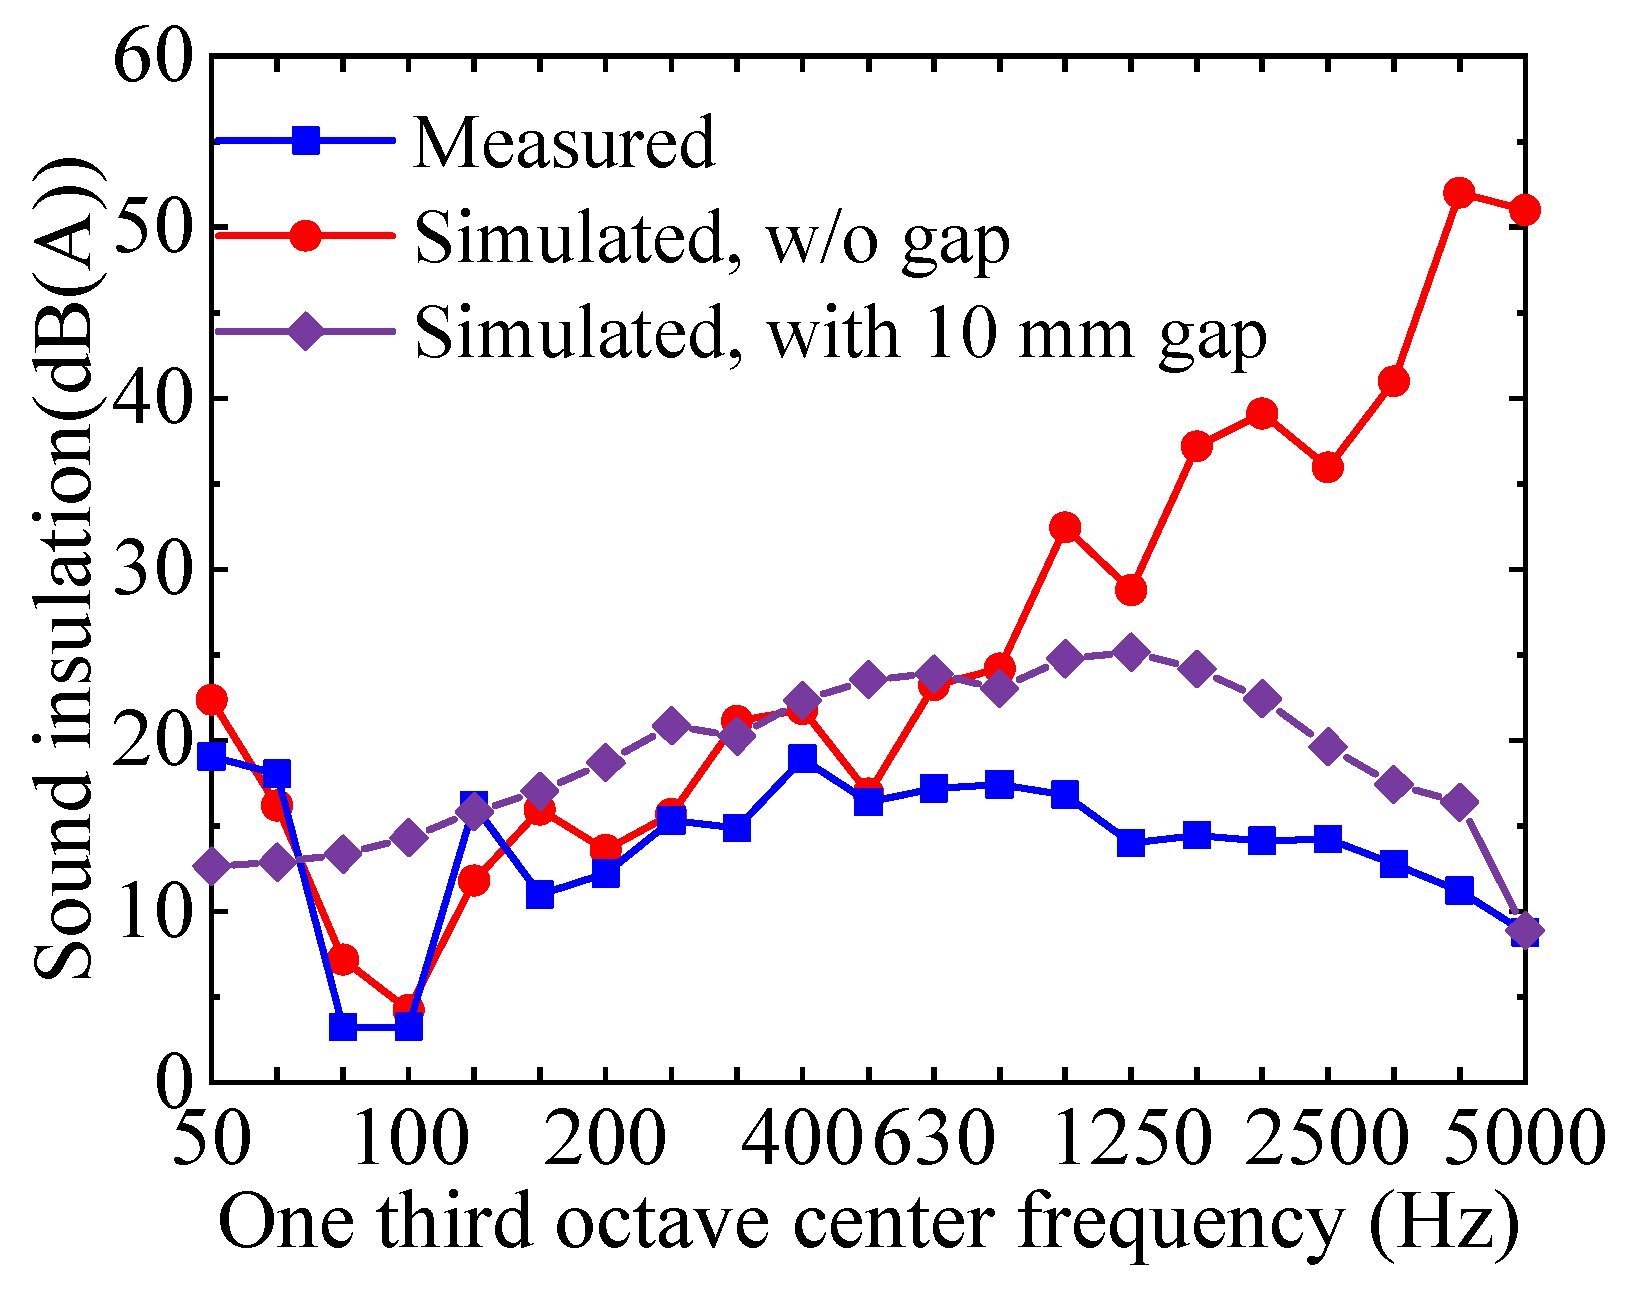
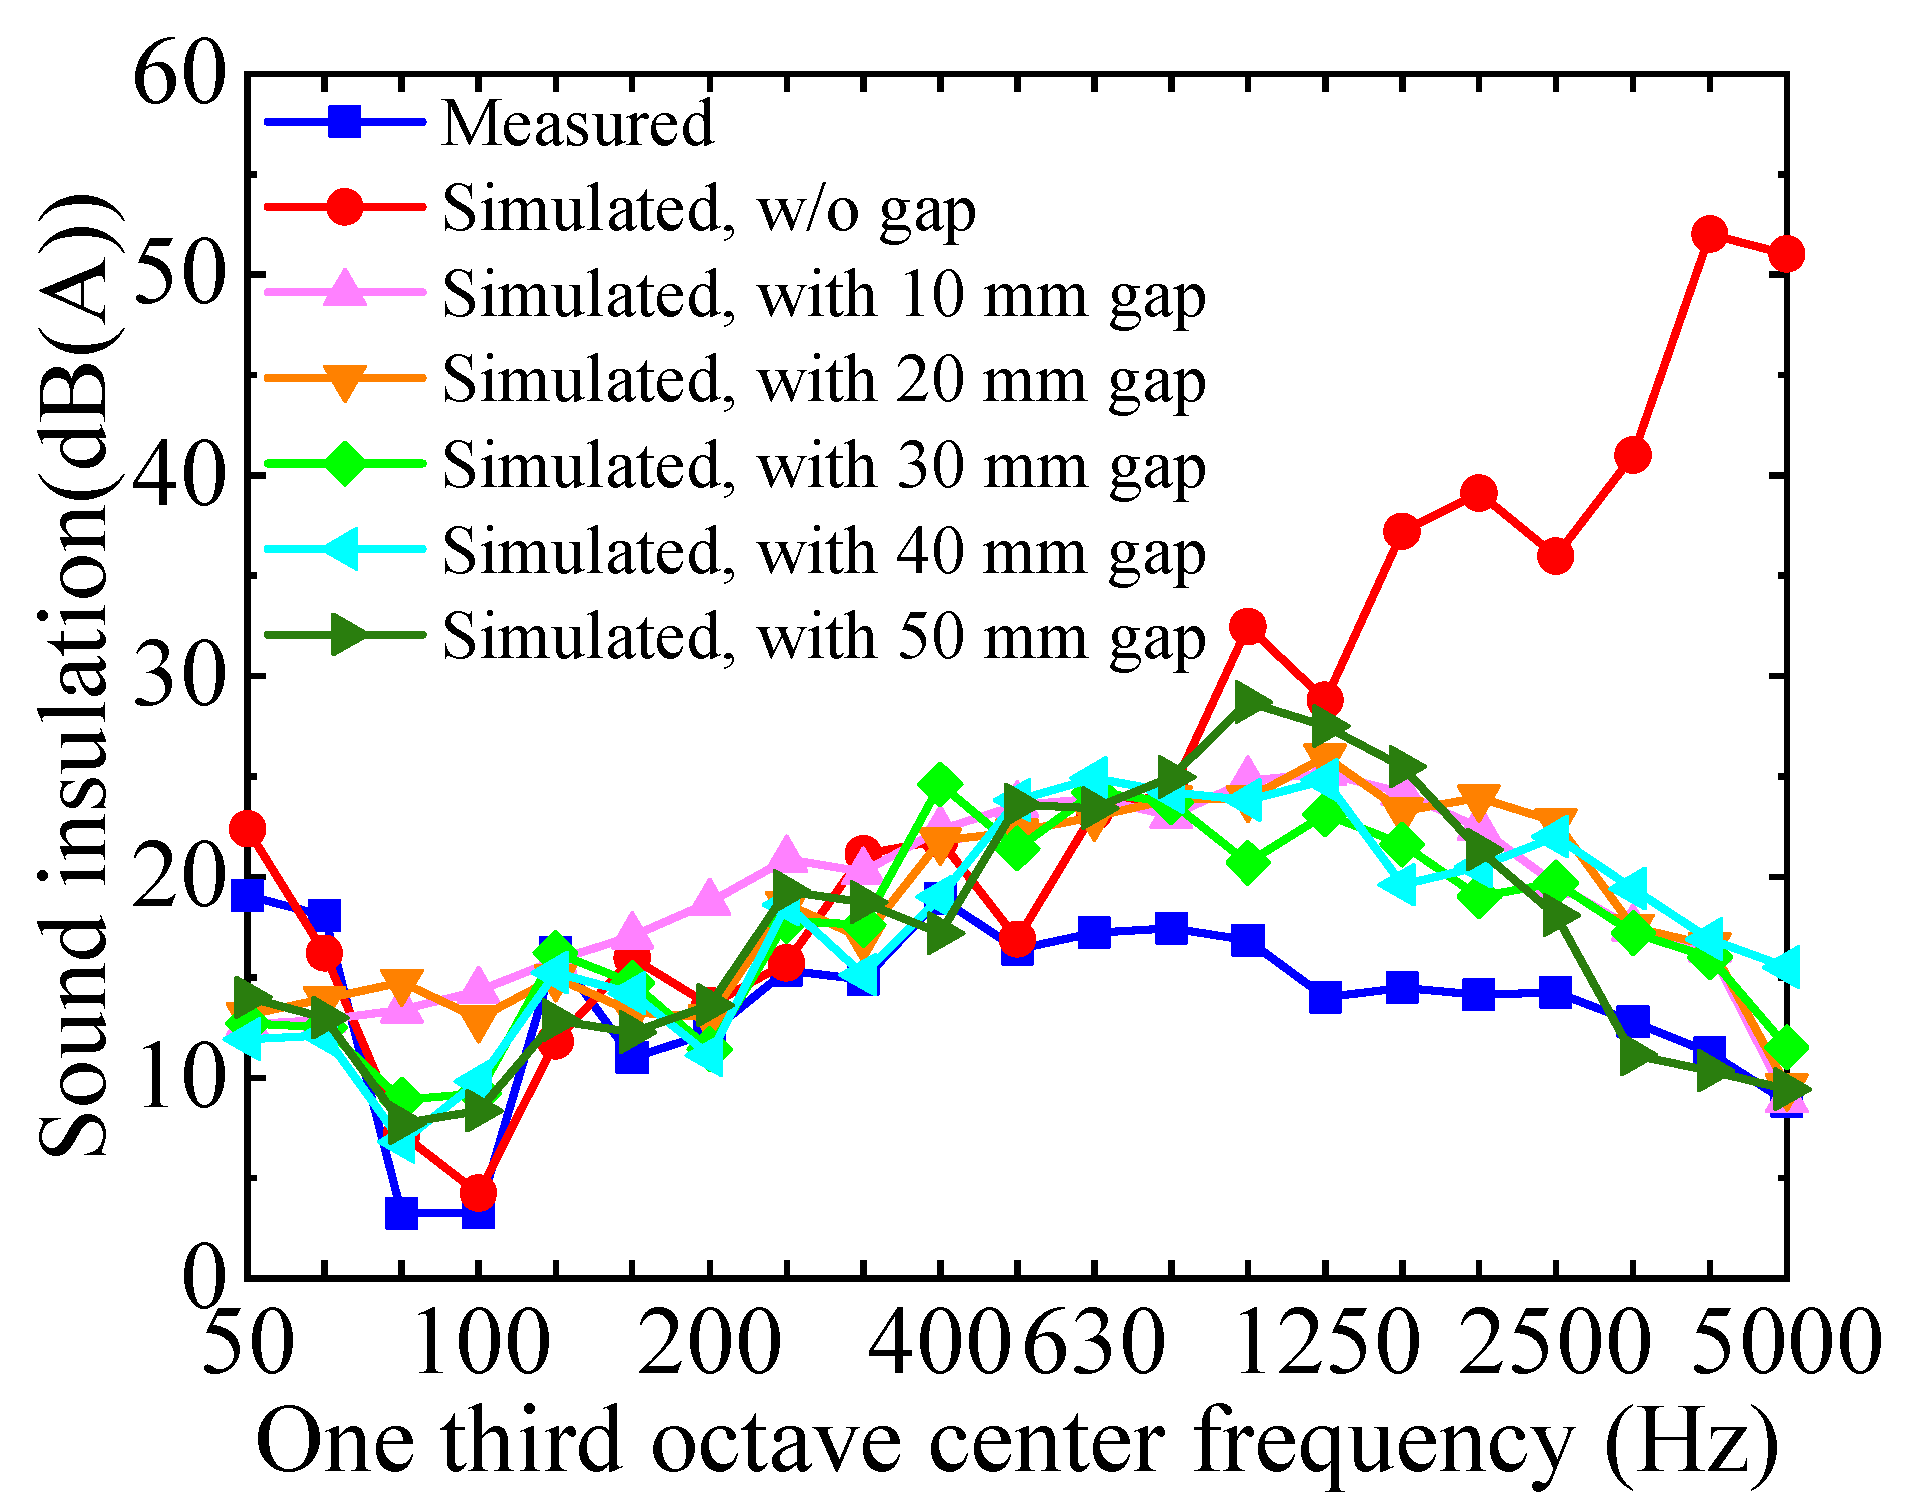
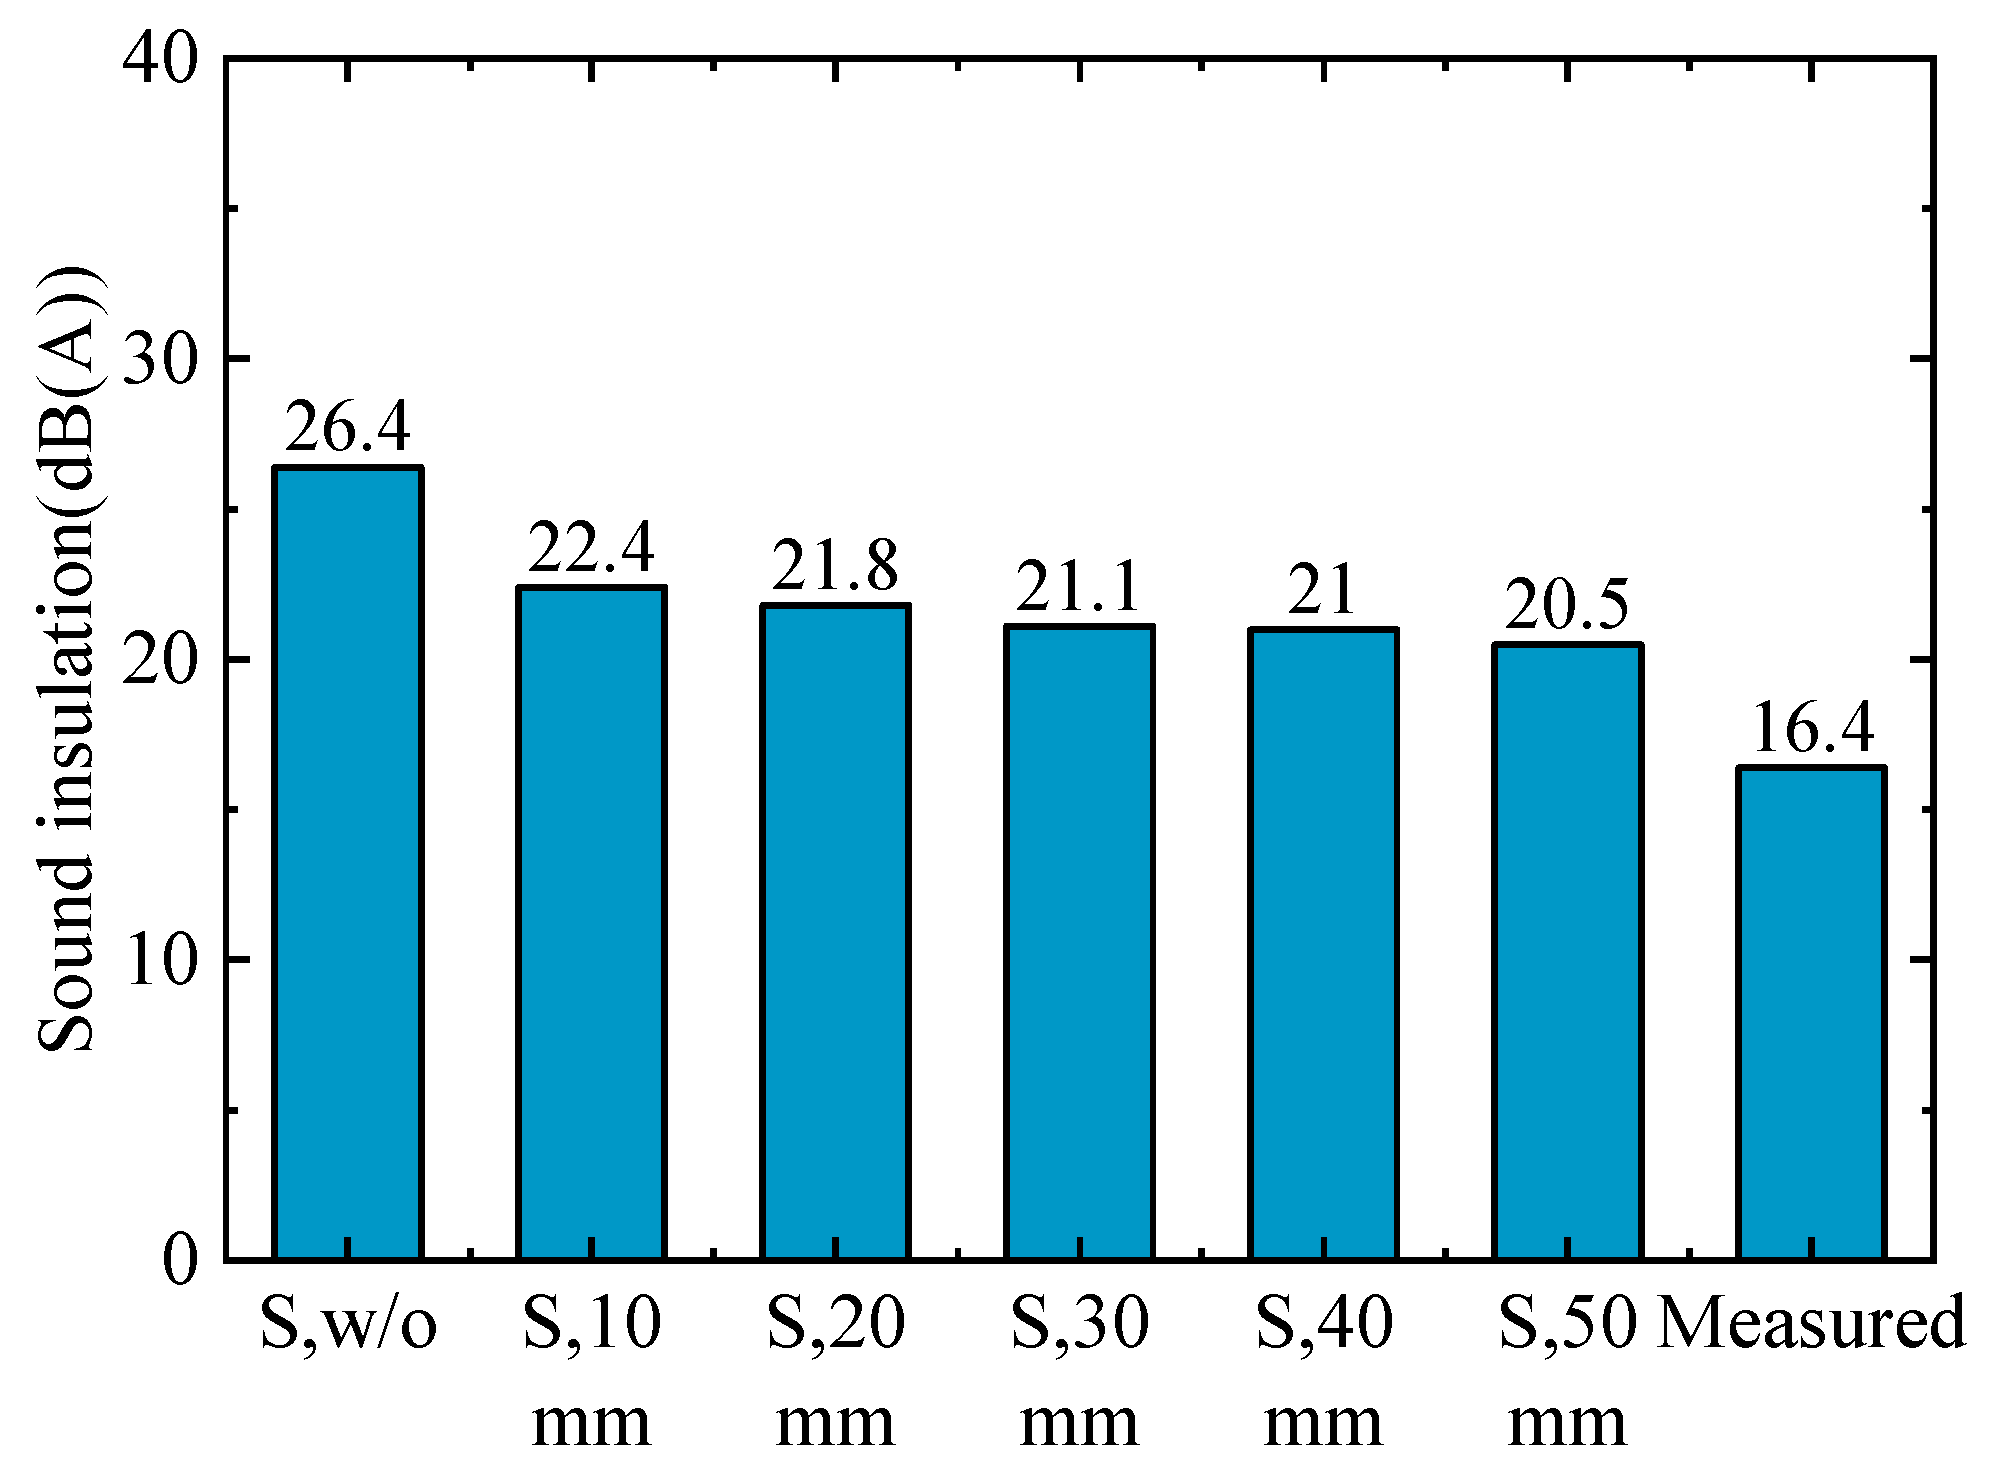
3.4. Sound Insulation Analysis Using the Window-Wall Assembly Model with Air Gaps
4. Discussion
4.1. Effect of Windows on Sound Insulation Capability
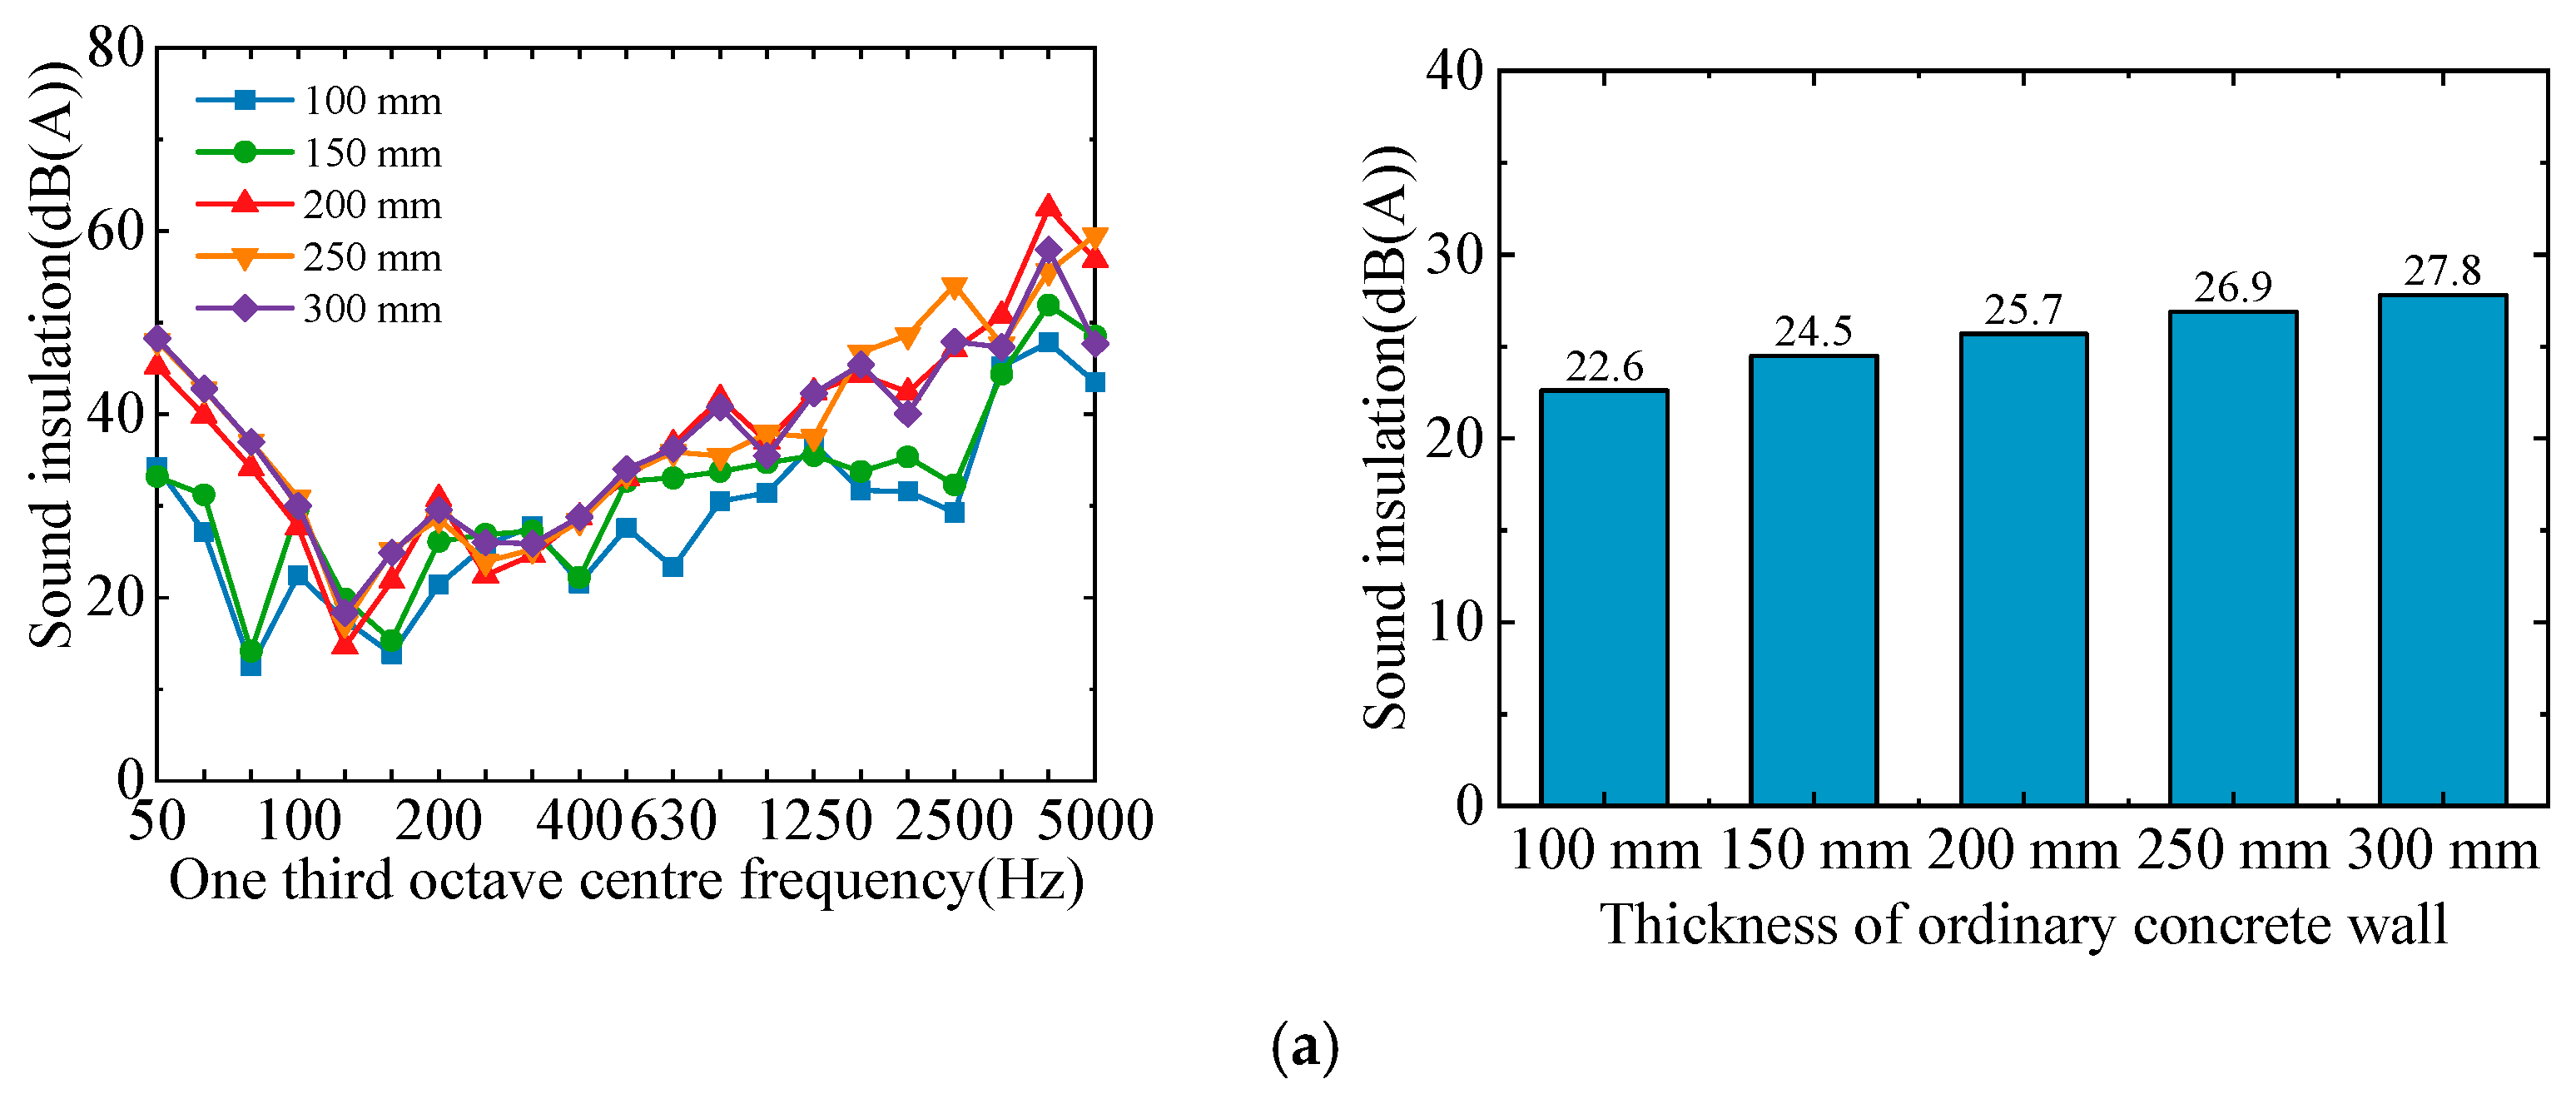
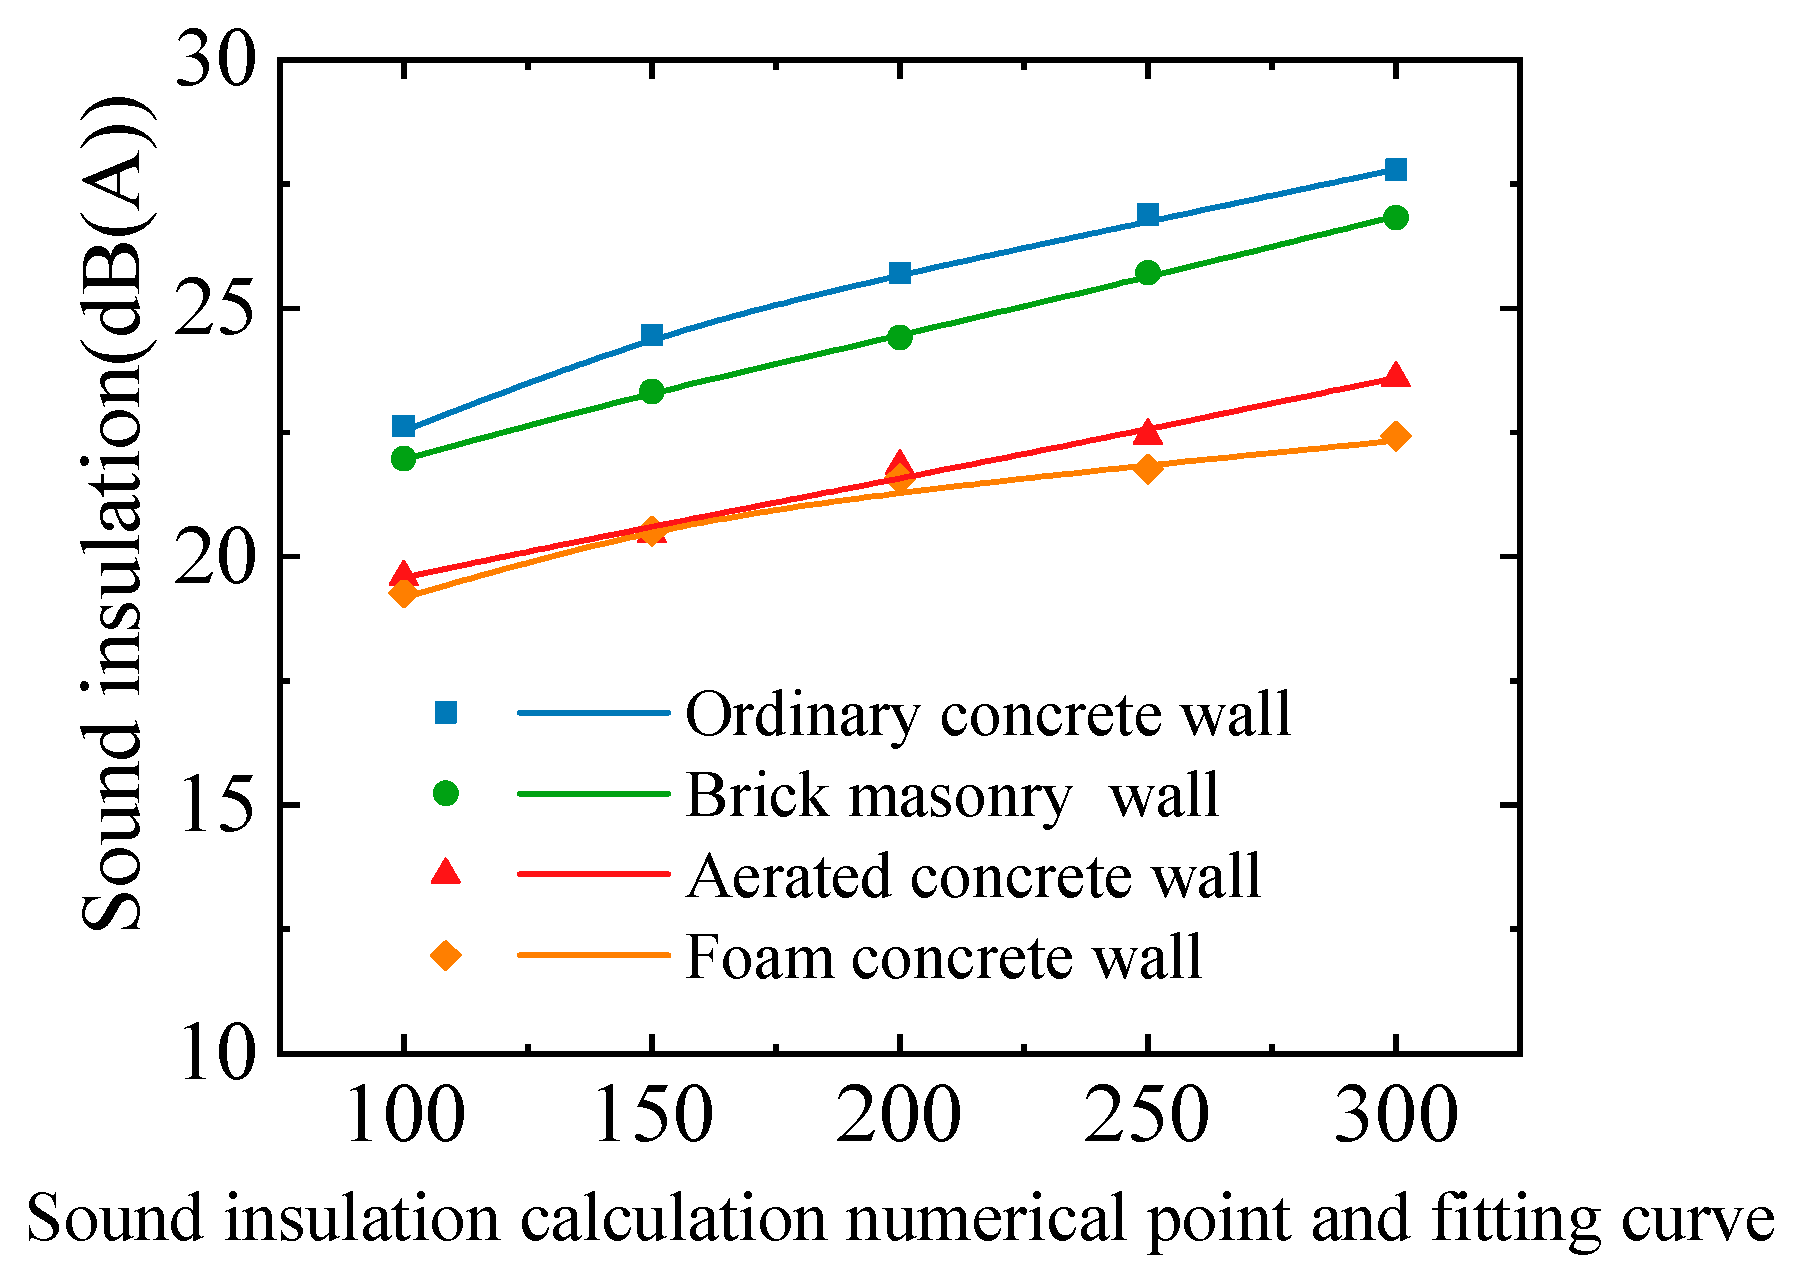
4.2. Effect of Wall on Sound Insulation Capability
4.3. Limitations of the Current Work
5. Conclusions
Author Contributions
Funding
Data Availability Statement
Conflicts of Interest
References
- Zhou, L.; Yu, Q.; Zeng, X. Analysis of current situation of urban rail transit noise and related countermeasures. China Environ. Prot. Ind. 2023, 4, 53–59. (In Chinese) [Google Scholar]
- Welch, D.; Shepherd, D.; Dirks, K.N.; Reddy, R. Health effects of transport noise. Transp. Rev. 2023, 43, 1190–1210. [Google Scholar] [CrossRef]
- Tetiranont, S.; Sadakorn, W.; Rugkhapan, N.; Prasittisopin, L. Enhancing Sustainable Railway Station Design in Tropical Climates: Insights from Thailand’s Architectural Theses and Case Studies. Buildings 2024, 14, 829. [Google Scholar] [CrossRef]
- Gangwar, M.; Sharma, S.M. Evaluating choice of traction option for a sustainable Indian Railways. Transp. Res. Part D Transp. Environ. 2014, 33, 135–145. [Google Scholar] [CrossRef]
- He, W.; He, K.; Zou, C.; Yu, Y. Experimental noise and vibration characteristics of elevated urban rail transit considering the effect of track structures and noise barriers. Environ. Sci. Pollut. Res. 2021, 28, 45903–45919. [Google Scholar] [CrossRef] [PubMed]
- Qiu, Y.; Zou, C.; Hu, J.; Chen, J. Prediction and mitigation of building vibrations caused by train operations on concrete floors. Appl. Acoust. 2024, 219, 109941. [Google Scholar] [CrossRef]
- He, W.; Liu, J.; Song, S.; Liu, P. A non-contact vehicle weighing approach based on bridge weigh-in-motion framework and computer vision techniques. Measurement 2024, 225, 113994. [Google Scholar] [CrossRef]
- Zou, C.; Li, X.; He, C.; Zhou, S. An efficient method for estimating building dynamic response due to train operations in tunnel considering transmission path from source to receiver. Comput. Struct. 2024, 305, 107555. [Google Scholar] [CrossRef]
- Hu, J.; Zou, C.; Liu, Q.; Li, X.; Tao, Z. Floor vibration predictions based on train-track-building coupling model. J. Build. Eng. 2024, 89, 109340. [Google Scholar] [CrossRef]
- Yu, L.; Bu, Z.; Li, L.; Zhu, X.; Lei, Z.; Luo, Y. Characteristics analysis of urban rail viaduct structure noise considering Doppler effect. Urban Mass Transit 2020, 23, 74–79+85. (In Chinese) [Google Scholar]
- He, W.; Zou, C.; Pang, Y.; Wang, X. Environmental noise and vibration characteristics of rubber-spring floating slab track. Environ. Sci. Pollut. Res. 2021, 28, 13671–13689. [Google Scholar] [CrossRef]
- Zhao, Y.; Li, X.; Lv, Q.; Jiao, H.; Xiao, X.; Jin, X. Measuring, modelling and optimising an embedded rail track. Appl. Acoust. 2017, 116, 70–81. [Google Scholar] [CrossRef]
- Li, X.; Chen, Y.; Zou, C.; Chen, Y. Train-induced vibration mitigation based on foundation improvement. J. Build. Eng. 2023, 76, 107106. [Google Scholar] [CrossRef]
- He, W.; He, K.; Yao, C.; Liu, P.; Zou, C. Comparison of damping performance of an aluminum bridge via material damping, support damping and external damping methods. Structures 2022, 45, 1139–1155. [Google Scholar] [CrossRef]
- Li, X.; Liang, L.; Zhao, Q. Influence of track structure type on noise radiated from an elevated box-girder. China Civ. Eng. J. 2018, 51, 78–87. (In Chinese) [Google Scholar]
- Song, L.; Li, X.; Zhang, L.; Liu, Q.; Feng, Q.; Luo, Y. Characteristics and prediction of structure-borne noise from urban rail transit bridge-sound barrier system. J. Traffic Transp. Eng. 2021, 21, 193–202. (In Chinese) [Google Scholar]
- Song, L.; Gao, K.; Liu, Q.; Liu, L.; Feng, Q. Study on the structure-borne noise of U-shaped girder bridges with fully-enclosed sound barriers. Appl. Acoust. 2023, 211, 109497. [Google Scholar] [CrossRef]
- Frid, A. Skirts and barriers for reduction of wayside noise from railway vehicles—An experimental investigation with application to the BR185 locomotive. J. Sound Vib. 2003, 267, 709–719. [Google Scholar] [CrossRef]
- Granzotto, N.; Bettarello, F.; Ferluga, A.; Marsich, L.; Schmid, C.; Fausti, P.; Caniato, M. Energy and acoustic performances of windows and their correlation. Energy Build. 2017, 136, 189–198. [Google Scholar] [CrossRef]
- Wu, W.; He, W.; Yu, H. Study and analysis on sound insulation performance of several common kinds of light weight panel for building partition. Sichuan Build. Sci. 2021, 47, 83–89. (In Chinese) [Google Scholar]
- Zhu, X.; Wang, L.; Wang, X.; Jiang, J. Simulation Study of Sound Insulation Performance of the Double-glazed Window. Noise Vib. Control. 2022, 42, 256–262. (In Chinese) [Google Scholar]
- Liu, M.; Peng, L.; Fan, Z.; Wang, D. Sound Insulation and Mechanical Properties of wood damping composites. Wood Res. 2019, 64, 743–758. [Google Scholar]
- Wang, J.; Du, B. Experiment on the optimization of sound insulation performance of residential floor structure. Appl. Acoust. 2021, 174, 107734. [Google Scholar] [CrossRef]
- Liu, X. Acoustic Analysis of Windows and Walls Using LMS Virtual.Lab. Master’s Thesis, Nanchang Hangkong University, Nanchang, China, 2016. (In Chinese). [Google Scholar]
- Lakshmikandhan, K.N.; Harshavardhan, B.S.; Prabakar, J.; Saibabu, S. Investigation on Wall Panel Sandwiched with Lightweight Concrete. IOP Conf. Ser. Mater. Sci. Eng. 2017, 225, 012275. [Google Scholar] [CrossRef]
- Arjunan, A.; Baroutaji, A.; Robinson, J.; Vance, A.; Arafat, A. Acoustic metamaterials for sound absorption and insulation in buildings. Build. Environ. 2024, 251, 111250. [Google Scholar] [CrossRef]
- Osipov, A.; Mees, P.; Vermeir, G. Numerical simulation of airborne sound transmission at low frequencies: The influence of the room and the partition parameters. Proc. Inter-Noise 1997, 2, 759–762. [Google Scholar]
- Maluski, S.P.S.; Gibbs, B.M. Application of a finite-element to low-frequency sound insulation in dwellings. Acoust. Soc. Am. 2000, 108, 1741–1751. [Google Scholar] [CrossRef] [PubMed]
- Ljunggren, L. Airborne sound insulation of single walls at low frequencies: A discussion on the influence of boundary and mounting conditions. Build. Acoust. 2001, 8, 257–267. [Google Scholar] [CrossRef]
- Tadeu, A.; António, J. Acoustic insulation of single panel walls provided by analytical expressions versus the mass law. Sound Vib. 2002, 257, 457–475. [Google Scholar] [CrossRef]
- GB/T 19889.5-2006; Acoustics—Measurement of Sound Insulation in Building Elements Part 5: Field Measurements of Airborne Sound Insulation of Façade Elements and Facades. China Architecture & Building Press: Beijing, China, 2006.
- GB/T 19889.3-2005; Acoustics—Measurement of Sound Insulation in Buildings and of Building Elements Part 3: Laboratory Measurements of Airborne Sound Insulation of Building Elements. China Architecture & Building Press: Beijing, China, 2006.
- Ferziger, J.H.; Peric, M. Computational Methods for Fluid Dynamics; Springer: Berlin/Heidelberg, Germany, 2002. [Google Scholar]


| Type of Wall | Type of Window | Wall Size | Window Size |
|---|---|---|---|
| Aerated concrete block | Single-glazed sliding windows | 5000 × 3000 × 200 | 2700 × 1500 (Single glazing 5 mm thick) |
| Material | Size (mm) | Density (kg/m3) | Elastic Modulus (Pa) | Poisson’s Ratio |
|---|---|---|---|---|
| Single-pane glass window | 1500 × 1250 × 3 | 2500 | 7.2 × 10¹⁰ | 0.2 |
| Concrete wall | 5000 × 5000 × 200 | 2500 | 3 × 10¹⁰ | 0.2 |
| Materials | Size of Components (mm) | Densities (kg/m3) | Elastic Modulus (Pa) | Poisson’s Ratio |
|---|---|---|---|---|
| Single-pane glass window | 2700 × 1500 × 5 | 2500 | 7.2× 10¹⁰ | 0.2 |
| Aerated concrete wall | 5000 × 3000 × 200 | 1300 | 4.5× 10⁹ | 0.2 |
| Type of Windows | Thickness (mm) | Density (kg/m3) | Elastic Modulus (Pa) | Poisson’s Ratio | Damping Ratio |
|---|---|---|---|---|---|
| Single-pane glass | 5 | 2500 | 7.2 × 10¹⁰ | 0.2 | 0.05 |
| Double-pane glass | 5 + 6air + 5 | ||||
| PVB Laminated glass | 5 + 0.38PVB + 5 5 + 0.76PVB + 5 | ||||
| Double-layer composite structure | 5 + 0.38PVB + 6air + 5 |
| Material | Density (kg/m3) | Elastic Modulus (Pa) | Poisson’s Ratio |
|---|---|---|---|
| Concrete wall | 2500 | 3 × 10¹⁰ | 0.2 |
| Brick wall | 2100 | 1.22 × 10¹⁰ | 0.2 |
| Lightweight concrete wall | 1950 | 2.1 × 10¹⁰ | 0.2 |
| Foam concrete wall | 1300 | 4.5 × 10⁹ | 0.2 |
Disclaimer/Publisher’s Note: The statements, opinions and data contained in all publications are solely those of the individual author(s) and contributor(s) and not of MDPI and/or the editor(s). MDPI and/or the editor(s) disclaim responsibility for any injury to people or property resulting from any ideas, methods, instructions or products referred to in the content. |
© 2024 by the authors. Licensee MDPI, Basel, Switzerland. This article is an open access article distributed under the terms and conditions of the Creative Commons Attribution (CC BY) license (https://creativecommons.org/licenses/by/4.0/).
Share and Cite
Wang, T.; He, W.; Wang, D.; Chen, J. Field Measurement and Numerical Simulation of Sound Insulation Characteristics of Buildings Along Elevated Urban Rail Lines. Buildings 2024, 14, 3799. https://doi.org/10.3390/buildings14123799
Wang T, He W, Wang D, Chen J. Field Measurement and Numerical Simulation of Sound Insulation Characteristics of Buildings Along Elevated Urban Rail Lines. Buildings. 2024; 14(12):3799. https://doi.org/10.3390/buildings14123799
Chicago/Turabian StyleWang, Teng, Wei He, Dongyang Wang, and Jialiang Chen. 2024. "Field Measurement and Numerical Simulation of Sound Insulation Characteristics of Buildings Along Elevated Urban Rail Lines" Buildings 14, no. 12: 3799. https://doi.org/10.3390/buildings14123799
APA StyleWang, T., He, W., Wang, D., & Chen, J. (2024). Field Measurement and Numerical Simulation of Sound Insulation Characteristics of Buildings Along Elevated Urban Rail Lines. Buildings, 14(12), 3799. https://doi.org/10.3390/buildings14123799