Article

Influence of the Soil Squeezing Effect on the Peripile Soil of Pre-Tensioned H-Type Prestressed Concrete Revetment Pile Construction Based on Field Tests

1
Key Laboratory of Ministry of Education for Geomechanics and Embankment Engineering, Hohai University, Nanjing 210098, China
2
Geotechnical Engineering Research Center of Jiangsu Province, Nanjing 210098, China
3
Engineering Research Center of Dredging Technology of Ministry of Education, Hohai University, Changzhou 213000, China
*
Author to whom correspondence should be addressed.
Buildings 2024, 14(12), 3816; https://doi.org/10.3390/buildings14123816
Submission received: 23 October 2024 / Revised: 22 November 2024 / Accepted: 24 November 2024 / Published: 28 November 2024

Abstract

:
Pre-tensioned H-type prestressed concrete revetment piles are a newly developed product dedicated to the protection of river, lake, and sea bank embankments, and their cross-section is H-shaped. In this study, a field test of H-type pile soil’s squeezing effect is carried out based on the second phase project of the HujiaShen Line. Pore water pressure, soil displacement, and other parameters of the H-type pile-driving process are monitored in real time. The test results show the following: (1) The influence range of the excess pore water pressure caused by the soil squeezing effect in the horizontal direction is about 14–15D, and in the vertical direction, the pore water pressure within a depth range of about 7D below the pile bottom increases rapidly. Its dissipation rate is fast at first and then slows down, and it completely dissipates 20 days after piling. (2) The excess pore water pressure caused by the soil squeezing effect does not decrease linearly in the radial direction. The soil around the construction pile can be divided into four areas: A, B, C, and D. Among them, A and B belong to the plastic zone, and C and D belong to the elastic zone. (3) The horizontal displacement of the soil occurs within the depth range of 5D from the surface of the pile to the bottom of the pile at the piling location, and the radial influence range is about 8–12D. From a vertical perspective, the main horizontal displacement of the soil occurs in the long section of the pile driven into the soil, showing a “U”-shaped distribution. (4) The dividing point between the vertical displacement uplift and the settlement of the soil appears within the range of 2–3 m from the construction pile, that is, between 5 and 7D. Settlement occurs after the piling is completed, and the settlement rate is fast at first and then slows down. The final settlement of the soil is stable on the 20th day. This research and experiment provide a design reference for the engineering application of pre-tensioned H-type prestressed concrete bank protection piles.

1. Introduction

Currently, water transportation projects are undergoing rapid development because of their advantages of low carbon and environmental protection, low transportation costs, the ability to save land resources, etc. At the same time, the construction of water transportation projects puts forward higher requirements for environmental protection and energy saving, which leads to the traditional block stone materials widely used in the past being replaced due to their low efficiency, low quality, and high energy consumption, among other shortcomings that prevent them from meeting the needs of the modern large-scale upgrading of inland `1 waterways. Pre-tensioned H-type prestressed concrete revetment piles are a newly researched and developed product dedicated to rivers, lakes, and coastal embankments. The H-type pile is designed with an H-shaped cross-section, with steel strands for longitudinal reinforcement, and is factory-produced through the pre-tensioning vibration molding process [1]. Compared with the traditional methods of cofferdam masonry, U-type sheet piles, and baffle-type bank protection, the H-type pile is significantly different in that it is equipped with a water-permeable step structure at the side of the flange of the pile body, and it has an optimized H-shape force cross-section. Embankment-retaining walls constructed with H-type piles have significantly improved performance in terms of flood control capacity and lateral earth pressure resistance and have better ecological and environmental protection effects and aesthetics, with significantly shortened construction periods and reduced costs, effectively responding to the demand for the energy-saving, environmentally friendly, and balanced development of water transportation projects.
Scholars have conducted a lot of research on H-pile technology and achieved certain results. Hama et al. [2] determined the load–settlement relationship of various types of sand by using different types of piles under the same geometric conditions. The test results showed that the H-pile had high ultimate bearing capacity at different lengths. Seo et al. [3] combined an H-pile with a precast concrete wall in a new structure and evaluated the ability of the structure to resist lateral load. By comparing the experimental results with the design capacity, it was believed that the structure could withstand sufficient lateral design load. Lv et al. [4,5] calculated the effective vertical stress of the surrounding soil and the axial force of the H-pile and calibrated these with the resistance of the centrifuge model test. They studied the effect of vertical shear on the load transfer mechanism of the H-pile and concluded that the downward pull of the H-pile can be effectively reduced by appropriately expanding the web. Zhang et al. [6] studied the performance of the H-pile under rainfall conditions based on centrifuge model tests and found that the duration of rainfall did not affect the moment distribution pattern of the H-pile, but it did affect the soil pressure distribution pattern on the pile side. Javanmardi et al. [7] conducted quasi-static cyclic tests based on the interaction between soil, abutments, and H-type piles and studied the failure mechanism, soil pressure distribution, etc. The test results showed that H-type piles have good ductility and energy absorption capacity. Ouyang et al. [8] proposed a linear finite element implementation method for the Euler–Bernoulli pile unit formula that can consider the influence of residual stress and effectively analyze the driving process of H-type steel piles in layered sand. Pramila Adhikari et al. [9] established the boundary relationship between IGM rock and hard rock based on limiting the rock resistance of IGM rock to the compressive strength of steel piles and finally proposed a geotechnical material classification flow chart and example design diagram to efficiently promote the design of H-type piles. Ervin Hegedus and Vijay K [10] determined the pull-out capacity of H-type piles under axial tensile loads through experiments. Jesswein and Liu et al. [11] drove H-type steel piles and pipe piles into glacial sediments in Ontario, Canada, and proposed a new design method for axial bearing capacity using a standard penetration test. Alshawabkeh et al. [12] considered parameters such as pile size, pile orientation, and pile equivalent cantilever length, studied the behavior of H-type steel piles using finite element software, evaluated their effects through regression analysis, and developed an empirical formula for lateral buckling capacity. Son et al. [13] converted railway load into dynamic load and analyzed two cases of installing only a front wall and installing a front wall with rear support. The results showed that the dynamic load resistance and lateral displacement in the former case were greater. Yang et al. [14] measured the load transfer mechanism during the static load test through field tests of H-type piles and found that nearby pile jacking was able to produce large tensile stresses that dominated a major portion of the installed pile; both the magnitude and distribution of the induced stresses were related to the penetration depth of the installed pile.
According to the previous introduction, we know that an H-type pile has many advantages, and many studies have been conducted by the predecessors. Still, the above studies mainly focus on the load transfer mechanism and the nature of the bearing capacity of H-type piles. On the other hand, an H-type pile is essentially a soil squeezing pile; it is difficult to avoid the soil squeezing effect, which will further result in the construction of the pile foundation uplift, destruction of the underground facilities around the piles, lowering the bearing capacity of the pile foundation and the undesirable hazards such as the destabilization of the surrounding environment [15,16,17,18]. At present, scholars at home and abroad have also conducted extensive research on the effect of soil squeezing on the sinking pile, and the main research methods include theoretical research, numerical analysis, modeling, and field tests. In the theoretical study, some scholars have analyzed the expansion characteristics of cylindrical cavities in improved Cam clay and proposed a solution with a wider, more comprehensive, broader range of applications [19,20,21,22]. Apostolos [23] proposed a generalized large-strain solution for the undrained expansion of vertical cylindrical cavities in critical state soils based on the rate-based plasticity formula. Li et al. [24] proposed a solution for the undrained expansion of cylindrical cavities in soils and essential soil states based on the rate-based plasticity formula: Anisotropic—anisotropic—anisotropic elastic–plastic elastoplastic solution for undrained expanding clays with cylindrical cavities. In the numerical simulation, Henke [25] investigated the effects of pile driving on peripile soils and adjacent structures based on numerical simulation and described in detail the main influences of the pile-driving process on the neighboring structures. Ding et al. [26] analyzed soil displacement induced by compression piles under silty soils by finite element simulation based on field construction data, and the results showed that soil horizontal displacement and velocity changes decrease with increasing depth of burial. Chrisopoulos and Triantafyllidis [27,28] analyzed soil horizontal displacement and velocity changes with increasing depth of burial by vibratory piling of saturated soils through a finite element study of vibratory pile driving in saturated soil after comparing factors such as pile motion and soil displacement and confirmed that the simulation method to simulate the basic essential fundamental aspects of pile driving well. Murad Abu-Farsakh et al. [29] performed a finite element simulation of the pile driving process based on field experimental data, which effectively predicted the process of generation and dissipation of excess pore water pressure and the change in the stress state of the soil around the pile during the pile driving process. In terms of modeling tests, Lu et al. [30] conducted a modeling test of a pressed pile based on the DIC technique. The experimental results showed that the conjugate behavior of soil displacement and stress was not as that of 1 times pile width at a distance from the surface of the pile of 3 times the width of the pile. Vogelsang et al. [31] revealed the relationship between soil displacement patterns and the characteristic phases of the compression pile using the DIC technique through a model test of a compression pile in saturated sand. Zhou et al. [5,32,33] conducted a physical model test based on transparent soil and particle image velocimetry. Modeling tests showed that the difference in soil displacement after the pile is more significant than before the pile at different burial depths. For field tests, Orrje et al. [34] tested the change in shear strength before and after pile driving and investigated the change in peripile pore water pressure. In Hagerty and Peck’s study of non-sensitive soils [35], this value was about 50%, and therefore, they observed displacement of people bulges, they obtained a similar conclusion to the increase in pore water pressure: the lower the sensitivity of the soil, the lower the displacement produced by the sinking pile. Zhang et al. [36,37,38] obtained soil samples at different time points during pile driving and performed microstructural tests, and found that microstructure controls the strength properties, and the macroscopic mechanical properties of the upper soil layer are inversely proportional to those of the lower one. Suleiman et al. [39] monitored the soil horizontal stress, pore water pressure, and soil horizontal displacement during CMC pile driving based on field tests, which were analyzed and found that the zone affected by the CMC installation extended to 2 to 3D from the outer surface of the CMC shaft.
The above studies show that in the process of pile laying, the soil will be squeezed into the pile and produce a soil squeezing effect. The soil squeezing effect will cause uneven settlement of foundation soil, horizontal displacement of soil, and rearrangement of soil after dissipation of excess pore water pressure, which will further cause instability of buildings, extrusion damage to underground buildings, damage to infrastructure after redistribution of soil, and change in water permeability of the soil layer and the flow path of groundwater, etc. [40,41,42,43,44]. H-type piles are a new type of bank protection structure; there are fewer studies on the soil squeezing effect of H-type piles at home and abroad, and it is not clear what kind of harm will be caused by the soil squeezing effect. Therefore, it is necessary to analyze the soil squeezing effect of the H-type pile in depth. Compared with the other three research methods, field tests have the advantages of higher authenticity and accuracy, which are suitable for complex geological conditions and can consider the problem comprehensively. Therefore, this paper relies on field tests to carry out the study of the H-type pile squeezing effect, analyze the parameters of pore water pressure and soil displacement of the soil around the H-type pile, and summarize the changes in pore water pressure and the distribution of soil displacement field of the H-type pile, which is of great significance for engineering application and provides a basis for the reduction in hazards of pile foundation construction.
In this paper, pore water pressure, soil horizontal displacement, and other parameters are selected as research parameters, combined with zoning theory and other theories to explain the experimental phenomena and summarize the law. The comprehensive study flowchart of this paper is shown in Figure 1.

2. Materials and Methods

The research methodology of the field tests was used in this study to obtain accurate results in a realistic and precise manner. Below are some descriptions of the test site, the materials and equipment used in the test, and the monitoring methods.

2.1. Testing Site

The site selected for this test is located between sections Z13′ and Z14′ on the left bank of the channel west of the newly built Zengjiafan bridge on the second phase of the Hujia-Shen line, which is easily accessible for drilling and burying of instruments. The total length of this channel section is 450 m, and the channel is upgraded according to the planning standard of a Class III channel, with a bottom width of 45 m and a water depth of 3.2 m. The location of the test site is shown in Figure 2.
The test site is located in the Hangjia Lake alluvial plain, the terrain is flat and low-lying, and its surface elevation is between 1.26~3.76 m. According to the “Geotechnical Engineering Investigation Specification” GB50021-2009 (2009) [45] geological investigation, ground investigation data show that the test site is divided into 5 layers within the depth of the test:
(1) Plain fill soil:
Brownish gray, mainly clayey soil, mixed with crushed stone, concrete, etc., the nature of the soil is not uniform. The thickness of the layer is 2.0~2.4 m, mainly distributed on the surface.
(2) Powdery clay:
Gray, soft plastic. There are no laminations, the cut surface is smooth, and the nature of the soil is uniform. The layer thickness is 3.9~4.6 m, and the depth of the top plate is 2.0~2.4 m.
(3) Powdery clay:
Gray or gray-yellow, plastic, with glossy cut surface and local roughness. The thickness of the layer is 2.7~3.2 m, and the depth of the top plate is 6.3~6.8 m.
(4) Powdery soil:
Gray-yellow, gray, very wet, slightly dense. There is no stratification, containing mica and a few shell debris, with a rough cut surface. The thickness of the layer is 6.9 m, and the depth of the top plate is 9.5 m.
(5) Powdery clay:
Gray, hard plastic, glossy surface, locally rough, thick layer. The layer thickness is more than 3.6 m, and the depth of the top plate is 16.4 m.
According to the “Geotechnical test method standard” (GB/T50123-2019) [46] indoor geotechnical test, the main physical and mechanical properties of each layer of soil are shown in Table 1 below.
In general, the terrain along the channel where the test site is located is relatively low-lying, and the stability is generally good, but a small portion of the area has subsidence, which is mostly due to the original revetment wall using dry masonry and the topsoil is subjected to scouring caused by the dual action of surface water and groundwater.

2.2. Materials and Construction Methods

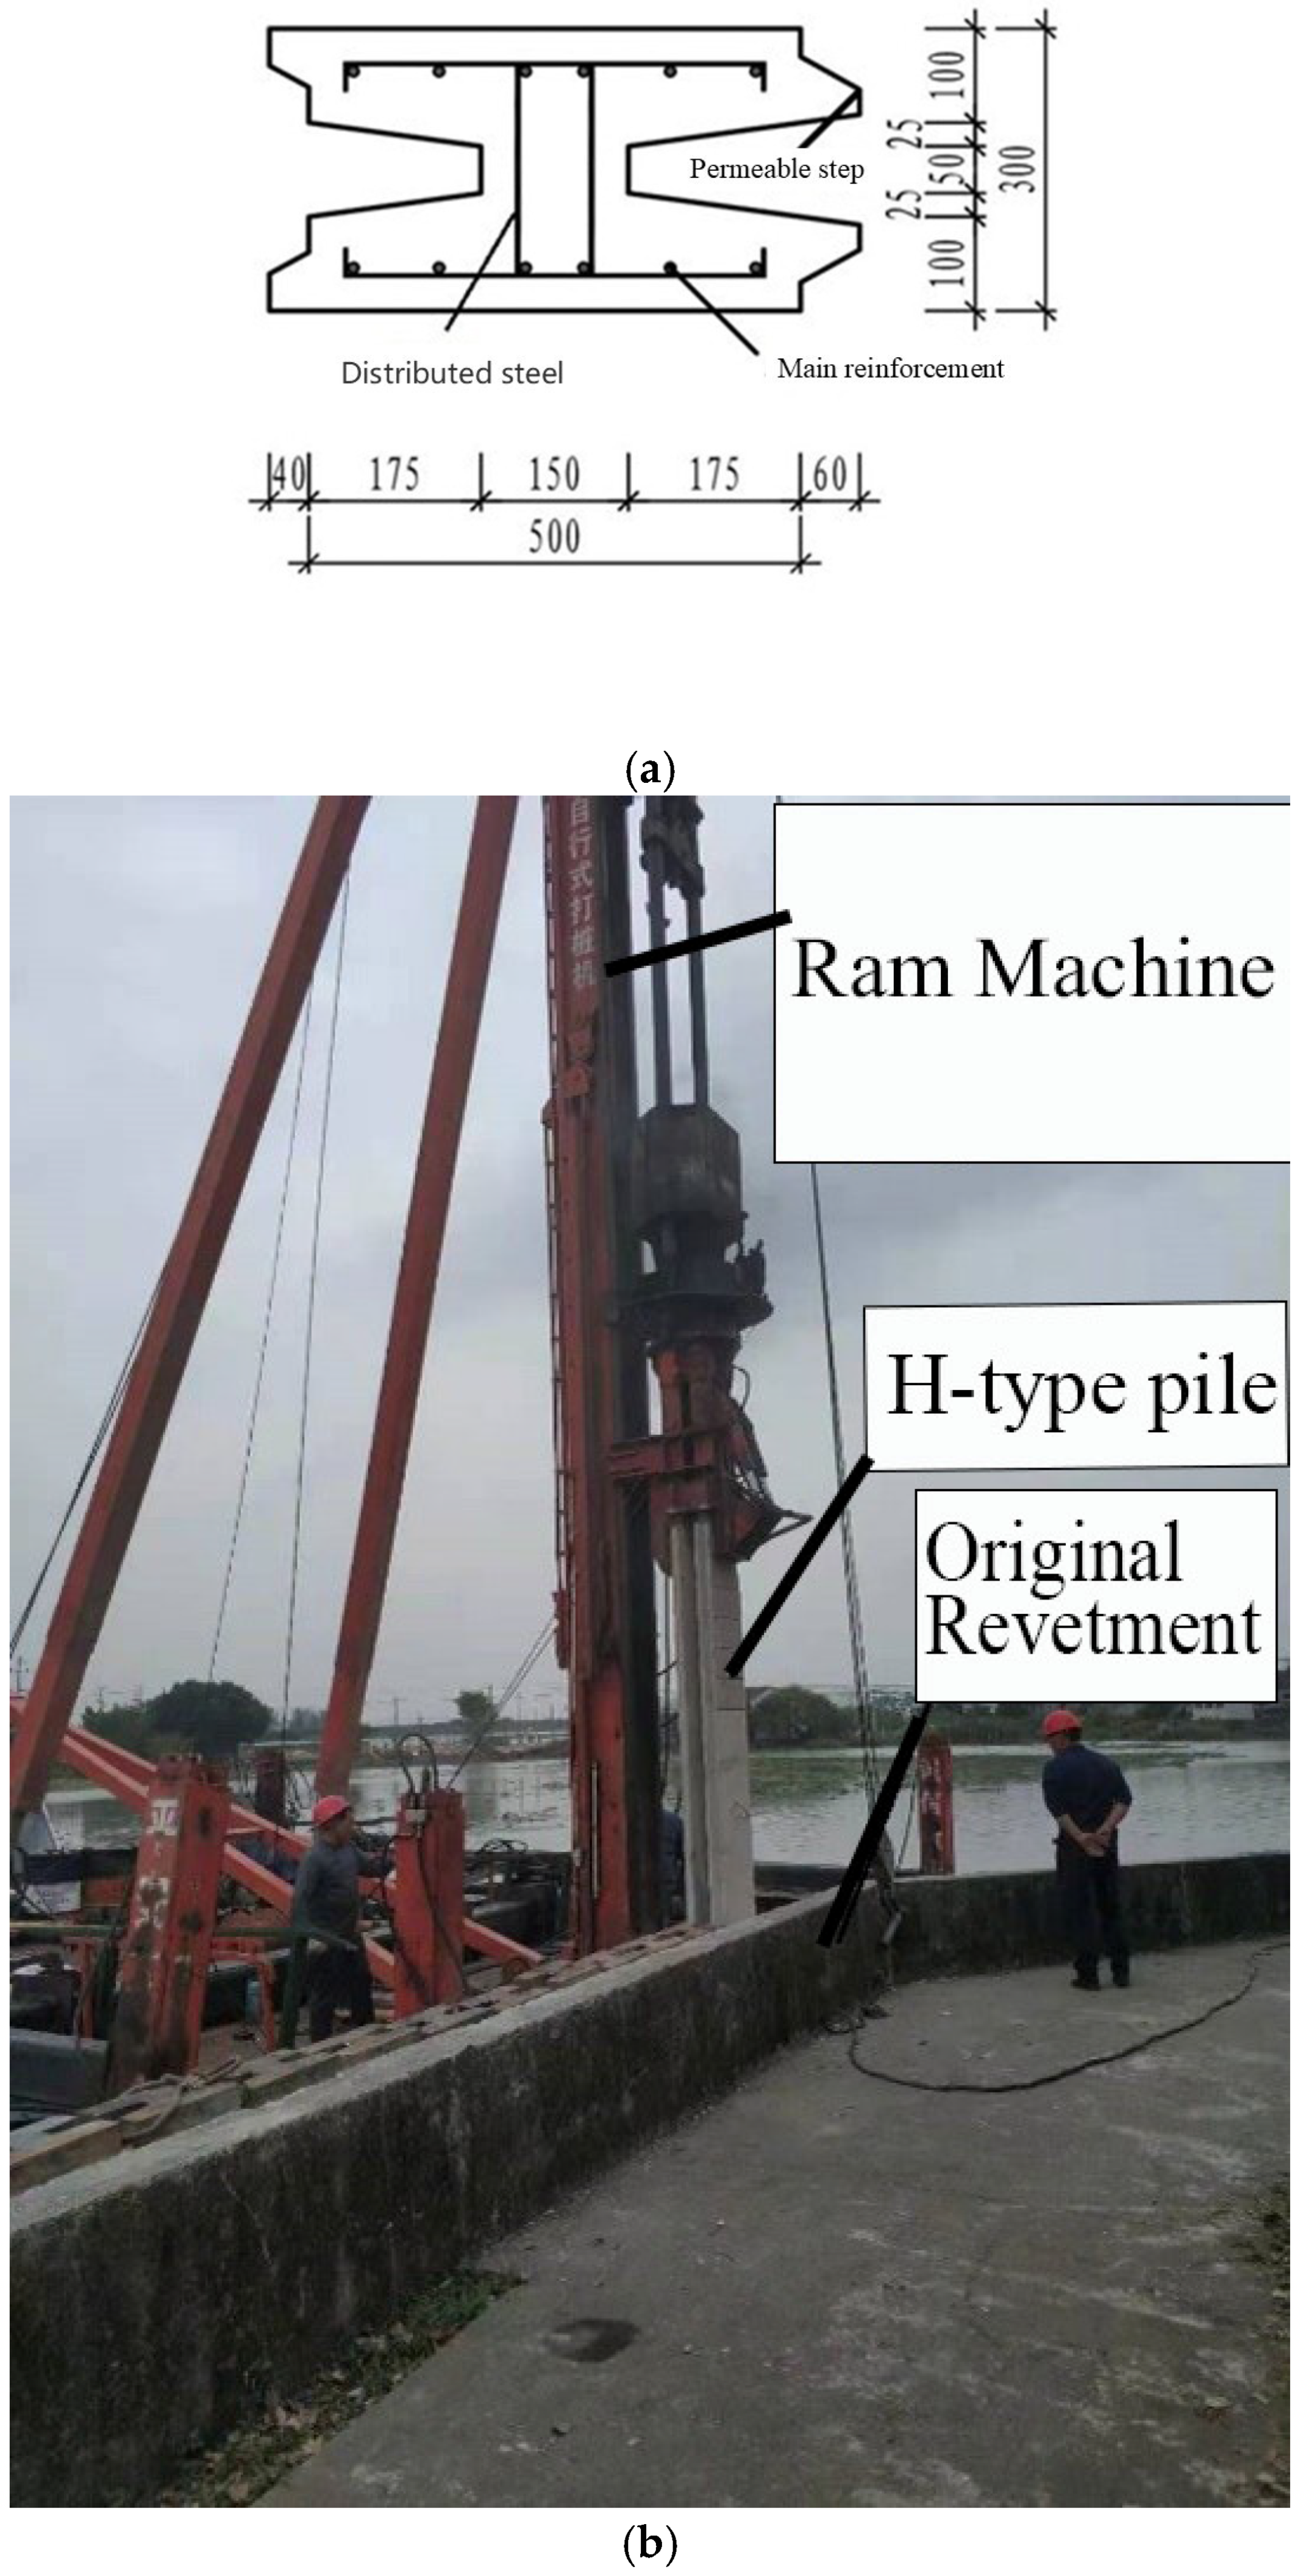
The field test piling process adopts the AHGF60-16 amphibious waterway piling vessel (Shandong Haiding Shipbuilding Co., Ltd., Weifang, China), and the specific parameters of the piling machine are shown in Table 2 below. The pile sinking method adopts the hammering method, and the end plate and steel collar are set at the pile head to improve the construction quality. The piles used in the test are H-type piles, which are 8 m in length, with a cross-section of 300 × 500 mm. According to the predicted soil squeezing effect range of this test, a total of 19 piles are driven, and according to the order of piling, the piles are numbered as piles No. 1~19 in order, and the 19 piles required for this test are driven on the same day of the piling day. The schematic diagram of the H-type pile used in this test and its field test are shown in Figure 3a,b.
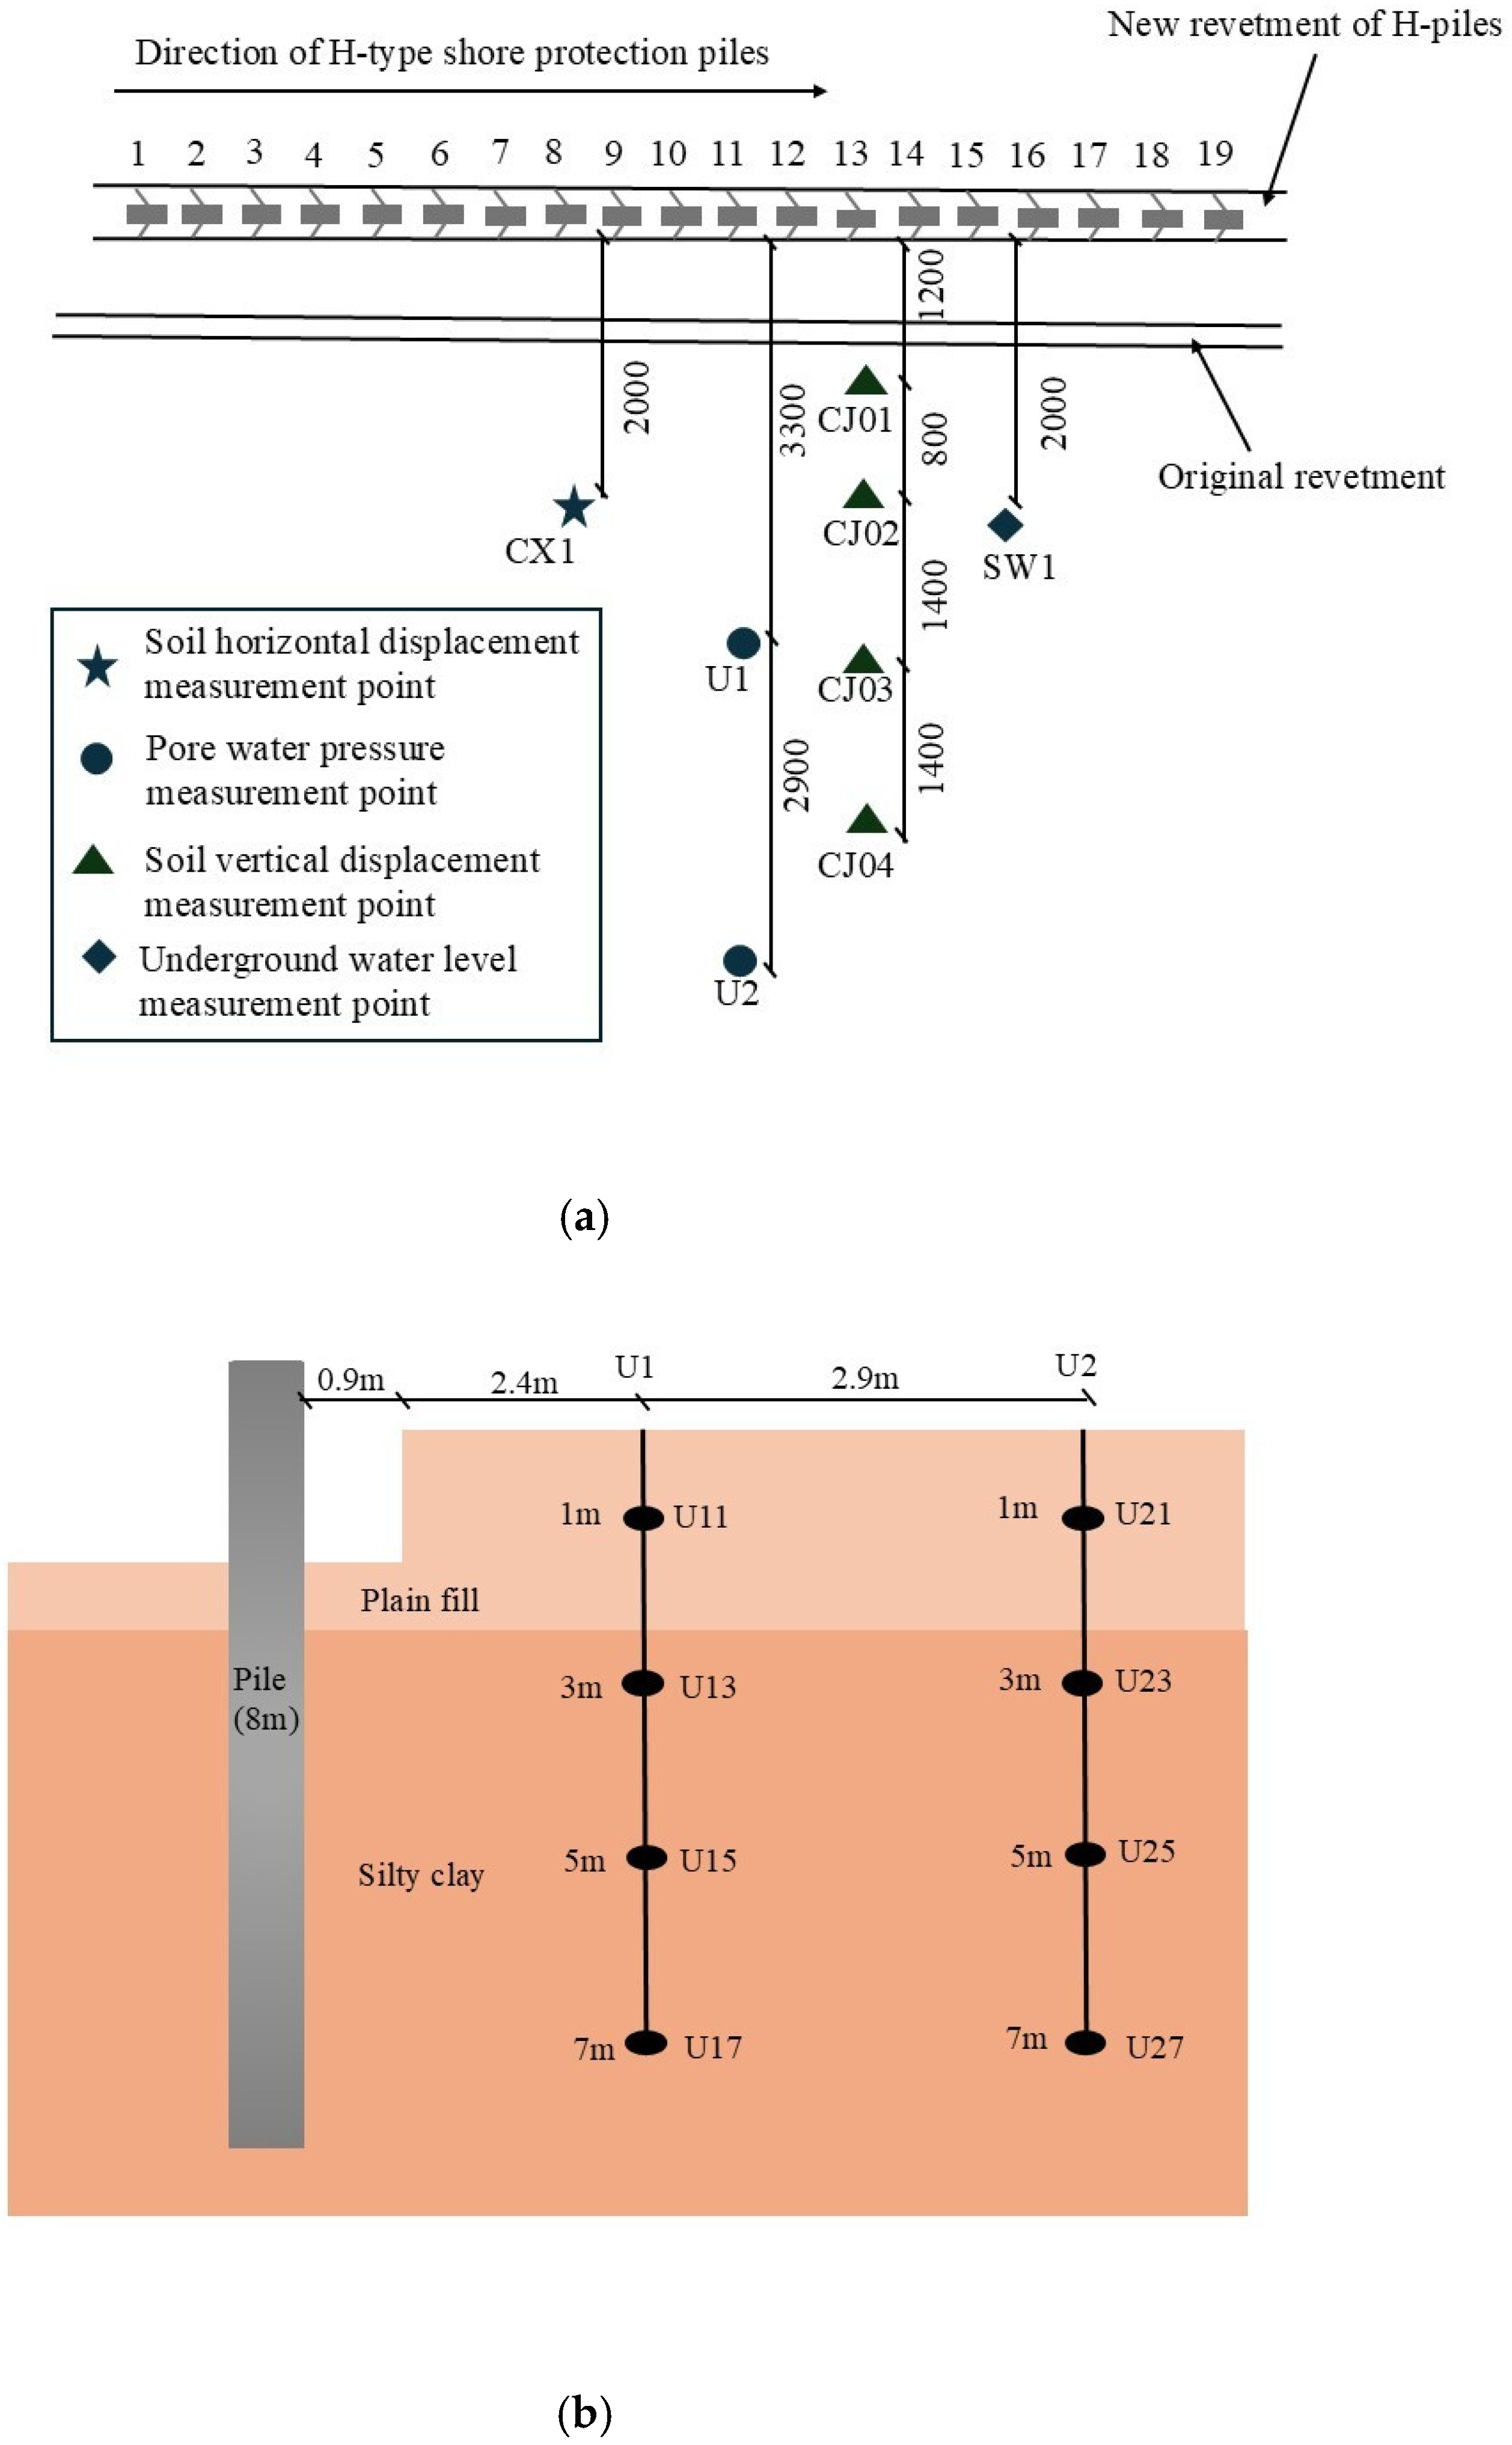
To investigate the change rule of pore water pressure and soil displacement caused by the soil squeezing effect during pile driving of H-type pile, a total of 4 types of measuring points, including pore water pressure, soil horizontal displacement, soil vertical displacement, and groundwater level, are buried in the test, which are set according to the “Technical Standard for Monitoring of Construction Pit Engineering” GB 50497-2019 [47], and combined with the characteristics of this project and the relationship between pile diameters. The top view plan of each measurement point is shown in Figure 4a.
Pore water pressure measurement point layout: this test adopts the range of 0.3 MPa pore water pressure gauge (Beijing Hengrui Changtai Technology Co., Ltd., Beijing, China) in the distance from the H-type pile 3.3 m to set the first pore water pressure measurement, recorded as U1; in the distance from the H-type pile 6.2 m to set the second pore water pressure measurement, recorded as U2. In order to prevent the penetration caused by the buried pore water pressure gauge drilling, the spacing between pore water pressure gauges is easily larger than 1 m, so 1 pore water pressure gauge is buried in each pore water pressure gauge at 1 m, 3 m, 5 m, 7 m from the ground surface. The pore water pressure gauges in the U1 measurement place are labeled as U11, U13, U15, and U17 from the top to the bottom, and the pore water pressure gauges in the U2 measurement place are labeled as U21, U23, U25, and U27 from the top to the bottom. The buried profile of the pore water pressure gauge is shown in Figure 4b. Because the vibration effect brought by the hammering method will cause a significant increase in pore water pressure, in order to study the change process in detail, it is necessary to continuously monitor the pore water pressure during the pile driving period. During pile driving of the preset 19 piles, the measurement of pore water pressure is carried out once for each pile; at the same time, in order to consider the change rule of pore water pressure in the depth direction in detail, continuous measurement is carried out at measurement point U17 during pile driving of pile No. 11, and constant measurement is carried out at measurement point U27 during pile driving of pile No. 12; after the completion of pile driving, the measurement is carried out once a day, and the change in pore water pressure is observed, and the change in amplitude becomes small. The monitoring period should be expanded appropriately.
Layout of soil horizontal displacement measurement points: The monitoring of soil horizontal displacement uses a PVC pipe with a diameter of 70 mm as an inclinometer tube (Jintan Wenxiang Sensor Factory, Changzhou, China), and its inner wall has two pairs of mutually perpendicular guide grooves with a depth of 3 mm. Due to the existence of the original revetment, an inclinometer tube is buried 2 m away from the H-type revetment pile. The hole measurement point number is recorded as CX1, and the inclinometer tube is buried at a depth of 14 m. Through the inclinometer tube, the specific horizontal displacement of the soil at each depth of 0.5 m from 0.5 m to 14 m can be measured. The initial value of the horizontal displacement of the soil is taken from the reading one day before the revetment construction. On the day of construction, a total of three measurements were made. During the pile sinking of pile No. 9 facing the inclinometer tube, in order to obtain more data in a shorter pile driving time, it is necessary to control the pile sinking rate and measure the horizontal displacement of the soil at each depth after the pile driving is completed, it is calculated once a day until the change is minor or even unchanged.
Layout of soil vertical displacement measurement points: The monitoring of soil vertical displacement uses a total station-type electronic distance meter (Changzhou Xinruide Instrument Co., Ltd., Changzhou, China). Firstly, an observation point is set far enough away from the construction, which is the reference point of vertical displacement monitoring, and at the same time, an observation point is set at 1.2 m, 2 m, 3.4 m, and 4.8 m from H-type pile, and a settlement nail is driven into it, which is recorded as CJ01~CJ04. Three times of monitoring are carried out on the same day of pile sinking, and after that, the settlement monitoring is carried out once a day, and the monitoring frequency is changed according to the gradual decrease in the vertical deformation, which gradually becomes 48 h once, 72 h once, and once a week until the change value of each measurement point is less than one time a week. Then, change the monitoring frequency according to the gradual decrease in vertical deformation, and gradually change it to once in 48 h, once in 72 h, and once in a week until the change value of each measuring point is less than the error value (0.15 mm), and stop monitoring.
Groundwater level measurement point buried: water level monitoring water level pipe selected for the 53 mm diameter PVC pipe (Shenzhen Oriental Wanhe Instrument Co. Ltd., Shenzhen, China), buried in the distance from the H-type pile 2 m, buried depth of 8 m. The top of the water level pipe is about 40 cm higher than the ground surface; at the same time, in order to prevent water vapor infiltration in the rainy weather and the influx of running water, you need to cover the water level pipe, so as to protect the water level pipe not to be affected. The groundwater level was measured once a day, 1 week before and 1 week after construction, 2 to 3 times on the day of construction to the monitoring section, and 1 to 2 times a week after 1 week. In order to ensure the accuracy of the measurements, each measurement should be taken twice, the results of the two measurements should be compared, and the average value should be taken if the discrepancy is not significant.

3. Results

3.1. Pore Water Pressure

Figure 5 is the excess pore water pressure dissipation diagram of pore water pressure measurement points U1 and U2. It can be seen from the figure that on the day when the H-type pile was driven into the soil, the excess pore water pressure increased rapidly and reached a peak value. The maximum value of the excess pore water pressure at the pore water pressure measurement point U1 appeared at the U17 measurement point, reaching 10.56 kPa, and the maximum value of the excess pore water pressure at the pore water pressure measurement point U2 appeared at the U27 measurement point, reaching 2.62 kPa. One day after the pile driving was completed, the excess pore water pressure at each measurement point at U1 and U2 dissipated rapidly, and the dissipation rate of U17 and U27 reached more than 85%. Subsequently, the excess pore water pressure slowly dissipated over time. After 20 days, except for the U1 measurement point, the excess pore water pressure at other pore water pressure measurement points can be considered to have been completely dissipated. It can be seen that the dissipation rate of excess pore water pressure after the piles are driven is not constant, but the dissipation rate is fastest on the first day after all the piles are driven and then enters a slow dissipation stage with some fluctuations.
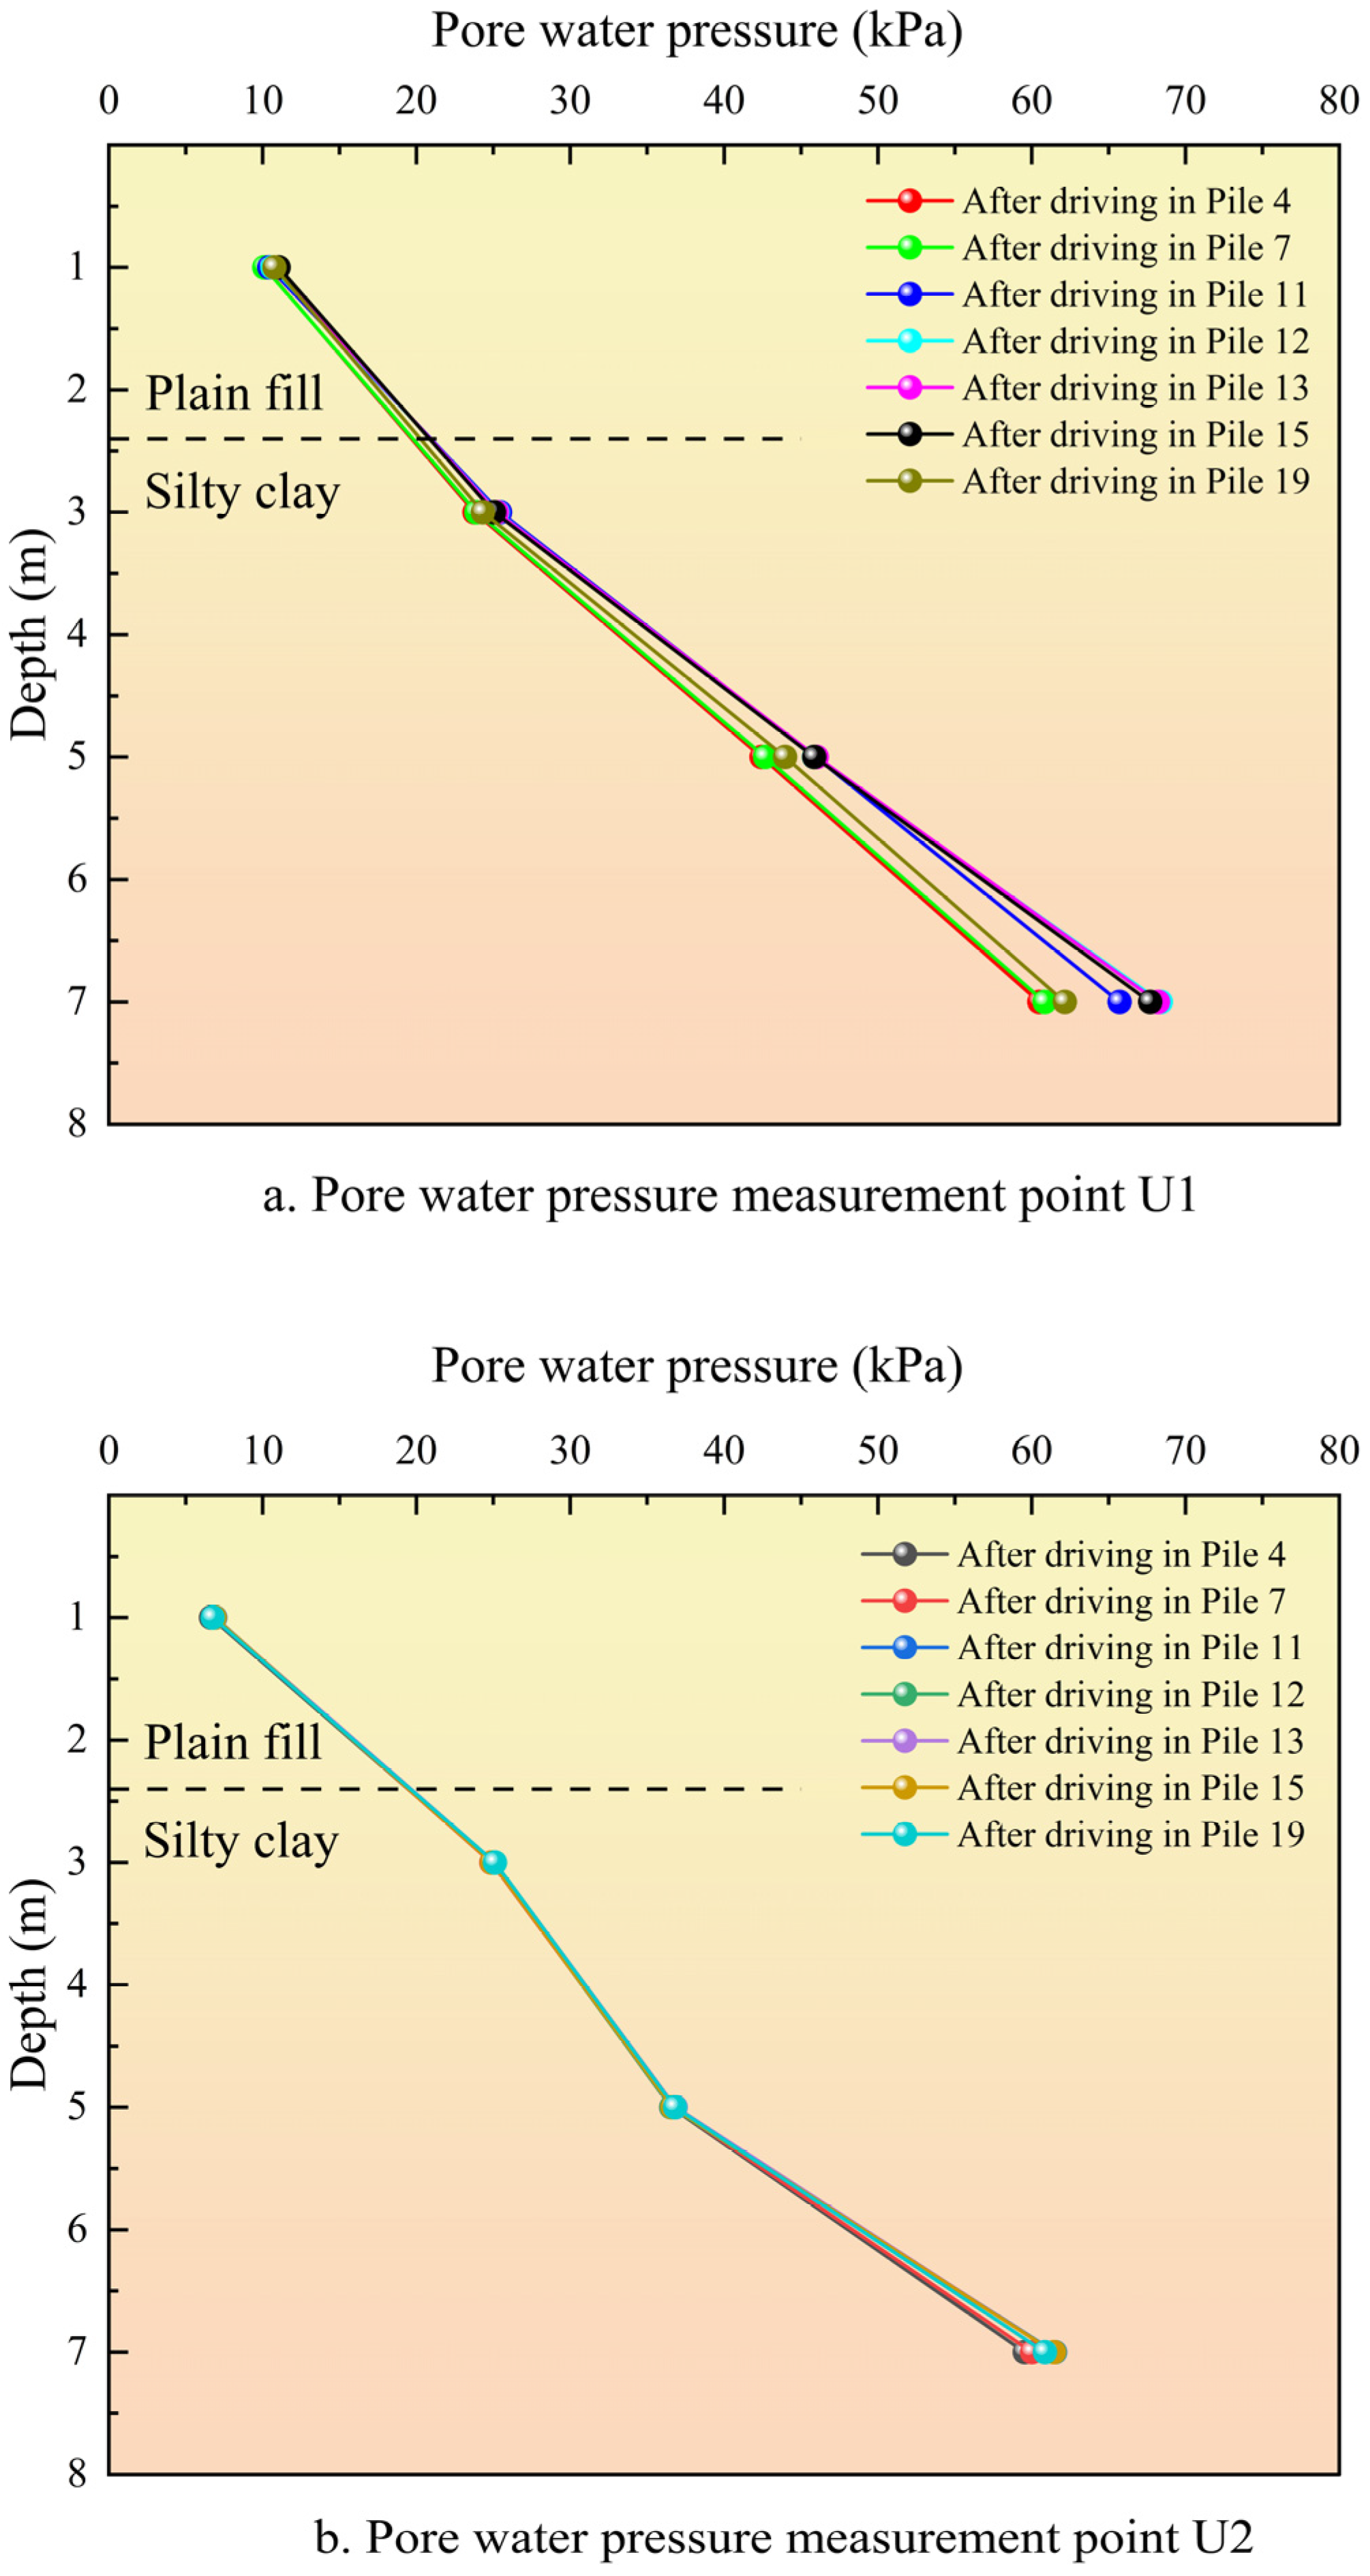
Because the soil squeezing effect of H-type pile is a spatial problem, in order to consider in detail the parameter change rule in the depth direction of the soil squeezing effect, this test focuses on the continuous measurement of pore water pressure during the driving of H-type shore protection piles, and Figure 6 shows the curve diagram of the change in pore water pressure along the depth on the day of the driving of the piles in the measurement points U1 and U2 of the pore water pressure force. As can be seen from Figure 6, the pore water pressure value at point U11 is about 10 kPa, the pore water pressure value at point U13 is about 25 kPa, the pore water pressure value at point U15 is about 42 kPa, and the pore water pressure value at point U17 is more than 65 kPa. The value of the pore water pressure at the pore water pressure measurement point U1 increases with the increase in the depth of the measurement point, and the same response relation is found for the pore water pressure at the measurement point U2. This shows that the response of pore water pressure is closely related to depth.
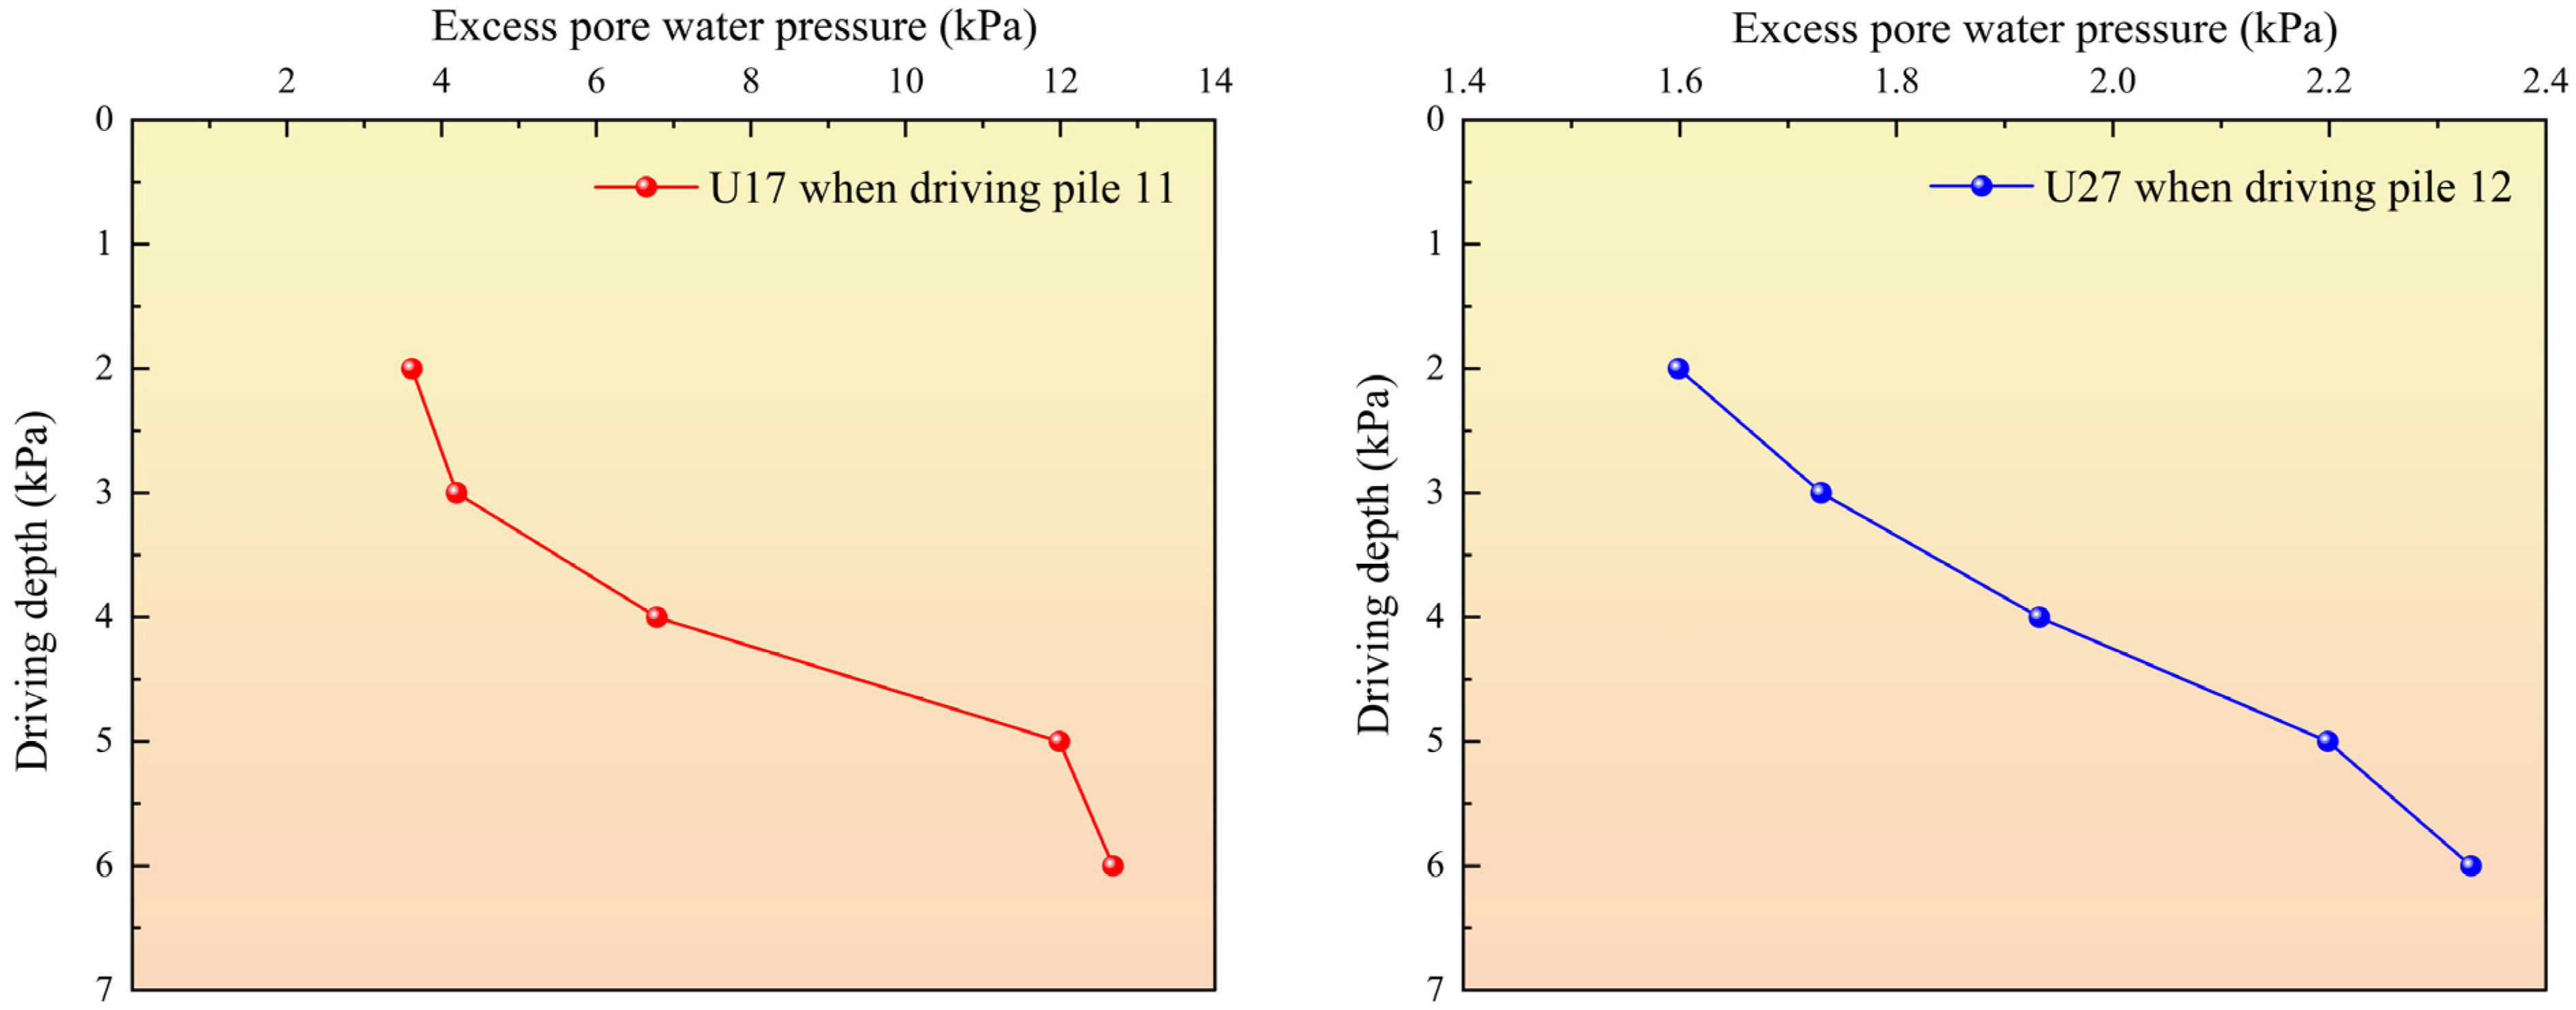
In order to further investigate the corresponding relationship between the pore water pressure and the driving depth, this test was conducted to continuously measure the measurement point U17 during the driving of pile No. 11 and the measurement point U27 during the driving of pile No. 12. As can be seen from Figure 7 (with the depth of penetration below the surface of the pile-driving place as the vertical coordinate), during the penetration of pile No. 11, the excess pore water pressure at U17 did not change significantly when the pile was driven into the soil body from 2 m to 3 m and from 5 m to 6 m, and the excess pore water pressure in the range of 3–5 m of the pile-driving increased from 4.21 kPa to 11.98 kPa. During the penetration of pile No. 12, the excess pore water pressure increased from 1.60 kPa to 2.33 kPa during the whole process. The increase in excess pore water pressure is much smaller than the excess pore water pressure at the U17 measurement point, resulting in the trend of excess pore water pressure change is not as obvious as that of U17. This indicates that there is a certain relationship between the rate of change in pore water pressure at a certain point in the soil and the drilling depth.
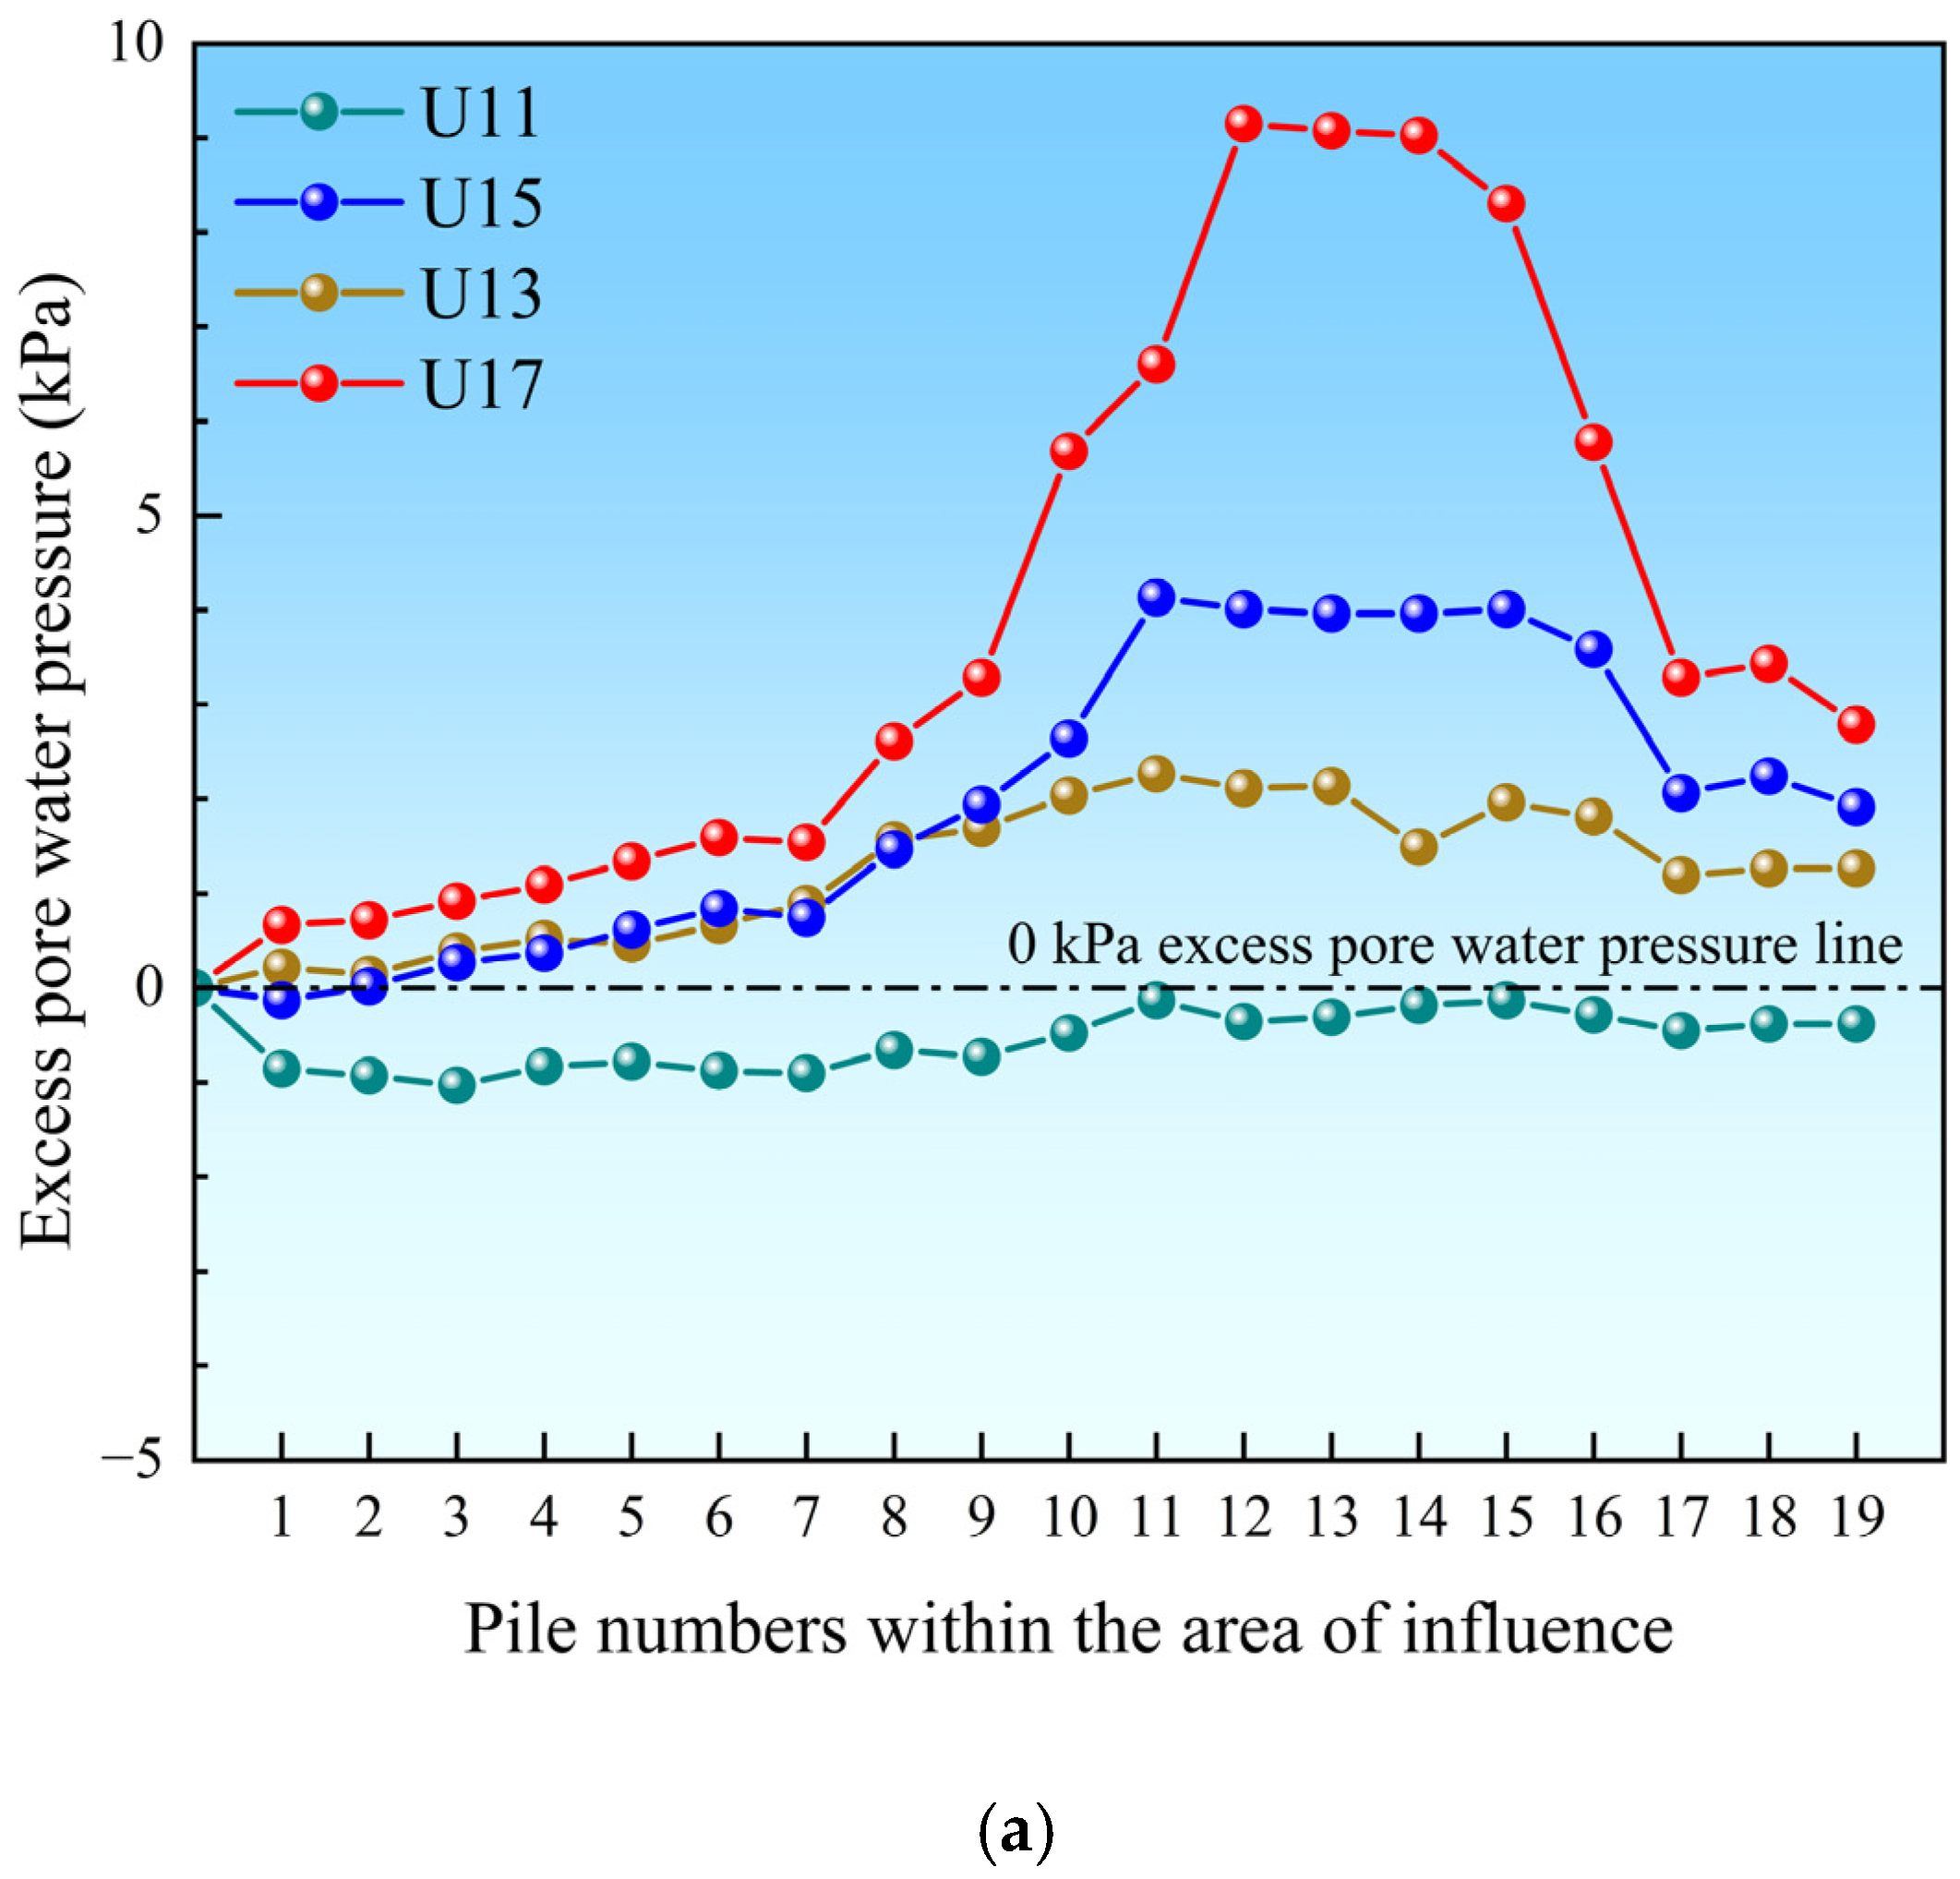
As shown in Figure 8, when drilling H-type piles No. 1~12, the pore water pressure measurement points U11~U17 and U21~U27 are increasing, among which, when drilling H-type piles No. 1~7, the excess pore water pressure value of each measurement point grows slowly, and the maximum excess pore water pressure value of pore water pressure measurement point U1 appears at measurement point U17, with the maximum value of 1.94 kPa, and the maximum excess pore water pressure value of pore water pressure measurement point U2 appears at measurement point U27, with the maximum value of 1.27 kPa. During the drilling of H-type piles No. 7~12, the excess pore water pressure value of each point increased rapidly, the maximum excess pore water pressure value of U1 appeared at point U17, and the maximum value of U1 was 9.35 kPa. The maximum value of pore water pressure at U2 is at U27, and the maximum value is 2.73 kPa. When piles 13~19 are driven in, the excess pore water pressure at each measurement point starts to decrease gradually and stabilize, which indicates that the response of pore water pressure is closely related to the distance of the pore water pressure measurement point from the construction pile.

3.2. Soil Displacement

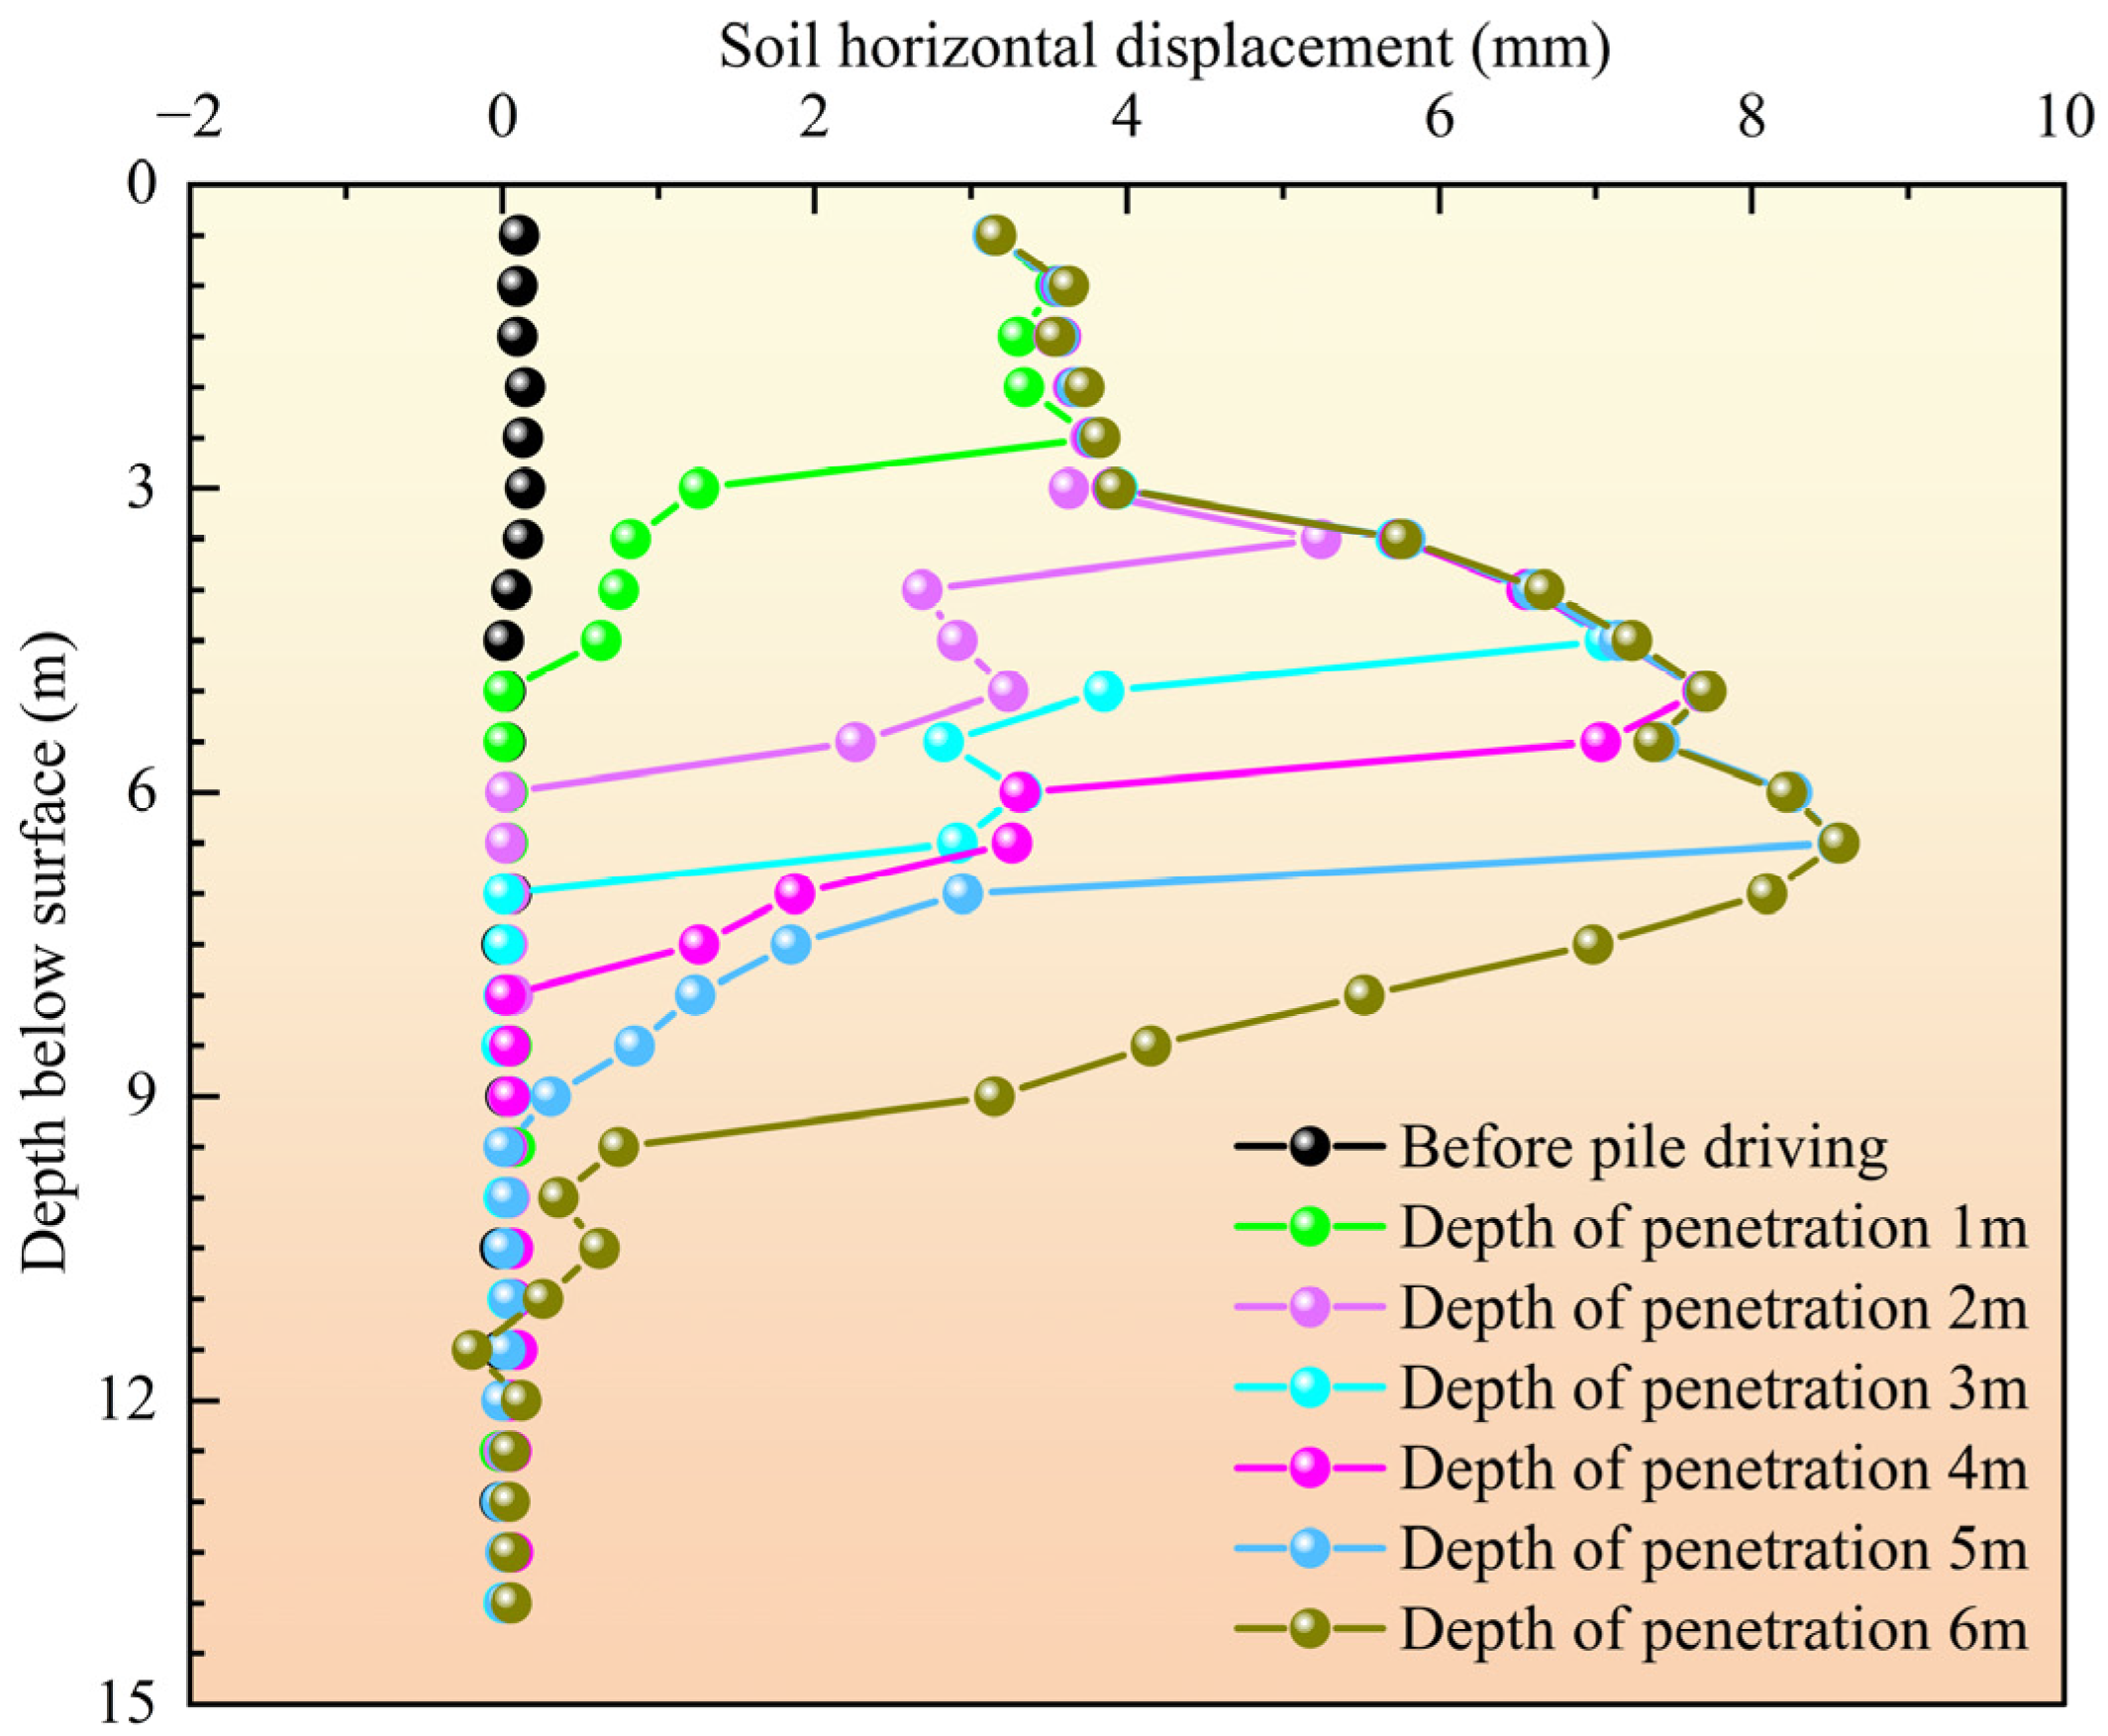
In order to study the change in soil horizontal displacement at each depth during the piling process, the pile sinking speed was controlled during the driving of the No. 9 pile, and the change in soil horizontal displacement during the driving of the No. 9 pile was studied. Figure 9 (with the depth below the shore surface as the ordinate) shows the change in soil horizontal displacement at each depth when the H-type pile was driven into the soil from 1 m to 6 m. As shown in Figure 9, the change law of soil horizontal displacement at different depths is basically the same as the increase in driving depth. Taking the change in horizontal displacement at each depth when the pile is driven into 1 m as an example since the surface at the piling location is 1.7 m lower than the shore surface when the pile sinking starts and the pile bottom just touches the soil surface at the piling location, it is equivalent to the elevation of the pile bottom being 1.7 m below the shore surface. When the H-type pile is driven into the soil to a depth of 1 m, the pile bottom is located 2.7 m below the shore surface. It is found that the soil horizontal displacement changes most dramatically in the soil from 0 to 2.5 m below the shore surface, and the soil horizontal displacement changes suddenly at the depth of the pile bottom. There is a slight change in the section from 2.5 m to 5 m, and the horizontal displacement of the soil does not change after 5 m. This shows that there is a correlation between the change in the horizontal displacement of the soil and the depth of the pile. On the other hand, during the continuous driving of pile No. 9 into the soil, the horizontal displacement of the soil above the bottom of the pile will continue to increase, but it is relatively limited. The maximum cumulative horizontal displacement at each depth when pile No. 9 is just driven in is not much different from the value when the bottom of the pile is just driven in. Among them, the cumulative horizontal displacement at a depth of 6.5 m is the largest, reaching 8.51 mm. The rule of small at the top and bottom and large in the middle has been reflected in the process of piling. At the same time, the soil below 10 m is almost unaffected or less affected. It can be seen that for this test, the vertical influence range of the driving of H-type piles on the horizontal displacement of the soil is within 10 m below the shore surface.
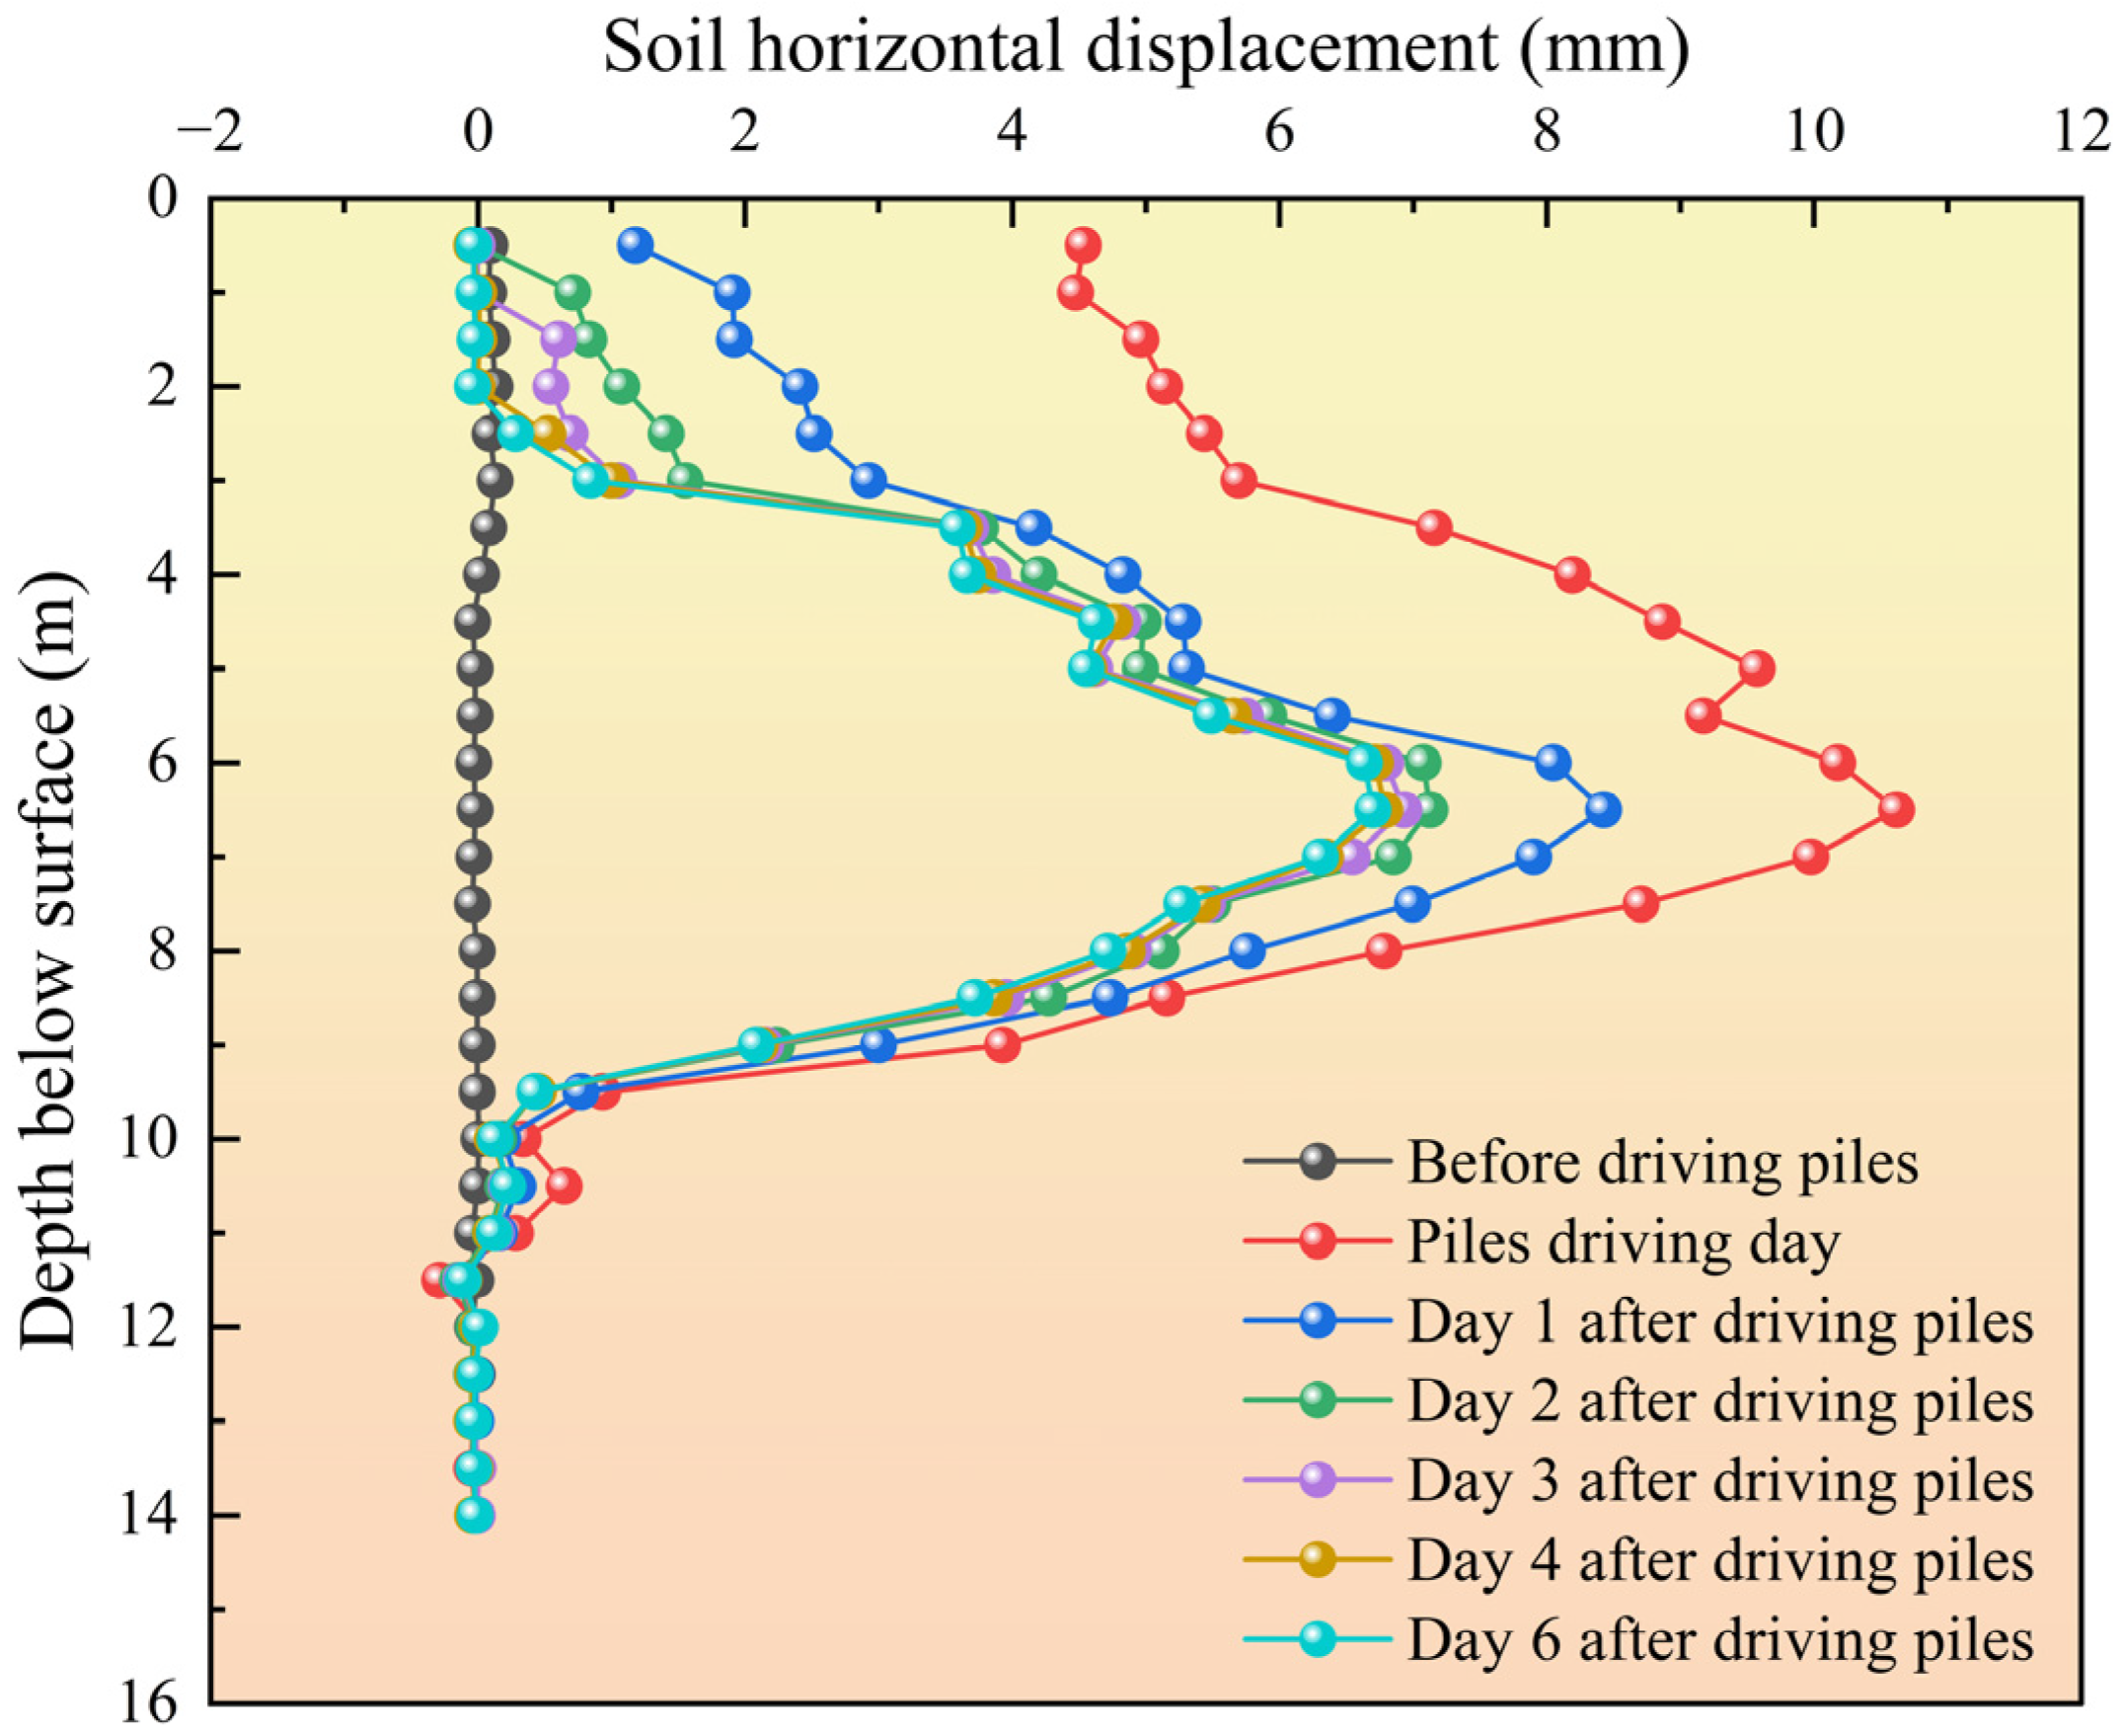
As shown in Figure 10, the soil horizontal displacement is still increasing after the completion of driving pile No. 9, which is directly opposite to the horizontal displacement measurement point, and then continuing to drive the subsequent H-type piles after the completion of driving pile No. 15, the cumulative horizontal displacement at all depths reaches the maximum value at that stage, and the cumulative horizontal displacement at 6.5 m reaches the maximum value of 10.63 mm, and the soil horizontal displacement in this section is measured once more after the driving of pile No. 19 The horizontal displacement of the soil in this section was measured again after pile 19 was driven in, and the soil at all depths experienced different degrees of backward displacement, while the pattern in the depth direction remained unchanged. This indicates that the construction of neighboring piles has an effect on the soil horizontal displacement in this section, and this effect will be reduced as the construction gradually moves away from the section.
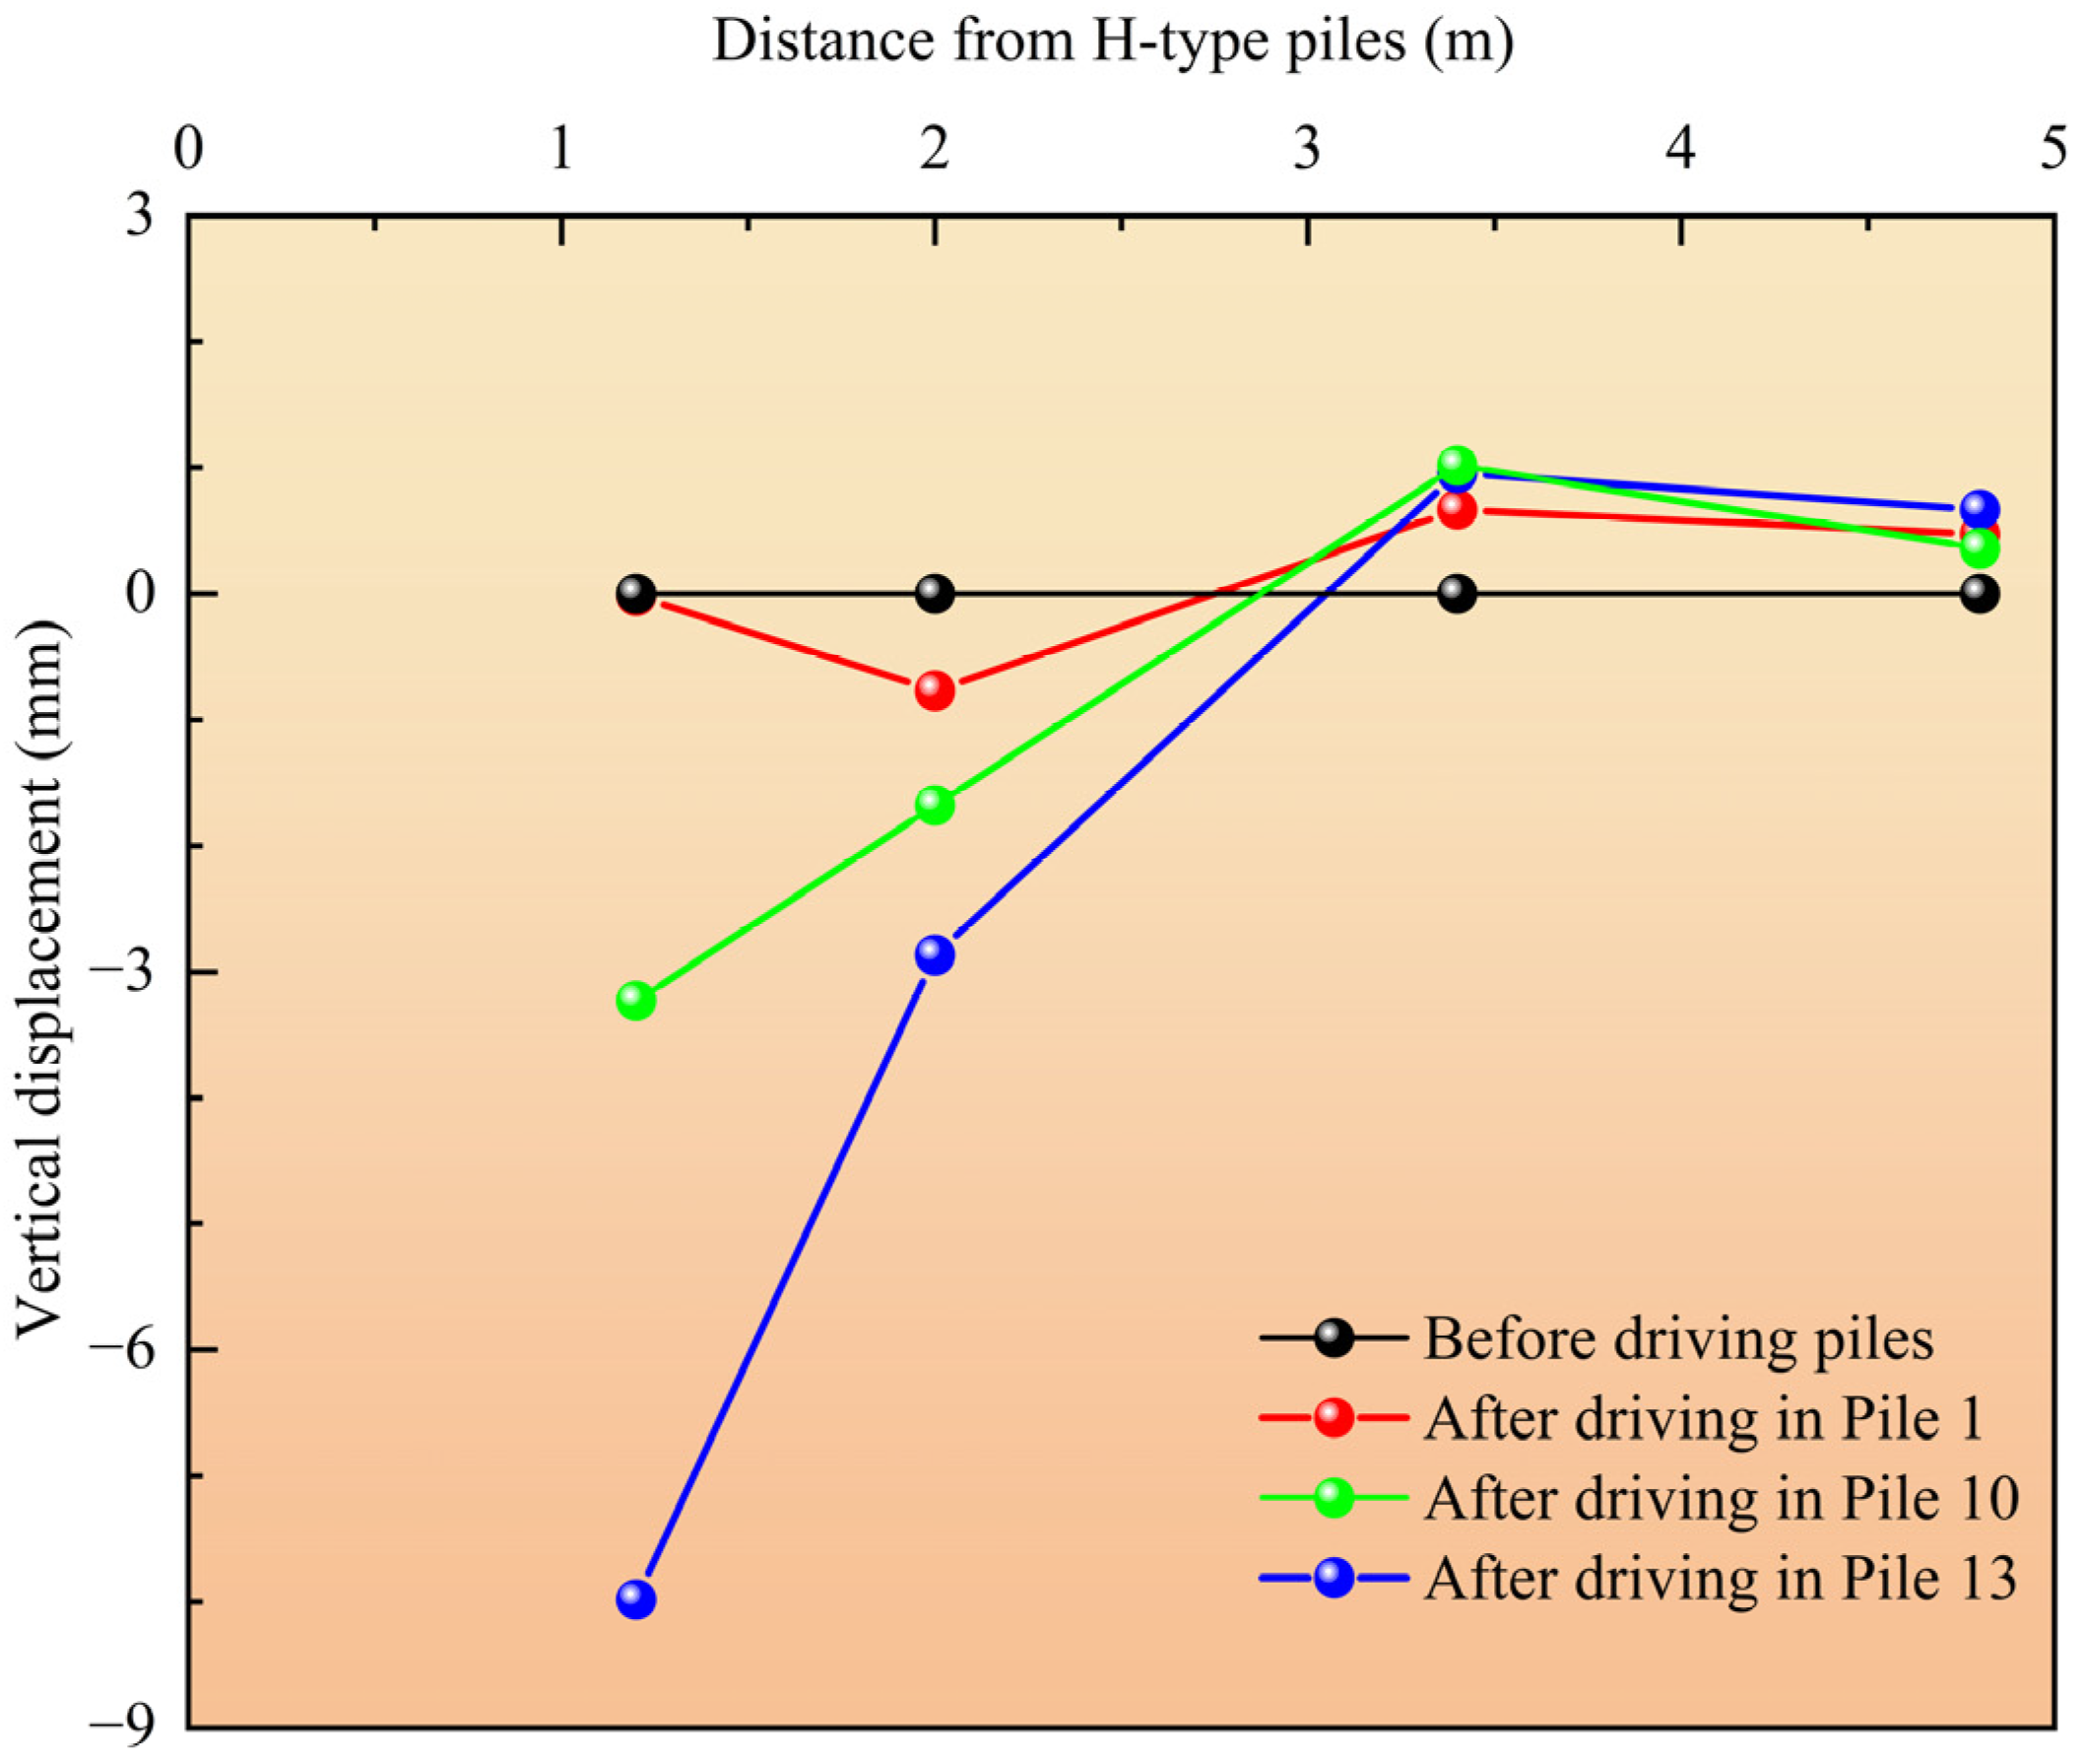
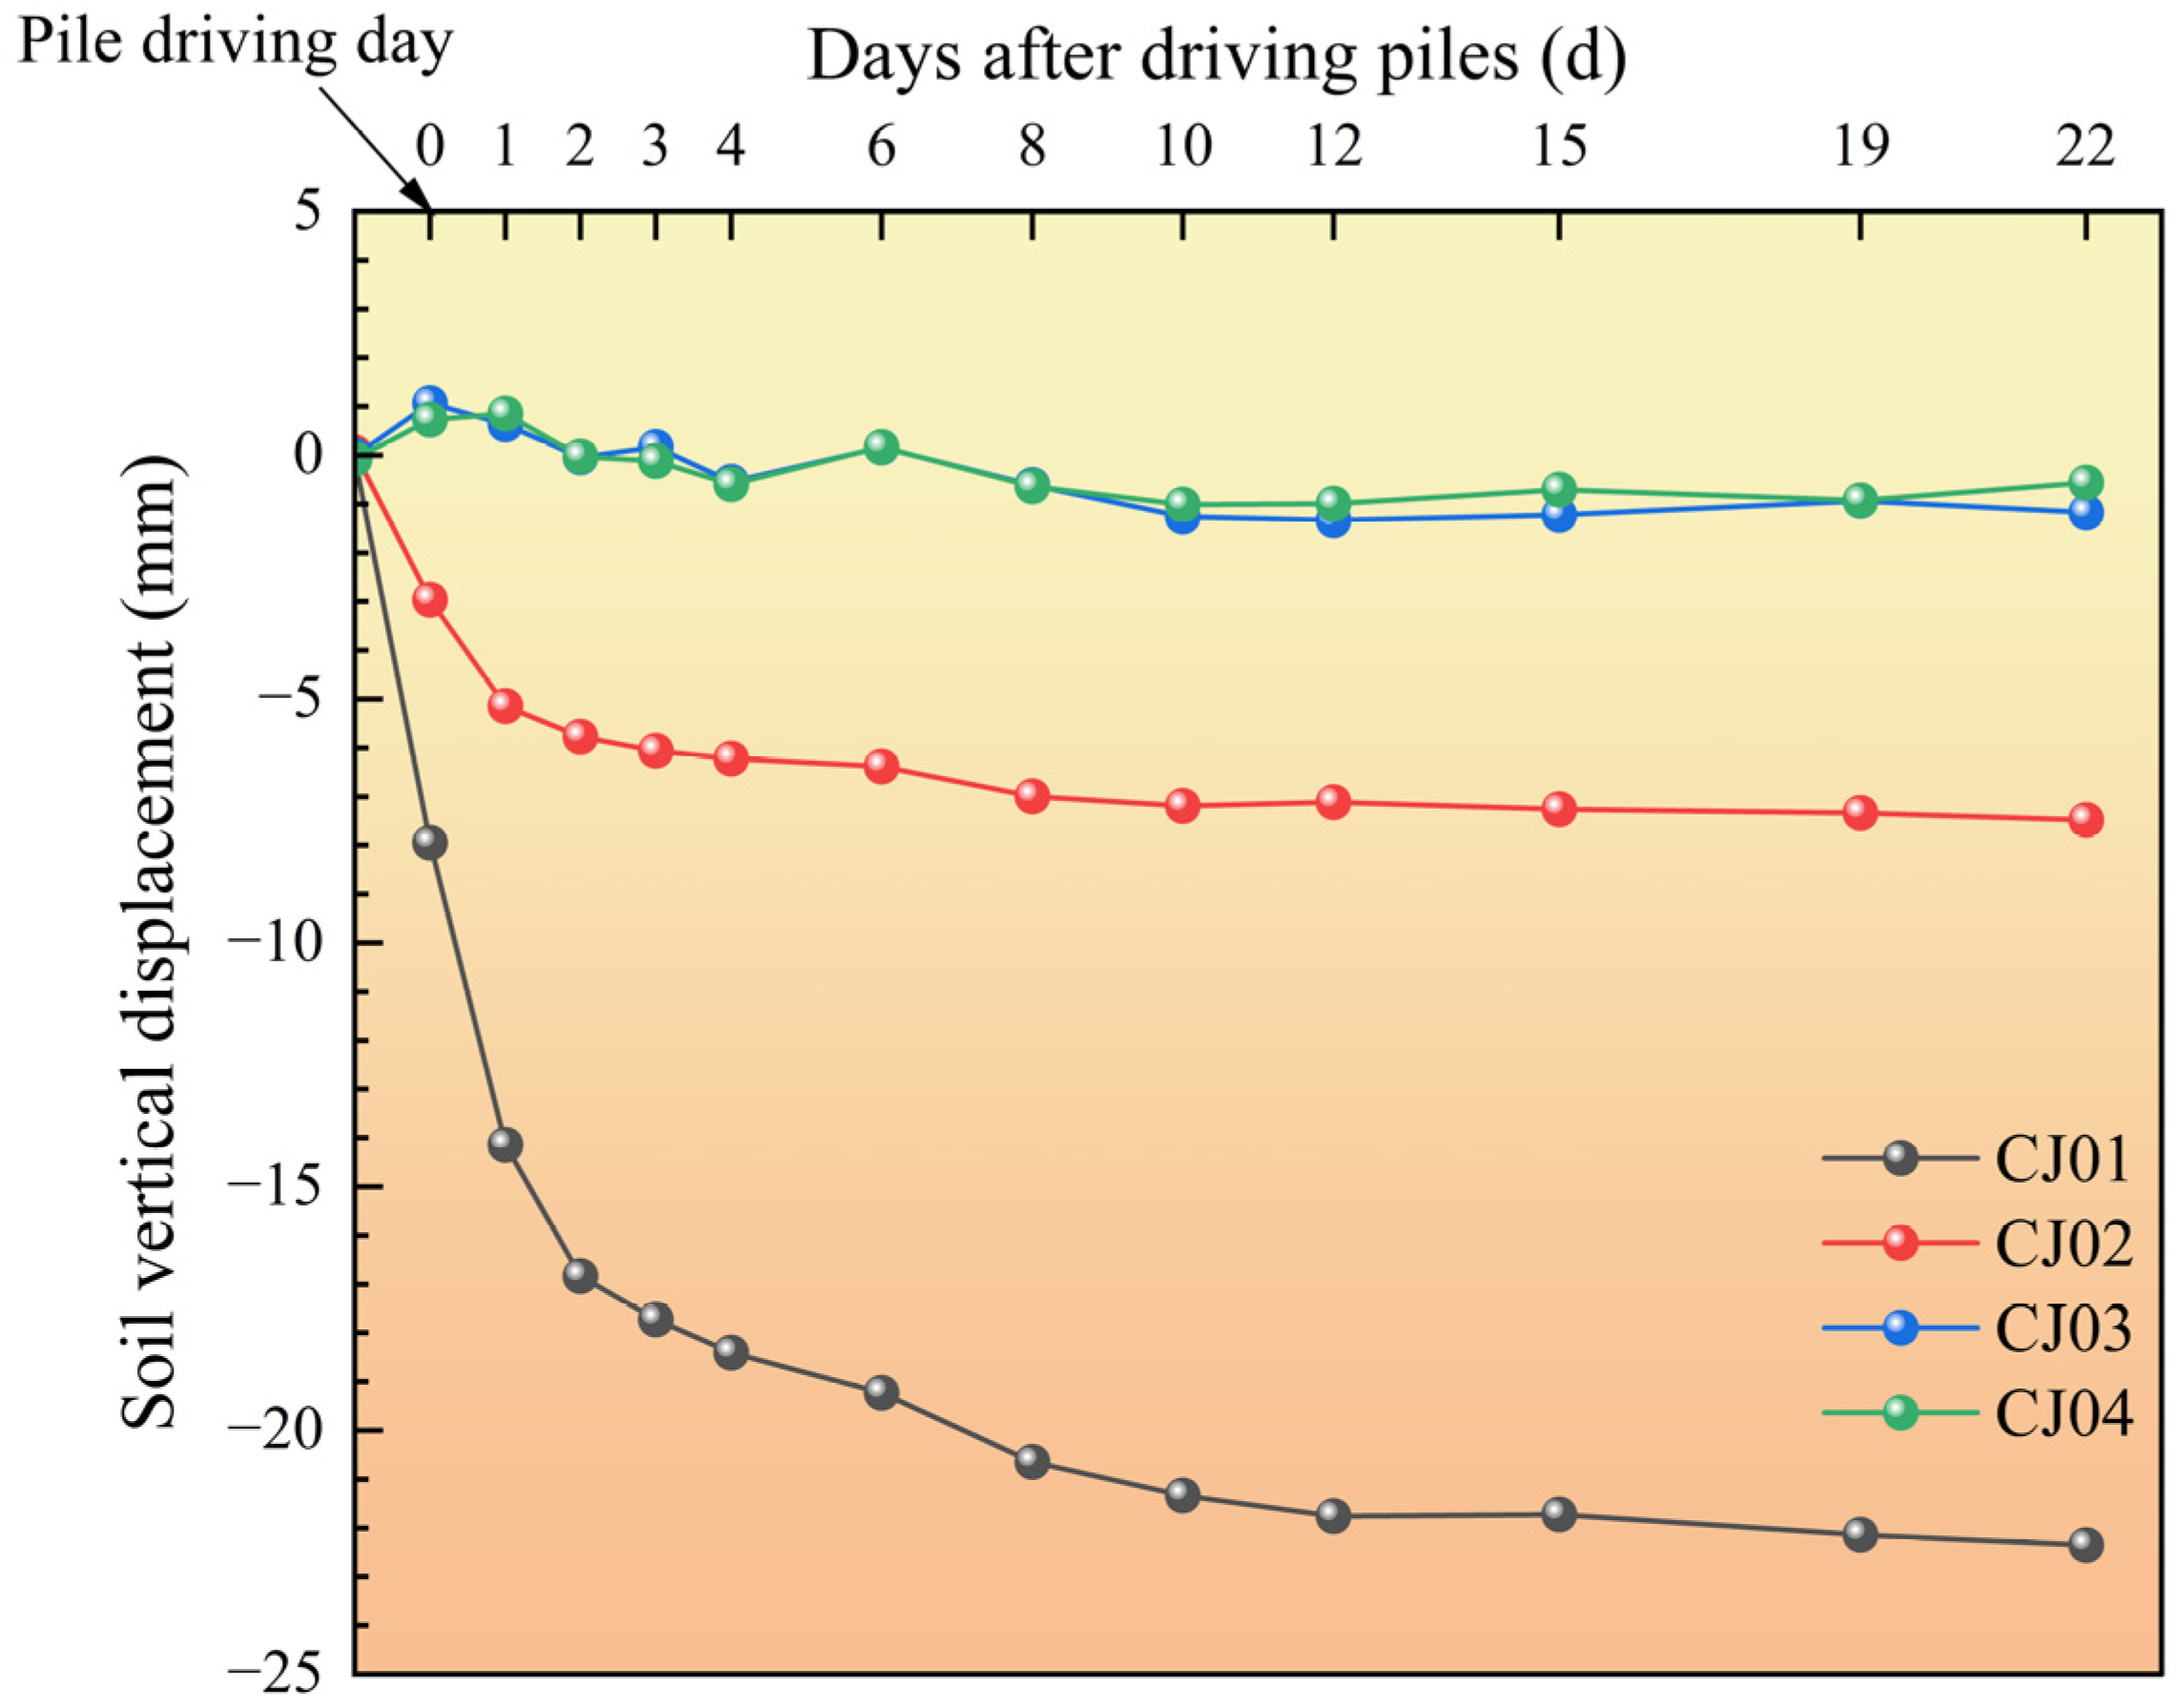
H-type pile, as an extruded soil pile, in the process of replacing the soil, in addition to the horizontal extrusion of the soil, will also make the soil vertical displacement; Figure 11 shows the vertical displacement of the soil during the piling period, it can be found that the vertical displacement of the soil at the measurement points did not all show the same performance, the vertical displacement of the soil at the measurement points of CJ03 and CJ04 was positive (bulge), while the vertical displacement of the soil at the measurement points of CJ01 and CJ02 was negative (subsidence) and the settlement of CJ01 is greater than that of CJ02.

4. Discussion

This field test investigated the soil squeezing effect induced by the pile driving process of H-type piles, focusing on data monitoring and analysis of soil pore water pressure, soil horizontal displacement, and soil vertical displacement.

4.1. Analysis of Results of Soil Squeezing Effect Manifested on Pore Water Pressure

When the H-type pile is driven into the soil using the hammering method, the pile will produce extrusion on the surrounding soil, which makes the pore water pressure of the surrounding soil increase rapidly and produce excess pore water pressure, and at the same time, the soil displacement produced makes the soil produce many horizontal or vertical cracks to form a good seepage and drainage channel [48]. Also, due to the close arrangement between the H-type piles it exacerbates the excess pore water pressure increase, which makes the pore water pressure at this point in time. The balance between the pore water pressure and the external extrusion pressure is broken, and the pore water pressure in the soil unit is much larger than the extrusion pressure received externally, which makes the pore water discharged outward, and the excess pore water pressure decreases rapidly. As the pore water is discharged, the pore water pressure gradually decreases, and the difference between it and the external squeezing pressure decreases, which makes the rate of pore water discharging outward decrease, and the rate of dissipation of the excess pore water pressure is also small. On the other hand, before piling, the soil particles in the soil body would have had strong cementation between them, which inhibited the excess pore water pressure, whereas the construction method of hammer piling greatly weakened the cementation between the particles [49] and thus made the generation and dissipation of excess pore water pressure very fast, which explains the inconsistency of the generation and the before-and-after dissipation rates of the excess pore water pressure in Figure 5. Ultimately, the excess pore water pressure dissipated completely in about 20 days, which is consistent with the related results of Yang [50] and Li [51] on the soil squeezing effect of PHC piles, and the soil they tested was also a pulverized clay soil. Regarding why the fluctuation of pore pressure value occurs during the subsequent dissipation of excess pore water pressure, this paper believes that it is related to the groundwater level and the river water level. Usually, the river water level and the groundwater level are not equal to each other, but they are able to have mutual influence. This project is on the bank, so the rise and fall of the river water level have an important influence on the rise and fall of the groundwater level in the soil body. While conducting this test, the groundwater level varied between −1.06 m and −0.71 m before pile sinking, and this variation kept the same trend with the variation in the river water level, and the groundwater level was slightly lower than the river water level. On the day of piling, three measurements of the groundwater level were made: at 13:00, when piling No. 9 was driven, the absolute elevation of the groundwater level exceeded the river level, compared with the measurement value of the previous day, the groundwater level rose by 0.11 m. At 17:00, when piling sinking was carried out to piling No. 19, the measurement was made again. The groundwater level was already lower than the river level, and the changes in the groundwater level and the river level were consistent for several days after that; the groundwater level still varies between −1.06 m and −0.71 m and is slightly lower than the river level. The abnormal changes during pile driving indicate that the groundwater level was disturbed by pile driving. The relationship between the river water and groundwater becomes stable after this period, and the river water level increases abruptly when there is upstream water inflow and prolonged rainfall, and the evaporation of the river water in dry weather causes a slow decrease in the river water level, which is transmitted to the groundwater level, resulting in the same trend of the changes in the groundwater level and the river water level. When the groundwater level changes under the influence of the river level, according to the calculation method of static pore water pressure [52,53,54,55], the pore water pressure at a certain depth increases under the influence of a rising groundwater level, while the pore water pressure at a certain depth decreases under the influence of a falling groundwater level, which explains why, after the dissipation of the excess pore water pressure caused by the soil squeezing effect, the pore water pressure still fluctuates.
As shown in Figure 6, during the on-site piling process, when the H-type pile is just driven in, the lateral resistance and end resistance of the pile body is relatively small, so the penetration process is relatively smooth at the beginning, and the disturbance of the pile to the soil is relatively small. When the pile is driven downward, the end resistance increases significantly, and the depth of the pile body driven into the soil with one hammer blow becomes smaller, and the disturbance is more intense, which is reflected in the pore water pressure. That is, when the pile is just completed, the deeper measuring holes generally produce greater pore water pressure than the smaller measuring holes. At the same time, as shown in Figure 7, when the bottom of the pile is driven into the soil for 3 m, the excess pore water pressure of the U17 measuring point begins to increase rapidly. At this time, the distance between the U17 measuring point (7 m) and the bottom of the pile is about 2.3 m (the surface at the pile driving location is 1.7 m lower than the surface on the shore, and all measuring points are on the shore). When the bottom of the pile is driven to 5.3 m, the bottom of the pile is flush with the U17 measuring point. After that, when the bottom of the pile continues to go deeper, the growth rate of the pore water pressure at the U17 measuring point begins to decrease. It can be seen that the pile driving process will have a great impact on the pore water pressure within a range of about 2 m below the bottom of the pile. According to the measurement results and the calculation of the equivalent diameter of the H-type pile used in the test, it can be concluded that the equivalent diameter of the H-type pile is D = 0.41 m, that is, the soil within a range of about 7 D below the bottom of the pile will be greatly affected by the driving of a single pile, so the excess pore water pressure in this range increases rapidly.
As can be seen from Figure 6, the pore water pressure shows a good linear relationship with depth in figure. 2.4 m below the ground surface is the junction of vegetative fill and pulverized clay, and the pulverized clay layer is completely below the water table because the groundwater level is maintained at about −0.74 m on the day of piling, so the initial pore water pressure of the pulverized clay layer increases linearly with the increase in the depth, which indicates that the excess pore water pressure induced by the soil squeezing effect on the day of piling also shows an approximately linear relationship. of excess pore water pressure on the day of piling is also approximately linear.
Therefore, the Henkel pore water pressure formula was introduced:
Δ u = β Δ σ 0 + α Δ τ 0
where Δσ0 is the octahedral normal stress increment, Δτ0 is the octahedral shear stress increment, and α and β are Henkel pore water pressure coefficients.
Equation (1) shows that the pore water pressure in the soil depends on the normal stress and shear stress, and the part of pore water pressure in excess is related to the increment of stress, which in turn is related to the squeezing pressure on the soil around the pile, if the process of driving the pile into the soil is regarded as the lateral squeezing of the soil, according to the formula of the Rankine soil pressure, in the cohesive soil:
σ a = γ z K a 2 c K a
In Equation (2), the following variables are given:
  • Ka—active earth pressure coefficient, K a = tan 2 45 ° φ 2 ;
  • γ—heaviness of the fill behind the wall, kN/m3, and the effective heaviness is taken below the water table;
  • c—cohesive force of clay, kPa;
  • φ—the angle of internal friction of the fill soil, °;
  • z—depth of the calculated point from the fill surface, m.
It can be seen from the Rankine earth pressure formula that the horizontal squeezing force of the pile on the soil increases with the increase in depth, and the depth level shows a linear relationship in the soil layer of the same nature so that the distribution of excess pore water pressure caused by the load at each depth is regular. Therefore, a linear fitting is performed on the excess pore water pressure at each depth to observe its fitting degree.
In Figure 12, pile 12, which is directly opposite to the monitoring section, and pile 15, which is slightly farther away, were selected for linear fitting of the excess pore water pressure generated by the pulverized clay layer, and it was found that the fit was good, indicating that the law of linear distribution of excess pore water pressure along the depth direction in the same soil is also valid for H-type piles, but it is reflected in the numerical value of the fit is slightly different, and the fit of the measurement point of U2 was not as good as that of the measurement point of U1, which is related to radial distance This is related to the radial distance. Meanwhile, the excess pore water pressure at the same depth of the pore water pressure force measurement points U1 is larger than that at U2, as shown in Figure 13. This indicates that the closer to the construction pile, the larger the excess pore water pressure is, and the excess pore water pressure caused by the soil squeezing effect generated by the driven H-type pile does not decrease linearly in the radial direction, which is analyzed as follows in conjunction with the partitioning theory about the soil squeezing effect of the sinking pile [56,57].
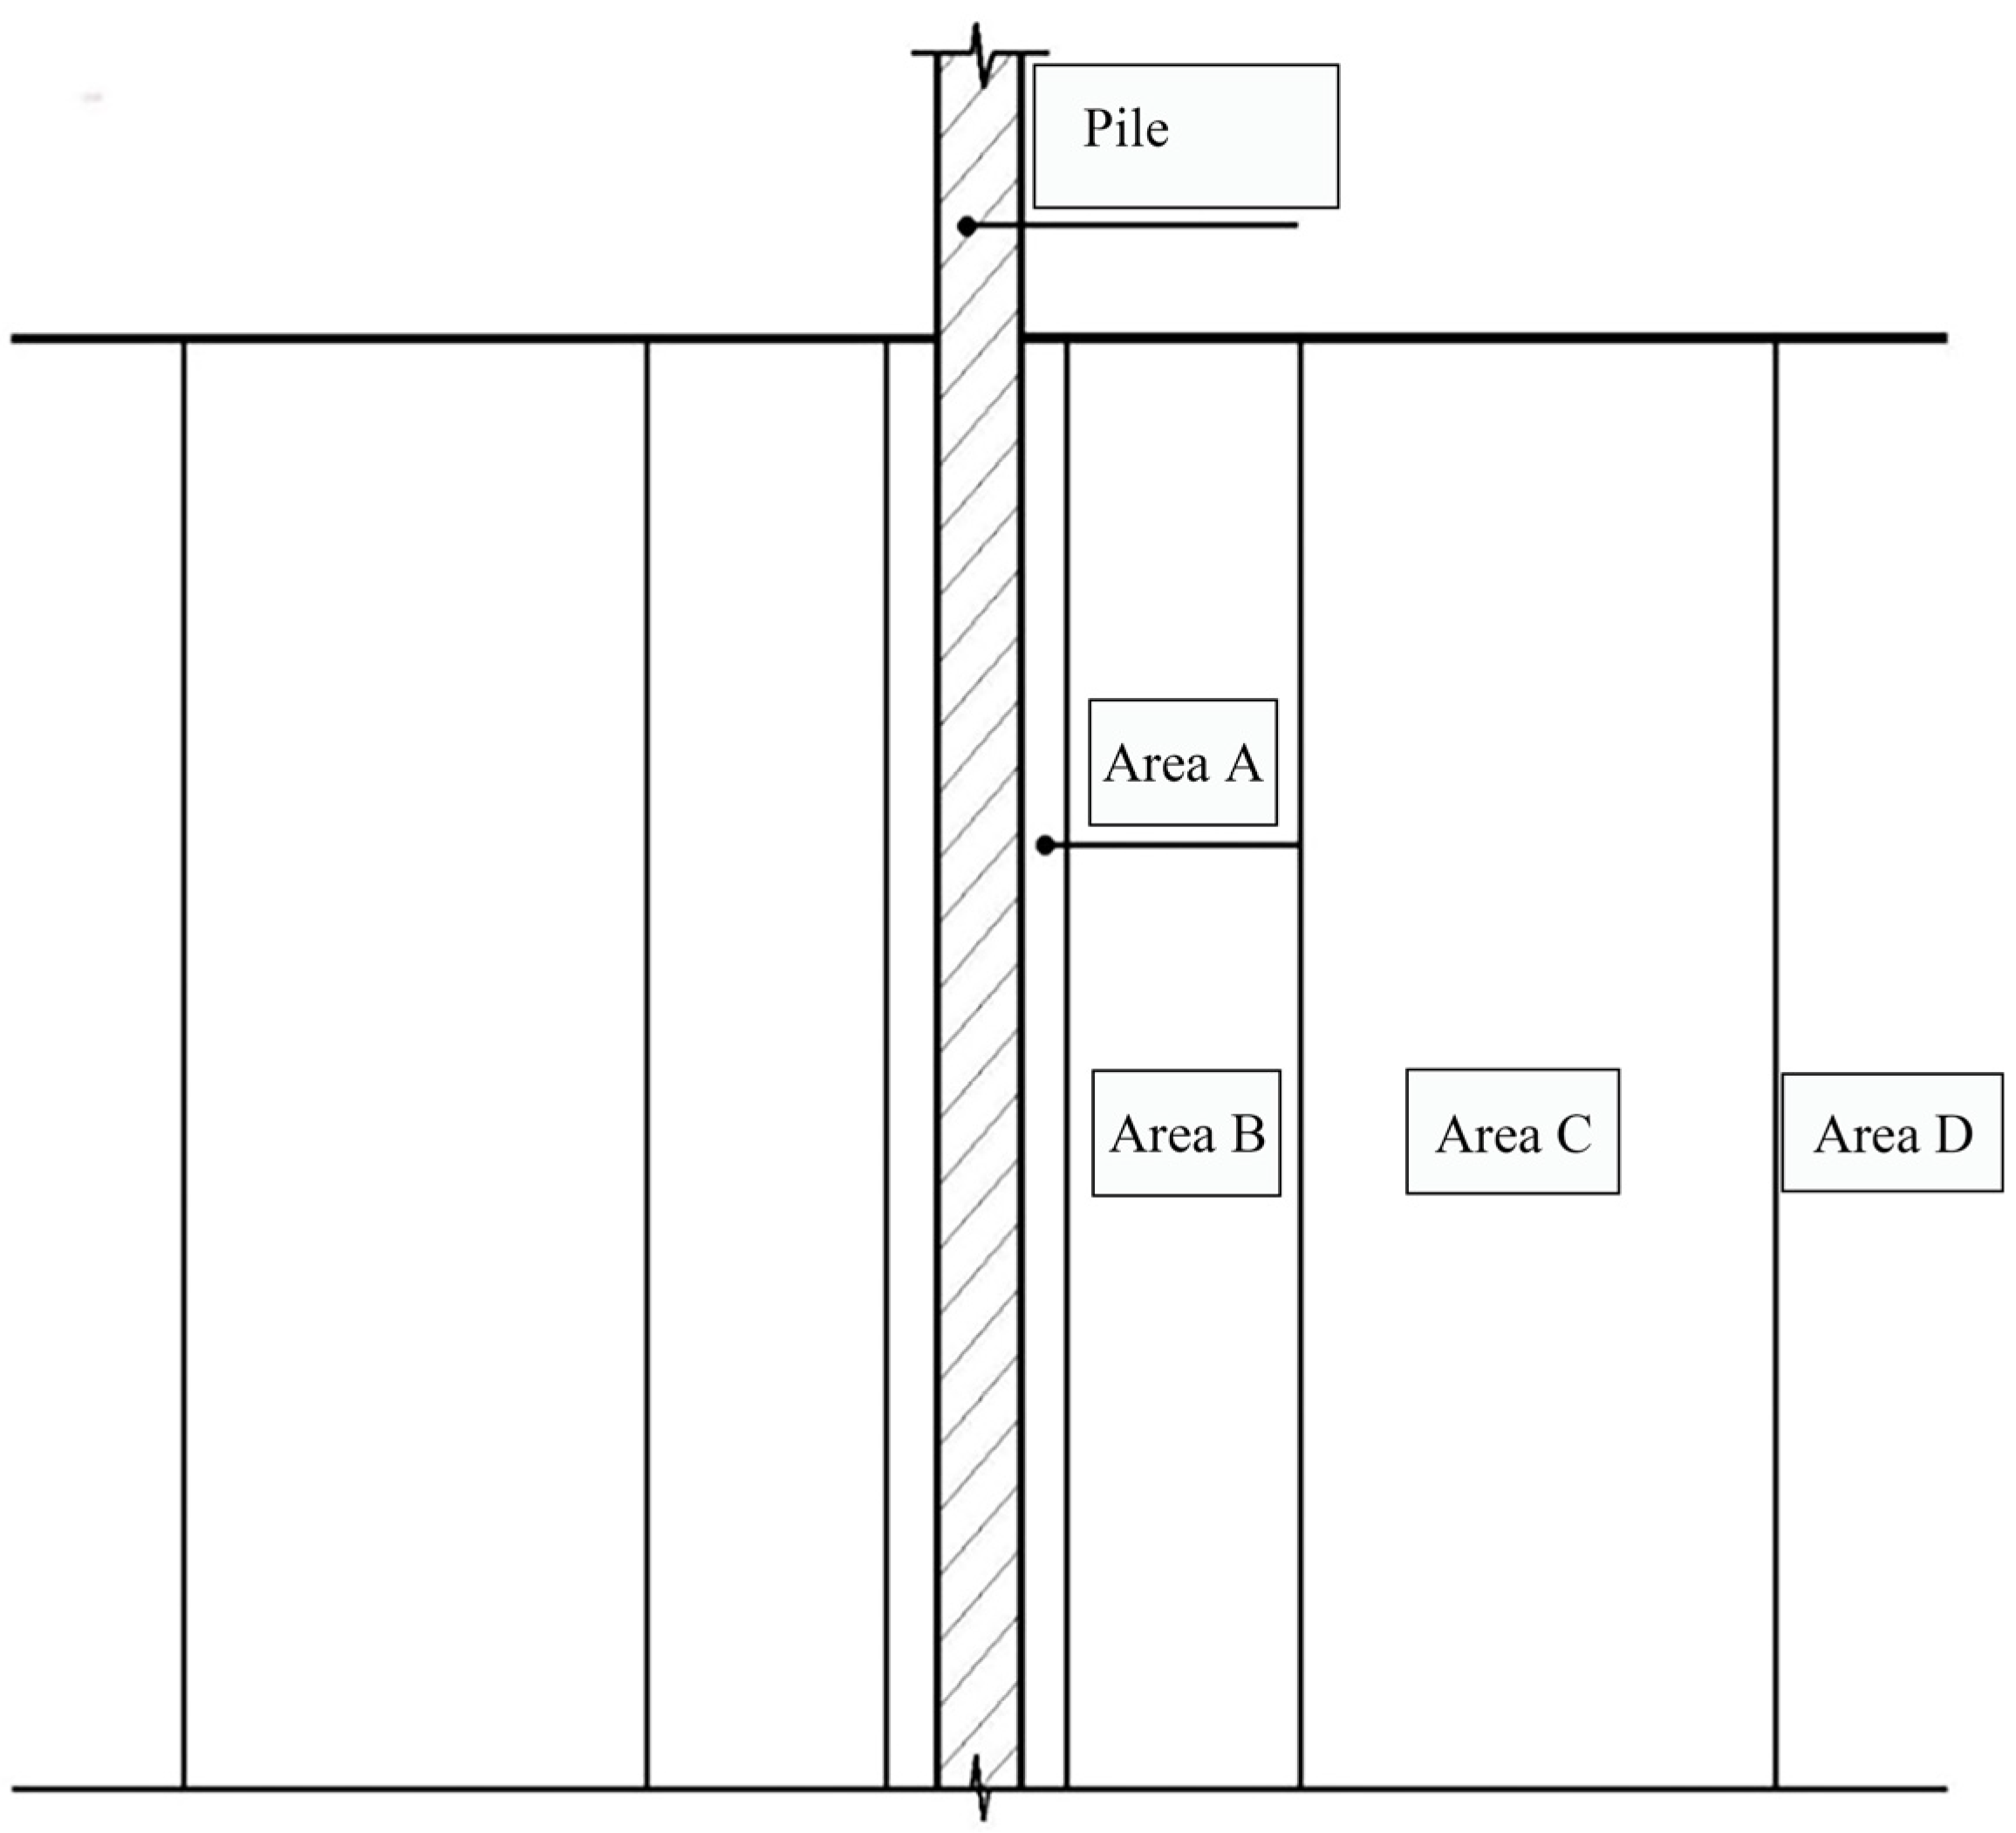
As shown in Figure 14, the soil squeezing effect produced by the sinking pile can be divided into four zones; zone A is close to the pile body, the soil squeezing effect is the most intense, which is a strong remodeling zone, generating large displacement, increasing the pore water pressure, and due to the pile dragging, the soil body is similar to being “cracked”, generating cracks, and the cracks exist in both directions, and the soil structure is basically completely destroyed. The soil structure is basically completely destroyed, but with the dissipation of the excess pore water pressure, the shear strength of the soil body in Zone A is gradually restored and even exceeds the original shear strength. Zone B is the main area for the study of the soil squeezing effect, which belongs to the plastic zone and has a larger range. Zone B is the main area for studying the soil squeezing effect, which belongs to the plastic zone and has a larger range. This zone is also subject to a large horizontal displacement and pore water pressure, and the interface between zone A and zone B is often the shear sliding surface when the pile is damaged. Zone C belongs to the elastic deformation zone, which is also affected by the soil squeezing effect, but the soil deformation belongs to the elastic deformation, and it can be recovered after a period of time. The farther D zone is not affected by the soil squeezing effect, or the effect is negligible and belongs to the non-disturbance zone.
Although there is no uniform conclusion about the radius of each zone, the theory explains the difference in the values and regularity of U1 and U2 measurement points well. As shown in Figure 8, the excess pore water pressure increases and then decreases with the driving of piles 1~19 and reaches the maximum value in pile 12, which can be explained by the above theory. First, during the driving of piles 1 to 7, the soil squeezing effect led to an increase in excess pore water stress. However, since the pore water pressure measurement points U1 and U2 were in zone D relative to the construction piles at this time, the excess pore water pressure generated was relatively small. Then, as the pile-driving position becomes closer and closer to the pore water pressure measurement place U1 and U2 when piles 8~12 are driven in, U1 is located in zone B, and U2 is located in zone C, both U1 and U2 pore water pressures obtain a rapid increase, but U1 is much larger than U2. Finally, when piles 13~19 are driven in, the pile-driving position becomes farther and farther away from U1 and U2, and the process of sinking piles in the hammering construction method is a super pore process of rapid dissipation of water pressure, resulting in the excess pore water pressure began to decrease. Since U1 is subjected to a more obvious soil squeezing effect, the regularity of excess pore water pressure at U1 is more obvious compared with U2. At the same time, it shows that there is a certain radial influence range of excess pore water pressure generated by the sinking process of H-type pile, and according to the test results, it can be concluded that the influence range of pore water pressure generated by H-type pile driving is about 14–15D. Comparing with the relevant conclusions of other scholars, some scholars based on the study of soil squeezing effect of soft soil foundations concluded that the influence range of pore water pressure is about 10~12.5D [58,59], and some scholars based on the relevant study of Randolph and Wroth introduced the influence range of excess pore water pressure caused by the piling process based on the clay foundation to be about 20D [60,61]. The reason for the difference is that for the former, the soil is silty soft soil, which has weaker permeability. Although the soil squeezing effect is severe, its impact range is limited. For the latter, due to the addition of drainage pipes in his study, the permeability is enhanced, which makes the pore water pressure transmit farther, but its excess pore water pressure is relatively small. Therefore, the soil squeezing effect of H-type piles is between the two.

4.2. Analysis of Results of Soil Squeezing Effect Manifested on Soil Displacement

In Figure 9, the soil horizontal displacement undergoes three stages of drastic change, weak change, and no change with the increase in soil depth. Still taking the H-type pile driven into the soil 1 m (at this time, the bottom of the pile is about 2.7 m below the surface of the bank) as an example, first of all, in the section of 0~2.5 m below the surface of the bank, the soil horizontal displacement undergoes a drastic change, because in this section in the process of pile driving, the bottom of the pile excludes the soil from outward, and also in the case of the saturated soft soil, which is basically not compressed, which further leads to the drastic change in the soil horizontal displacement. Below the surface of the 2.5~5 m section, soil horizontal displacement only weakly changed, on the one hand, because the section of soil by the upper layer of soil strain state changes the influence of soil horizontal displacement. On the other hand, the section of soil from the bottom of the pile’s vertical distance is farther, so it is affected by the smaller. Similarly, the soil horizontal displacement under 5 m below the surface is not affected. From this, we can judge that the soil horizontal displacement of the H-type pile used in this test only occurs in the depth range from the ground surface to 2 m below the bottom of the pile, i.e., the depth range from the ground surface to 5D below the bottom of the pile at the pile driving place, and the main soil horizontal displacement occurs in the long section of the pile which is driven into the soil.
In Figure 10, the soil horizontal displacement curve shows that the construction of neighboring piles also affects the soil horizontal displacement in this section, as the soil horizontal displacement continues to increase on the original basis after pile No. 15 is driven, and the soil horizontal displacement is shifted back after pile No. 19 is driven. This is because in the process of pile driving, on the one hand, the monitoring section will be affected by the change in strain state in the process of construction pile driving, which in turn generates new soil horizontal displacement. On the other hand, with the continuous dissipation of excess pore water pressure, the soil particles in the soil body are rearranged, and the soil body continues to be densely compacted, resulting in the occurrence of backward displacement. Therefore, when pile No. 15 was driven in, the influence of construction piles still dominated the monitoring section, leading to the increase in soil horizontal displacement, while when pile No. 19 was driven in, the dissipation of excess pore water pressure dominated the monitoring section, which led to the re-densification of the soil and the occurrence of soil horizontal displacement, which also indicates that the boundary of the influence range of the soil horizontal displacement is located between piles No. 15 and 19, i.e., the horizontal influence range of the piling on the soil horizontal displacement is about to 3 m. This also indicates that the boundary of influence range of soil horizontal displacement is located between Piles 15 and 19, i.e., the horizontal displacement of soil by piling is about 3–5 m, i.e., 8~12D.
In order to further study the influence of excess pore water pressure dissipation on soil horizontal displacement, we studied the variation in cumulative horizontal displacement at each depth with time after pile driving, as shown in Figure 15, where the maximum horizontal displacement measured on the day of pile driving is taken. It can be found that with the dissipation of excess pore water pressure, the horizontal displacement of soil is indeed gradually moving back, and the rate of return is also large at first and then small, which is consistent with the above-mentioned law of excess pore water pressure dissipation. At the same time, in terms of depth, the horizontal displacement presents a vertical “U-shaped” distribution, which is slightly different from the conclusions of other scholars. Zhu [62] analyzed the results of the field construction test and numerical simulation of pipe piles and concluded that the radial horizontal displacement of soil from top to bottom presents a distribution law of “large at the top and small at the bottom, and the interface turns,” which is affected by the depth of the covering soil and the bonding stiffness of the soil interface; while Xu Zhigang’s test results are close to the test results, that is, “small at the top and small in the middle.” The most direct reason for these different results is the different properties of the soil layers. Secondly, due to the existence of the old revetment in this project, the horizontal displacement of the soil above a depth of 2 m is inhibited, resulting in less displacement of the upper soil than the middle section.
In Figure 11, CJ01 and CJ02 show settlement, and CJ03 and CJ04 show bulging, which mainly depends on two aspects. On the one hand, the soil squeezing effect during pile sinking will squeeze the soil body, which will result in bulging. On the other hand, the hammering method of construction will bring a vibration effect to the soil, even to the surrounding buildings and environment, and such a vibration effect will produce uneven subsidence of the foundation [63,64,65,66,67]. According to Yao [68], the pile driving vibration is a kind of impact-type vibration, and due to the amplitude of the vibration wave to the surroundings, a vibration impact field is formed, and its isobars are in the form of a closed ring, as in the lake surface. Its isobar is a closed ring, like the ripples formed by putting stones into the lake, spreading out from the center to the surrounding, and in the process of pile sinking, the energy of a hammer blow is fixed; if a hammer blow penetrates into the pile of a shorter distance, it means that the harder the soil is, the greater the energy transmitted to the foundation soil, the vibration will be more intense, even more than the effect brought by soil squeezing effect. The final vertical displacement of each measurement point is reflected as settlement or bulging; it depends on which side of the soil the squeezing effect and vibration effect are dominant, the vibration of the surface a little far away is more minor, and the transferring effect of the soil squeezing effect makes the surface at a faraway place bulge; the near surface is not only subjected to the vibration of the piling vibration to settle downward, but also the pile in the process of subsidence, the soil around the pile will be dragged downward to the pile pit to make it flow into the pile pit, which also is the reason why the settlement of the soil still occurs even with the presence of soil squeezing effect, and the result of the data that the settlement is greater than the bulge are also consistent with the related study of D’Appolonia [69]. In this test, the demarcation point between settlement and uplift occurs in the range of 2–3 m from the construction pile, i.e., between 5 and 7D.
At the end of pile driving, the effect of soil squeezing effect gradually dissipates, but the uneven settlement of the foundation still continues to develop; meanwhile, with the continuous dissipation of super-hole pressure, the settlement speed is fast at the beginning and then becomes slow until the final settlement is stabilized, which is experienced for a total of 20 days, as shown in Figure 16, the point with the largest settlement is CJ01, and the settlement is finally 22.30 mm, while the smallest point is only CJ04 of 0.47 mm, indicating that the phenomenon of uneven settlement of the foundation is obvious in the process of H-type pile in the course of piling construction. If it is not controlled, it will have an adverse effect on the surrounding buildings.

5. Conclusions

This paper relies on the Hujiashen II project to study the soil squeezing effect produced during the piling process of H-type prestressed concrete shore protection piles and carries out field tests around the three indicators of excess pore water pressure, soil horizontal displacement, and soil vertical displacement, and obtains the relevant conclusions as follows:
(1) During the driving of H-type piles, the excess pore water pressure caused by the soil squeezing effect has an impact range of about 14–15D in the horizontal direction, and in the vertical direction, it will cause the pore water pressure within a depth range of about 7D below the pile bottom to increase rapidly.
(2) In this test, the excess pore water pressure caused by the soil squeezing effect will rise rapidly during the piling process and then begin to decline rapidly after the piling. The decline rate on the first day can reach more than 85% and then slowly decline. About 20 days after the completion of the piling, the excess pore water pressure will completely dissipate. For this project, the river water level and groundwater level fluctuate synchronously before and after the piling, causing fluctuations in the excess pore water stress.
(3) During the driving of H-type piles, the pore water pressure in the same soil layer shows a good linear relationship with depth. After linear fitting of the excess pore water pressure, it is found that the excess pore water pressure caused by the soil squeezing effect does not decrease linearly in the radial direction. The soil around the construction pile can be divided into four regions: A, B, C, and D. Among them, A and B belong to the plastic zone, and C and D belong to the elastic zone.
(4) The horizontal displacement of the soil caused by the squeezing effect of the H-type pile occurs within the depth range of 5D from the surface of the pile to the bottom of the pile, while the main horizontal displacement of the soil occurs in the long section of the pile driven into the soil. The radial influence range of the horizontal displacement of the soil depends on the displacement newly generated by the squeezing effect and the return displacement caused by the dissipation of the excess pore water pressure. It is concluded that the radial influence range of the horizontal displacement of the soil caused by the squeezing effect of the H-type pile is about 8–12D. The horizontal displacement of the soil is distributed in a “U” shape along the depth direction.
(5) Whether the vertical displacement of the soil caused by the squeezing effect of the H-type pile is settlement or uplift at a certain point around the pile depends on the dual combination of the squeezing effect and the vibration effect during pile driving. In this experiment, the dividing point between soil uplift and settlement appears within the range of 2–3 m from the construction pile, that is, between 5 and 7D. After the pile driving is completed, the soil settles due to the dissipation of pore water stress. The settlement rate is fast at first and then slows down. The final settlement of the soil is stable on the 20th day.

Author Contributions

Conceptualization: J.L. and Y.W.; methodology: J.L. and Y.W.; validation: Y.X. and Y.W.; formal analysis: J.L., Y.X., and Y.W.; investigation: Y.X.; resources: Y.W. and Y.X.; data curation: J.L. and Y.X.; writing—original draft preparation: J.L. and Y.X.; writing—review and editing: Y.W.; visualization: Y.X.; supervision: Y.W.; project administration: J.L.; funding acquisition: J.L. All authors have read and agreed to the published version of the manuscript.

Funding

This work was supported in part by the National Natural Science Foundation of China under Grant 52378337.

Data Availability Statement

The data presented in this study are available in this article.

Conflicts of Interest

The authors declare no conflicts of interest.

References

  1. Zhang, Z.X.; Chen, G.; Xu, T.B.; Gong, S.F.; Xiao, Z.B.; Liu, C.B. Experimental study on flexural and shear performance of prestressed steel strand ultra-high strength concrete H-type piles. J. Zhejiang Univ. Eng. 2019, 53, 31–39. [Google Scholar] [CrossRef]
  2. Hama Salih, S.J.; Salih, N.B.; Noory, D.B. Optimum Design of Steel Piles in Different Sandy Soil Configurations. Geomech. Geoeng. 2022, 17, 347–357. [Google Scholar] [CrossRef]
  3. Seo, D.-J.; Kang, D.-M.; Lee, H.; Moon, D.Y. An Experimental Study on Lateral Load Resistance of a Wall Structure composed of Precast Concrete and H-Pile. J. Korea Inst. Struct. Maint. Insp. 2020, 24, 9–17. [Google Scholar]
  4. Lv, Y.; Zhang, D.; Li, P.; Zheng, C. A Theoretical Analysis of the Vertical Shearing Mechanism of the H-Pile. Soil Mech. Found. Eng. 2015, 52, 122–130. [Google Scholar] [CrossRef]
  5. Lv, Y.; Zhang, D.; Rong, X.; Wang, Y. Mechanism of Downdrag for Floating H-Pile Subjected to Surcharge. Soil Mech. Found. Eng. 2017, 54, 110–116. [Google Scholar] [CrossRef]
  6. Zhang, H.; Xing, H.; Zhu, L.; Tannant, D.; Guo, X. Centrifuge Model Tests of H-Type Anti-Slide Pile Reinforced Slope under Different Rainfall Duration. Eur. J. Environ. Civ. Eng. 2024, 1–21. [Google Scholar] [CrossRef]
  7. Javanmardi, A.; Huang, F.; Chen, W.; Xu, P.; Xue, J. Experimental Study on Seismic Response of an Integral Abutment: Steel H-Pile Structure under Quasi-Static Cyclic Loads. J. Earthq. Eng. 2023, 27, 2358–2380. [Google Scholar] [CrossRef]
  8. Ouyang, W.; Wan, J.; Liu, S.-W.; Li, X. Line-Finite-Element Implementation for Driven Steel H-Piles in Layered Sands Considering Post-Driving Residual Stresses. Adv. Struct. Eng. 2021, 24, 1384–1398. [Google Scholar] [CrossRef]
  9. Adhikari, P.; Ng, K.W.; Gebreslasie, Y.Z.; Wulff, S.S.; Sullivan, T.A. Geomaterial Classification Criteria for Design and Construction of Driven Steel H-Piles. Can. Geotech. J. 2020, 57, 616–621. [Google Scholar] [CrossRef]
  10. Hegedus, E.; Khosla, V.K. Pullout Resistance of “H” Piles. J. Geotech. Eng. 1984, 110, 1274–1290. [Google Scholar] [CrossRef]
  11. Jesswein, M.; Liu, J. A New SPT-Based Method for Estimating Axial Capacity of Driven Piles in Glacial Deposits. Geotech. Geol. Eng. 2022, 40, 1043–1060. [Google Scholar] [CrossRef]
  12. Alshawabkeh, Y.M.; Issa, M.A.; Abandah, M.R.; Salman, N.N. Lateral Buckling Capacity of Steel H-Piles Supporting Integral Abutment Bridges (IABs). Structures 2023, 50, 896–907. [Google Scholar] [CrossRef]
  13. Son, S.-W.; Seo, M.; Im, J.-C.; Yoo, J.-W. Dynamic Numerical Analysis of Displacement Restraining Effect of Inclined Earth-Retaining Structure during Embankment Construction. Appl. Sci. 2019, 9, 2213. [Google Scholar] [CrossRef]
  14. Yang, J.; Tham, L.G.; Lee, P.K.; Yu, F. Observed Performance of Long Steel H-Piles Jacked into Sandy Soils. J. Geotech. Geoenviron. Eng. 2006, 132, 24–35. [Google Scholar] [CrossRef]
  15. Nguyen, T.N.; Nguyen, T.A. The effect of pile driving process on stress and strain of neighboring building’s foundations: An application in vietnam. Geomate J. 2023, 24, 1–10. [Google Scholar] [CrossRef]
  16. Goodall, S.; Merifield, R. A Case Study on Lateral Ground Movements Due to Piling Driving in Soft Clay Near an Existing Elevated Roadway. In Proceedings of the 5th International Conference on Transportation Geotechnics (ICTG) 2024, Sydney, Australia, 20–22 November 2024s; Rujikiatkamjorn, C., Xue, J., Indraratna, B., Eds.; Springer Nature: Singapore, 2025; Volume 8, pp. 215–228. [Google Scholar] [CrossRef]
  17. Attari, Y.; Eiksund, G.R.; Jostad, H.P. Assessment of the Impact of Pile Driving on Slope Stability. 2023. Available online: https://hdl.handle.net/11250/3111894 (accessed on 15 November 2024).
  18. Hørlykke, T.; Dedenroth, B.; Sørensen, K.K. A Case Study of Heave of Pile-Supported Structures Due to Pile Driving in Heavily Overconsolidated Very High Plasticity Palaeogene Clay. In Proceedings of the 17th Nordic Geotechnical Meeting, Reykjavik, Iceland, 25–28 May 2016. [Google Scholar]
  19. Cao, L.F.; Teh, C.I.; Chang, M.F. Undrained Cavity Expansion in Modified Cam Clay I: Theoretical Analysis. Géotechnique 2001, 51, 323–334. [Google Scholar] [CrossRef]
  20. Chen, S.L.; Abousleiman, Y.N. Exact Drained Solution for Cylindrical Cavity Expansion in Modified Cam Clay Soil. Géotechnique 2013, 63, 510–517. [Google Scholar] [CrossRef]
  21. Chen, H.; Li, L.; Li, J.; Wang, H. Stress Transform Method to Undrained and Drained Expansion of a Cylindrical Cavity in Anisotropic Modified Cam-Clay Soils. Comput. Geotech. 2019, 106, 128–142. [Google Scholar] [CrossRef]
  22. Geng, D. Comparison of Different Theoretical Calculation Methods of Soil Squeezing Effect. Int. Core J. Eng. 2022, 8, 448–456. [Google Scholar] [CrossRef]
  23. Vrakas, A. A Rigorous Semi-Analytical Solution for Undrained Cylindrical Cavity Expansion in Critical State Soils. Int. J. Numer. Anal. Methods Geomech. 2016, 40, 2137–2160. [Google Scholar] [CrossRef]
  24. Li, L.; Li, J.; Sun, D. Anisotropically Elasto-Plastic Solution to Undrained Cylindrical Cavity Expansion in K0-Consolidated Clay. Comput. Geotech. 2016, 73, 83–90. [Google Scholar] [CrossRef]
  25. Henke, S. Influence of Pile Installation on Adjacent Structures. Int. J. Numer. Anal. Methods Geomech. 2010, 34, 1191–1210. [Google Scholar] [CrossRef]
  26. Ding, J.; Zhang, J.; Wang, Q.; Zhang, J.; Qi, H. Numerical Analysis of Soil Squeezing Effect of Pipe Pile Construction in Deep Silt Site. IOP Conf. Ser. Earth Environ. Sci. 2021, 696, 012022. [Google Scholar] [CrossRef]
  27. Chrisopoulos, S.; Triantafyllidis, T. Zur Numerischen Modellierung von Vibrationsrammung Im Gesättigten Boden. Bautechnik 2019, 96, 176–194. [Google Scholar] [CrossRef]
  28. Chrisopoulos, S.; Vogelsang, J.; Triantafyllidis, T. FE Simulation of Model Tests on Vibratory Pile Driving in Saturated Sand. In Holistic Simulation of Geotechnical Installation Processes; Triantafyllidis, T., Ed.; Lecture Notes in Applied and Computational Mechanics; Springer International Publishing: Cham, Switzerland, 2017; Volume 82, pp. 124–149. [Google Scholar] [CrossRef]
  29. Abu-Farsakh, ·M.; Rosti, F.; Souri, A. Evaluating Pile Installation and Subsequent Thixotropic and Consolidation Effects on Setup by Numerical Simulation for Full-Scale Pile Load Tests. Can. Geotech. J. 2015, 52, 1734–1746. [Google Scholar] [CrossRef]
  30. Lu, Y.; Wang, Q.; Li, X.J.; Sun, H.Q.; Wang, X.Y. Characterization of Soil Displacements During Press-in Pile Model Tests. In Proceedings of the GeoShanghai 2018 International Conference: Fundamentals of Soil Behaviours, Shanghai, China, 27–30 May 2018; Zhou, A., Tao, J., Gu, X., Hu, L., Eds.; Springer: Singapore, 2018; pp. 550–556. [Google Scholar] [CrossRef]
  31. Vogelsang, J.; Huber, G.; Triantafyllidis, T. Experimental Investigation of Vibratory Pile Driving in Saturated Sand. In Holistic Simulation of Geotechnical Installation Processes; Triantafyllidis, T., Ed.; Lecture Notes in Applied and Computational Mechanics; Springer International Publishing: Cham, Switzerland, 2017; Volume 82, pp. 101–123. [Google Scholar] [CrossRef]
  32. Zhou, D.; Zhang, W.G. Transparent Soil Model Test on Displacement Field of Soils around Single Passive Pile. In Proceedings of the International Conference on Geotechnical and Earthquake Engineering, Austin, TX, USA, 10–13 June 2018; American Society of Civil Engineers: Reston, VA, USA, 2019; pp. 652–659. [Google Scholar] [CrossRef]
  33. Ahmed, M.; Iskander, M. Analysis of Tunneling-Induced Ground Movements Using Transparent Soil Models. J. Geotech. Geoenviron. Eng. 2011, 137, 525–535. [Google Scholar] [CrossRef]
  34. Orrje, O.; Broms, B.B. Effects of Pile Driving on Soil Properties. J. Soil Mech. Found. Div. 1967, 93, 59–73. [Google Scholar] [CrossRef]
  35. Hagerty, D.J.; Peck, R.B. Heave and Lateral Movements Due to Pile Driving. J. Soil Mech. Found. Div. 1971, 97, 1513–1532. [Google Scholar] [CrossRef]
  36. Zhang, J.; Zhao, J.; Niu, L. Analysis of soil microstructure components for squeezing effect by pile-driving. J. Eng. Geol. 2011, 19, 231–237. [Google Scholar]
  37. Zhang, J.; Zhao, J.; Sun, S. Model test and analysis of excess pore water pressure produced by driving pile group. Ind. Build. 2009, 1, 76–78. [Google Scholar]
  38. Lei, H. Micro-structural effect of consolidation deformation in saturated soft clay. J. Hydraul. Eng. 2004, 4, 91–95. [Google Scholar]
  39. Suleiman, M.T.; Ni, L.; Davis, C.; Lin, H.; Xiao, S. Installation Effects of Controlled Modulus Column Ground Improvement Piles on Surrounding Soil. J. Geotech. Geoenviron. Eng. 2016, 142, 04015059. [Google Scholar] [CrossRef]
  40. Langford, J.; Lande, E.-J.; Sandene, T.; Kahlstrøm, M.; Nadim, F.; Norén-Cosgriff, K.; Piciullo, L.; Ritter, S.; Hauser, C.; Lysdahl, A.; et al. BegrensSkade II–REMEDY–Risk Reduction of Groundwork Damage: An Overview. IOP Conf. Ser. Earth Environ. Sci. 2021, 710, 012058. [Google Scholar] [CrossRef]
  41. Attari, Y.; Jostad, H.P.; Grimstad, G.; Eiksund, G.R. Evaluation of Pile Driving Effects on Slope Stability in Clay. Geotech. Geol. Eng. 2024, 42, 1623–1638. [Google Scholar] [CrossRef]
  42. Poulos, H.G. Effect of Pile Driving on Adjacent Piles in Clay. Can. Geotech. J. 1994, 31, 856–867. [Google Scholar] [CrossRef]
  43. Sagaseta, C.; Whittle, A.J. Prediction of Ground Movements Due to Pile Driving in Clay. J. Geotech. Geoenviron. Eng. 2001, 127, 55–66. [Google Scholar] [CrossRef]
  44. Vytiniotis, A.; Casey, B.; Sykora, D.W. Lateral Soil Movements Due to Pile Driving: A Case Study in Soft Clays. In Proceedings of the International Foundation Congress and Equipment Expo 2018, Orlando, FL, USA, 5–10 March 2018; pp. 113–128. [Google Scholar] [CrossRef]
  45. GB50021-2009; Geotechnical investigation specification. Ministry of Housing and Urban-Rural Development: Beijing, China, 2009.
  46. GB/T50123-2019; Geotechnical Test Method Standards. Ministry of Housing and Urban-Rural Development: Beijing, China, 2019.
  47. GB 50497-2019; Technical Standards for Monitoring of Construction Pit Works. Ministry of Housing and Urban-Rural Development: Beijing, China, 2019.
  48. Viggiani, C.; Mandolini, A.; Russo, G. Piles and Pile Foundations; CRC Press: Boca Raton, FL, USA, 2014. [Google Scholar]
  49. Xu, Y.; Fu, D. Excess pore pressure induced in piling in saturated structural soft soils. Rock Soil Mech. 2000, 1, 53–55. [Google Scholar] [CrossRef]
  50. Yang, S.; Li, Y. Experimental Research on Compacting Effect of PHC Piles. Chin. J. Geotech. Eng. 2006, 20, 117–120. [Google Scholar]
  51. Li, G.; Bian, S.; Lu, X.; Yang, T.; Lei, G. Field test on extruding soil caused of PHC pipe pile driving by static pressure for improving soft Field test on extruding soil caused of PHC pipe pile driving by static pressure for improving soft. Rock Soil Mech. 2013, 34, 1089–1096. [Google Scholar]
  52. Ying, H.; Zhang, L.; Xie, K.; Huang, D. Pore Pressure Response to Groundwater Fluctuations in Saturated Double-Layered Soil. Math. Probl. Eng. 2015, 2015, 389089. [Google Scholar] [CrossRef]
  53. Zhang, L.; Ying, H.; Xie, K.; Huang, D. Effect of Groundwater Fluctuations on Pore Pressures and Earth Pressures on Coastal Excavation Retaining Walls. Mar. Georesour. Geotechnol. 2016, 34, 770–781. [Google Scholar] [CrossRef]
  54. Luo, Y.; Gong, X.; Wu, R. New Method for Calculation of Water-Earth Pressure on Foundation Pit Considering Ground Water Seepage. J.-Zhejiang Univ. Eng. Sci. 2007, 41, 157. [Google Scholar]
  55. Benmebarek, N.; Benmebarek, S.; Kastner, R.; Soubra, A.-H. Passive and Active Earth Pressures in the Presence of Groundwater Flow. Géotechnique 2006, 56, 149–158. [Google Scholar] [CrossRef]
  56. Piling Theory Manual. Available online: https://apps.dtic.mil/sti/citations/ADA386246 (accessed on 18 November 2024).
  57. Liu, L. Pile Foundation Design and Calculations. Available online: https://www.zhangqiaokeyan.com/book-cn/081504191419.html (accessed on 15 November 2024).
  58. Tang, S.; He, L.; Fu, C. Excess pore water pressure caused by an installing pile in soft foundation. Rock Soil Mech. 2002, 6, 725–729+732. [Google Scholar] [CrossRef]
  59. Chen, D. Influencing Range and Preventive Measures of Squeezing Effect of Static Pressure Pile Construction in Soft Soil Area. Shanghai Constr. Sci. Technol. 2019, 1, 22–25. [Google Scholar]
  60. Zhu, D.; Indraratna, B.; Poulos, H.; Rujikiatkamjorn, C. Field Study of Pile—Prefabricated Vertical Drain (PVD) Interaction in Soft Clay. Can. Geotech. J. 2020, 57, 377–390. [Google Scholar] [CrossRef]
  61. Randolph, M.F.; Wroth, C.P. An Analytical Solution for the Consolidation around a Driven Pile. Int. J. Numer. Anal. Methods Geomech. 1979, 3, 217–229. [Google Scholar] [CrossRef]
  62. Zhu, S. Field Test and Numerical Simulation Study on Horizontal Compaction Effect of Pipe Pile Construction in Soft Soil Laye. Constr. Technol. 2020, 49, 77–81. [Google Scholar]
  63. Bradshaw, A.S.; Baxter, C.D.P.; Osborn, P. Lessons Learned from Pile Driving at the Central Artery/Tunnel Project. In Proceedings of the Sessions of Geo-Frontiers 2005 Congress, Texas, Austin, USA, 24–26 January 2005; pp. 1–15. [Google Scholar] [CrossRef]
  64. Feld, J.; Carper, K.L. Construction Failure; John Wiley & Sons: Hoboken, NJ, USA, 1996. [Google Scholar]
  65. Svinkin, M.R. Mitigation of Soil Movements from Pile Driving. Pract. Period. Struct. Des. Constr. 2006, 11, 80–85. [Google Scholar] [CrossRef]
  66. Woods, R.D. Dynamic Effects of Pile Installations on Adjacent Structures; Transportation Research Board: Washington, DC, USA, 1997; Volume 7. [Google Scholar]
  67. Massarsch, K.; Fellenius, B. Ground Vibrations Induced by Impact Pile Driving. In Proceedings of the International Conference on Case Histories in Geotechnical Engineering, Arlington, Virginia, 13 August 2008. [Google Scholar]
  68. Yao, D.; Zhang, Y.; Ye, Y.; Yan, P. Impact of Jacked Pile Construction Vibration on Environment and Its Control Measures. Chin. J. Undergr. Space Eng. 2013, S1, 1739–1743. [Google Scholar]
  69. D’Appolonia, D.J.; Lambe, T.W. Performance of Four Foundations on End Bearing Piles. J. Soil Mech. Found. Div. 1971, 97, 77–93. [Google Scholar] [CrossRef]
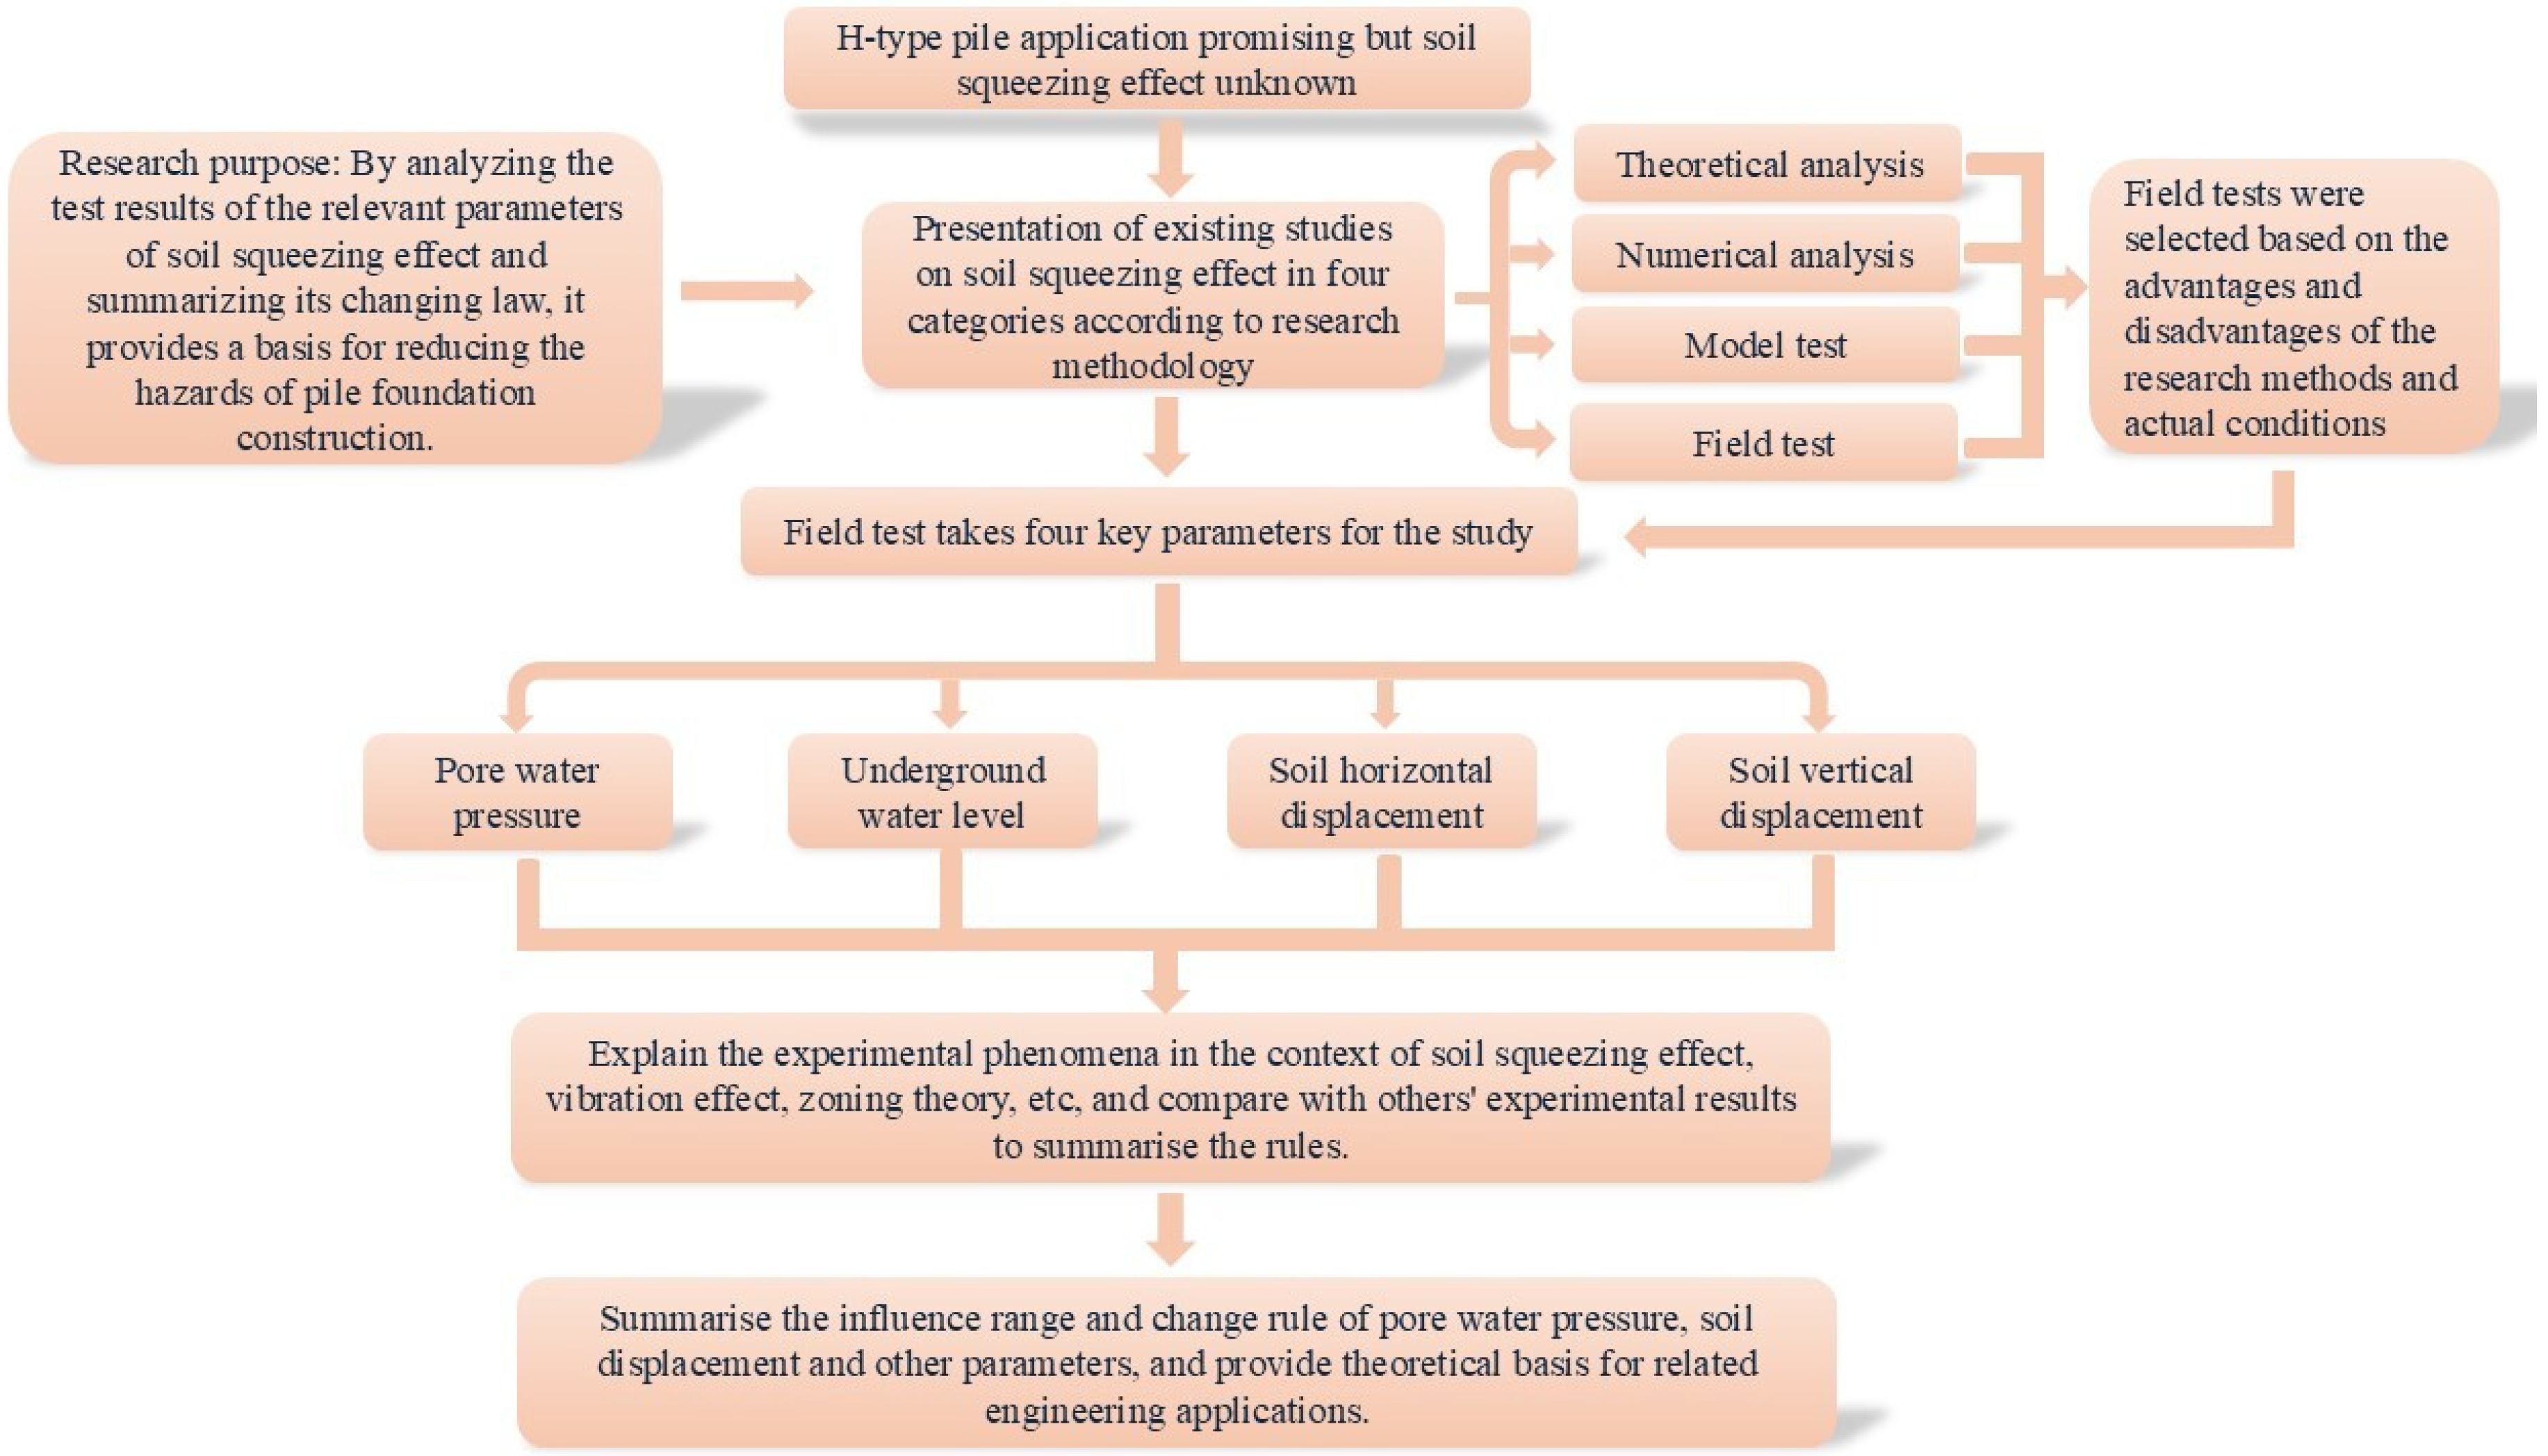
Figure 1. Comprehensive study flowchart.
Buildings 14 03816 g001
Figure 2. Location map of the test site.
Buildings 14 03816 g002
Figure 3. H-type piles and their field-driven placement. (a) Schematic cross-section of pre-tensioned H-type prestressed concrete revetment pile (unit: mm). (b) Schematic of H-type pile placement.
Buildings 14 03816 g003
Figure 4. Layout of measurement sites. (a) Overhead plan of the site layout of each measurement point (unit: mm). (b) Installation profile of pore water pressure measurement points.
Buildings 14 03816 g004
Figure 5. Excess pore water pressure dissipation curve. (a) Pore water pressure measurement point 1. (b) Pore water pressure measurement point 2.
Buildings 14 03816 g005aBuildings 14 03816 g005b
Figure 6. Variation in pore water pressure values with depth on the day of piling.
Buildings 14 03816 g006
Figure 7. Excess pore water pressure variation curve during single pile driving.
Buildings 14 03816 g007
Figure 8. Variation in excess pore water pressure during pile driving. (a) Pore water pressure measurement point 1. (b) Pore water pressure measurement point 2.
Buildings 14 03816 g008aBuildings 14 03816 g008b
Figure 9. Soil horizontal displacement at different depths during pile sinking in stages.
Buildings 14 03816 g009
Figure 10. Soil horizontal displacement at different times on the day of pile driving.
Buildings 14 03816 g010
Figure 11. Vertical deformation of the ground surface during pile driving.
Buildings 14 03816 g011
Figure 12. Fitted curve of excess pore water pressure in silty clay layer after driving pile 12 and pile 15.
Buildings 14 03816 g012
Figure 13. Comparison of excess pore water pressure at the same depth at pore water pressure measurement points 1 and 2.
Buildings 14 03816 g013
Figure 14. Schematic diagram of the zoning of the extent of soil impact by the sunken piles.
Buildings 14 03816 g014
Figure 15. Comparison of horizontal displacements of soil at various depths with time.
Buildings 14 03816 g015
Figure 16. Plot of soil vertical displacement with time after completion of pile driving.
Buildings 14 03816 g016
Table 1. Statistical indicators of physical and mechanical properties of soil layers.
Floor NumberNameWater ContentWet
Density
Void RatioDegree of SaturationPlasticity IndexLiquidity IndexCoefficient of CompressibilityModulus of Compression
ωρeSrIPILavEs
%g/cm3%MPa−1MPa
−1Plain fill soil26.71.910.79890.7130.580.3405.29
−2Powdery clay30.91.890.89294.5160.590.3685.40
−1Powdery clay33.91.860.96495.7150.860.4464.62
−2Powdery soil28.51.880.84694.1101.060.2219.04
−1Powdery clay27.31.940.78994.3150.450.2976.21
Table 2. Pile driving machine parameters.
Parameter NameCylinder Block Quality
kg
Frequency
Min−1
Maximum Energy
kJ
Maximum Pile Weight
kg
Gross Weight of
Hammer
kg
Parameter value250035–5057.560004200
Disclaimer/Publisher’s Note: The statements, opinions and data contained in all publications are solely those of the individual author(s) and contributor(s) and not of MDPI and/or the editor(s). MDPI and/or the editor(s) disclaim responsibility for any injury to people or property resulting from any ideas, methods, instructions or products referred to in the content.