Article

Study of the Static Performance of Guyed Towers in High-Voltage Transmission Lines

1
Extra High Voltage Company, State Grid Hubei Electric Power Co., Ltd., Wuhan 430050, China
2
School of Civil and Hydraulic Engineering, Huazhong University of Science and Technology, Wuhan 430074, China
*
Author to whom correspondence should be addressed.
Buildings 2024, 14(12), 3960; https://doi.org/10.3390/buildings14123960
Submission received: 12 November 2024 / Revised: 3 December 2024 / Accepted: 10 December 2024 / Published: 13 December 2024
(This article belongs to the Section Building Structures)

Abstract

:
Guyed towers in high-voltage transmission lines consist of the tower body, guy wire system, and foundation. A well-designed guy wire system with optimized tension levels is essential to maintain the stability of the tower under wind loads and other external forces. In practical operation, to prevent excessive corrosion of the pinned metal components at the tower base, these connections are often encased in concrete, altering the base connection conditions and affecting the structural forces on the tower. This study develops a finite element analysis model based on two guyed tower structures from a high-voltage transmission line project. By measuring the actual tensions of the guy wire and testing the basic material performance, this model considers the effects of varying base connection conditions and different guy wire tension levels. Under designed ice load and extreme wind load conditions, the analysis focuses on changes in tower body stress, tower-top displacement and inclination, and guy wire forces. The results indicate that when the tower base is uniformly pinned or fixed, the initial guy wire tension has minimal impact on maximum tower stress but significantly affects maximum tower displacement and inclination when the tower was under the ice and wind load conditions. The base connection condition has a pronounced impact on the stress states of the tower and guy wire system, especially under the designed wind loads. In particular, when the base is fixed, the maximum base stress in Tower 1 under the wind loads is 270% higher than in a pinned condition. The initial guy wire tension level significantly affects the guy wire force under the ice and wind loads; for example, when Tower 1 is subjected to approximately 85% of the design level of high wind load, some guy wires reach full relaxation prematurely, presenting localized strength failure risks at the tower foot, potentially threatening the tower safety under extreme design loads.

1. Introduction

As urbanization and industrialization accelerate across China, the nation’s demand for electricity continues to rise sharply. This increasing demand necessitates more efficient and reliable power transmission systems, driving advancements in electrical grid components. In recent decades, guyed transmission towers have become a prominent choice in China due to their strength, ease of installation, esthetic appeal, and affordability. Among these innovations, V-shaped guyed towers represent a significant development in the structural design of guyed towers. Long-term operation of cable towers may lead to problems such as relaxation of internal forces in the cables and rusting of metal connections at the tower base, which might influence the stress state of the tower structure significantly. Especially, a simple method of wrapping the base hinge with concrete was usually applied for preventing further rusting of the metal components. Thus, the rotation at the tower base was restricted to a large extent, which changed the tower base condition. However, a critical concern with V-shaped guyed towers is their heavy reliance on guy wires for support and stability [1]. It is essential to ensure the appropriate tension and real base condition of the guy wires, as any imbalance in tension reduces the reliability and safety of the tower, especially under challenging environmental conditions such as strong winds, ice, heavy snowfall, and extreme temperatures [2,3,4].
Numerous scholars have conducted studies to evaluate the performance and safety of guyed transmission towers under various loading conditions using either the finite element method or comprehensive evaluation methods. For instance, H. Max Irvine, in his book, “Cable Structures” [5], introduced the idea of linearized static response of guy wires and stability of guyed towers, which laid a foundation for further research. Jiang Lan et al. applied both the Bayesian Network (BN) method and the Fault Tree (FT) method, offering valuable insights for the safety assessment and maintenance of transmission line guyed towers [6]. Wang Jinyu et al., utilizing the matter–element extension theory, assessed the impact of meteorological factors on the safety of fundamental structures such as insulators, conductors, and lightning arresters within transmission line systems [7]. Tan Rong et al. investigated the design safety of ultra-high tower structures using the Transmission Tower Analysis (TTA) program [8]. Zhao and Wang conducted strength tests on 500 kV guyed transmission towers under static wind loads and proposed feasible reinforcement solutions to enhance the safety and stability of these structures [9]. Zhu et al. performed a fragility analysis and evaluated the wind directionality-based failure probability of transmission towers under strong winds. They developed a method to calculate the damage and collapse probabilities of towers, taking into account wind directionality [3]. Jiang et al. studied the safety performance of transmission tower-line systems under uneven settlement conditions, highlighting the importance of considering the impact of foundation displacement on tower stability and cable stress [10]. Additionally, Fu and Li conducted an uncertainty analysis of the strength capacity and failure paths of transmission towers under wind loads [11]. Despite this extensive body of research, limited research has focused on the comparative impact of real tension variability across guy wires and real change in the base condition in V-shaped tower designs.
In this study, two V-shaped guyed towers from a 500 kV transmission line, which have been in service for more than three decades in the northern suburbs of Hubei Province, were selected and analyzed. We employed on-site measurements to gather actual tension force data from the guy wires and also considered the possible boundary conditions that may change. The finite element method was used to simulate the performance of the guy wires under the designed ice and strong wind loads. The primary aim of this research is to compare the current condition of the guy wires with the original design specifications, evaluating whether, after years of service, the guy wires still meet their design specifications under the designed ice and wind loads.

2. Tension Force and Material Properties of Guy Wires

2.1. Tension Force Test

This paper conducted on-site measurements of the tension forces in the guy wires of two V-shaped guyed towers (see Figure 1). Each tower is equipped with four sets of symmetrically arranged guy wires, with two wires per set. The SGSS-200 kN tension meter (Shanghai Shigan Industrial CO., Ltd, Shanghai, China) was employed to measure the tension in each wire, with each measurement repeated three times. The measured tension values (N0,i, i = 1, 2, and 3) for each wire are recorded in Table 1. Additionally, the diameter of each wire was measured three times (D0,i, i = 1, 2, and 3), and the average value was taken to calculate the cross-sectional area, used to determine the stress in the guy wire, which is also listed in Table 1. In the table, N0,av and D0,av represent the average tension and average diameter, respectively. The calculated average tensile stress σG0,t can be calculated as follows:
σ G 0 , t = 4 N 0 , a v π   D 0 , a v 2
The identification of the guy wires for the guyed tower is illustrated in Figure 2. The guy wires are arranged in a clockwise sequence and are designated as G1, G2, G3, and G4, with G1 representing the guy wire on the left side of the tower’s front elevation. In Figure 2, each position in the same direction has two guy wires, distinguished as A and B, which are also identified in Table 1.
According to the specifications outlined in the original design drawings for the selected guyed tower, the initial stress in the V-shaped guy wires is set at 120~160 MPa. A comparison between the measured stress data of the guy wires and the specified design value (taken here as 140 MPa) reveals that the stress levels of the majority of the guy wires range between 30% and 50% of the design value, with the maximum stress level reaching only 54% of the design state and the minimum stress level dropping to 22% of the design state. Consequently, the actual stress state of both towers exhibits significant reductions when compared to the design conditions.

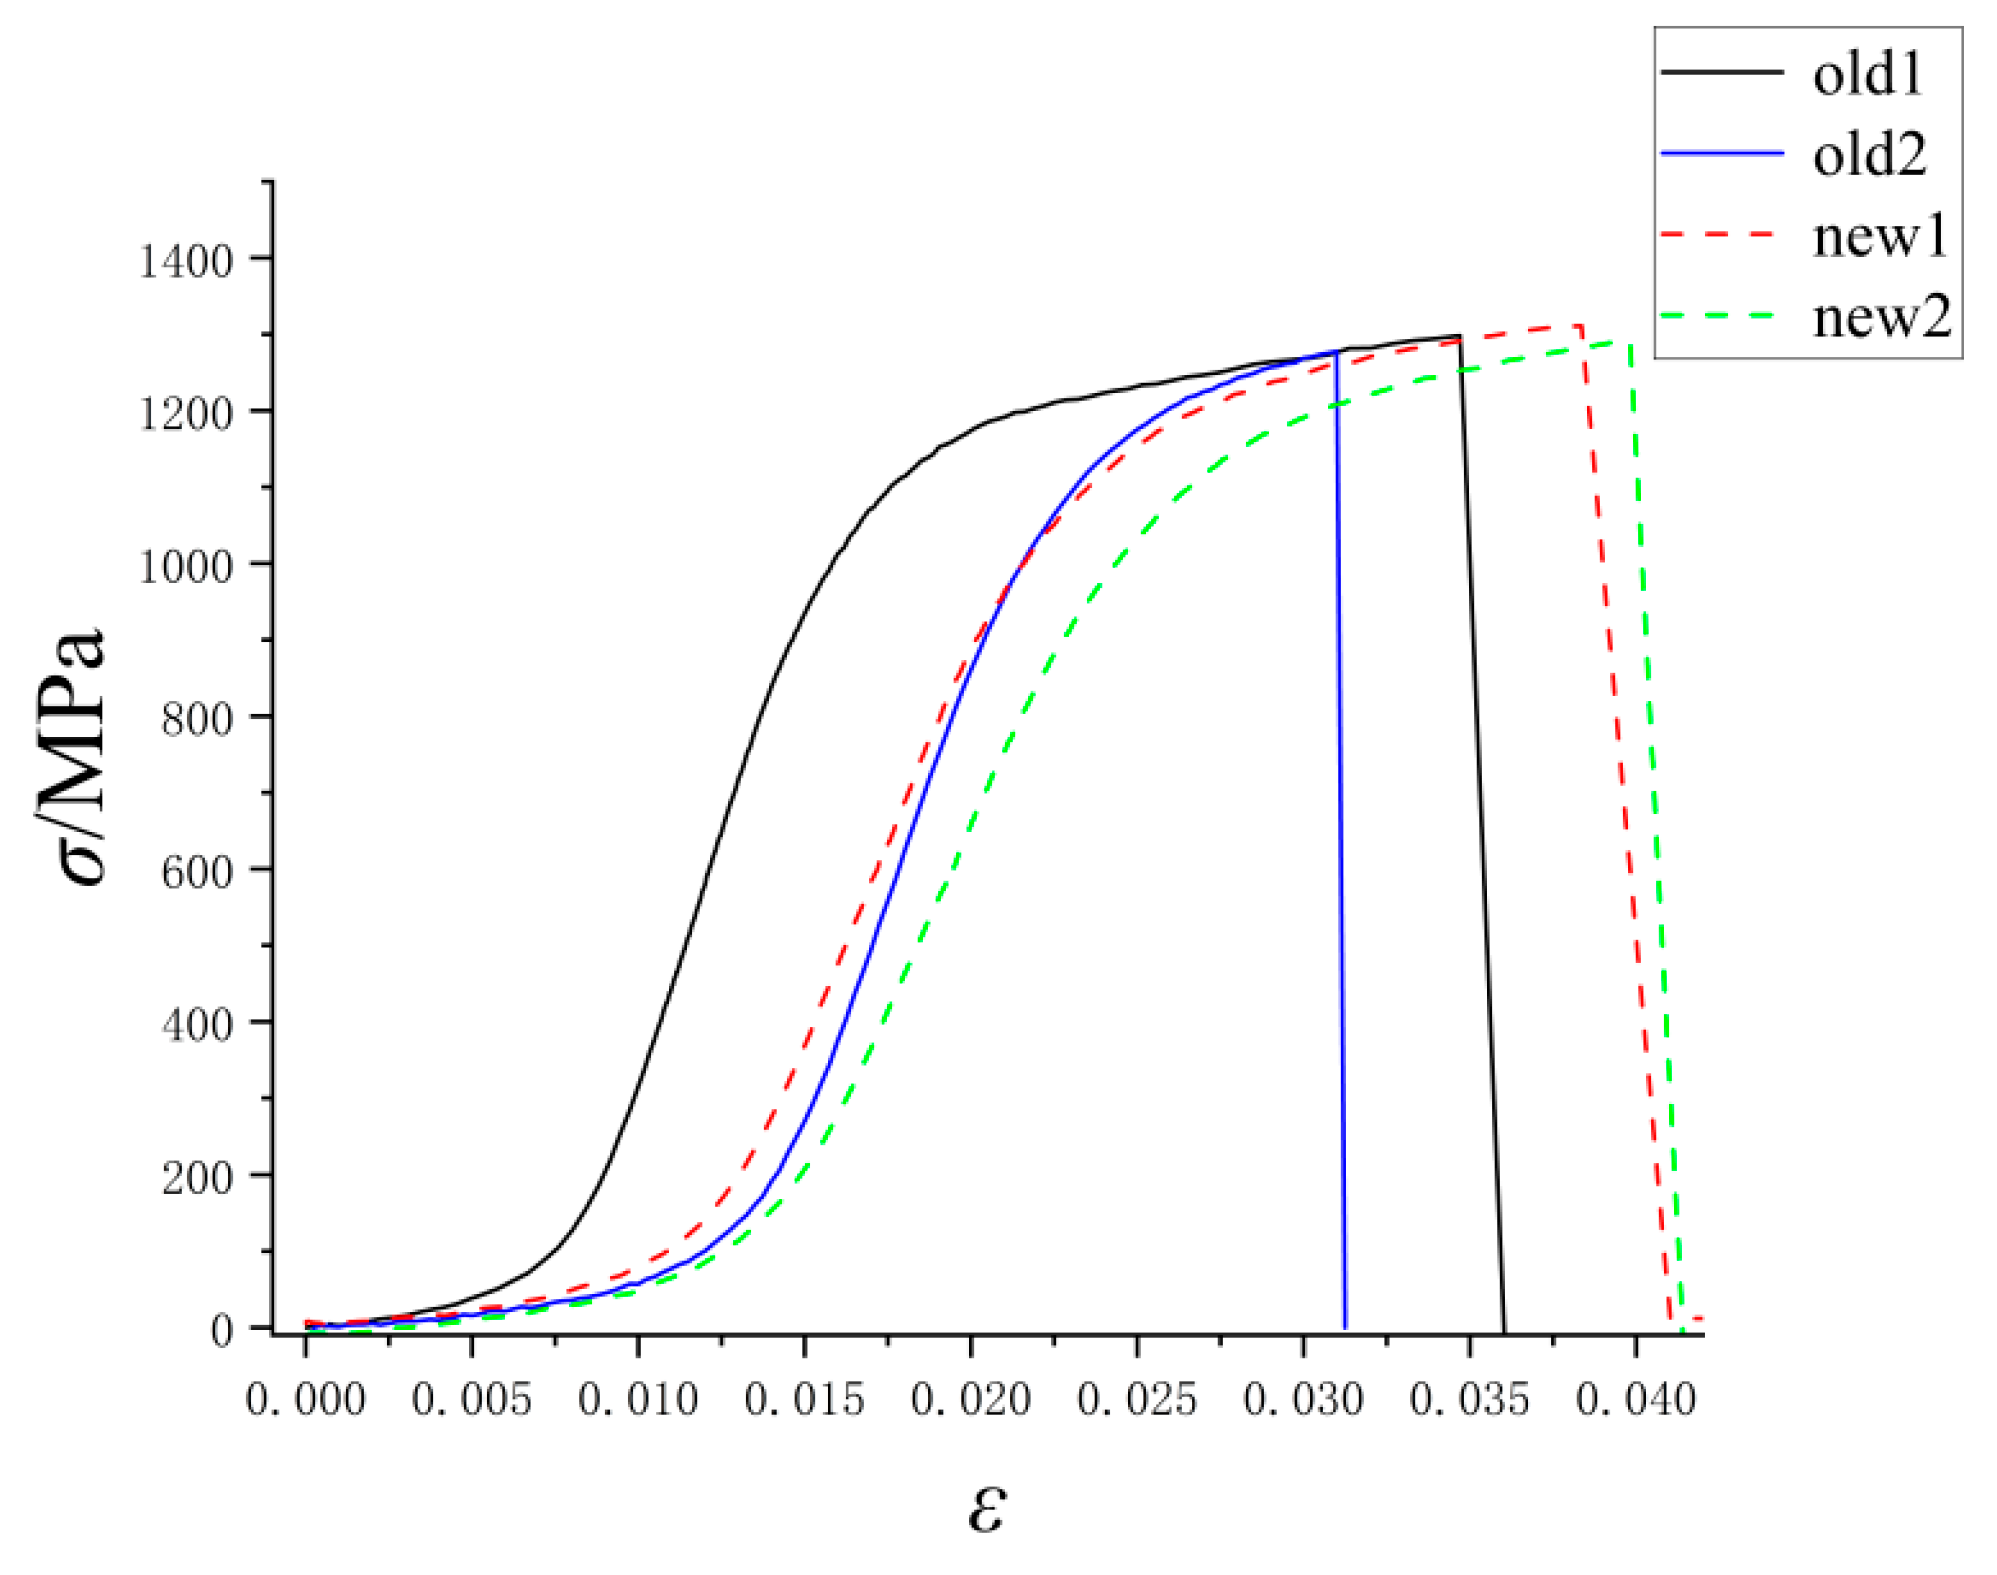
2.2. Material Properties Testing of Guy Wire

Based on the Chinese standard GB/T 228.1-2021 [12], the used guy wires were removed from the actual tower site, and new guy wires of the same material standard were split into single-strand guy wires to make tensile test specimens. Material properties testing was conducted using an MTS universal testing machine, resulting in the stress–strain curves shown in Figure 3. In Figure 3, the labels “old 1” and “old 2” denote the used guy wires, and the labels “new 1” and “new 2” denote the new guy wires.
From Figure 3, it can be observed that during the initial stage of the tensile test, the guy wire is not fully taut, resulting in rapid displacement changes and, consequently, rapid strain increase. Once the guy wire became completely tensioned, it entered the elastic phase, where the curve slope significantly increased compared to the previous phase. As the test load continued to increase, the guy wire material reached its elastic limit and then yielded. The stress–strain curve indicates that the yield strength of a single strand guy wire is approximately 1100 MPa, with an ultimate strength of around 1300 MPa. According to the Chinese standard GB 50545-2010 [13], the ultimate stress of the 19 stranded galvanized steel wire used in actual use is about 720 MPa, and the yield stress is about 600 MPa. The yield strength and ultimate strength of the used guy wires show no significant difference from those of the unused guy wires. Therefore, in subsequent model creation, these values will be used as the basic material properties of the guy wires.

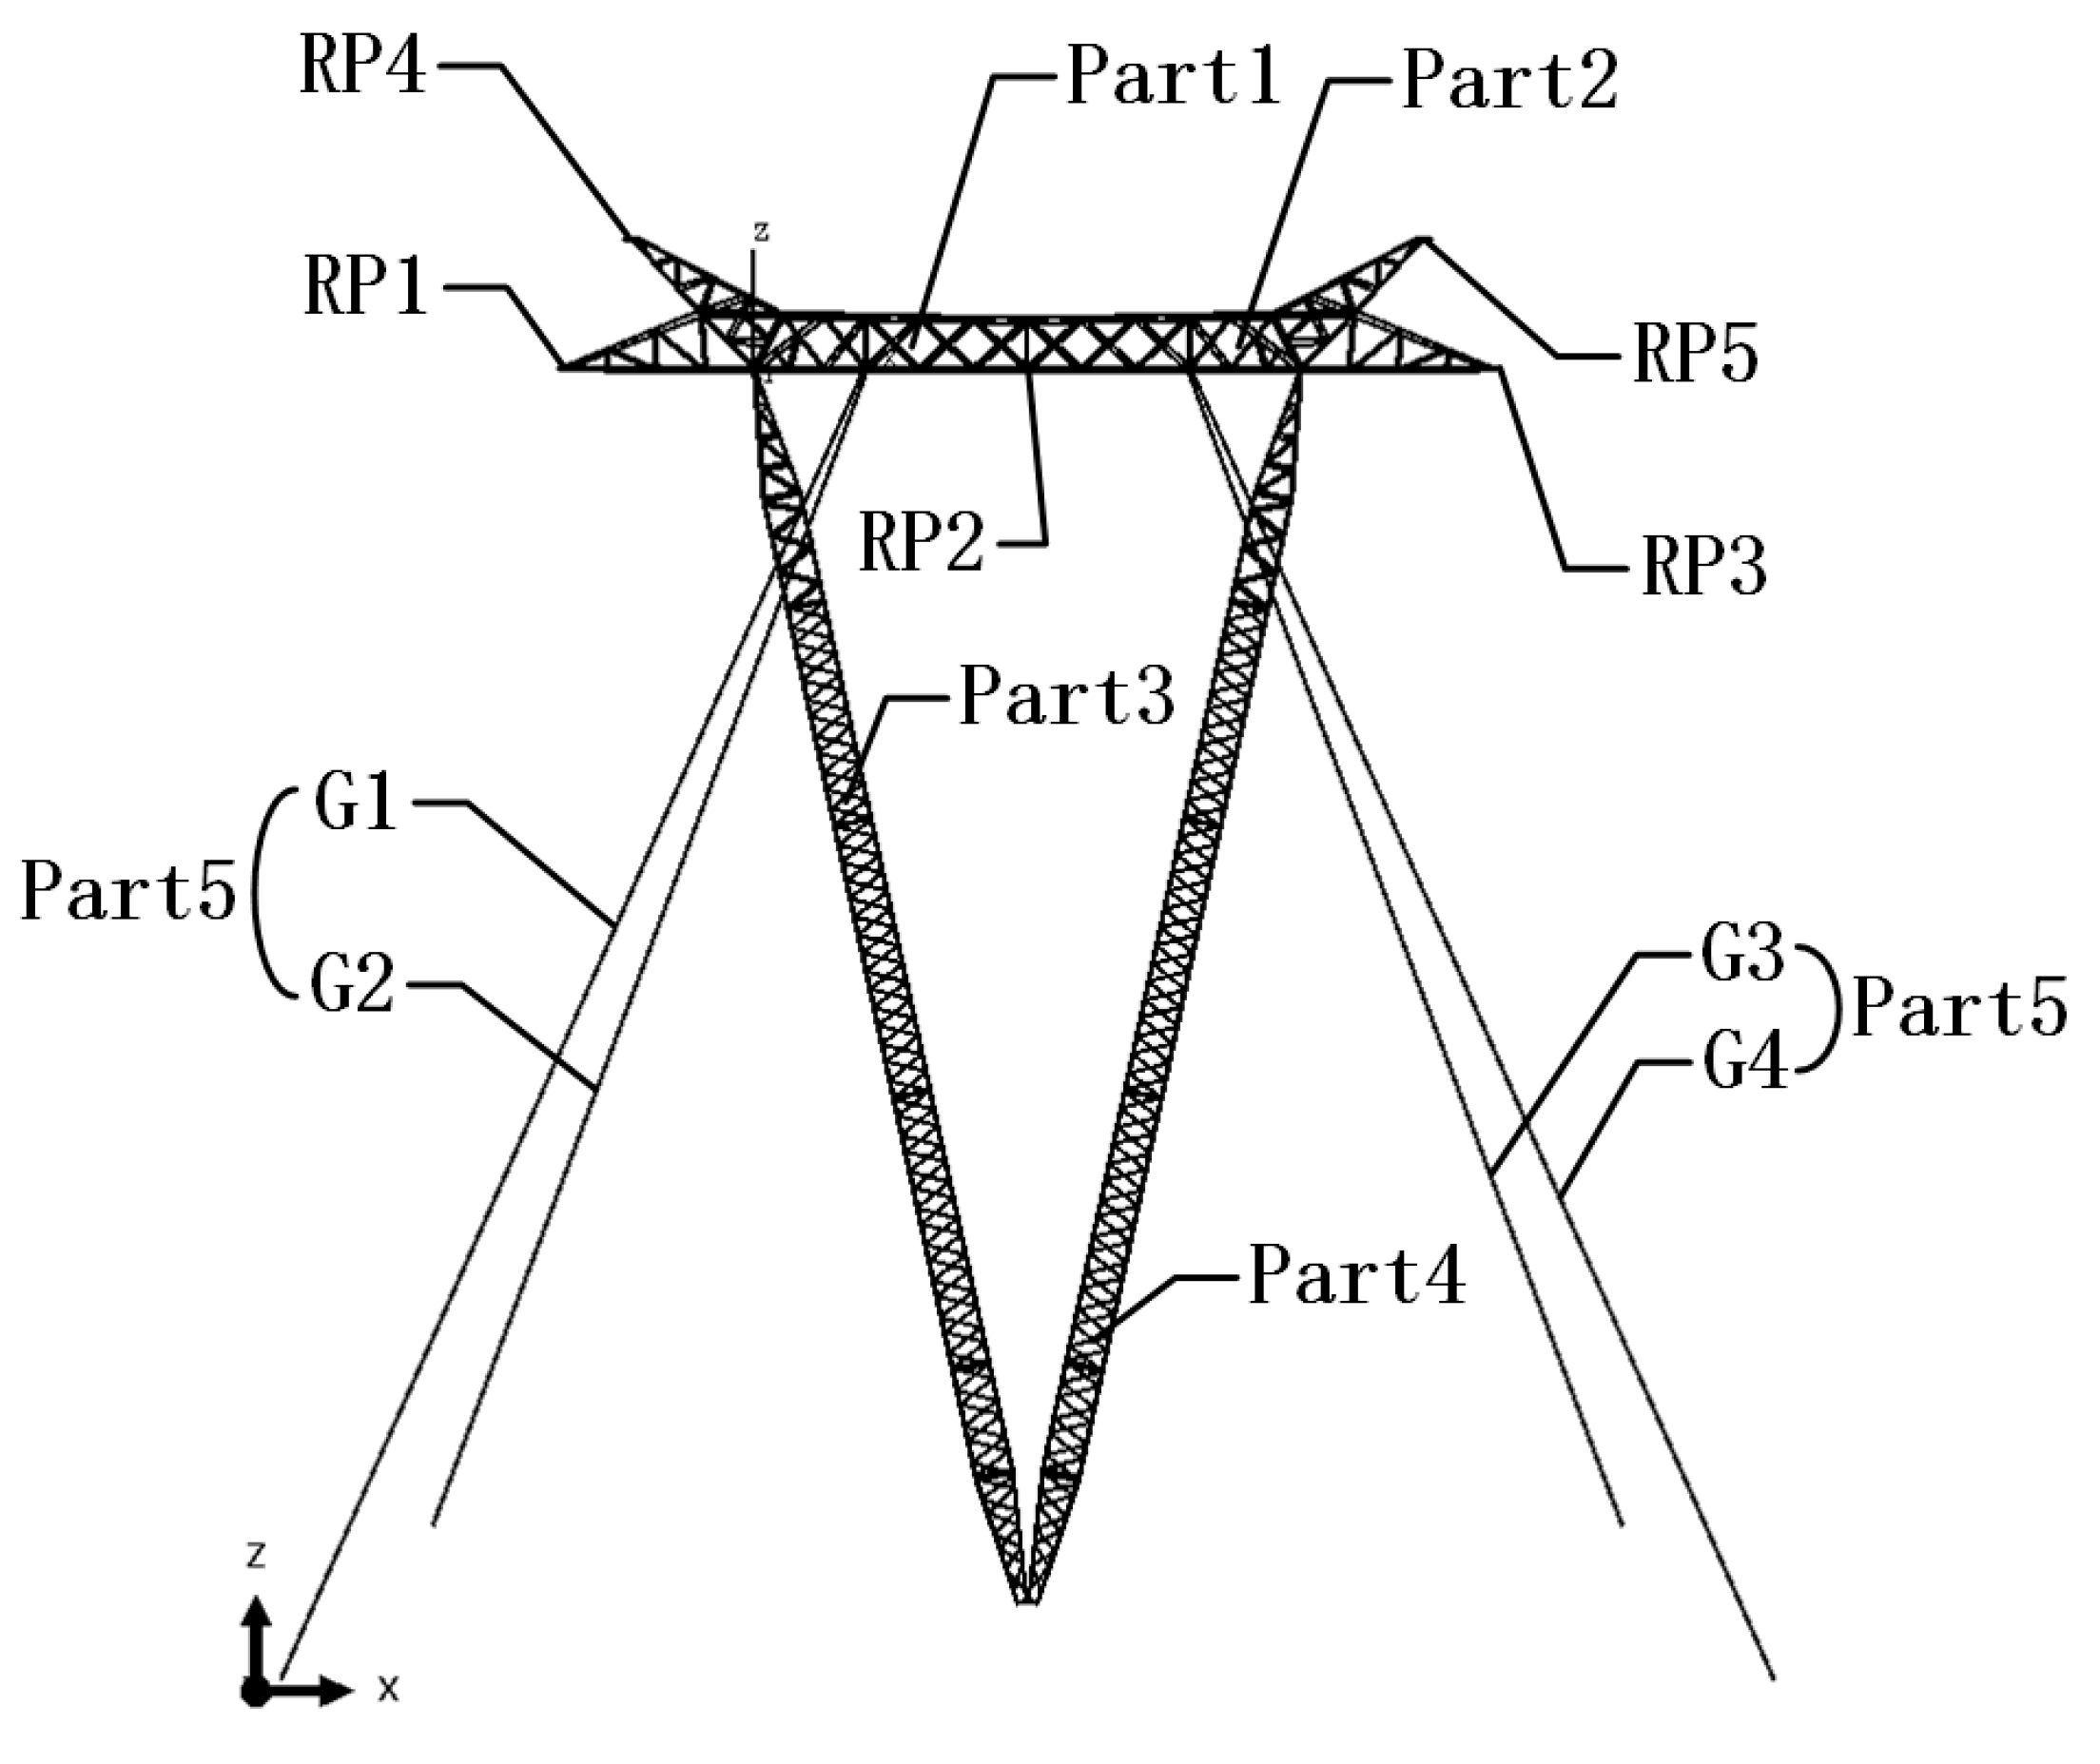
3. Finite Element Model for the Guyed Tower

Based on the relevant design drawings, the guyed tower is constructed of steel and uses bolts to connect the angles and plates. During the model creation, the tower body is modeled entirely using beam elements, while the guy wires are modeled using truss elements. The connections between members are rigidly connected beam elements. The entire transmission tower is divided into five parts as shown in Figure 2, and individual component models are created before being assembled into the final guyed tower model. The connections between Parts 1, 2, 3, and 4 are tied, while the connection between Part 5 (the guy wires) and Parts 1 and 2 is coupled. The mesh size for the tower members is 0.2 m. One of the primary objectives of this study is to discuss the impact of guy wire internal force variations on the mechanical state of transmission tower structures. In this context, the effect of guy wire mesh division on the computational results is addressed. The relationship curve of internal forces in guy wires G1 and G2 under high-wind load conditions, as a function of the number of guy wire elements, is shown in Figure 4. The results indicate that when the number of mesh elements per guy wire is no less than 10, the stress values in G1 and G2 remain stable at 262.5 MPa and 264.2 MPa, respectively. Therefore, a mesh division of 10 elements per guy wire is chosen for subsequent analysis. It should be noted that the two wires, A and B, which are set in the same position and direction mentioned above, are simplified as a single wire with the same cross-sectional area as the total of these two wires.
Boundary conditions for the finite element model are established based on the transmission tower drawings and their actual operational state. At the base of the four guy wires, hinges are implemented, constraining all three axial degrees of freedom (U1 = U2 = U3 = 0) and allowing only rotations. A reference point is positioned at the center of each of the two tower bases, coupled to the bottom of each member, and these reference points are set as pinned (U1 = U2 = U3 = 0). The maintenance of wrapping the metal components of the tower base was set as a fixed boundary condition, i.e., U1 = U2 = U3 = 0 and UR1 = UR2 = UR3 = 0.
According to the special loading conditions specified in the design, as shown in Figure 2, reference points RP1, RP2, RP3, RP4, and RP5 are created at five positions on the top of the model tower. These reference points are coupled with the tower members, and corresponding concentrated loads are applied to each reference point. These reference points correspond to the three transmission wire joints and two ground wire joints of the transmission tower. Two loading conditions, including the ice loading and the high wind loading, are selected for simulation analysis. Under the ice loading, the lateral load is relatively small, while the vertical load is larger. Under the high wind conditions, the lateral load is larger, while the vertical load is smaller, making the comparison between the two conditions quite distinct. Among them, the lateral load under the ice loading conditions is 5.9 kN for RP1~RP3, 1.2 kN for RP4 and RP5, and the vertical load is 49 kN for RP1~RP3 and 8.35 kN for RP4 and RP5, respectively; under the high wind loading conditions, the lateral load is 18.8 kN for RP1~RP3 and 2.9 kN for RP4 and RP5, and the vertical load is 27.7 kN for RP1~RP3 and 4.25 kN for RP4 and RP5, respectively. Noting that the measured internal forces in the guy wires of the towers show that the stresses in the guy wires G3 and G4 are lower than those in the guy wires G1 and G2, the lateral load is applied to be along the x-positive direction in the xoz plane, which is towards the guy wires G3 and G4, to simulate the most unfavorable loading conditions of the guyed tower. Additionally, a gravitational acceleration of 9.8 m/s2 is applied in the vertical direction to account for the self-weight of the structure.
As previously mentioned, truss elements are utilized to simulate the guy wires of the transmission tower, and a cooling method is employed to apply prestress, effectively achieving stress loading in the guy wires. The linear thermal expansion coefficient is defined by the following formula:
α = L L T
where ΔL represents the change in length of the object, L denotes the original length of the object, and ΔT indicates the change in temperature. In the truss element, the ratio of ΔL to L corresponds to the normal strain ε. The normal stress σ can be derived using the following formula:
σ = E α T
Herein, σ represents the normal stress, and E denotes the elastic modulus. In the simulation, the prestress settings will be divided into three scenarios: In the first scenario, the prestress values of all guy wires are set to be the same as the measured stress values of the guy wires of Tower 1; in the second scenario, the prestress values of all guy wires are set to be the same as the measured stress values of the guy wires of Tower 2; in the third scenario, the prestress of all guy wires is set to the initial prestress value of 140 MPa as given in the design drawings, and this model is referred to as Tower 3. When creating the model, the guy wire section was simplified by replacing the actual double guy wires with a single equivalent guy wire, and the input guy wire stress value should be the measured average stress value of guy wires A and B, according to Table 1. The initial stress values σG0 input for each guy wire of each tower are shown in Table 2. In the model analysis, various types of steel used are assumed to follow an idealized elastoplastic model, with a Young’s modulus of 206 GPa and a Poisson’s ratio of 0.3; the Young’s modulus of guy wires is 110 GPa, and Poisson’s ratio is 0.25. The yield strength of the guy wires is taken from the aforementioned test values, and the yield strength of the steel material is 345 MPa. Furthermore, geometric nonlinearity was also considered.
It was noted that the ambient temperature during the field measurement of guy wire data was 25 °C. As the relevant ambient temperature during an ice-loading condition should be typically at or below 0 °C, a temperature reduction of 25 °C was also considered when the initial wire stress was applied using the temperature reduction method in the model. Conversely, strong wind conditions may occur at any time of the year; therefore, only the environmental temperature during the field stress measurement is considered for these scenarios. In practice, a temperature decrease tightens the guy wires, increasing internal forces, which generally enhances the structural performance of the guyed tower. To simulate the most adverse loading condition for the tower, the analysis includes the effect of a 10 °C temperature increase—representing an ambient temperature of approximately 35 °C—after applying the field-measured stress values using the temperature reduction method. This approach ensures a comprehensive assessment of the guyed tower’s mechanical performance under varying environmental conditions.

4. Simulation Results

Simulations were conducted for Tower 1, Tower 2, and Tower 3 under two loading conditions: the ice loading and the high wind loading, considering both fixed and pinned boundary conditions at the tower base. This analysis yielded the stress states and displacement conditions for the guyed towers under various scenarios. Representative stress contour plots and displacement contour plots made by Abaqus CAE (2023) are shown in Figure 5. From Figure 5, it can be observed that significant stress concentrations occur on the left and right sides of the tower top (RP1 and RP3) and at the tower base. The stresses at RP1 and RP3 are primarily attributed to these points being the locations of applied loads. The stress levels at these points are relatively low (less than 160 MPa) and are therefore not discussed further in subsequent sections. The focus of the analysis is on the stress distribution at the tower base. An enlarged view of the tower base in Figure 5 reveals that the maximum stress occurs in the members closest to the bottom. In some cases, these stresses approach the yield strength of the material. The subsequent discussion emphasizes the implications of these stress levels on the structural integrity of the tower base.
The stress in the guy wires (σG) under the ice loading and the high wind loading, as well as the maximum displacement (Umax) of the tower, were extracted and recorded in Table 3 and Table 4, respectively. In these tables, σF represents the maximum Mises stress at the tower base, and β denotes the inclination angle of the tower. This angle was calculated based on the relationship between the lateral and vertical displacements at the tower top center point and the design tower height (H = 33 m), specifically, β = tan 1 U 1 H U 3 , where U1 is the horizontal displacement in the x-direction and U3 is the vertical displacement in the z-direction. The parameters δU and δβ represent the reduction ratios in maximum displacement and tower inclination angle, respectively, comparing the fixed condition to the pinned condition for each tower. In Table 4, the data within the parentheses represent the simulated guy wire stress under a 25 °C condition, while the data outside the parentheses correspond to the simulation under a 35 °C condition.
Table 3 reveals that under both the pinned and fixed conditions at the tower base, the maximum stress in the tower body is concentrated near RP1 and the base of the tower, with the stresses in the left guy wires G1 and G2 significantly exceeding those in G3 and G4:
(1)
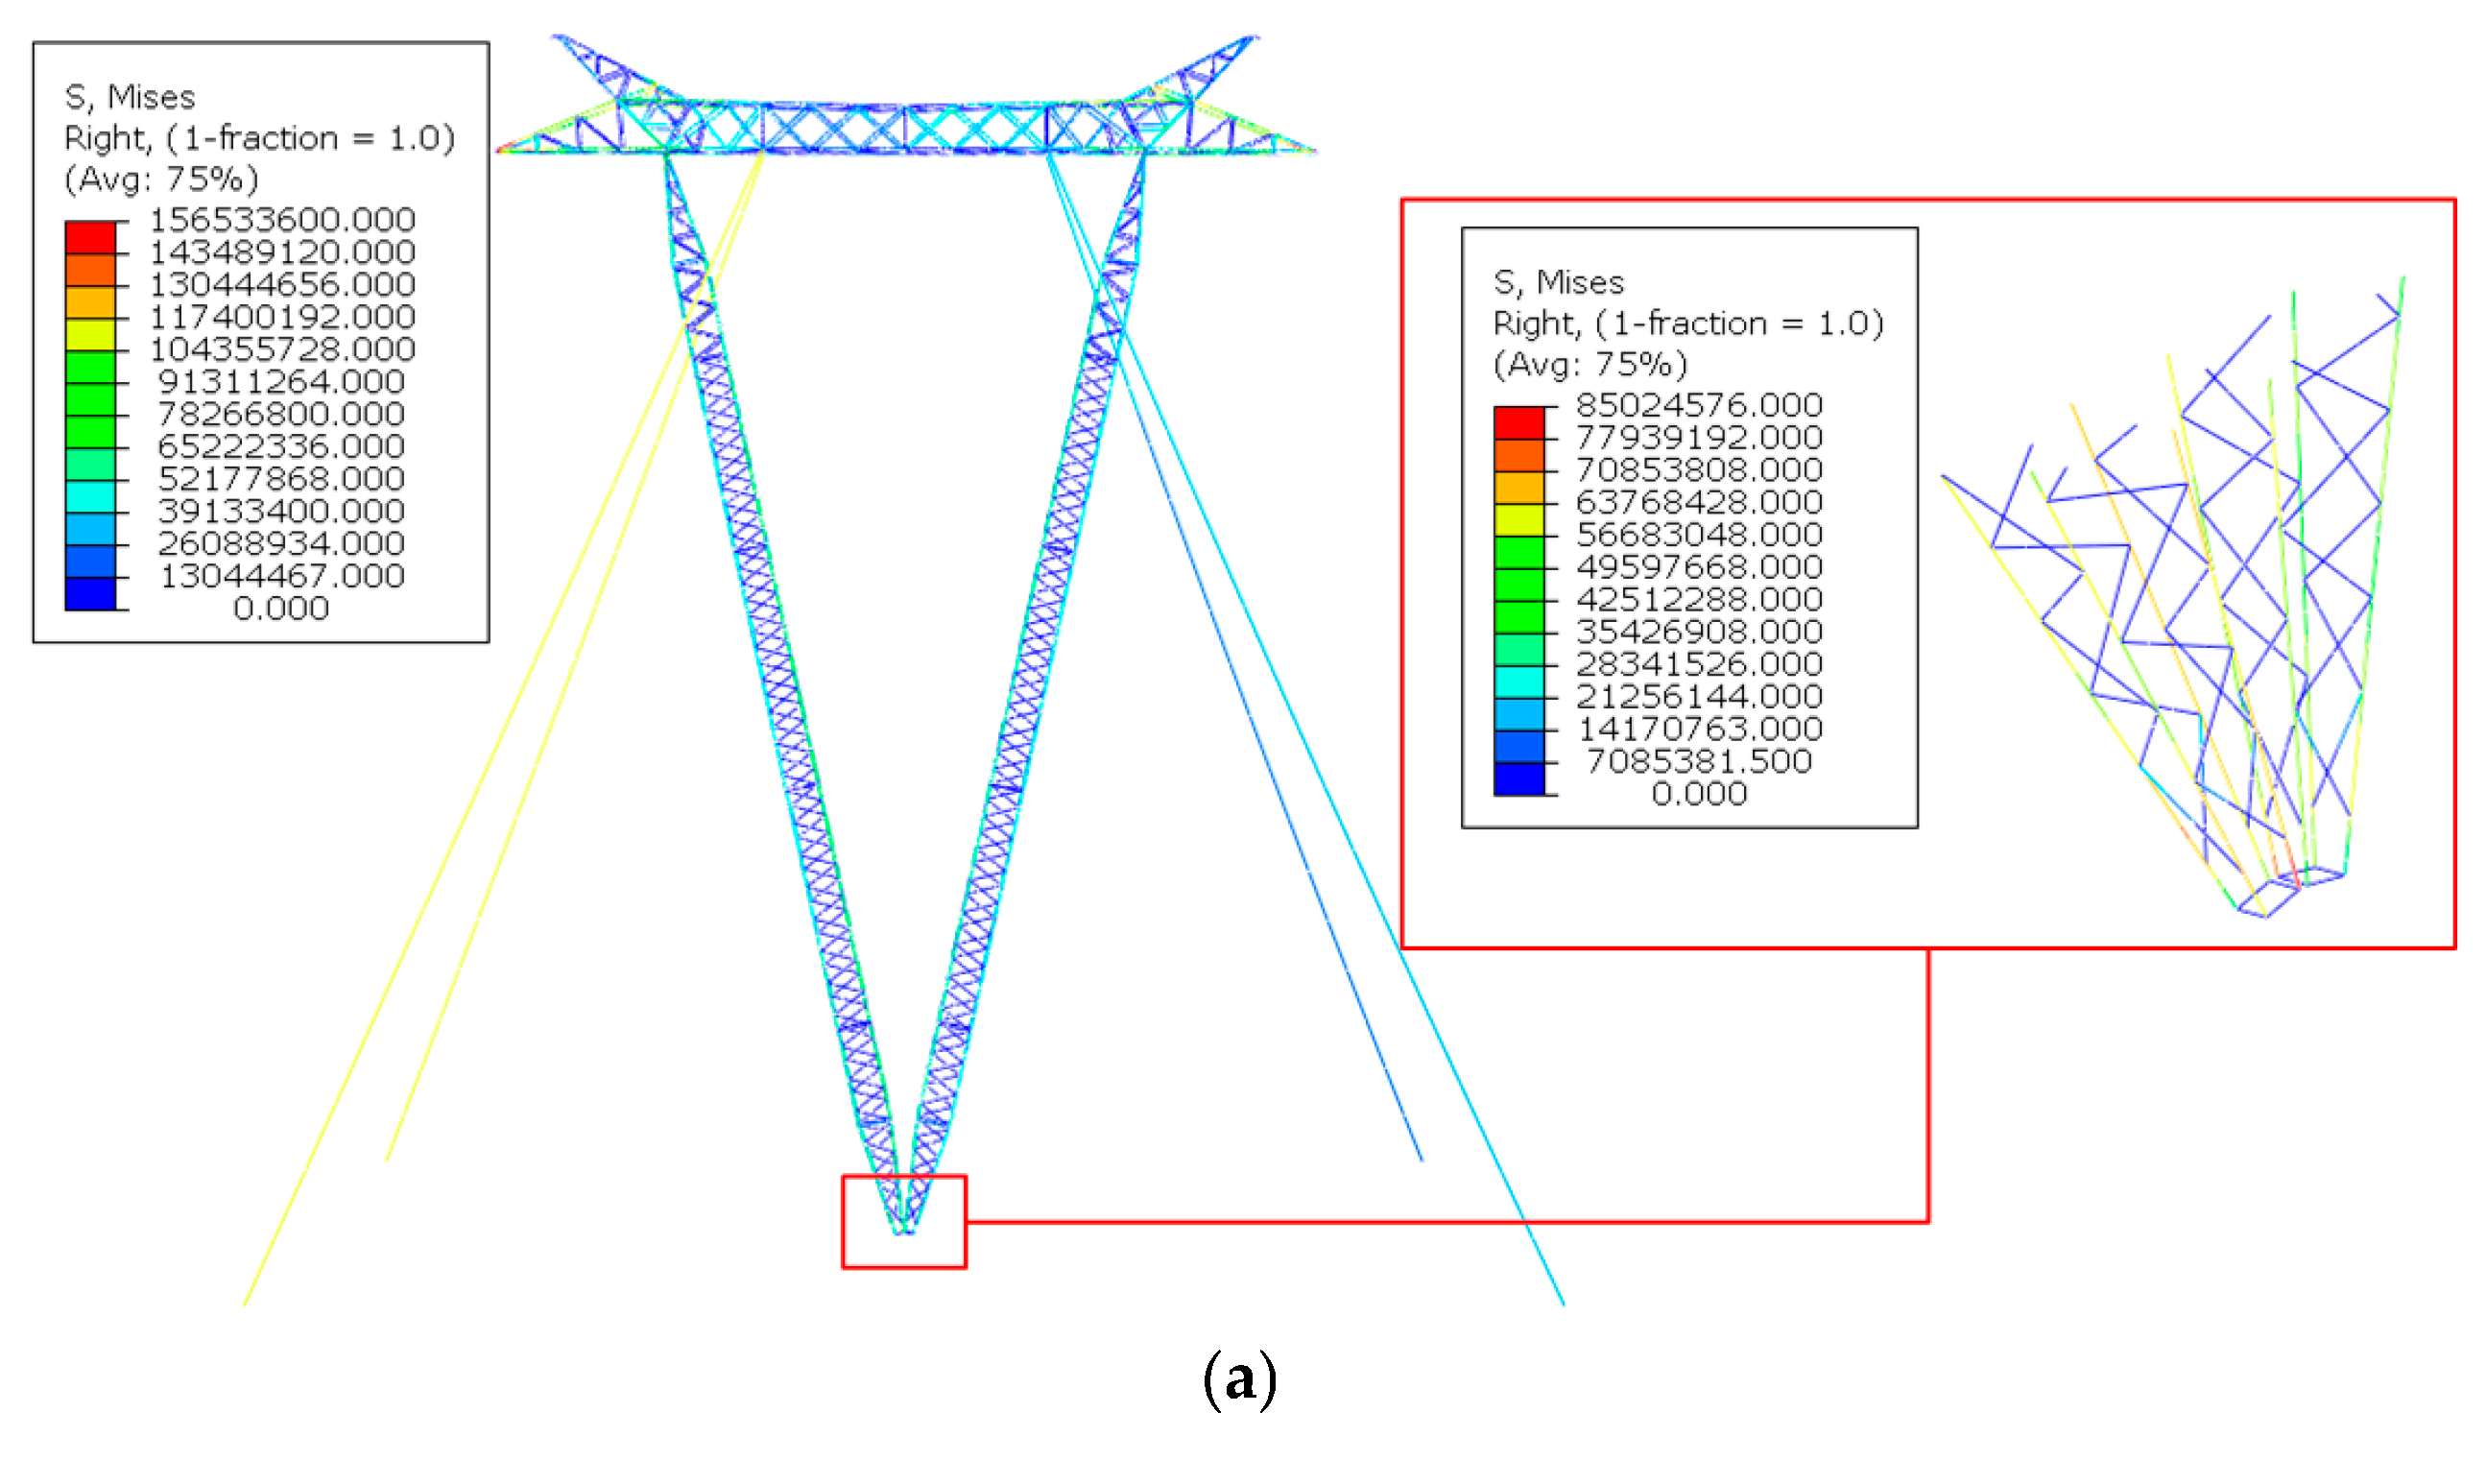
Under the ice loading condition, when Towers 1 and 2 are configured with hinged bases, the maximum stresses of the tower body are 85.02 MPa and 91.69 MPa, respectively. When the base is fixed, the maximum stresses of the tower body are 154.70 MPa and 160.30 MPa. This indicates that the differences in internal forces of the guy lines have a relatively minor impact on the maximum stress of the tower body under ice loading conditions. Given that the current internal forces in the guy wires differ significantly from the original design conditions, whether the base is pinned or fixed, the maximum stress in the tower body shows notable variations, with Towers 1 and 2 exhibiting approximately a 20% reduction in maximum stress compared to Tower 3.
(2)
Under the ice loading condition, analysis of the maximum stress at the tower base indicates significant variations between the hinged and fixed conditions. Compared to the hinged base condition, the maximum stresses for Towers 1, 2, and 3 increase by 82%, 75%, and 61%, respectively, when the bases are fixed. When the initial stress in the guy wires is relatively high, the magnitude of the maximum stress increase tends to decrease. This is attributed to the greater initial stress enhancing the guy wires’ capacity to resist lateral loads, thereby reducing the bending moments experienced at the fixed base and narrowing the difference in maximum stress compared to the pinned condition.
(3)
Under the ice loading condition, it was observed that for Towers 1, 2, and 3, the final stresses of the four groups of guy wires in the pinned configuration are similar to those in the fixed configuration, indicating that the final stress levels are largely independent of the boundary conditions at the tower base. A comparison of stresses among the guy lines of Towers 1, 2, and 3 reveals that Tower 3 exhibits the highest final stresses, followed by Tower 2, with Tower 1 showing the lowest. This suggests a direct proportional relationship between guy wire stress and initial stress under the ice loading conditions. Notably, under the ice loading condition, who has a small lateral load, the stresses in guy wires G3 and G4 of Tower 1 are only around 27 MPa. Thus, if the current tension in the guy wires is too low, they may be in a fully relaxed state or experiencing excessively low stress under the ice loading.
(4)
Analysis of maximum displacement and the inclination angle of the tower body shows that, compared to the pinned condition, the maximum displacements and inclination angles are relatively smaller when the towers are fixed. Given the relatively low initial stress, the reduction in maximum displacement and inclination angle for Tower 1 when transitioning from pinned to fixed conditions is significant. A comparison of the maximum displacements and inclination angles of Towers 1, 2, and 3 indicates that they decrease with an increase in the initial stress. When compared to Tower 3, the displacements for Tower 1 increase by 24.3% and 24.0% under hinged and fixed conditions, respectively, while maximum displacements of Tower 2 increase by 18.1% and 17.0%. Therefore, the increase in tower body displacement, compared to the design state, is related to the initial stress in the guy lines.
From Table 4, it can be observed that the 35 °C condition is slightly more unfavorable for the guyed tower compared to the 25 °C condition. Although the final guy wire stress differs only slightly between the two conditions, the tower displacement and tilt angle under the 35 °C condition are greater than those under 25 °C. Additionally, the stress at the tower base is higher under the 35 °C condition. To evaluate the safety of the guyed tower under more adverse conditions, the following analysis focuses on the data simulated for the 35 °C condition.
Analysis of Table 4 reveals the following:
(1)
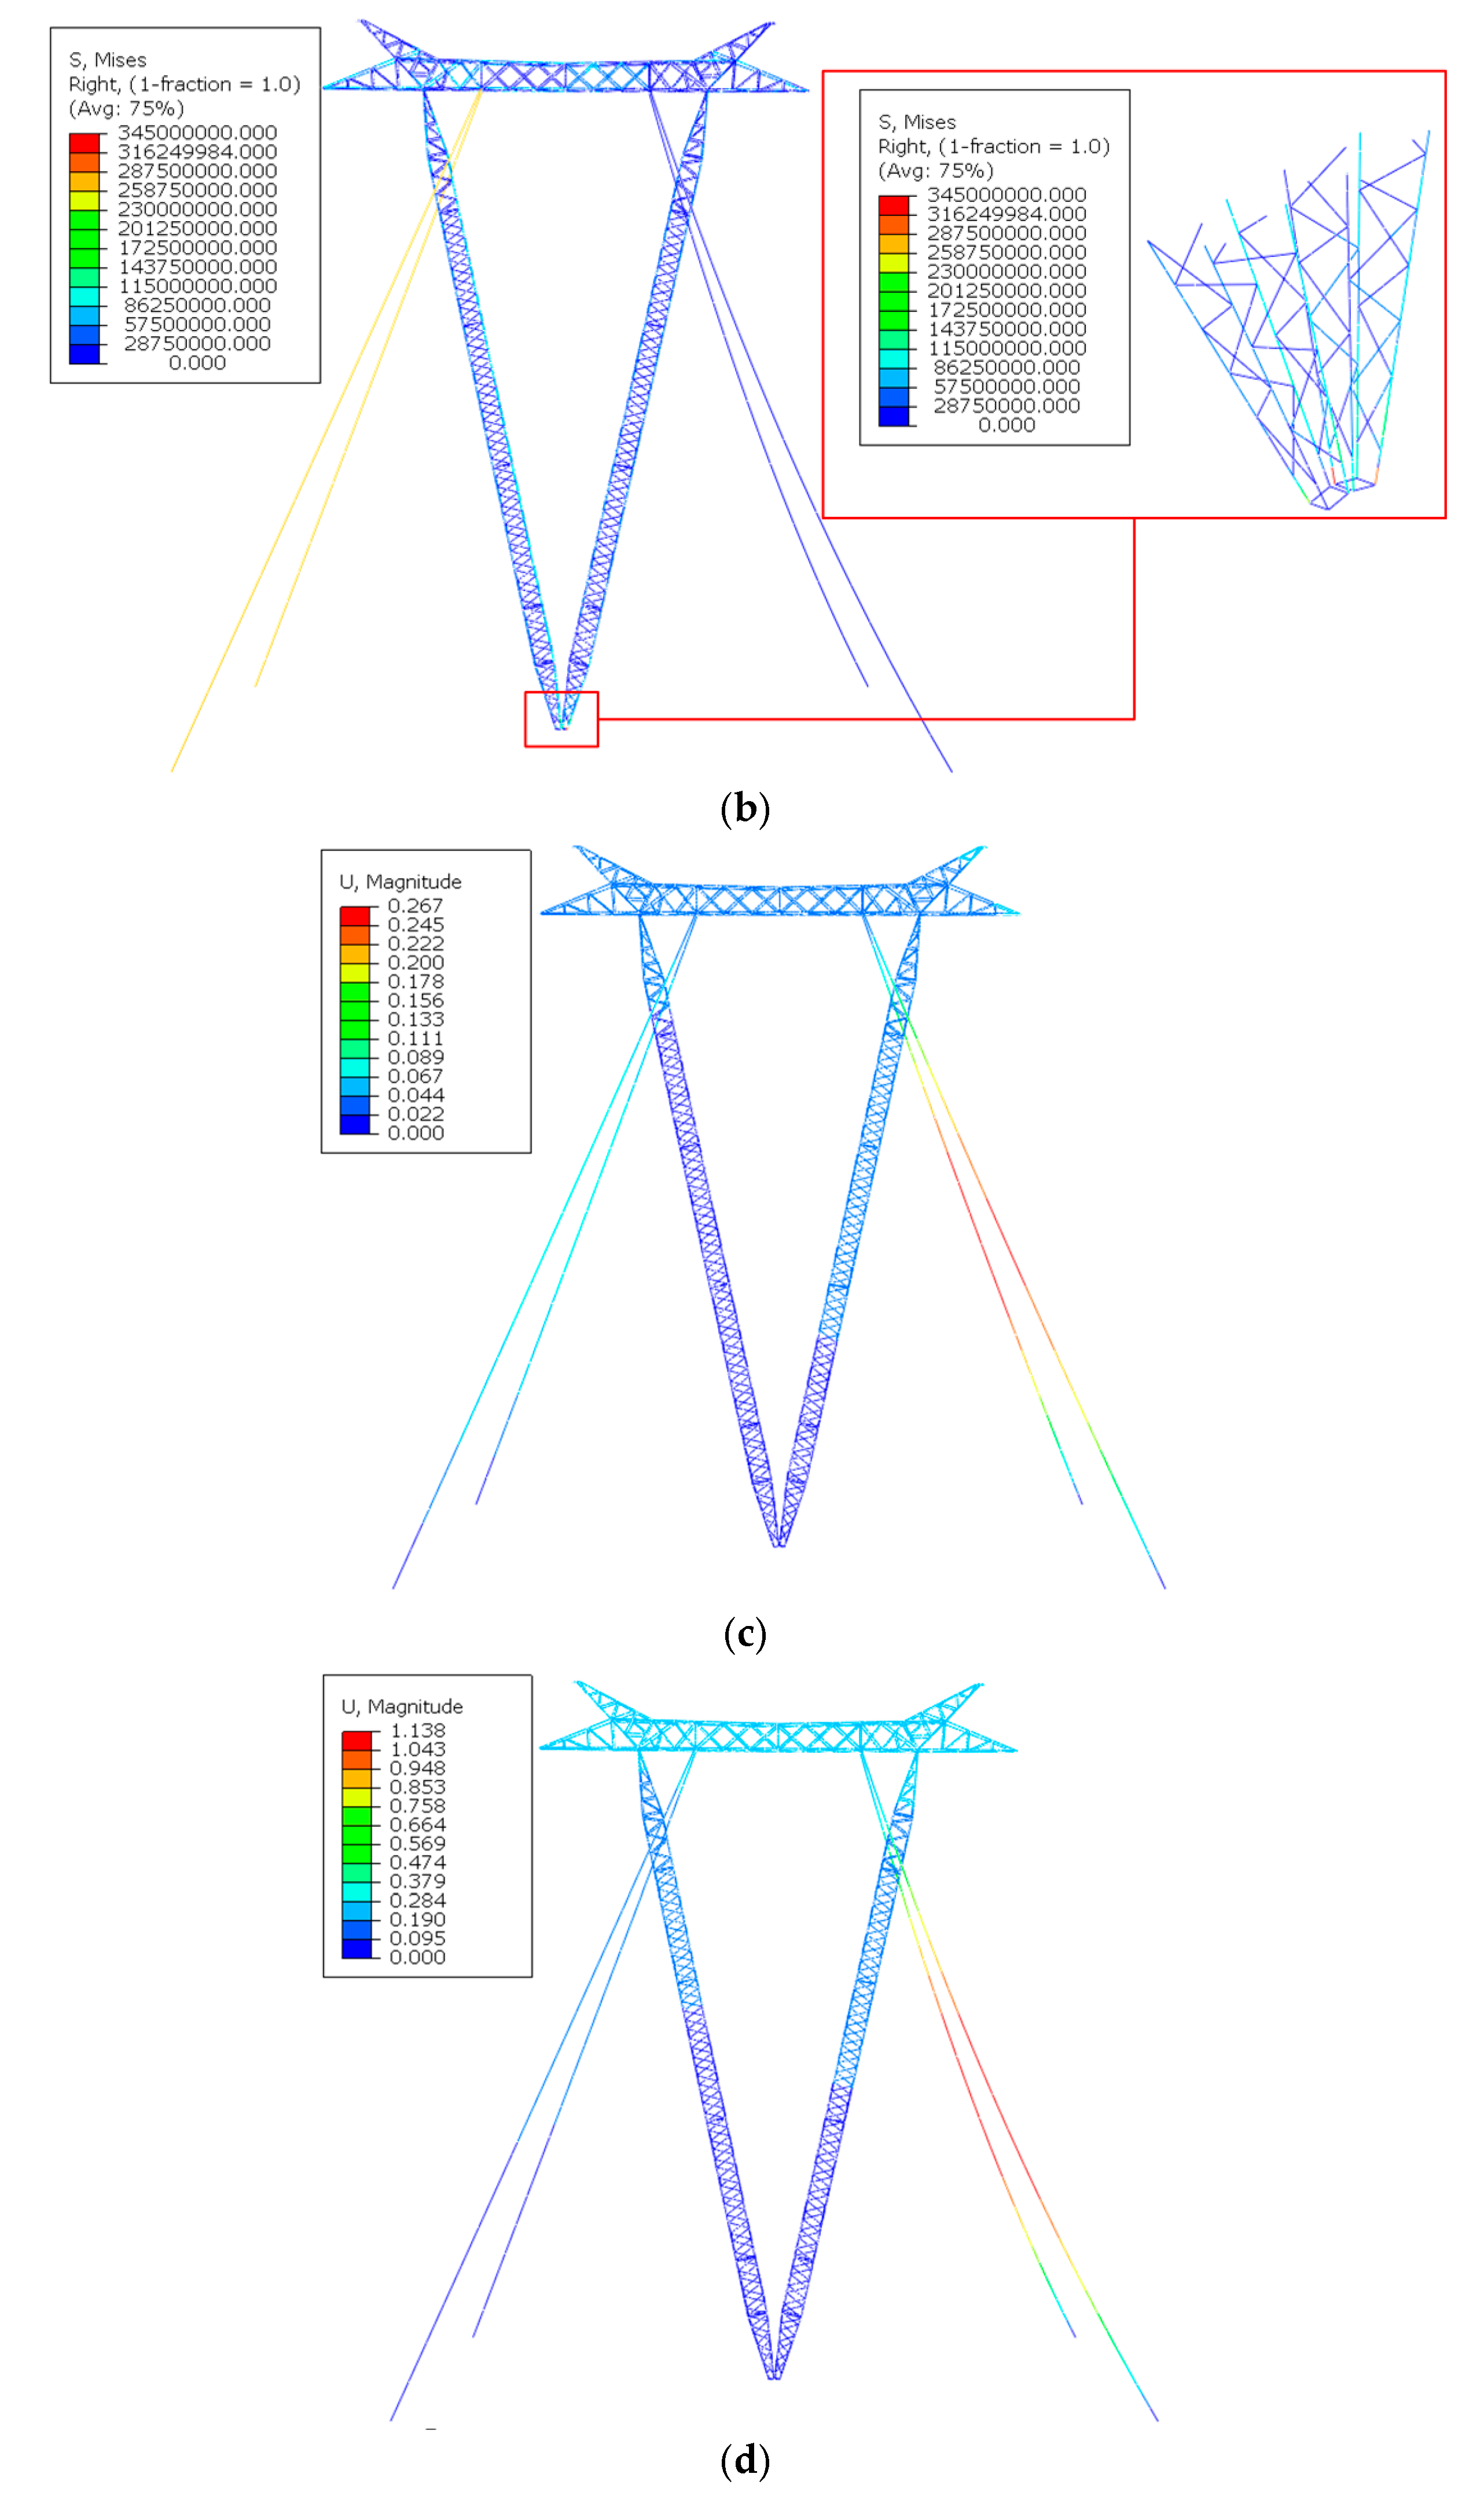
Similar to the ice accretion load scenario, under both pinned and fixed base conditions, the maximum stress in the tower structure is minimally influenced by the initial tensile stress of the guy wires. However, within the same tower, the maximum stress in the fixed model significantly exceeds that of the pinned model. Specifically, when compared to the hinged configuration, the maximum stresses in Towers 1, 2, and 3 under the fixed conditions increase by 270%, 227%, and 137%, respectively. This indicates that under the influence of strong lateral wind loads, converting the tower base from a pinned to a fixed configuration significantly amplifies the maximum stress at the base. Furthermore, when the initial tensile stress is relatively low, the local stress after fixing reaches the yield stress.
(2)
Under the high wind load conditions, when in pinned configuration, the stress in the tension wires G1 and G2 of Towers 1, 2, and 3 is equivalent to that of the fixed connection, exceeding 200 MPa. Conversely, the stress on the guy wires G3 and G4 of all towers is very low, among which the guy wires G3 and G4 of tower 1 and tower 2 are both less than 7 MPa. This indicates that under significant lateral wind loading, the ultimate stress levels in the guy wires are largely independent of the connection configuration at the base of the towers and are more closely related to the initial stress in the guy wires and the direction of the wind. Consequently, if the current tension in the guy wires is insufficient, they may reach a state of complete slackness under the high wind loads, which poses a risk to structural safety.
(3)
The analysis of maximum displacements and tower inclination angles reveals that changing the base connection from pinned to fixed has a minimal impact on the maximum displacements and angular changes in each tower. Unlike scenarios involving ice accumulation, the maximum displacements and tower inclination angles in this case exhibit a significant increase. This is primarily due to the lateral load component of the wind forces. As the initial tensile stress in the guy wires increases, the maximum displacement and tower inclination angle decrease; furthermore, the changes observed when transitioning from pinned to fixed connections are also less pronounced. Specifically, in comparison to Tower 3, Tower 1 experiences increases in maximum displacement of 109% and 107% under the hinged and fixed conditions, respectively. Tower 2 shows increases of 57% and 56% under the same conditions. Consequently, under the high wind load conditions, a reduction in the initial tensile stress of the guy wires significantly compromises the structural safety of the towers.
Furthermore, comparing the relationship between guy wire stress and initial stress under the ice load and the high wind load conditions reveals that, under lower horizontal load scenarios, the initial tensile stress more significantly affects the final stress state of the guy wires. Specifically, as the initial tensile stress increases, the final guy wire stress also increases. In contrast, under conditions of the higher horizontal load, the influence of the initial tensile stress on the final stress state of the guy wires becomes less pronounced; thus, the final guy wire stress is not entirely dependent on the initial tensile stress. Regarding the parameters of maximum displacement and inclination angle of the tower, their values are entirely contingent on the level of the initial tensile stress. Higher initial tensile stress results in reduced maximum displacement and inclination angle of the tower under the identical loading conditions.

5. Discussions

From Table 3 and Table 4, it can also be observed that under ice-loading and high-wind conditions, the models with relatively low initial guy wire prestress exhibit extremely small final stress in guy wires G3 and G4. In such cases, although the final stress in these guy wires remains around 7 MPa, further reducing the material density of the guy wires significantly decreases this stress value. This confirms that the residual stress in G3 and G4 under these conditions is primarily generated by the self-weight of the wire, and the guy wires are approximately slackening or fully relaxed. Therefore, in Towers 1 and 2 under high-wind loads, complete relaxation of the guy wires occurs regardless of whether the tower base is fixed or pinned. Through an investigation of the simulation process, the ratio of the load condition at which G3 and G4 stresses approach full relaxation to the total applied load was determined. The corresponding percentages for various loading scenarios and tower configurations are summarized in Table 5.
In the case of high wind loads, guys G3 and G4 in Towers 1 and 2 fully slacken at around 30% and 45% of the design load level, respectively. However, even when guys G3 and G4 are completely slackening, the maximum stress observed in guys G1 and G2 across these conditions reaches only 269.00 MPa, which is less than 50% of the yield stress of 600 MPa. This indicates that, from a structural loading perspective, there is no immediate risk to the tower body. However, the absence of tension in G3 and G4 compromises the stabilizing effect of these guys, creating potential stability concerns for the overall structure.
Table 3 and Table 4 further reveal that, when the base constraint of the tower changes from a pinned to a fixed connection, the Mises stress at the tower base increases significantly, indicating that the stress state at the base is critical for overall structural safety. According to the data, only Tower 1, under high wind load with a fixed base, reaches the yield stress of 345 MPa at the base. In all other scenarios, the stress levels remain within safe limits. Simulation analysis of Tower 1 under high wind and fixed base conditions shows that the maximum stress at the base reaches the yield stress when 85% of the design load is applied. Thus, for guyed towers like Tower 1, where the initial tension in the guys is relatively low, it is inadvisable to alter the base constraint to a fixed support, as this could lead to yield in the steel structure at the base, posing a substantial risk to structural safety.

6. Conclusions

Based on actual in situ measurements of guy wire tension and material property tests, this study established a finite element model for analyzing the structural response of guyed towers. Comparative analyses were conducted to assess the structural behavior of the tower under the ice accretion and high wind loads at the current guy tension levels. The main conclusions are as follows:
  • When the tower base is either pinned or fixed, the difference in actual guy tension levels between Towers 1 and 2 under the ice and wind loads has a minimal impact on the maximum stress in the tower body. However, it significantly influences the maximum displacement and inclination angle of the tower body.
  • The type of base constraint (pinned or fixed) results in notable differences in maximum stress in the tower body under both load conditions. The lower the existing guy tension level, the more pronounced this difference becomes. Specifically, under high wind load conditions with a fixed base, the maximum base stress in Tower 1 is 270% greater than when the base is pinned.
  • The initial tension level of the guy wires has a substantial effect on guy wire tension under both the ice and wind loads. Some guy wires in Towers 1 and 2 may fully slacken under relatively low ice or wind load conditions, which can threaten the structural stability of the guyed tower.
  • Additionally, with a fixed base connection, local yield failure at the base of Tower 1 may occur when subjected to 85% of the design wind load level.

Author Contributions

All authors of this paper have made objective contributions within the scope of their respective job responsibilities. Conceptualization, H.C.; methodology, H.C. and A.Z.; software, H.W.; validation, H.C., Y.W., H.Y. and L.X.; formal analysis, H.W. and M.P.K.; investigation, M.P.K. and H.W.; writing—original draft preparation, H.W. and M.P.K.; writing—review and editing, A.Z. and H.C.; supervision, H.C., Y.W. and H.Y.; project administration, L.X. All authors have read and agreed to the published version of the manuscript.

Funding

This research received no external funding.

Data Availability Statement

The original contributions presented in this study are included in the article material. Further inquiries can be directed to the corresponding author.

Conflicts of Interest

Authors Haoyuan Chen, Yongan Wang, Hong Yin and Liwei Xia were employed by the Extra High Voltage Company, State Grid Hubei Electric Power Co., Ltd. The remaining authors declare that the research was conducted in the absence of any commercial or financial relationships that could be construed as a potential conflict of interest.

References

  1. Titus, H.M.; Jayachandran, S.A. A flexibility approach for geometric nonlinear static analysis of guyed masts. Structures 2024, 70, 107842. [Google Scholar] [CrossRef]
  2. Liu, S.; Zhang, W.; Li, Q.; Yan, S.; Zhang, S.; Li, C.; Li, L. Engineering method for quantifying the coupling effect of transmission tower-line system under strong winds. J. Wind Eng. Ind. Aerodyn. 2024, 255, 105954. [Google Scholar] [CrossRef]
  3. Zhu, C.; Yang, Q.; Huang, G.; Zhang, X.; Wang, D. Fragility analysis and wind directionality-based failure probability evaluation of transmission tower under strong winds. J. Wind Eng. Ind. Aerodyn. 2024, 246, 105668. [Google Scholar] [CrossRef]
  4. Hou, G.; Muraleetharan, K.K.; Panchalogaranjan, V.; Moses, P.; Javid, A.; Al-Dakheeli, H.; Bulut, R. Resilience assessment and enhancement evaluation of power distribution systems subjected to ice storms. Reliab. Eng. Syst. Saf. 2022, 230, 108964. [Google Scholar] [CrossRef]
  5. Max Irvine, H.M. Cable Structures; MIT Press: Cambridge, MA, USA, 1981; pp. 135–146. [Google Scholar]
  6. Jiang, L.; Cao, Z.; Tang, B.; Chen, B. Safety Evaluation Method of Guyed Tower Based on Bayesian Network. Spec. Struct. 2024, 41, 18–24. [Google Scholar]
  7. Wang, J.; Li, Z.; Liang, Y.; Meng, G. Safety evaluation of transmission lines considering meteorological factors. J. Electr. Power Sci. Technol. 2023, 38, 210–217. [Google Scholar]
  8. Tan, R.; Sun, J.H.; Dang, K.N.; Yue, X. Research on Design Safety of Extra-High Transmission Tower Structure. Power Syst. Clean Energy 2013, 29, 93–97. [Google Scholar]
  9. Zhao, Q.; Wang, D. The design and calculation on strength tests of 500kV guyed transmission tower under static wind load. In Proceedings of the International Conference on Multimedia Technology, Hangzhou, China, 26–28 July 2011; pp. 1796–1799. [Google Scholar]
  10. Jiang, T.; Zhang, Y.; Wang, Y.; Yu, B.; Zhang, Y.; Ge, Y. Research on the Safety of Transmission Tower Line System Under Uneven Settlement. Constr. Technol. 2018, 47, 132–136. [Google Scholar]
  11. Fu, X.; Li, H.N. Uncertainty analysis of the strength capacity and failure path for a transmission tower under a wind load. J. Wind Eng. Ind. Aerodyn. 2018, 173, 147–155. [Google Scholar] [CrossRef]
  12. GB/T 228.1-2021; China National Standardization Administration, Metallic Materials—Tensile Testing—Part 1: Method of Test at Room Temperature. National Standards of the People’s Republic of China: Beijing, China, 2021.
  13. GB 50545-2010; China National Standardization Administration, Code for Designing of 110~750 kV Overhead Transmission Line. National Standards of the People’s Republic of China: Beijing, China, 2010.
Figure 1. On-site measurement of tension forces.
Buildings 14 03960 g001
Figure 2. Model diagram of the guyed tower and guy wire identification.
Buildings 14 03960 g002
Figure 3. Stress–strain curves of guy wires.
Buildings 14 03960 g003
Figure 4. Stress calculation results for guy wires G1 and G2 under different element quantity conditions.
Buildings 14 03960 g004
Figure 5. Typical stress and displacement contour plots. (a) Stress contour plot under the ice loading for Tower 1. (b) Stress contour plot under the high wind loading for Tower 1. (c) Displacement contour plot under the ice loading for Tower 1. (d) Displacement contour plot under the high wind loading for Tower 1.
Buildings 14 03960 g005aBuildings 14 03960 g005b
Table 1. Results of tension force measurements.
Tower Wire N0,i (kN)N0,av
(kN)
D0,i (mm)D0,av
(mm)
σG0,t
(MPa)
123123
Tower 1G1A4.23.83.93.9712.8512.9613.1612.9930.0
G1B6.36.25.86.1012.9412.9113.0012.9546.3
G2A5.25.65.75.5012.9612.8812.9512.9341.9
G2B6.76.87.06.8312.8912.8313.0112.9152.2
G3A4.84.44.04.413.2413.4013.8013.4830.8
G3B3.63.53.93.6713.0813.6013.7013.4625.8
G4A4.84.74.84.7712.9112.9613.0312.9736.1
G4B4.03.94.03.9712.8713.0813.1713.0429.7
Tower 2G1A9.19.49.49.3014.5314.3614.1314.3457.6
G1B9.19.19.39.1414.4714.1914.3914.3556.5
G2A12.012.512.312.2614.3614.3114.2614.3176.2
G2B9.49.39.69.4314.3414.3314.2214.3058.7
G3A6.97.16.86.9314.2614.2514.3114.2743.3
G3B8.38.28.28.2314.2514.4614.2714.3351.0
G4A9.89.69.69.6714.4114.2514.4214.3659.7
G4B8.99.19.09.0014.3414.3914.3614.3655.6
Table 2. Initial stress values for guy wires in the respective towers.
ModelσG0 (MPa)
G1G2G3G4
Tower 138.147.028.333.9
Tower 257.067.547.258.6
Tower 3140.0140.0140.0140.0
Table 3. Calculation results for ice accretion conditions.
ModelBoundary ConditionσG/MPaUmax
(mm)
δU
(%)
β
(°)
δβ
(%)
σF
MPa
G1G2G3G4
Tower 1Hinged112.40113.1026.6228.6753.02-0.0534-85.02
Fixed112.10112.6027.1128.7252.680.640.05281.12154.70
Tower 2Hinged116.80117.9048.9048.9350.39-0.0425-91.69
Fixed116.30118.0048.8349.4949.701.370.04210.94160.30
Tower 3Hinged206.80206.80135.00135.0042.65-0.0510-112.90
Fixed206.90206.30135.60135.0042.490.380.05060.78181.90
Table 4. Calculation results for high wind load conditions.
ModelBoundary ConditionσG/MPaUmax
(mm)
δU
(%)
β
(°)
δβ
(%)
σF
MPa
G1G2G3G4
Tower 1Hinged267.40268.904.624.81238.8-0.3562-93.31
(267.50)(269.00)(4.88)(5.10)(227.6)(0.3391)(93.38)
Fixed262.50264.204.754.79233.82.090.34852.16345.00
(262.60)(264.60)(5.03)(5.07)(222.9)(2.07)(0.3320)(2.09)(345.00)
Tower 2Hinged219.80221.205.936.19179.5-0.2653-94.02
(220.10)(221.60)(6.44)(6.72)(168.7)(0.2488)(94.17)
Fixed216.90218.406.006.27176.41.730.26081.70307.60
(217.40)(219.00)(6.51)(6.82)(165.8)(1.72)(0.2446)(1.69)(295.90)
Tower 3Hinged249.60249.6028.5228.51114.4-0.1644-99.06
(257.40)(257.40)(36.33)(36.32)(113.0)(0.1611)(101.00)
Fixed248.70248.3029.4629.02113.21.050.16271.03234.80
(256.60)(256.20)(37.37)(36.91)(112.0)(0.88)(0.1596)(0.93)(234.70)
Table 5. Guy wire slackening analysis.
Tower LoadBoundary ConditionΔL (%)
Tower 1Strong windPinned30
Tower 1Strong windFixed30
Tower 2Strong windPinned45
Tower 2Strong windFixed45
Disclaimer/Publisher’s Note: The statements, opinions and data contained in all publications are solely those of the individual author(s) and contributor(s) and not of MDPI and/or the editor(s). MDPI and/or the editor(s) disclaim responsibility for any injury to people or property resulting from any ideas, methods, instructions or products referred to in the content.

