Article

Standardization of CAD Drawing Formats and GeoJSON-Based Processing for 3D Spatial Data Extraction of Underground Utilities

by
Jongseo Lee
1,
Yudoo Kim
2 and
Il-Young Moon
3,*
1
Movements Research Center, Movements Co., Ltd., Seoul 06651, Republic of Korea
2
Department of Artificial Intelligence, Dongyang Mirae University, Seoul 08221, Republic of Korea
3
Department of Computer Science and Engineering, Korea University of Technology and Education, Cheonan 31253, Republic of Korea
*
Author to whom correspondence should be addressed.
Buildings 2024, 14(12), 3980; https://doi.org/10.3390/buildings14123980
Submission received: 29 October 2024 / Revised: 25 November 2024 / Accepted: 12 December 2024 / Published: 14 December 2024
(This article belongs to the Section Construction Management, and Computers & Digitization)

Abstract

:
The traditional construction industry has predominantly relied on labor-intensive methods, resulting in significantly lower efficiency and productivity compared to other industries. According to a report by the Korea Productivity Center (KPC), the productivity of the construction industry is approximately 24.5% lower than that of the manufacturing sector and 15.7% lower than that of the service sector, highlighting a significant productivity gap. To enhance efficiency and productivity in the construction sector, the South Korean government, led by the Ministry of Land, Infrastructure, and Transport, has announced a policy aimed at achieving 100% adoption of smart construction technologies by 2025. In this paper, we propose a methodology for standardizing the format of underground utilities plan drawings by incorporating 3D coordinates, shapes, and attribute information to facilitate the digital transformation of construction site data. Furthermore, we introduce a standardized approach for extracting data from these drawings and converting them into 3D spatial data in the GeoJSON (Geographic JavaScript Object Notation) format. The experimental results of the technology for processing structured drawings into 3D spatial data demonstrated that all data were successfully converted without any omissions.

1. Introduction

Smart construction technology utilizes the Internet of Things (IoT), big data, artificial intelligence (AI), and Building Information Modeling (BIM) to automate the entire lifecycle of the construction industry, from design and construction to completion and maintenance, through digital transformation.
According to a report by the Korea Institute for Industrial Economics and Trade (KIET), the proportion of companies utilizing digital technologies has steadily increased since 2017, but remained at approximately 15% as of 2022 [1,2]. Industry-specific analysis reveals that the ICT manufacturing and producer services sectors exhibit the highest adoption rates of digital technologies. As ICT advancements continue, industries are leveraging digital transformation to enhance productivity.
However, the traditional construction industry, historically reliant on labor-intensive methods, now faces numerous challenges, including labor shortages, safety concerns, efficiency demands, and environmental issues [3,4].
Digital transformation has become a core strategy for enhancing productivity across various industries worldwide. In particular, advancements in ICT technologies are accelerating the adoption of digital tools in sectors such as manufacturing and services, driving the proliferation of data-driven management and operational practices. According to a report by McKinsey & Company, digital transformation has the potential to increase productivity in manufacturing by approximately 15–20%, with advanced analytics and automation being key contributors to operational efficiency [5].
In contrast, the construction industry has traditionally relied on labor-intensive operations, resulting in a slower adoption of digital transformation compared to other sectors. However, in recent years, smart construction technologies have gained significant attention, accelerating the digitalization of the construction sector. A global study by Deloitte revealed that 72% of projects implementing smart construction technologies achieved reduced timelines and cost savings. Key technologies driving this shift include Building Information Modeling (BIM), drones, the Internet of Things (IoT), and Artificial Intelligence (AI) [6].
Regions such as Europe, North America, and Asia–Pacific have seen significant government-led initiatives and investments to advance smart construction practices. For example, the European Union (EU) supports the digital transformation of the construction sector through programs like Horizon 2020, aimed at establishing digital construction platforms. In North America, the adoption of AI and cloud-based platforms for construction project management has become widespread. Similarly, in the Asia–Pacific region, countries like China, Japan, and South Korea are actively developing smart construction technologies in alignment with smart city projects [6].
Thus, the digital transformation of the construction industry has emerged as a pivotal strategy for addressing global challenges such as labor shortages, environmental regulations, and safety improvements. By significantly enhancing productivity and efficiency, this transformation is driving a rapid shift toward smart construction practices, underpinned by advanced smart construction technologies.
Smart construction enables significant reductions in construction time and costs through the automation and digitalization of construction processes [7,8]. By digitally integrating all the phases of construction, it maximizes operational efficiency [7]. Furthermore, the introduction of autonomous construction equipment, leveraging robotics and AI technology, allows for unmanned automation, while drones and IoT technologies collect data from construction sites [8]. These data are used for real-time site monitoring and AI-driven analysis, which supports quick decision-making to prevent accidents and improve construction management efficiency. The adoption of smart construction technology is becoming essential in the modern construction industry, and it will play a critical role in transforming construction processes and contributing to sustainable development.
The digital transformation of the construction industry is closely aligned with government policy, and it is being promoted as a key strategy to enhance the competitiveness of the industry. In January 2020, the South Korean government announced a policy briefing that set the goal of “commercializing core smart construction technologies by 2025” [9]. This plan aims to secure key technology packages that can be deployed across construction sites immediately, positioning the country as a leader in construction technology. The goal is to improve productivity in the construction industry by more than 25%, while reducing construction time and accident rates by over 25%.
To achieve these objectives, the government is promoting a smart construction technology development initiative, which consists of four core areas and twelve detailed projects. This initiative seeks to bring about innovative changes through digital transformation, laying a solid foundation for the future of the construction industry [10].
The digital transformation of design data in the underground construction industry is progressing actively on a global scale. In particular, the integration of Building Information Modeling (BIM) and geographic information systems (GIS) has introduced transformative advancements in the design, construction, and maintenance of underground facilities. However, challenges persist in converting data from BIM to GIS formats. To address this issue, a methodology has been introduced for converting BIM files into SHP (shapefile) formats, enabling seamless utilization within GIS environments [11].
Furthermore, advancements in integrating AI technologies with BIM processes are being actively introduced to automate workflows [12]. However, several challenges persist in converting BIM data into training datasets suitable for AI applications. BIM data are not inherently time-series data, which poses difficulties in analyzing temporal aspects. Additionally, extracting precise geometric information from BIM models remains a limitation. The absence of a comprehensive and robust data extraction toolchain further underscores the current intermediate level of integration. Nevertheless, it is anticipated that, over time, the accuracy and precision of data exchange processes will improve significantly, enabling the more seamless integration between BIM and AI technologies.
The adoption of 3D design plays a crucial role in enhancing the efficiency and accuracy of the construction industry. First, 3D design enables the clear visualization of spatial relationships, allowing errors to be identified and corrected during the design phase, thereby improving design quality and reducing costs and time during construction [13].
Additionally, integration with Building Information Modeling (BIM) facilitates comprehensive data management and utilization across the entire lifecycle of design, construction, and maintenance, transforming design data into valuable information throughout the project lifecycle. This approach allows for various simulations and analyses to derive optimal design solutions and proactively identify construction risks, such as clashes with surrounding infrastructure, thus enhancing safety and cost-effectiveness [14].
Moreover, the combination of 3D design with visualization technologies such as Virtual Reality (VR) and Augmented Reality (AR) enables the intuitive communication of design intent, strengthening collaboration and improving stakeholder engagement. Furthermore, 3D design provides a foundation for innovative approaches like smart construction technologies and digital twins, enabling data-driven decision-making and accelerating the digital transformation of the construction industry [15].
In conclusion, 3D design is not merely a design tool but a pivotal technology driving productivity, efficiency, and innovation in the construction industry.
The digital transformation technologies in the construction industry have been rapidly advancing alongside the development of BIM and AI technologies. However, numerous technical and policy-related challenges remain to be addressed to maximize productivity in the construction sector.
Existing studies have predominantly focused on converting BIM data into GIS-compatible formats or integrating AI technologies to develop artificial intelligence models utilizing BIM data [11,12].
In this paper, we propose a methodology for standardizing the format of underground facility plan drawings by incorporating 3D coordinates, shapes, and attribute information to facilitate the digitalization of the construction industry. We also introduce a standardization technique for extracting data from these drawings and converting them into 3D spatial data in the GeoJSON format [16]. Traditional 2D drawings have difficulty effectively representing the precise 3D location and shape of underground utilities, but the standardization method proposed in this study adds 3D spatial information, thereby enhancing efficiency in the design, construction, and maintenance phases.
First, we propose a standardized format that integrates 3D coordinates (X, Y, Z) with the shape and attribute information to more clearly represent the location, shape, and attributes of underground utilities. This format maintains consistency in the drawings and allows for the intuitive and accurate representation of spatial data for various utilities.
Subsequently, using a spatial data extraction and processing algorithm module, the standardized drawings are converted into 3D spatial data in the GeoJSON format. GeoJSON is an open format that efficiently manages both spatial and non-spatial information, enabling the seamless integration of underground utility data with various GIS systems and 3D modeling tools.
When utilizing the structured drawings proposed in this study, which include 3D spatial information, the transition to 3D spatial data can be achieved more quickly compared to traditional 2D-based design methods. This approach enables faster workflows for 2D design engineers compared to directly adopting 3D modeling software for their designs. While students are already learning 3D design through educational curricula, experienced 2D design engineers in the industry are often reluctant to adopt new 3D design software due to the challenges of balancing their existing workload with the learning curve of new tools.
Given the difficulties faced by these engineers in transitioning to 3D design, the technology presented in this study is specifically tailored to enhance the efficiency of their workflows. Unlike existing studies, this research focuses on transforming 2D design drawings into 3D BIM-compatible designs by converting design data into GeoJSON-based 3D spatial data. GeoJSON was chosen for its compatibility and versatility across various GIS software platforms, ensuring broader usability.
Through this technological development, the study aims to improve the data processing efficiency in the management and maintenance of underground facilities, ultimately contributing to better operational outcomes in the industry.

2. Materials and Methods

2.1. Overview

This study focuses on developing a methodology for extracting 3D spatial data from underground utility drawings and converting them into a GeoJSON format. The approach integrates 2D CAD-based drawings, standardizes the drawing format, and validates the results for accuracy.

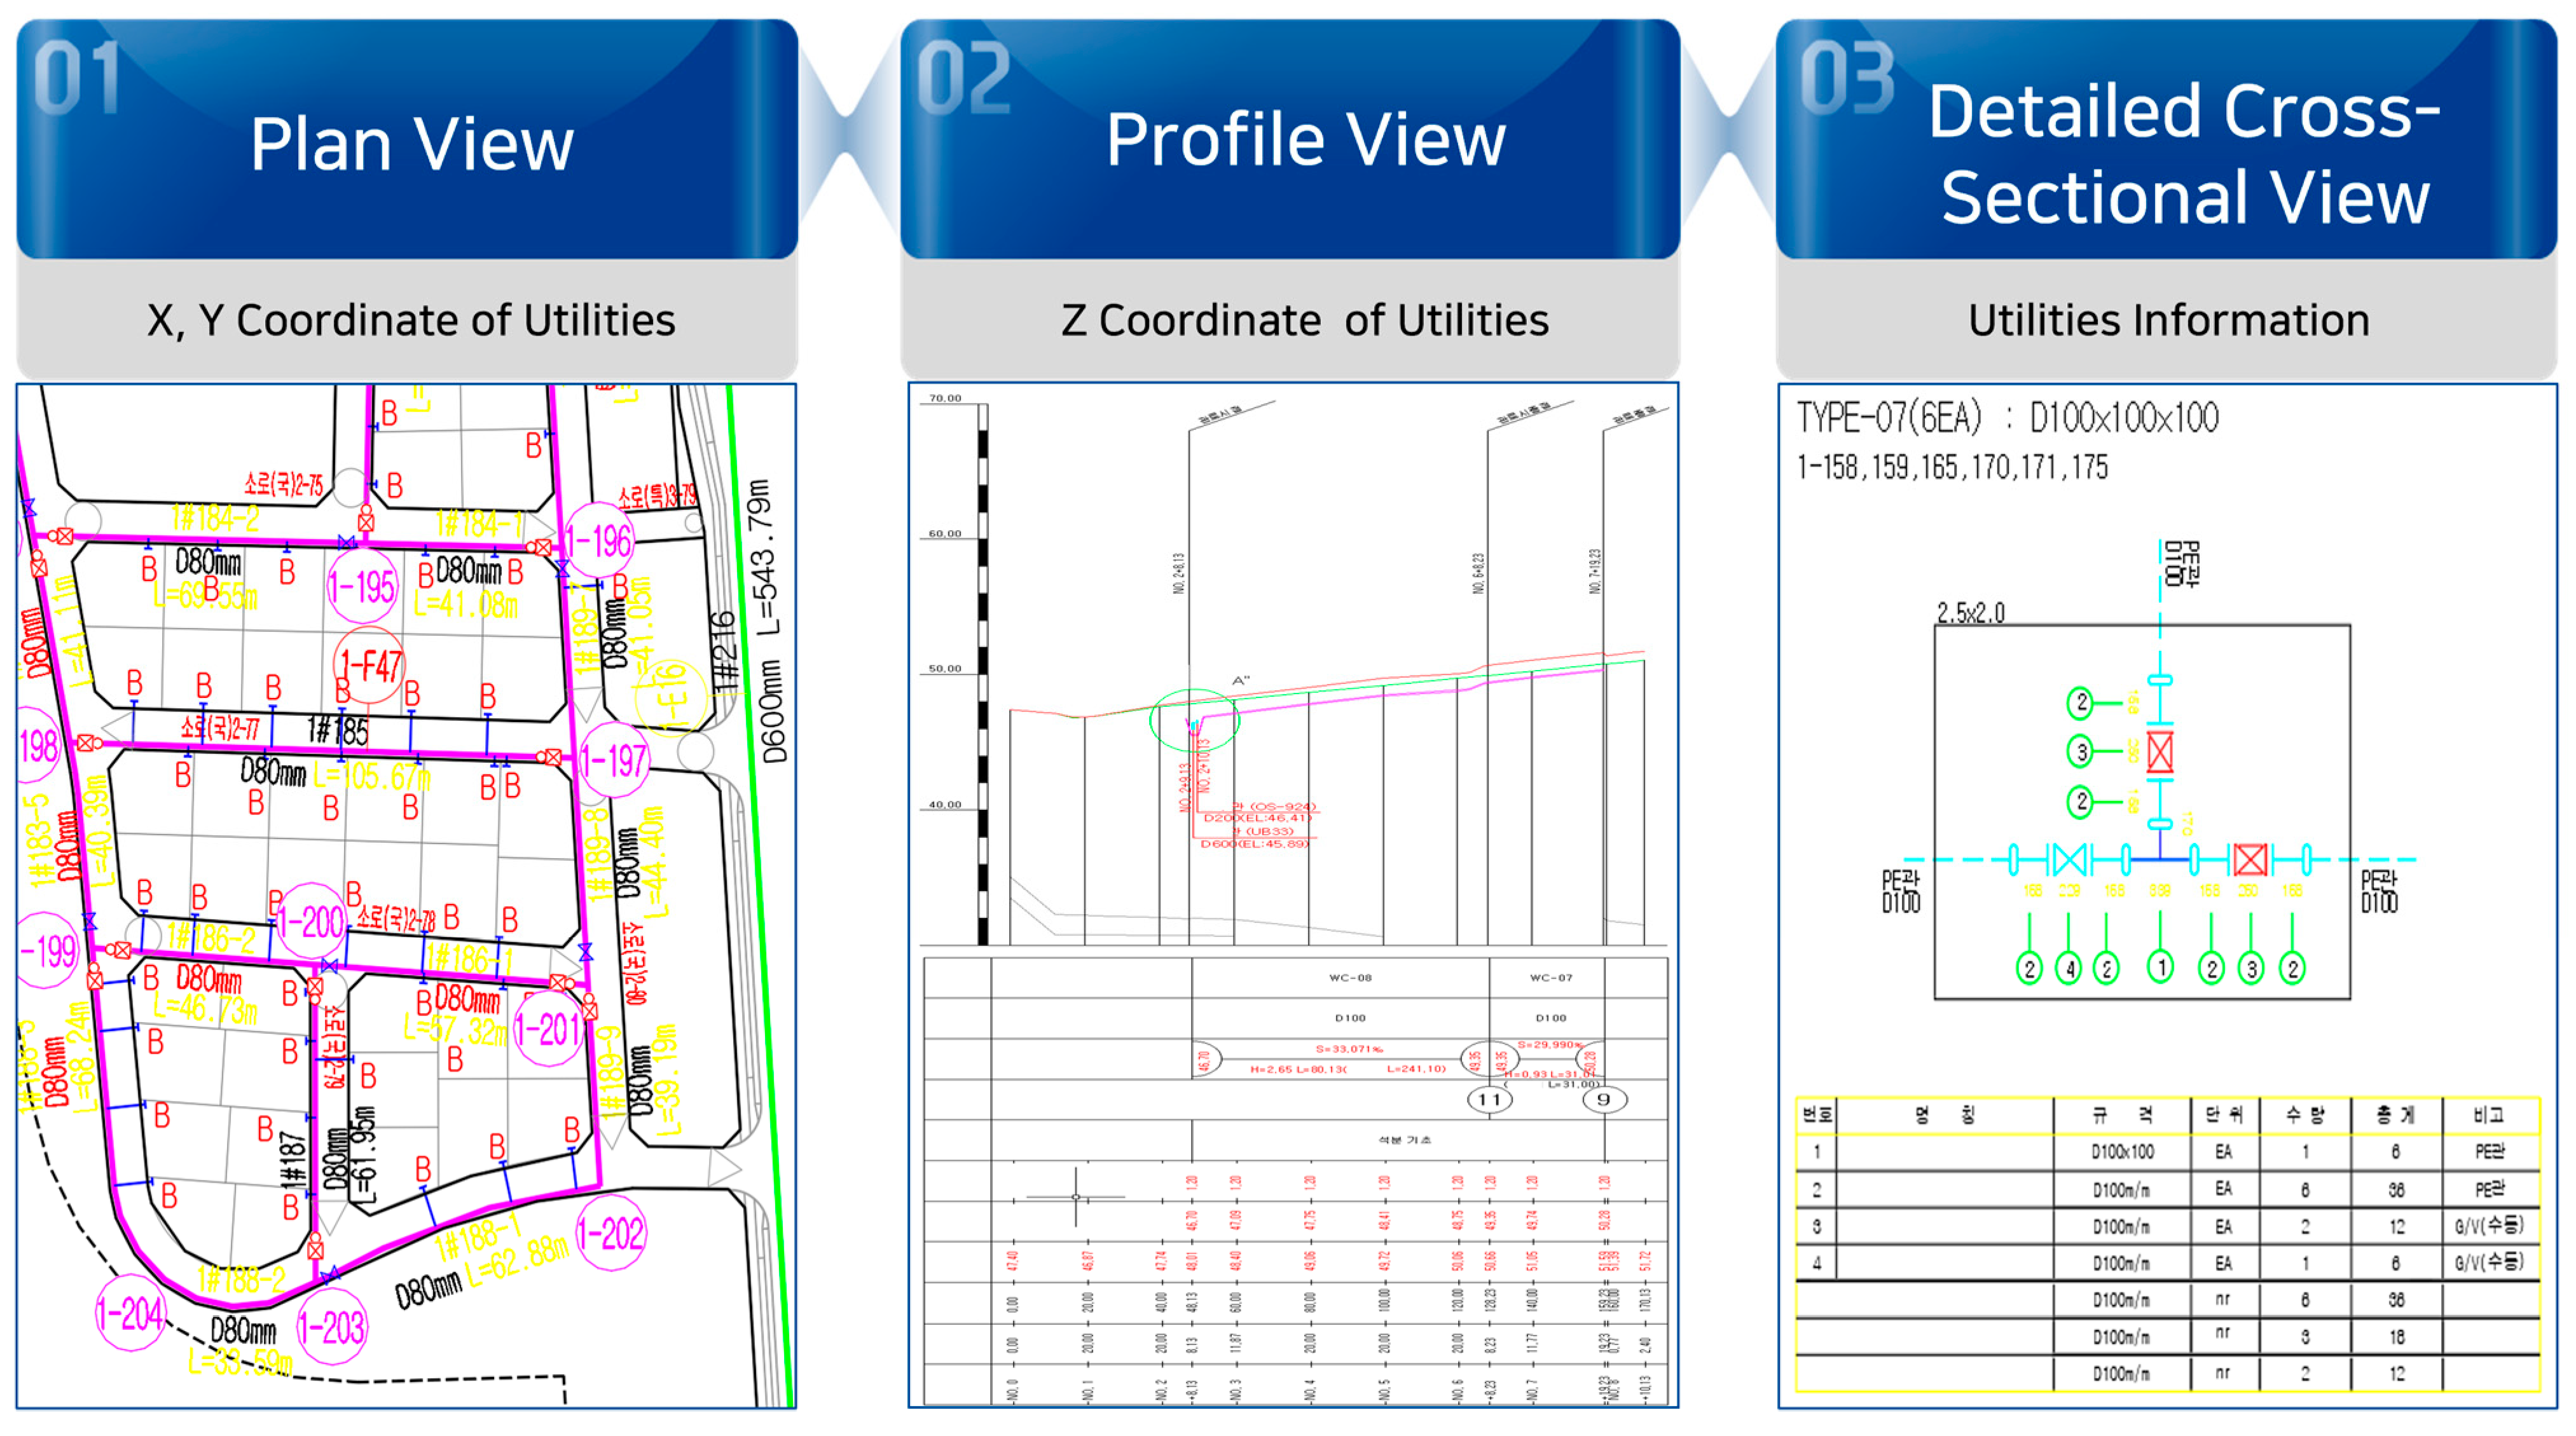
2.2. Integration of 2D Drawings

The methodology integrates 2D underground utility drawings, which are typically categorized as follows:
  • Plan view: provides the X-Y alignment and layout of pipelines relative to their surroundings;
  • Profile view: includes depth information along the Z-axis and connections to structures such as manholes;
  • Detailed cross-sectional view: displays detailed specifications of individual infrastructure components, such as pipe diameters and materials.
Using a custom Python-based module for generating and processing underground facility objects, combined with the ezdxf library [17], CAD files in the DXF format were processed to extract geometric and attribute data. The extracted data were integrated into a unified dataset, enabling the creation of non-redundant objects representing individual underground facilities. Subsequently, 3D spatial analyses were performed on the generated objects to establish inter-object relationships, ensuring a comprehensive representation of their connectivity within the spatial environment.

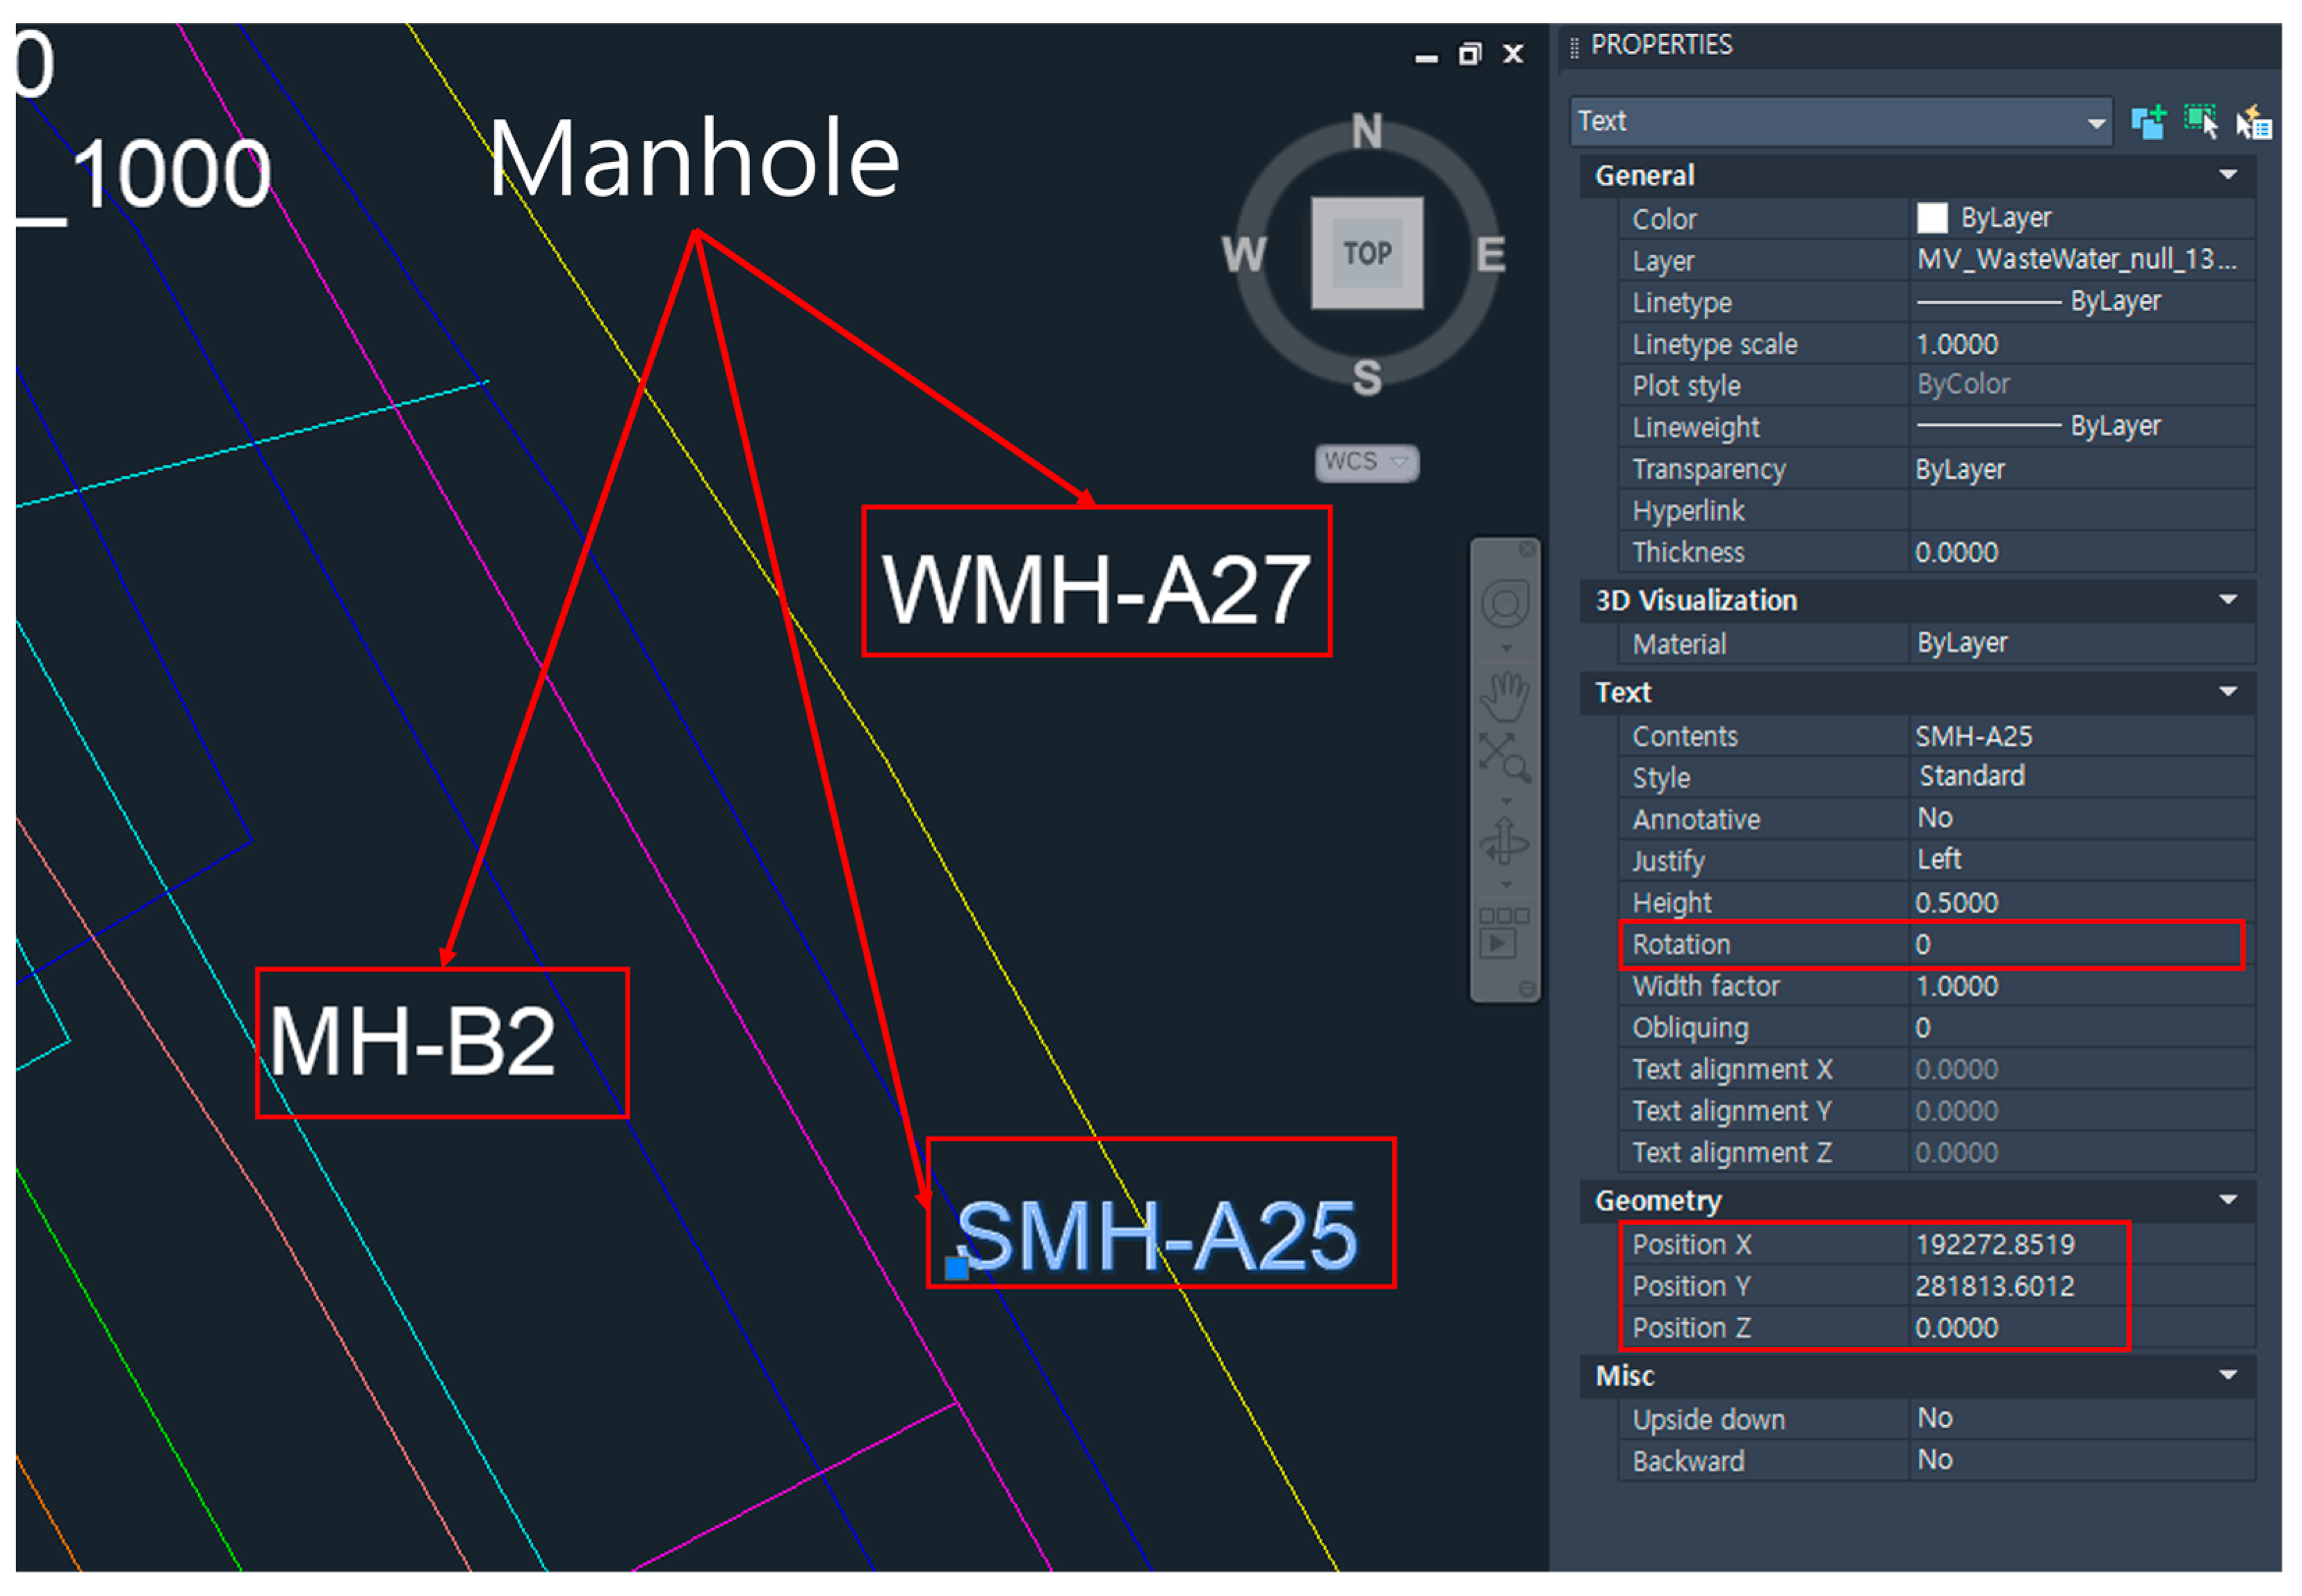
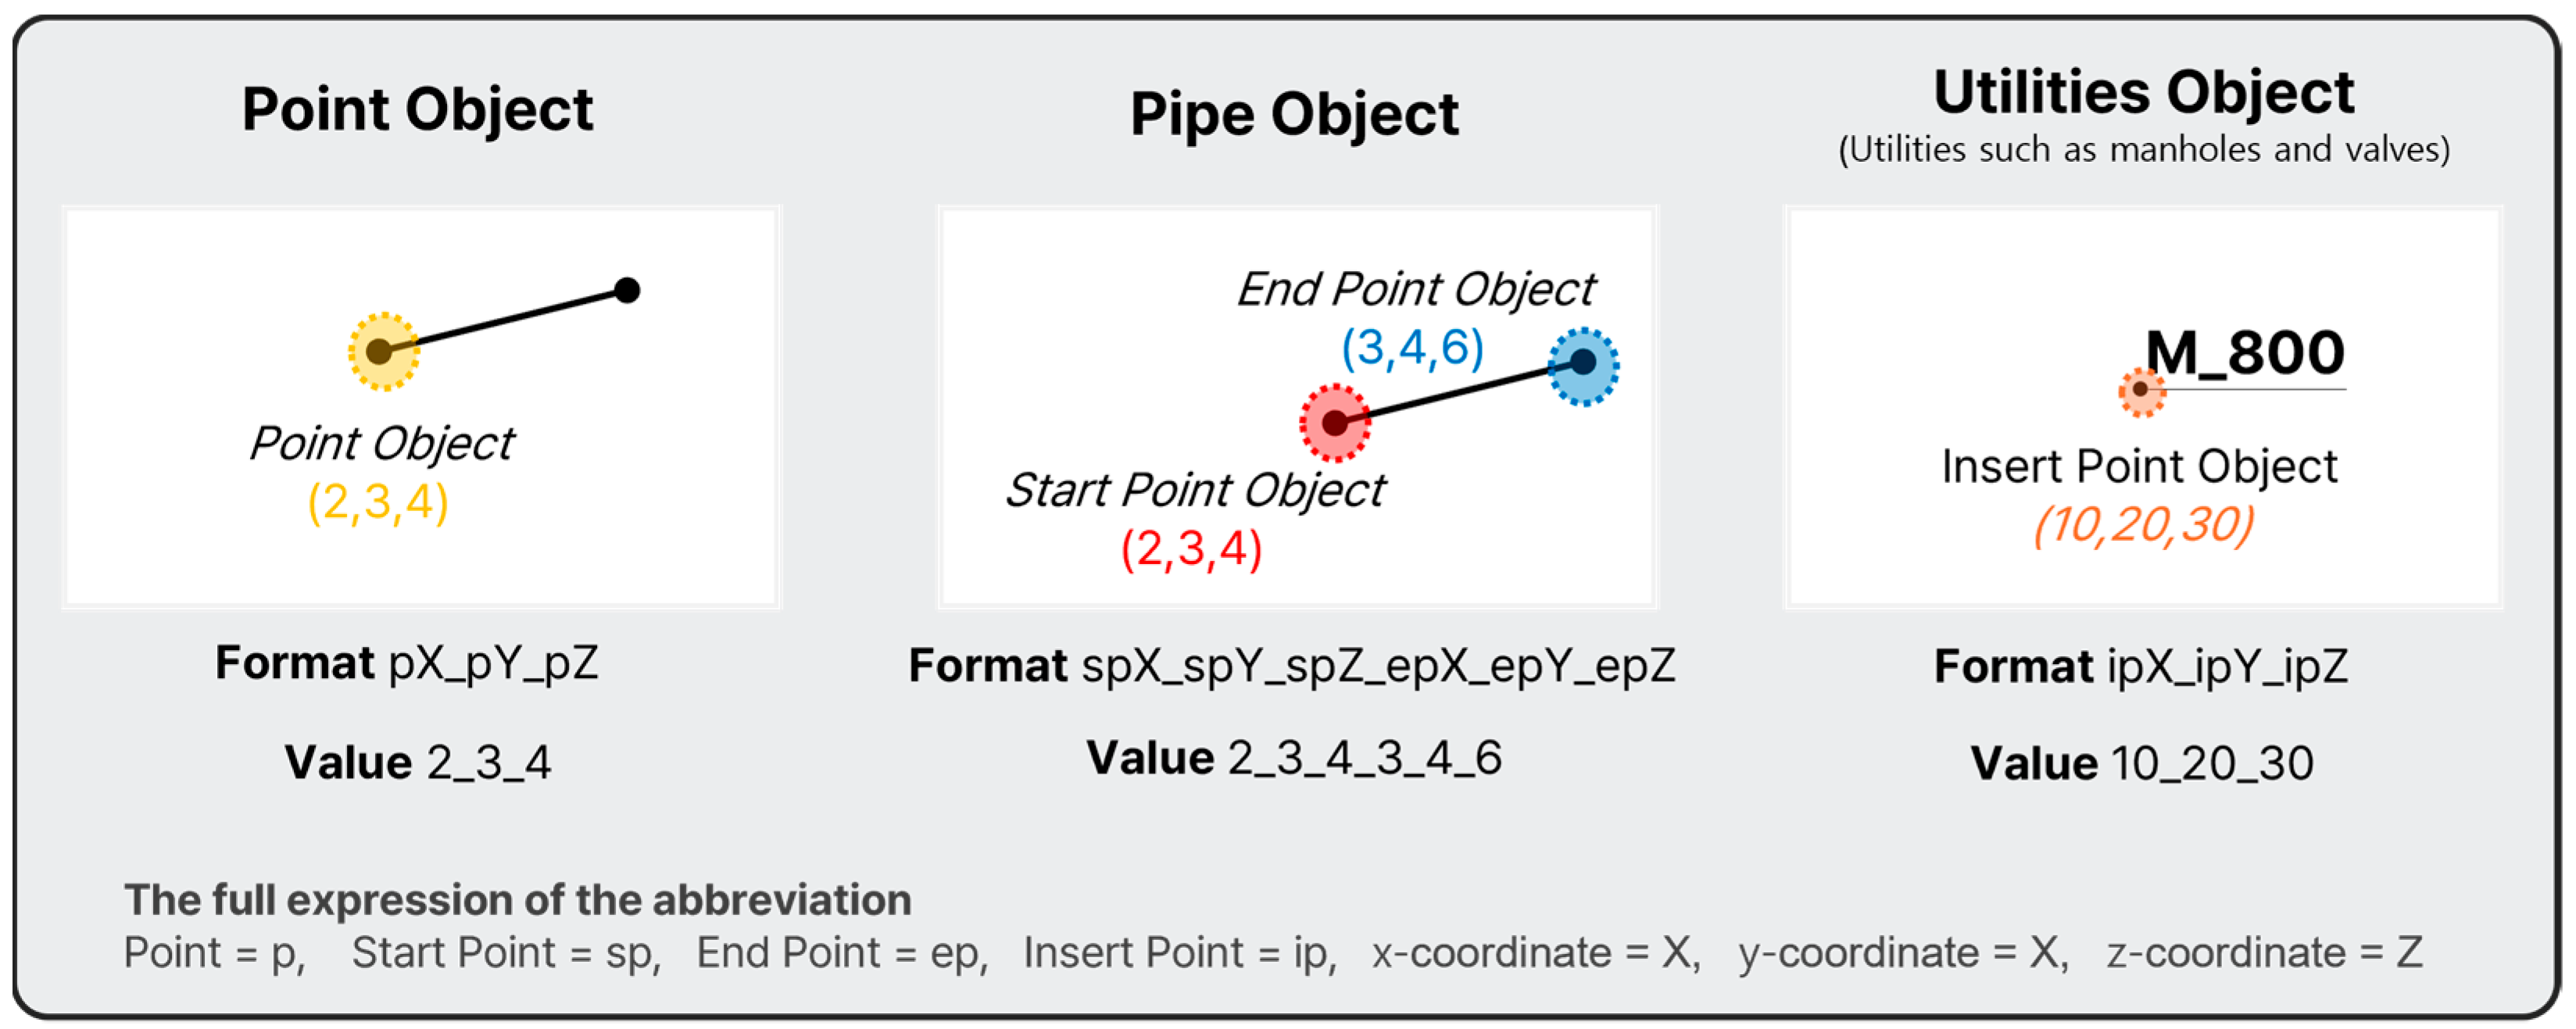
2.3. Standardization of CAD Formats

To address inconsistencies in the input data, a standardized format was developed. The standard ensures uniform representation and compatibility for creating 3D spatial models. The key components include the following:
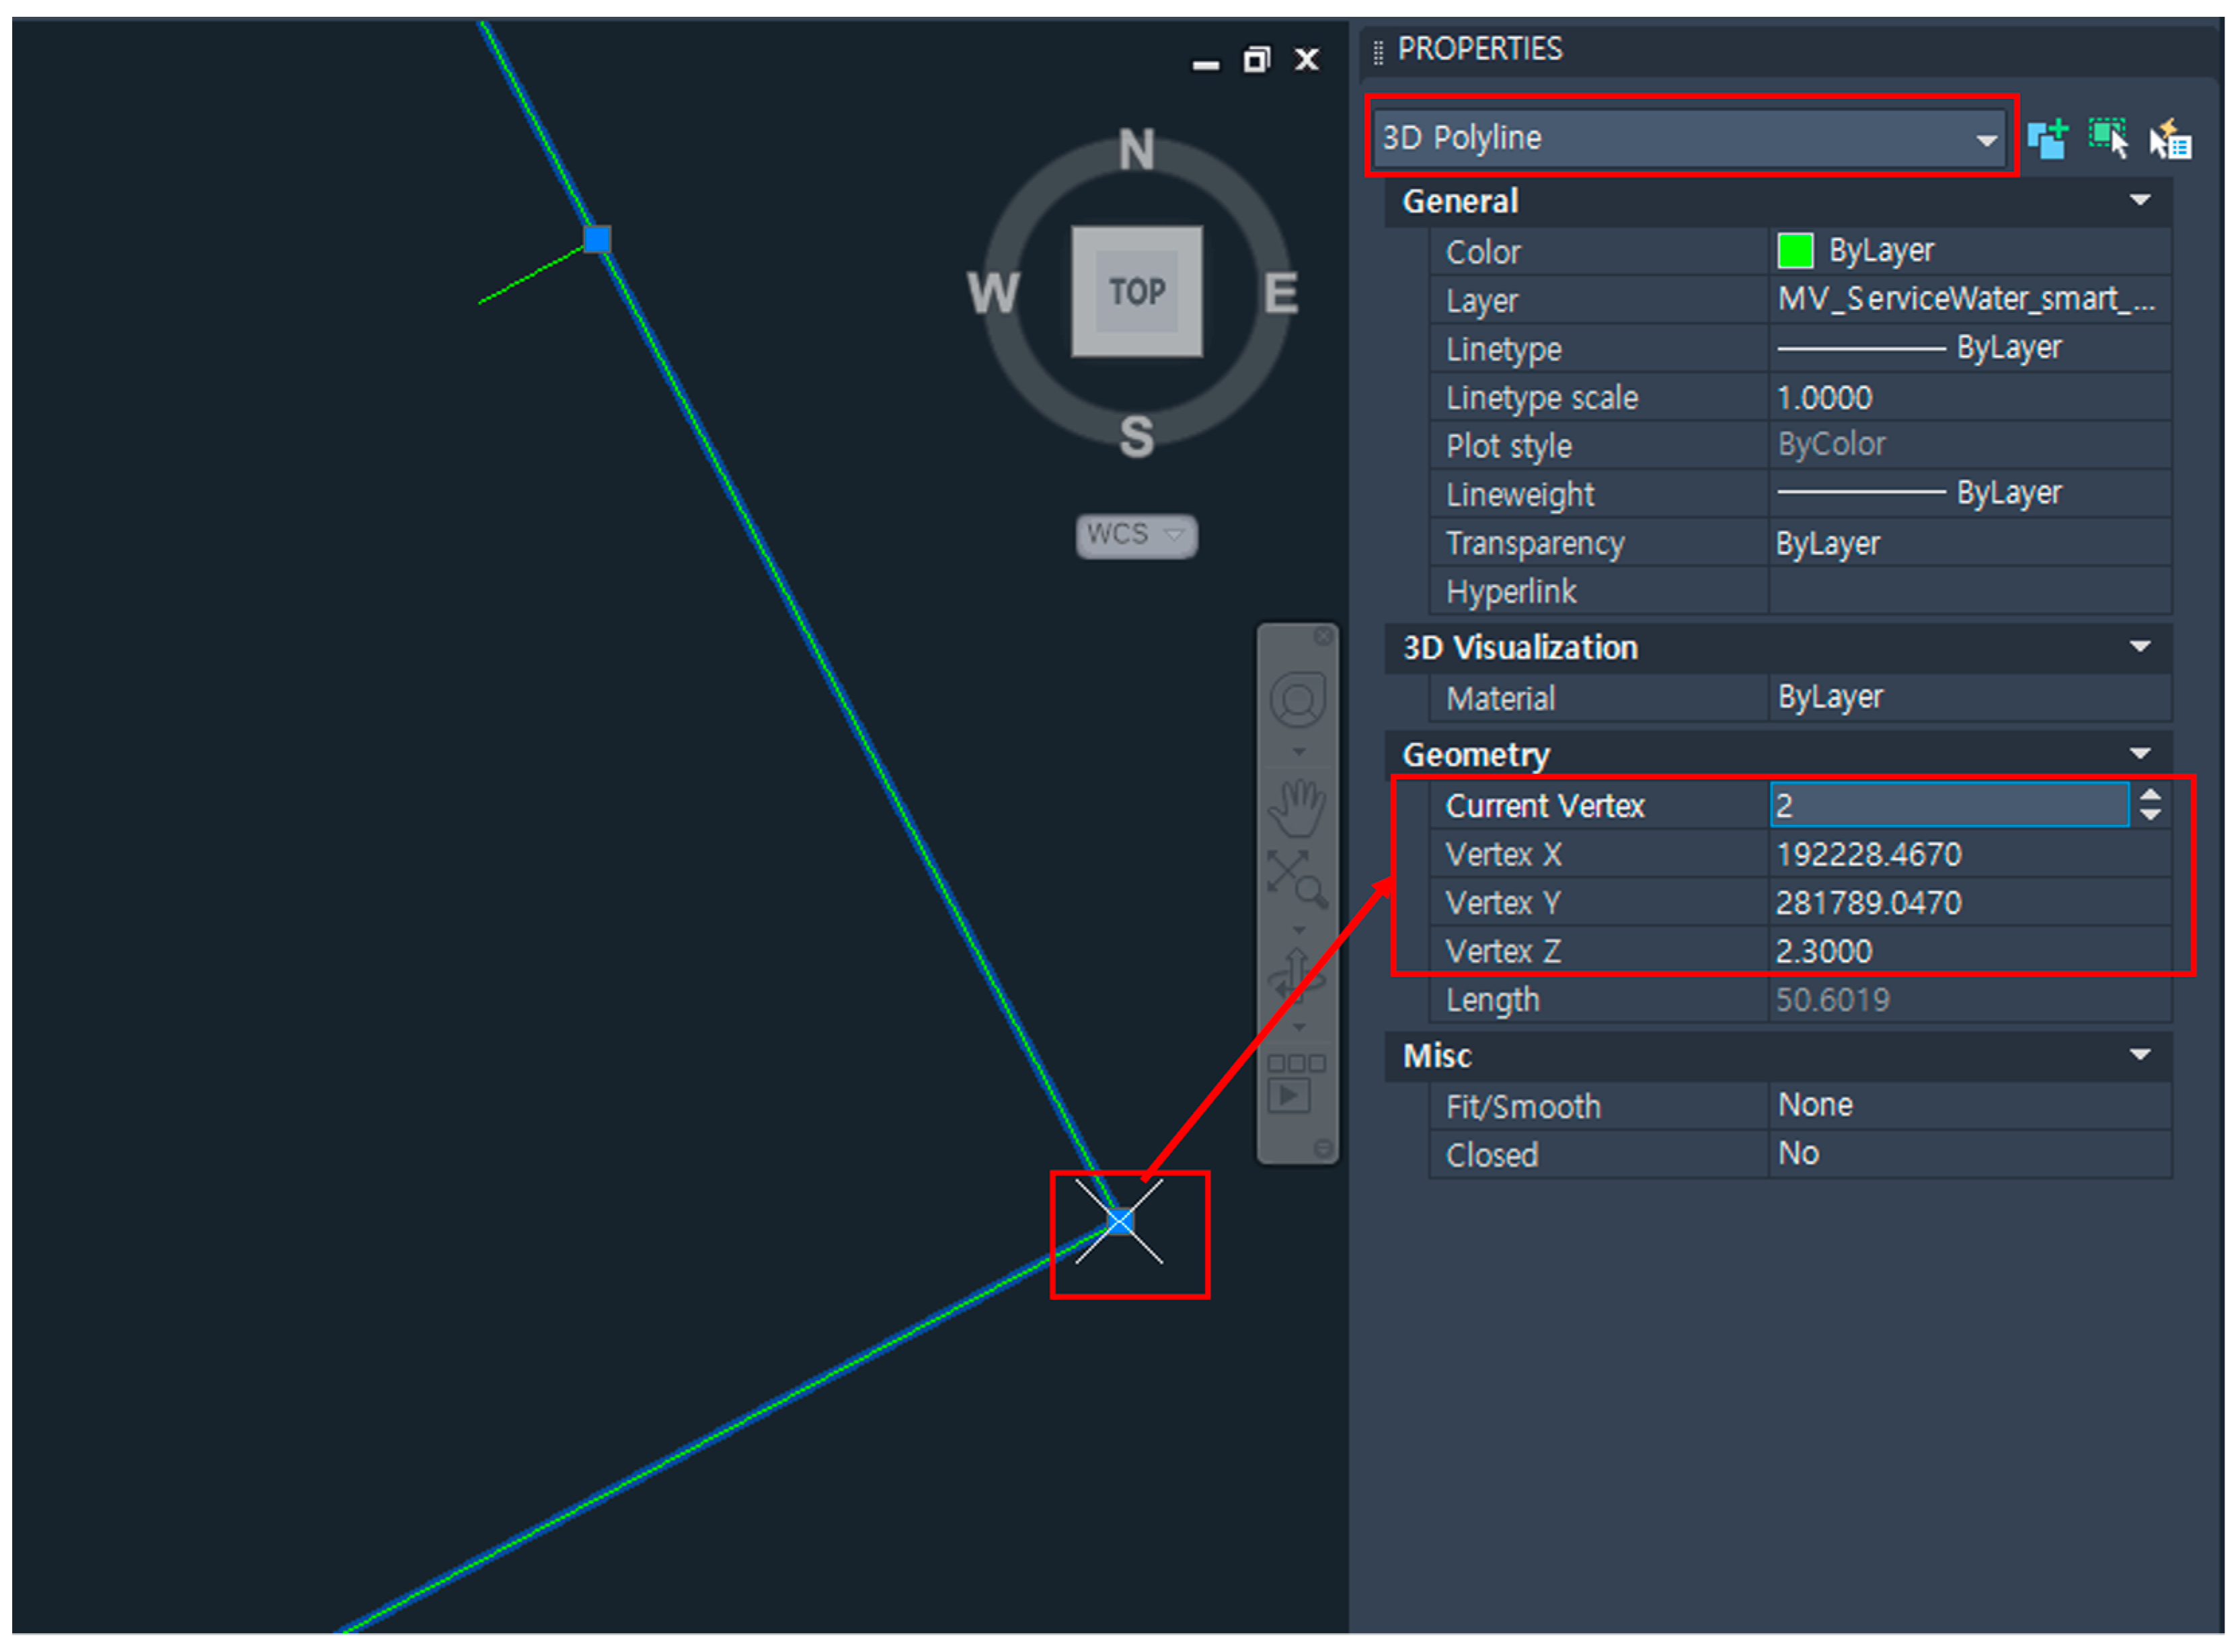
  • 3D coordinate information (X, Y, Z): defines the precise spatial location of the underground facility in the three-dimensional space;
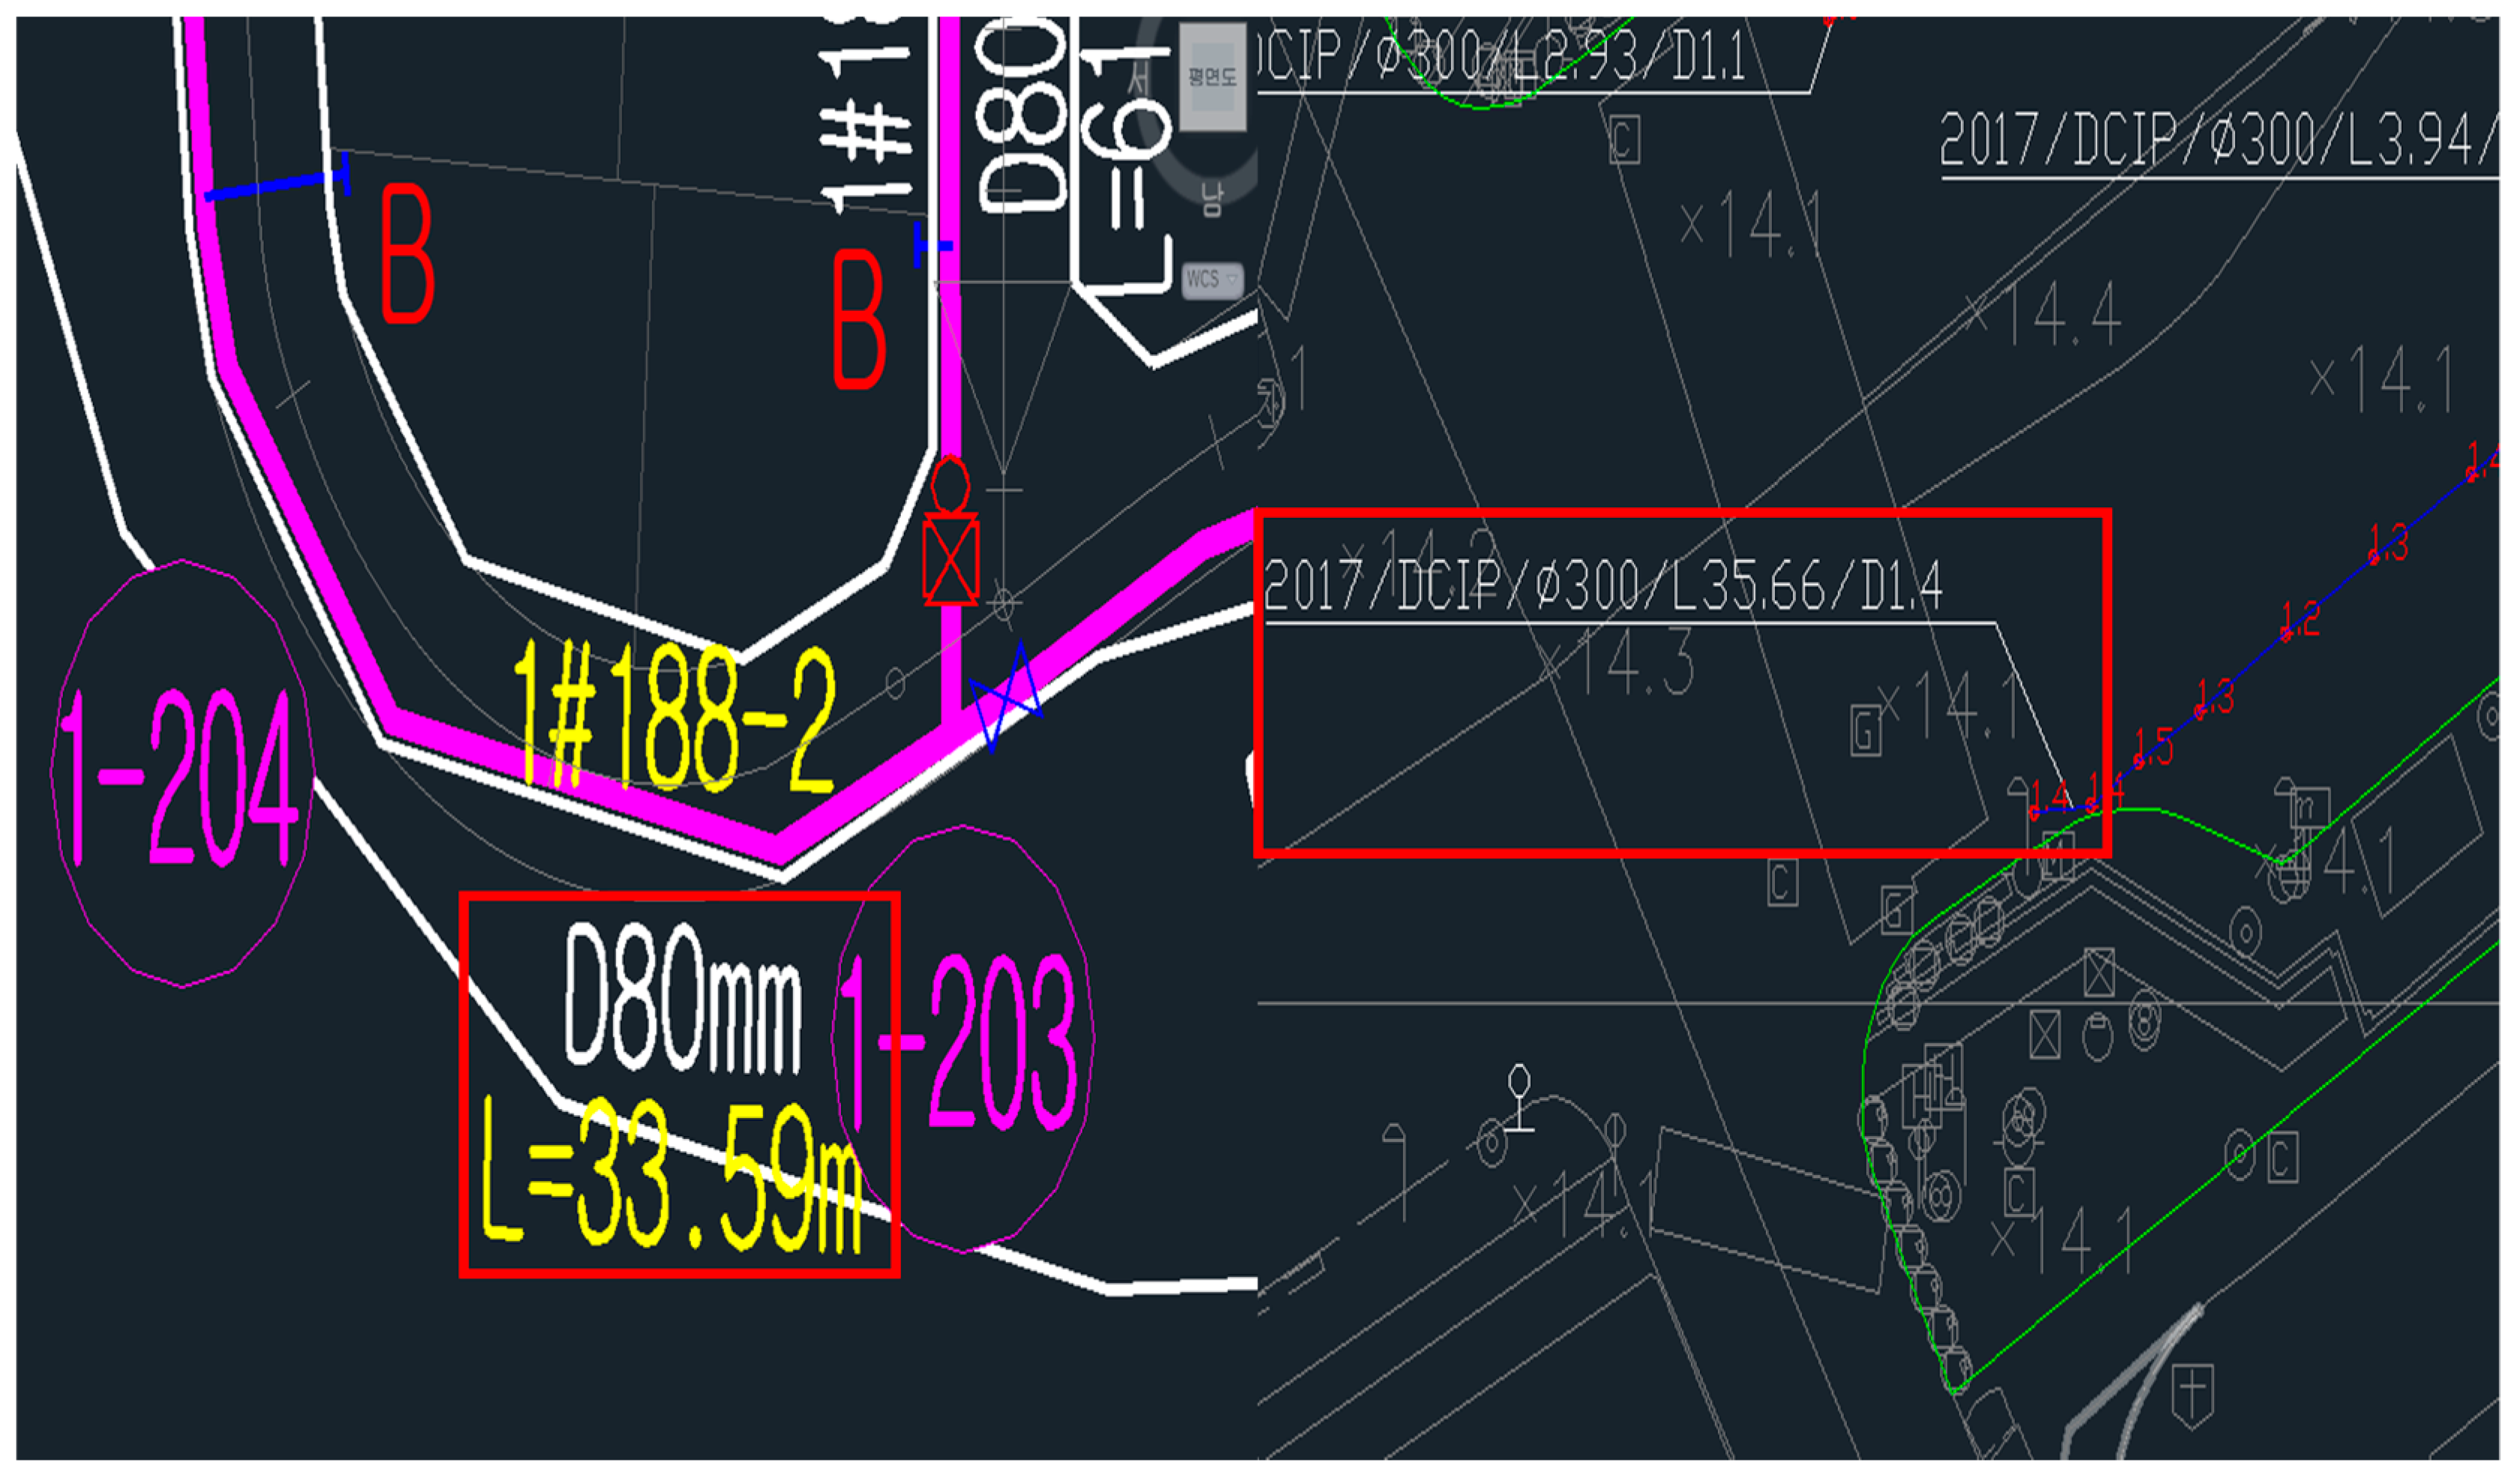
  • Geometric information: specifies data representing the shape of the underground facility, such as diameter, width, and height;
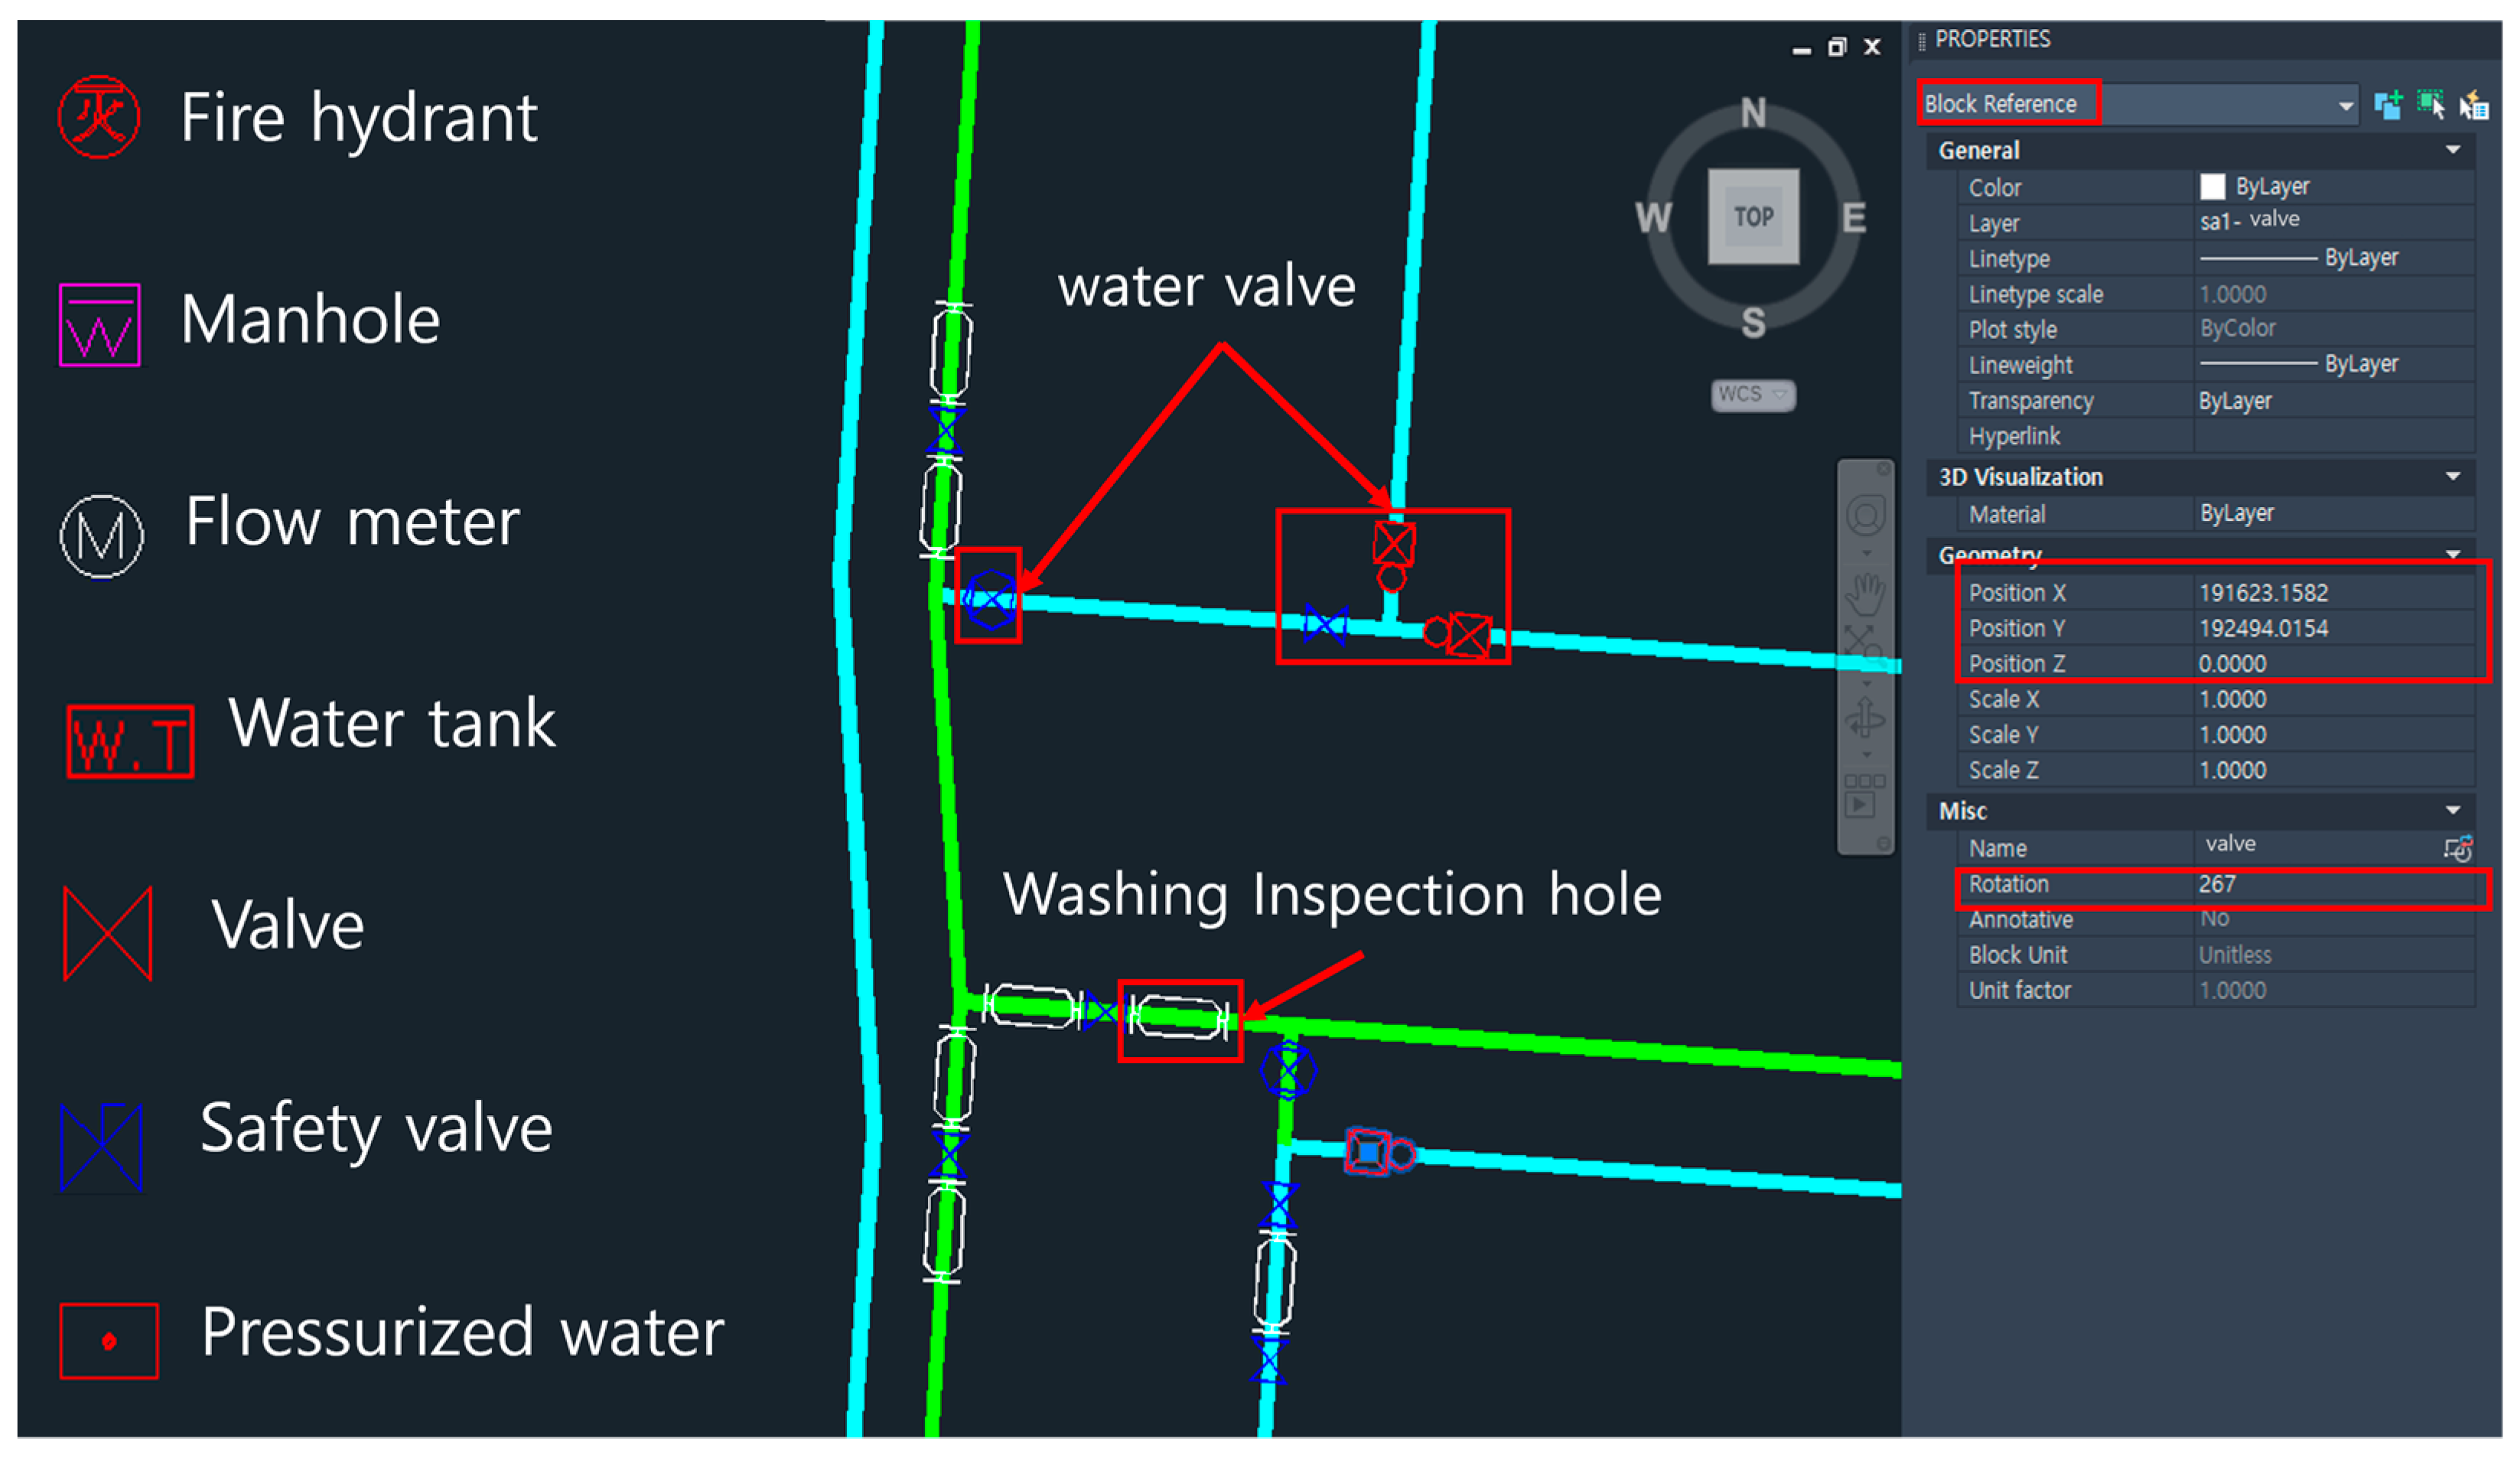
  • Attribute data: describe the attributes of the underground facility, including its type, orientation, and other relevant properties.
This standardization minimizes data loss during the extraction of information from drawings that include 3D spatial data. Furthermore, it enables the automation of data extraction, thereby enhancing the productivity and efficiency of the digital transformation process for 2D design drawings of underground facilities.

2.4. Standardization of GeoJSON Formats

The standardized data were converted to the GeoJSON format due to its compatibility with GIS platforms and 3D modeling software. The conversion process includes the following steps:
  • Extract CAD entity data from plan drawings containing 3D spatial information;
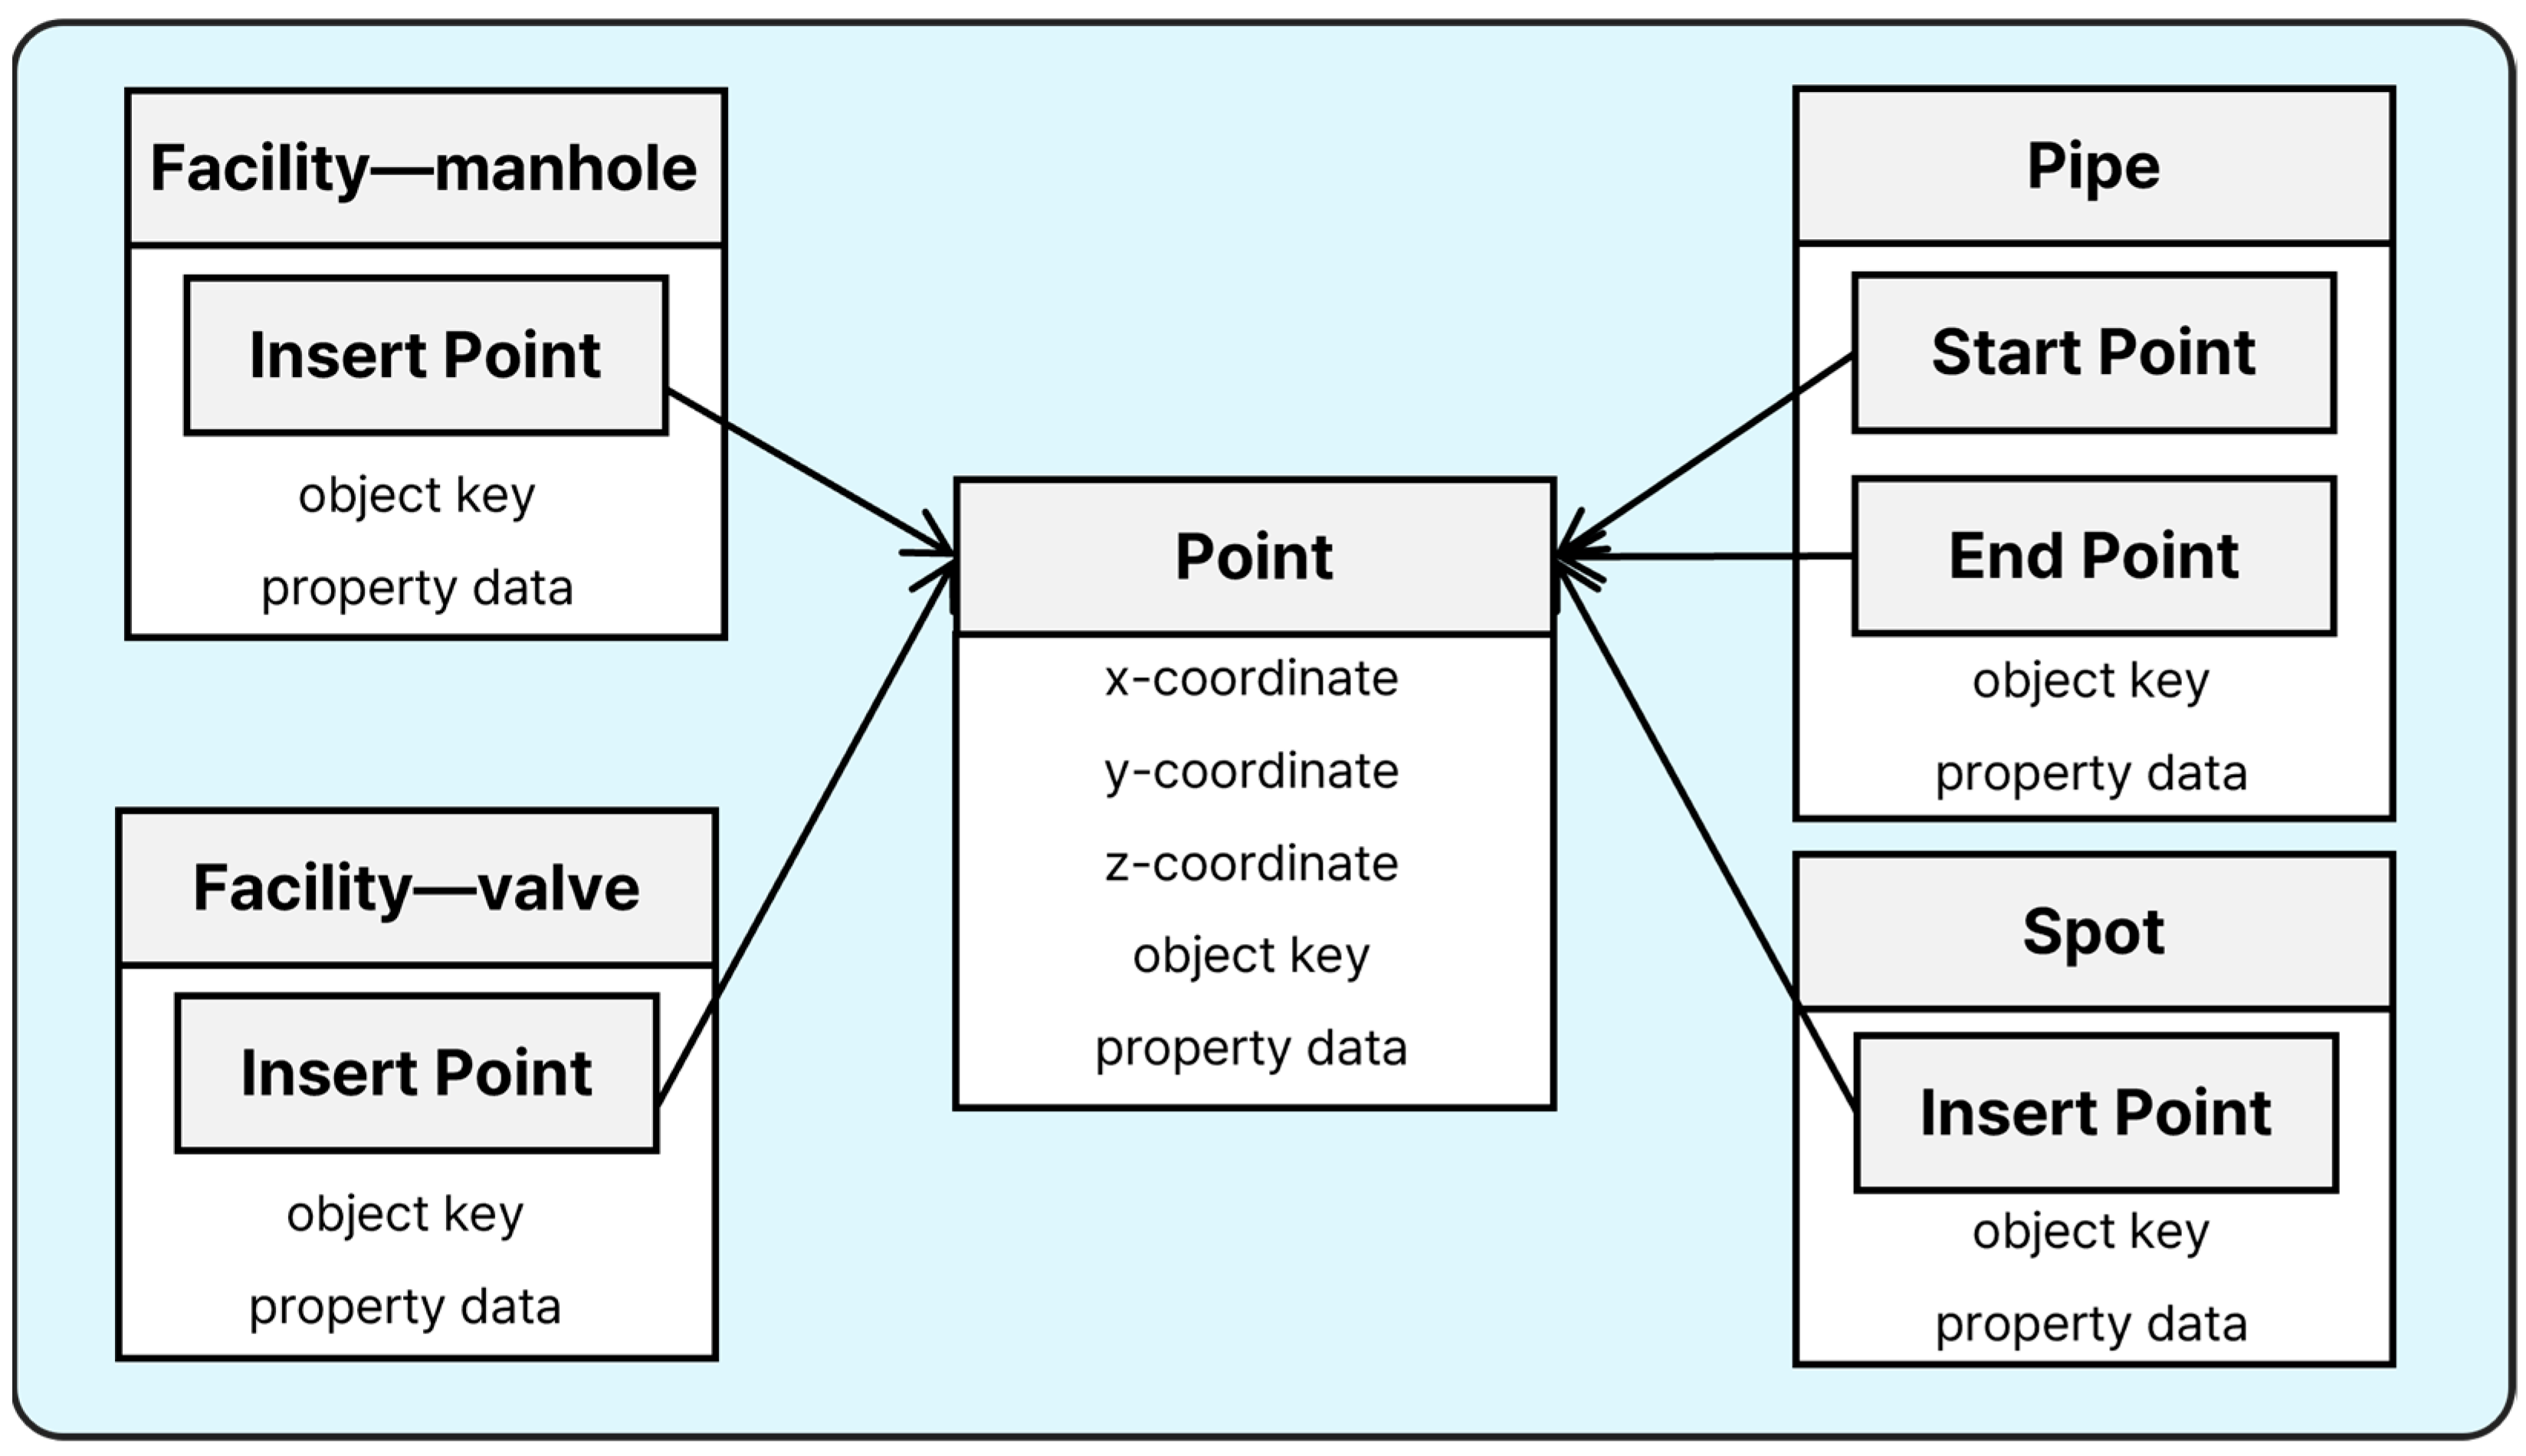
  • Generate underground facility object data based on the extracted data;
  • Perform spatial analyses on the underground facility objects to generate relational data;
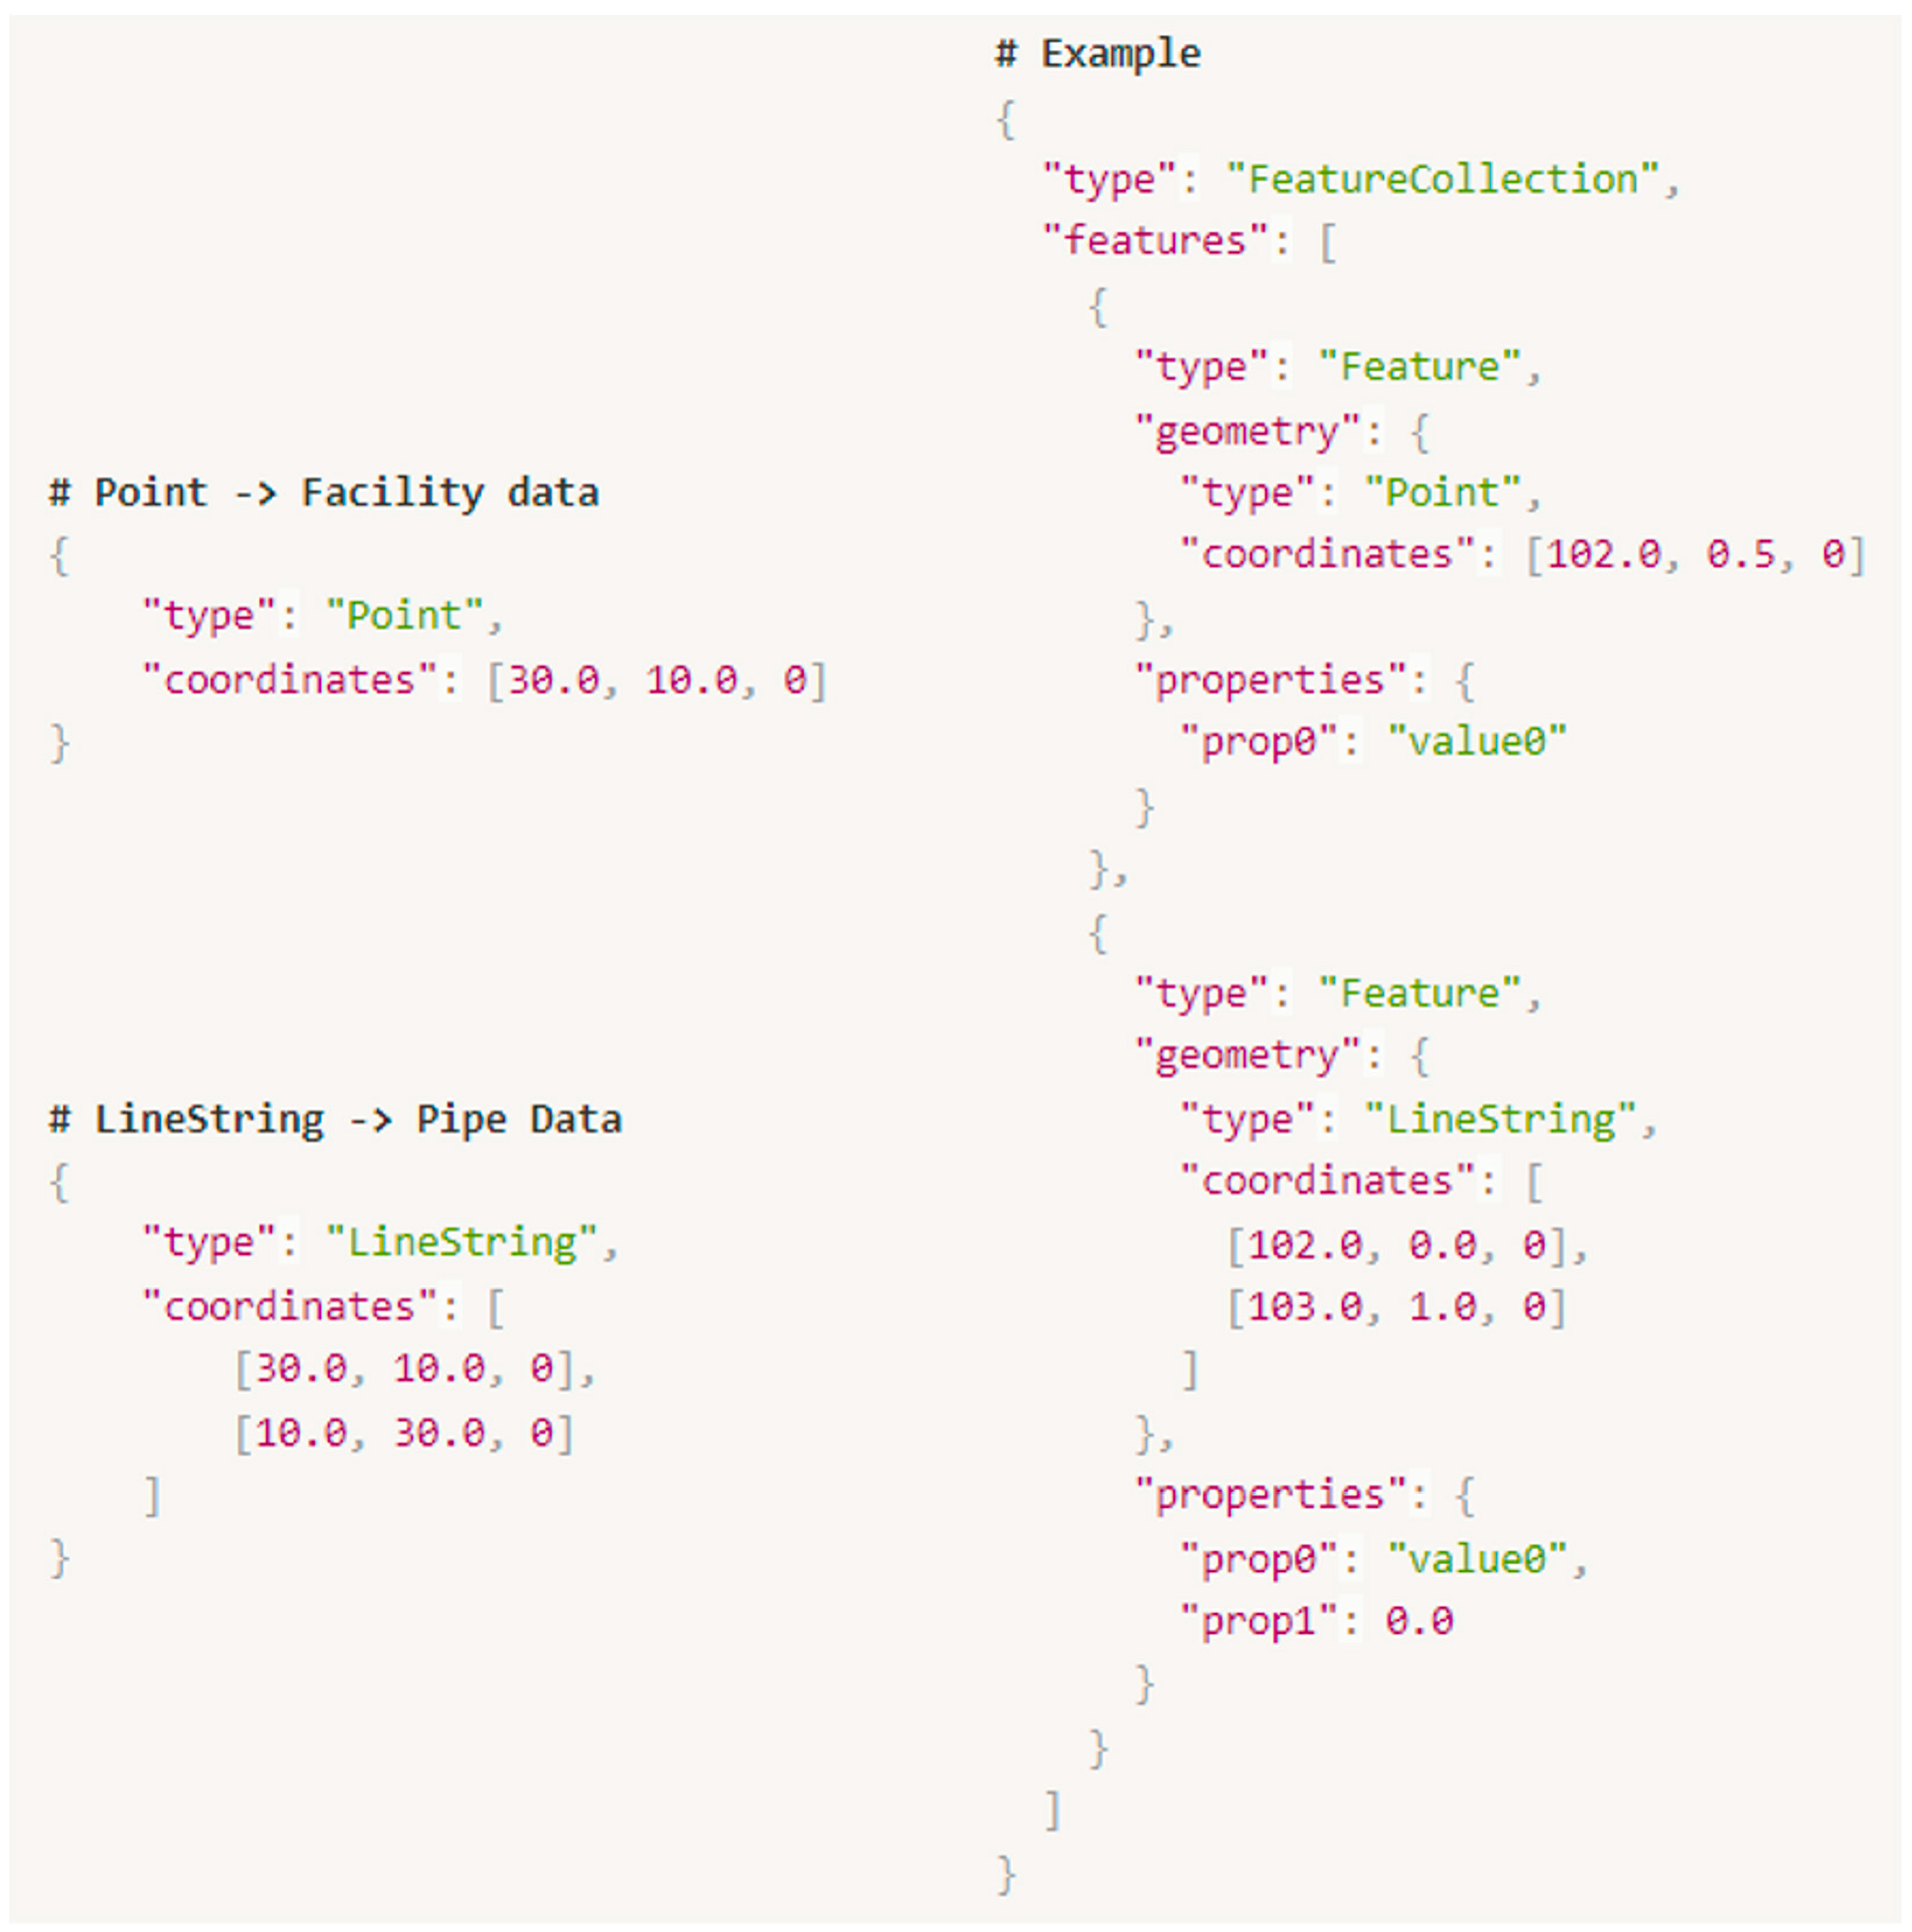
  • Map the generated object data to GeoJSON geometry types (Point, LineString) and attach location and attribute data to the GeoJSON objects.

2.5. Accuracy Testing with Complex Environment

To validate the proposed methodology, the development was initially conducted using a simple drawing. For further validation, accuracy testing was performed using complex underground facility data from a residential area currently in use, encompassing all seven major types of underground utilities. The testing process included the following steps:
Coordinate verification: randomly selected pipelines were compared with the original CAD drawings to confirm the accuracy of their coordinates;
  • Attribute verification: attributes such as diameter and material were cross-referenced with the original data to ensure consistency;
  • Systematic testing: The methodology was applied to transform the facility data from the Smart Village in Section 1, Section 2 and Section 3 of Busan Eco-Delta City [18,19], a pilot smart city in South Korea. A random sampling inspection was conducted, analyzing 20 pipeline configuration cases to evaluate the robustness of the methodology.
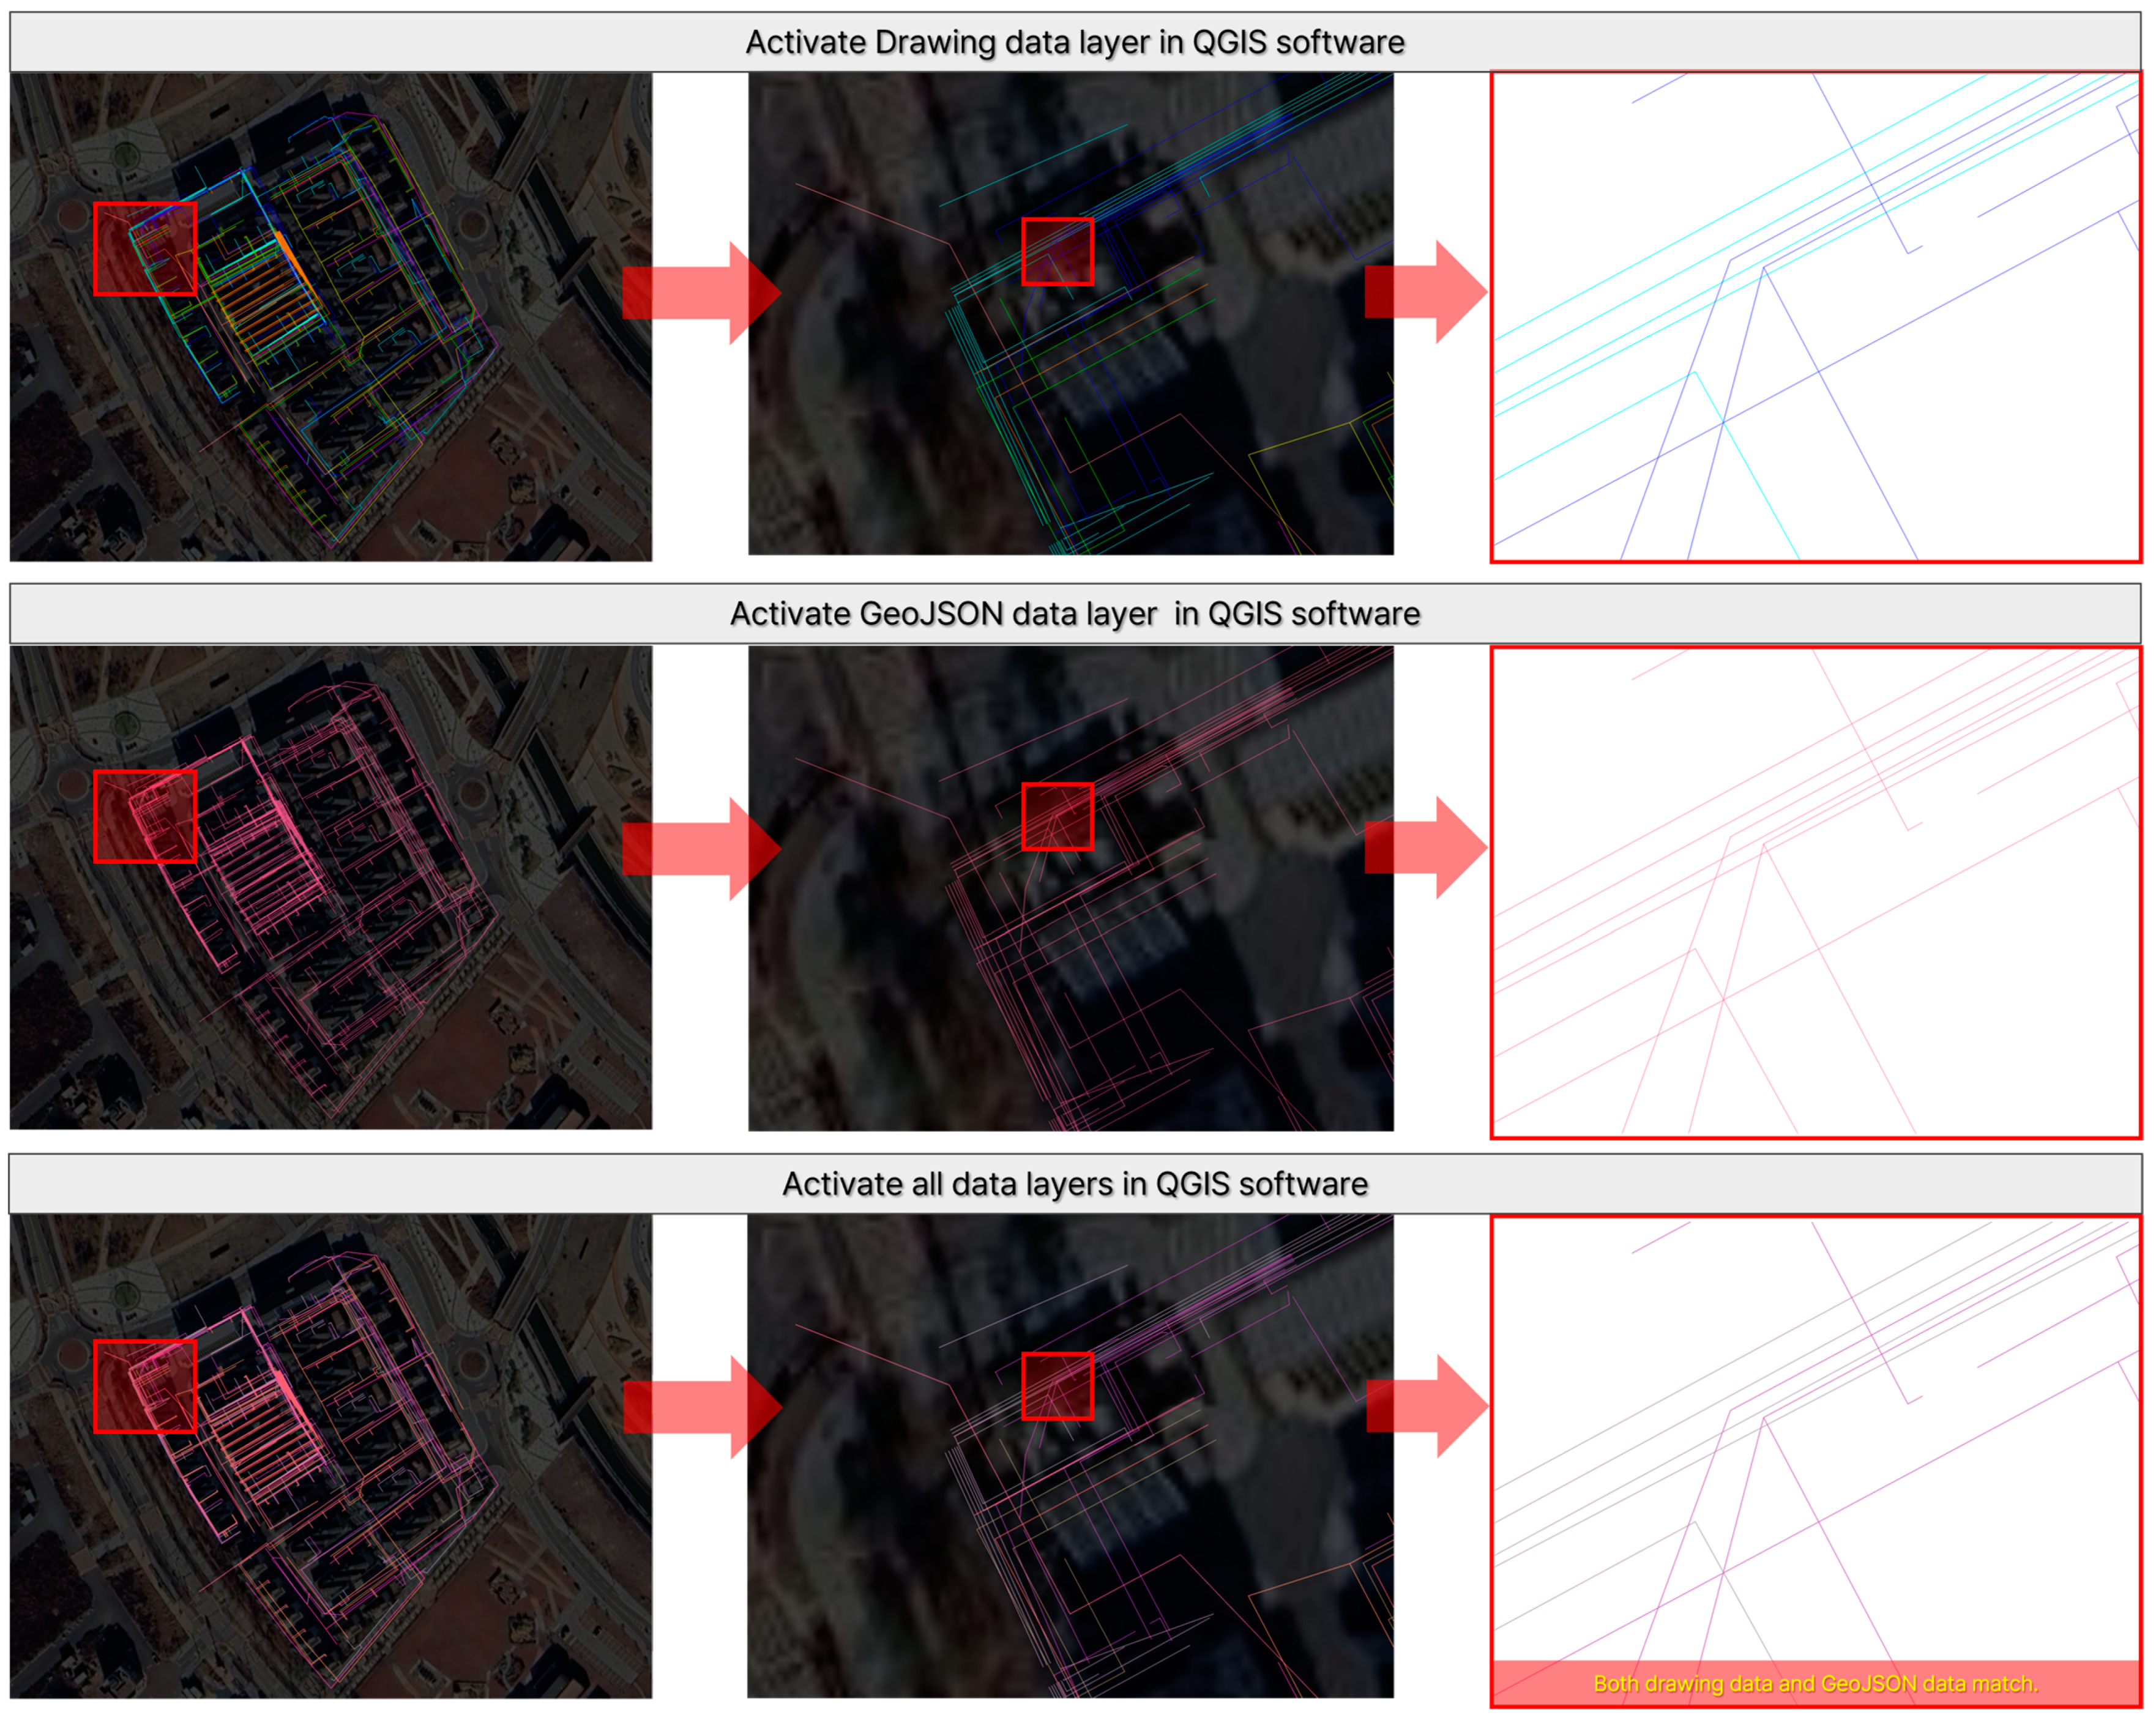
  • The results confirmed that the CAD-based drawings were accurately converted to GeoJSON without any data loss during the transformation process.

3. Standardization of Plan Drawing Formats for Extracting 3D Spatial Information of Underground Utilities

3.1. Integration of Underground Pipeline Drawings for 3D Data Extraction

Underground pipeline drawings are typically divided into the plan view, profile view, and detailed cross-sectional view, as shown in Figure 1. The plan view shows the layout and location in the X-Y plane, including the path of the pipeline and connection points. The profile view illustrates a cross-section along the pipeline’s path, providing depth data in the Z-axis and showing connections with facilities such as manholes. Finally, the detailed cross-sectional view presents specific details of particular facilities and includes information about the devices within them.
Underground pipeline drawings are created using software such as AutoCAD, where pipeline data are generated into drawing files. To generate 3D spatial data, data from plan views, profile views, and detailed cross-sectional views must be extracted and integrated into a single dataset.
However, 2D drawings have limitations in expressing spatial relationships, which can lead to misunderstandings and communication issues between designers and contractors due to the complexity of the structures. Additionally, 2D drawings may overlook critical details, failing to provide comprehensive information necessary for construction, which can result in construction errors. To overcome the limitations of 2D drawings, 3D modeling technologies like BIM (Building Information Modeling), a key smart construction technology, are being used to resolve these issues.

3.2. Integrated Management of BIM Technology and Barriers to Its Adoption

BIM is a technology designed to manage the entire lifecycle of construction, including the design, construction, operation, and maintenance. By utilizing 3D modeling to visualize design information, it integrates data such as materials, costs, construction processes, and schedules, allowing for efficient management throughout the entire construction process.
Although BIM is becoming a key technology in smart construction, several challenges need to be addressed for its full adoption.
First, most BIM software is foreign-produced, and the high initial investment cost poses a significant burden, particularly for small and medium-sized enterprises (SMEs) or startups [20]. Second, there is a shortage of skilled professionals capable of effectively using BIM. While training programs for existing 2D design engineers are being conducted, the time it takes for them to adapt to new software can negatively impact productivity [21]. Third, BIM requires the collection and processing of large amounts of data, which makes it difficult to ensure data accuracy and consistency. Legal requirements or guidelines need to be clearly established to address these issues, but currently, such regulations are insufficient [22].

3.3. Integration of 3D Spatial Information for 2D Design Engineers

To overcome the barriers to BIM adoption, it is essential to provide solutions that allow existing 2D design engineers to easily transition to BIM workflows. In this paper, we propose a method for standardizing the format of plan drawings that incorporate 3D spatial information. This approach integrates 3D coordinates and geometric data into 2D drawings, enabling design engineers to generate 3D models effortlessly while maintaining their existing workflows [23].
In particular, this method utilizes a drawing extraction module that allows for the rapid extraction of 3D spatial data, converting them into the GeoJSON format and creating the foundational data needed for generating IFC-standard BIM libraries. The proposed method effectively integrates 3D information from the design phase, contributing to the comprehensive management of the entire construction lifecycle. Furthermore, it minimizes the time required for design engineers to adapt to new software, thereby positively impacting productivity [24].
Ultimately, the adoption of plan drawings that incorporate 3D spatial information will promote the effective utilization of BIM and serve as a key foundation for accelerating the digital transformation of the construction industry.

3.3.1. 3D Spatial Data for BIM Data Processing

The 3D spatial information consists of the location, shape, and other attribute data of underground utilities. Location information is represented as points (x, y, z), which are used to generate connection relationship data between utilities [25]. The shape information describes the form and dimensions of utilities in the 3D space, including parameters like diameter, width, and height [26]. By utilizing location and shape data, 3D modeling can be created, and this can be integrated with other attribute information such as the type and name of the underground utility to process BIM data.
To process BIM data, a technology has been developed that extracts and integrates data from plan views, profile views, and detailed cross-sectional views, allowing the creation of 3D spatial data in a custom-defined JSON file format, as shown in Figure 2. However, existing technologies that use these three types of drawings to integrate them into 3D spatial data have a somewhat complex process, resulting in some inconvenience.

3.3.2. Plan Drawing Format Incorporating 3D Spatial Information

To address the limitations of existing technologies, relevant data that can be used to process 3D spatial information were selected, and a standardized drawing format was developed by adding this data to underground utility drawings. As a result, only the plan view containing 3D spatial information needs to be extracted, eliminating the need to separately extract profile views and detailed cross-sectional views. This allows for the faster and more efficient processing of 3D spatial data.
First, the Z-coordinate data, which are typically extracted from the profile view, are now incorporated into the plan view. To represent pipelines in the plan view, polyline CAD entities are used. As illustrated in Figure 3, a 3D polyline entity is utilized to include the X, Y, and Z values of the pipeline, ensuring that all spatial information is contained in the plan view.
2D design engineers traditionally represent the location of pipeline utilities in plan views using only X and Y values, typically utilizing 2D polylines or lightweight polyline entities, while the Z-value (elevation) of the utilities is depicted in the profile view. However, by using 3D polylines to create the drawings, the inconvenience of comparing plan and profile views can be eliminated. This allows the location information of the utilities to be intuitively understood with just the plan view, making it much more efficient.
Figure 4 illustrates the method for inputting the shape and attribute data for utilities in the drawing. When expressing attribute data in plan views, leaders (callout lines) are used to visually link the attribute information to each utility. The leader lines start from the specific utility and connect to a text or icon that describes the relevant attribute information, making it easier to understand the data in the drawing intuitively.
However, in order to extract information represented by the leader lines and map it to the corresponding utility with the relevant attribute data, a spatial computation process is required. This process maps the attribute data to the pipeline or utility by calculating the shortest distance between CAD entities using the coordinates entered in the drawing. However, since each 2D design engineer may have different methods of creating the drawings, many exceptions arise during the shortest distance mapping process, making it difficult to achieve accurate mapping.
To achieve a higher accuracy in mapping, instead of adding the shape and attribute information as individual CAD entities in the drawing, the same shape and attribute information can be added to a single layer, as shown in Figure 5. In this method, the same information is included in the layer name, and when extracting the drawing data, the layer name is parsed to extract and store the data in the predefined order. While adding a large amount of data may increase the length of the layer name, this approach allows for more accurate data extraction compared to the traditional method of spatial computation-based mapping.
Table 1 shows the basic rules used for creating layer names that include the shape and attribute information. If additional data are required depending on the situation, they can be added starting from the 8th item. Layers are first categorized into pipeline layers and utility layers. The pipeline and utility layers share the same structure up to the 6th item, but for utility layers, the 7th item contains the type of utility. Utility types include facilities such as manholes and valves, excluding pipelines. The data entries are separated by an underscore “_” delimiter. Additionally, if there are no data for a particular entry in the sequence, the keyword “null” is used to indicate the absence of data when extracted. Care must be taken to ensure that no entry is missing from the sequence to guarantee all data are correctly input.
As shown in Figure 6, facilities are represented in the drawing using specific symbols corresponding to their type. When inputting symbols into the drawing, Block entities are used, allowing for point-based location information, orientation during construction, and attribute information to be entered.
To represent facilities using Block entities, the appropriate symbols must be prepared in advance. Additionally, when extracting data, it becomes necessary to add a GIS DB table to the drawing to explain the meaning of the symbols, so that the facility type associated with each symbol can be extracted. This introduces an additional layer of complexity in the process.
To address this issue, Text entities can be used instead of Block entities to represent facilities, as shown in Figure 7. In this case, the facility name is entered as the content of the Text, the location of the facility is input as the point data where the Text is placed, and the orientation for construction is set using the rotation value of the Text. This allows all the same information to be entered as when using Block entities.

4. 3D Spatial Analysis of Underground Utilities Data

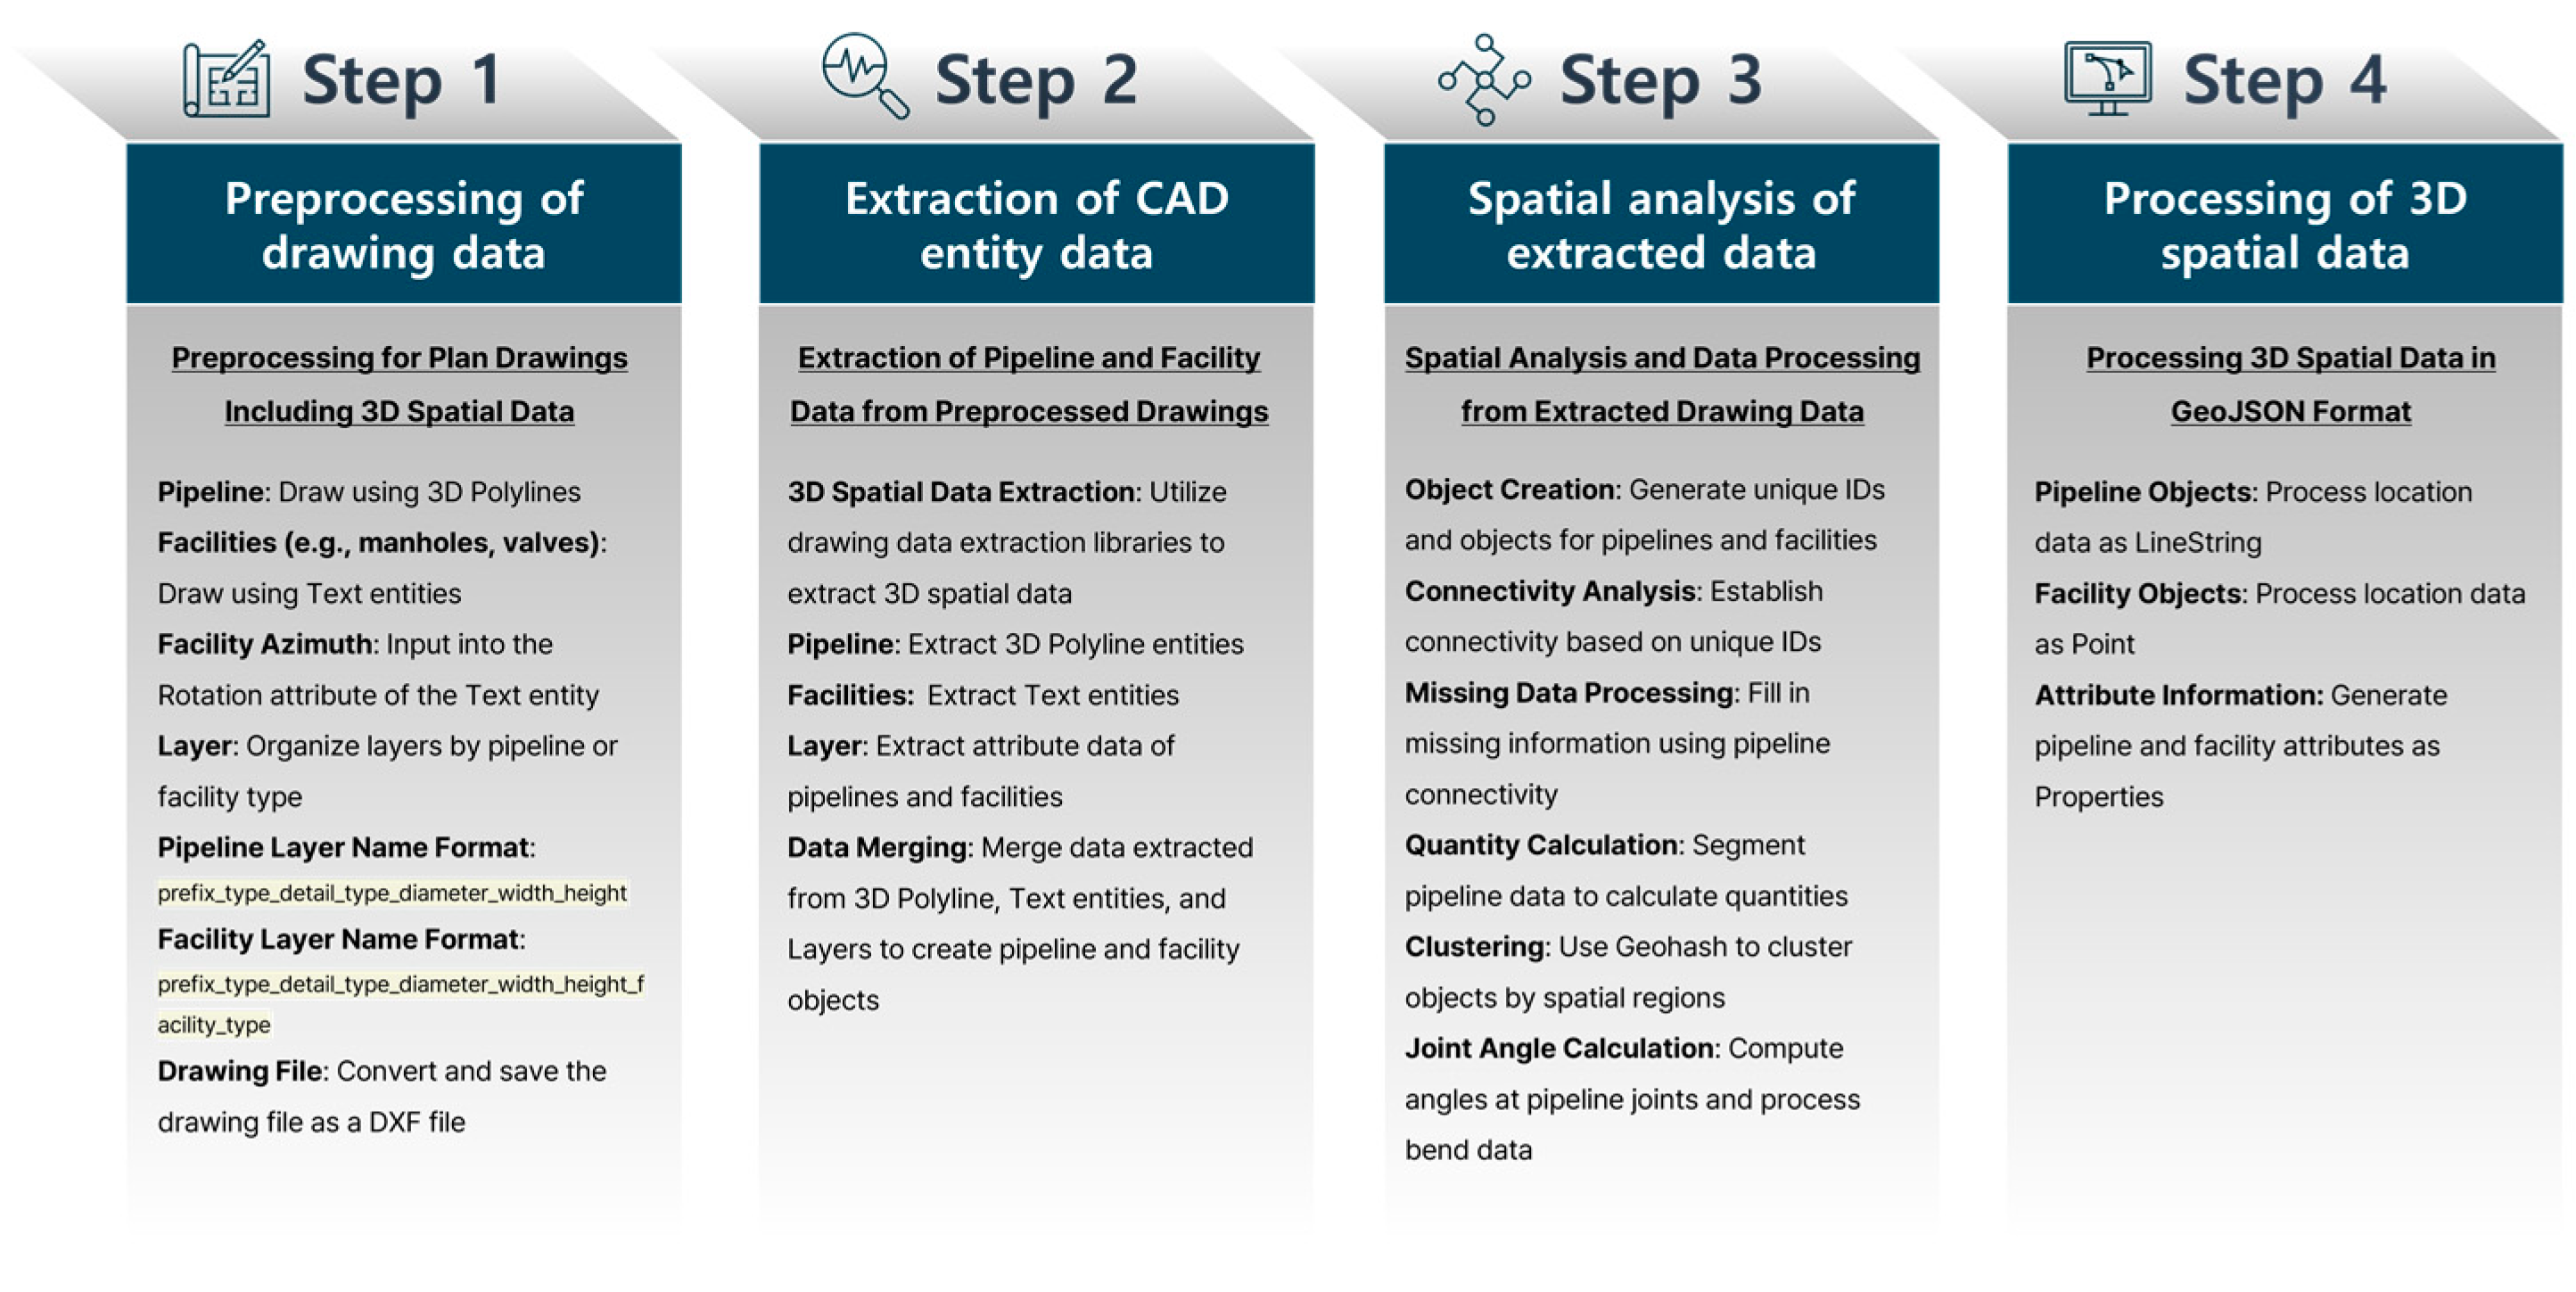
4.1. Data Extraction Process for Spatial Data Processing

Recent advancements in artificial intelligence have led to improved techniques for extracting data from drawings. One proposed method uses data augmentation techniques with the YOLO (You Only Look Once) model to accurately detect objects in drawing images [27,28]. This approach is particularly suitable for quickly and accurately recognizing objects and efficiently extracting information from construction or mechanical design drawings. Another approach combines Optical Character Recognition (OCR) with deep learning to extract text and geometric elements from drawings and convert them into 3D models for use in digital twin environments.
However, underground utility drawings require the extraction of precise construction location coordinates, which differs from the typical methods of object detection or text recognition. The location data for underground utilities are difficult to fully extract using standard image detection or text recognition methods. Therefore, it is necessary to use Polyline, Text, and Block entities within the drawings to acquire more accurate spatial data. To address this, the present study converts drawing data into ASCII text-format DXF files, allowing for the extraction of precise location data for underground utilities. This approach helps accurately calculate the required materials for construction and ensures that construction is carried out exactly according to the planned location, preventing rework and contributing to cost savings and improved work efficiency.
The DXF drawing-based data extraction method is divided into four main stages, as shown in Figure 8. The first stage processes the extracted drawing file into a plan view containing the 3D spatial information. The second stage extracts CAD entities from the drawing containing the 3D spatial information. The third stage processes the underground utility data using spatial computations based on the extracted data. The fourth and final stage processes the information into the GeoJSON format, producing the final underground utility data.

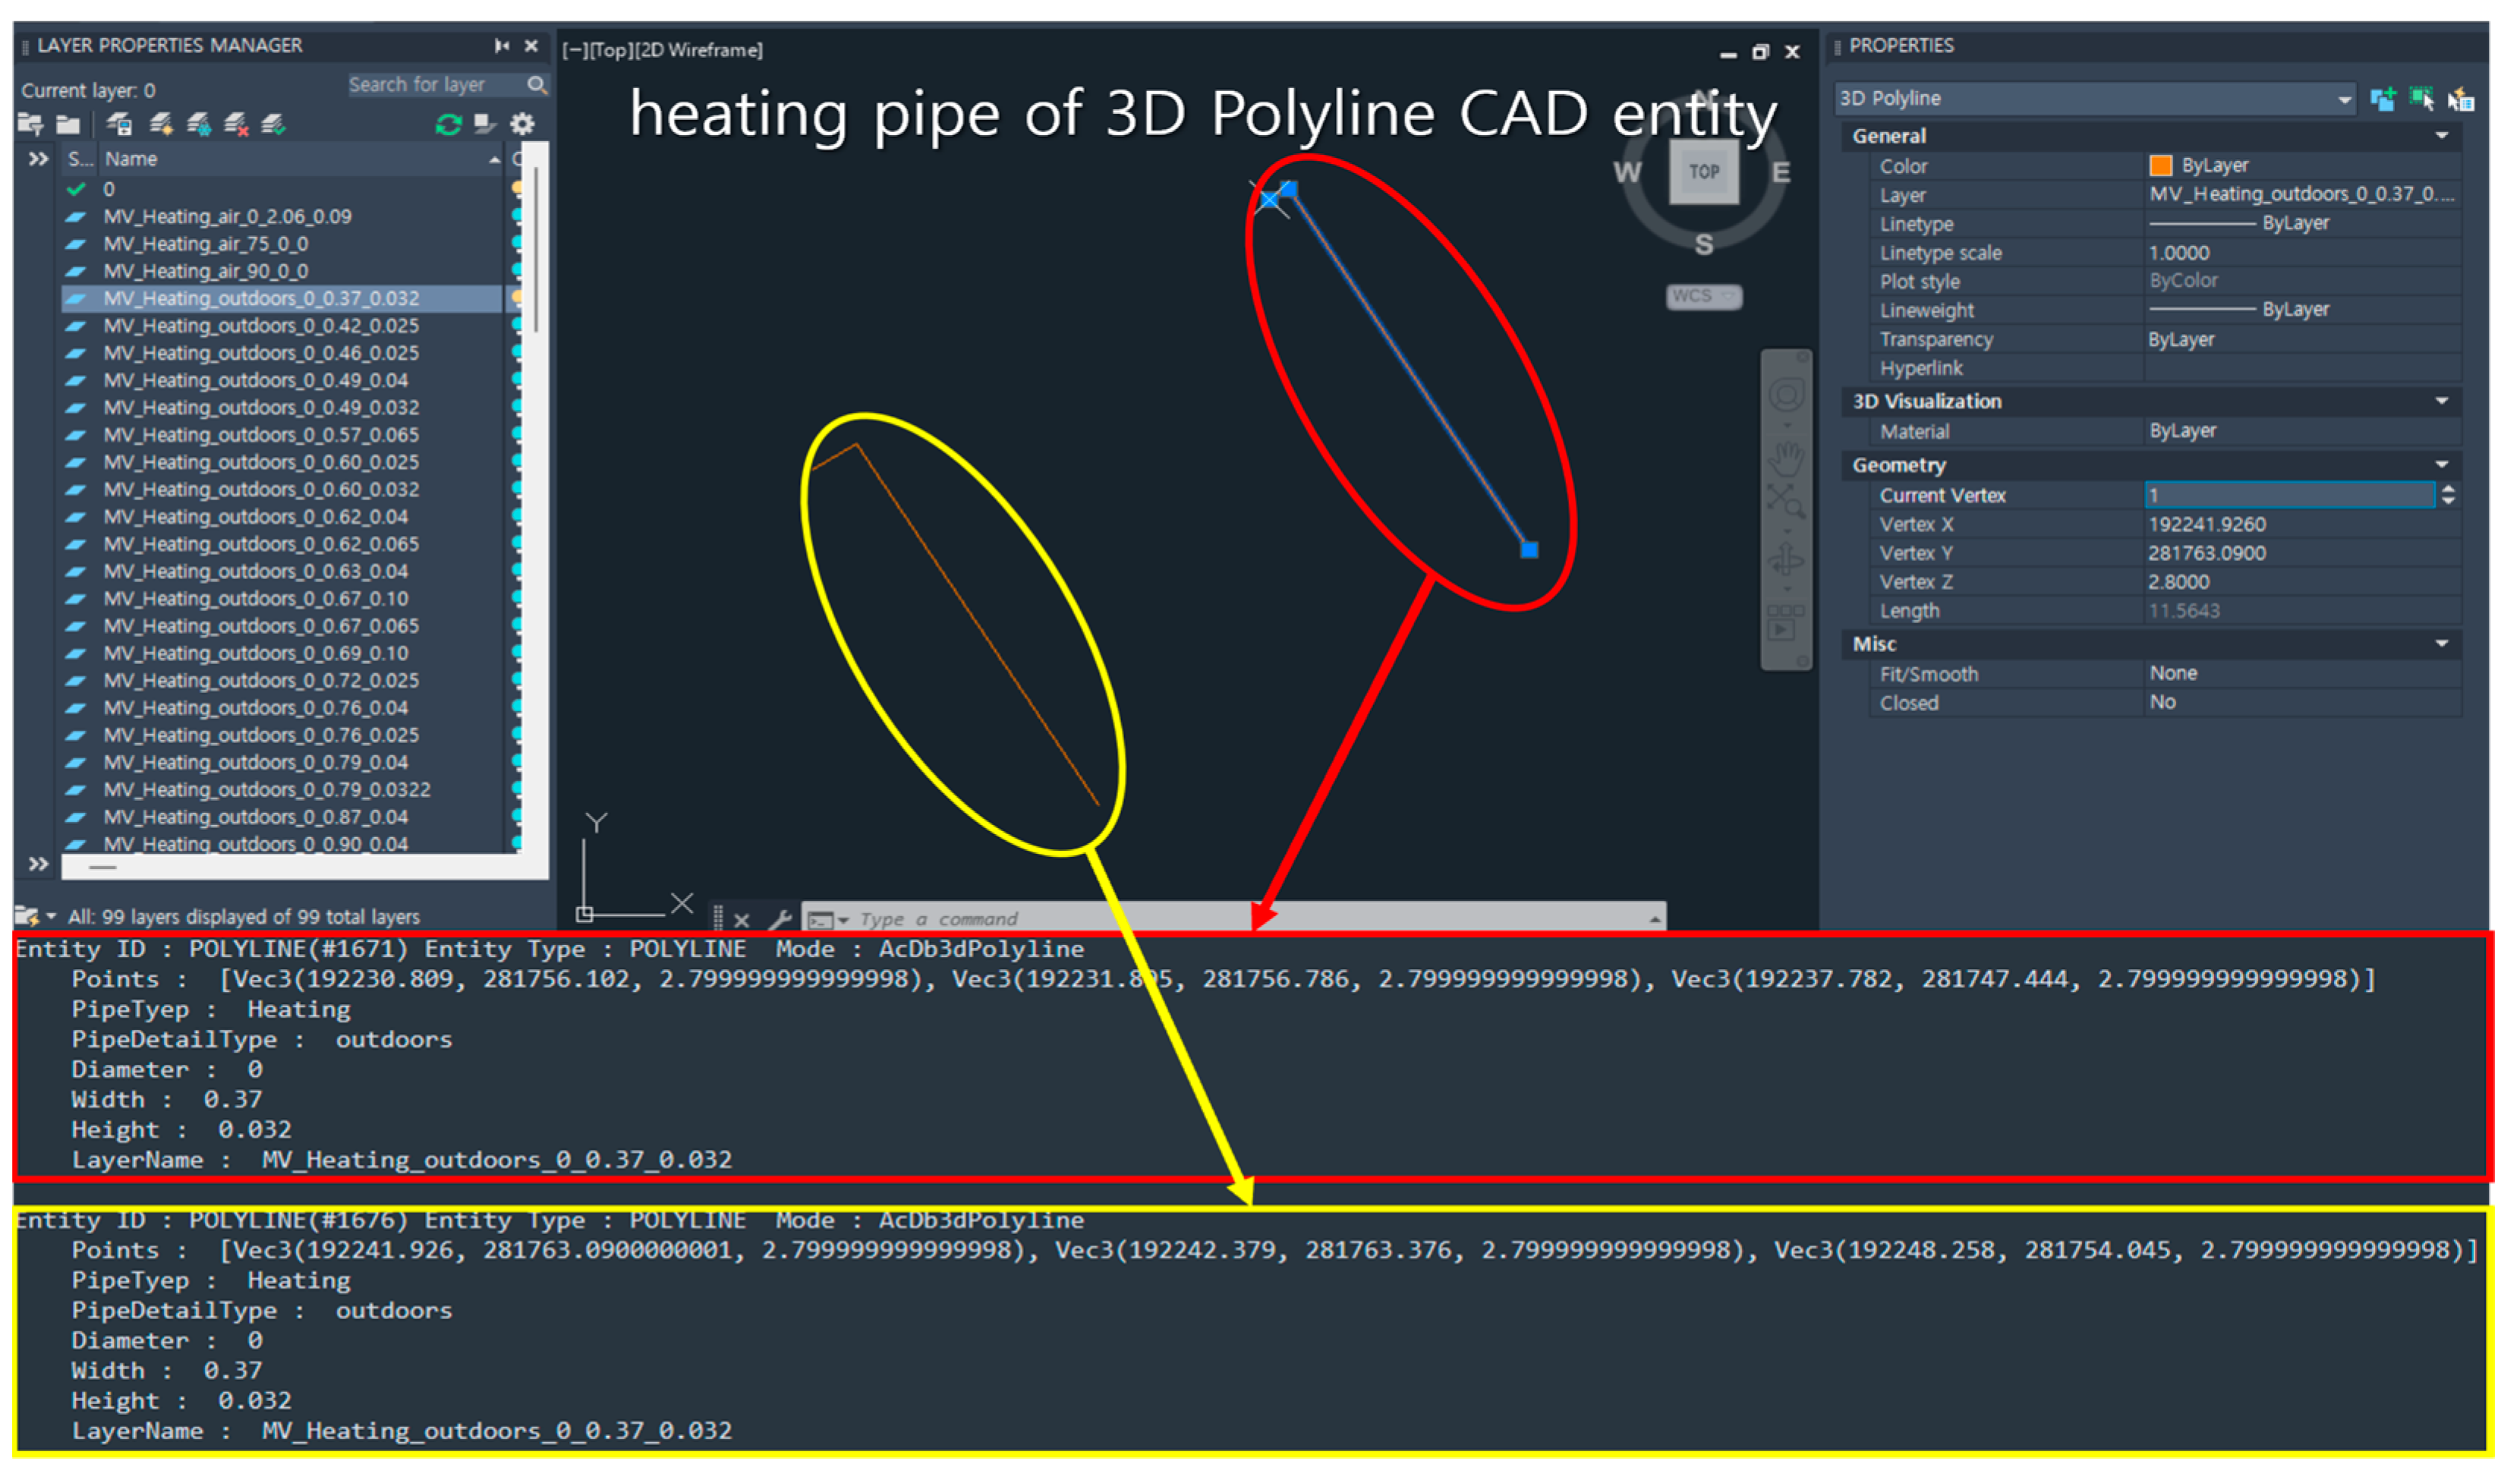
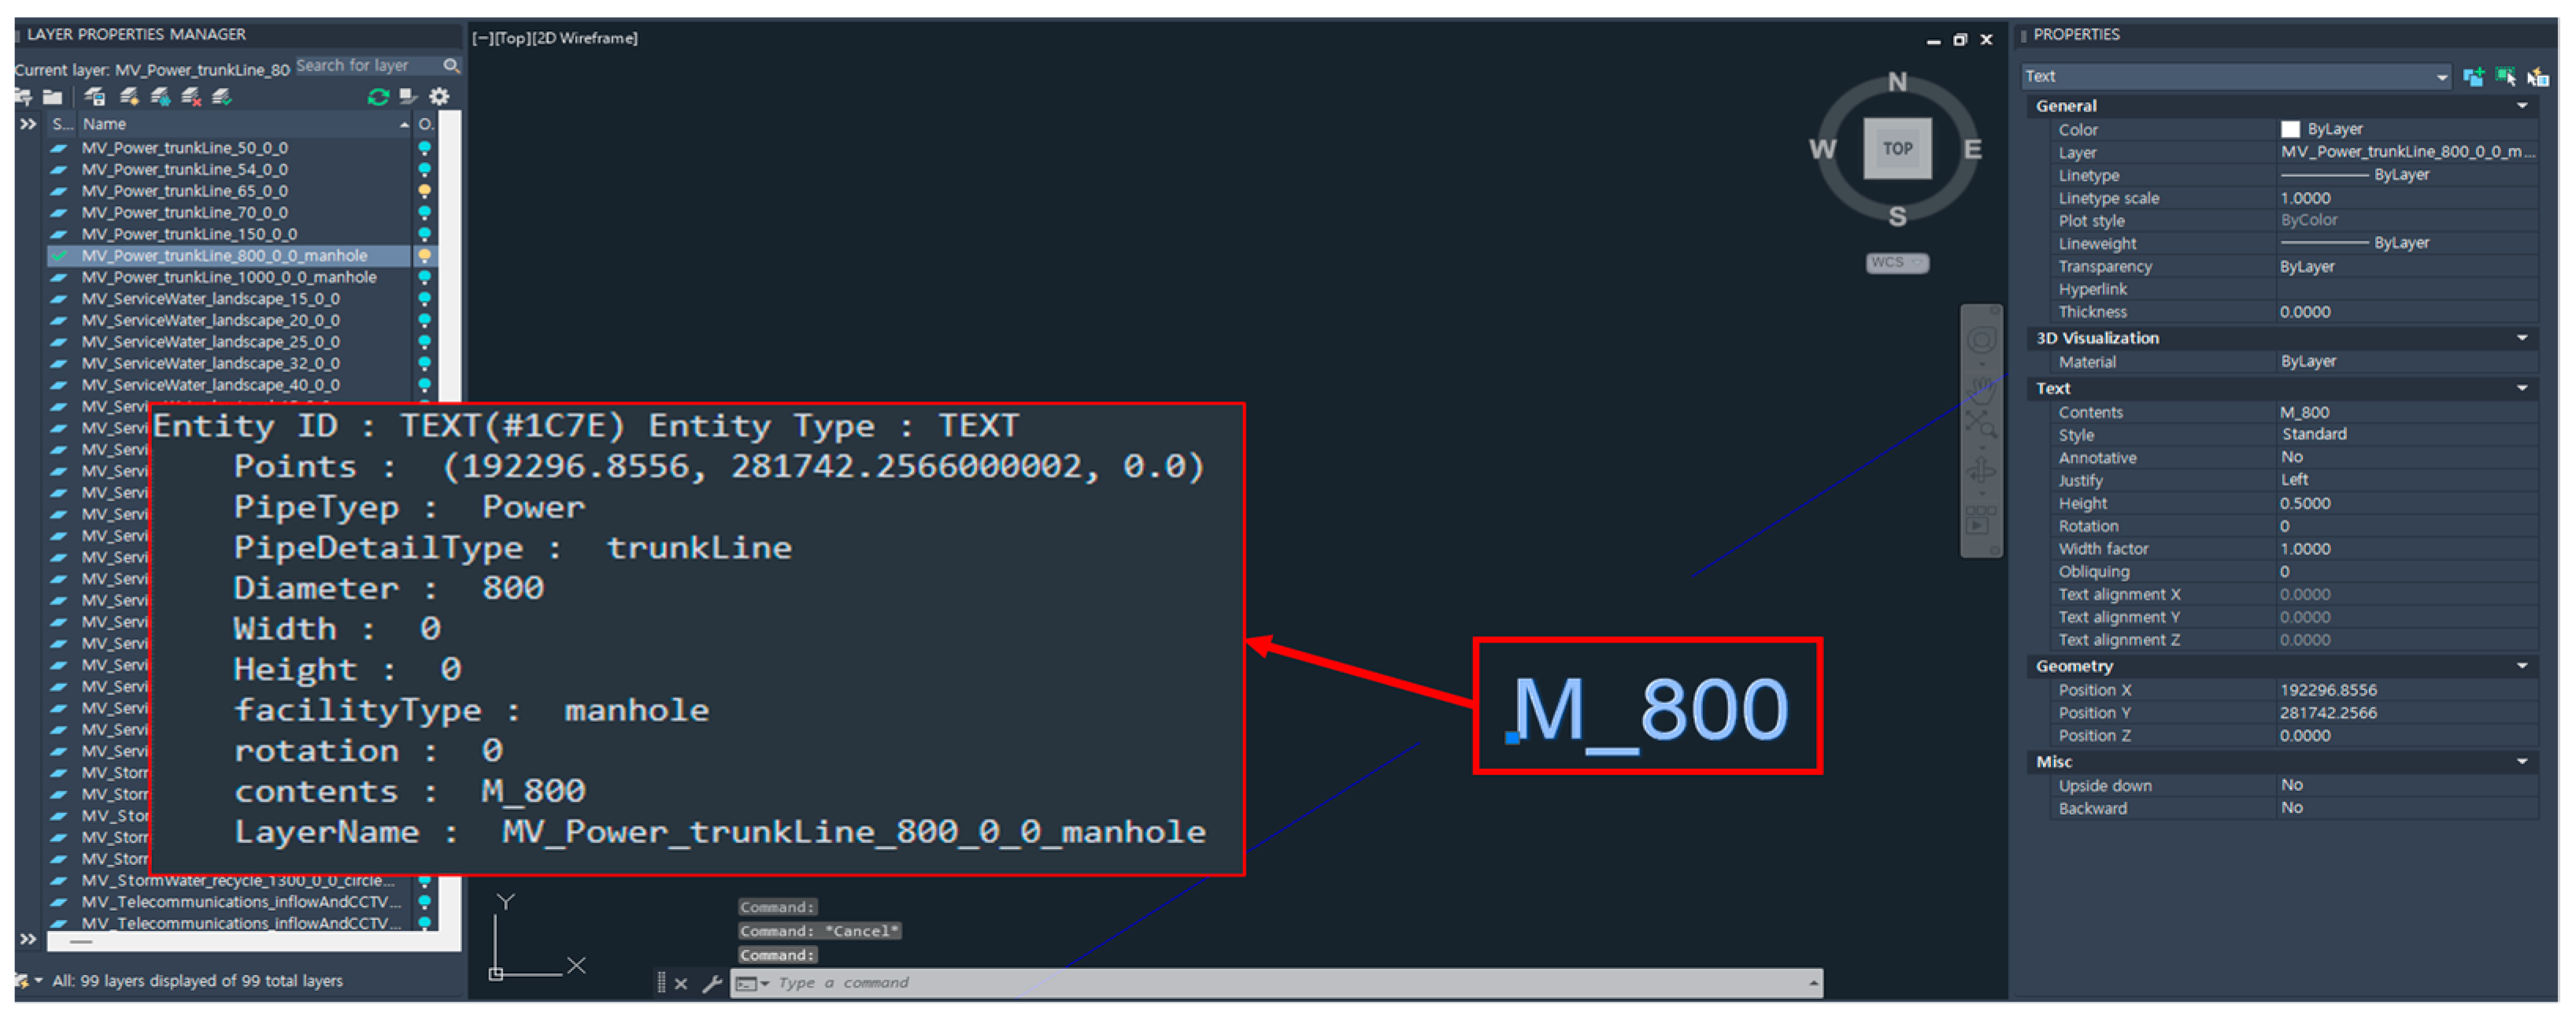
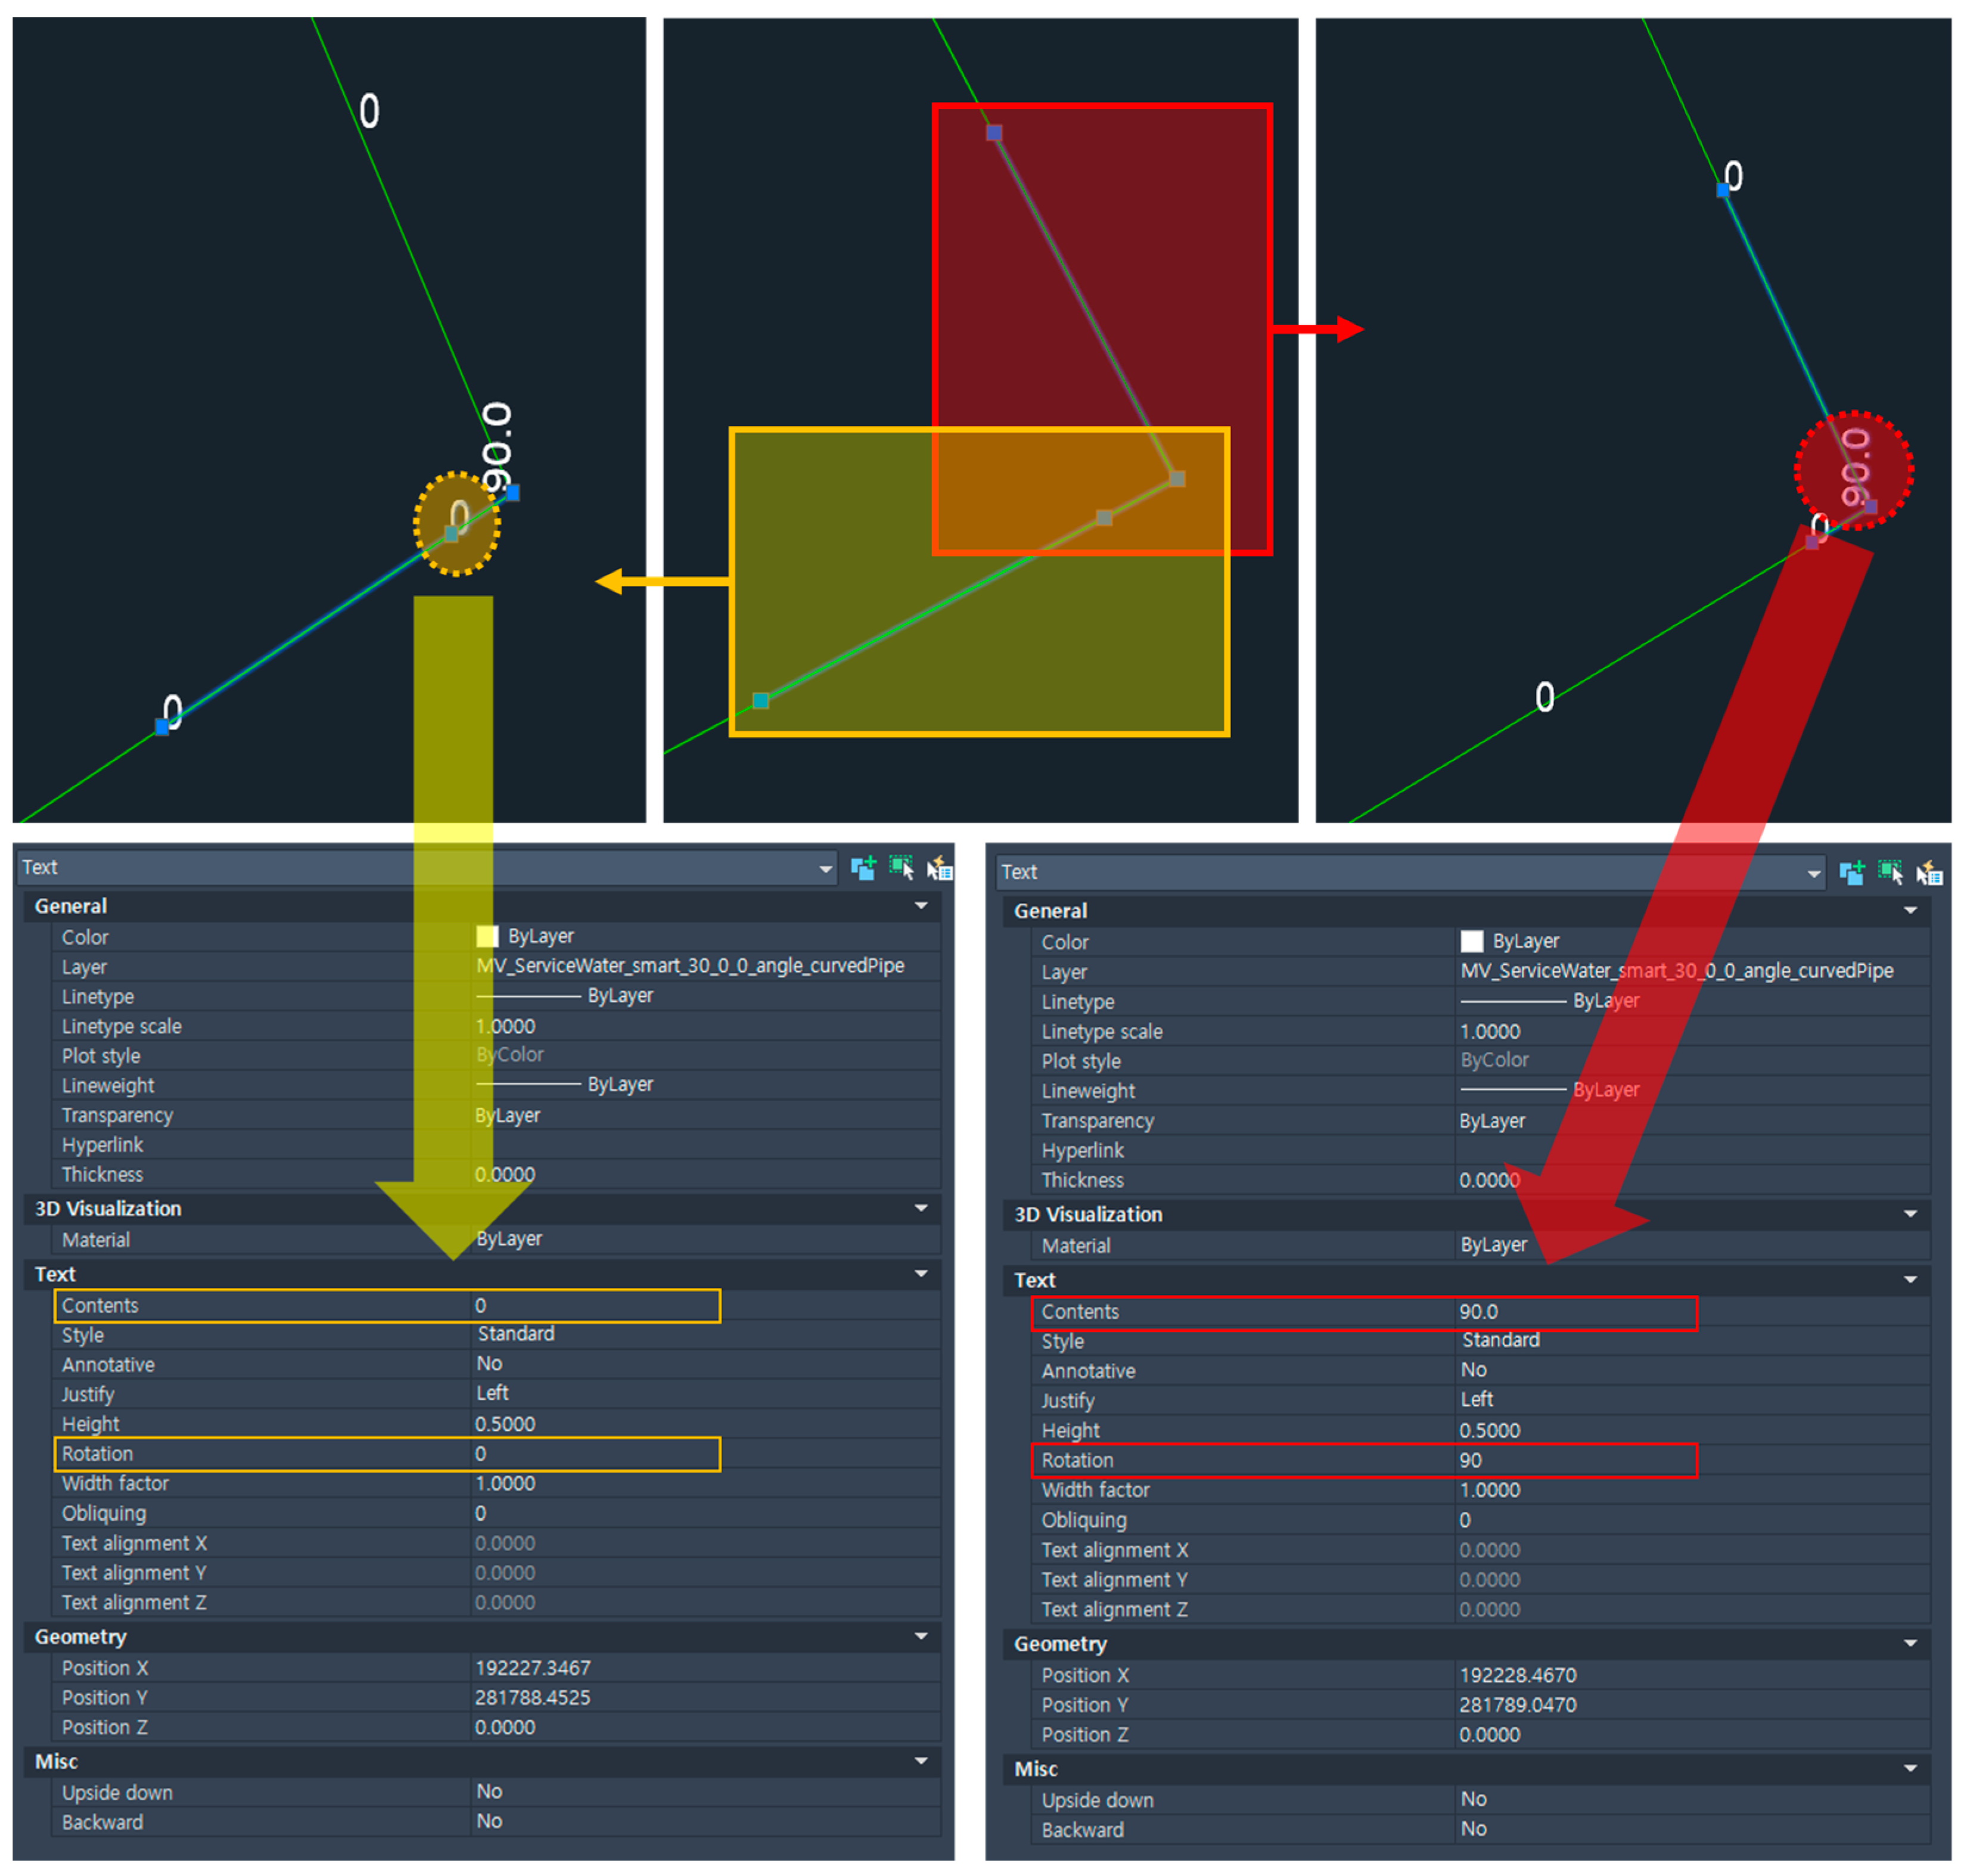
4.2. CAD Entity Data Extraction

The CAD data structure is illustrated in Figure 9. The Document represents the entire CAD file and serves as the top-level object containing all the data in the drawing. The Modelspace represents the actual working space of the CAD drawing, where all the entity information is stored in a 1:1 scale design space. Layers are logical divisions within the CAD drawing used to separate and manage specific groups of entities. Each Layer can be assigned attributes such as a name, color, and visibility settings, and the entities within a Layer inherit these properties. Entities represent the actual design elements, such as lines, polylines, text, circles, and blocks. Each entity has its own unique properties, such as the location, size, and shape [29].
In Section 3 (Standardization of Plan Drawing Formats for Extracting 3D Spatial Information of Underground Utilities), the underground utility plan view containing the 3D spatial information is converted into a DXF file. Once the converted drawing is loaded, the Document object is accessed, and all Layer information from the Modelspace object is retrieved. The entities contained within each layer are then extracted using the CAD Entity Data Extraction Module, which retrieves the relevant information for each entity.
Figure 10 shows the generation of a plan view representing the 3D spatial data for heating pipes, expressed as a 3D polyline CAD entity. Underground utilities are represented as lines made up of two or more points, with critical location information entered as geometric data rather than being displayed in text form. To extract detailed information from the CAD entities, the CAD Entity Extraction Module is used to retrieve the specific information entered.
Figure 11 illustrates an example of generating manhole facility information as a Text CAD entity in the plan view. In this case, the facility information is represented by a single point indicating its location, and detailed information is extracted using the CAD Entity Extraction Module.
In the plan view format that includes the 3D spatial information, both pipeline and facility data are represented in a predefined format. The CAD Entity Extraction Module analyzes formats defined by CAD, such as Polyline and Text, to extract the data, which are then processed into a format suitable for 3D spatial information.

4.3. Spatial Analysis and 3D Spatial Data Processing

The data extracted from the CAD entities of pipelines and facilities are raw data represented as points and lines obtained from the drawing. These data are then processed into pipeline and facility objects, which are used to generate the final 3D spatial data. The processed 3D spatial data are output in GeoJSON format for use in various GIS software applications.
First, the raw positional data in the form of points and lines are utilized to process the data into pipeline and facility objects. The line-based raw data, represented as a Polyline entity, are composed of two or more points, with each pair of points forming a line, which is then represented as pipeline data. For example, a Polyline composed of three points can be processed into two pipeline objects. Point-based facility data represent valves, manholes, and other facilities, and since each facility only requires one location point, these data can be used as they are.
Each generated object is assigned a unique identifier to ensure no duplication among objects. Typically, a UUID (Universally Unique Identifier) is used, but this takes up significant storage space (128 bits), is not easily readable, and is inefficient for sequential sorting.
In this study, the unique identifier for each pipeline and facility object is generated by combining the x, y, and z coordinates of the location data, as shown in Figure 12.
The unique identifier generated using this method is utilized for retrieving object information. Since it is based solely on the object’s location data, it allows for the immediate extraction of location information. Furthermore, it offers greater versatility for other applications compared to using a UUID, which is why this unique identifier was adopted instead of a UUID in this study.
Second, additional information for pipeline and facility objects is processed using the Layer name and entity attribute information. By analyzing the Layer name, information such as the type of pipeline (e.g., water, electricity, communication), diameter, width, height, and the type of facility is processed as the object’s attribute information.
After generating the pipeline and facility objects and processing the attribute information, the final object information is stored in the underground utility structure, as shown in Figure 13. The basic point object contains the location information of the pipelines and facilities. For pipelines, two-point coordinates are stored, with the start and end points each represented as separate point objects. Other facilities are represented with a single-point object containing their location information.
Each underground utility object contains a point object with its unique identifier and location information, and also manages the corresponding attribute information. This structure allows for the efficient storage and management of the various attributes and location data of underground utilities.
Third, spatial analysis is used to analyze the relationships between pipelines and generate missing branch pipe data. In Figure 14, the point where the branch pipe occurs is shown, and the relationship of the branch is identified using the 3D location data of Pipeline 1 and Pipeline 2 [30]. The branch pipe location must be included in both Pipeline 1 and 2, but since Pipeline 2 does not contain this information, new branch pipe location data are generated for Pipeline 2. This separates Pipeline 2 into two pipelines, and the object information is updated accordingly.
Fourth, for design drawings, the actual quantity of pipelines is calculated by dividing the pipelines represented by polylines into segments based on the length of construction materials. Spatial analysis is used to generate new point information, which is then used to assemble the pipeline objects.
Figure 15 illustrates the spatial analysis process for quantity calculation. Here, the length of Pipeline 1 is 150 m, and the length of Pipeline 2 is 87.21 m. In the design of underground utilities, design engineers select commercially available pipelines based on factors such as the ground characteristics of the installation site and the population density of the surrounding area. These selections are documented accordingly. Using the pipe diameter and material information specified for the region, engineers determine the length of the construction materials and segment pipelines 1 and 2 into defined lengths. This segmentation process facilitates the subdivision of pipelines within a three-dimensional spatial framework. The relationships between the segmented points are analyzed, and the final pipeline objects are created accordingly [31].
Fifth, once the pipeline and facility objects are created, clustering is performed to analyze the connection relationships between underground utilities. Utilizing Geohash allows for the efficient clustering and analysis of large spatial datasets, which can be applied in various fields such as IoT, traffic management, and GIS [32,33,34,35].
To analyze the connection relationships between underground utilities, the central coordinates of the pipeline objects are converted into Geohash values for clustering. The relationships between objects with the same Geohash value are analyzed first, and for pipeline objects located on the boundary of a Geohash area, the adjacent 8 Geohash areas are further analyzed to extend the connection relationships. To determine if pipelines are connected, the object IDs of the two points that make up the pipelines are compared. If they share the same point, they are considered connected.
For example, in Figure 16, Pipeline 1 is classified as part of the Geohash area ‘wy5xvk6z’, based on its central coordinates. Similarly, Pipeline 2, which is connected to Pipeline 1, also falls within the same Geohash area, ‘wy5xvk6z’, indicating that both pipelines belong to the same Geohash region. In contrast, Pipeline 3, which is also connected to Pipeline 1, is located in the Geohash area ‘wy5xvke0’, making it part of a different Geohash region.
To identify the connectivity of Pipeline 1, its Geohash value, ‘wy5xvk6z’, is used to analyze connections with other pipelines within the same Geohash area, confirming its connection to Pipeline 2. However, the connection between Pipeline 1 and Pipeline 3 cannot be determined at this stage. After analyzing the connections within the same Geohash region, the analysis is extended to the eight adjacent Geohash areas—North (N), North-East (NE), East (E), South-East (SE), South (S), South-West (SW), West (W), and North-West (NW)—relative to the Geohash value of Pipeline 1 (‘wy5xvk6z’). Through this process, the connectivity between Pipeline 1 and Pipeline 3, located in the Geohash area ‘wy5xvke0’, can be established.
The connectivity between pipelines is determined based on the Geohash region of their central coordinates, enabling the accurate identification of spatial relationships between pipelines.
This Geohash-based clustering technique enables the systematic analysis of the spatial connectivity between pipelines and facilities.
Sixth, the angle between connected pipelines is calculated based on their connection relationships. This angle calculation is necessary for determining the type and quantity of elbows required for the actual construction. When installing elbows at pipeline junctions, it is important to know the connection angle to select the appropriate elbow type. Commonly available elbows are typically 40°, 90°, and 180°, while non-standard angles such as 11.25° and 22.5° are also used. For other angles, two straight pipes may be welded together on-site to achieve the desired angle.
The angle between two pipelines is calculated by converting the location information of each pipeline into vectors, and then determining the angle between the two vectors using the dot product calculation, as shown in Equation (1). The angles calculated through Equation (1) can be observed in various forms, as shown in Figure 17.
θ = acos ( α · β | α | | β | )   ( w h e r e   0     θ < 180 ) ,
The calculated angle is used to determine the quantity of elbows based on the available types. Figure 17 shows the process of calculating the angle between two pipelines based on their connection relationship and inputting this information into the drawing. This process enables the accurate identification of the type and quantity of elbows required for construction, thereby improving the accuracy of material planning and cost estimation.
Through the six stages of spatial analysis, the data extracted from CAD entities are processed into an underground utility object structure. Depending on the need, additional spatial analyses can be conducted, such as calculating the 3D rotation angles for placing underground utilities in 3D space or extracting design interference points.

5. 3D Spatial Data in GeoJSON Format

5.1. Application of GeoJSON Format to Underground Utility Data

GeoJSON is a concise and intuitive data format based on JSON, designed to represent geographic data. It supports spatial objects of various shapes, such as points, lines, and polygons, each containing coordinate and attribute information. GeoJSON is widely used for data transmission and storage in web-based geographic information systems, enabling the efficient sharing of spatial data across GIS applications. Its simplicity and versatility make it a key component in modern geospatial data processing and analysis, especially for sharing open data.
For BIM data processing, the extracted data from plan views, profile views, and detailed cross-sectional views are integrated into a custom-defined JSON structure, as shown in Figure 2. Since this JSON file structure must be shared for data exchange, there are challenges in using it across different software applications. To address this issue, the 3D spatial data processed into the custom JSON format were converted into GeoJSON, a standard adopted under RFC 7946 by the IETF (Internet Engineering Task Force) in 2016. Through this conversion, the 3D spatial data are now optimized for use in various geographic information software applications.
The GeoJSON file structure uses the JSON format to represent geographical objects, organizing spatial data in an intuitive and concise manner. A GeoJSON file typically starts with a top-level object called FeatureCollection, which contains multiple Feature objects. Each Feature object has a geometry attribute representing its location information and a properties attribute containing additional attribute data about the geographic object. The geometry attribute can be defined as a point, lineString, or polygon, and each shape is represented by an array of coordinates. For example, a point object contains a single coordinate, while a line object is represented by a series of connected coordinates.
The pipeline data for underground utilities are represented as a linestring, while other facilities are represented as points, with their topological information defined in the geometry attribute, as illustrated in Figure 18. Additionally, the shape and attribute information for each facility are stored in the properties attribute in a key-value format, and any additional underground utility information is stored here to further process the data.

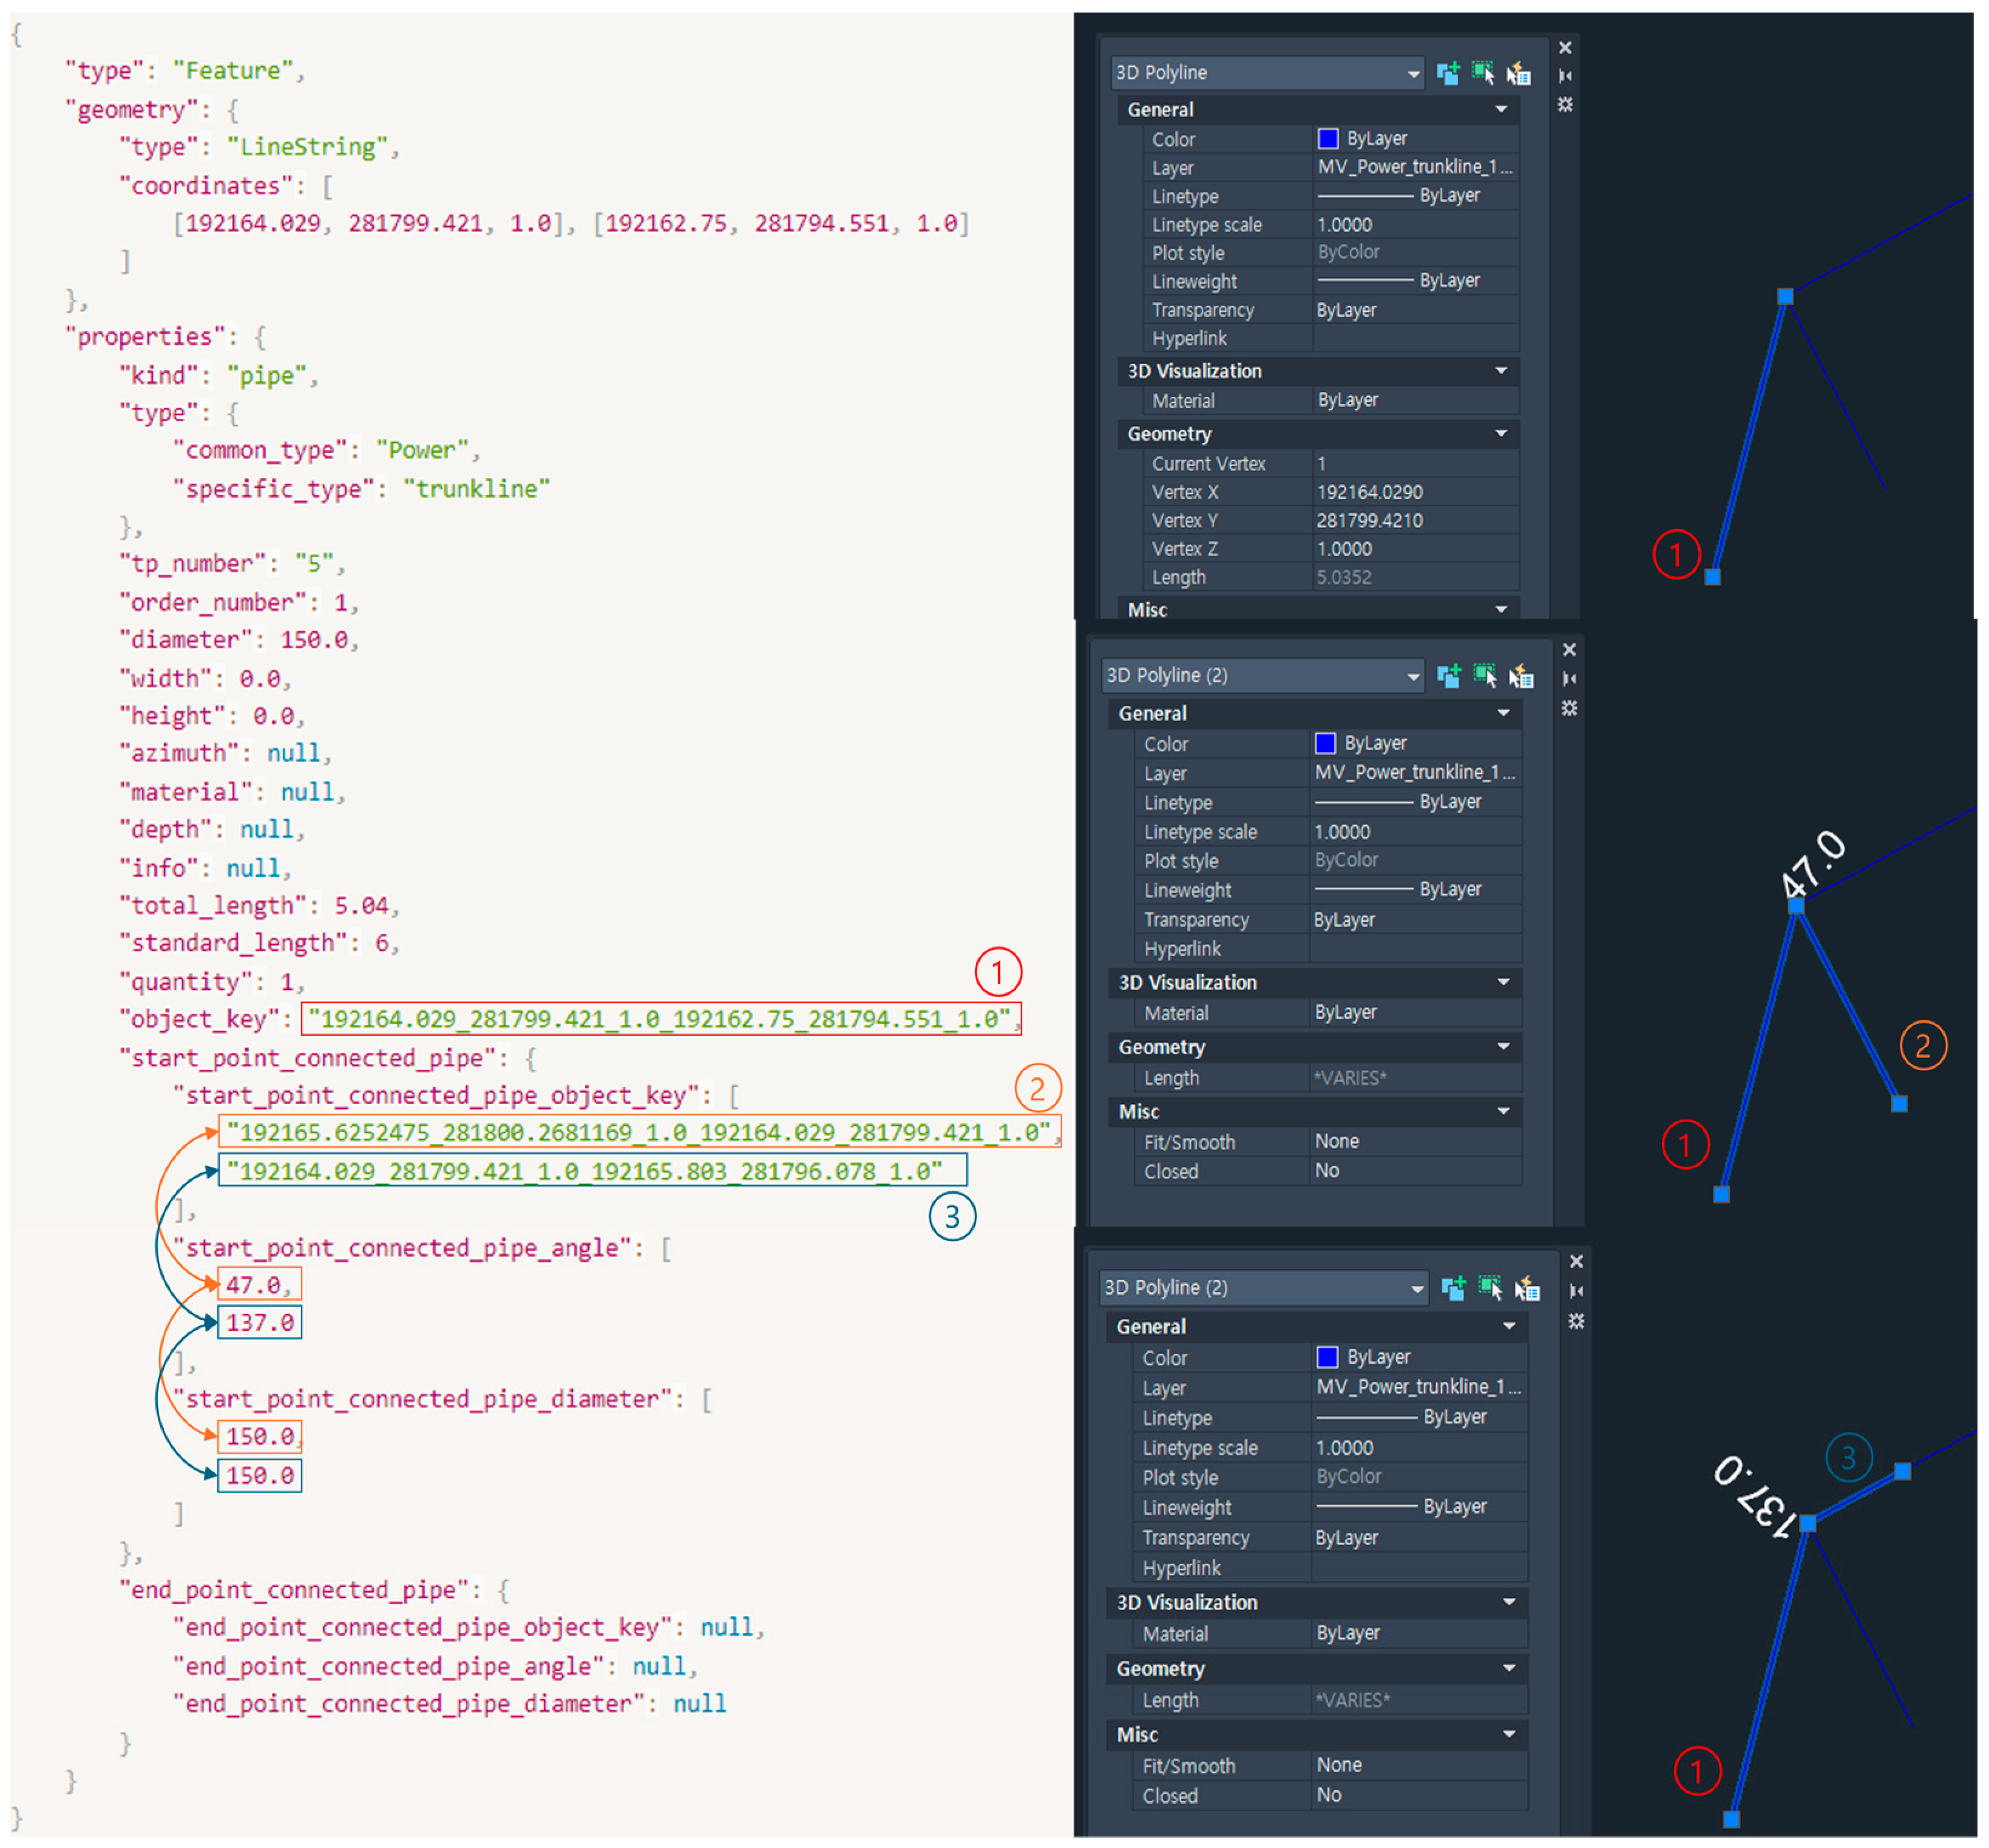
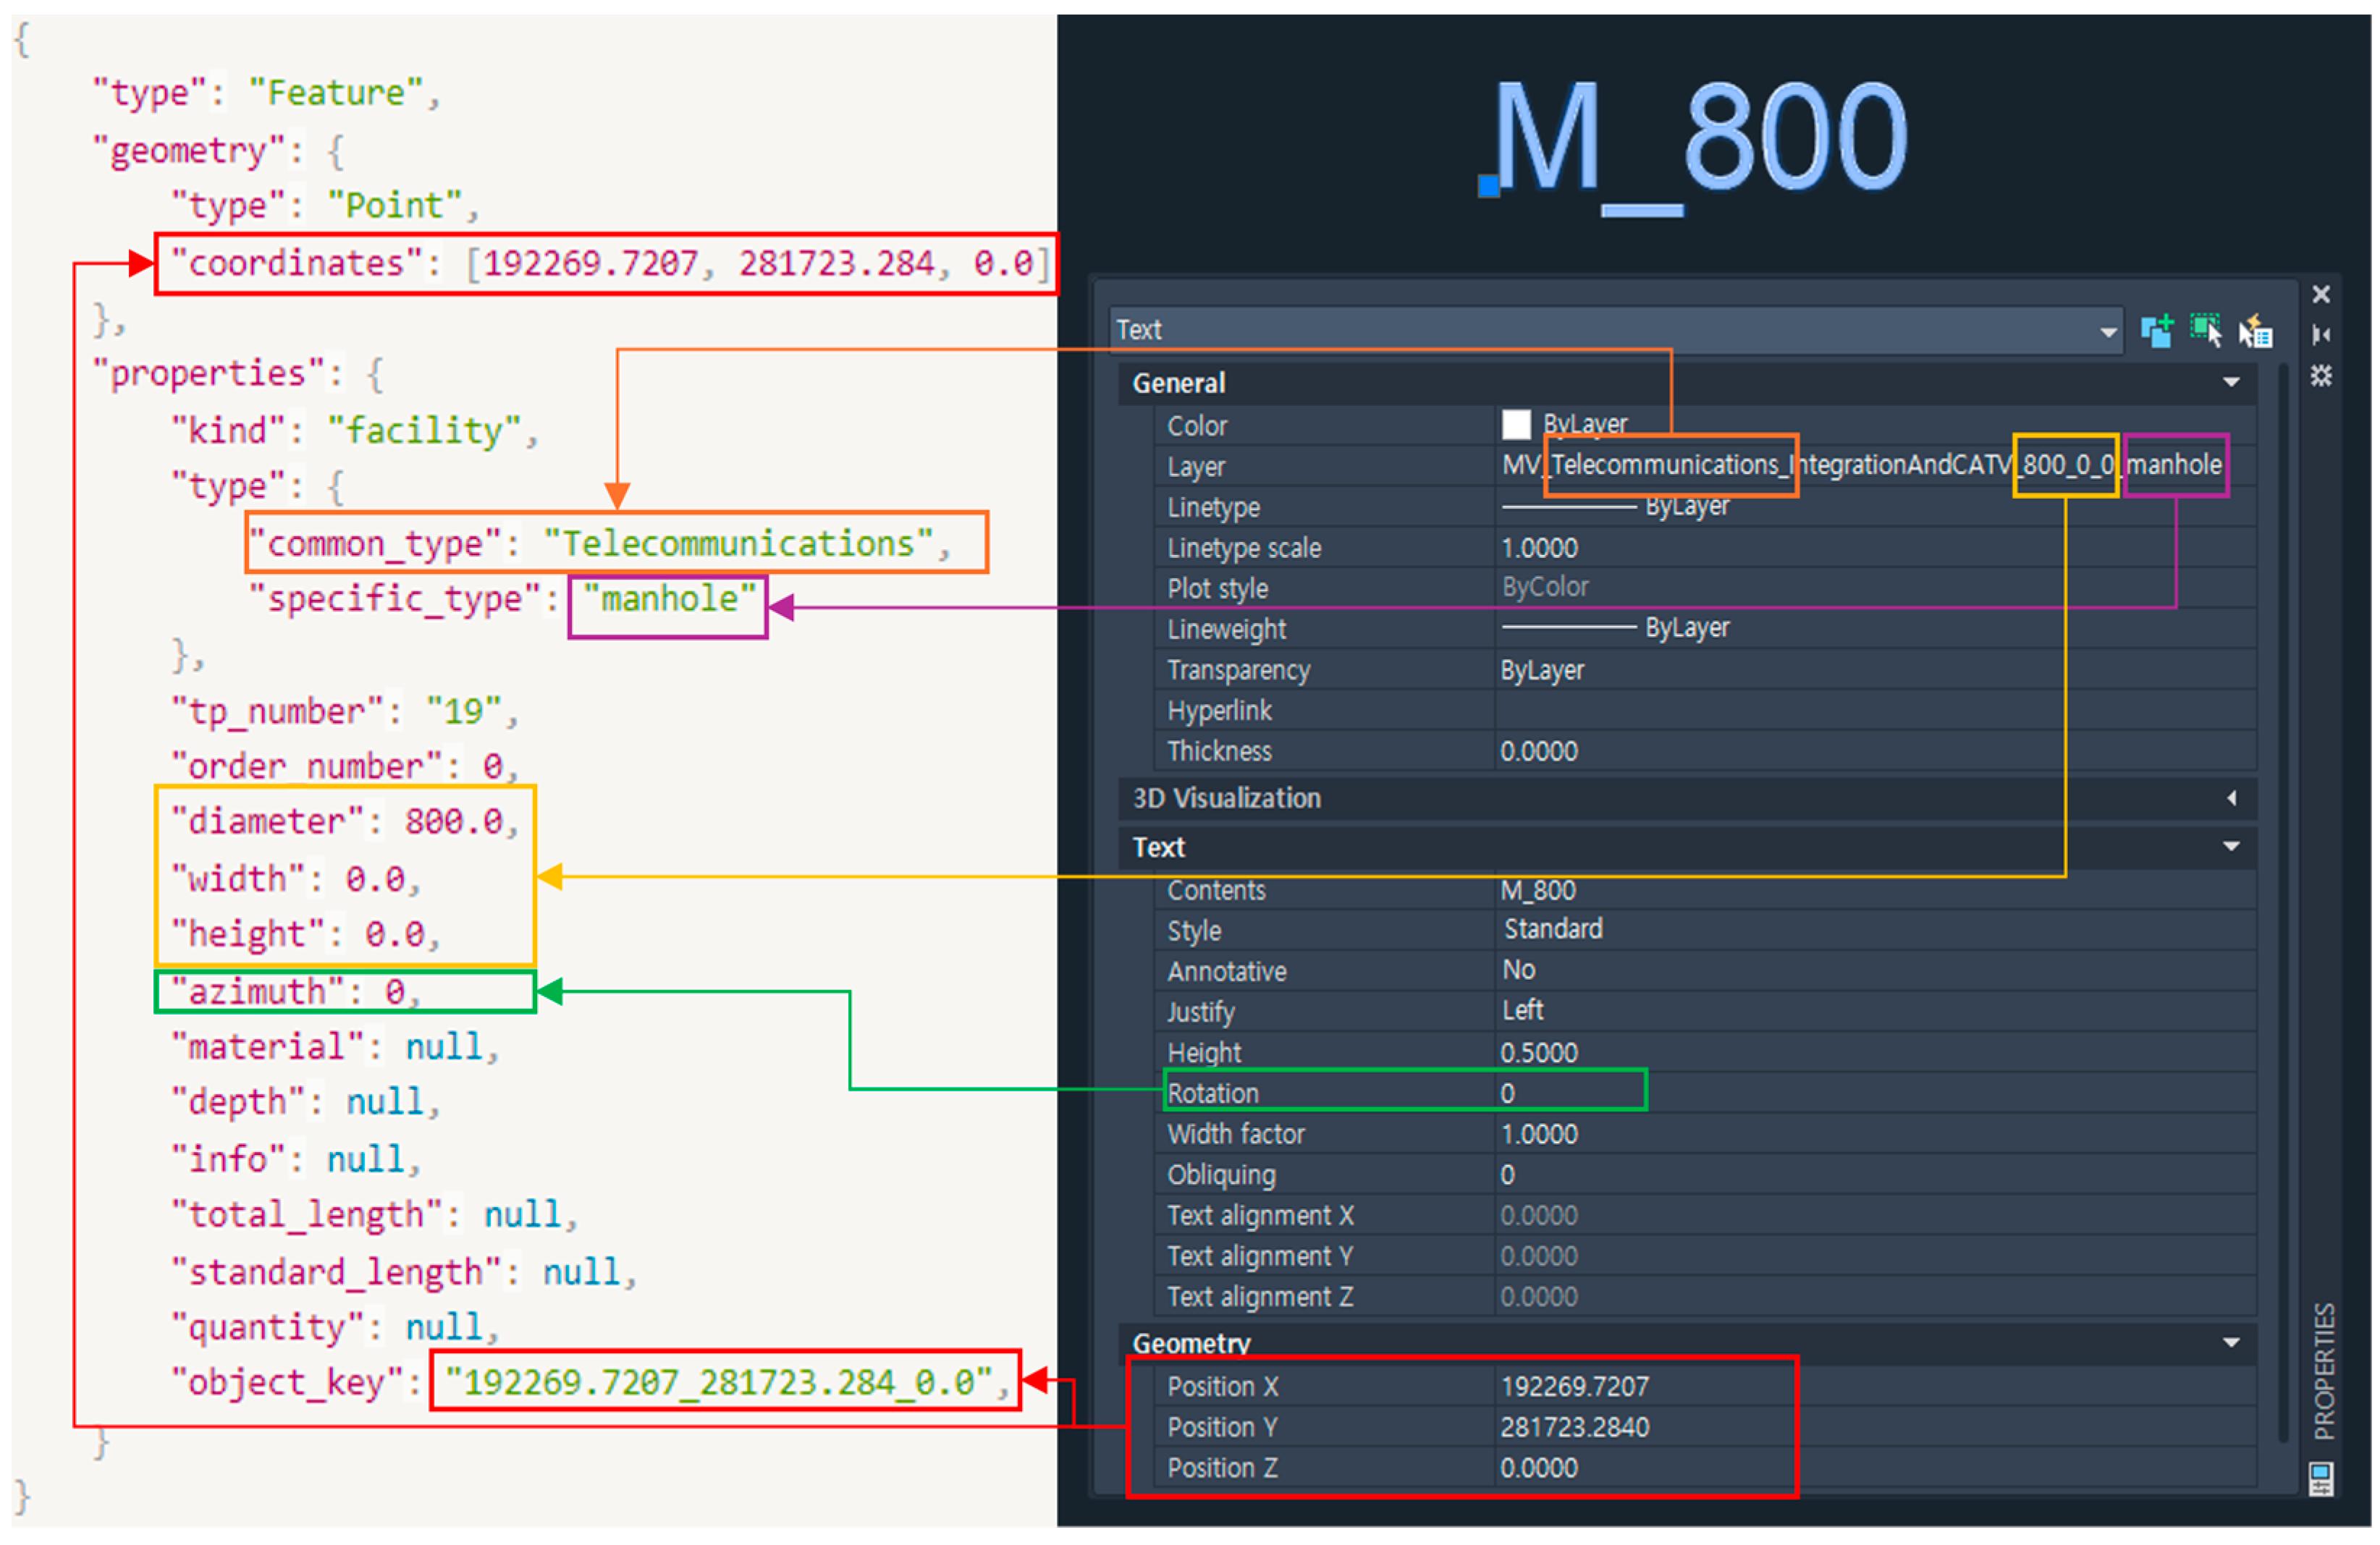
5.2. GeoJSON Data Generation

The pipeline and facility object data generated through 3D spatial analysis are converted into the GeoJSON format to create spatial data for underground utilities. Pipeline objects are represented using the “LineString” geometry type to express topological information, while point-based facility objects, such as valves or manholes, are represented using the “Point” geometry type [36]. In addition to topological information, attribute data and spatial analysis results are stored in the properties section in a key-value format.
Since the GeoJSON format is applied, all generated information is compatible with various GIS software. However, if the key values of the attribute information stored in the properties section are not clearly defined, it becomes difficult to provide accurate information. Therefore, to efficiently utilize 3D spatial data based on GeoJSON, it is essential to clearly define the meaning of the key values.
Table 2 provides detailed explanations of the keys included in the properties. These are defined based on the attribute values used in this paper and may be modified depending on the situation. If a value for a specific key is not available, string values are entered as “null” and numeric or constant values are entered as “0”.
Figure 19 shows the result of outputting pipeline object data in the GeoJSON format. In this case, the geometry contains the location information of the pipeline, and the properties include the shape and attribute information of the pipeline object. Item 1 in the figure represents the unique identifier of the pipeline, labeled as “object_key”, and items 2 and 3 represent the pipelines connected to the first pipeline. The “start_point_connected_pipe” and “end_point_connected_pipe” keys in the properties section contain the information about the pipelines connected to the start and end points of pipeline 1. If no pipelines are connected to the start or end point of pipeline 1, the corresponding value is marked as ‘null’. If multiple pipelines are connected, the information is stored in a list format. This list includes the unique identifier of the connected pipelines, the angle of the connection, and the diameter information of the connected pipelines. The information can be matched and used through the index of the list.
Figure 20 shows the result of outputting manhole object data in GeoJSON format. Similar to pipelines, the geometry contains location information, and the properties section includes the shape and attribute information of the facility object.
Unlike pipeline objects, facility objects have point-based location information, allowing the use of azimuth information to accurately place the facility in 3D space. This enables more precise placement of facilities like manholes.

5.3. Accuracy Testing for Digital Conversion of Underground Utility Data

An accuracy test for extracting underground utility objects from plan view data containing full 3D spatial information was conducted through a software verification test by the Korea Testing & Research Institute (KTR) [37]. The details of the test equipment and environment are shown in Table 3, with the 3D spatial data processing module (Extract Geojson v1.0) installed on the test equipment. The drawing data for the test were stored in a designated location, and the test proceeded from there.
To measure the accuracy of the data extraction, Polyline CAD entities were selected as the target objects, and the location and diameter information were chosen as the comparison parameters for the extracted objects.
The test procedure proceeded as follows: First, the test data file was processed using the 3D spatial data processing module to extract CAD entities, and based on this, underground utility pipeline and facility object data were generated. Finally, the underground utility object data were processed into 3D spatial data and output in the GeoJSON format.
Autocad, QGIS, and text editor software were used to compare the accuracy of the extracted objects. The accuracy comparison process, as illustrated in Figure 21, started by selecting an arbitrary polyline from the drawing, then generating the unique identifier (object_key) for the corresponding pipeline object. Next, this object_key was located within the processed GeoJSON data using a text editor to compare its attribute information. Alternatively, in QGIS, the same polyline object selected from the drawing was matched with its object_key in the attribute information. The location and diameter information were then compared to ensure the two datasets matched. A total of 20 accuracy comparison tests were conducted, and all 20 tests resulted in 100% accurate data extraction.
To evaluate the overall data extraction accuracy of the test drawing file and the extracted 3D spatial data (GeoJSON), a verification process was conducted using QGIS. The verification steps were as follows:
To ensure that the drawing data and GeoJSON data were accurately aligned, Google Maps was set as the background layer. The EPSG:5187 coordinate system, commonly used in actual drawings, was applied to maintain spatial accuracy. Separate layers were created for the drawing data and GeoJSON data, referred to as the ‘dxf’ layer and the ‘geojson’ layer, respectively.
As shown in Figure 22, the ‘dxf’ and ‘geojson’ layers were visualized together over the map layer. This visualization confirmed that both datasets were accurately represented at the correct locations. When the two datasets were displayed simultaneously, it was observed that all facilities were perfectly aligned, with a 100% overlap between the two layers. This result demonstrates complete consistency between the drawing data and the GeoJSON data.

6. Development, Utilization, and Standardization of 3D Spatial Data for Underground Utilities

6.1. The Importance of Processing 3D Spatial Data

Building 3D data for underground utilities offers several advantages. First, by representing the exact location and shape of underground utilities in 3D, collisions during road construction or building projects can be avoided, enabling more efficient work. Second, it allows for the integrated management of various types of underground utility data, ensuring interoperability and facilitating data sharing between different agencies. Third, 3D spatial data enable real-time monitoring, analysis, and prediction through digital twin technology, playing a critical role in the development of smart cities.
While recent advances in object recognition using deep learning technologies have been significant, there are still limitations in accurately extracting 3D spatial data. Given the nature of construction, accurately identifying locations is essential for preventing accidents during construction and reducing project timelines, making the accuracy of underground utility data of utmost importance.
To achieve highly accurate 3D spatial data for underground utilities, this paper introduces a drawing format that incorporates 3D spatial information and attributes. It proposes methods for extracting topological, geometric, and attribute information from 2D CAD drawings to generate underground utility object data, as well as techniques for extracting 3D spatial data in GeoJSON format and standardizing the data. The proposed method underwent accuracy testing for the digital conversion of underground utility data by a certified testing agency, and the results demonstrated that all 3D spatial data for underground utilities input in the 2D drawings could be digitally converted with 100% accuracy.

6.2. Utilization Strategies for GeoJSON-Based Spatial Data

The standardization of 3D spatial data is having a significant impact on various aspects of smart construction technologies. In particular, BIM and digital twin technologies are maximizing efficiency in construction projects by utilizing 3D underground utility data, as follows:
  • BIM is a technology that integrates and manages data throughout the entire lifecycle of a construction project, from planning and design to construction and maintenance. When 3D underground utility data are integrated with BIM, it helps prevent potential conflicts with underground resources during construction and allows for more efficient construction planning;
  • A digital twin based on 3D underground utility data enables real-time data monitoring, analysis, and prediction. This allows for the real-time assessment of the condition of underground utilities and enables immediate responses in the case of anomalies;
  • Autonomous equipment, such as robots and drones, can perform autonomous construction and maintenance tasks based on 3D underground utility data. These technologies reduce reliance on human labor while increasing the accuracy and safety of operations;
  • The development direction of smart construction technology through the standardization of 3D spatial data for underground utilities is as follows. 3D data, when analyzed using artificial intelligence (AI) technology, play a crucial role in anomaly detection and condition prediction of underground utilities. AI analyzes data collected from various sensors to predict the aging state of underground utilities, optimizing the timing and methods of maintenance based on these insights;
  • In smart construction, large-scale data are integrated and managed through cloud platforms, enabling real-time collaboration and data sharing. In a cloud environment, 3D underground utility data can be accessed by various stakeholders at any time, significantly improving project efficiency;
  • As intelligent maintenance systems that combine 3D underground utility data with sensor data are developed, predictive maintenance will become possible. This will help prevent accidents in advance and reduce emergency repair and recovery costs;
  • The combination of digital twin technology and the Internet of Things (IoT) will open a new chapter in smart construction. IoT sensors collect real-time data on underground utilities, which are then reflected in the digital twin model, allowing for the real-time tracking and control of the condition of underground utilities.

6.3. Current Status of 3D Spatial Data Standardization

For the proposed method to be effectively utilized, the standardization of 3D spatial data for underground utilities is necessary. Currently, the standardization of 3D spatial data for underground utilities is a significant global issue. With the development of smart cities, BIM, and digital twin technologies, standardization is essential for the systematic management and utilization of underground utility data [38].
One of the key trends in standardization is the international standard ISO 19152: LADM (Land Administration Domain Model), which manages spatial information, including underground utilities, and deals with 3D terrain and underground utility data [39,40]. Another relevant standard is ISO 19650, which defines the management of 3D data in relation to the application of BIM and information management. The OGC (Open Geospatial Consortium) provides standards for 3D modeling of cities, roads, railways, bridges, and underground utilities through CityGML and InfraGML, offering guidelines for representing 3D data at various levels of detail [41].
In addition, individual countries are establishing legal regulations and guidelines for the standardization of underground utility data. For instance, South Korea has established standards for managing underground utility data through the Act on the Construction and Management of Spatial Information.

7. Conclusions

The method proposed in this paper was validated through field testing using underground utility data from the Smart Village in Busan Eco Delta City Section 1, Section 2 and Section 3. The results demonstrated that 3D spatial data could be extracted and processed from 2D drawing data within approximately one minute, achieving 100% data accuracy between the drawings and the extracted 3D spatial data. Additionally, further research was conducted on generating BIM outputs using GeoJSON-based 3D spatial data. This research focuses on developing two key technologies: automatic 3D modeling using 3D spatial data and creating BIM outputs in IFC file format using GeoJSON data and 3D modeling files. The automatic 3D modeling technology extracts location information for pipelines and facilities from 3D spatial data and automatically generates Vertex, Edge, and Surface data, resulting in an OBJ file, a 3D graphic image format. The BIM output generation technology takes GeoJSON files and OBJ files as inputs and uses the ifcOpenShell library to generate BIM outputs in IFC file format.
Ongoing research aims to integrate the proposed technology with automatic 3D modeling and BIM output generation technologies to develop a complete system for generating BIM outputs from 2D drawings. This system will also enable history management for the generated data. It is expected to allow field engineers in the construction design industry to perform 3D design transformations more quickly and efficiently than using conventional commercial 3D design software. Moreover, it will reduce the burden on existing 2D design engineers by eliminating the need for extensive training in 3D design software, providing them with practical convenience.
The standardization of 3D spatial data for underground utilities is a core element in advancing smart construction technologies. Standardized 3D data enable seamless integration with various technologies, paving the way for advancements in autonomous construction, digital twins, and AI-based analysis and predictive technologies. These technological advancements are expected to lead to more efficient infrastructure management, cost reduction, and enhanced safety. Standardized 3D underground utility data are becoming an essential component of smart city implementation and are poised to drive innovative changes in the construction industry in the future.

Author Contributions

Conceptualization, J.L.; methodology, J.L.; software, J.L.; validation, J.L.; formal analysis, Y.K.; investigation, J.L.; resources, Y.K.; data curation, Y.K.; writing—original draft preparation, J.L.; writing—review and editing, I.-Y.M.; visualization, J.L.; supervision, I.-Y.M.; project administration, I.-Y.M.; funding acquisition, J.L. All authors have read and agreed to the published version of the manuscript.

Funding

This work was supported by a Korea Industrial Technology Association (KOITA) grant funded by the Korea Ministry of Environment (MSIT) (No.1711199719, R&D CENTER Capability Enhancement Project).

Data Availability Statement

The datasets in the current study are available from the corresponding author upon reasonable request.

Acknowledgments

The authors would like to thank the Korea Industrial Technology Association (KOITA) and the Korea Ministry of Environment (MSIT) for their support through the R&D Center Capability Enhancement Project (No. 1711199719). This support was instrumental in enabling the completion of this research. Additionally, we extend our gratitude to the researchers and collaborators who provided valuable insights and feedback throughout the study.

Conflicts of Interest

Author Jongseo Lee was employed by the company Movements Research Center, Movements Co., Ltd. The remaining authors declare that the research was conducted in the absence of any commercial or financial relationships that could be construed as a potential conflict of interest.

References

  1. KPC (Korea Productivity Center). Labor Productivity Index by Industry in 2021. Korea Productivity Statistics. 2021. Available online: https://www.nafi.re.kr/new/report.do?articleNo=3293&attachNo=3967&mode=download (accessed on 16 November 2024).
  2. KIET (Korea Institute for Industrial Economics and Trade). The Current State of Digital Transformation in Korea and Policy Directions. KIET Research Report. 2024. Available online: https://www.kiet.re.kr/research/economyDetailView?detail_no=2979 (accessed on 16 November 2024).
  3. Du, S.; Hou, L.; Zhang, G.; Tan, Y.; Mao, P. BIM and IFC Data Readiness for AI Integration in the Construction Industry: A Review Approach. Buildings 2024, 14, 3305. [Google Scholar] [CrossRef]
  4. Padida, S.; Srinivas, K. Adoption of Metaverse in the Indian Construction Industry: An Overview. J. Smart Build. Constr. Technol. 2023, 5, 1–8. [Google Scholar] [CrossRef]
  5. McKinsey & Company. Korea’s Next S-Curve: A New Economic Growth Model for 2040. McKinsey & Company. 2024. Available online: https://www.mckinsey.com/kr/~/media/mckinsey/locations/asia/korea/our%20insights/koreas%20next%20s%20curve%20a%20new%20economic%20growth%20model%20for%202040/koreas-next-s-curve-a-new-economic-growth-model-for-2040-ko.pdf (accessed on 16 November 2024).
  6. Deloitte. Digital Construction: Bridging Productivity Gaps in the Construction Industry. Deloitte Global Report. 2024. Available online: https://www2.deloitte.com/content/dam/Deloitte/kr/Documents/technology-media-telecommunications/2024/kr-digital-construction-c.pdf (accessed on 16 November 2024).
  7. Choi, W.; Na, S.; Heo, S. Integrating Drone Imagery and AI for Improved Construction Site Management through Building Information Modeling. Buildings 2024, 14, 1106. [Google Scholar] [CrossRef]
  8. Iqbal, F.; Ahmed, S.; Amin, F.; Qayyum, S.; Ullah, F. Integrating BIM–IoT and Autonomous Mobile Robots for Construction Site Layout Printing. Buildings 2023, 13, 2212. [Google Scholar] [CrossRef]
  9. Republic of Korea Policy Briefing. Commercialization of Core Smart Construction Technologies by 2025. Available online: https://korea.kr/briefing/pressReleaseView.do?newsId=156371677 (accessed on 24 October 2024).
  10. MOLIT. Realization of Commercialization of Smart Construction Core Technology by 2025: Smart City Comprehensive Portal. Available online: https://smartcity.go.kr (accessed on 24 October 2024).
  11. Zhu, J.; Wu, P. Towards Effective BIM/GIS Data Integration for Smart City by Integrating Computer Graphics Technique. Buildings 2021, 13, 1889. [Google Scholar] [CrossRef]
  12. Forcael, E.; Ferrari, I.; Opazo-Vega, A.; Pulido-Arcas, J.A. Construction 4.0: A Literature Review. Sustainability 2020, 12, 9755. [Google Scholar] [CrossRef]
  13. Yigitbas, E.; Nowosad, A.; Engels, G. Supporting Construction and Architectural Visualization through BIM and AR/VR: A Systematic Literature Review. Buildings 2023, 13, 12274. [Google Scholar] [CrossRef]
  14. Liu, C.; Yan, W.; Moure, P.; Fan, C.; Mehta, A. A Computational Design and Evaluation Tool for 3D Structures with Planar Surfaces. Buildings 2021, 11, 2103. [Google Scholar] [CrossRef]
  15. Noghabaei, M.; Heydarian, A.; Balali, V.; Han, K. A Survey Study to Understand Industry Vision for Virtual and Augmented Reality Applications in Design and Construction. Buildings 2020, 10, 2795. [Google Scholar] [CrossRef]
  16. GeoJSON. GeoJSON Format Specification (RFC 7946). Available online: https://geojson.org (accessed on 24 October 2024).
  17. EZDXF. DXF Reference—DXF Tags. Available online: https://ezdxf.mozman.at/docs/develop/dxftags.html (accessed on 16 November 2024).
  18. K-Water. Eco-Delta City. Available online: https://www.kwater.or.kr/website/ecodeltacity/english/ (accessed on 16 November 2024).
  19. Busan Smart Village. Busan Smart Village. Available online: https://busan-smartvillage.com/ (accessed on 16 November 2024).
  20. Othman, I.; Gardezi, S.S.S.; Altan, H.; Abdalla, S.B. BIM-Based Research Framework for Sustainable Building Projects: A Strategy for Mitigating BIM Implementation Barriers. Appl. Sci. 2021, 11, 5397. [Google Scholar] [CrossRef]
  21. Ariono, B.; Wasesa, M.; Dhewanto, W. The Drivers, Barriers, and Enablers of BIM Innovation in Developing Countries: Insights from Systematic Literature Review and Comparative Analysis. Buildings 2022, 12, 1912. [Google Scholar] [CrossRef]
  22. Tran, T.V.; Tran, H.V.V.; Nguyen, T.A. A Review of Challenges and Opportunities in BIM Adoption for Construction Project Management. Eng. J. 2024, 28, 79–98. [Google Scholar] [CrossRef]
  23. Shawky, K.; Alnaser, A.A.; Shibeika, A.; Sherif, A. Developing Standard BIM Execution Plans for Complex Construction Projects. Appl. Sci. 2024, 14, 6614. [Google Scholar] [CrossRef]
  24. Yan, J.; Siow Wei, J.; Schrotter, G. Towards an Underground Utilities 3D Data Model for Land Administration. Remote Sens. 2019, 11, 1957. [Google Scholar] [CrossRef]
  25. Lee, Y.; Park, S.; Hong, C. Implementing a Digital Twin of an Underground Utility Tunnel for Geospatial Feature Extraction Using a Multimodal Image Sensor. Appl. Sci. 2023, 13, 9137. [Google Scholar] [CrossRef]
  26. Lee, J.S.; Kim, Y.D.; Moon, I.Y. Methods for Underground Facility Maintenance Using Smart Construction Technology. In Proceedings of the ICNGC 2023, Seoul, Republic of Korea, 20–23 December 2023; pp. 123–130. [Google Scholar]
  27. Mishra, S.; Hashmi, K.A.; Pagani, A.; Liwicki, M.; Afzal, M.Z. Towards Robust Object Detection in Floor Plan Images: A Data Augmentation Approach. Appl. Sci. 2021, 11, 11174. [Google Scholar] [CrossRef]
  28. Zhao, Y.; Deng, X.; Lai, H. A Deep Learning-Based Method to Detect Components from Scanned Structural Drawings for Reconstructing 3D Models. Appl. Sci. 2020, 10, 2066. [Google Scholar] [CrossRef]
  29. Bartoněk, D. Automatic Creation of 3D Documentation in CAD/BIM Based on Topology. Mathematics 2023, 11, 3758. [Google Scholar] [CrossRef]
  30. Chen, X.; Wang, X.; Liu, Y. A Hybrid Framework for High-Performance Modeling of Three-Dimensional Pipe Networks. ISPRS Int. J. Geo-Inf. 2019, 8, 441. [Google Scholar] [CrossRef]
  31. Shen, T.; Zhang, H.; Huo, L.; Sun, D. Spatial Data Fusion Model Design and Research for an Underground Pipeline in Urban Environment Scene Modeling. Appl. Sci. 2024, 14, 6760. [Google Scholar] [CrossRef]
  32. Ulu, M.; Kilic, E.; Türkan, Y.S. Prediction of Traffic Incident Locations with a Geohash-Based Model Using Machine Learning Algorithms. Appl. Sci. 2024, 14, 725. [Google Scholar] [CrossRef]
  33. Yu, M.; Eldawy, A.; Mokbel, M.F. SpatialSpark: A Framework for Large-Scale Spatial Data Processing. In Proceedings of the IEEE International Conference on Big Data (BigData), Orlando, FL, USA, 18 December 2021; Available online: https://spatialhadoop.cs.umn.edu/publications/ICDE15_industrial_522.pdf (accessed on 16 November 2024).
  34. Yu, J.; Zhang, Z.; Sarwat, M. Spatial Data Management in Apache Spark: The GeoSpark Perspective and Beyond. Geoinformatica 2019, 23, 37–78. [Google Scholar] [CrossRef]
  35. Ahmed, M.; Mokbel, M.F.; Eldawy, A. A Survey of Spatial and Spatio-Temporal Data Analytics Systems. In Proceedings of the IEEE Transactions on Knowledge and Data Engineering, Seoul, Republic of Korea, 13–17 April 2015; Volume 35, pp. 1–15. Available online: https://ieeexplore.ieee.org/abstract/document/7113382 (accessed on 16 November 2024).
  36. Stouffs, R.; Tekavec, J.; Stoter, J. Tools for BIM-GIS Integration (IFC Georeferencing and Conversions): Results from the GeoBIM Benchmark 2019. ISPRS Int. J. Geo-Inf. 2020, 9, 502. [Google Scholar] [CrossRef]
  37. Korea Testing & Research Institute. KTR Software Commissioned Test/Assignment Verification. Available online: https://www.ktr.or.kr/test-evaluation/led/contentsid/2003/index.do (accessed on 24 October 2024).
  38. Kang, T. Scan to BIM Mapping Process Description for Building Representation in 3D GIS. Appl. Sci. 2023, 13, 9986. [Google Scholar] [CrossRef]
  39. ISO 19152:2012; Geographic Information—Land Administration Domain Model (LADM). ISO: Geneva, Switzerland, 2024. Available online: https://www.iso.org (accessed on 24 October 2024).
  40. FIG. 3D Spatial Units and ISO 19152: LADM as a Base for 3D Cadastre. Available online: http://home.zcu.cz/~kjanecka/Publications/Janecka-3Dkatastr-GvP2014.pdf (accessed on 24 October 2024).
  41. OGC. OGC Standards and 3D Modeling: CityGML and InfraGML. Available online: https://www.ogc.org (accessed on 24 October 2024).
Figure 1. Underground utilities drawing.
Buildings 14 03980 g001
Figure 2. 3D spatial data integrated from plan view, profile view, and detailed cross-section view data in JSON format.
Buildings 14 03980 g002
Figure 3. 3D polyline entity containing x, y, and z coordinates.
Buildings 14 03980 g003
Figure 4. Representation of facility attribute information on plan view.
Buildings 14 03980 g004
Figure 5. Layer naming for drawing including shape and attribute information.
Buildings 14 03980 g005
Figure 6. Facility data represented as block entity on drawings.
Buildings 14 03980 g006
Figure 7. Generation of facility data using text entity.
Buildings 14 03980 g007
Figure 8. Data extraction steps based on DXF drawing.
Buildings 14 03980 g008
Figure 9. CAD data structure.
Buildings 14 03980 g009
Figure 10. Heating pipelines expressed as a 3D polyline entity.
Buildings 14 03980 g010
Figure 11. Facility expressed as a text entity.
Buildings 14 03980 g011
Figure 12. Unique value of underground facility object.
Buildings 14 03980 g012
Figure 13. Underground utility object structure.
Buildings 14 03980 g013
Figure 14. Generating missing branch pipe data through spatial analysis.
Buildings 14 03980 g014
Figure 15. Spatial analysis for quantifying pipeline data in design drawings.
Buildings 14 03980 g015
Figure 16. Spatial analysis of pipe connection relationships based on Geohash-based clustering data.
Buildings 14 03980 g016
Figure 17. Calculating pipe joint angles using pipe connection relationships.
Buildings 14 03980 g017
Figure 18. Apply underground facility data in GeoJSON geometries format.
Buildings 14 03980 g018
Figure 19. Generating GeoJSON for pipeline object data.
Buildings 14 03980 g019
Figure 20. Generating GeoJSON for facility object data.
Buildings 14 03980 g020
Figure 21. Comparison of 3D spatial data processing results.
Buildings 14 03980 g021
Figure 22. Overlay Comparison of Drawing Data and GeoJSON Data in QGIS.
Buildings 14 03980 g022
Table 1. Layer naming rules.
IndexPipelineFacility
1PrefixPrefix
2TypeType
3Detail typeDetail type
4DiameterDiameter
5WidthWidth
6HeightHeight
7 Facility type
Table 2. Key values of Properties.
KeyDescriptionUnit
kindPipe or facility
common_typeThe 7 types of underground facilities
specific_typeDetailed types of underground facilities
tp_numberFacility management number
order_numberSub-facility management number
diameterDiameter of the pipemm
widthWidth of the pipem
heightHeight of the pipem
azimuthRotation angle based on the north directiondegree
materialMaterial of the pipe
depthDepth to the top of the pipem
infoDetailed angle of the curved pipe and facilitydegree
total_lengthLength of the pipem
standard_lengthLength of the pipe in design datam
quantityPipe quantity calculation resultea
object_keyUnique value of underground facility
start_point_connected_pipe Pipe connected to the starting point
end_point_connected_pipe Pipe connected to the end point
start_point_connected_pipe_object_keyUnique value of the pipeline connected to the starting point
end_point_connected_pipe_object_keyUnique value of the pipeline connected to the end point
start_point_connected_pipe_angleAngle of the elbow at the starting point of the pipedegree
end_point_connected_pipe_angleAngle of the elbow at the end point of the pipedegree
start_point_connected_pipe_diameterDiameter of the pipe connected to the starting pointmm
end_point_connected_pipe_diameterDiameter of the pipe connected to the end pointmm
Table 3. Experimental equipment specifications and test environment.
Equipment SpecificationDescription
CPUIntel(R) Core(TM) Ultra 7 155H 1.40Ghz
RAM32 GB
HDD1 TB
NICIntel(R) Wi-Fi 6 AX211 160MHz
OSWindows Pro 11, 64bit
S/W, ModulePython 3.11.9
Extract Geojson v1.0
NetworkTCP/IP
Test data fileFile name: BIM_sample.dxf
File size: 813 kb
Data extraction accuracy (%)(number of successful object extractions/number of selected objects) × 100
Number of data comparisonsSelect a random object and compare it 20 times
Disclaimer/Publisher’s Note: The statements, opinions and data contained in all publications are solely those of the individual author(s) and contributor(s) and not of MDPI and/or the editor(s). MDPI and/or the editor(s) disclaim responsibility for any injury to people or property resulting from any ideas, methods, instructions or products referred to in the content.

