Article

Experimental Research on Mechanism Impairment and Reinforcement of Empty Bucket Wall

1
College of Civil Engineering and Architecture, Wenzhou University, Wenzhou 325035, China
2
International Science and Technology Cooperation Base for Engineering Technology and Intelligent Monitoring of Ultra-Soft Soil, Wenzhou 325035, China
3
Center for Research on Microgrids (CROM), AAU Energy, Aalborg University, 9220 Aalborg, Denmark
*
Author to whom correspondence should be addressed.
Buildings 2024, 14(2), 383; https://doi.org/10.3390/buildings14020383
Submission received: 13 December 2023 / Revised: 24 January 2024 / Accepted: 29 January 2024 / Published: 1 February 2024
(This article belongs to the Section Building Structures)

Abstract

:
In this study, the raw material for the empty bucket wall consists of Dalun bricks unique to South Zhejiang. The investigation focuses on the changes in compressive properties of the empty bucket wall with masonry mortar strength grades of M 2.5, M 5.0, M 7.5, and M 10.0 after a designated period of maintenance in both dry and wet environments. Following this, the empty bucket wall undergoes reinforcement, and the compressive properties are studied. The ensuing comparisons yield pertinent conclusions. Unreinforced walls maintained with varying mortar strengths in a wet environment exhibit reduced cracking loads by 5.8 to 30% and damage loads by 5.6 to 10.8% compared to their counterparts in a dry environment. Reinforced walls, maintained with different mortar strengths in wet environments, show reduced cracking loads by 6.2% to 36% and damage loads by 2.5% to 5.7% compared to those in dry environments. The stress–strain curves of unreinforced and reinforced barrel walls of various strength classes are obtained by fitting the test stress–strain data to the stress–strain data derived from corresponding model equations. These stress–strain curves for unreinforced and reinforced walls align well with the model curves, affirming the precision of the tests.

1. Introduction

Masonry is one of the oldest building techniques in the world today, with the advantages of simple material extraction, abundant sources of raw materials, wide distribution, low cost, good fire and high-temperature resistance, excellent heat insulation, sound insulation, easy production, and construction. Due to the previous advantages, masonry materials are widely used in the entire world.
The empty bucket wall is a typical masonry structure, which can save more brick dosage, mortar, and labor than the traditional solid wall and has good thermal insulation and heat preservation properties [1]. The empty bucket wall structure now widely exists in rural areas of southern townships in China, and the basic properties related to empty bucket walls in different regions are of interest to many engineers and technicians, so an in-depth study of the relevant properties of empty bucket walls is necessary.
Nowadays, there are more studies on masonry structures both domestically and internationally, and there are more domestic studies than foreign studies on the structure of empty bucket walls, with the predominant study of the seismic performance of empty bucket walls and the secondary study of the compressive and shear performance of empty bucket walls.
At present, there is more research on masonry techniques at home and abroad, and there is more research on empty bucket wall structures in China than abroad, predominantly with research on the seismic performance of empty bucket walls and secondary research on the compressive and shear performance of empty bucket wall. Xiaobin Li et al. [2,3] investigated the seismic performance of the empty bucket wall, conducting a static test on the slice wall of the empty bucket wall. The results indicated that different masonry methods minimally impact the wall, and elevating the strength of masonry mortar leads to an increase in both the cracking load and ultimate load of the cavity bucket wall. Zhuo Wang et al. [4] explored the seismic performance of brick walls. Test outcomes demonstrated that fiber-reinforced cementitious composite facings effectively enhanced the bearing capacity and deformation capacity of brick walls. The authors proposed a formula for calculating the shear-bearing capacity of brick walls under various reinforcement methods. The mechanical properties were numerically analyzed using the finite element method, with the results aligning with the test outcomes. Niu L. et al. [5,6] examined the effects of freeze–thaw cycles and salt corrosion cycles on the mechanical and seismic properties of restrained masonry walls. Experimental results indicated a tendency for the compressive strength, bearing capacity, and energy dissipation capacity of mortar and brick masonry to decrease with an increasing number of freeze–thaw and corrosion cycles. Models predicting damage under offshore atmospheric conditions and degradation of masonry shear bond strength due to freeze–thaw damage were also presented. Caison Luo et al. [7,8,9,10] conducted static tests on walls reinforced with fiber-reinforced plastic (FRP). The results highlighted that FRP reinforcement not only improved the bearing capacity of brick columns but also significantly enhanced their ultimate strain, compressive stiffness, and ductility. This study proposed an analytical model for masonry bearing capacity under different reinforcement schemes. Zhuo Zhang et al. [11,12] fabricated recycled concrete, porous, hollow core blocks, constructed the walls with these blocks and conducted axial compression tests. Findings revealed that the axial compression damage process of recycled concrete block walls was similar to that of standard brick and ordinary concrete block walls, yet deformation resistance and cracking load were stronger. A theoretical ultimate bearing capacity formula suitable for recycled concrete hollow block walls was proposed. Liangtao Bu et al. [13,14,15,16,17] investigated the compressive properties of masonry reinforced with fiber-reinforced polymers. Test results indicated that fiber-reinforced polymer effectively strengthened masonry, significantly improving the bearing capacity of the structure. This study also established a model for evaluation, with predicted values in good agreement with test results. Huizhi Zhang et al. [18] explored the bearing capacity and displacement of masonry constructed with self-insulated blocks. Numerical simulation analyses and experimental tests were conducted, concluding that compressive damage of masonry was generally controlled by mortar or block with lower compressive strength. Higher compressive strength of mortar is favorable for improving bearing capacity and displacement. Wenzhong Zheng et al. [19] simulated the vertical load and axial compressive deformation of an in-service brick wall before reinforcement using a tension spiral brick wall for pre-compression. The results showed relatively uniform axial compression deformation of the reinforced wall under additional axial load, with the concrete slab wall being the first to be destroyed. A formula for calculating axial compressive load capacity was proposed based on the test results. Huiling Wang et al. [20] investigated the damage mechanism of SFC steel under uniaxial tensile action using experimental and multiscale simulation methods. Numerical results highlighted three types of damage mechanisms for SFC steel under uniaxial tension, with ferrite/carburite interface debonding identified as the main mechanism leading to final fracture. Yangyang Zhang et al. [21] combined the three-dimensional Hashin–Yeh damage criterion with a damage evolution model to develop a progressive damage model for assessing the damage mechanism of reinforced thermoplastic pipes (RTP). Results indicated that FPF is mainly damaged by matrix tensile damage, while FF is mainly damaged by fiber-matrix shear damage. Walid Mansour et al. [22] conducted a study on 12 reinforced concrete beams to analyze the shear performance of carbon fiber-reinforced polymer (CFRP) out-of-slab reinforced recycled aggregate concrete (RAC) beams. Results showed increased ultimate load after using recycled aggregate and reinforcing with CFRP. A three-dimensional nonlinear finite element model was developed to compare different reinforcement methods.
The empty bucket wall, a highly representative masonry structure in China, is widely embraced for its advantages, including ease of material acquisition and efficiency. With an increasing focus from scholars, this study addresses the unique challenges faced by these walls in the subtropical monsoon region of southern Zhejiang, characterized by severe weather conditions such as typhoons and rainstorms leading to frequent wet states. Currently, the impact of these conditions on wall performance remains unstudied. Furthermore, wet and dry cycle testing emerges as a crucial method for assessing durability. Simulating alternating exposure to dry and wet environments allows for the evaluation of volume shrinkage, strength changes, and other material property alterations. These findings serve as foundational data for designing, constructing, and maintaining material structures, ensuring their safety and durability. Building on prior studies, this experiment specifically explores changes in the compressive properties of hollow bucket walls with different strength-grade mortars in both dry and wet conditions, aligning with the characteristics of such structures in southern Zhejiang. Concurrently, this study employs hybrid fiber reinforcement to investigate the alterations in the compressive properties of reinforced bucket walls under dry and wet environments. It delves into the load deformation of both reinforced and unreinforced bucket walls in these conditions, along with calculating the relevant bearing capacity of reinforced and damaged bucket walls. The aim is to provide references and foundations for future research on bucket wall reinforcement. Given the history of flooding in South China and the middle and lower reaches of the Yangtze River, leading to prolonged immersion of empty bucket walls in water, understanding the performance changes in immersed walls holds significant relevance for practical projects.

2. Materials and Methods
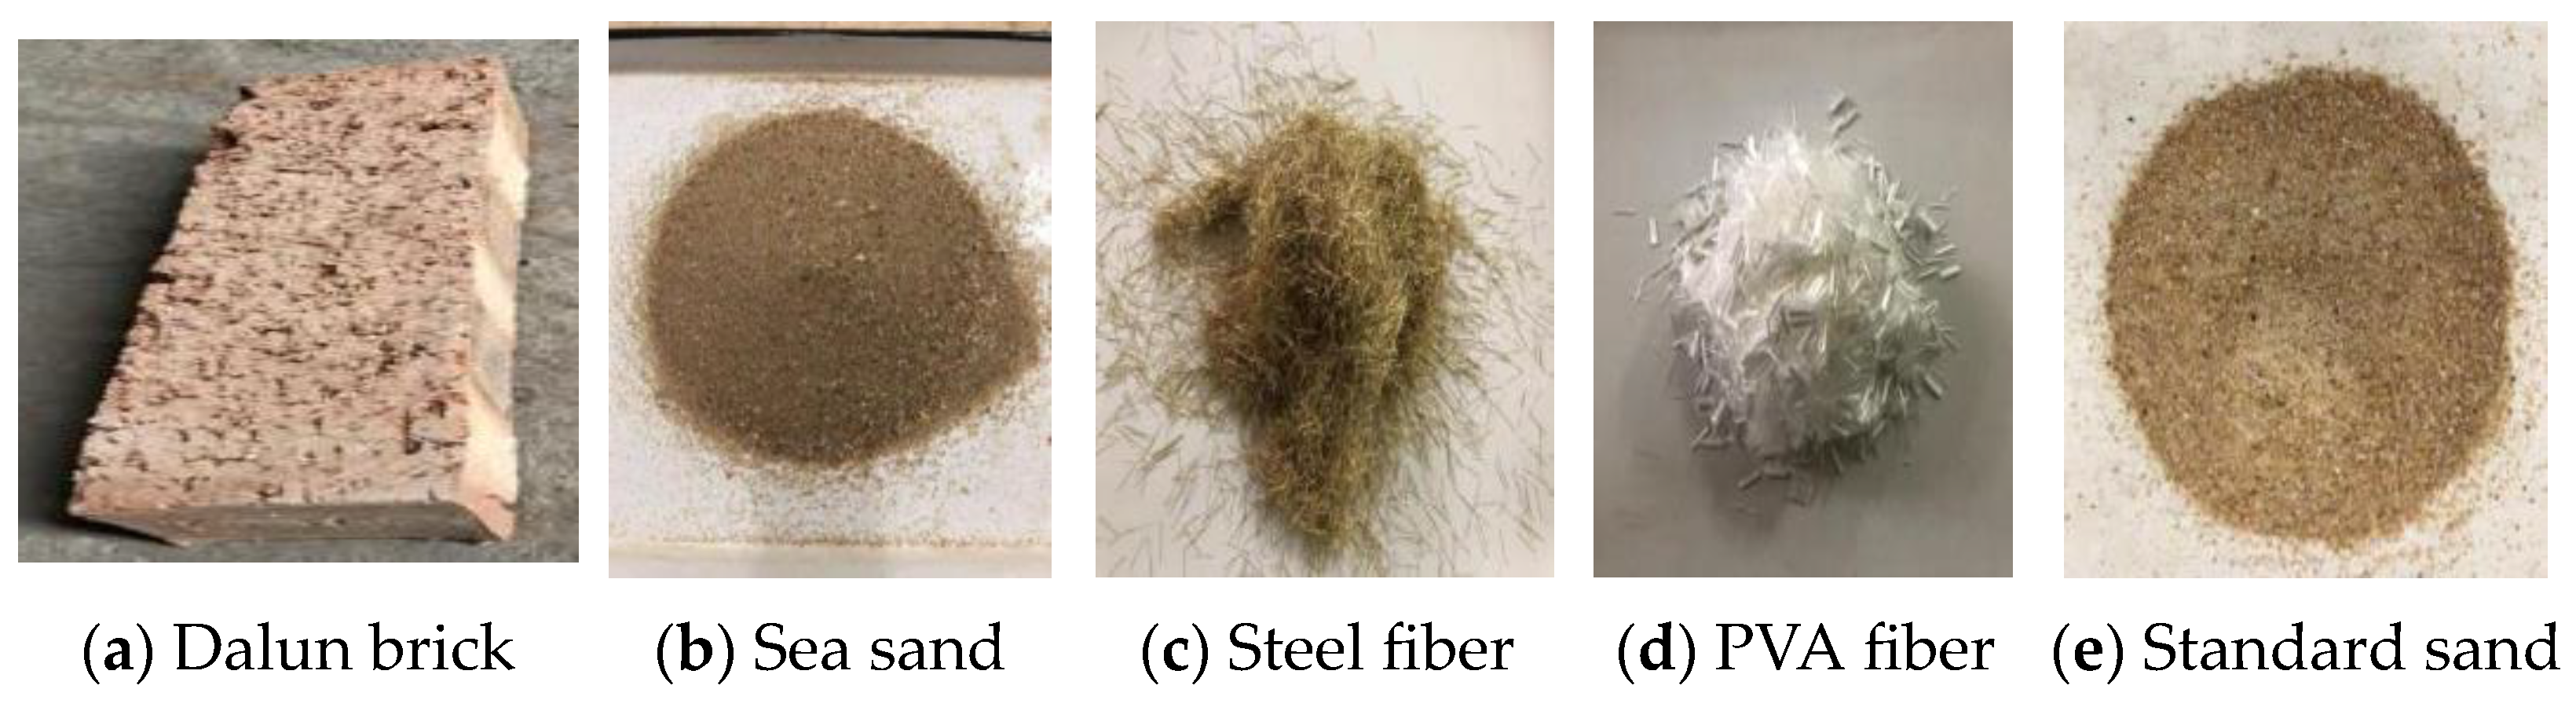
2.1. Test Materials

The clay bricks used are Dalun bricks, exclusive to Wenzhou, measuring 240 mm × 75 mm × 45 mm. The sample complies with the average compressive strength of ƒ ≥ 20 MPa and the standard value of strength ƒk ≥ 14 MPa, as stipulated in GB/T 5101-2017 fired common bricks [23], so the specimen can be assessed as MU20. Masonry mortar is prepared from cement, lime, water, and sand in corresponding proportions. According to JGJ/T 70-2009 Standard for test method of performance on building mortar [24], the masonry mortar is a blend of cement, lime, water, and sea sand. Mortar strength grades are designed as M 2.5, M 5.0, M 7.5, and M10.0. The masonry mortar mixes are shown in Table 1. The cement material is ordinary silicate cement with a strength class of 42.5. The sand is washed sea sand and complies with the relevant provisions of GB/T 14684-2011 of sand for construction [25]; it can be concluded that the fineness modulus of washed sea sand is 2.088, which belongs to fine sand. According to the specification requirements of JGJ/T 70-2009 Standard for test method of performance on building mortar to make cubic mortar test blocks, the size of the mortar test block is designed as 70.7 mm × 70.7 mm × 70.7 mm. Test blocks are prepared according to relevant standards, with compressive results shown in Table 2.
The reinforcement mortar utilized in the mixed fiber mortar consists of masonry mortar incorporating mixed fibers and additives. The mixed fibers, comprising steel fibers with a diameter of 0.2 mm, length of 13 mm, and tensile strength of 2.85 GPa, along with PVA fibers with a length of 12 mm, density of 1300 kg/m3, tensile strength of 1.56 GPa, modulus of elasticity of 36.3 GPa, and ultimate elongation of 7.8%, are prepared in a specific proportion. The additive is a composite blend of hard gypsum, polycarboxylic acid, plastic expander, and defoamer. These components are mixed in appropriate proportions. Following the guidelines of GB/T 50081-2002 Standard for the test method of mechanical properties on ordinary concrete [26], cubic specimens with a side length of 100 mm are produced for testing the strength of reinforced mortar. The 7-day compressive strength of the masonry mortar cube specimens measured 49.6 Mpa; the 14-day compressive strength was 60.0 MPa, and the 28-day compressive strength reached 61.0 MPa, as depicted in Figure 1.

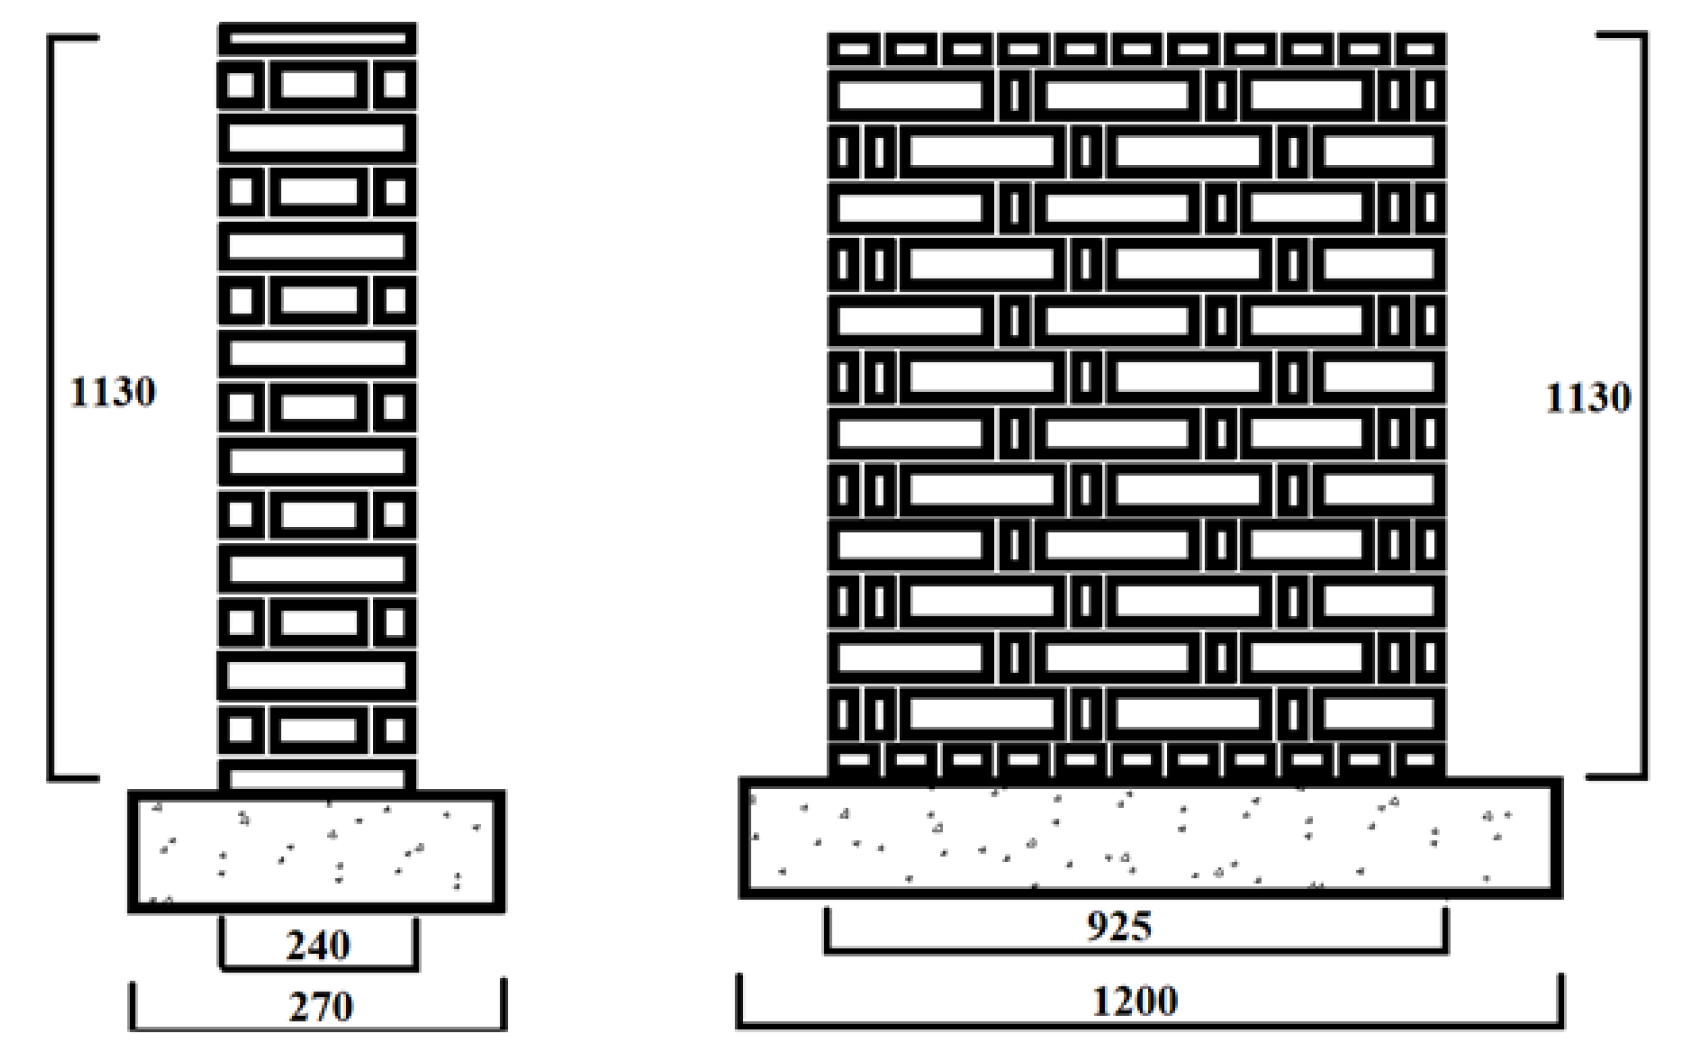
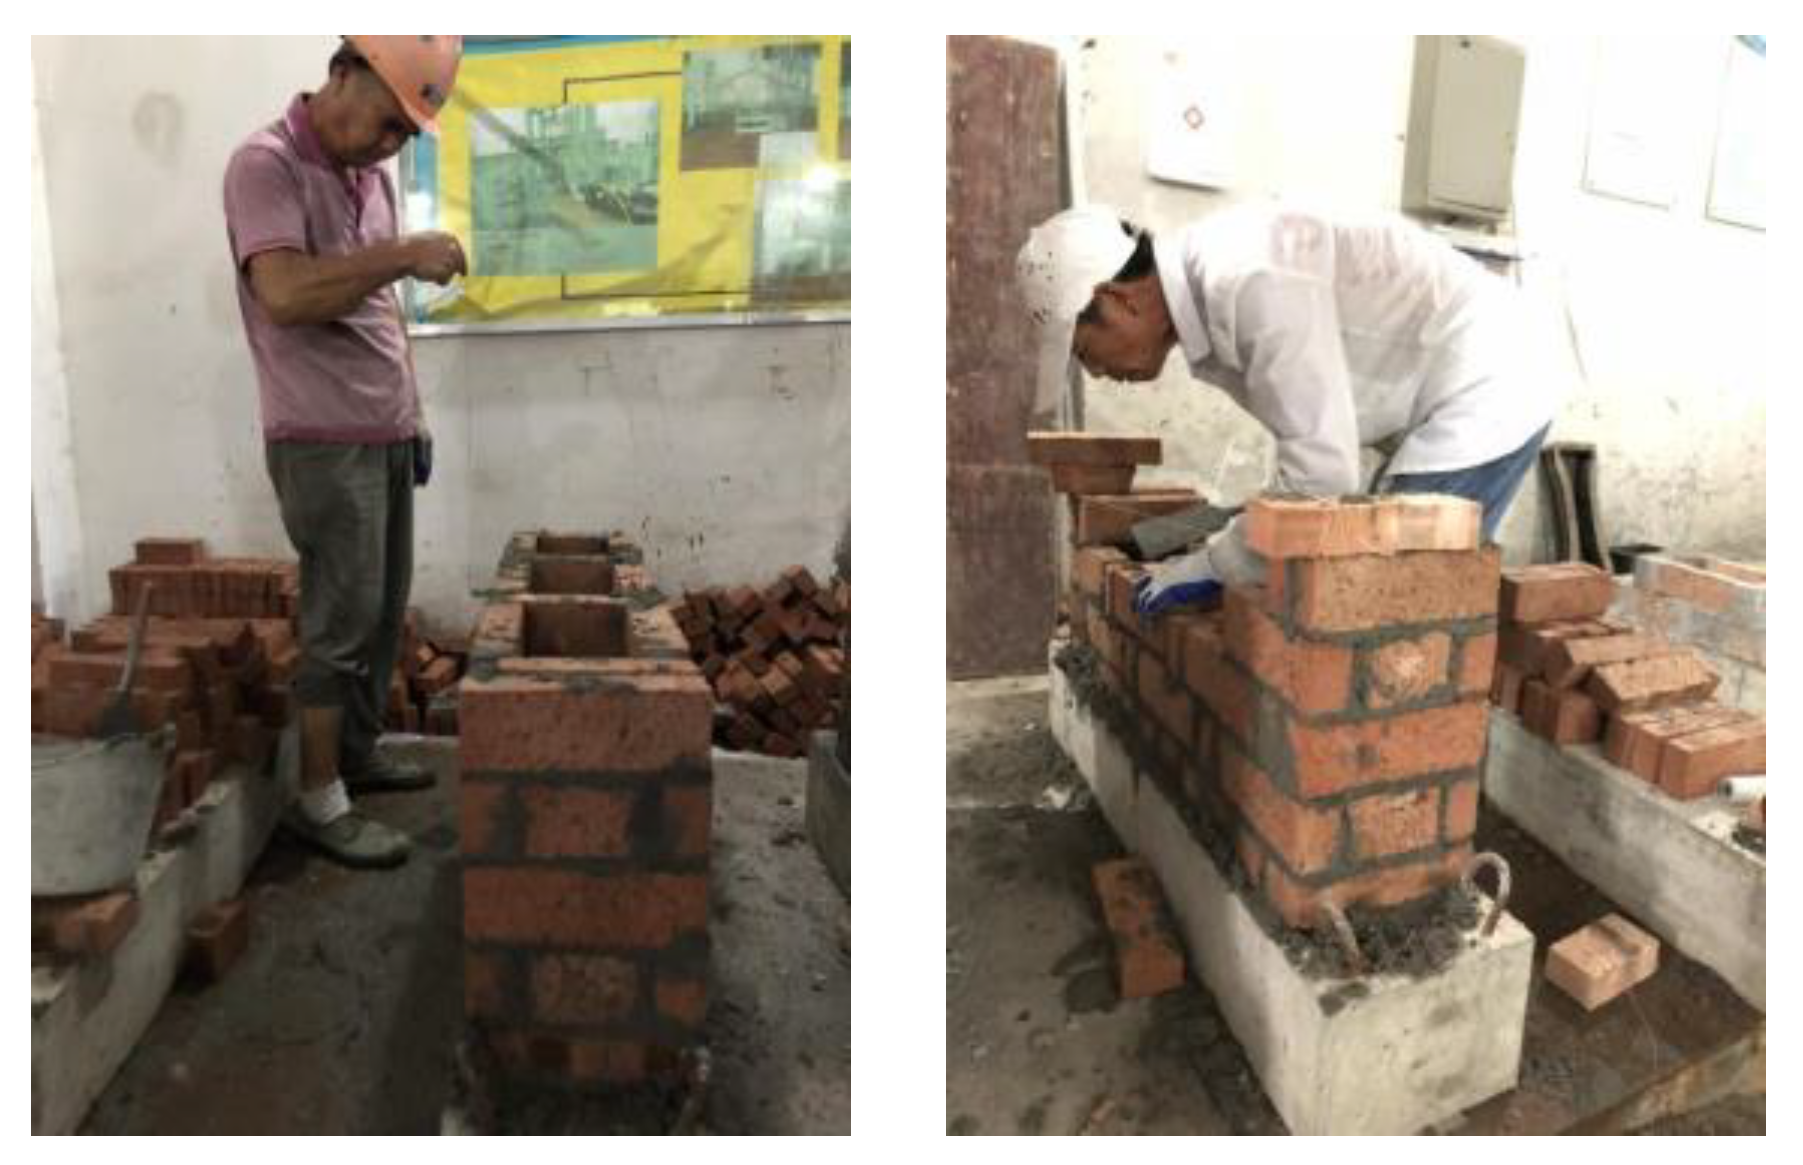
2.2. Wall Test Design

2.2.1. Unreinforced Wall Test Design

The unreinforced wall masonry follows the guidelines of GB 50924-2014 code for the Construction of Masonry Structures Engineering. Testing utilizes clay sintered bricks, particularly Daren bricks, which are unique to Wenzhou, and the more commonly used strength grades of masonry mortar are categorized as M 2.5, M 5.0, M 7.5, and M 10.0 [27]. For each mortar strength, two identical walls are constructed, totaling eight empty bucket walls.
These walls are divided into two groups: the first group is numbered M 2.5–1, M 5.0–1, M 7.5–1, and M 10.0–1, and the second group is numbered M 2.5–2, M 5.0–2, M 7.5–2, and M 10.0–2. Field visits to Yongjia County, Wencheng County, and Taishun County in Wenzhou City reveal that the local empty bucket wall exhibits a height-to-width ratio close to 1. Two types of masonry methods for the empty bucket wall are identified: sleepy empty bucket wall; and sleepless empty bucket wall, illustrated in Figure 2. The masonry process involves side-laid bricks, known as bucket bricks, and flat-laid bricks, known as sleep bricks. The sleep-empty bucket wall uses every 1~3 buckets of bricks to build a sleepy brick. The sleepless empty bucket wall, known as a full bucket wall, only uses bucket bricks without sleeper bricks. Considering practical aspects like test pouring, the final decision is made to construct the empty bucket wall without sleep. The wall has a height-to-width ratio of 1.2, with dimensions of 1130 mm in height, 925 mm in width, and a wall thickness of 240 mm, as depicted in Figure 3. The wall masonry process is illustrated in Figure 4. The maintenance of the eight empty bucket walls is divided into two stages. In the first stage, all walls are placed in a dry environment for 60 days. The second stage consists of two groups: the first group of four empty bucket walls with different strength levels, numbered M 2.5–1, M 5.0–1, M 7.5–1, M 10.0–1, undergo continuous maintenance in a natural environment for 7 days. The other group, numbered M 2.5–2, M 5.0–2, M 7.5–2, and M 10.2–2, is maintained in a moist condition for 7 days. The unreinforced walls under repair are depicted in Figure 5.

2.2.2. Reinforced Wall Test Design

The reinforced wall masonry adheres to the specifications outlined in GB 50924-2014 Code for the Construction of Masonry Structures Engineering. Testing involves the use of masonry mortar with strength grades of M 2.5, M 5.0, M 7.5, and M 10.0 for the test [27]. Corresponding to each masonry mortar, two identical walls are constructed, totaling eight empty barrel walls. These walls are divided into two groups: the first group is numbered G 2.5–1, G 5.0–1, G 7.5–1, and G 10.0–1; and the second group is numbered G 2.5–2, G 5.0–2, G 7.5–2, and G 10.0–2. The empty bucket walls in both groups share the same aspect ratio, dimensions, and masonry as the unreinforced walls. Following the completion of masonry, the walls are kept in the natural environment for 28 days. After this period, the walls are reinforced by applying layers of mortar reinforcing bars to the four walls and the top face of the empty bucket walls, with an average thickness of 8 mm. After reinforcement, the walls undergo maintenance in a natural environment for an additional 32 days. Subsequently, the G 2.5–1, G 5.0–1, G 7.5–1, and G 10.0–1 walls are placed in a dry environment, while the G 2.5–2, G 5.0–2, G 7.5–2, and G 10.0–2 walls are maintained in a natural environment. Due to the reinforced wall’s coated surface preventing wetting during wet conservation, the interior of the wall is wetted and conserved. The protected reinforced wall is depicted in Figure 6.

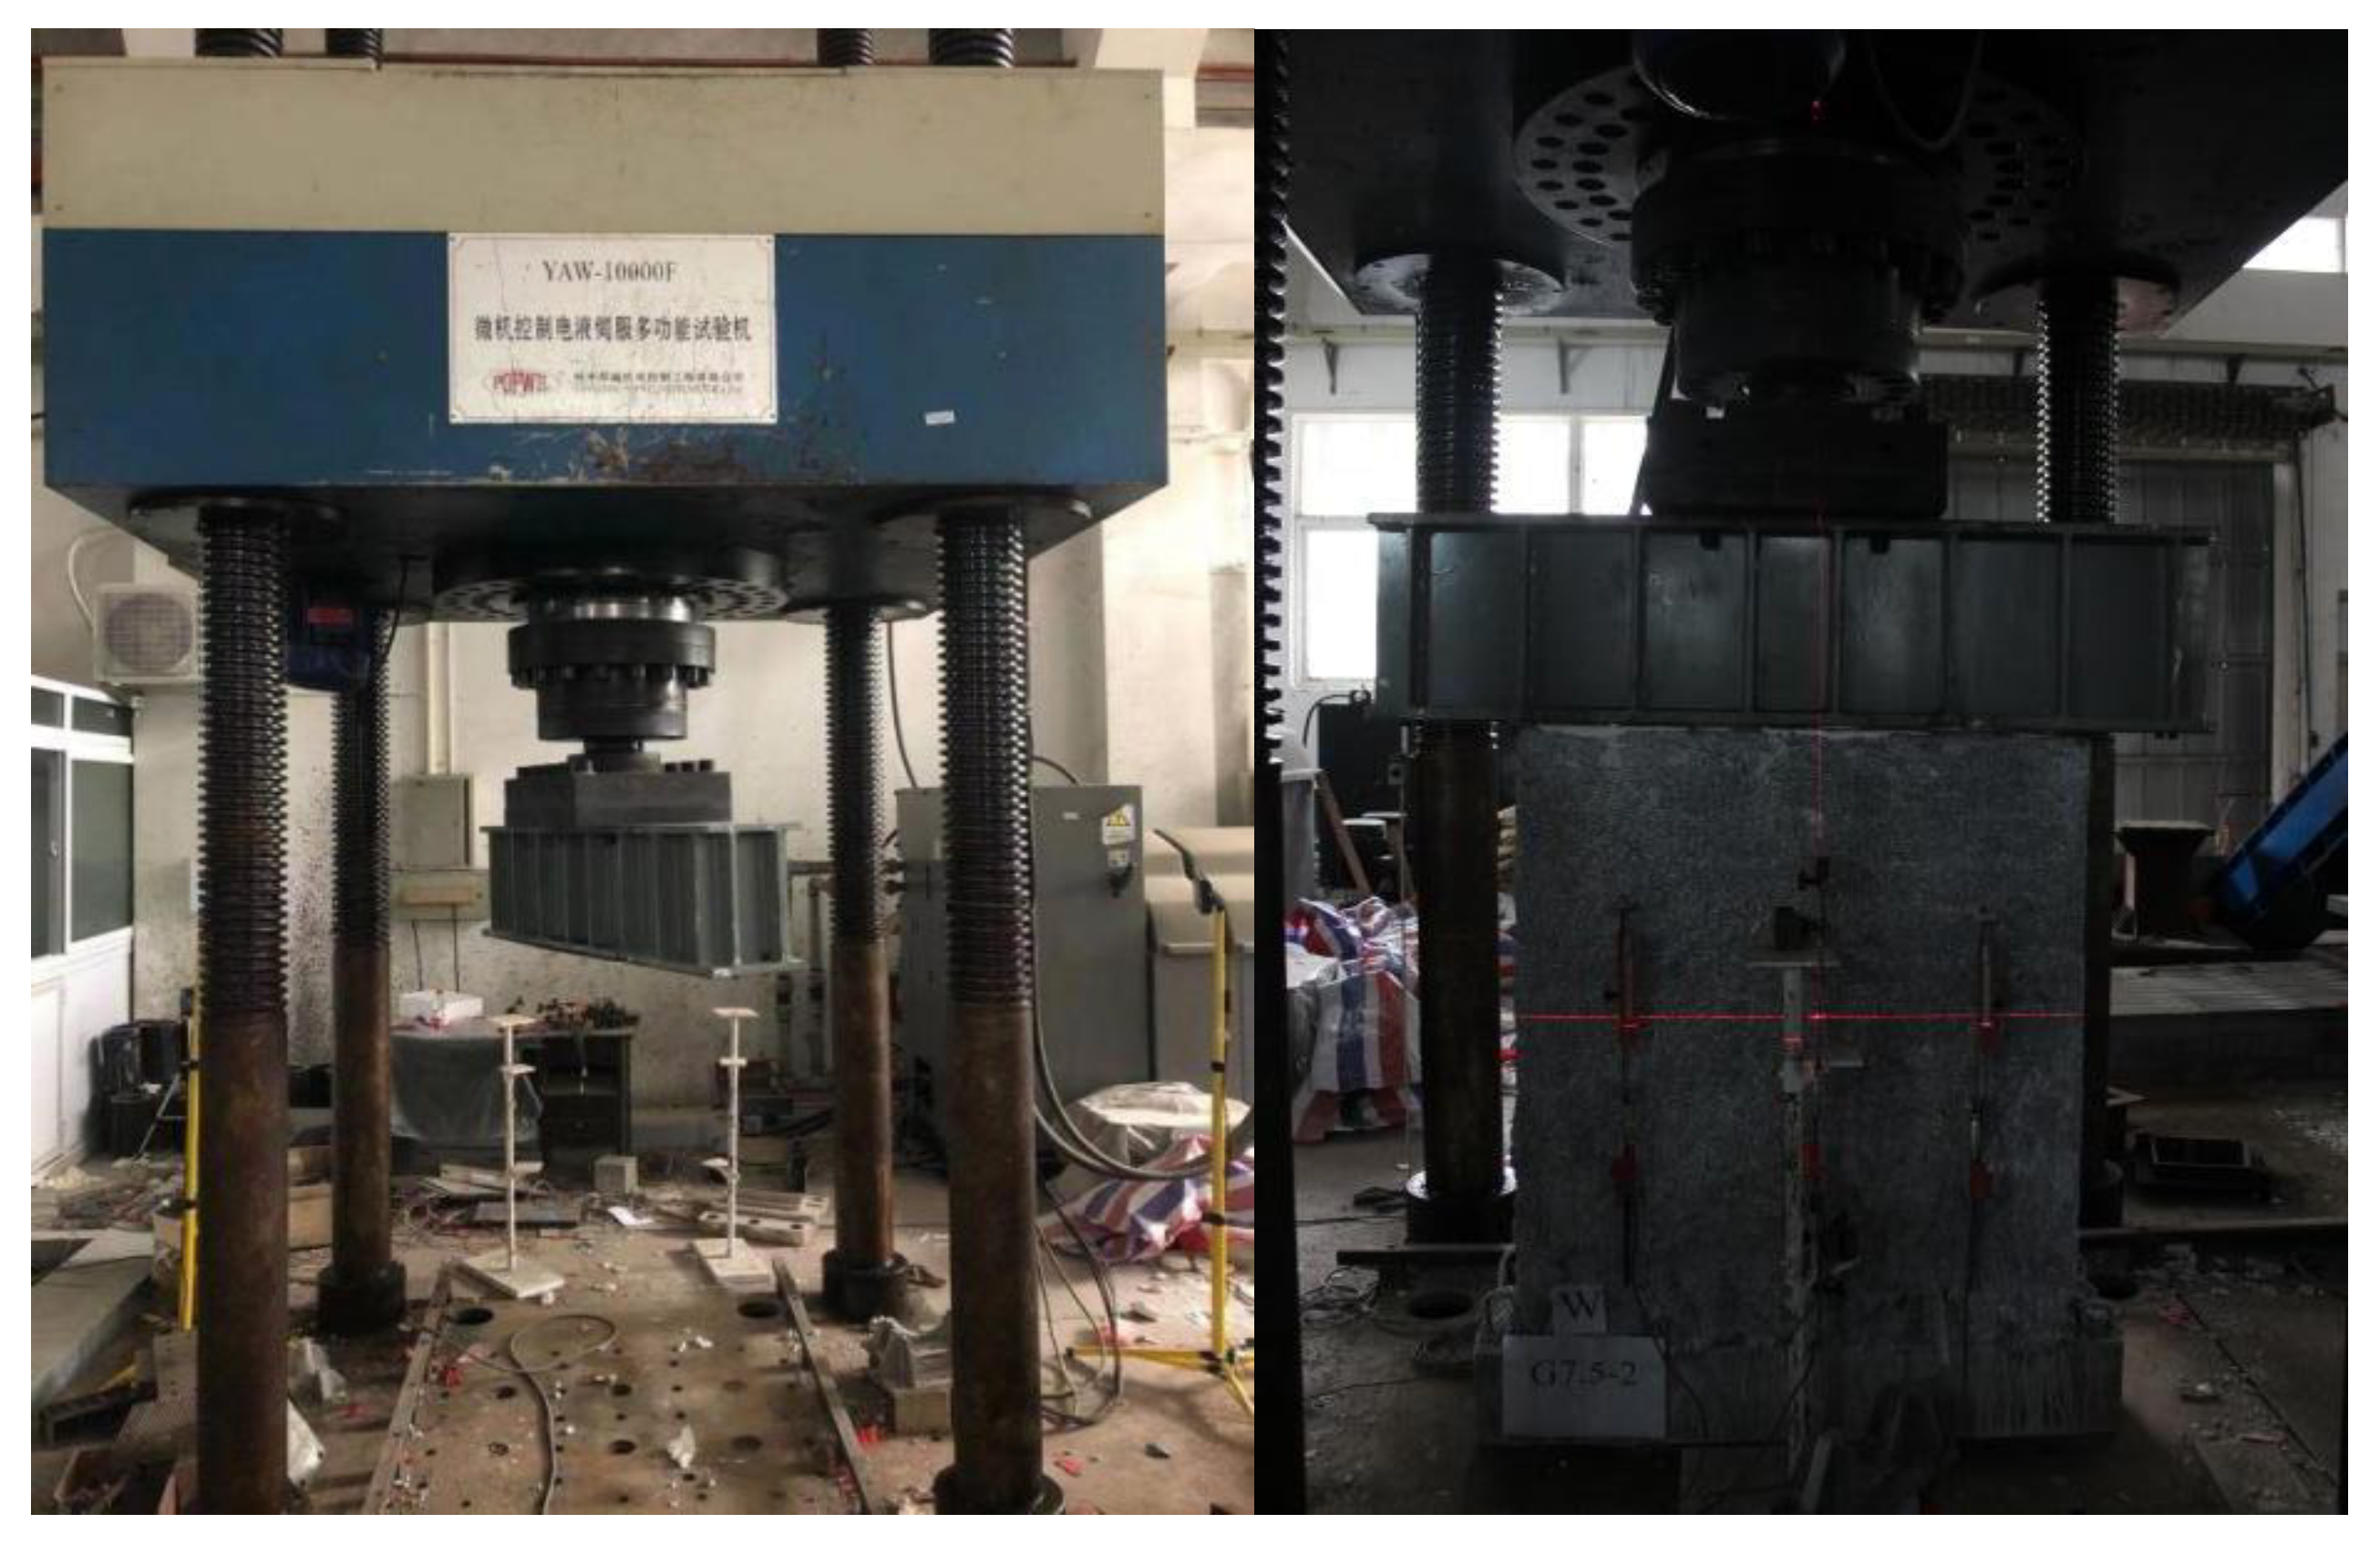
2.3. Test Equipment and Measurement Point Arrangement

2.3.1. Test Equipment without Reinforced Walls

The damage load detection of an unreinforced empty bucket wall is performed with a 1000 kN compressive loading system; the compressive testing machine is shown in Figure 7, and the collector is a static collector produced by Jiangsu Donghua Company. The collector adopts a DH3816N static stress test and analysis system; the supply voltage is 220 V/50 Hz, and the sampling frequency is 2 Hz. The displacement meter adopts an SDP-100CT type displacement meter produced by Japan Tokyo Sokki Kenkyujo company; the range is 100 mm. The compressive testing machine, static collector, and displacement meter are shown in Figure 7.

2.3.2. Test Equipment for Reinforced Walls

The reinforced empty bucket wall compressive test was carried out on a 10,000 kN microcomputer-controlled electro-hydraulic servo multifunctional testing machine, which was designed and produced by Hangzhou Bonneville, as shown in Figure 8. The acquisition instrument and displacement meter are the same as the equipment used for unreinforced walls.

2.4. Measurement Point Arrangement of the Wall

The monitoring points were arranged in this test to detect the changes in vertical and horizontal displacements of the wall under the action of vertical load. A displacement meter was arranged at the upper 1/3 and lower 1/3 of the W and E sides of the empty bucket wall for detecting the horizontal displacement of the wall, and a displacement meter was arranged at the left 1/3 and right 1/3 of the W and E sides of the wall for detecting the vertical displacement of the wall. For horizontal displacement detection, the detection points on W and E surfaces are marked as Wup, Wdown, Eup, and Edown, respectively; for vertical displacement detection, the detection points on W and E surfaces are marked as Wleft, Wright, Eleft, Eright, respectively. In summary, a total of 8 displacement meters were used for each wall in this test. The layout of measuring points is shown in Figure 9.

3. Empty Bucket Wall Compressive Performance Test Study

3.1. Experimental Study on the Compressive Performance of Unreinforced Walls

The cracks of the unreinforced walls were plotted, and the corresponding load-vertical displacement graphs and load-horizontal displacement graphs were obtained from the measured data to compare and analyze the performance changes in the empty bucket walls in dry and wet environments.

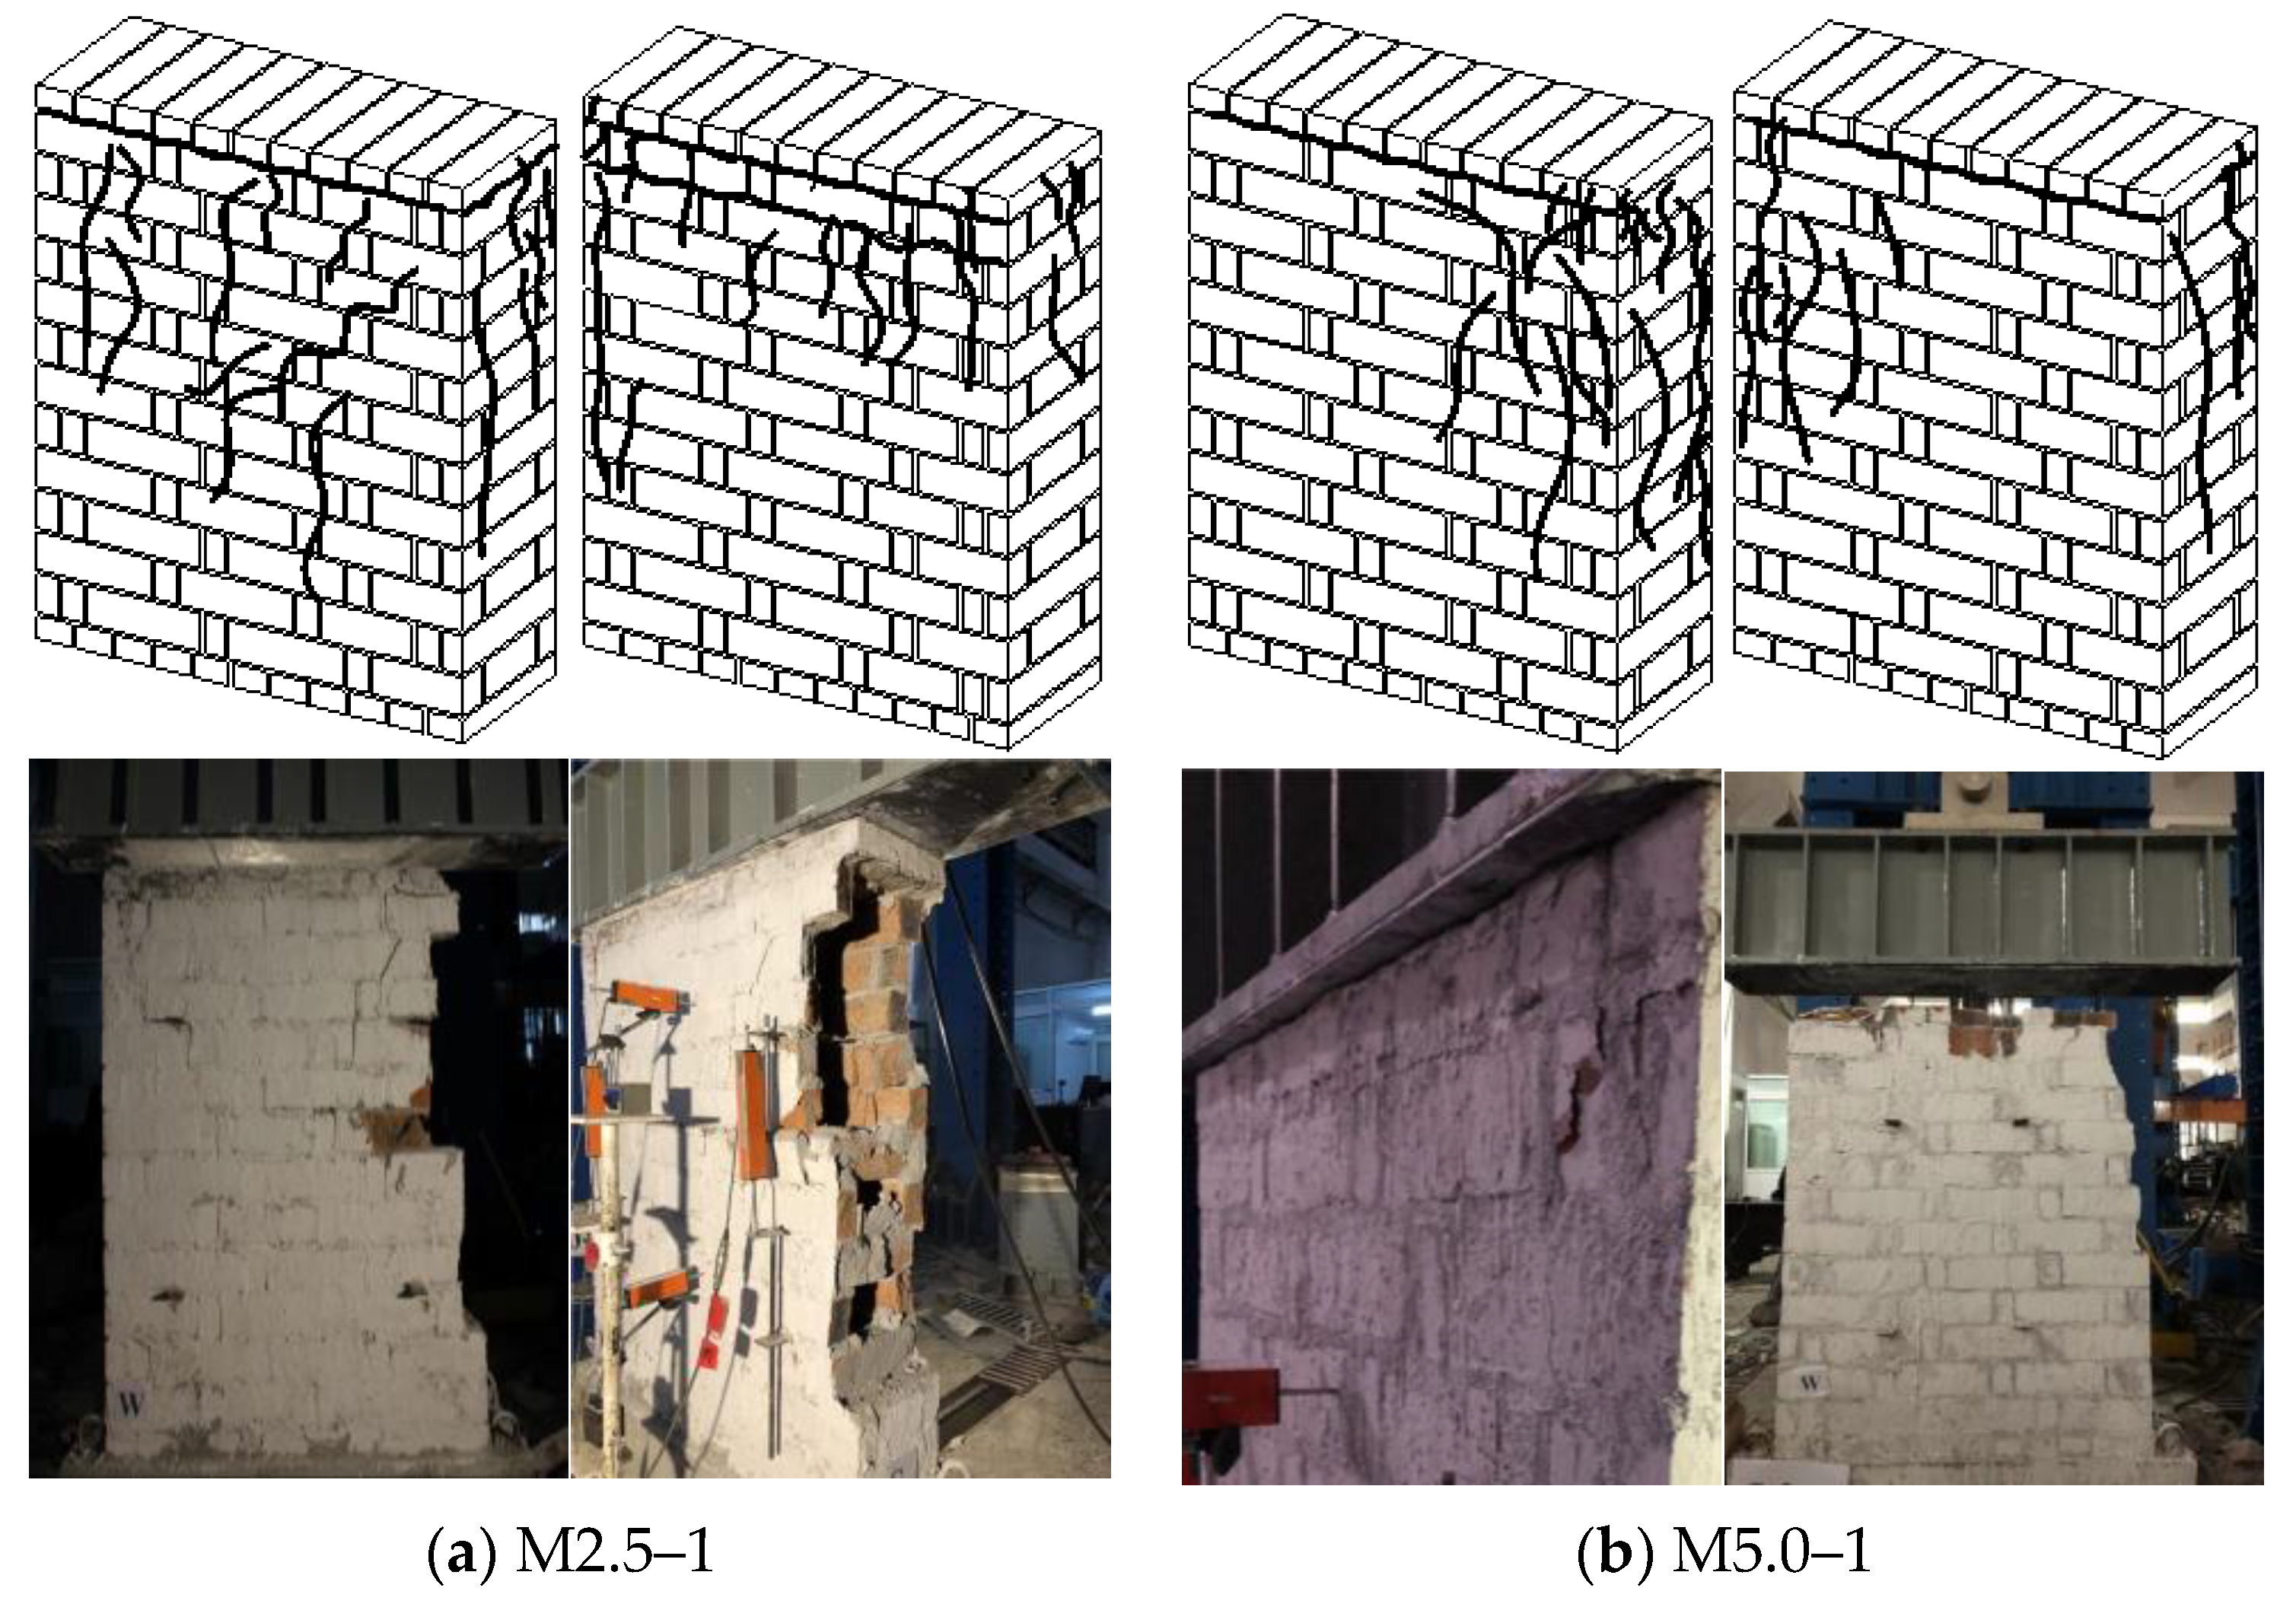
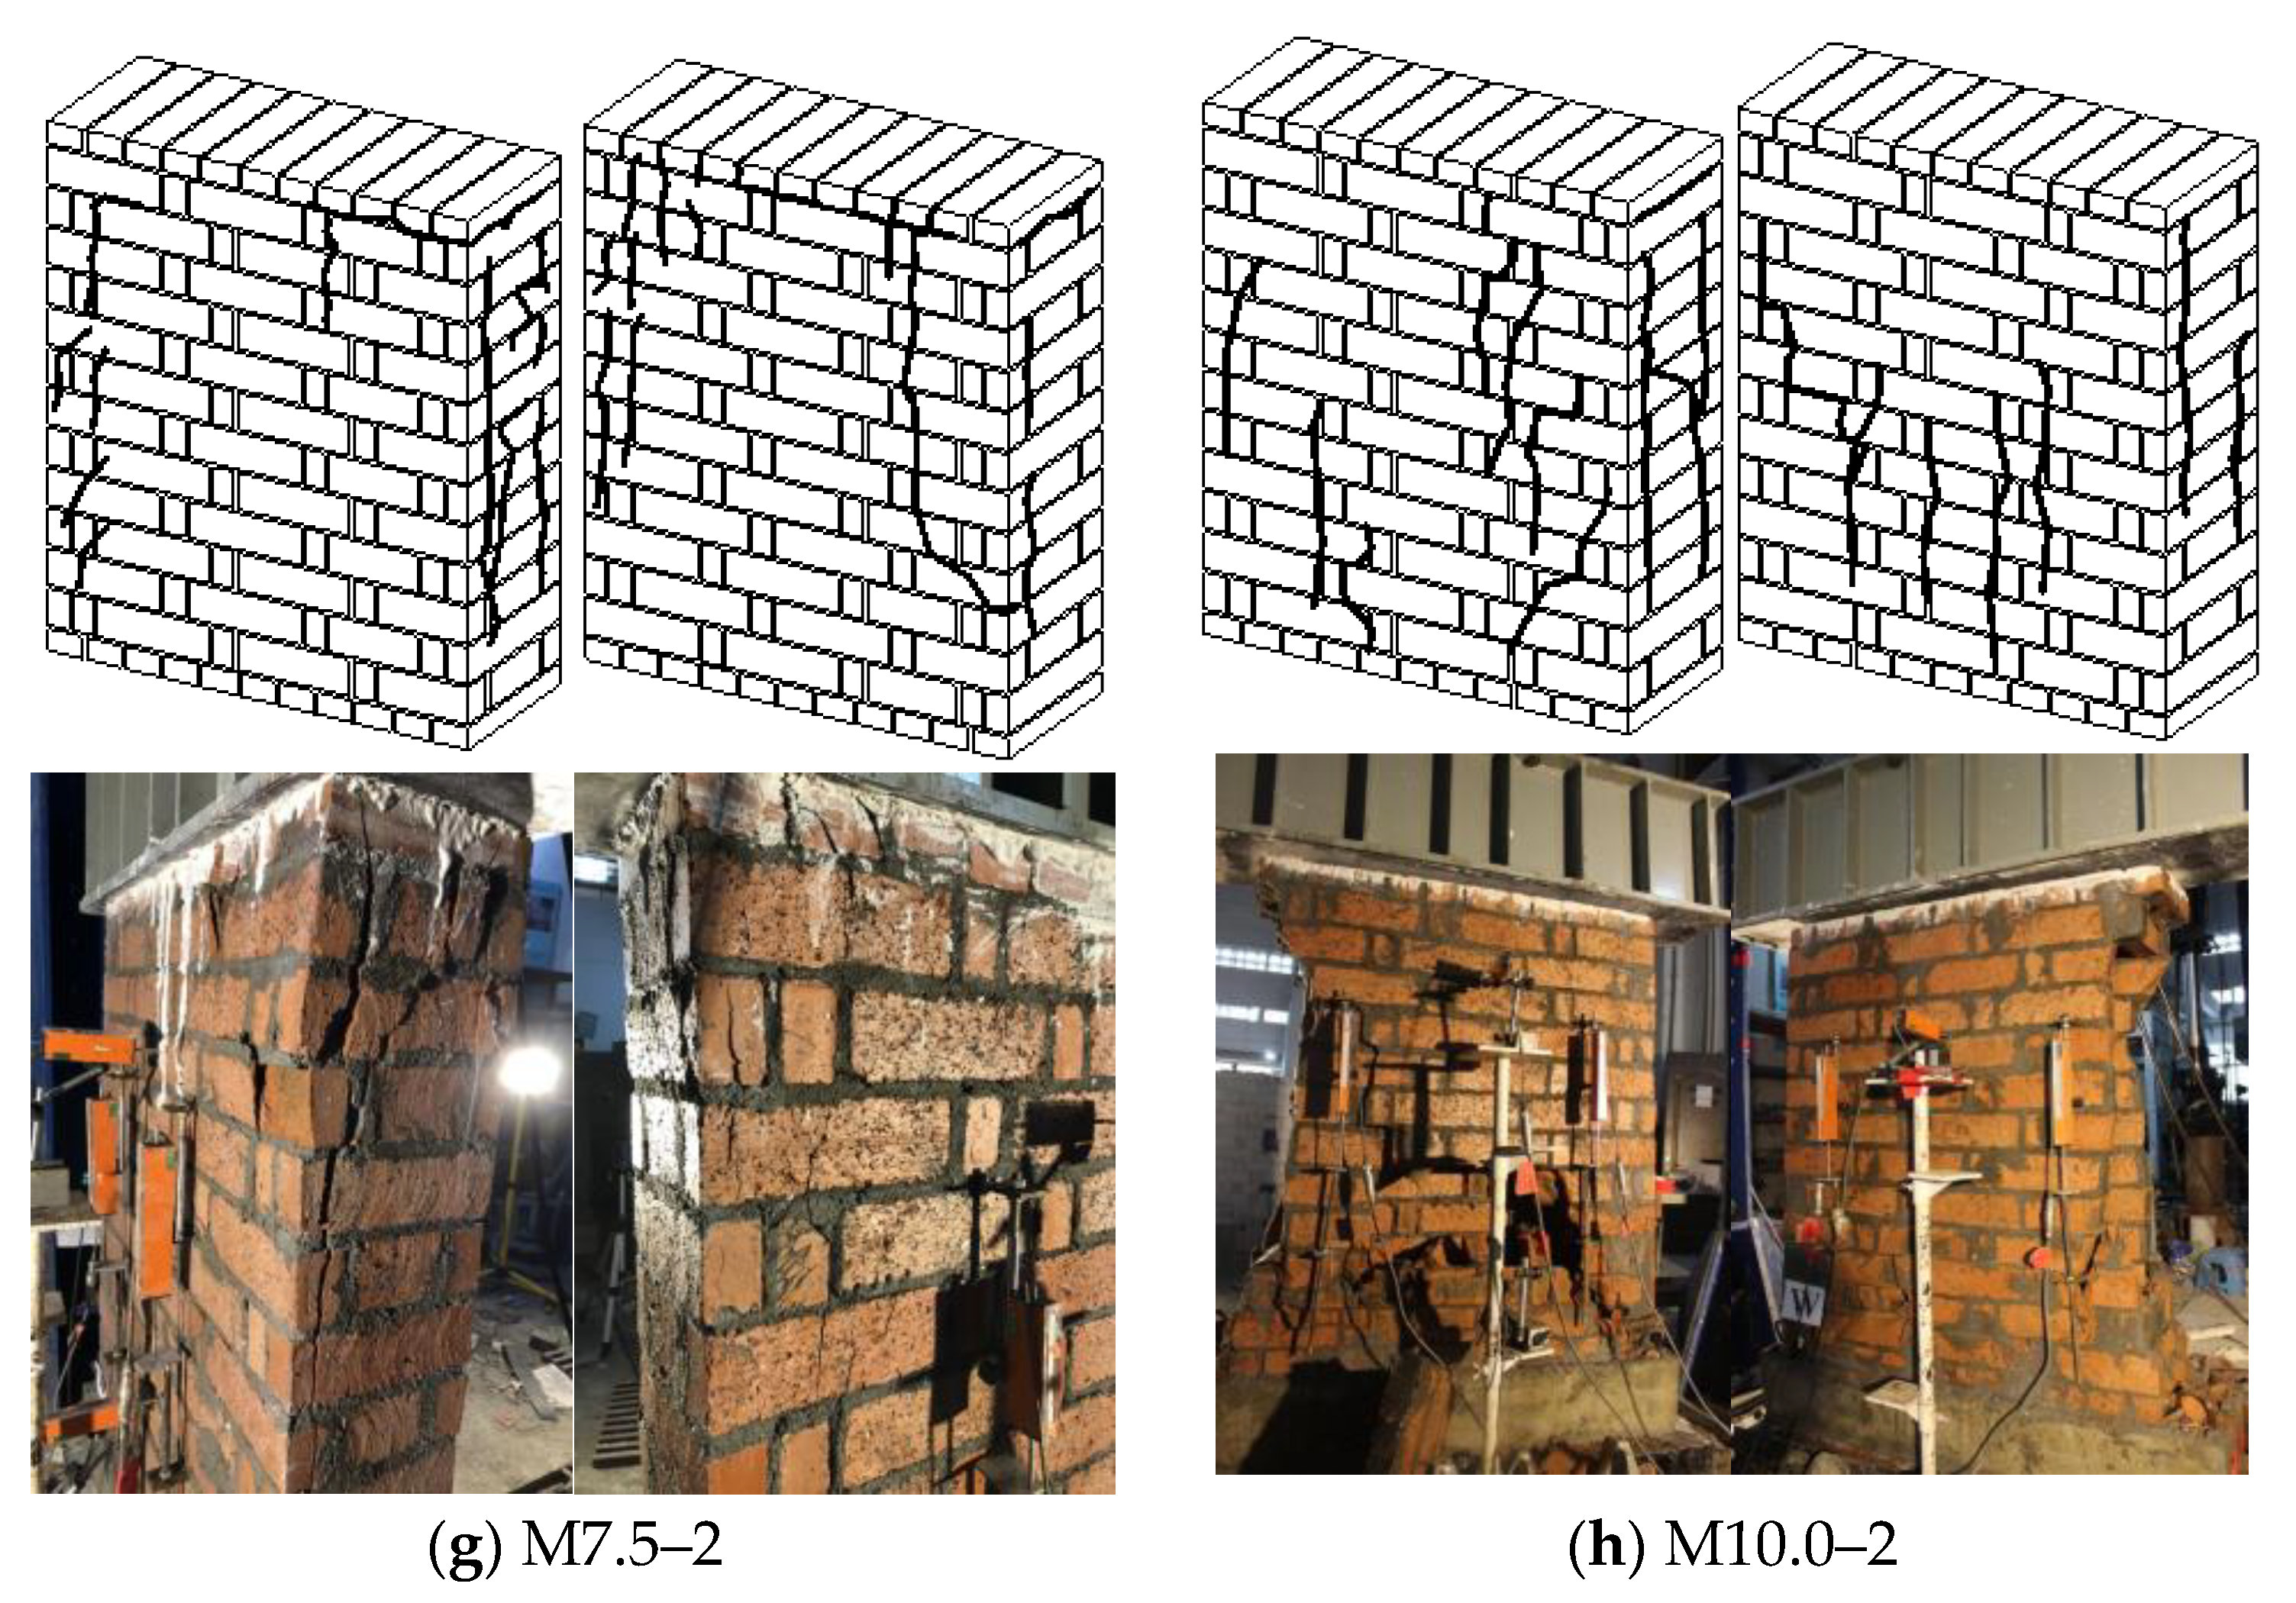
3.1.1. Damage Process and Morphology of Unreinforced Walls

Before loading the wall, the wall was first leveled with plaster at the top of the wall, and after leveling, the pre-pressure was started, after which the instrument readings were checked, and then the formal loading test was started. During formal loading, the loading rod was slowly shaken while ensuring that the rate was as uniform as possible at each loading until the specimen was damaged and the loading was stopped [28]. The distribution of cracks in each section of the unreinforced empty bucket wall is shown in Figure 10.
As depicted in Figure 10, the damage progression of the wall can be broadly categorized into three stages: the elastic stage; the stage of cracks appearing and developing; and the stage of damage. The initial stage, the elastic stage, is observed at the test’s onset. Data readings indicate a linear relationship between load and displacement, signifying that the bucket wall remains in the elastic stage. Simultaneously, there are no visible cracks on the surface of the bucket wall during this phase. The second stage involves the appearance and development of cracks. As the load continues to increase, thin horizontal cracks emerge, followed by vertical cracks. Some mortar begins to peel off the surface, accompanied by a distinct sound. The third stage marks the destruction stage. With ongoing load increase, numerous cracks expand, evolving into large cracks that eventually form vertical penetration joints. Upon reaching the critical load point, the penetration joint undergoes rapid expansion, leading to the sudden collapse of bricks accompanied by breaking sounds. This is followed by a large-scale collapse, indicating that the wall has reached a state of complete destruction.

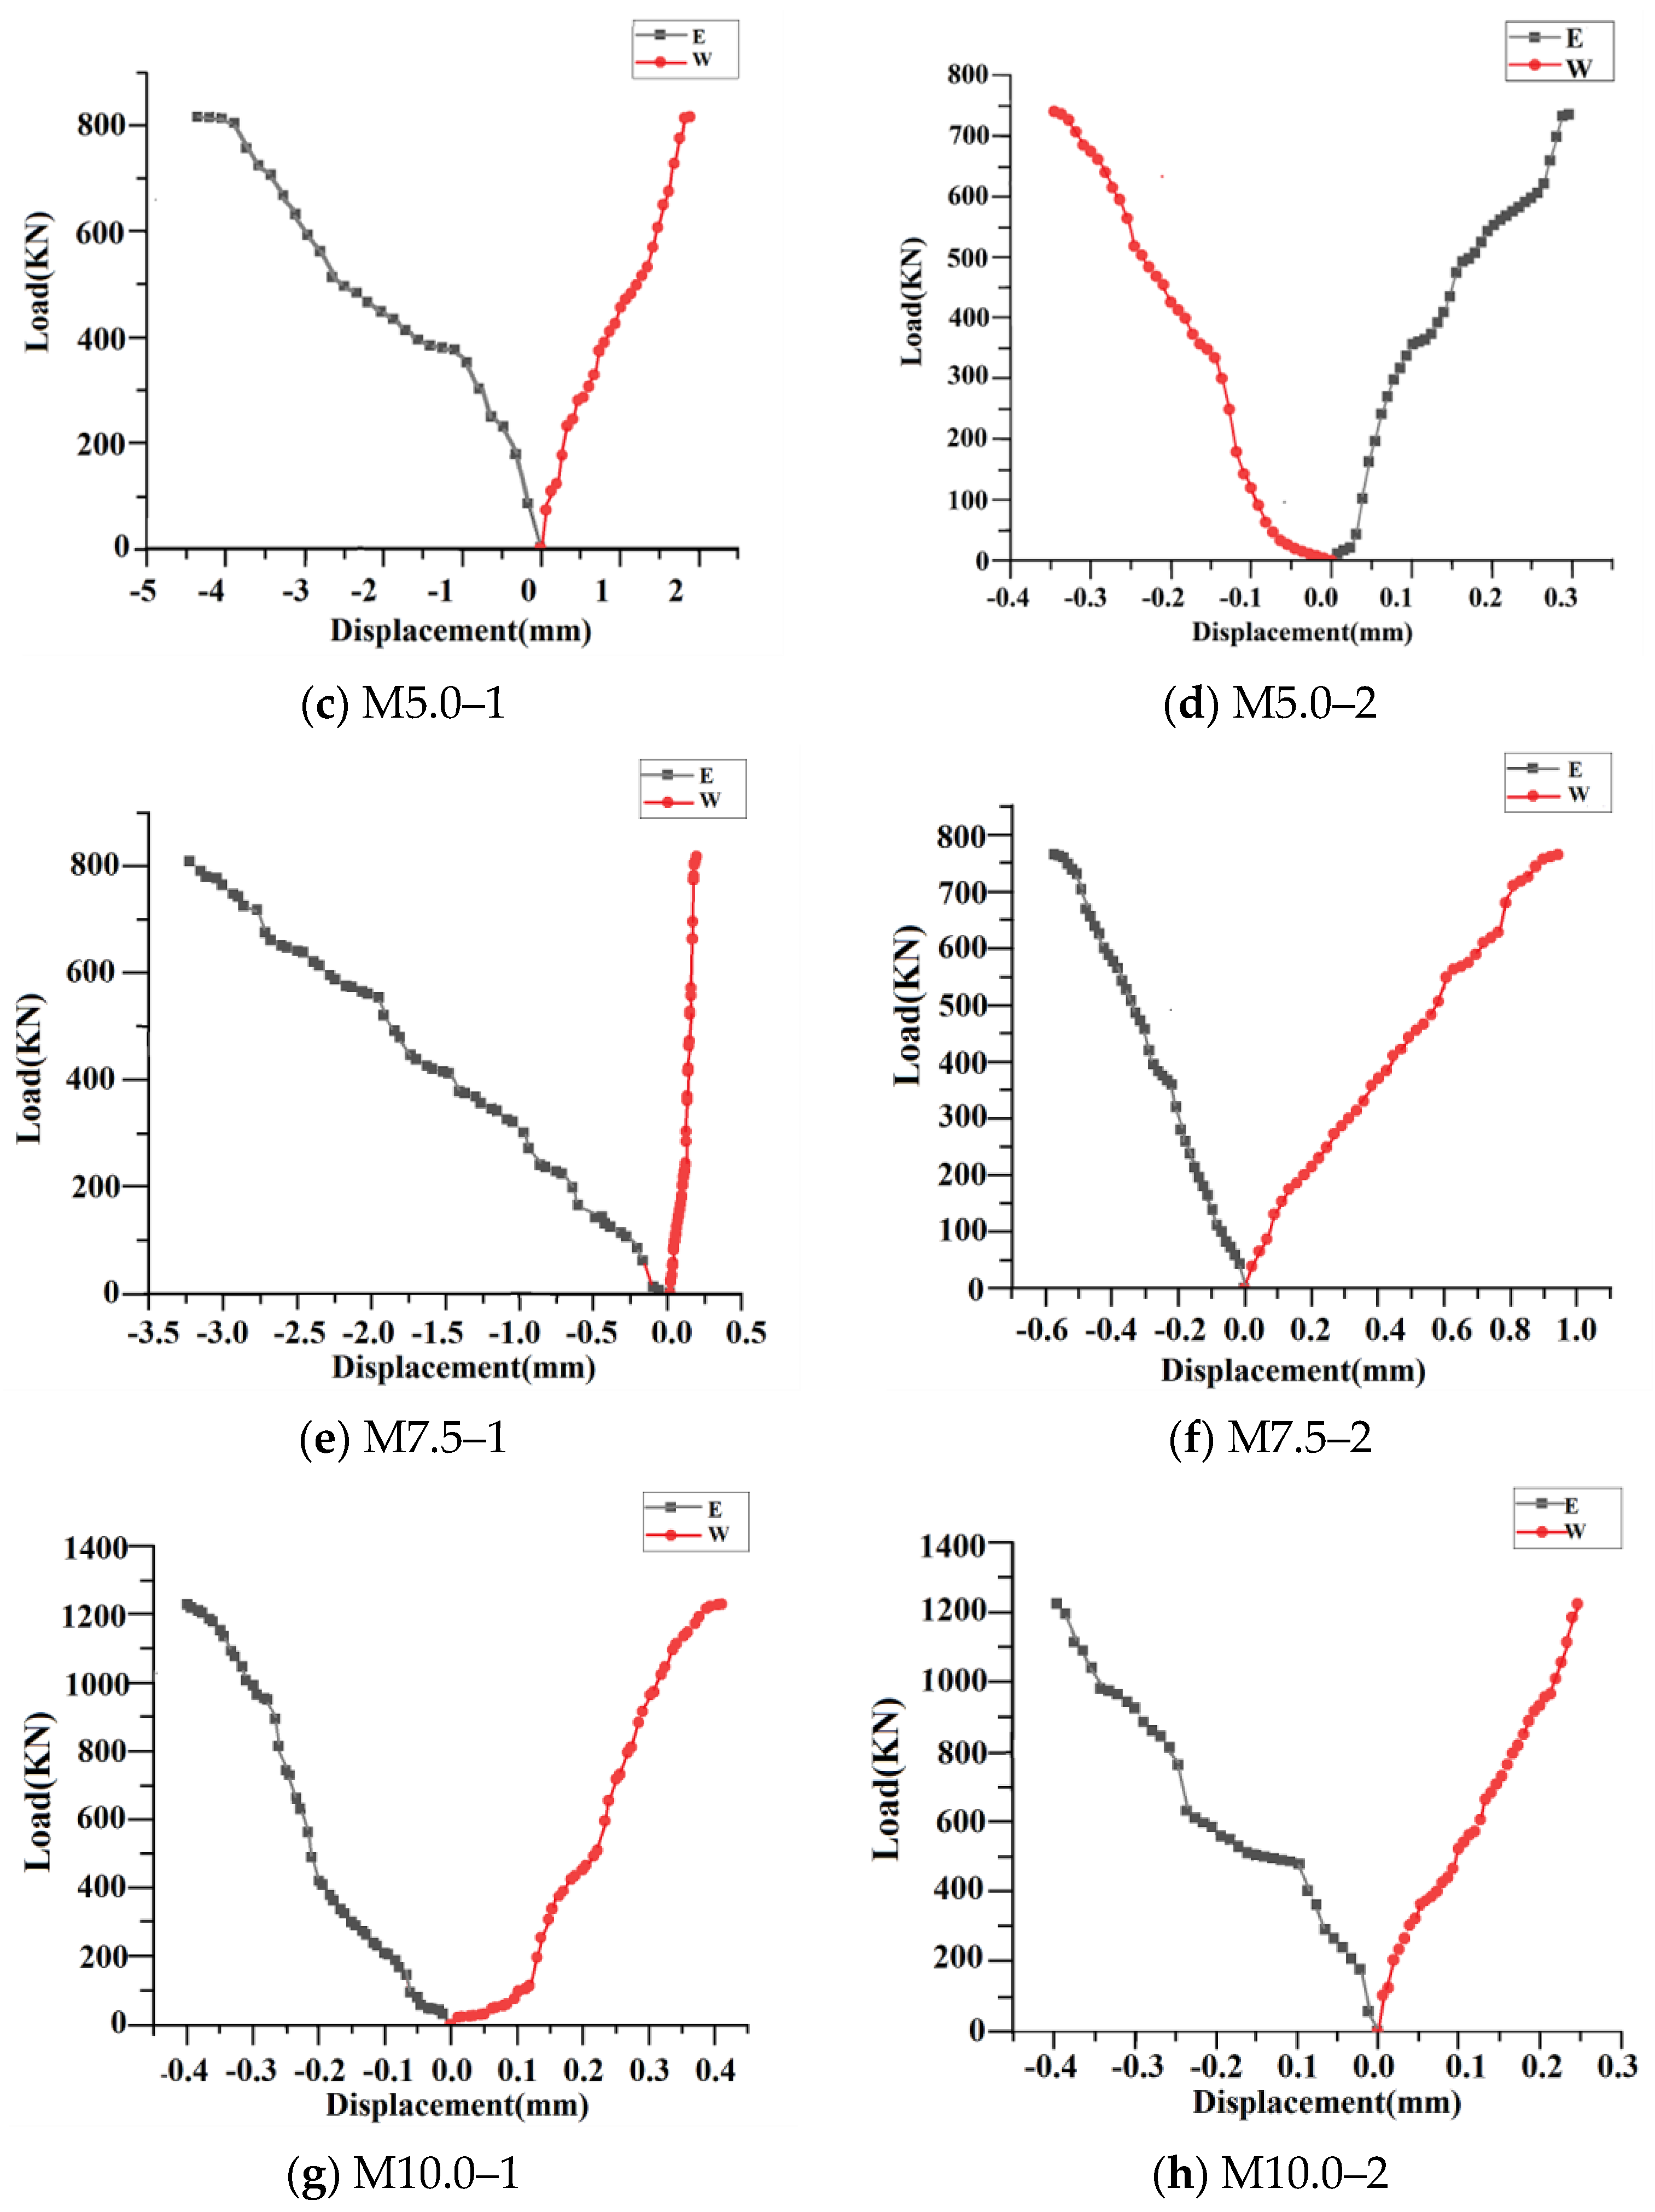
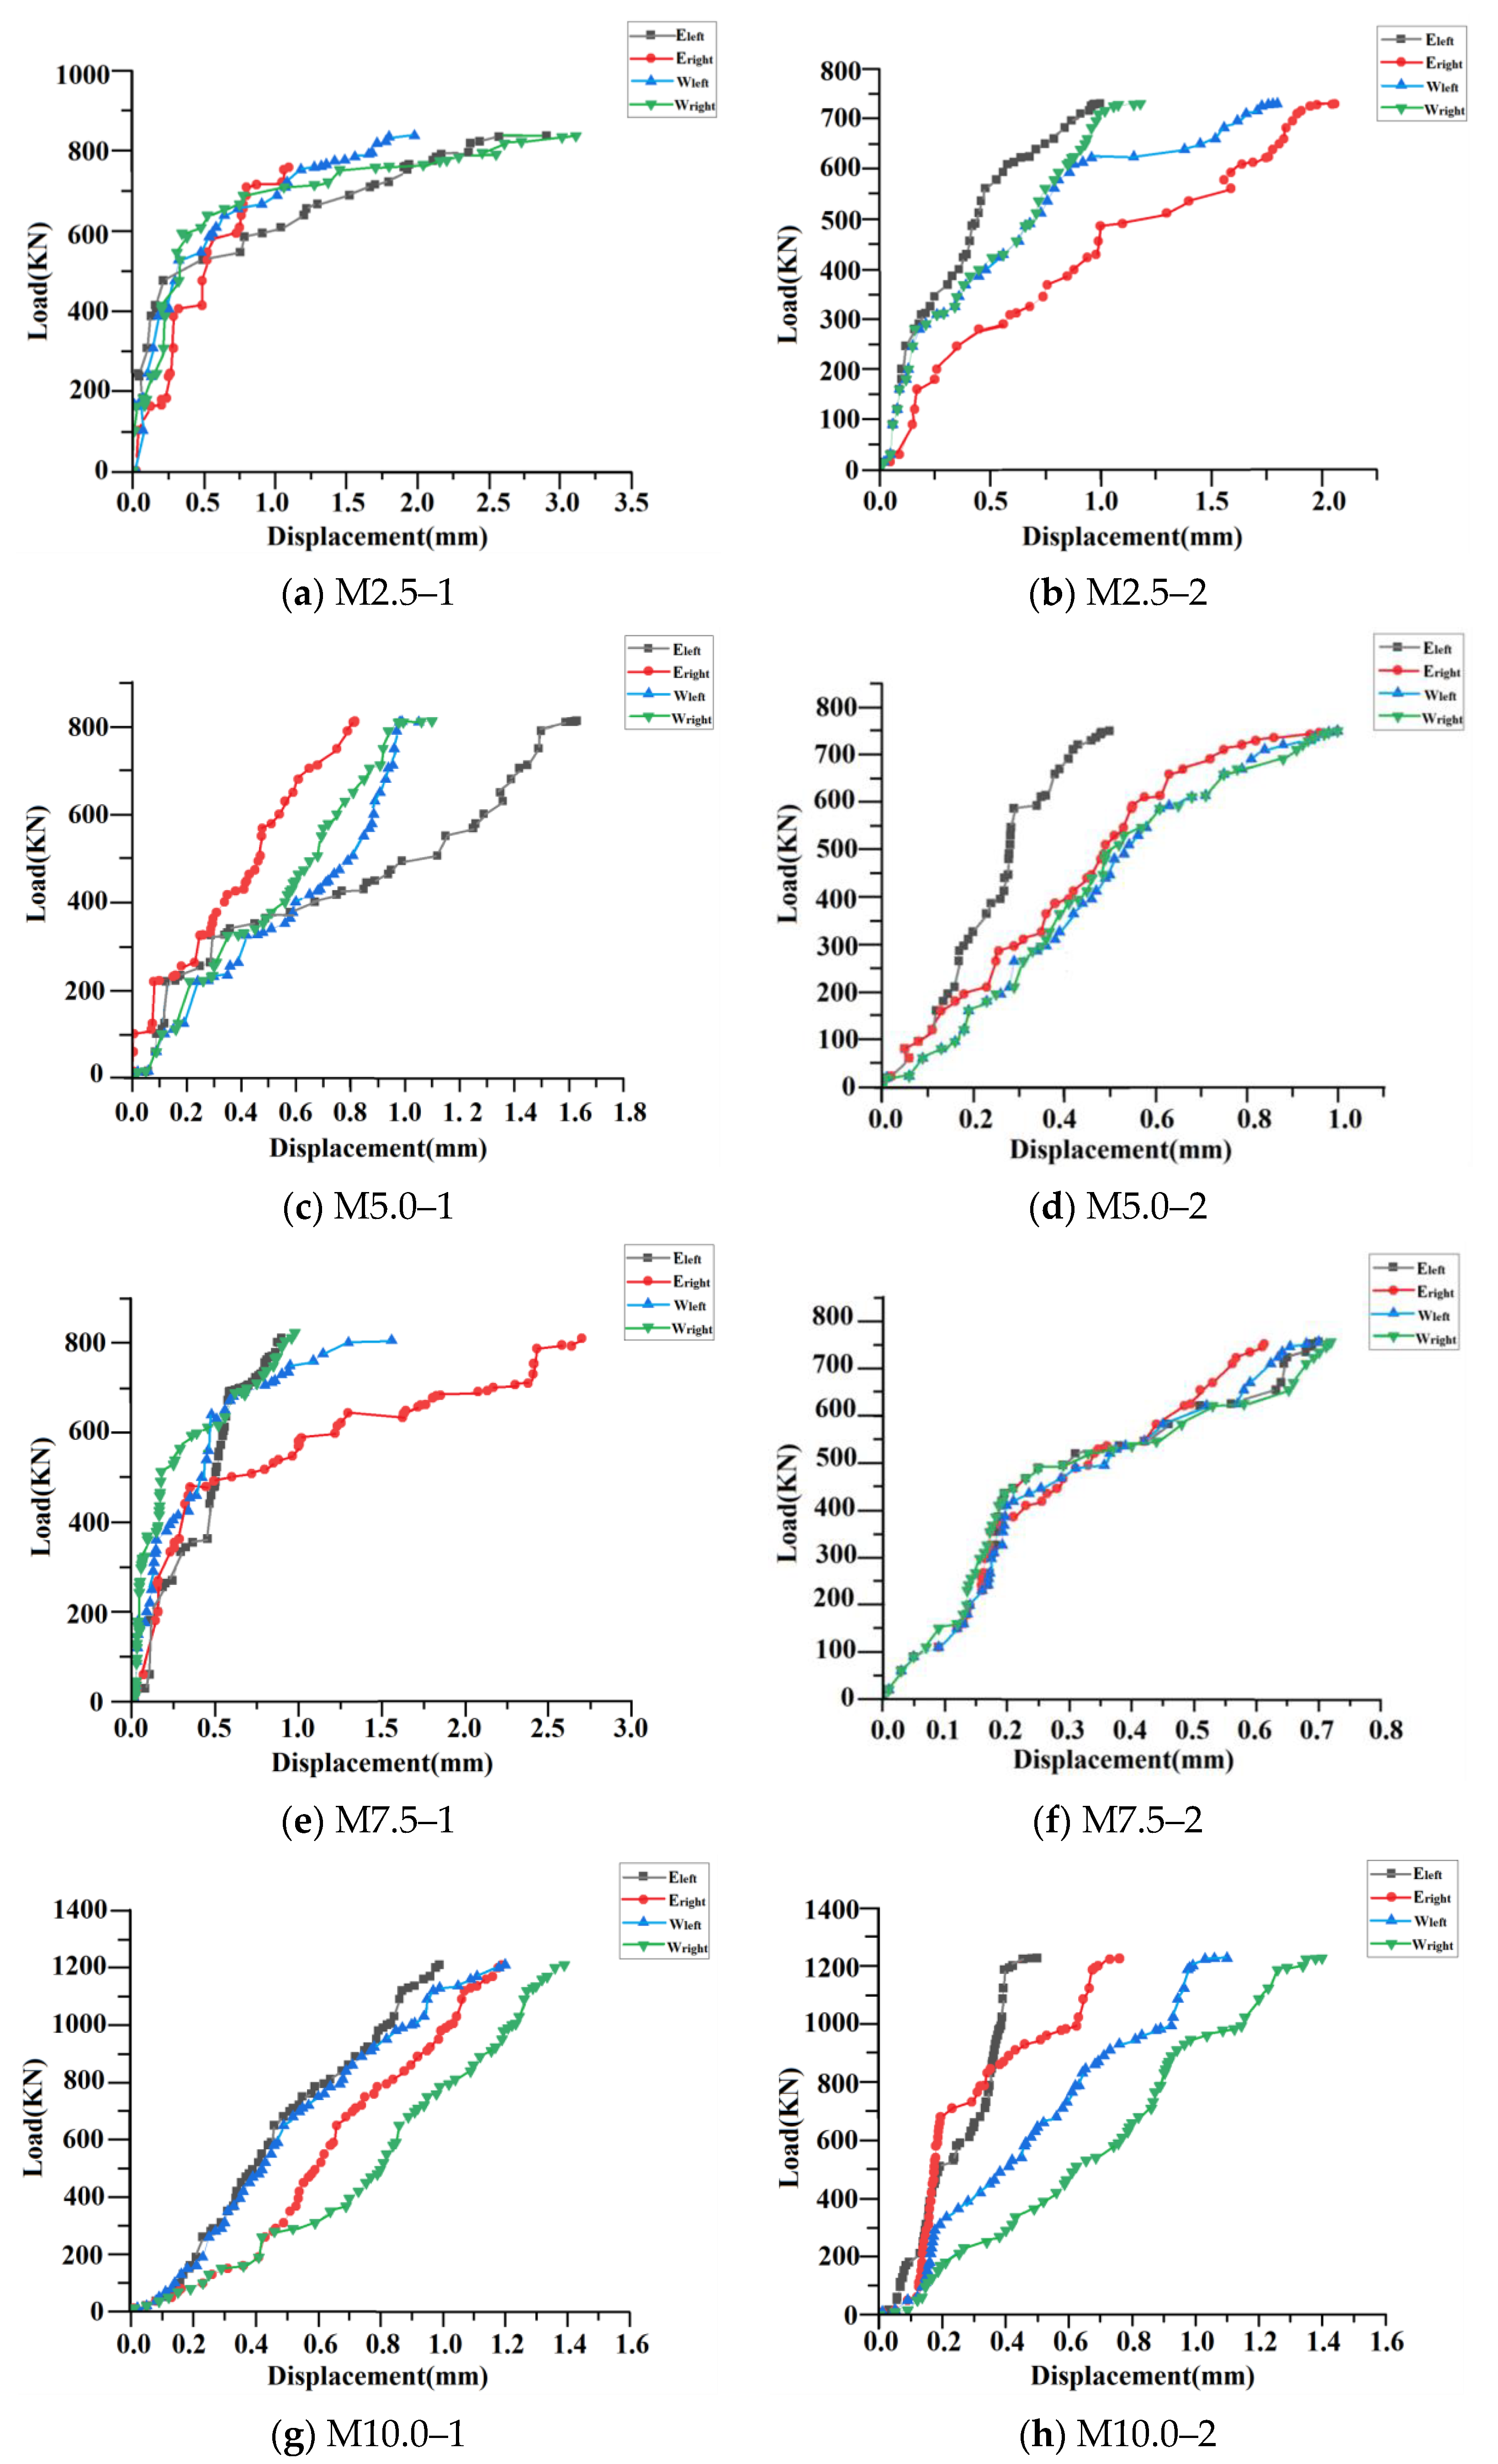
3.1.2. Analysis of Load-Horizontal Displacement Test Results of Unreinforced Walls

The load-horizontal displacement of the unreinforced empty bucket wall under the vertical load is shown in Figure 11.
Figure 11 illustrates that the horizontal displacement of the walls of the same strength is generally larger in the dry environment than in the wet environment after a certain time of maintenance under the action of the vertical load. Among them, except for wall M 5.0–2, which produced outward deformation (bulging outward) on the E side and inward deformation (depression inward) on the W side, the rest of the walls produced outward deformation (bulging outward) on the W side and inward deformation (depression inward) on the E side. When the load reaches the cracking state of the wall, its horizontal displacement increases significantly.

3.1.3. Analysis of Load-Vertical Displacement Test Results of Unreinforced Walls

The load-vertical displacement of the unreinforced empty bucket wall under the vertical load is shown in Figure 12.
It is obvious from Figure 12 that the load-vertical displacement curves of all empty bucket walls were almost linear at the initial stage of load loading, indicating that the walls were still in the elastic stage at this time. In the elastic stage, the vertical displacement of the wall does not change; after that, with a further increase in the vertical load, cracks appear in the wall; the first crack in the brick wall in this test occurs at 30–65% of the damage load, which indicates that the wall has begun to enter the plastic stage, and with the continuous increase in the load, the vertical displacement of the wall begins to increase significantly; the cracks of the wall begin to expand continuously, and the cracks and the slope of the curve become wider and larger. If the load is stopped at this time, the cracks continue to develop, and the wall can be regarded as being in a dangerous state at this time. As the load continues to increase, the brick wall is crushed or loses its stability, and the wall is destroyed because the bearing capacity of the wall has reached its limit value.

3.2. Experimental Study on the Compressive Performance of Reinforced Walls

The crack diagrams of the reinforced walls were plotted, and the corresponding load-vertical displacement diagrams and load-horizontal displacement diagrams were obtained from the measured data to compare and analyze the performance changes in the empty bucket walls in dry and wet environments.

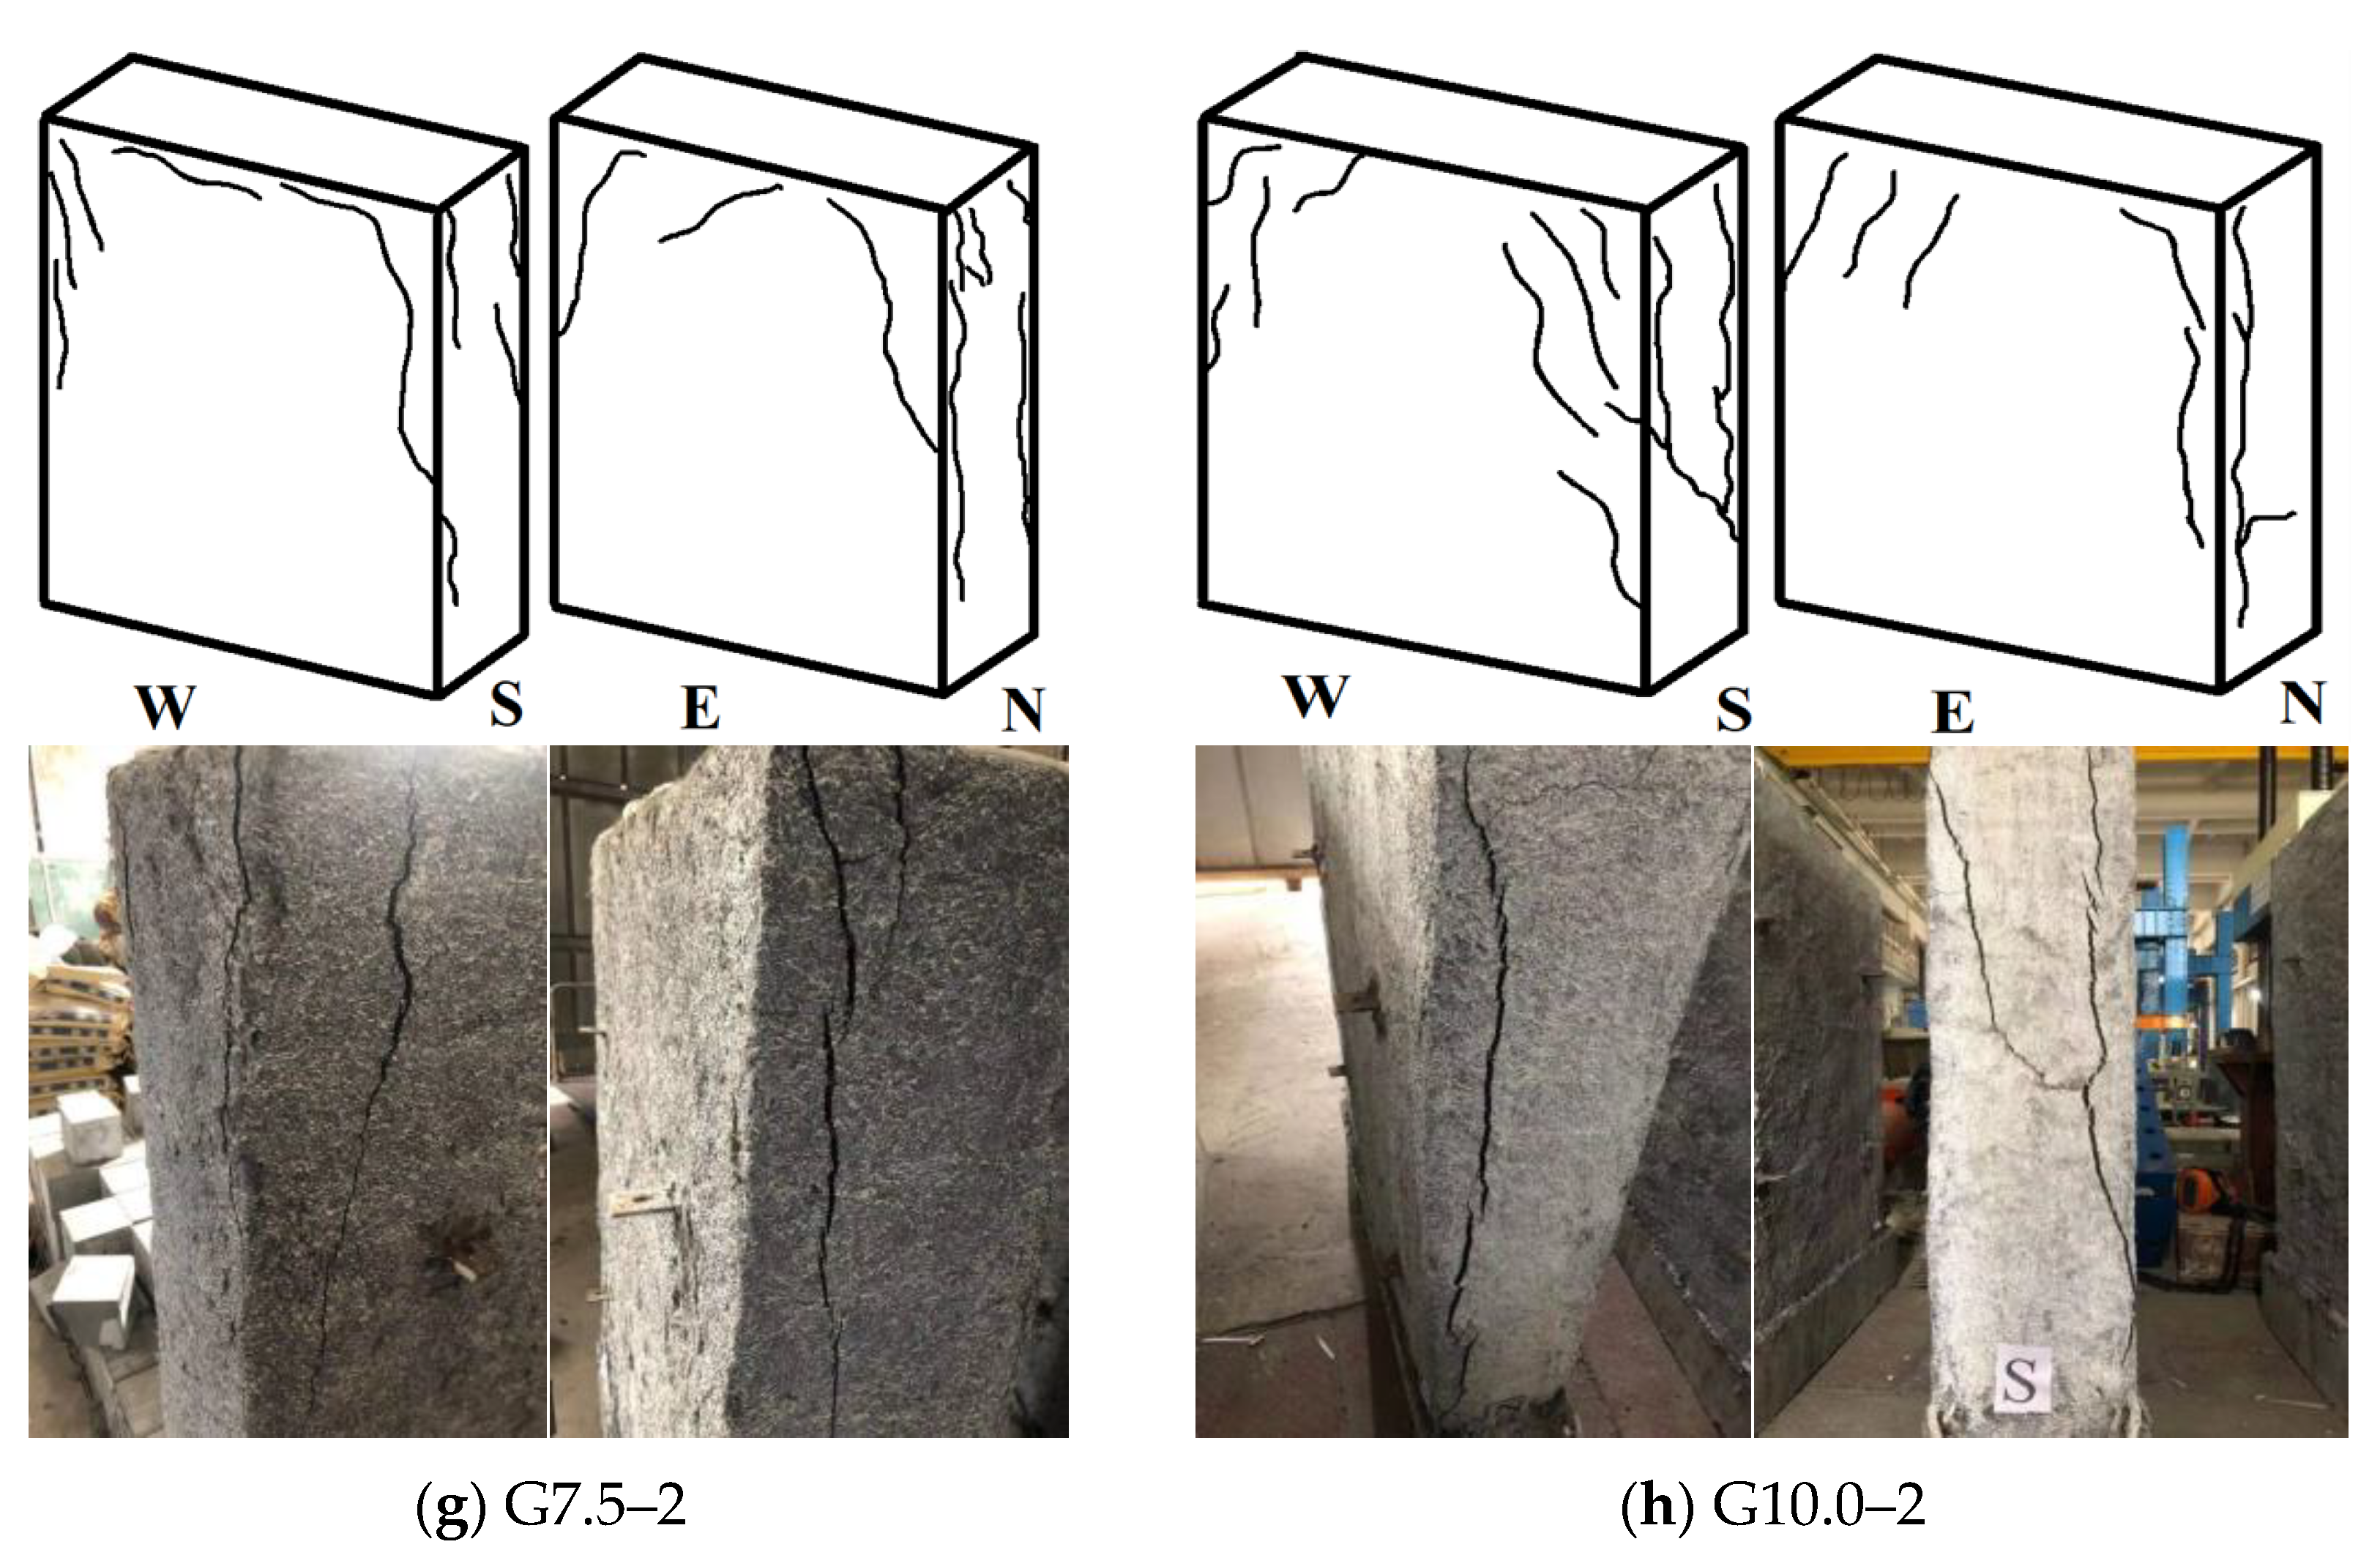
3.2.1. Reinforced Wall Damage Process and Morphology

The test was carried out using the displacement control method with a controlled rate of 0.5 mm/min and a graded loading mechanism, with the first target displacement value set to 5 mm, and after reaching the target displacement value, the target displacement was set to 2 mm each time, and the observation of wall cracks was maintained for 3 min after each time the target displacement value was reached [28]. Before the test started, the top of the wall was leveled with gypsum, after which the pre-pressure was started, and the pre-pressure loading value was 20 kN to test whether the displacement meter, acquisition instrument, and other equipment could work properly. After the pre-pressure was finished, the wall compressive test was formally started. When the wall shows large cracks and the load reading of the testing machine falls back significantly, the wall can be considered to be completely damaged. The distribution of cracks in each section of the reinforced empty bucket wall is shown in Figure 13.
In Figure 13, the progression of wall damage can be delineated into three main stages: the elastic stage; the stage of cracks appearing and developing; and the stage of damage. The first stage, the resilience stage, is characterized by a linear relationship between load and displacement, indicating that the brick wall remains in the elastic stage. Simultaneously, there are no visible cracks on the surface of the brick wall during this phase. Moving to the second stage, the appearance and development of cracks, the load continues to increase, and the surface of the wall remains free of cracks. However, an intermittent crisp splintering sound emanates from within the wall. This splitting sound becomes more pronounced with further load increases. When the load reaches a critical point, vertical fine microcracks slowly appear and develop. The third stage marks the destruction stage. As the cracks develop, a violent splitting sound resonates inside the wall, and vertical cracks in the wall progress almost simultaneously appear at a visible speed, producing a tearing sound. Ultimately, a very intense and crisp crackling sound from within the wall, coupled with a significant drop in computerized load readings, indicates a loss of bearing capacity and the complete destruction of the wall.

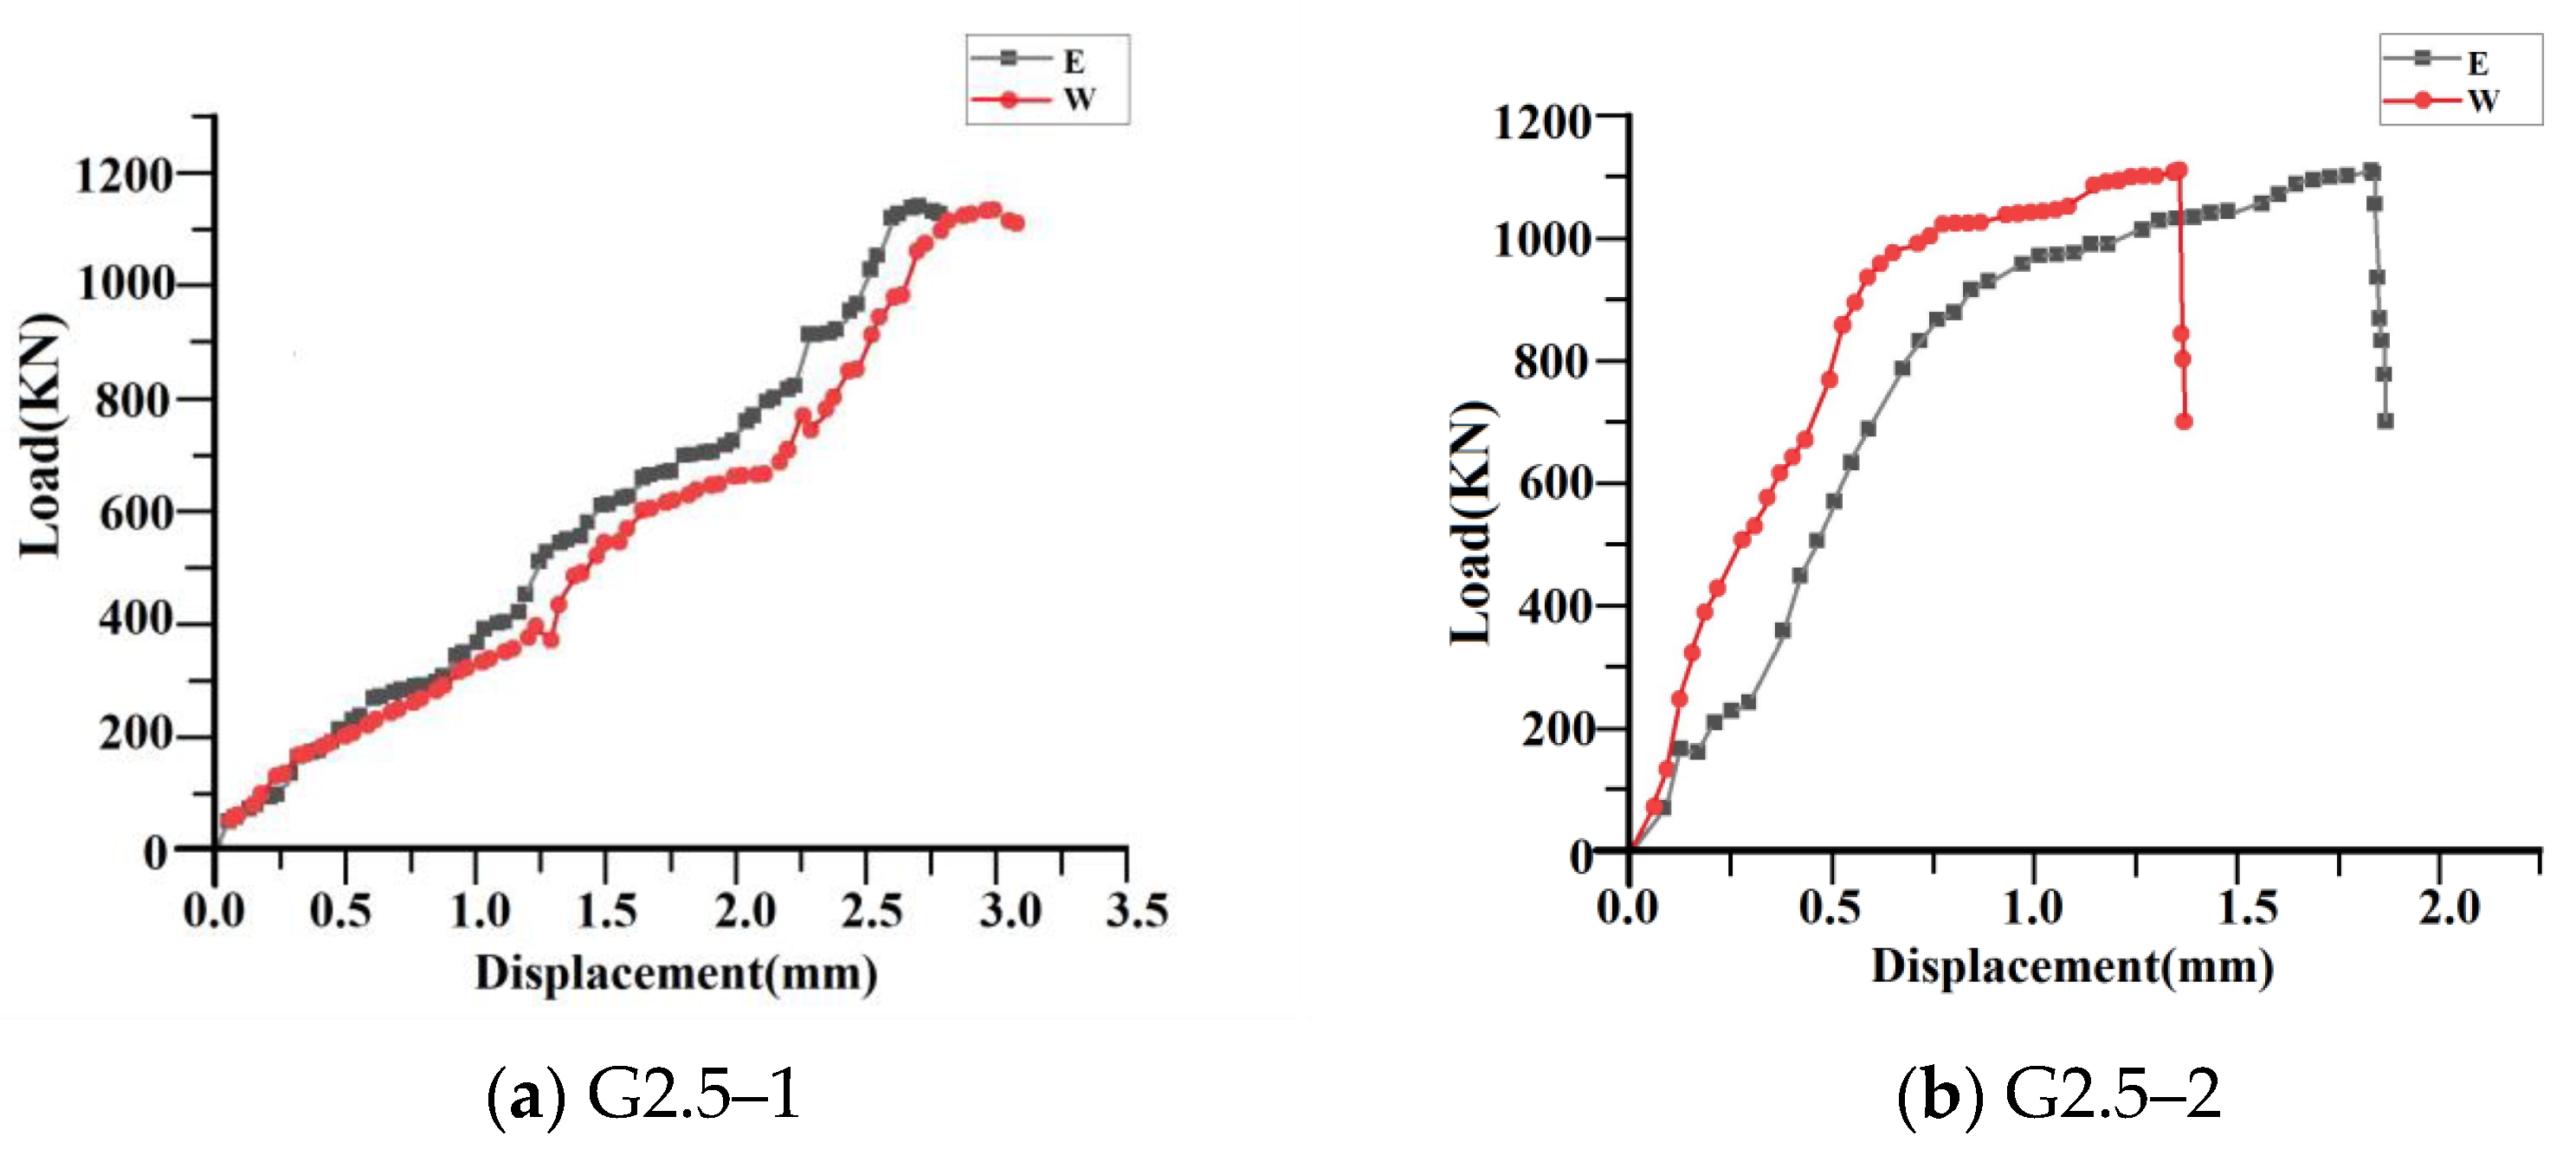
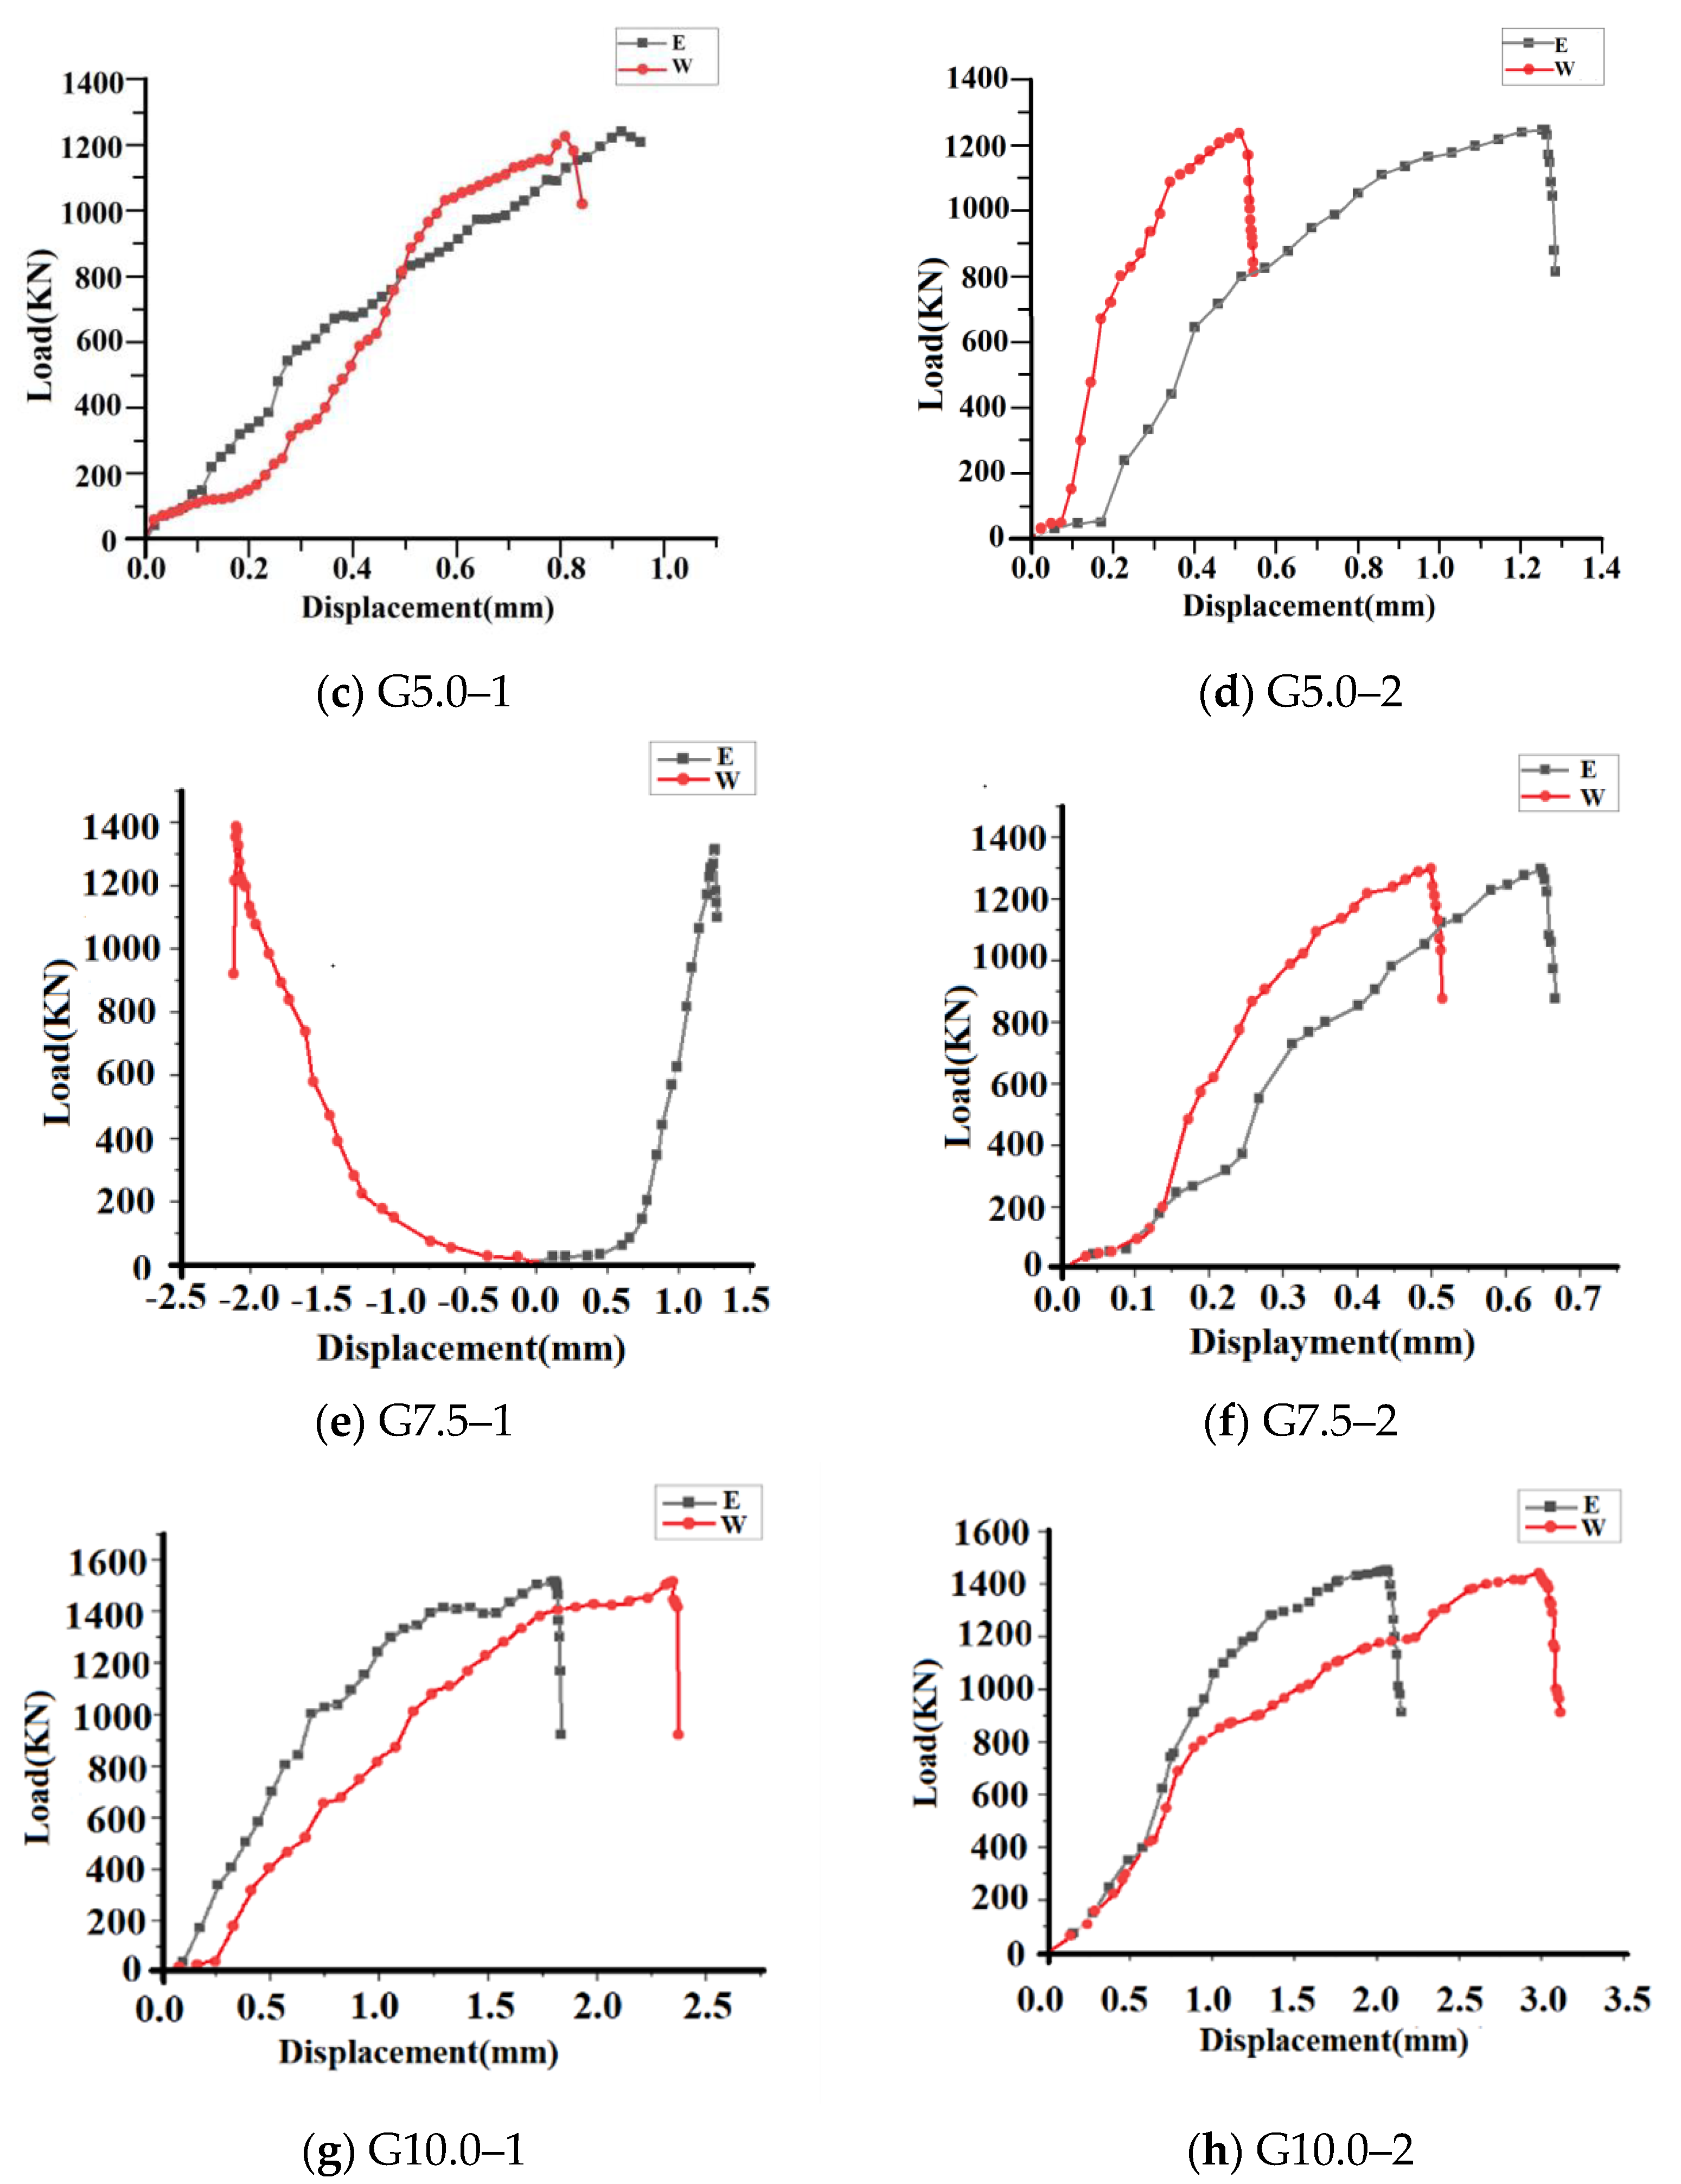
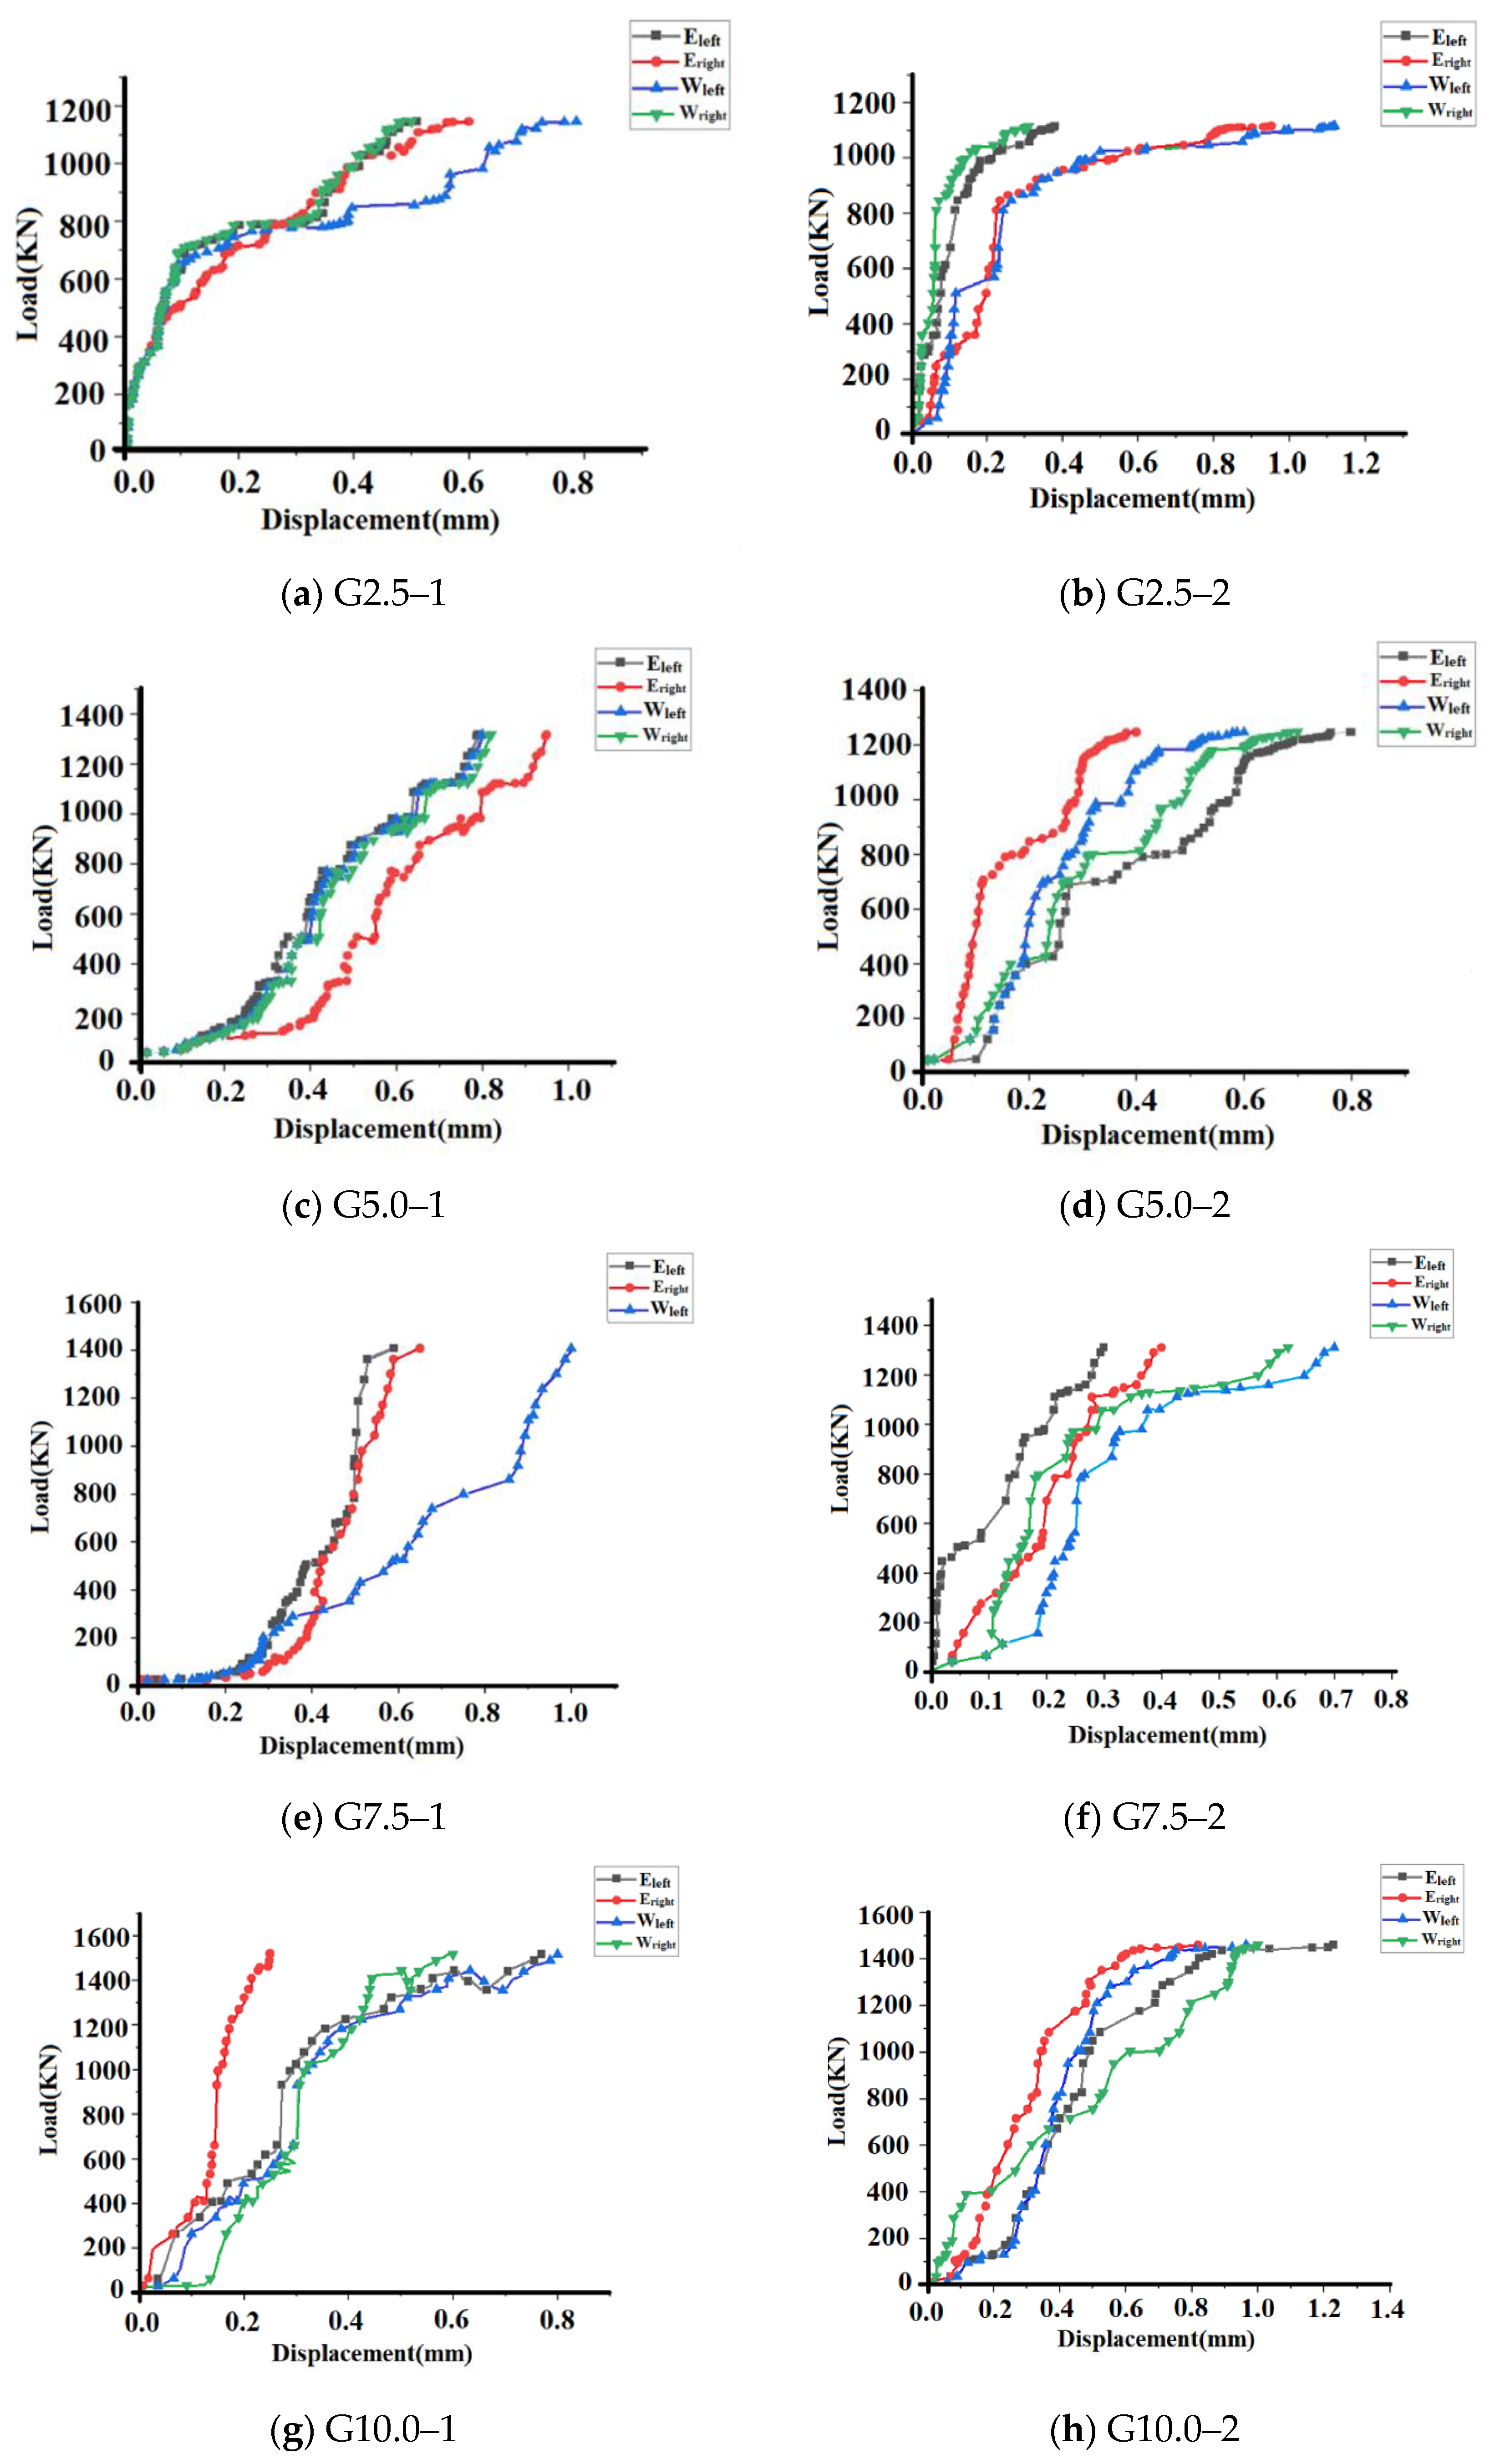
3.2.2. Analysis of Load-Horizontal Displacement Test Results of Reinforced Empty Bucket Wall

The load-horizontal displacement of the reinforced empty bucket wall under the vertical load is shown in Figure 14.
From Figure 14, it can be seen that the readings of displacement gauges of all reinforced empty bucket walls under vertical load are positive, except for empty bucket wall G 7.5–1; i.e., the walls all bulge outward to both sides, and the W side of empty bucket wall G 7.5–1 deforms inward (wall concave) and the E side deforms outward (wall convex) when it is under pressure, so the reinforced empty bucket walls deform under vertical load. The wall surface generally bulges outward.

3.2.3. Analysis of Load-Vertical Displacement Test Results of Reinforced Empty Bucket Wall

The load-horizontal displacement of the reinforced empty bucket wall under the vertical load is shown in Figure 15.
Figure 15 shows that the load-vertical displacement curve of all walls after reinforcement is almost linear at the beginning loading stage, indicating that the empty bucket wall is in an elastic stage at this time, and the change in the vertical displacement of the wall is not obvious at the elastic stage, after which cracks appear in the wall as the load continues to increase, and when the first crack appears in the reinforced wall in the test, it generally occurs at 66–88% of the damage load. This indicates that the wall has begun to enter the plastic stage; the load continues to be applied; the vertical displacement of the wall increases significantly; the wall cracks begin to accelerate the development; the cracks become wider and larger, and the slope of the curve also begins to change significantly. If the vertical load stops being applied at this time, the cracks in the wall develop on their own, and finally, the bearing capacity of the wall reaches the limit value, and the wall is crushed or completely loses stability and is destroyed.

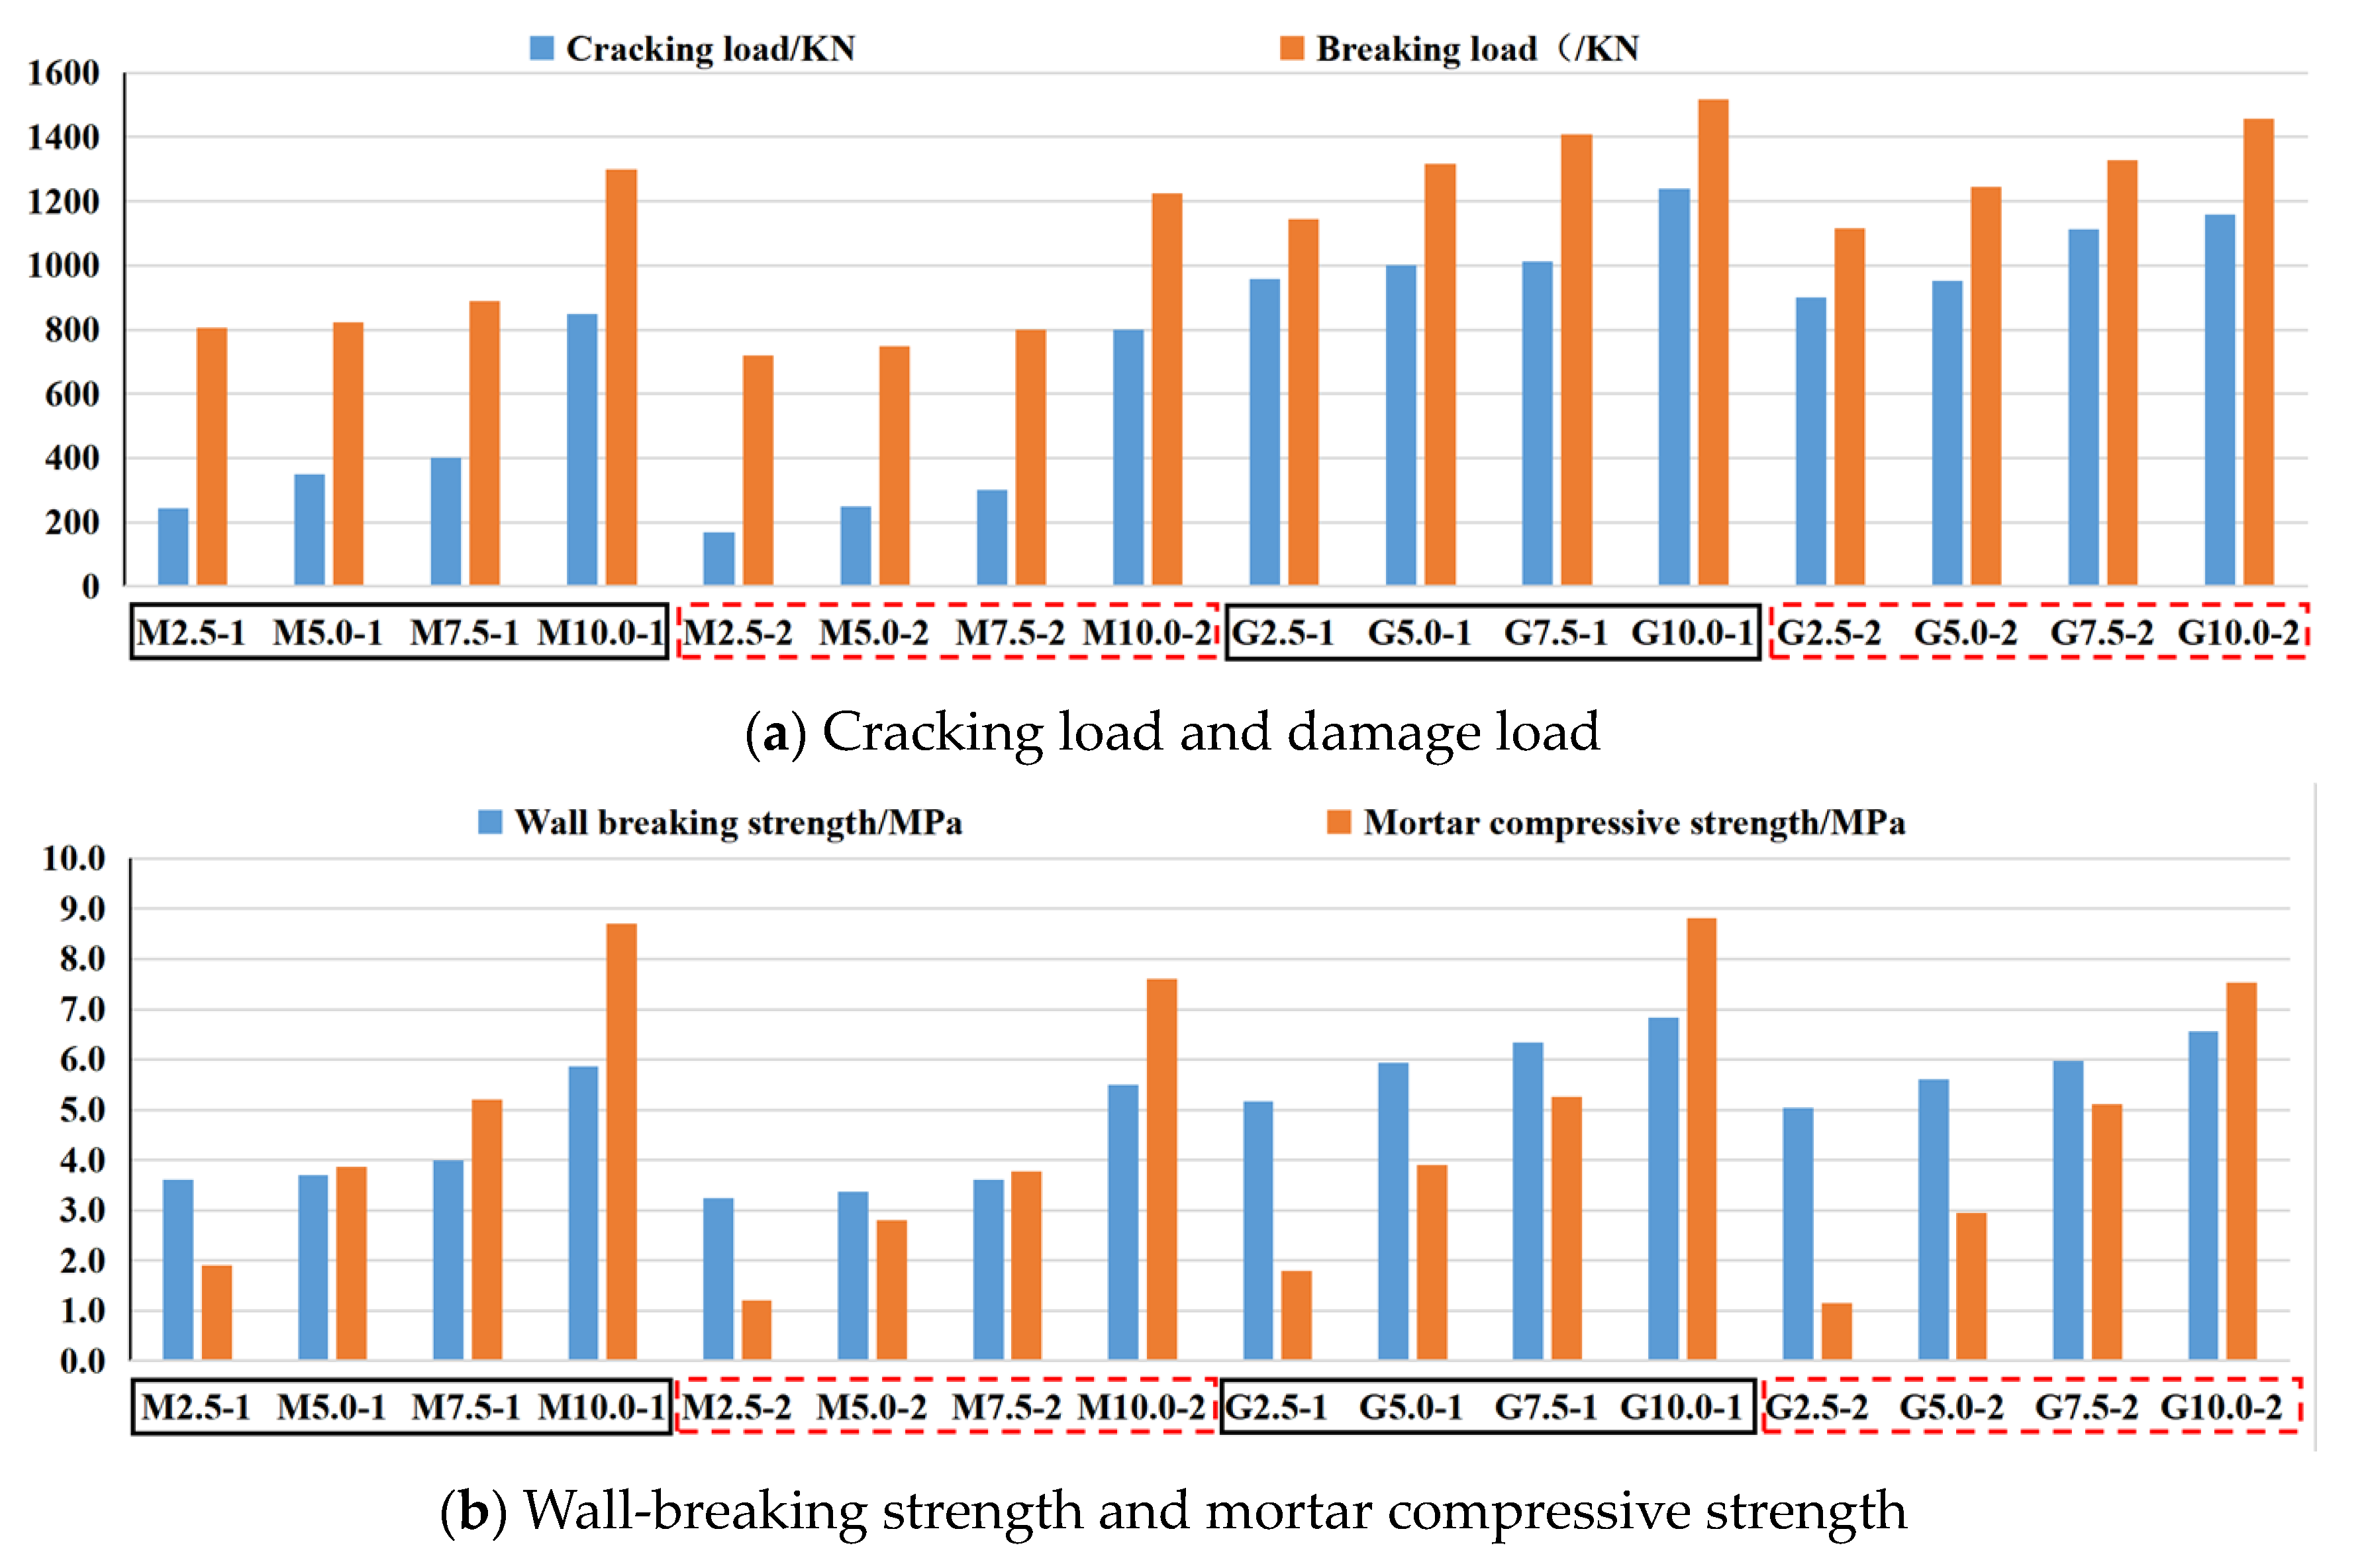
3.3. Compression Results of Empty Bucket Walls under Different Maintenance Environments

The compression results obtained for the unreinforced and reinforced empty bucket walls maintained in dry and wet environments are shown in Figure 16.
  • From the maintenance of unreinforced vacant bucket walls of the same strength in different environments in Figure 16, it can be seen that the cracking and damage loads of unreinforced vacant bucket walls in wet environments are significantly lower than their cracking and damage loads in dry environments, where for cracking loads, M 2.5–2 is 30% lower than M 2.5–1; M 5.0–2 is 28.5% lower than M 5.0–1; M 7.5–2 reduced by 25% compared to M 7.5–1, and M 10.0–2 reduced by 5.8% compared to M 10.0–1. For damage load, M 2.5–2 reduced by 10.8% compared to M 2.5–1; M 5.0–2 reduced by 9% compared to M 5.0–1; M 7.5–2 reduced by 8.4% compared to M 7.5–1, and M 10.0–2 reduced by 5.6%, indicating that the cracking load decreases more significantly for walls maintained in a humid environment, which are more affected by the wet and dry environment than those affected by the damage load. In addition, the cracking load and damage load of the empty bucket wall under the same maintenance environment both become larger with the increase in masonry mortar strength, indicating that the strength of masonry mortar has a significant effect on the overall bearing capacity of the empty bucket wall, in which the cracking load and damage load of the empty bucket wall with M 10.0 strength of this test are significantly higher than those of the other three strengths, indicating that the masonry mortar with mortar strength grade M 10 and Dalun brick combination can significantly improve the bearing capacity of the wall so that the overall bearing capacity of the wall can be significantly improved;
  • Through the maintenance of reinforced vacant bucket walls of the same strength in different environments in Figure 16, it can be seen that the cracking and damage loads of the reinforced vacant bucket walls in the wet environment are significantly lower than their cracking and damage loads in the dry environment, where for cracking loads, G 2.5–2 is 6.2% lower than G 2.5–1; G 5.0–2 is 36% lower than G 5.0–1; G 7.5–2 reduced by 10.2% compared to G 7.5–1, and G 10.0–2 reduced by 14.6% compared to G 10.0–1. For damage load, G 2.5–2 reduced by 2.5% compared to G 2.5–1; G 5.0–2 reduced by 5.4% compared to G5.0–1; G 7.5–2 reduced by 5.7% compared to G 7.5–1; G 10.0–2 reduced by 4% compared to G 10.0–1 decreased by 4%, and by comparing the data, it can be seen that the cracking load of the reinforced empty bucket wall maintained in a wet environment decreased more significantly relative to that in a dry environment, and its influence by the wet and dry environment was greater than the influence by the damage load.

4. Stress–Strain Analysis of Empty Bucket Wall

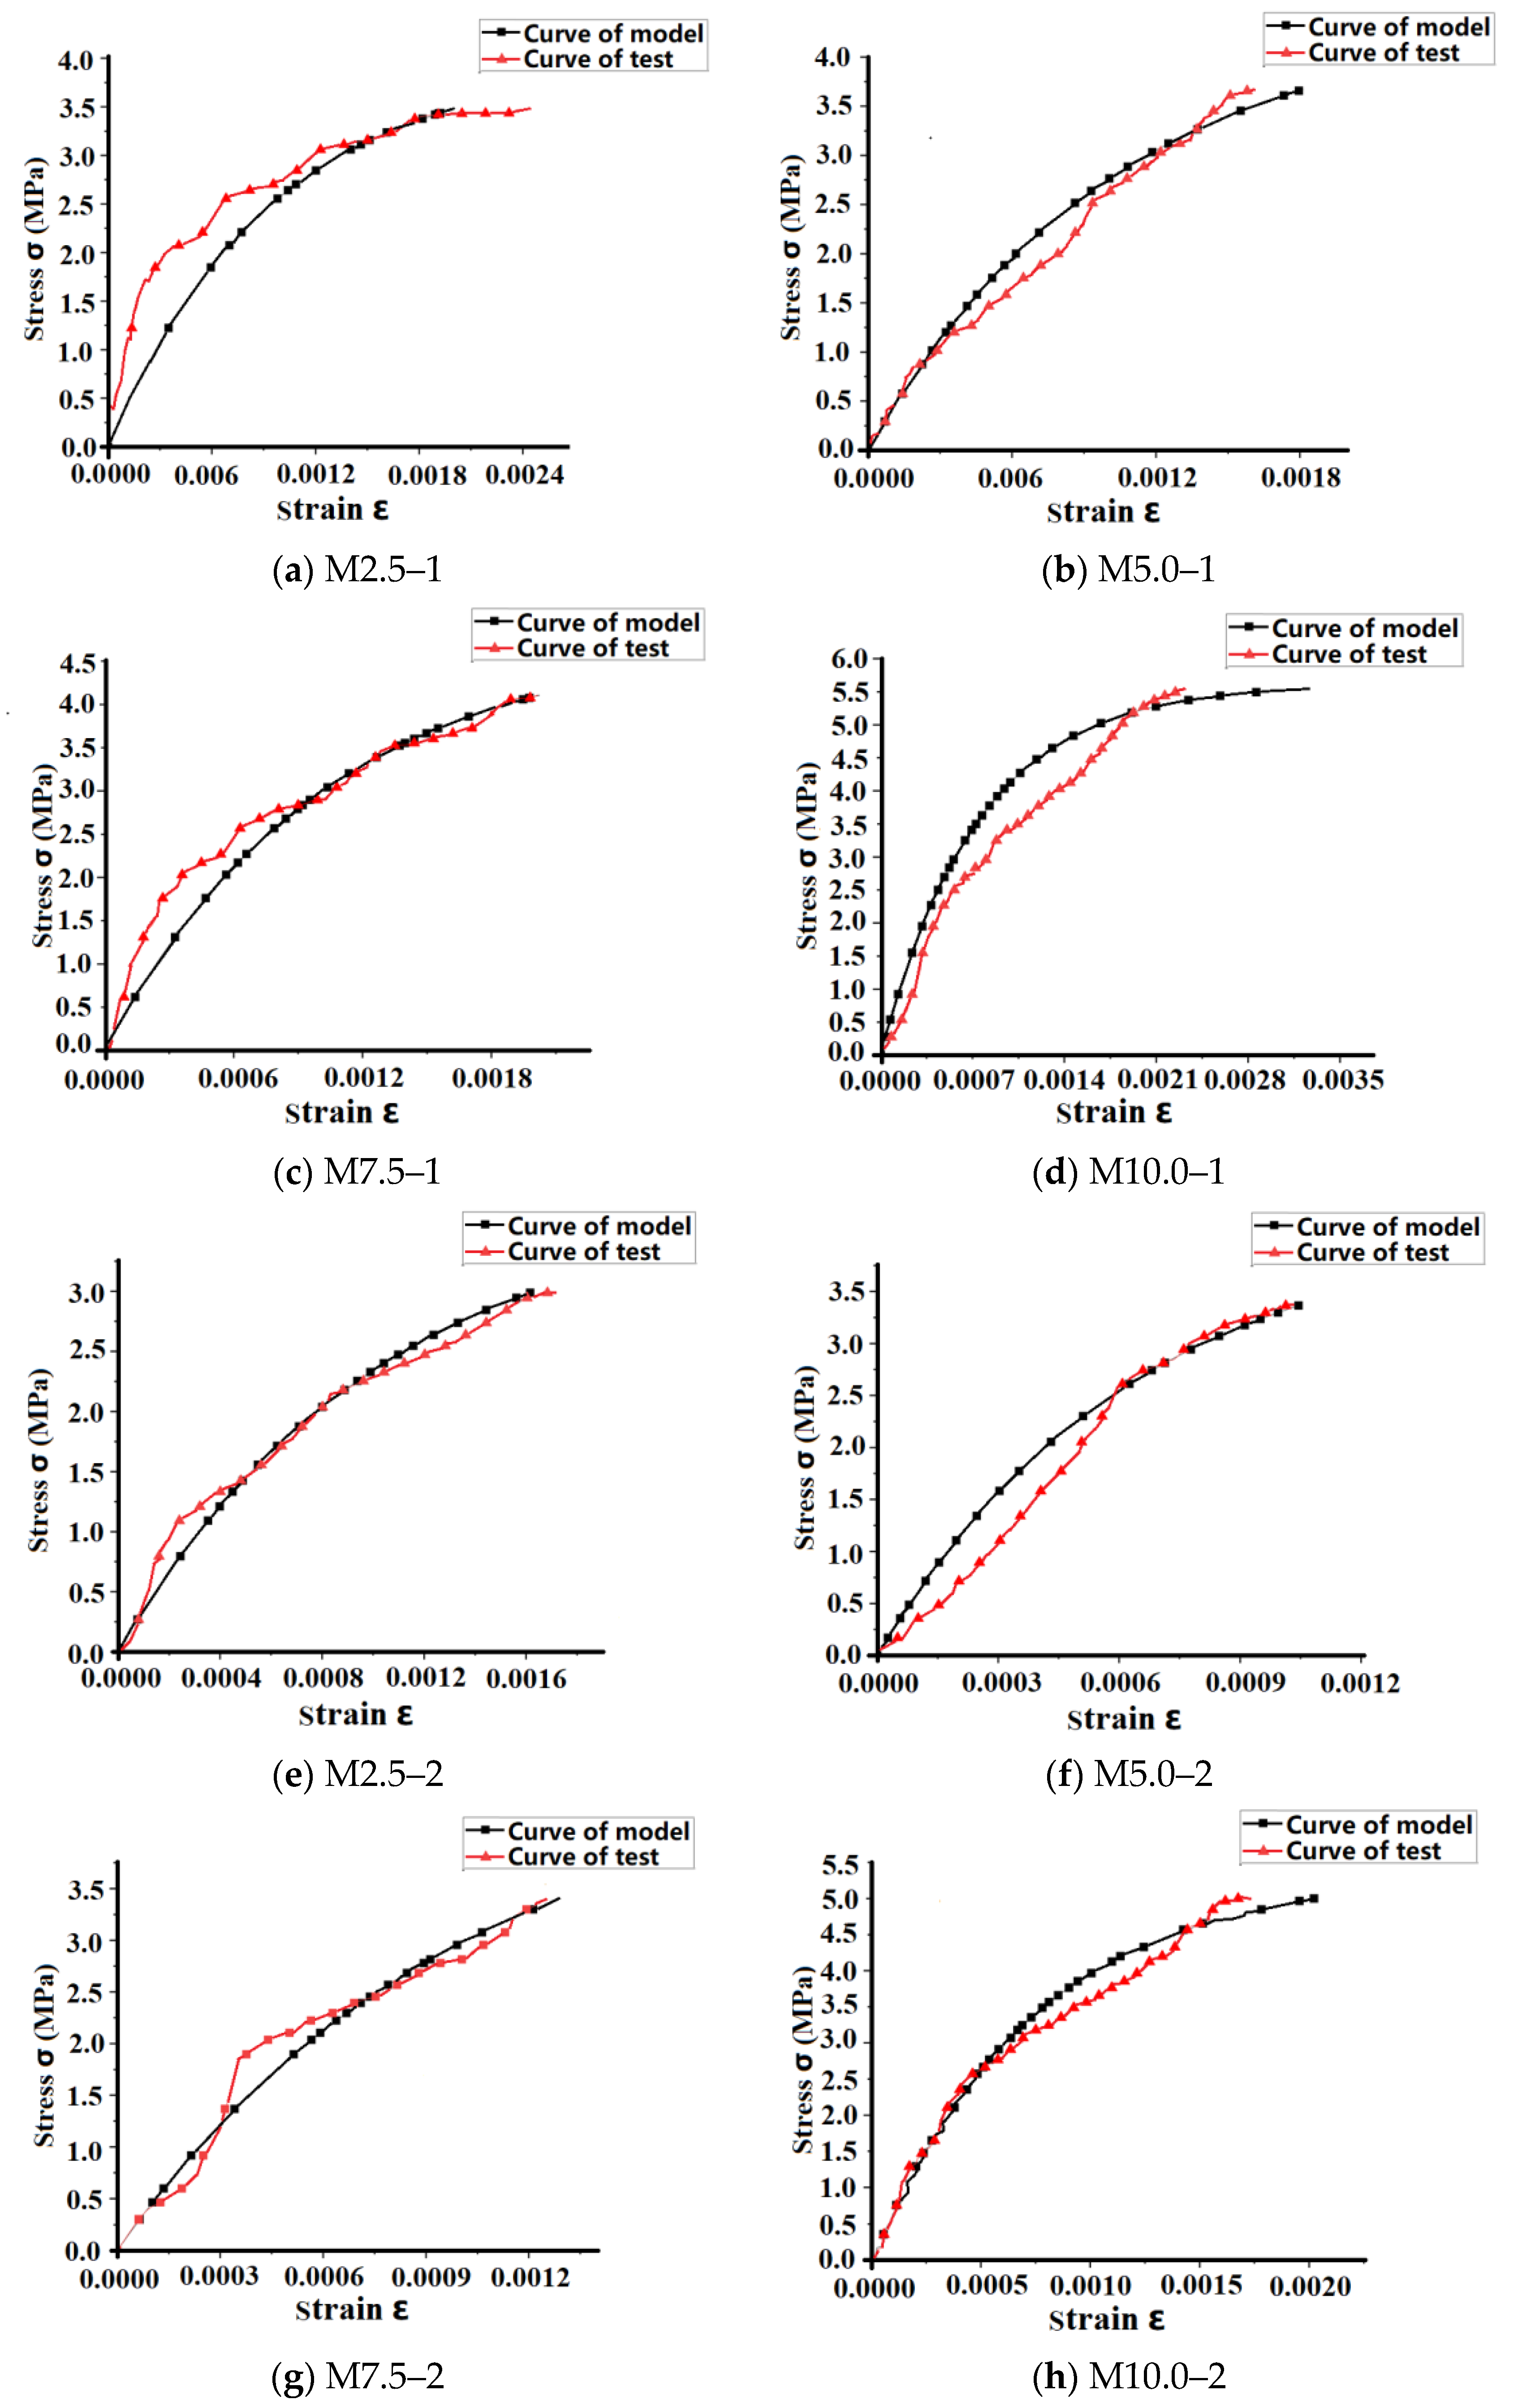
4.1. Comparison of Model Curves and Test Curves of Unreinforced Walls

The stress–strain relationship, as a basic indicator of masonry structures, is mainly linear, logarithmic, polynomial, and radical [29].
The most classical of which is the logarithmic formula
ε = 1.1 ξ ln 1 σ 1.1 f k
where ε represents strain; σ represents stress; ξ represents the elastic characteristic value related to block type and mortar strength, and ƒk represents the standard value of masonry compressive strength.
Since the ξ of Equation (1) cannot reflect the effect of block strength, Shi Chuxian proposed an improved stress–strain relationship based on this equation through research and analysis:
ε = 1 ξ f m ln 1 σ f m
The masonry structure compressive stress–strain curve equation is obtained by mathematically deriving the coefficient to be determined ξ = 460 from the above equation:
ε = 1 460 f m ln 1 σ f m
It can be seen from Equation (3) that when σ is infinitely close to ƒm, then ε tends to ∞. At this time, the masonry load reaches 80–90% of the damage load, and in actual engineering, such a masonry structure indicates that it is already in a dangerous state, so it is recommended that the strain obtained at σ = 0.9 be used as the ultimate strain sult of the masonry.
Calculate the average compressive strength of a brick wall.
f m = 0.78 f 1 0.5 1 + 0.07 f 2
Formula (4), ƒm is the average compressive strength of masonry; ƒ1 is the measured strength of brick, and ƒ2 is the measured strength of mortar.
The average value of compressive strength of unreinforced strong walls in this test was obtained according to Equation (4), and the fitting function in origin software, as well as the nonlinear fitting function, were used to fit the parameters ξ applicable to this test, and the fitting results are shown in Table 3.
Table 3 shows the fitted stress–strain equations for unreinforced walls, where the parameter ξ is expressed as the elastic characteristic value related to the strength of Dalun brick and mortar, according to Table 3. The assessment of the regression equations’ fit, indicated by coefficients R2, reveals that over 90% of the fitted stress–strain equations for unreinforced walls can be accounted for by the established relationships among the factors. This highlights a high degree of goodness of fit for the regression equations. Simultaneously, it demonstrates that this regression equation elucidates 90% of the total variation, affirming the high accuracy and effectiveness of the proposed regression equation.
The average compressive strength and elastic characteristic values of the brick wall were substituted into Equation (2) to calculate the fitted model stress–strain curve, and the test stress–strain curve was compared with the model stress–strain curve, and the results are shown in Figure 17.
Figure 17a–d shows the model stress–strain curves and test stress–strain curves for unreinforced vacant bucket walls M 2.5, M 5.0, M 7.5, and M 10.0 in a dry environment, respectively. Figure 17e–h a denotes the model stress–strain curves and the test stress–strain curves of unreinforced empty bucket walls M 2.5, M 5.0, M 7.5, and M 10.0 in a wet environment, respectively, and it can be seen that the model curves and the fit coefficients are above 0.90.

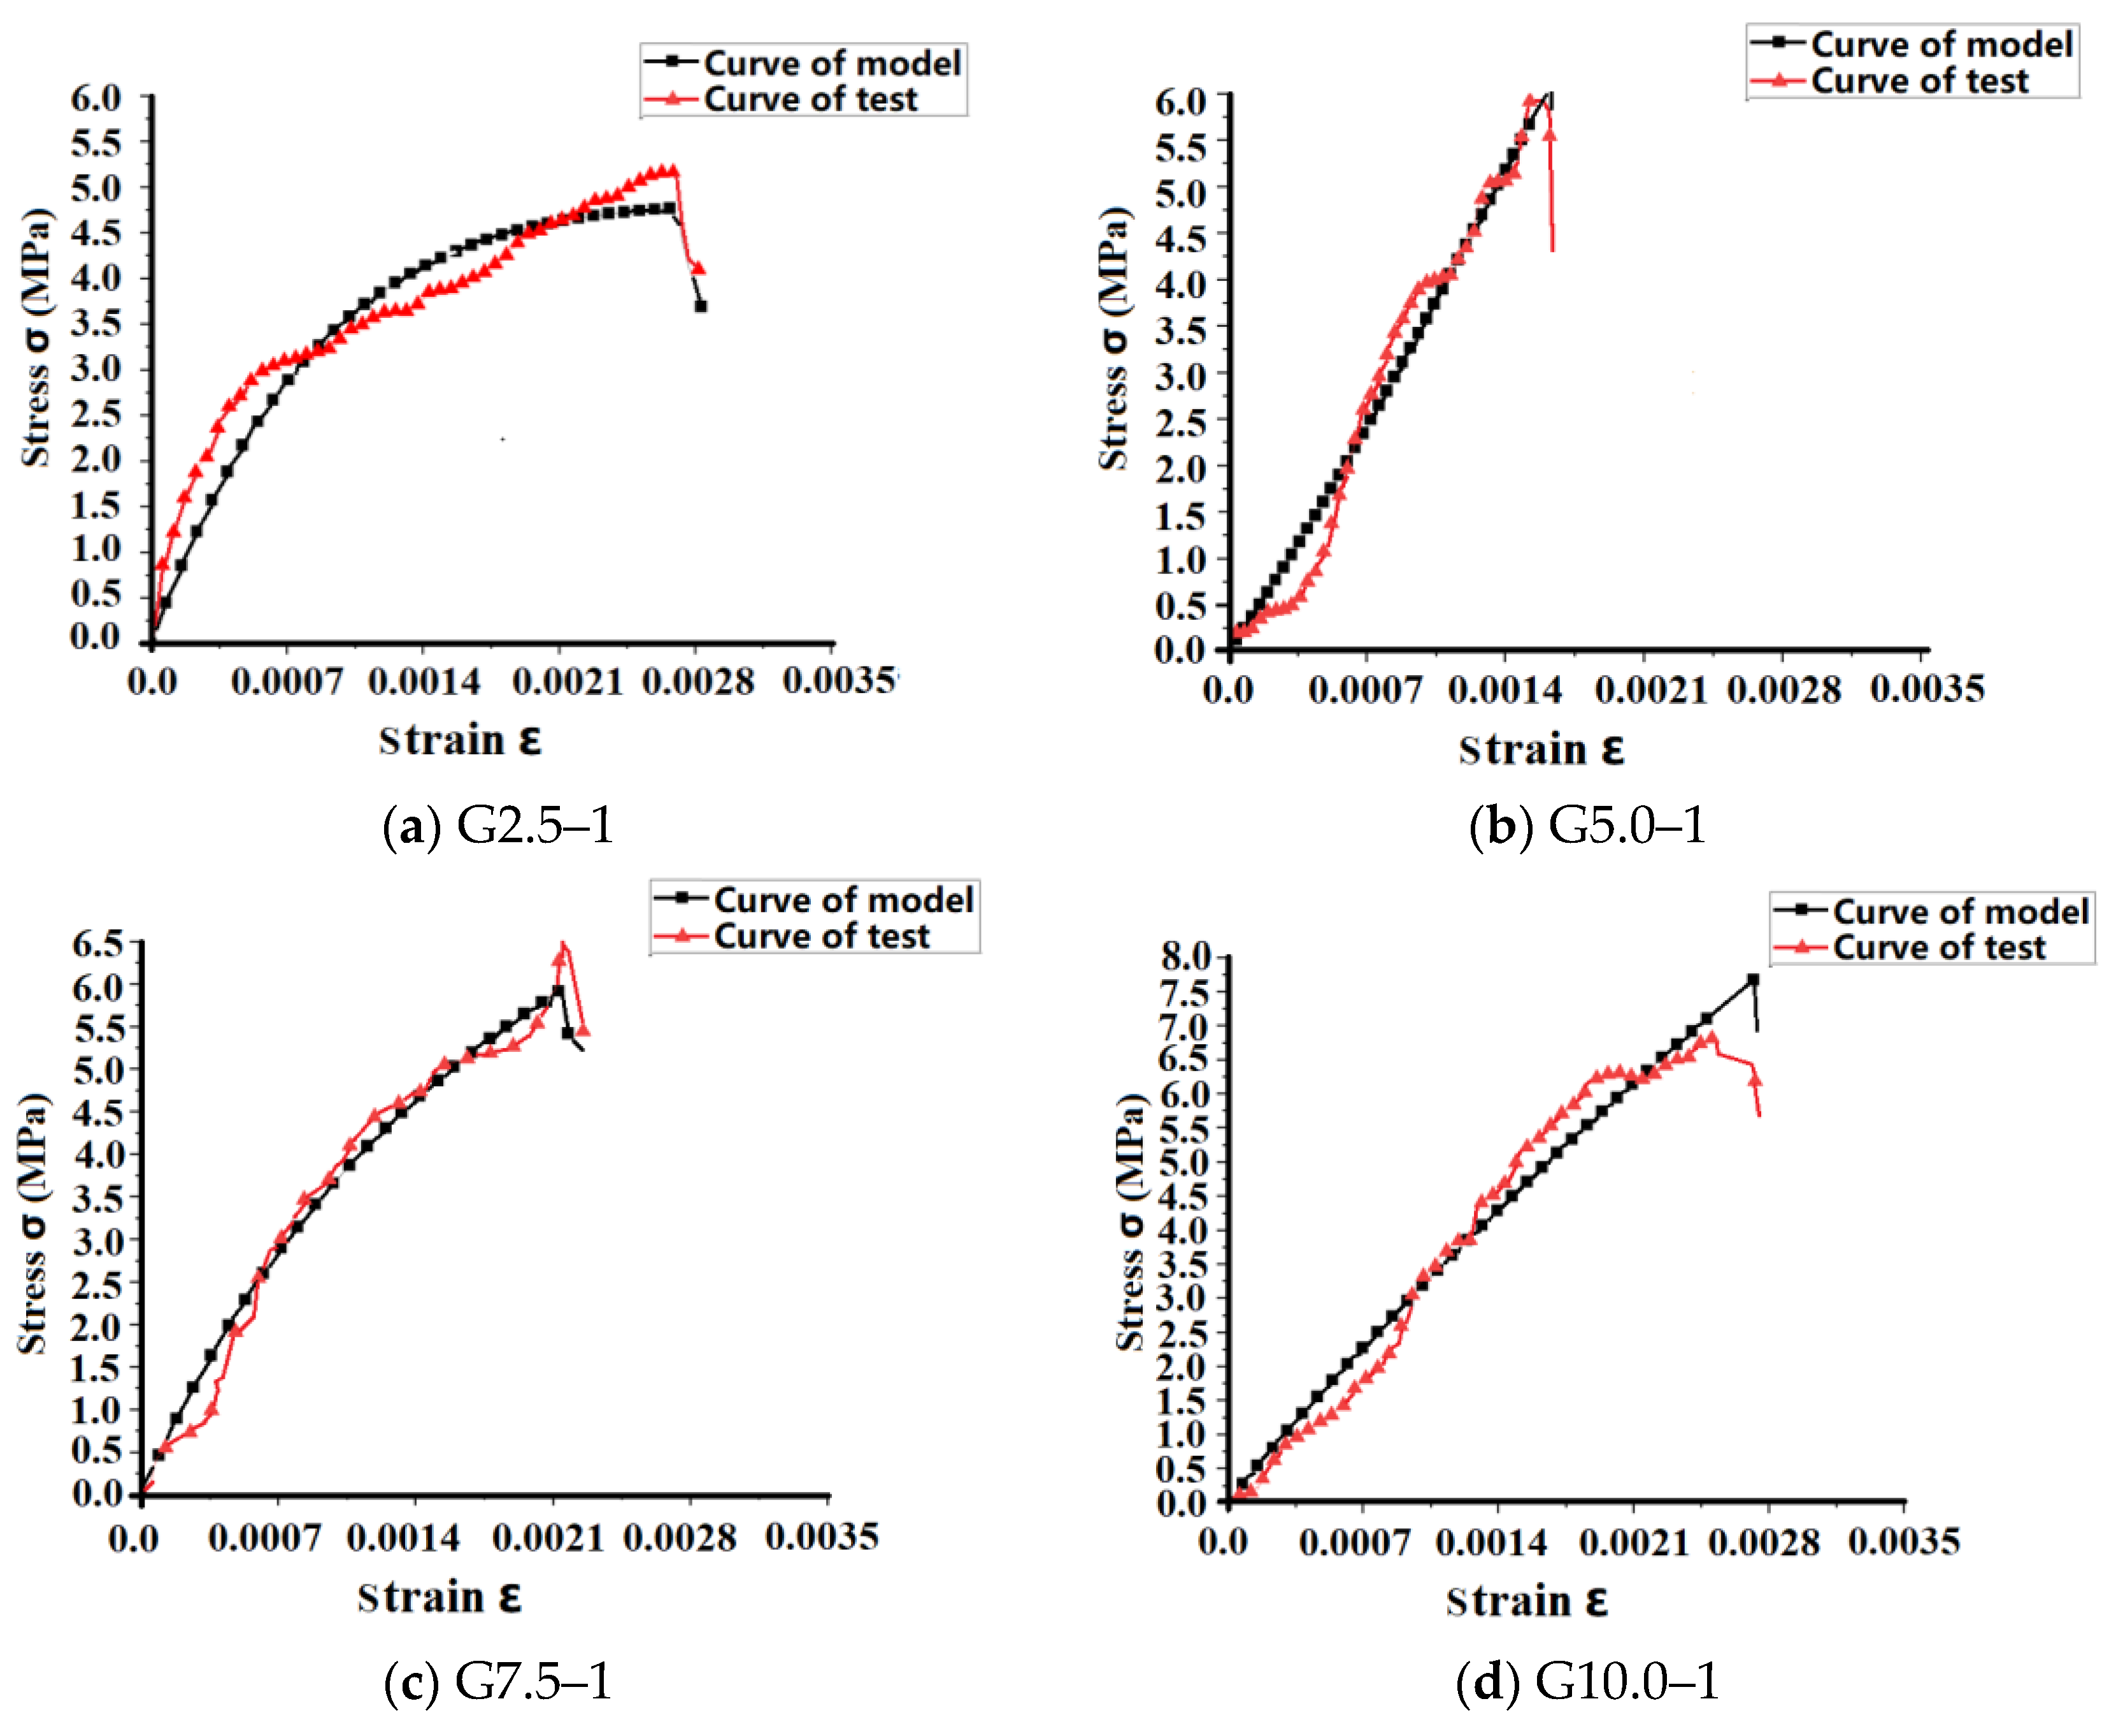
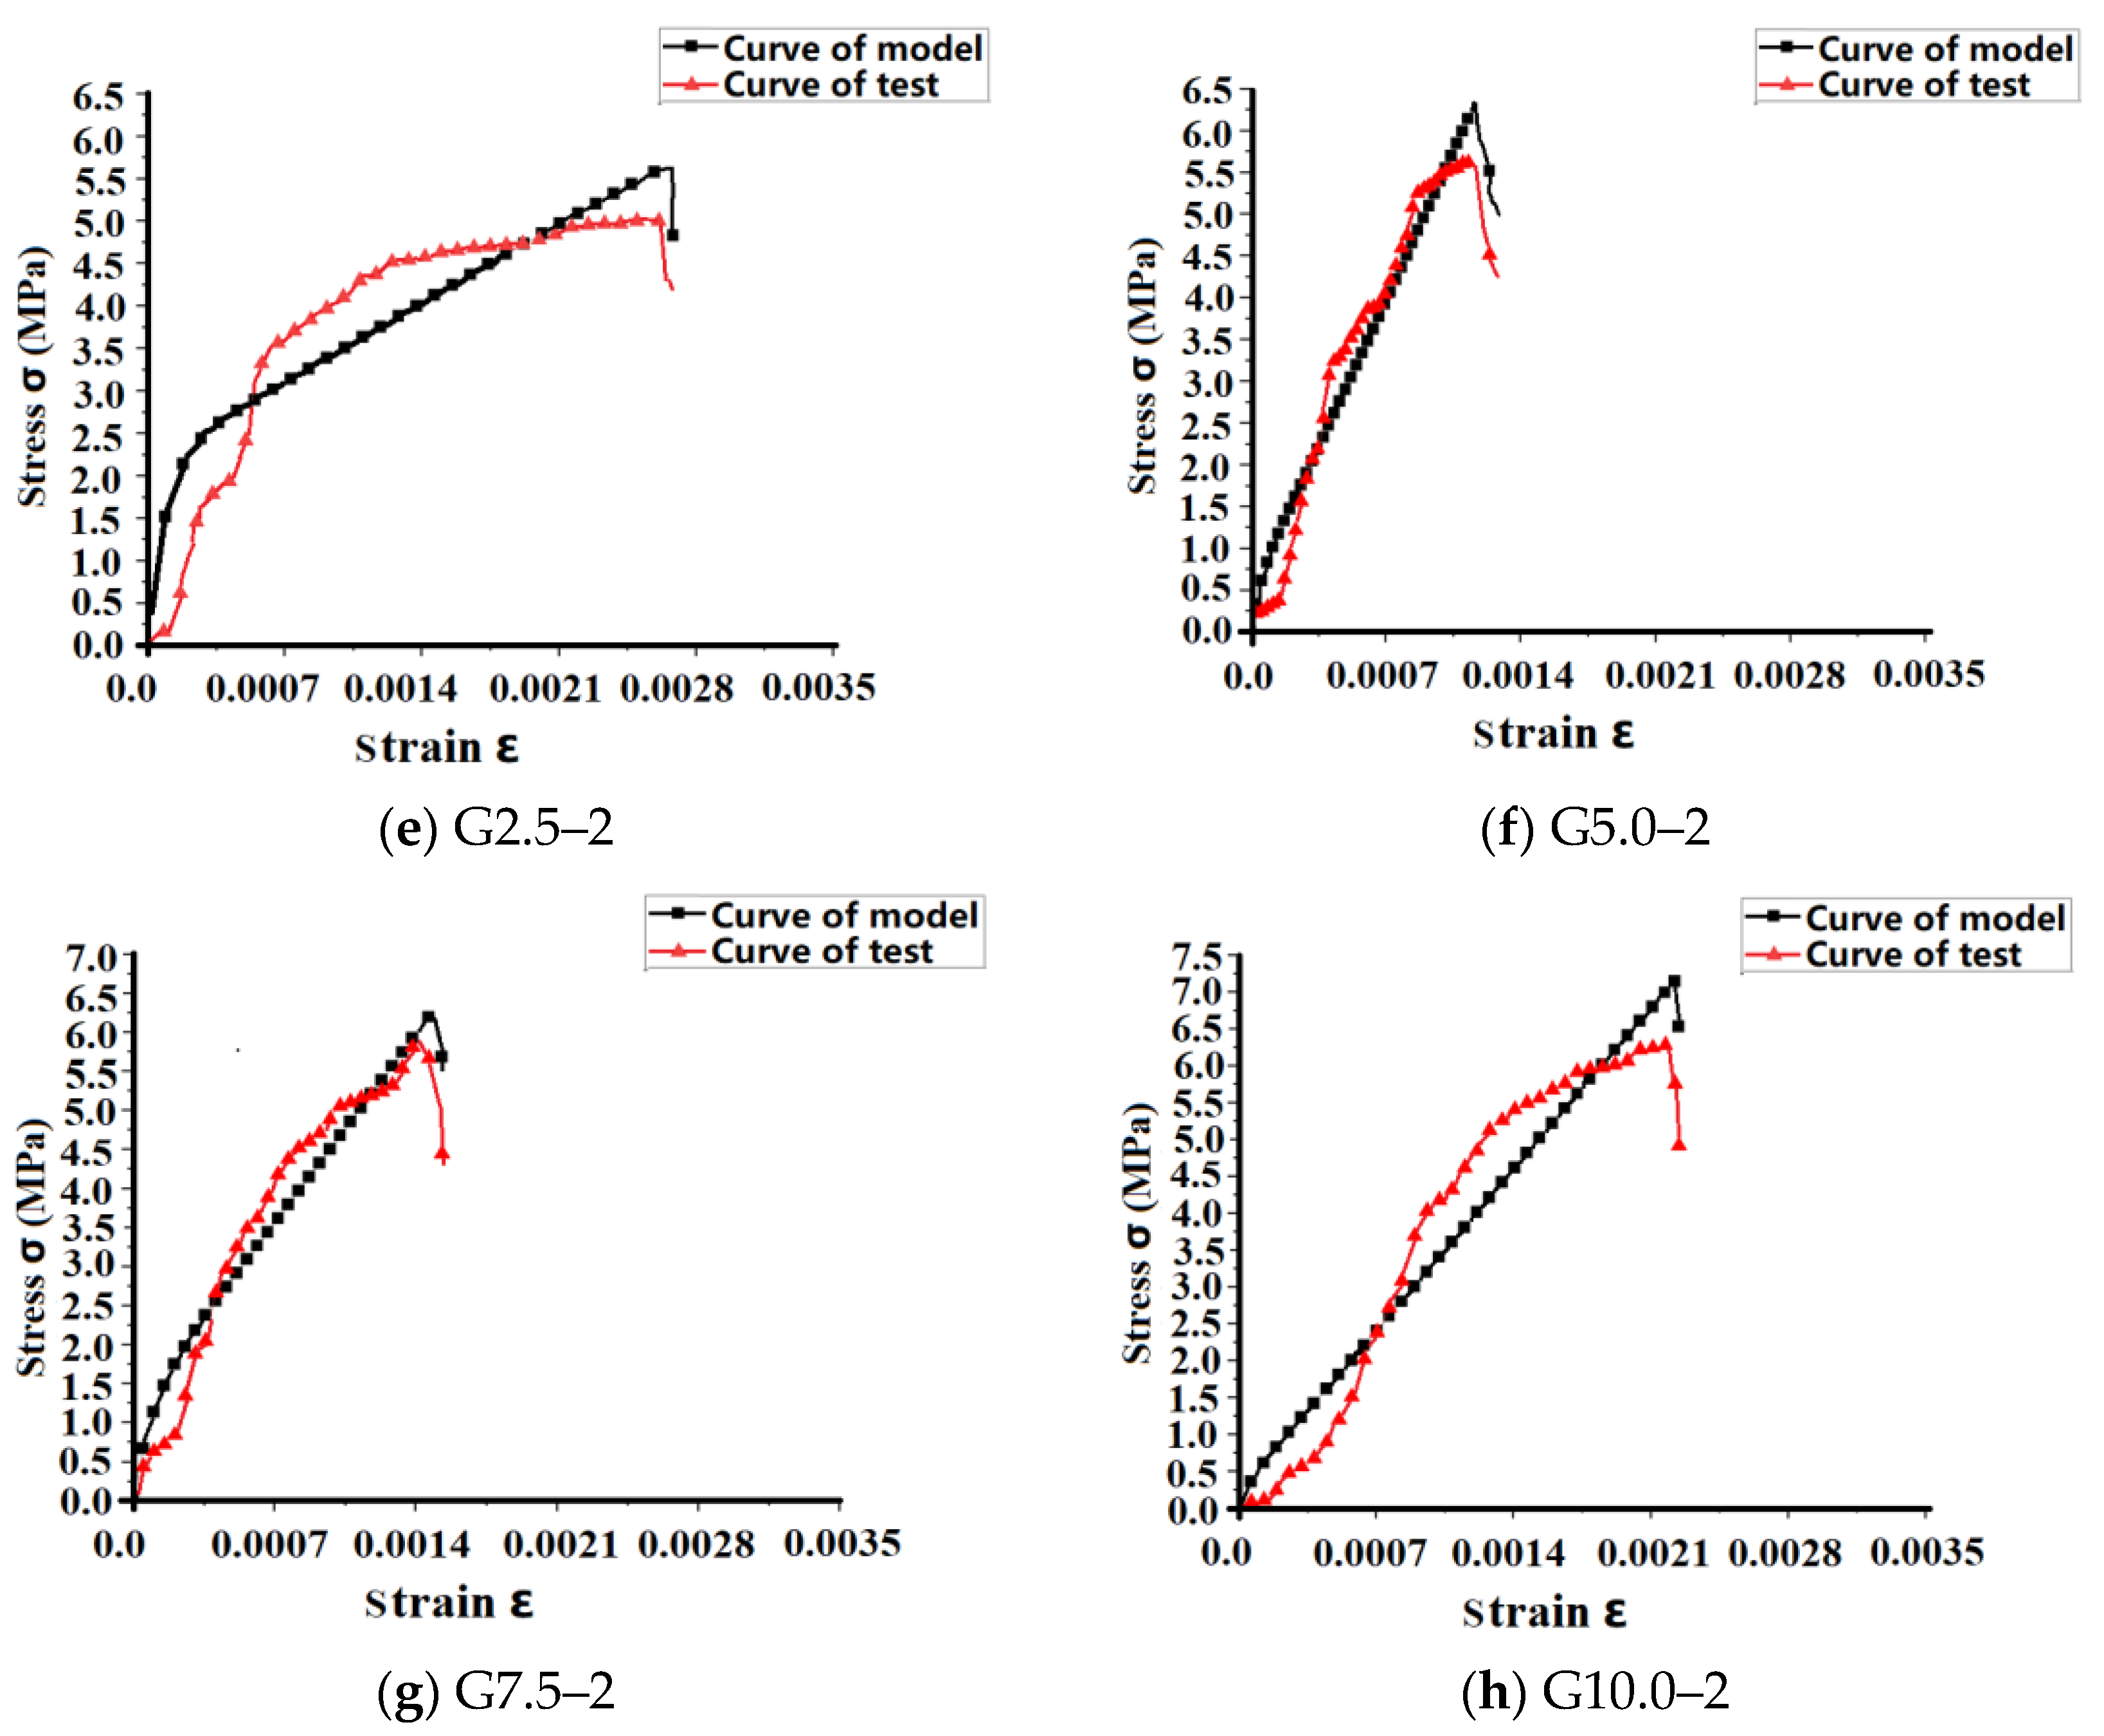
4.2. Stress–Strain Analysis of Reinforced Empty Bucket Wall

Currently, a prevailing method for calculating the bearing capacity of reinforced brick walls, both domestically and internationally, involves directly adding the bearing capacity of the reinforced material to that of the cavity wall. This approach results in considering the reinforced wall as a unified structure comprising the cavity wall and the masonry of the reinforced material [30].
As a result, Formula (5) can be derived, indicating the integration of the bearing capacities of the cavity wall and the reinforced material.
σ g = k 1 σ 1 + k 2 σ 2
where σg denotes the stress of the reinforced empty bucket wall (MPa); σ1 denotes the stress of the unreinforced empty bucket wall (Mpa); σ1 is obtained from the deformation of Equation (2), that is σ 1 = f m 1 e ξ × ε × f m ; k1 denotes the correction factor of the unreinforced empty bucket wall; k2 denotes the correction factor of the reinforced material; σ2 denotes the stress of the reinforced material (Mpa); σ2 is σ 2 = f c a ε ε 0 + 3 2 a × ε ε 0 2 + a 2 × ε ε 0 3 , where ƒc denotes the axial compressive strength of the reinforcement; ε denotes the strain of the reinforcement; ε0 denotes the strain corresponding to the peak stress of the reinforcement, and a denotes the relationship between the axial compressive strength of the reinforcement and the fiber volume ratio of the reinforcement.
a = 5.32268 0.23777 f c 0.77875 + 0.54711 λ p f + 1.05199 λ s f λ p f , where ƒc denotes the axial compressive strength of the reinforcement; λsf denotes the steel fiber volume rate, and λpf denotes the PVA fiber volume rate.
The data of the reinforced empty bucket wall obtained from the test were substituted into Equation (5) and fitted to obtain the corresponding model equation for each strength level of the reinforced empty bucket wall, and the fitting results are shown in Table 4.
Table 4 shows the fitted stress–strain equations for the reinforced walls, where the parameters k1 and k2 represent the correction coefficients for the unreinforced walls and the reinforced materials, according to Table 4. To evaluate the degree of fit of the regression equations above 0.97, it is determined by the coefficients R2. It is shown that more than 97% of the fitted stress–strain equations for unreinforced walls can be explained by the fitted relationships between the above factors, indicating a high degree of goodness of fit of the regression equations. At the same time, it can be proved that this regression equation explains 97% of the total variation. So, the accuracy of the proposed regression equation is high and effective.
Table 4 displays the fitted stress–strain equations for the reinforced walls, where the parameters k1 and k2 represent the correction coefficients for the unreinforced walls and the reinforced materials, as outlined in Table 4. The assessment of the regression equations’ fit, indicated by coefficients R2, reveals that over 90% of the fitted stress–strain equations for unreinforced walls can be accounted for by the established relationships among the factors. This highlights a high degree of goodness of fit for the regression equations. Simultaneously, it demonstrates that this regression equation elucidates 90% of the total variation, affirming the high accuracy and effectiveness of the proposed regression equation.
The test data were substituted into the equations in Table 4, and the resulting model stress–strain curves of the reinforced walls were compared with the test stress–strain curves obtained from the tests, and the results are shown in Figure 18.
Figure 18a–d shows the model stress–strain curves and the test stress–strain curves of reinforced empty bucket walls G 2.5, G 5.0, G 7.5, and G 10.0 in a dry environment, respectively. Figure 18e–h shows the model stress–strain curves and the test stress curves of reinforced empty bucket walls G 2.5, G 5.0, G 7.5, and G 10.0 in a wet environment, respectively. Figure 18f–h shows the model stress–strain curves and the test stress–strain curves of reinforced empty bucket walls G 2.5, G 5.0, G 7.5, and G 10.0 under a wet environment, respectively. The error primarily arises from simplifying the model by opting for a linear model instead of capturing a nonlinear relationship accurately. Alternatively, using a straightforward nonlinear model instead of a more complex one can lead to inaccuracies in representing the model relationship. However, the overall trend can be seen that the model curves and the test curves match very well, and the fitting coefficients are all above 0.97.

5. Discussion

The empty bucket wall in China is recognized as a typical masonry structure due to its ease of construction, material efficiency, and widespread use. However, this study acknowledges limitations in exploring the shear and seismic performance, emphasizing the need for further in-depth research, especially in earthquake-prone regions like China. This discussion notes that this research is a basic introduction to hybrid fiber and suggests the necessity for more detailed examinations of its specific performance through additional experimental research.
Moreover, this study highlights the masonry technique used in the test (air hopper without sleep) and suggests investigating the impact of different masonry types on the empty bucket wall in future studies. Lastly, regarding the reinforcement study, this discussion proposes exploring the thickness of the reinforcement layer as a variable to determine the optimal thickness, providing valuable insights for practical projects in the future.

6. Conclusions

This paper explores the compressive properties of empty bucket walls constructed with Dalun bricks unique to southern Zhejiang. This study investigates changes in compressive properties for masonry mortar strength grades (M 2.5, M 5.0, M 7.5, M 10.0) after curing in both wet and dry environments. Subsequently, it delves into the compressive properties of walls reinforced with hybrid fibers across different strength classes. Additionally, this research extends to the compressive testing of small cubic test blocks with various masonry mortar strengths (M 1.0, M 2.5, M 5.0, M 7.5, and M 10.0) after curing in dry, humid, and underwater environments (0 m, 1 m, and 2 m). This paper draws pertinent conclusions from these comparisons.
The cracking load and damage load of unreinforced empty bucket walls maintained in a humid environment are smaller than those of empty bucket walls maintained in a dry environment. The horizontal displacement of unreinforced empty bucket walls maintained in a dry environment is generally larger than their horizontal displacement maintained in a humid environment; the strength size of masonry mortar has a certain influence on the bearing capacity of empty bucket walls; the influence of humid environment on the cracking load of unreinforced empty bucket walls is larger than their damage load; the compressive strength of empty bucket walls is generally lower than the strength of Dalun bricks.
The cracking load and damage load of the reinforced bucket wall maintained in a humid environment are smaller than those of the bucket wall maintained in a dry environment; the reinforced bucket wall generally has a slight outward bulge under the vertical load; the effect of the humid environment on the cracking load of the reinforced bucket wall is larger than that of its damage load.
Following the reinforcement of the empty bucket wall, both its cracking and damage loads experienced significant increases, with the rate of cracking load increase surpassing that of damage load. Moreover, in a wet environment, the reinforcement led to a higher increase rate in both cracking load and damage load compared to maintenance in a dry environment. The introduction of mixed fibers notably enhances wall reinforcement, improving energy dissipation, bearing capacity, stiffness, and ductility to a certain extent. Additionally, mixed fibers exhibit better adhesion to the brick wall, suggesting feasibility in future practical engineering.
By comparing the compressive properties and their stress–strain curves of empty bucket walls maintained in dry and wet environments before and after reinforcement, the relevant characteristic values of unreinforced empty bucket walls of different strength classes were fitted, and the test stress–strain curves of unreinforced empty bucket walls were compared with the theoretical stress–strain curves of the formula model, and the test stress–strain curves of reinforced empty bucket walls were compared with the model stress–strain curves. The trends were in good agreement, which proved the accuracy of the tests.

Author Contributions

Conceptualization, R.D., F.Y. and J.L.; methodology, R.D., J.L. and F.Y.; investigation, R.D. and Y.C.; validation, R.D.; funding acquisition, R.D. and L.S.; writing—review and editing, R.D. and L.S.; data curation, Y.C.; writing—original draft preparation, Y.C.; resources, L.S.; supervision, L.S., F.Y. and J.L. All authors have read and agreed to the published version of the manuscript.

Funding

Financial support from the National Natural Science Foundation of China NSFC(NO.51878511); Major Science and Technology Projects in Zhejiang Province (NO.2011C13013).

Institutional Review Board Statement

Not applicable.

Informed Consent Statement

Not applicable.

Data Availability Statement

Data are contained within the article.

Conflicts of Interest

The authors declare no conflicts of interest. The funding sponsors had no role in the design of the study; in the collection, analyses, or interpretation of data; in the writing of the manuscript, and in the decision to publish the results.

References

  1. Zhu, R. The research of Seismic Strengthening Design Method of the Traditional Dwelling in the Rowlock Wall according to the Original Architectural Style and Features; Xi’an University of Architecture and Technology: Xi’an, China, 2017. [Google Scholar]
  2. Li, X.; Tang, W.; Zhang, Q.; Sun, L.; Jin, G.; Ye, Q. Test study lateral resistance behavior of row lock wall. J. Nat. Disasters 2010, 19, 8–12. [Google Scholar]
  3. Lei, M. Study on Seismic Behavior of Row Lock Wall and Row Lock Wall Strengthened with HPFL; Hunan University: Changsha, China, 2013. [Google Scholar]
  4. Wang, Z.; LI, X.; Gao, R.; Zhang, Y.; Xu, Q. Experimental research on seismic performance of brick walls strengthened by fiber-reinforced cement-based composite material surface layer. Build. Struct. 2021, 51, 17–25+16. [Google Scholar]
  5. Niu, L.; Zheng, S.; Li, L. Experimental study on the seismic behavior of masonry walls under offshore environment. Structures 2020, 28, 433–445. [Google Scholar] [CrossRef]
  6. Zhou, Y. Mechanical properties and seismic behavior of confined masonry walls in freeze-thaw environment. Structures 2021, 31, 647–659. [Google Scholar] [CrossRef]
  7. Luo, C.; Huang, Y. Experimental study on brick masonry columns strengthened with GFRP sheet under axial compression. Civ. Eng. Fujian Univ. Technol. 2013, 11, 19–23. [Google Scholar]
  8. Werasak, R.; Meng, J.; Ratchaneewan, K. Behaviors of Historic Masonry Walls Retrofitted with GFRP under Axial Load. Adv. Mater. Res. 2010, 133, 959–964. [Google Scholar]
  9. Tarek, A.; Yousef, A.-S. Behavior of FRP strengthened infill walls under in-plane seismic loading. J. Compos. Constr. 2007, 11, 308–318. [Google Scholar]
  10. Guerreiro, J.; Proença, J.; Ferreira, J.G.; Gago, A. Experimental characterization of in-plane behavior of old masonry walls strengthened through the addition of CFRP-reinforced render. Compos. Part B 2018, 148, 14–26. [Google Scholar] [CrossRef]
  11. Zhang, Z. Experimental Study on the Compressive Performance of Reclaimed Concrete Hollow Block Wall; Changsha University of Science and Technology: Changsha, China, 2018. [Google Scholar]
  12. Wu, H.; Chun, Y.; Xie, X.; Zhang, T.; Li, Q.; Li, C. Experimental study of EPS concrete block wall compressive strength. N. Build. Mater. 2018, 45, 103–108. [Google Scholar]
  13. Bu, L.; Ma, Y. Section stiffness calculation of the RC beams strengthened with PVA-ECC steel mesh. J. Railw. Sci. Eng. 2017, 14, 514–519. [Google Scholar]
  14. Li, P. Experimental study on the performance of CFRP-strengthened masonry structures under debris flow impacts. Structures 2021, 31, 602–612. [Google Scholar] [CrossRef]
  15. Li, T. Performance of axially loaded masonry columns confined using textile reinforced concrete (TRC) added with short fibers. Constr. Build. Mater. 2021, 279, 122413. [Google Scholar] [CrossRef]
  16. Cheng, S.; Yin, S.; Lei, J. Comparative experimental analysis on the in-plane shear performance of brick masonry walls strengthened with different fiber-reinforced materials. Constr. Build. Mater. 2020, 259, 12087. [Google Scholar] [CrossRef]
  17. Dong, Z. Strengthening of unreinforced masonry walls against out-of-plane loads using carbon textile reinforced mortar optimized by short PVA fibers. Eng. Struct. 2021, 227, 111433. [Google Scholar] [CrossRef]
  18. Zhang, H. Load Capacity and Displacement of Recycled Concrete and Self-Insulation Block Masonry Wall. Materials 2020, 13, 863. [Google Scholar] [CrossRef]
  19. Zhen, W.; Yan, F.; Zhang, P.; Wang, Y. Experimental study on the load capacity of brick wall strengthened with concrete splint under axial compression. J. Harbin Inst. Technol. 2018, 50, 145–151. [Google Scholar]
  20. Wang, H.; Wang, F.; Qian, D. Investigation of damage mechanisms related to microstructural features of ferrite-cementite steels via experiments and multiscale simulations. Int. J. Plast. 2023, 170, 103745. [Google Scholar] [CrossRef]
  21. Wang, Y.; Lou, M.; Wang, Y. Stochastic failure analysis of reinforced thermoplastic pipes under axial loading and internal pressure. China Ocean. Eng. 2022, 36, 614–628. [Google Scholar] [CrossRef]
  22. Mansour, W.; Wang, P. Experimental and numerical evaluations of the shear performance of recycled aggregate RC beams strengthened using CFRP sheets. Eng. Struct. 2024, 301, 117368. [Google Scholar] [CrossRef]
  23. GB/T 5101-2017; Fired Common Bricks. China National Standardization Administration: Beijing, China, 2017.
  24. JGJ/T 70-2009; Standard for Test Method of Performance on Building Mortar. China National Standardization Administration: Beijing, China, 2009.
  25. GB/T 14684-2011; Sand for Construction. China National Standardization Administration: Beijing, China, 2011.
  26. GB/T 50081–2002; Standard for Test Method of Mechanical Properties on Ordinary Concrete. China National Standardization Administration: Beijing, China, 2002.
  27. GB 50924-2014; Code for Construction of Masonry Structures Engineering. China National Standardization Administration: Beijing, China, 2014.
  28. GB/T 50129-2011; Standard Test Method for Basic Mechanical Properties of Masonry. China National Standardization Administration: Beijing, China, 2011.
  29. GB 50003-2011; Code for the Design of Masonry Structures. China National Standardization Administration: Beijing, China, 2011.
  30. Hao, Q. Study Onconstitutive Modelofs Teel-Pvahybrid Fiber Cementltious Composites; Wenzhou University: Wenzhou, China, 2017. [Google Scholar]
Figure 1. Test materials.
Buildings 14 00383 g001
Figure 2. Empty Bucket Wall.
Buildings 14 00383 g002
Figure 3. Schematic diagram of specimen size.
Buildings 14 00383 g003
Figure 4. Wall masonry process.
Buildings 14 00383 g004
Figure 5. Wall under maintenance.
Buildings 14 00383 g005
Figure 6. Reinforced wall in maintenance.
Buildings 14 00383 g006
Figure 7. Experimental apparatus.
Buildings 14 00383 g007
Figure 8. Multifunctional testing machine.
Buildings 14 00383 g008
Figure 9. Layout of measuring points.
Buildings 14 00383 g009
Figure 10. Unreinforced Walls crack distribution Wall crack distribution.
Buildings 14 00383 g010aBuildings 14 00383 g010bBuildings 14 00383 g010c
Figure 11. Load-horizontal displacement curve of unreinforced bucket wall.
Buildings 14 00383 g011aBuildings 14 00383 g011b
Figure 12. Load-vertical displacement curve of unreinforced bucket wall.
Buildings 14 00383 g012
Figure 13. Reinforced Walls crack distribution Wall crack distribution.
Buildings 14 00383 g013aBuildings 14 00383 g013bBuildings 14 00383 g013c
Figure 14. Load-horizontal displacement curve of reinforced empty bucket wall.
Buildings 14 00383 g014aBuildings 14 00383 g014b
Figure 15. Load-vertical displacement curve of reinforced bucket wall.
Buildings 14 00383 g015
Figure 16. Compression results of empty bucket wall under different maintenance environments. Note: The end number is 1 for dry environment maintenance; the end number is 2 for wet environment maintenance.
Buildings 14 00383 g016
Figure 17. Comparison of the model curve and test curve of the unreinforced wall.
Buildings 14 00383 g017
Figure 18. Comparison of the model curve of the reinforced wall and test curve.
Buildings 14 00383 g018aBuildings 14 00383 g018b
Table 1. Mix proportions of masonry mortar.
Strength RatingCement (Kg/m3)Lime (Kg/m3)Sand (Kg/m3)Water (Kg/m3)Viscosity (mm)
M2.51403081904380–40070–90
M5.21621621393.2290–31070–90
M7.51851111239.5250–27070–90
M10.0290871595330–35070–90
Table 2. Compressive results of masonry mortar cube specimens.
Specimen Number7 Days14 Days28 DaysViscosity (mm)
M2.51.251.331.5070–90
M5.22.813.213.8070–90
M7.55.356.406.5070–90
M10.06.918.519.4370–90
Table 3. Fitting results of unreinforced walls.
Specimen NumberExpressionsParameters ξR2
M2.5–1 ε = 1 533 3.95 ln 1 σ 3.95 532.773170.90937
M5.0–1 ε = 1 462 4.43 ln 1 σ 4.43 462.337620.94791
M7.5–1 ε = 1 450 4.76 ln 1 σ 4.76 449.82970.96613
M10.0–1 ε = 1 568 5.61 ln 1 σ 5.61 567.517330.90812
M2.5–2 ε = 1 497 3.78 ln 1 σ 3.78 496.688080.98813
M5.0–2 ε = 1 770 4.17 ln 1 σ 4.17 770.362360.95114
M7.5–2 ε = 1 470 4.66 ln 1 σ 4.66 470.235280.96958
M10.0–2 ε = 1 589 5.34 ln 1 σ 5.34 588.941620.90829
Table 4. Fitting results of a reinforced wall.
Specimen NumberExpressionsCoefficient
k1
Coefficient
k2
R2
G2.5–1 σ g = 1 . 48943 σ 1 0.01832 σ 2 1.48943−0.018320.99103
G5.0–1 σ g = 0 . 16704 σ 1 + 0.27472 σ 2 −0.167040.274720.9884
G7.5–1 σ g = 0 . 92364 σ 1 + 0.06444 σ 2 0.923640.064440.99585
G10.0–1 σ g = 0 . 16068 σ 1 + 0.16847 σ 2 0.160680.168470.99105
G2.5–2 σ g = 0 . 58048 σ 1 + 0.08771 σ 2 0.580480.087710.97671
G5.0–2 σ g = 0 . 12257 σ 1 + 0.33514 σ 2 0.122570.335140.98378
G7.5–2 σ g = 0 . 26491 σ 1 + 0.22585 σ 2 0.264910.225850.98443
G10.0–2 σ g = 0 . 052 σ 1 + 0.20587 σ 2 0.0520.205870.97709
Disclaimer/Publisher’s Note: The statements, opinions and data contained in all publications are solely those of the individual author(s) and contributor(s) and not of MDPI and/or the editor(s). MDPI and/or the editor(s) disclaim responsibility for any injury to people or property resulting from any ideas, methods, instructions or products referred to in the content.

