Article

Shear Bearing Capacity Prediction of Steel-Fiber-Reinforced High-Strength Concrete Corbels on Modified Compression Field Theory

1
School of Civil Engineering and Communication, North China University of Water Resources and Electric Power, Zhengzhou 450046, China
2
Engineering Technology Research Center for Structural Vibration Control and Health Monitoring of Henan Province, Zhengzhou 450046, China
*
Author to whom correspondence should be addressed.
Buildings 2024, 14(2), 388; https://doi.org/10.3390/buildings14020388
Submission received: 9 December 2023 / Revised: 16 January 2024 / Accepted: 19 January 2024 / Published: 1 February 2024
(This article belongs to the Section Building Materials, and Repair & Renovation)

Abstract

:
In order to analyze the shear mechanism of the steel-fiber high-strength concrete corbels, a calculation model for the shear bearing capacity of steel-fiber-reinforced high-strength concrete corbels was proposed based on the modified compression field theory. Considering the existence of residual tensile stress in steel-fiber-reinforced concrete at crack locations, the cracked steel-fiber-reinforced concrete was treated as a continuous material. The constitutive relation of cracked steel-fiber-reinforced concrete and the local stress equilibrium equation were modified. It was compared with the results of 34 steel-fiber high-strength concrete corbels, including those in this paper. The predicted results were compared with the experimental values and the predictions of the Fattuhi model, Campione model, and Russo model to validate the rationality of the proposed model. The results revealed that the mean value between the experimental values and the predicted results of the proposed model is 1.104, with a variance of 0.003, showing good agreement. The proposed model can accurately predict the shear bearing capacity of steel-fiber-reinforced high-strength concrete corbels.

1. Introduction

As cantilever support structures, reinforced concrete corbels are important vertical load-bearing components in practical engineering applications such as industrial plants and road bridges. The steel-fiber-reinforced high-strength concrete formed by incorporating steel fibers into high-strength concrete is a type of composite material that not only overcomes the drawbacks of poor ductility and brittleness of high-strength concrete [1,2], but it also enhances the cracking, tensile, and shear strength of concrete. The application in the corbels can effectively improve the shear performance and bearing capacity of the structure [3,4,5].
The internal stress state of corbels becomes complex under the action of loads, the presence of non-linear strain behavior, and significant stress redistribution across the section. They belong to the category of typical D-region members [6]. According to Saint-Venant’s principle [7], the D-region has the characteristics of discontinuity in a geometric structure or disturbances in the flow of forces, which are no longer suitable for design theory assumed by the plane section [8,9]. Khattab et al. [10] conducted experimental research on the corbels with different shear span ratios, and compared the test results with those calculated using the shear friction and strut-and-tie models specified in ACI 318-14 [11]. Malgorzata et al. [12] performed experiments on reinforced concrete corbels. By fitting and analyzing the test results, the formula for calculating the inclined crack of the corbels is proposed. Yang et al. [13] proposed a calculation method for predicting the shear carrying capacity of reinforced concrete corbels, which showed better predictive results compared to other existing models. Wael et al. [14] presented a reinforced concrete corbel bearing capacity calculation method based on the strut-and-tie model. The results indicated that the proposed strut-and-tie method provided sufficiently accurate predictions, leading to the conclusion that it offers safe and reliable approach for calculating the bearing capacity of corbels. Perceka et al. [15] made 10 high-strength steel-fiber concrete beams. Based on the observation results of the test results and the evaluation results of the previous shear strength equations, the prediction equation of the shear strength of steel-fiber concrete beams was proposed. Muhammad et al. [16] conducted pouring tests on 12 BFRP-reinforced concrete beams. In addition, based on the published experimental shear strength and test results of 217 FRP-RC beams without stirrup, the equation for predicting the contribution of concrete to the shear strength of FRP-RC beams was established with good accuracy. However, there is a limited amount of reported research on the calculation models and methods specifically used for steel-fiber-reinforced high-strength concrete corbels, and there is no unified calculation model and method for the calculation of its bearing capacity, which cannot meet the needs of practical engineering design. In 1986, Canadian scholars Vecchio and Collins [17] proposed the modified compression field theory (MCFT) based on the existing theory of the compression field, which considered the equilibrium, compatibility conditions, and the constitutive relationship of cracked concrete. MCFT has been widely recognized for the analysis of membrane, beam, plate, shell, and plane frames. Even the more complex structural analysis results are ideal, and it is also suitable for steel-fiber-reinforced concrete structures [18,19]. Gao et al. [20] and Zhang et al. [21], Zhu et al. [22], Lei et al. [23], used MCFT to study the shear capacity of reinforced steel-fiber concrete beam–column joints, steel-fiber high-strength concrete two-pile cap, and hybrid concrete deep beams, respectively. The results showed that the predicted shear strength is in good agreement with the experimental results. The modified pressure field theory takes into account the tensile stress of cracked concrete and determines the average stress, average strain, and crack angle according to the equilibrium conditions, compatibility conditions, and the stress–strain relationship between reinforced and cracked concrete. Finally, the shear bearing capacity of reinforced concrete members under the action of shear force can be obtained, which is more accurate and reasonable.
The current research proposes a model that calculates the shear bearing capacity of steel-fiber-reinforced high-strength concrete corbels based on MCFT. The proposed model considers the stress transfer of steel fiber as the crack corrects the constitutive relationship of steel-fiber-reinforced concrete, allowing for a better reflection of the shear behavior of steel-fiber-reinforced high-strength concrete corbels. It was used to predict the shear capacity of 31 specimens, including the specimens tested in this study. The predicted results were compared with the experimental results and simultaneously compared with calculation models proposed by other scholars to evaluate its accuracy.

2. Establishment of the Proposed Model

The modified compression field theory incorporates stress equilibrium conditions both between and within cracks, offering a comprehensive and practical theoretical framework, and includes the following aspects:
  • The shear stress and normal stress experienced by concrete micro-elements are uniformly distributed when subjected to loads.
  • The stress and strain of concrete refer to the average stress and strain in the cracking zone.
  • The principal stress and principal strain directions of concrete are consistent.
  • There is no bond slip between steel bars and concrete, assuming ideal bond conditions.
  • Shear stress in steel bars is not considered: only the axial stress in the steel bars is taken into account.

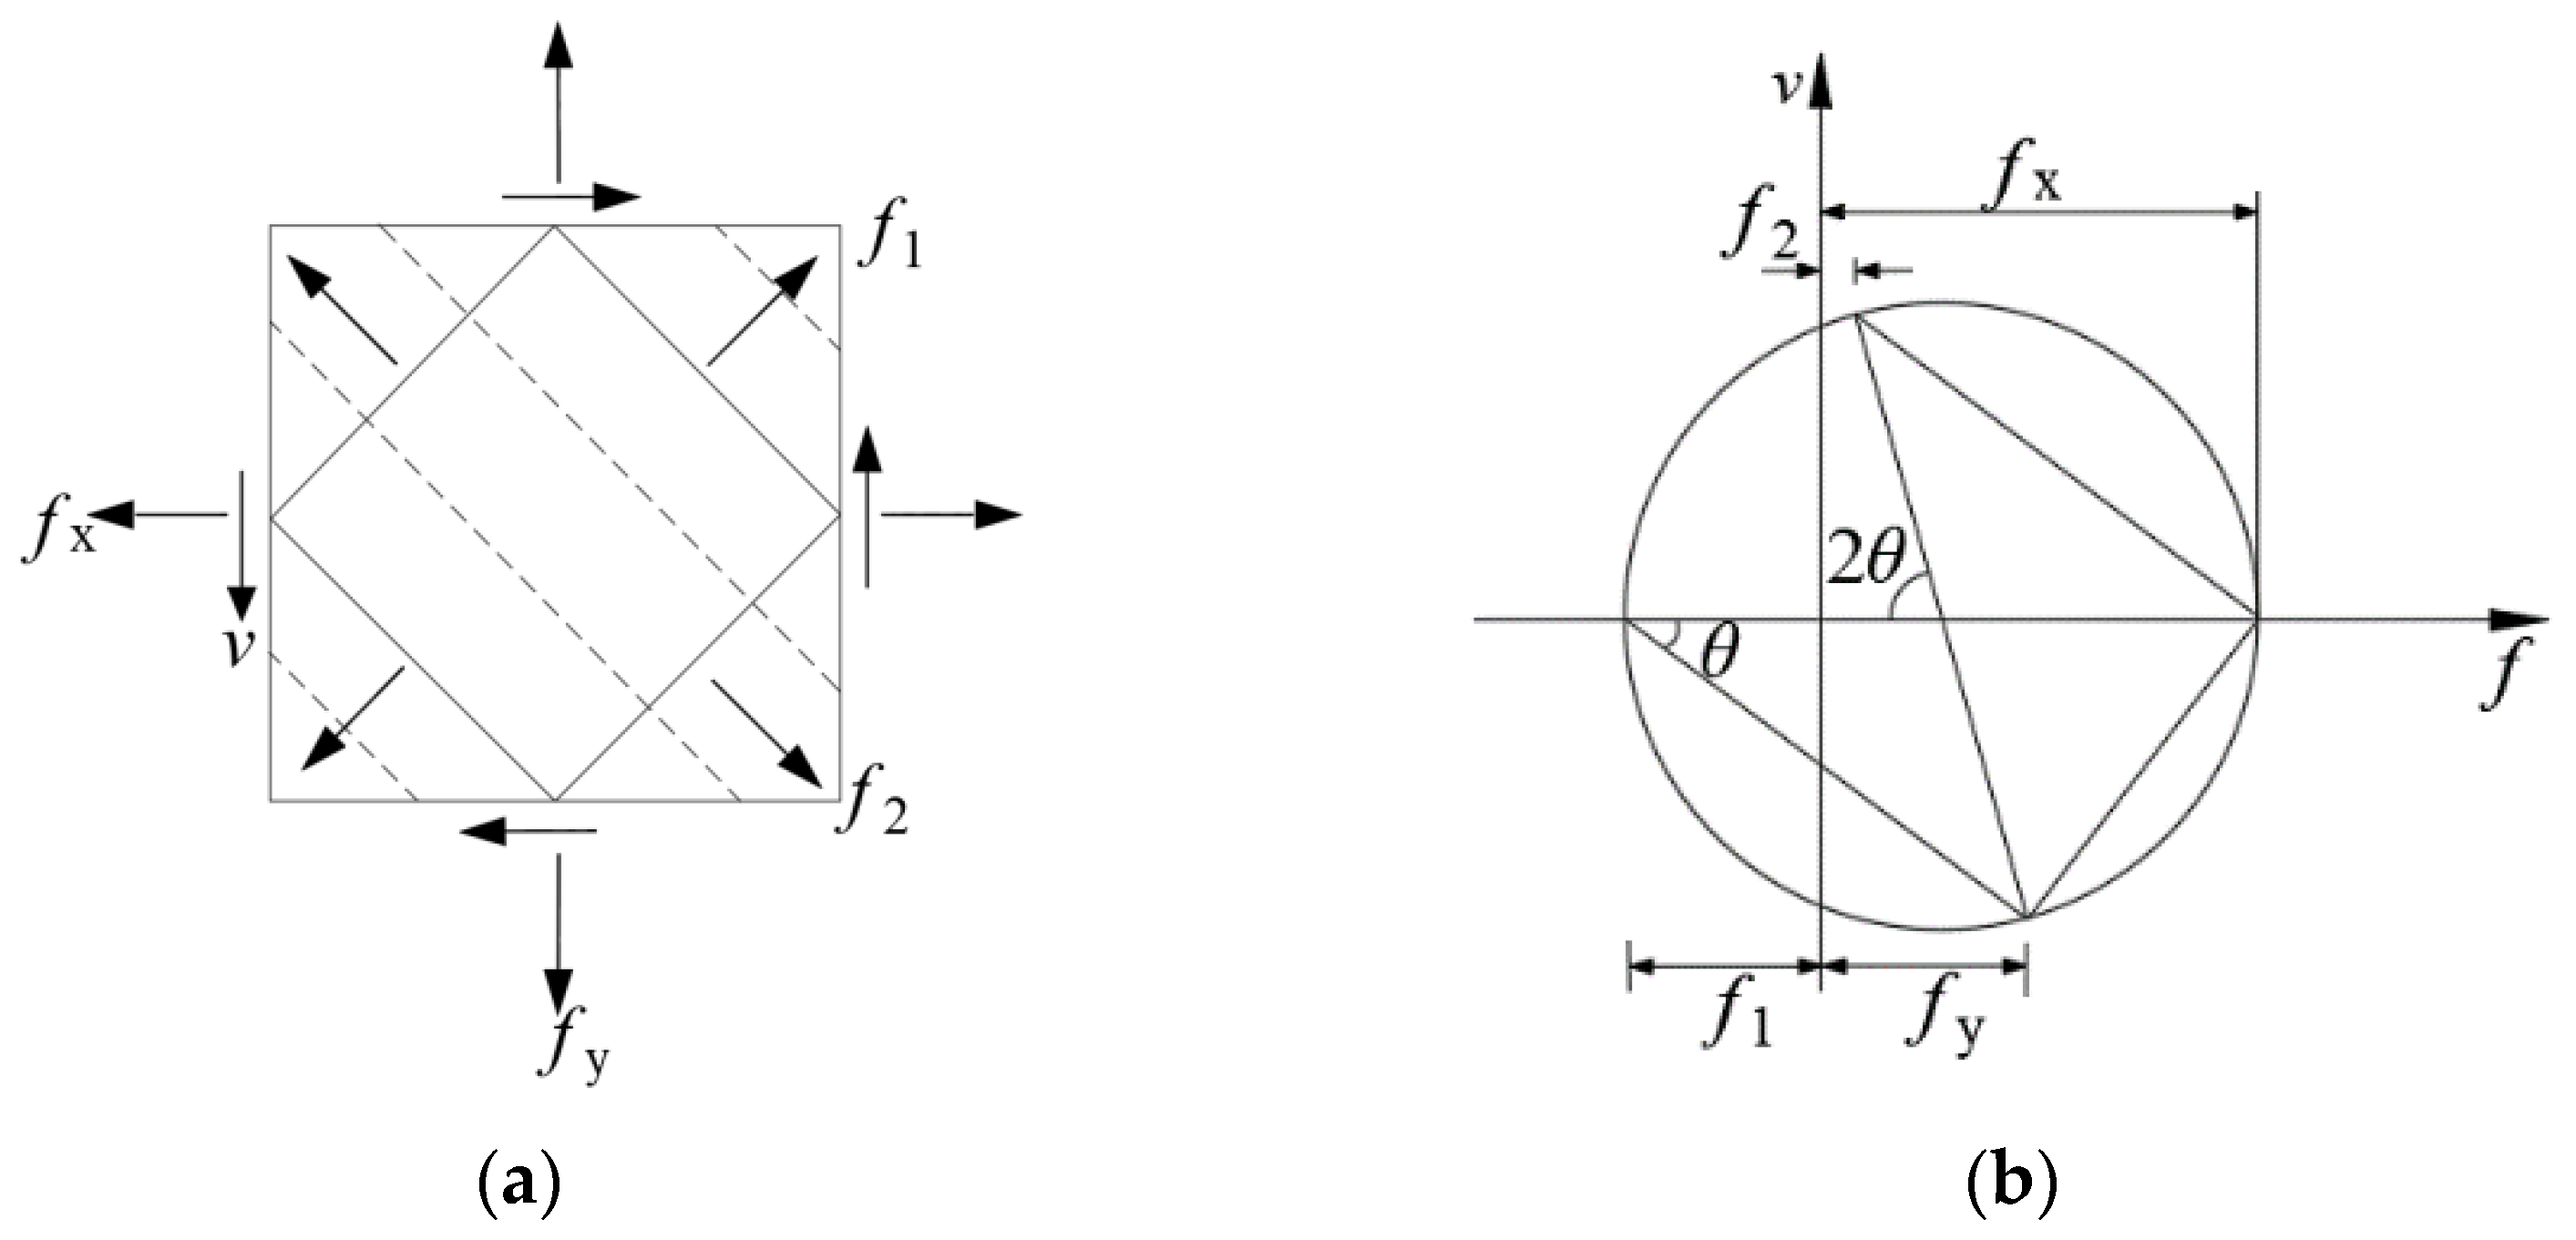
2.1. Equilibrium Conditions

Assuming that the cracked steel-fiber-reinforced high-strength concrete is a homogeneous composite material (whereby Figure 1 illustrates Mohr’s circle of average stress), the following relationships are determined:
f x = f 1 v cot θ + ρ sx f sx
f y = f 1 v tan θ
f 1 + f 2 = v ( tan θ + cot θ )
where f1 is the principal tensile stress of the concrete; f2 is the principal compressive stress of the concrete; fx and fy are the average stresses of the element along the x and y directions, respectively; θ represents the inclination of the diagonal compressive; v is the shear stress by the element; fsx is the stress in the x direction of the steel reinforcement; and ρsx is the reinforcement ratio in the x direction.
After cracking, steel-fiber concrete corbels continue to transmit stress across the cracks. The bond between concrete and steel fibers enhances the stress at the crack, providing a bridging effect. This effectively inhibits crack propagation and improves the transfer of shear forces across the crack interfaces [24]. Considering the steel of fibers on concrete shear resistance under the stress balance condition at the crack, the residual tensile stress generated by steel fiber is as follows:
σ f = K f L f D f τ u ρ f
where Kf is the effective distribution coefficient of steel fibers; Lf is the length of the steel fibers; Df is the diameter of steel fibers; τu is the bond strength between steel fibers and concrete, whereby τu = 0.6 fc′2/3 [18]; and ρf represents the volume fraction of steel fibers.
Steel fibers are randomly distributed in the concrete matrix, and when the fiber pullout angle exceeds a certain limit, it is considered that the steel fibers have little contribution to the tensile strength of the concrete [25,26]. Therefore, assuming that the x-axis direction is the normal direction of the crack surface, the angle formed between a single steel fiber and the x-axis direction is θf, as shown in Figure 2.
According to Foster’s research findings [27], when the fiber pullout angle exceeds 60 degrees, the contribution of steel fibers is not considered. The fiber inclination is between 0 and 60 degrees. The effective distribution coefficient of randomly oriented steel fibers in concrete is calculated by integrating according to the following equation:
K f = 1 2 π π π 0 60 ° cos θ f sin θ f d θ f d φ
For the steel-fiber concrete corbels, the bridging effect of steel fibers enhances the shear stress. Thus, the balance of transverse reinforcement direction (x direction) force can be expressed as follows:
ρ sx f sx + f 1 sin 2 θ f 2 cos 2 θ = 0
Similarly, the balance of forces in the y direction is:
f 1 v tan θ σ n = 0
where σn is the axial compressive stress, which is taken as σn = nfc′; n is the axial load ratio (n = N/fcbh0; N is the axial load and b is the width of the corbel section).
From Equation (8), it can be expressed as:
f 1 b h 0 V tan θ = N

2.2. Constitutive Relations

2.2.1. Stress–Strain Relationship of Concrete in Tension

The concrete is considered to be in the linear elastic stage before cracking, that is, the tensile stress–strain relationship is as follows:
f 1 = E c ε 1 ( ε 1 ε cr )
where Ec is the elastic modulus of concrete; ε1 is the principal tensile strain.
The tensile stress–strain relationship of cracked concrete is given by [28]:
f 1 = 0 . 33 f c 1 + 500 ε 1 ( ε 1 > ε cr )
where fc′ is the compressive strength of concrete cylinder; εcr is the cracking strain of concrete, given by εcr = 0.33 fc(1/2)/Ec [17].
For the principal tensile stress and strain relationship of steel fiber concrete, the reinforcement effect of steel fiber on concrete is considered. The tensile stress in cracked steel-fiber-reinforced concrete is equal to the residual tensile stress in concrete plus the tensile stress in steel fibers at the crack location [29]. The expression is given by:
f 1 = 0 . 33 f c 1 + 500 ε 1 + σ f ( ε 1 > ε cr )

2.2.2. Stress–Strain Relationship of Concrete in Compression

The stress–strain relationship of steel-fiber-reinforced concrete in compression, as suggested by Vecchio and Collins [30,31], is as follows:
f 2 = f 2 , max 2 ε 2 ε 0 ε 2 ε 0 2
f 2 , max f c = 1 0 . 8 0 . 34 ε 1 ε 0 1
where f2,max is the maximum principal compressive stress in the concrete; ε0 is the compressive strain of concrete corresponding to the maximum principal compressive stress, which is generally −0.002; ε1 and ε2 are the strains corresponding to the principal tensile stress and the principal compressive stress.

2.2.3. Stress–Strain Relationship of Reinforcement

The stress–strain relationship for steel in tension and compression is used by an ideal elastic–plastic model, which can be expressed as:
f s = E s ε s f y
where fs and εs represent the stress and strain of steel reinforcement, respectively; Es denotes the steel reinforcement elastic modulus; and fy represents the yield strength of the steel reinforcement.

2.3. Compatibility Conditions

Assuming no slippage between the steel reinforcement and concrete, the deformation amount of reinforcement and concrete is exactly the same. Therefore, the incremental strain values of the concrete and steel are also same. At the instant of cracking, the incremental strain and stress values of the steel reinforcement can be neglected, resulting in the following equation:
ε cx = ε sx = ε x
ε cy = ε sy = ε y
where εcx and εcy are the concrete strain in x and y directions, respectively; εsx and εsy are the strain in the x and y directions of the reinforcement, respectively; εx and εy are the strains in the x and y directions of the element.
The geometric relationship between the principal strains of concrete and Mohr’s circle of average strain (Figure 3) is given as follows:
tan 2 θ = γ xy ε y ε x
ε 1 + ε 2 = ε x + ε y
tan 2 θ = ε x ε 2 ε y ε 2 = ε 1 ε y ε y ε 2
where ε1 and ε2 are the principal tensile and compressive strains of the element, respectively, while γxy is the shear strain.
From (18)–(20), we can obtain:
ε x = ε 1 cos 2 θ + ε 2 sin 2 θ
ε y = ε 1 sin 2 θ + ε 2 cos 2 θ
γ xy = 2 ( ε 1 ε 2 ) sin θ cos θ

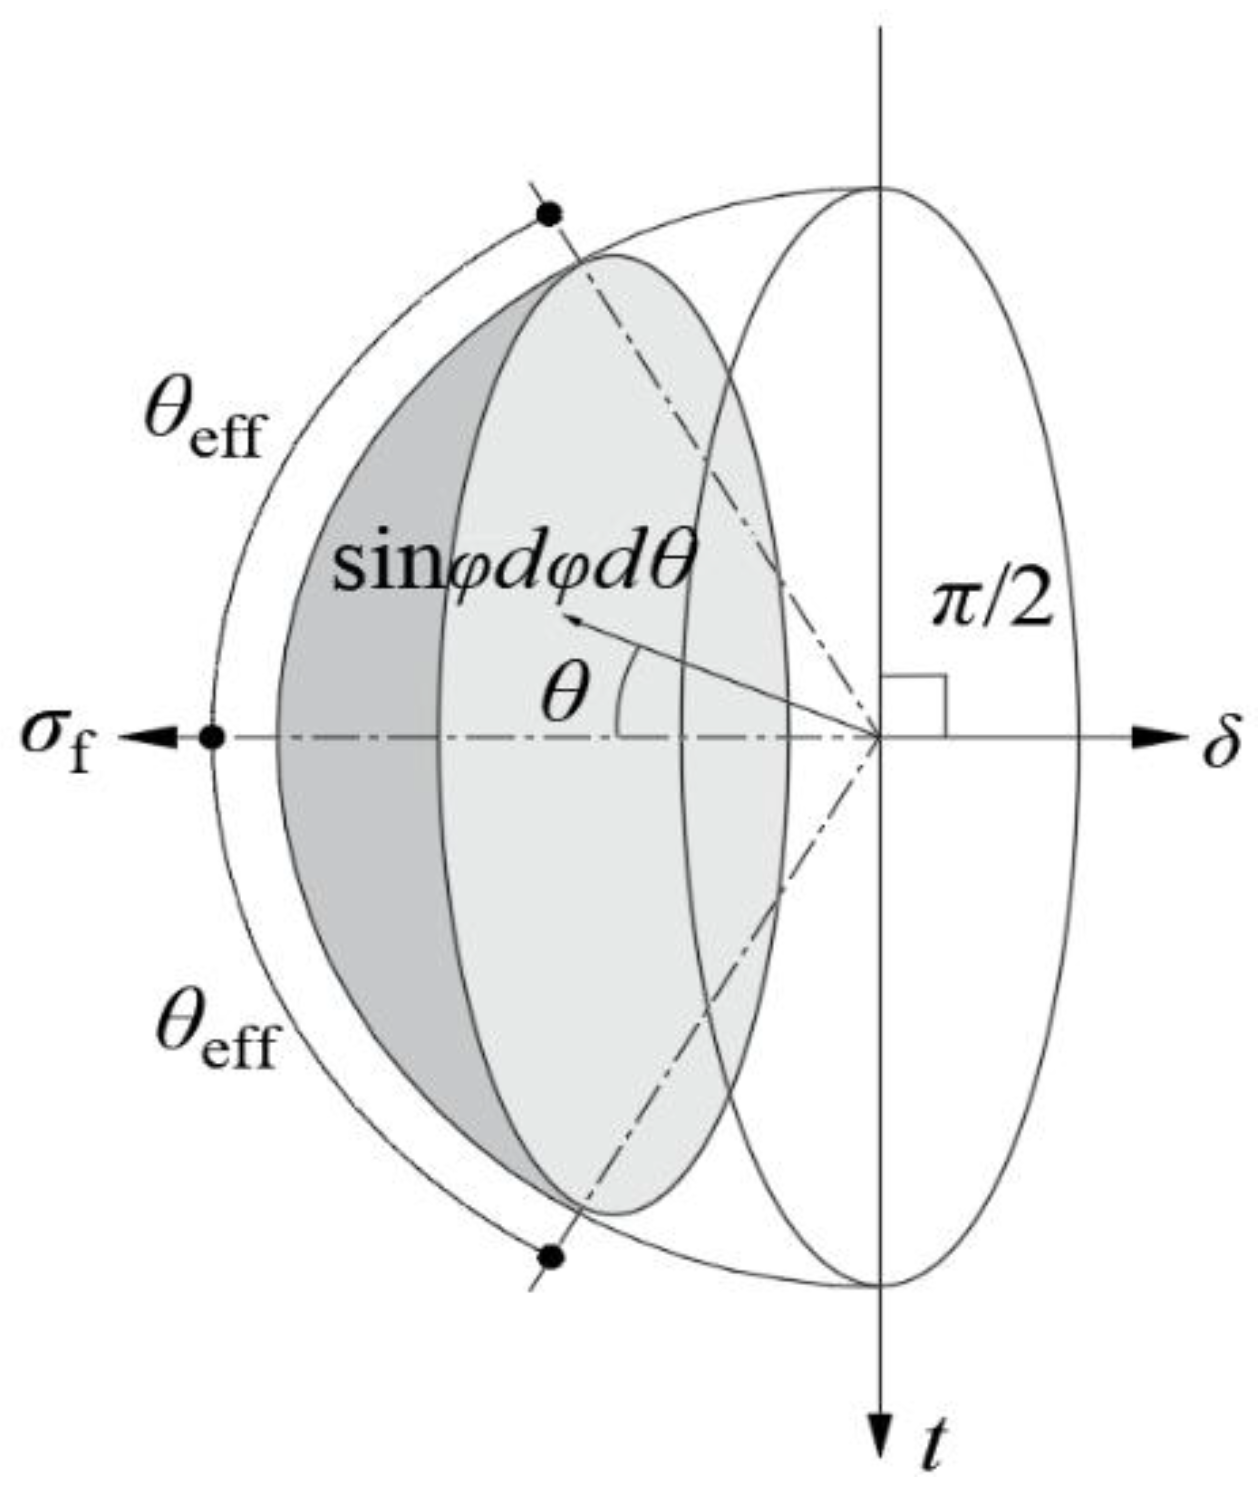
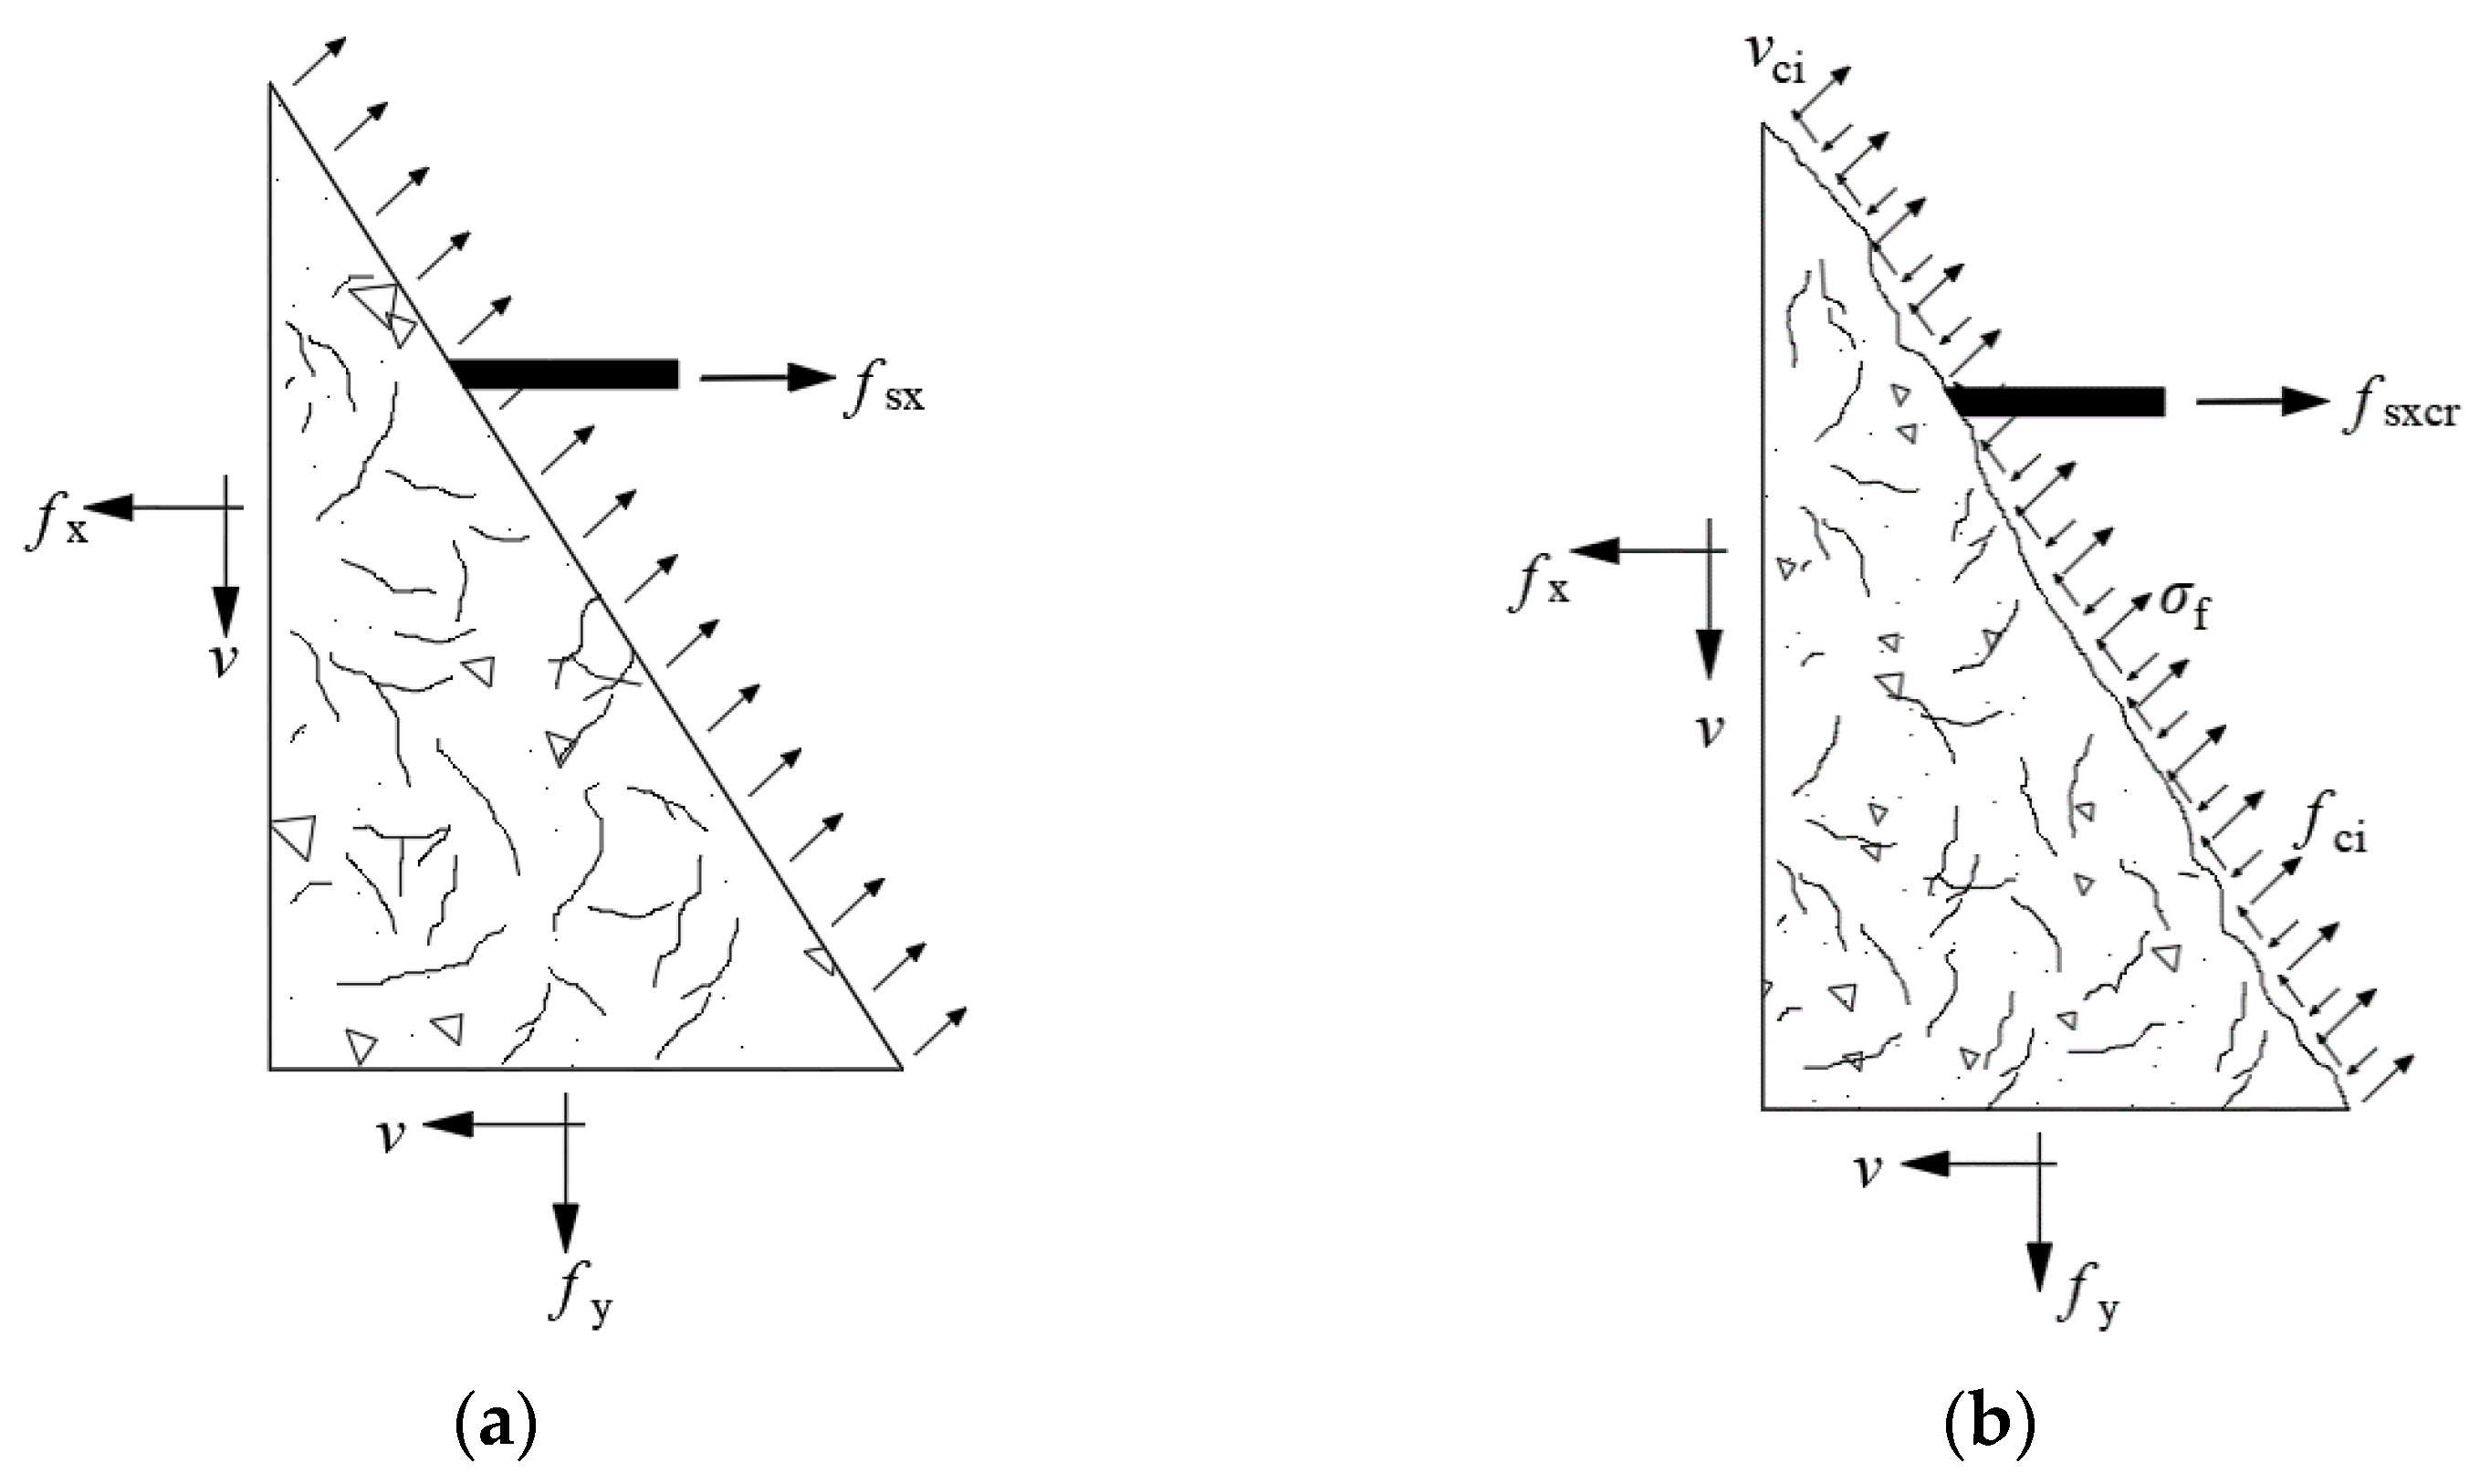
2.4. Stress Equilibrium of Steel Fibers at the Crack

In the MCFT, the average stress is assumed to be in equilibrium with the stress at the crack location using the static equivalence method. This allows for a reasonable simplification of the actual complex stress state, considering it as an ideal series of parallel cracks. Figure 4 shows the stress distribution of the cracked unit at the crack location and between cracks. Because the compressive stress fci at the crack is relatively small, its influence can be ignored. Considering the stress equilibrium in the direction of the stirrup, the following can be obtained:
ρ sx f sx sin θ + f 1 sin θ = ρ sx f sxcr sin θ v ci cos θ + σ f sin θ
Thus,
f 1 = ( ρ sx f sxcr ρ sx f sx ) v ci cot θ + σ f
where fsxcr is the reinforcement stress in the x direction of the crack, and vci is the shear stress at the crack, which can be calculated by the following formula:
v ci = 0 . 18 f c 0 . 3 + 24 w a + 16
The size of the crack spacing mainly depends on the distribution of longitudinal steel bars and stirrups. The denser the arrangement of steel reinforcement, the closer the cracks, and the corresponding spacing decreases. The crack width can be calculated using the following equation:
w = ε 1 s θ
s θ = 1 sin θ s m x + cos θ s m y
where a is the maximum aggregate size, w is the crack width, sθ is the average crack spacing, smx is the crack spacing in the x direction, and smy represents the crack spacing in the y direction. To simplify, the maximum spacing between longitudinal reinforcement and stirrups is used in the above calculation.
When the reinforcement at the crack reaches its yield strength, the control condition for the principal tensile stress f1 can be obtained via Equation (24):
f 1 ρ sx ( f sxy f sx ) v ci cot θ + σ f
At the same time, the control condition for the reinforcement stress at the crack is given by:
f sxcr = f sx + ( f 1 + v ci cot θ σ f ) / ρ sx f sxy
By combining Equations (3) and (6), we can obtain:
v = ρ sx f sx tan θ + ( v ci tan θ + σ f ) tan θ
The shear capacity of steel-fiber-reinforced high-strength concrete corbels is obtained via:
V = A sv f y h 0 s tan θ + ( v ci tan θ + σ f ) b h 0 tan θ

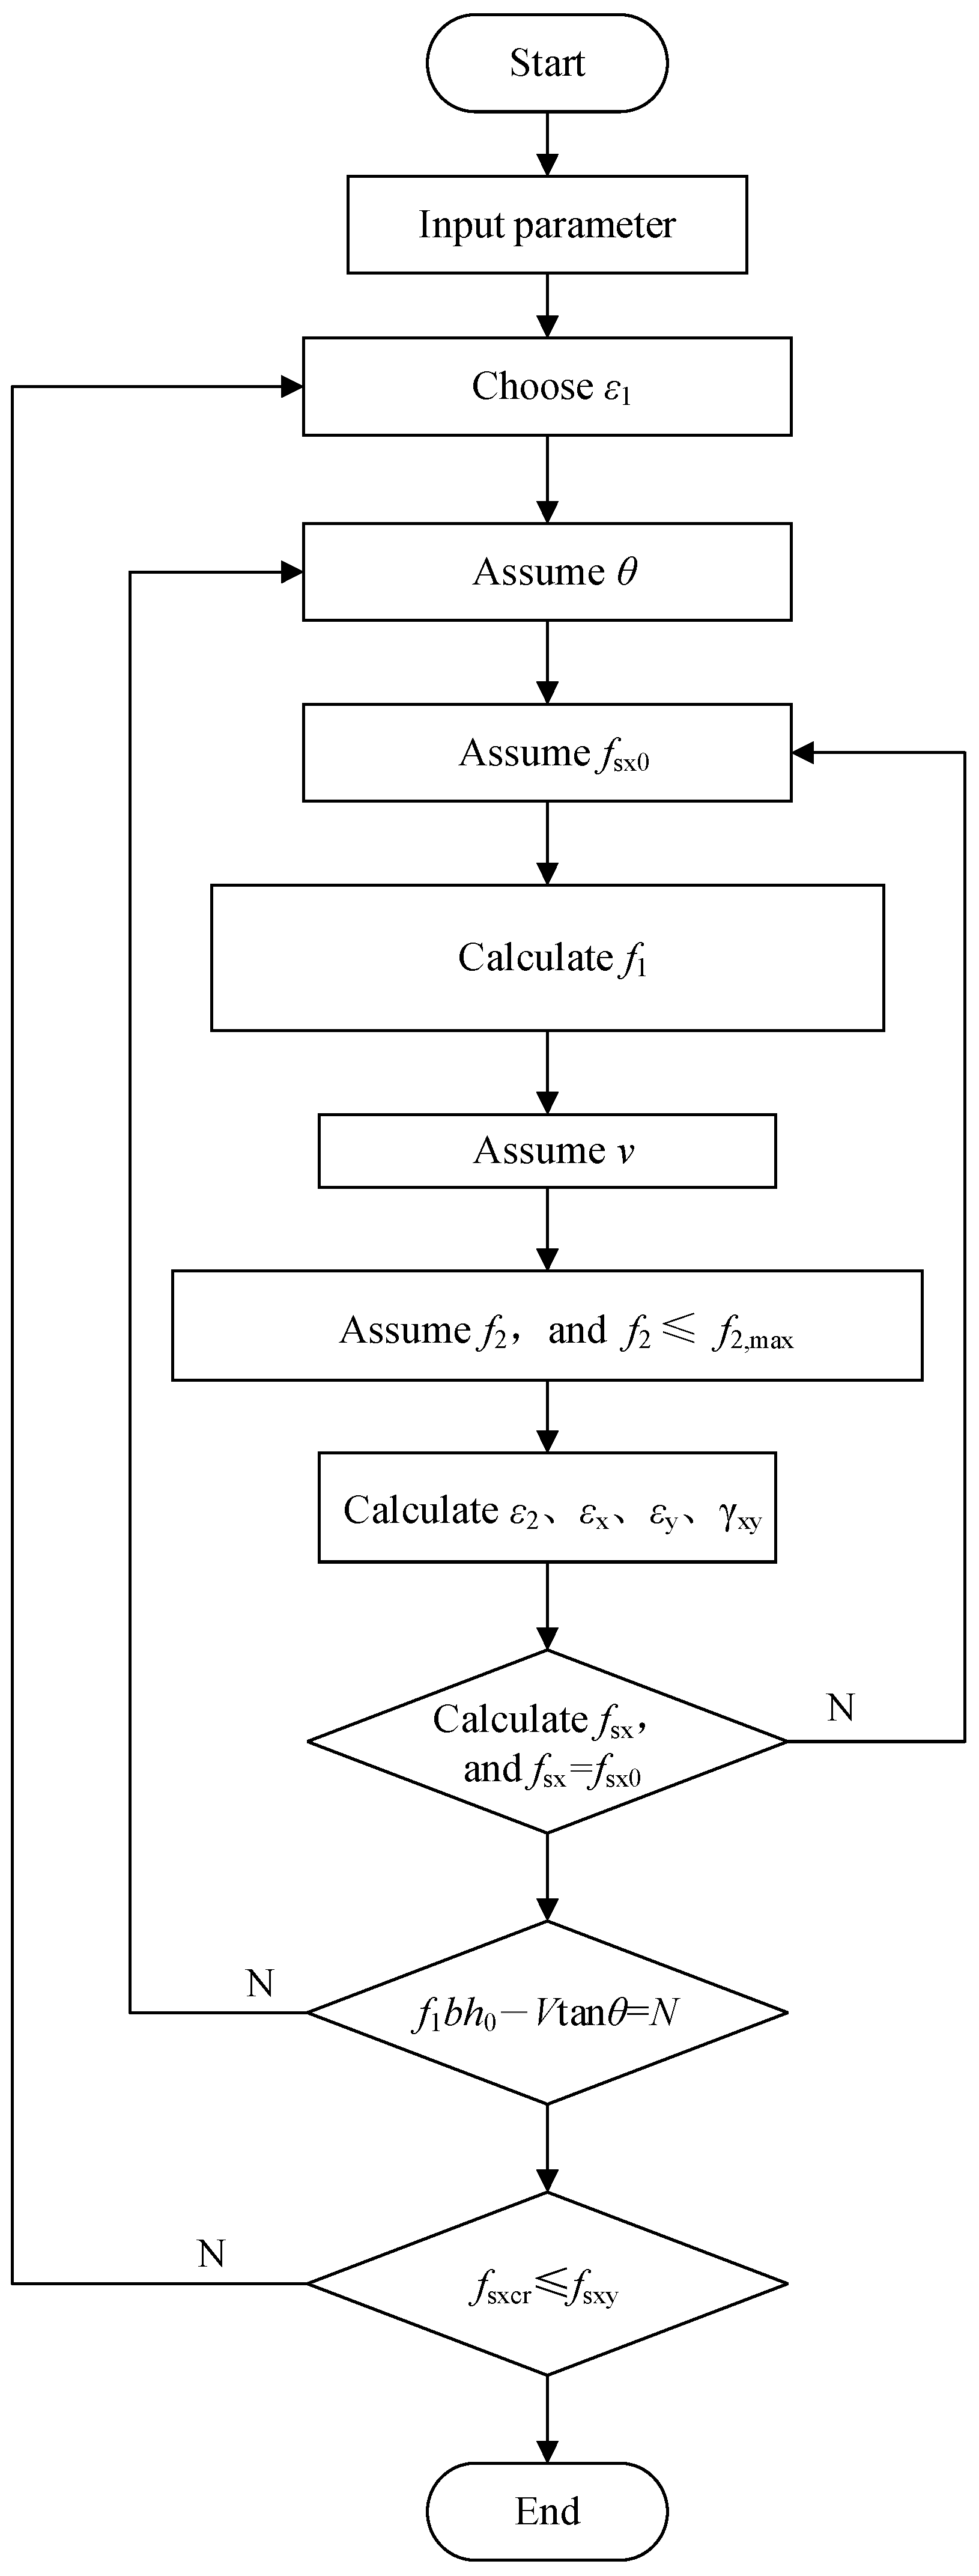
2.5. Calculation Process

The abovementioned equilibrium conditions, constitutive relations, compatibility conditions, and stress equilibrium of steel fibers at the crack are solved simultaneously to calculate the shear capacity of steel-fiber-reinforced high-strength concrete corbels. Figure 5 illustrates the flowchart of the solution process, which involves the following main steps:
  • Input corbels’ geometry and material parameters.
  • Assume ε1, and the increment of ε1 is 0.0001.
  • Assume θ.
  • Calculate vci and w using Equations (25) and (26).
  • Assume fsx0.
  • Calculate f1 using Equation (11), and satisfy Equation (28).
  • Calculate v using Equation (30).
  • Calculate f2 using Equation (3), and f2 is limited by f2,max.
  • Use Equation (14) to determine whether it is equal to the assumed fsx0. If it is, continue to the next step; otherwise, return to (6) to assume the stirrup stress again.
  • Calculate axial load N using Equation (8), and whether the axial force is equal to 0. If it is true, the analysis of the corresponding principal tension strain state is completed. If not, return to (4) to assume the crack inclination again until it is equal.
  • Calculate fsxcr using Equation (29), if fsxcr is less than fsxy, the calculation ends. Otherwise, return to (2) to re-assume the main tensile strain of concrete.

3. Model Verification

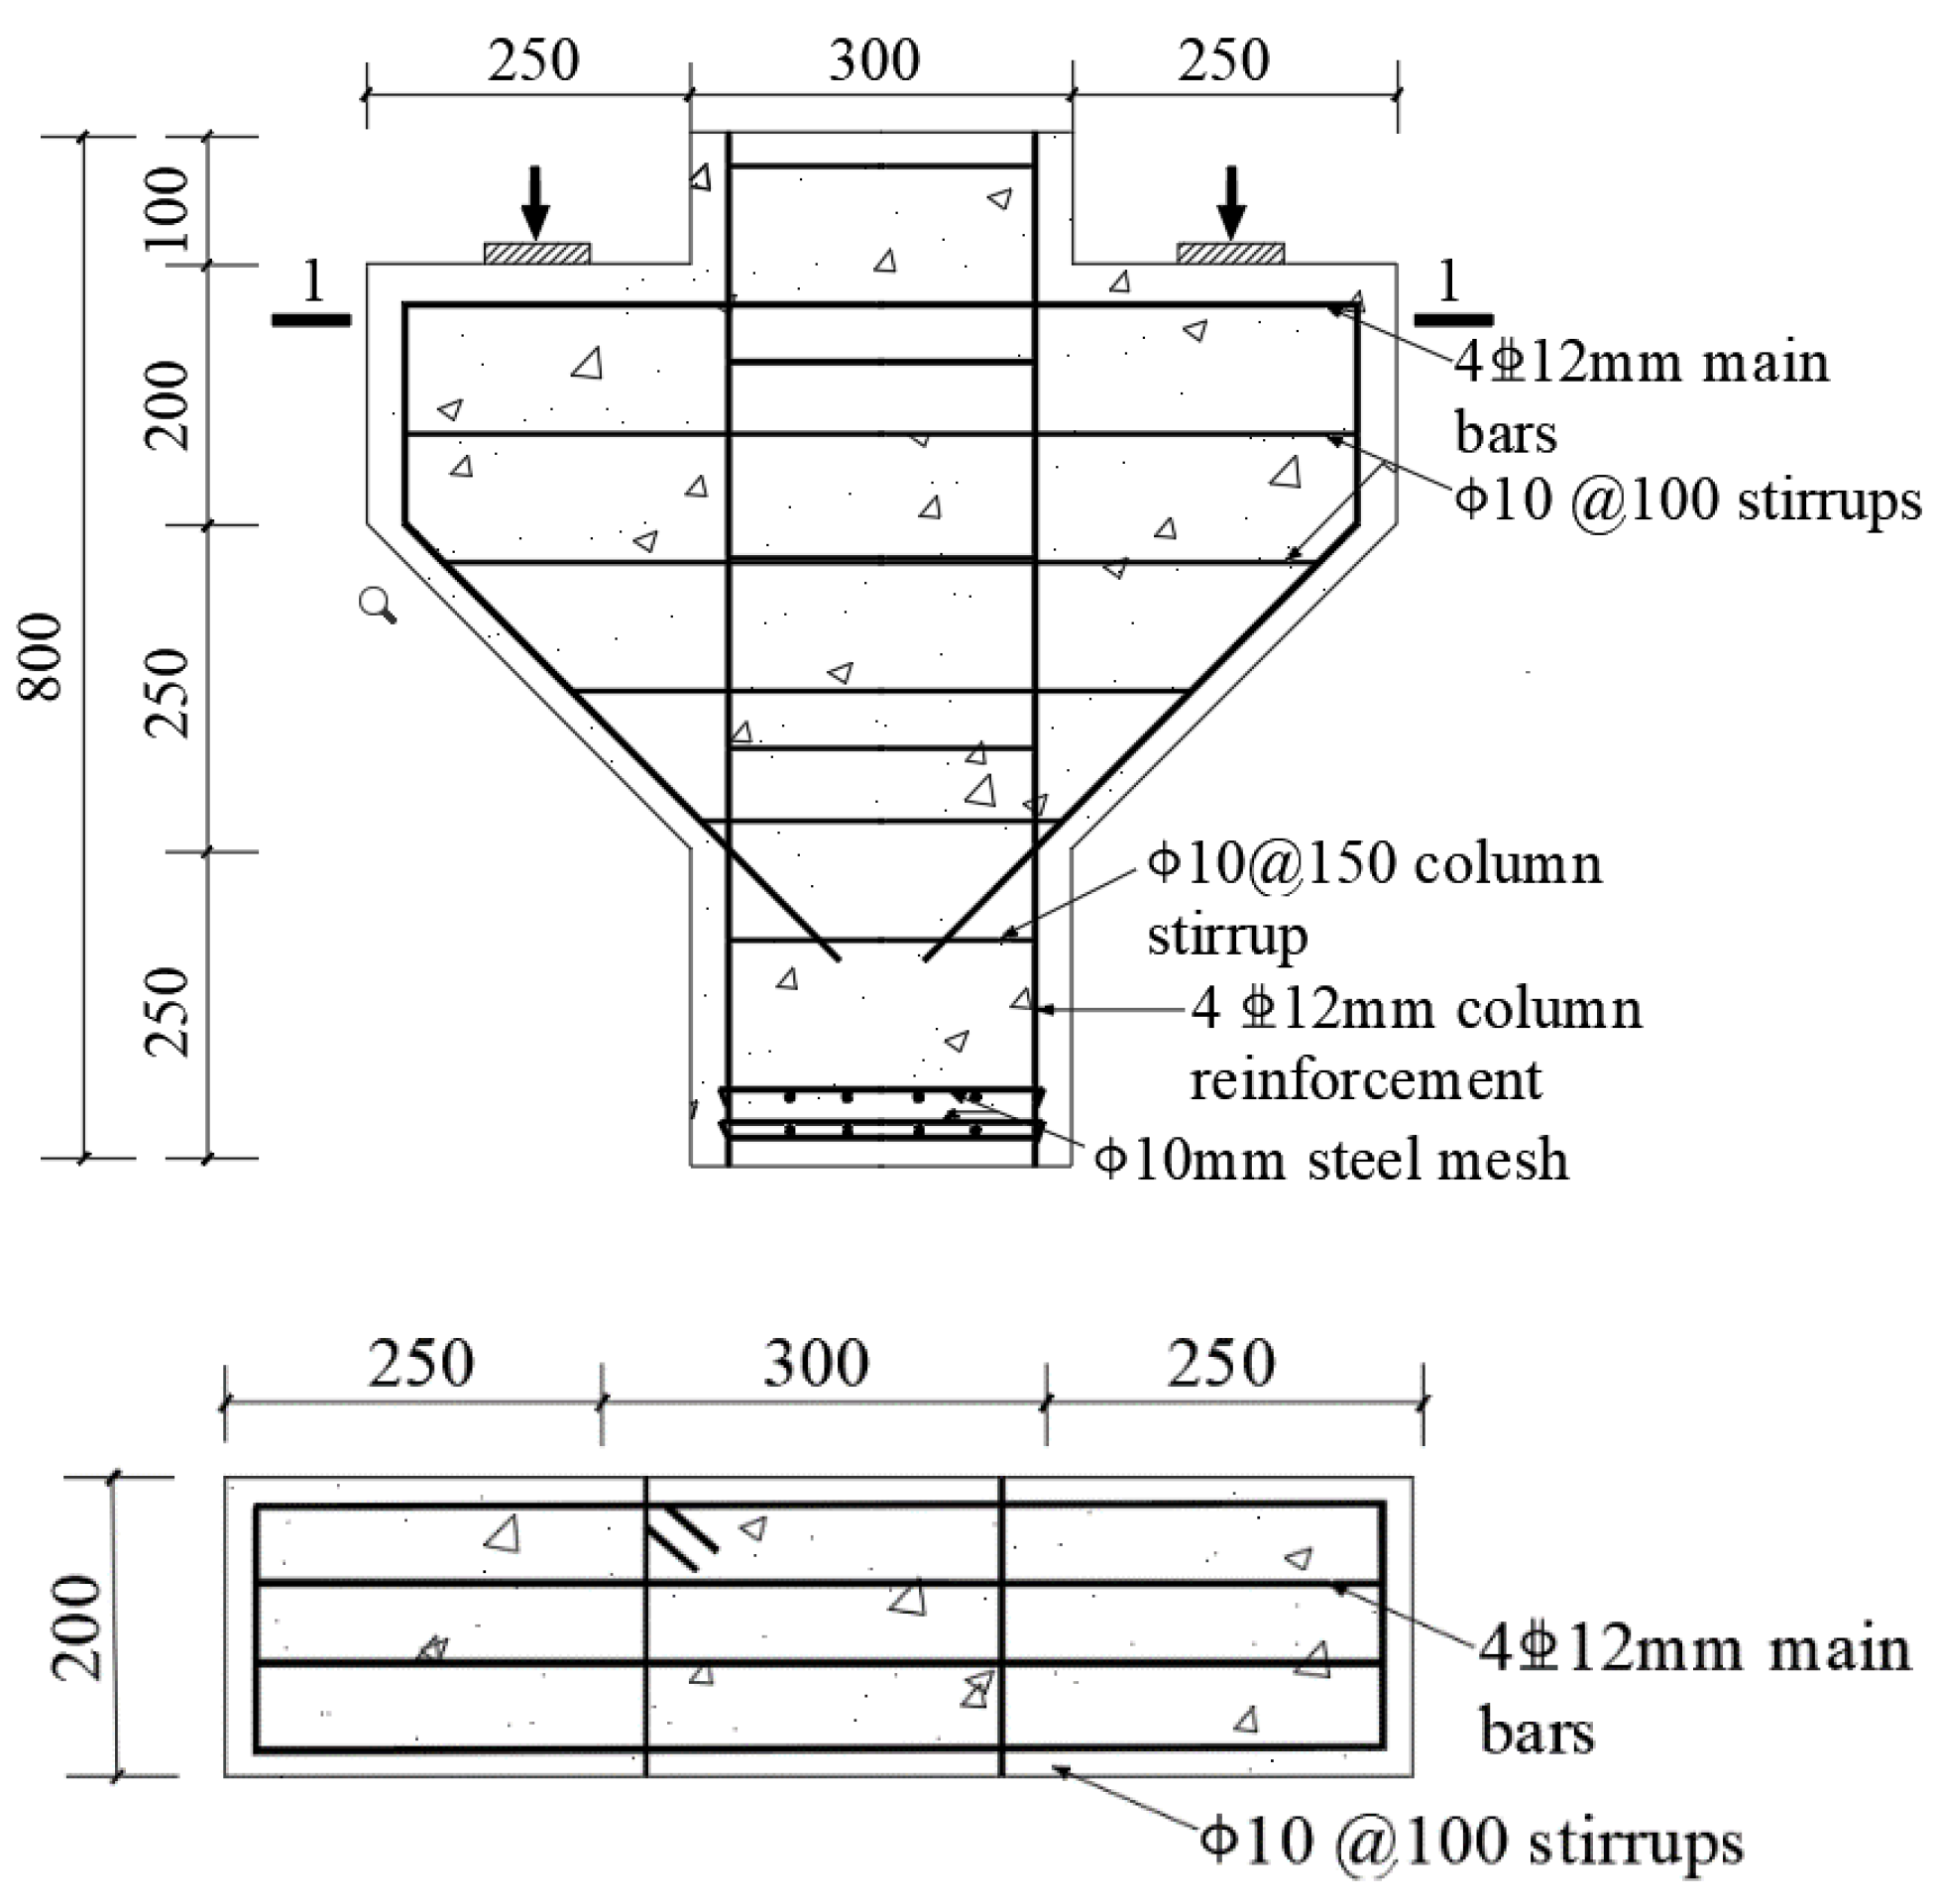
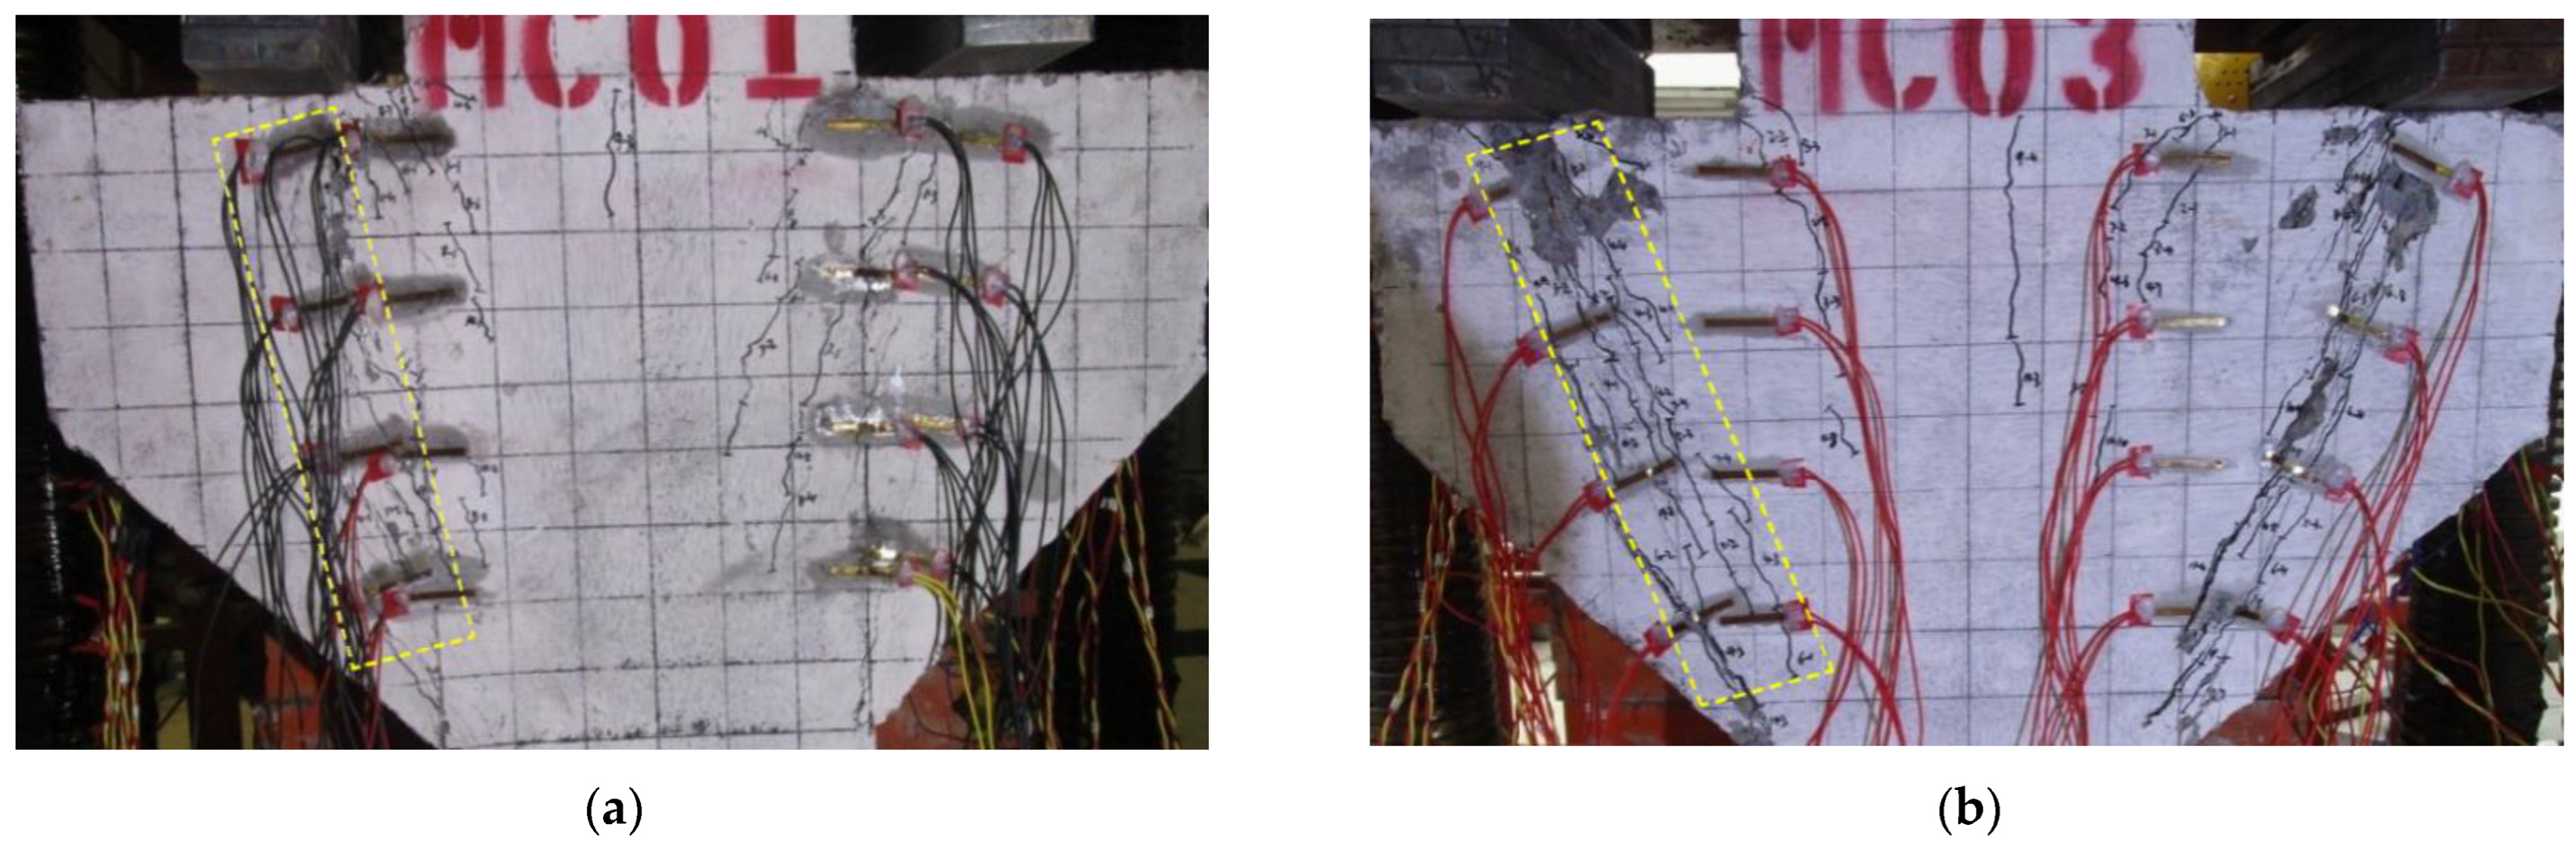
3.1. Experimental Work

With the aim of verifying the above shear bearing capacity calculation model, the shear test of nine steel-fiber high-strength concrete corbels under concentrated load was completed, with a width of 200 mm, a height of 450 mm at the root cross-section, and a width of 200 mm. The design parameters of the shear span-to-depth ratio (λ), the steel fiber dosage (ρf), the main reinforcement ratio (ρs), the stirrup reinforcement ratio (ρsh), and the main parameters and reinforcement are shown in Table 1 and Figure 6.
The longitudinal reinforcement and stirrup reinforcement of the specimens were made of HRB400- and HPB300-grade steel bars, respectively. The measured mechanical properties of various types of steel reinforcement are presented in Table 2.
The main test results and failure patterns of the specimens are shown in Table 3. All specimens experienced shear failure, and can be divided into three stages, namely initial cracking, critical cracking, and ultimate failure. Due to the difference in shear span ratio, the typical failure modes of the specimen include diagonal shear failure and diagonal compression failure. The top longitudinal tensile reinforcement gradually reaches the yield strength, and the penetrating diagonal crack appears at the connection surface between the loading plate and the column, forming the concrete failure mode caused by shear force. As shown in Figure 7a, the failure section is close to the vertical and slightly oblique shear crack, which resulted in the patterns of diagonal shear failure. Figure 7b shows that the middle part of the diagonal direction is perpendicular to the direction of the main tensile stress, and several oblique ventral shear cracks that are roughly parallel to each other appear successively, and oblique prisms appear in the abdomen of the corbel. After the occurrence of the main oblique crack, when the ultimate load is approaching, the yield strength of the longitudinal tensile reinforcement part reaches the vertical part, which led to the patterns of diagonal compression failure.

3.2. Comparison with Test Results

A comparative analysis was conducted by selecting shear capacity models proposed based on the Fattuhi model [32], Campione model [33], and Russo model [34] and by comparing them with the model presented in this paper. The introduction is presented below.

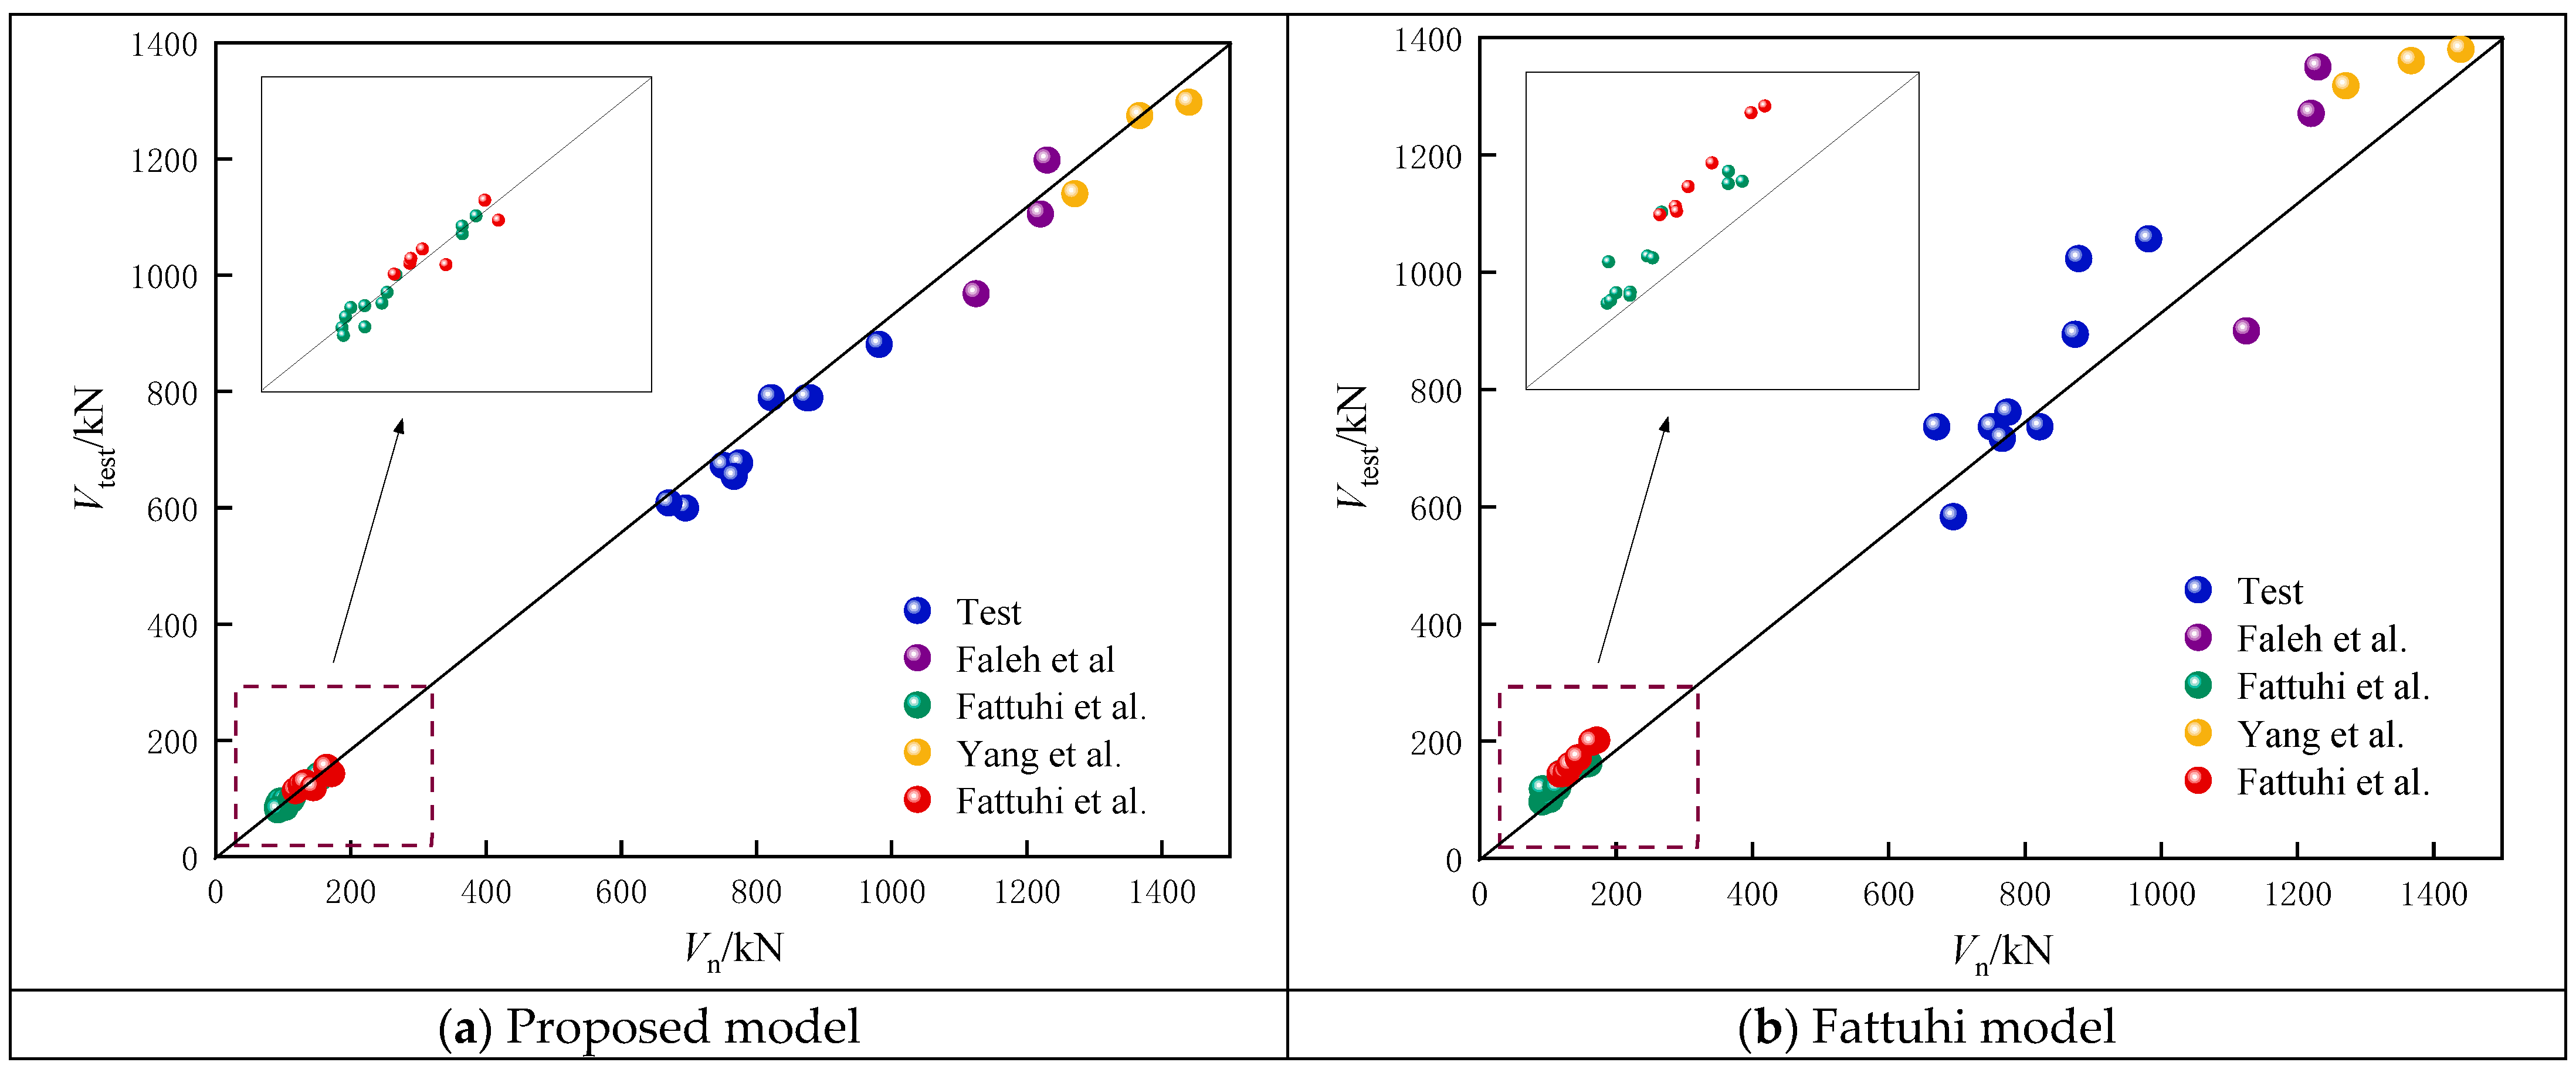
3.2.1. Fattuhi Model [32]

The formulation takes into account the contributions of both traditional bar reinforcement and fibrous reinforcement, considering their respective volumes and their influence on the mechanical behavior of the corbels. Fattuhi proposed an empirical formulation based on experimental data:
V = k 1 b h ( f t ) k 2 ( f y f cu ) k 4 ( d h ) k 5 ( ρ ) k 6
The values of the constants k1 to k6 are 57.292, 0.315, −0.812, −0.049, 0.678, and 0.626, where b is the corbel’s width; h is the corbel’s height; d is the corbel’s effective height; fy is the yield strength of longitudinal bar; ft is the concrete tensile strength; and ρ is the longitudinal reinforcement ratio.

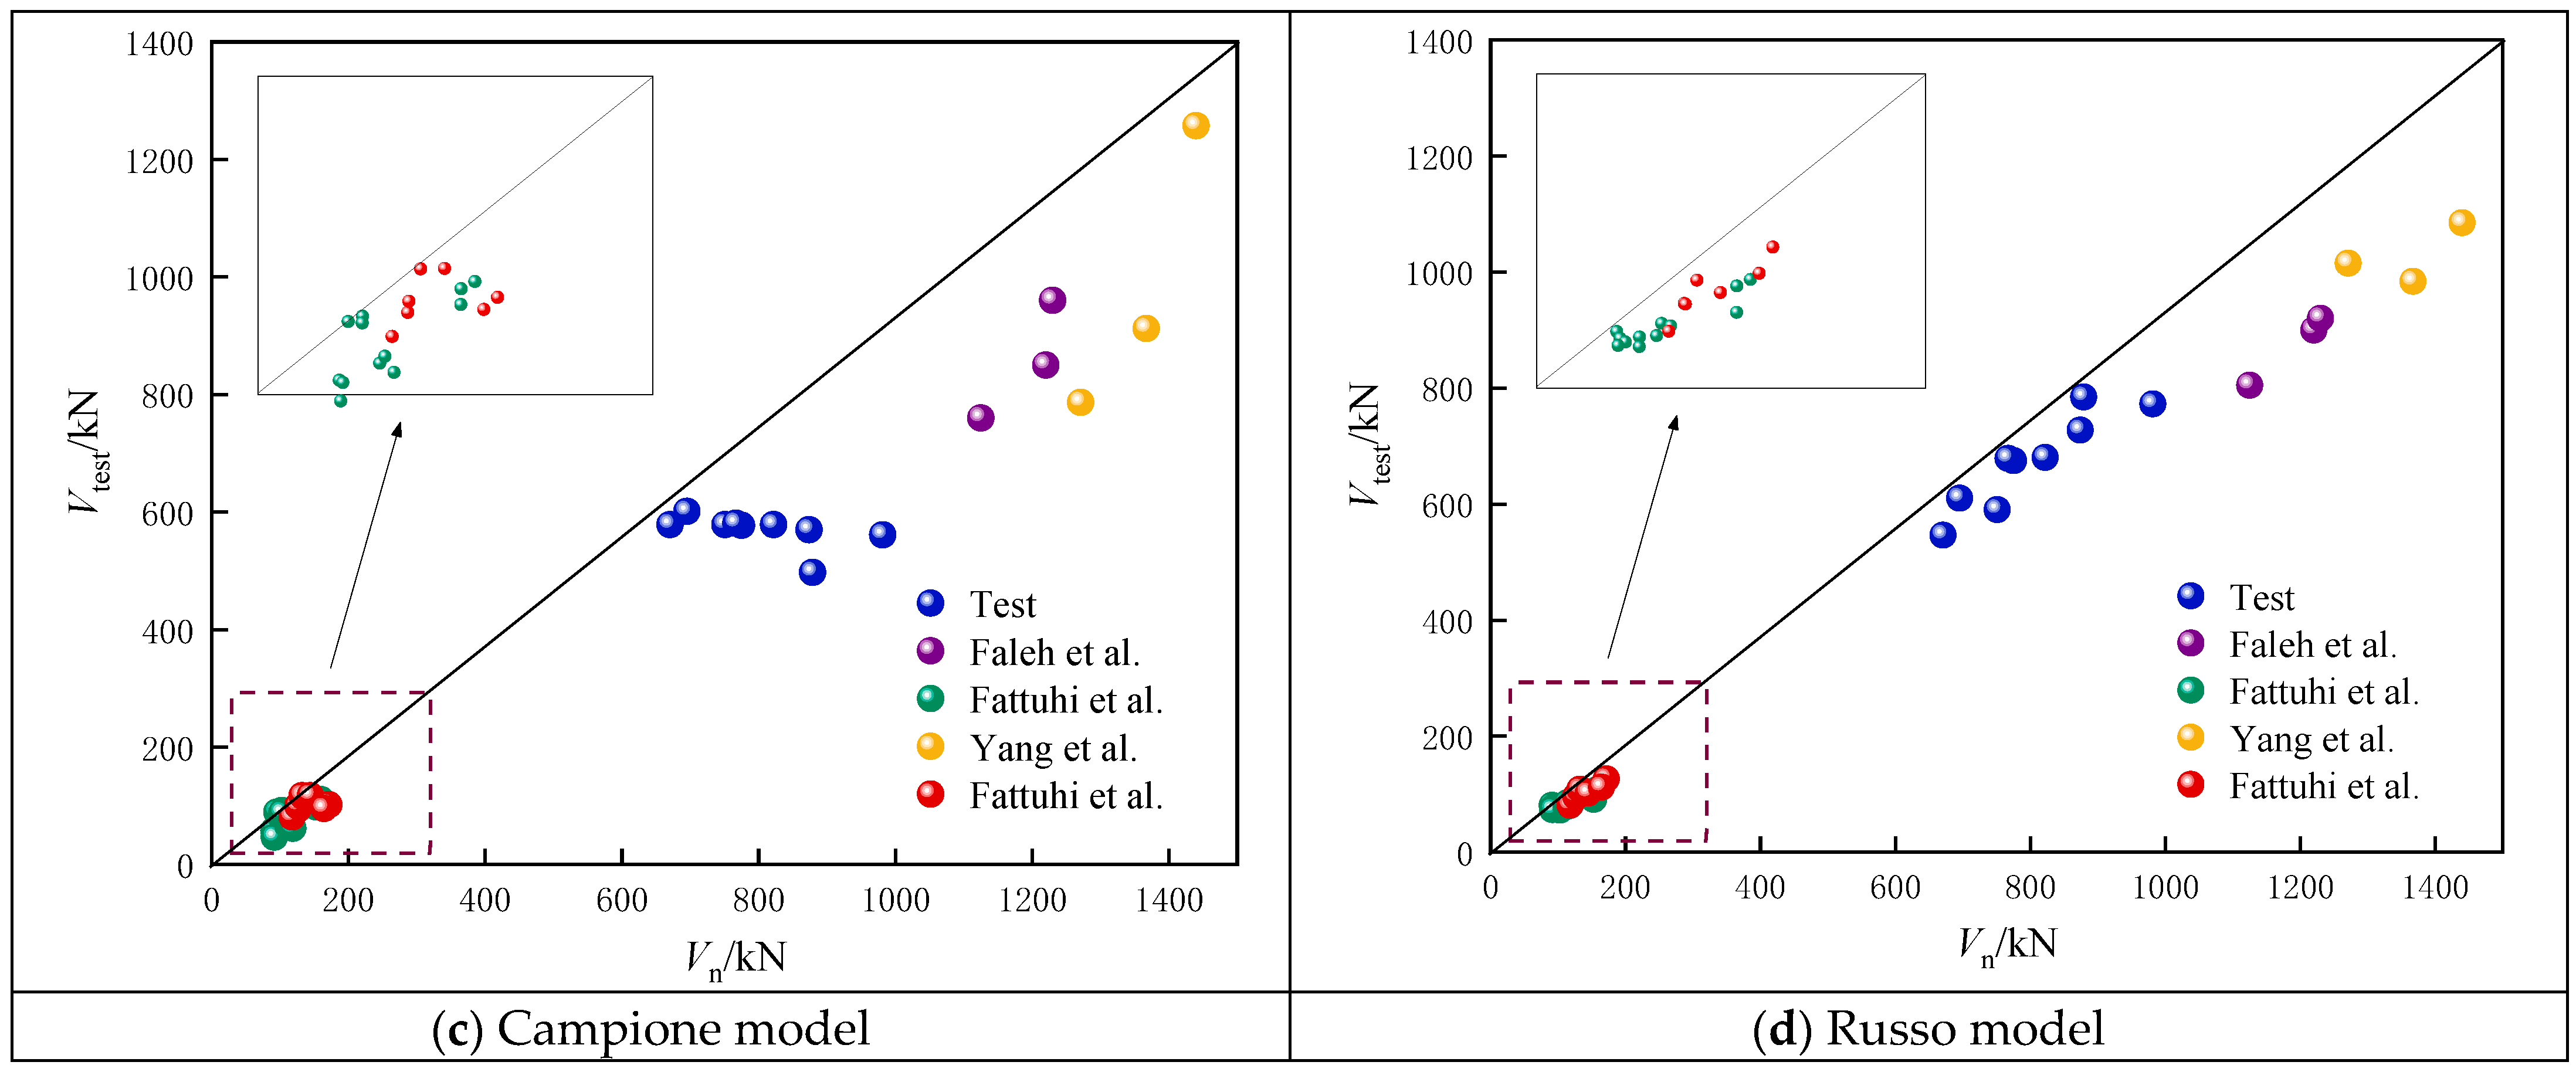
3.2.2. Campione Model [33]

The shear strength of fiber-reinforced concrete corbels, including stirrups, is expressed below, taking into account the influence of concrete grade, fiber volume, and reinforcement ratio:
V = χ f c ( b x c cos α ) sin α + b sin α cos α 0.2 f c F ( d x c ) ( 1 f ctf f y E s E ct ) + c
χ = 0 . 74 ( f c 105 ) 3 1.28 ( f c 105 ) 2 + 0.22 ( f c 105 ) + 0.87
α = d x c 3 a
where η is the load distribution coefficient, fc′ is the concrete tensile strength, α is the angle between the tie and strut, F is the fiber factor, fctf is the steel fiber concrete tensile strength, and c is the thickness of the protective layer.

3.2.3. Russo Model [34]

Based on the combination of the strut-and-tie mechanism resulting from cracked concrete and the main tension reinforcement, as well as the strength contribution from secondary reinforcement, the following are obtained:
V = 0 . 8 ( k χ f c cos θ 1 + 0.65 ρ h f yh cot θ 1 ) b h
k = ( n ρ f ) 2 + 2 n ρ f n ρ f
θ = 2 arctan 1 + ( a d ) 2 + ( 1 k 2 4 ) a d k 2
n = 42.6 f c
where χ is the softening coefficient; θ1 is the angle between the concrete strut and the axis of the column; and fyh and ρh are the yield strength and reinforcement ratio of stirrup, respectively.

3.2.4. Model Validity

To validate the rationality of the proposed model in this study, the experimental results of 34 corbel tests from this study and references [35,36,37,38] were compared with the calculation results of various models proposed by researchers, including the model proposed in this study. Table 4 presents the results obtained from the study. Vtest is the measured shear capacity values. Vn is the calculated shear capacity values by the model proposed in this study. VF is the calculated values by the Fattuhi model. VC is the calculated values by the Campione model. VR is t-calculated values by the Russo model. The mean value of the test value and the Fattuhi model was 0.942, and the variance was 0.009. The calculated value of the specimen was greater than the test value, and the calculated result of the model was not safe. The mean values of the ratio calculated by the Campione model and Russo model were 1.453 and 1.311, respectively, and the variances were 0.061 and 0.017, respectively. The calculated results were conservative, and the error between the proposed model and the test value was large. From information obtained from various scholars, it can be determined that the calculation results of the proposed model are closer to the experimental values, and the variance is smaller. The shear bearing capacity of the specimen can thus be calculated accurately.
Figure 8 shows the comparison between the experimental values and the calculated values. In the upper left area of the figure, the experimental values are greater than the calculated values, indicating a conservative safety. The lower right area of the figure represents cases where the experimental values are smaller than the calculated values, indicating an underestimation of the safety margin. For the Fattuhi model, there is significant fluctuation in the experimental data. Both the Campione model and Fattuhi model, along with their calculated results, underestimate the experimental values, indicating a conservative estimation, but with high dispersion. In contrast, the calculated values from the proposed model in this paper show a better agreement with the experimental values, with lower dispersion. This illustrates that the model proposed in this paper is more capable of accurately predicting the shear capacity of steel-fiber-reinforced high-strength concrete corbels.

4. Conclusions

This study proposes a calculation model for the shear capacity of steel-fiber-reinforced high-strength concrete corbels based on the modified compression field theory by calculating the shear capacity of 34 steel-fiber high-strength concrete corbels and comparing the results of the models proposed by various scholars. Through comparative analysis, the rationality of the proposed model is confirmed. It provides new ideas for theoretical analysis, leading to the following conclusions:
  • Based on the modified compression field theory, the contribution of steel fibers to the tensile strength of concrete at crack locations is considered. The constitutive relationship of cracked steel-fiber-reinforced concrete and the local stress equilibrium equation are modified. A calculation model for the shear bearing capacity of steel-fiber-reinforced high-strength concrete corbels is proposed.
  • Compared with other scholars’ models, the predicted value of shear capacity calculated by the proposed model is closer to the experimental value. It can be effectively utilized for predicting and analyzing the shear bearing capacity of steel-fiber-reinforced high-strength concrete corbels, and has a clear mechanical model.

Author Contributions

Conceptualization, H.-M.L. and J.-Y.Z.; methodology, J.-Y.Z.; test, H.-M.L. and J.-Y.Z.; software, S.-S.L. and J.-Y.Z.; validation, H.-M.L. and J.-Y.Z.; formal analysis, H.-M.L. and J.-Y.Z.; investigation, H.-M.L.; resources, S.-S.L.; data curation, S.-S.L.; writing—original draft preparation, H.-M.L. and J.-Y.Z.; writing—review and editing, H.-M.L. and J.-Y.Z.; supervision, S.-S.L.; project administration, H.-M.L.; funding acquisition, S.-S.L. All authors have read and agreed to the published version of the manuscript.

Funding

This research was funded by the National Natural Science Foundation of China (No. U1404526, No. 52179133).

Data Availability Statement

Data are contained within the article.

Conflicts of Interest

The authors declare no conflicts of interest. The funders had no role in the design of the study; in the collection, analyses, or interpretation of data; in the writing of the manuscript, or in the decision to publish the results.

References

  1. He, Z.Q.; Liu, Z.; Ma, Z. Investigation of Load-Transfer Mechanisms in Deep Beams and Corbels. ACI Struct. J. 2012, 109, 467–476. [Google Scholar] [CrossRef]
  2. Nguyen, T.T.; Thai, H.T.; Ngo, T. Effect of steel fibers on the performance of an economical ultra-high strength concrete. Struct. Concr. J. 2023, 24, 2327–2341. [Google Scholar] [CrossRef]
  3. Parthiban, P.; Kar, S.; Mondal, A.K. Stress–strain behaviour of (hpfrc) high-performance fibre reinforced concrete: An experimental study. Mater. Today Proc. 2023, 80, 3119–3123. [Google Scholar] [CrossRef]
  4. Iqbal, S.; Ali, I.; Room, S. Enhanced mechanical properties of fiber reinforced concrete using closed steel fibers. Mater. Struct. J. 2019, 52, 56. [Google Scholar] [CrossRef]
  5. Gali, S.; Subramaniam, K.V.L. Evaluation of crack propagation and post-cracking hinge-type behavior in the flexural response of steel fiber reinforced concrete. Int. J. Concr. Struct. Mater. 2017, 11, 365–375. [Google Scholar] [CrossRef]
  6. Yun, Y.M.; Lee, Y. Strengths of Struts and Nodal Zones for Strut-and-Tie Model Design of Reinforced Concrete Corbels. Civ. Eng. J. 2021, 7, 1275–1289. [Google Scholar] [CrossRef]
  7. Schlaich, J.; Schafer, K.; Jennewein, M. Toward a consistent design of reinforced concrete structures. PCI J. 1987, 32, 74–150. [Google Scholar] [CrossRef]
  8. Canha, R.M.F.; Kuchma, D.A. Numerical analysis of reinforced high strength concrete corbels. J. Eng. Struct. 2014, 74, 130–144. [Google Scholar] [CrossRef]
  9. Hwang, S.J.; Tsa, R.J.; Lam, W.K. Simplification of softened strut-and-tie model for strength prediction of discontinuity regions. ACI Struct. J. 2017, 114, 1569–1579. [Google Scholar] [CrossRef]
  10. Abdul, R.; Khattab, S. Corbel strut and tie modeling—Experimental verification. ACI Struct. 2020, 26, 327–339. [Google Scholar] [CrossRef]
  11. ACI 318 Committee. Building Code Requirements for Structural Concrete (ACI 318-14) and Commentary; American Concrete Institute: Farmington Hills, MI, USA, 2014. [Google Scholar]
  12. Lachowicz, M.K. Experimental study of the post tensioned prestressed concrete corbels. J. Eng. Struct. 2016, 108, 1–11. [Google Scholar] [CrossRef]
  13. Yang, K.H.; Ashour, A.F. Shear capacity of reinforced concrete corbels using mechanism analysis. Struct. Build. 2012, 165, 111–125. [Google Scholar] [CrossRef]
  14. Wael, K. Strength Prediction of Corbels Using Strut-and-Tie Model Analysis. Int. J. Concr. Struct. Mater. 2015, 9, 255–266. [Google Scholar] [CrossRef]
  15. Perceka, W.; Liao, W.C.; Wu, Y.F. Shear Strength Prediction Equations and Experimental Study of High Strength Steel Fiber-Reinforced Concrete Beams with Different Shear Span-to-Depth Ratios. J. Appl. Sci. 2019, 9, 4790. [Google Scholar] [CrossRef]
  16. Jaza, H.M.; Ali, R.Y. Shear behavior of normal and high-strength concrete beams reinforced with BFRP bars and basalt macro fibers. Constr. Build. Mater. 2023, 408, 133516. [Google Scholar] [CrossRef]
  17. Vecchio, F.J.; Collins, M. The modified compression field theory for reinforced concrete elements subjected to shear. ACI Struct. J. 1986, 3, 219–231. [Google Scholar] [CrossRef]
  18. Kaufmann, W.; Mata, F.J.; Amin, A. Compression field analysis of fiber-reinforced concrete based on cracked membrane model. ACI Struct. J. 2019, 116, 213–224. [Google Scholar] [CrossRef]
  19. Wagh, S.K.; Vianthi, A.; Liao, W.C. Experimental and MCFT-Based Study on Steel Fiber-Reinforced Concrete Subjected to In-Plane Shear Forces. Int. J. Concr. Struct. Mater. 2023, 17, 29. [Google Scholar] [CrossRef]
  20. Gao, D.Y.; Shi, K. Calculation method for shear behavior of steel fiber reinforced concrete beam-column joints based on modified compression field theory. Civ. Eng. J. 2016, 49, 41–48. [Google Scholar] [CrossRef]
  21. Zhang, L.Y.; Yao, J.T.; Hu, Y.K.; Gao, J. Predicting shear strength of steel fiber reinforced concrete beam-column joints by modified compression field theory. ACI Struct. J. 2022, 41, 1432–1441. [Google Scholar] [CrossRef]
  22. Zhu, K.F.; Lu, J.Z.; Liu, Y.; Shao, Y.M. Shear Capacity of Hybrid Fiber Reinforced Concrete Deep Beams Based on Modified Compression Field Theory. J. Yantai Univ. 2016, 29, 216–221. [Google Scholar] [CrossRef]
  23. Lei, J.; Chen, Z.X.; Shi, K.; Wang, W.G. Study on shear behavior and bearing capacity calculation of steel fiber reinforced high strength concrete two-pile caps. J. Build. Struct. 2023, 44, 234–245. [Google Scholar] [CrossRef]
  24. Yan, X.; Shi, Q.X.; Xu, Z.D. Experimental study on bond behavior between concrete and deformed steel bar with different steel bar. J. Hunan Univ. 2020, 47, 45–52. [Google Scholar] [CrossRef]
  25. Mortazavian, S.; Fatemi, A. Effect of fiber orientation and anisotropy on tensile strength and elastic modulus of short fiber reinforced polymer composites. J. Compos. Part B Eng. 2015, 72, 116–129. [Google Scholar] [CrossRef]
  26. Huo, L.Y.; Bi, J.H.; Zhao, Y.; Wang, Z.Y. Constitutive Model of Hybrid Steel Fiber Reinforced Concrete with Different Fiber Lengths. Constr. Build. Mater. 2022, 25, 1034–1039. [Google Scholar]
  27. Foster, S.J. On Behavior of High-Strength Concrete Columns: Cover Spalling, Steel Fibers and Ductility. ACI Struct. J. 2001, 98, 583–589. [Google Scholar] [CrossRef]
  28. Vecchio, F.J.; Collins, M.P. Predicting the response of reinforced concrete beams subjected to subjected to shear using modified compression field theory. ACI Struct. J. 1988, 85, 258–268. [Google Scholar] [CrossRef]
  29. Naaman, A.E.; Moavenzadeh, F.; Mcgarry, J. Probabilistic analysis of fiber reinforced concrete. J. Eng. Mech. Div. 1974, 100, 397–431. [Google Scholar] [CrossRef]
  30. Bentz, E.C.; Vecchio, F.J.; Collins, M.P. Simplified modified compression field theory for calculating shear strength of reinforced concrete elements. ACI Struct. J. 2006, 103, 614–624. [Google Scholar] [CrossRef]
  31. Collins, M.P.; Mitchell, D.; Adebar, P. A general shear design method. ACI Struct. J. 1996, 93, 36–45. [Google Scholar] [CrossRef]
  32. Fattuhi, N.I. Reinforced corbels made with plain and fibrous concretes. ACI Struct. J. 1994, 91, 530–536. [Google Scholar] [CrossRef]
  33. Campione, G.; Lidia, L.M.; Maria, L.M. Steel Fiber-Reinforced Concrete Corbels: Experimental Behaviour and Shear Strength Prediction. ACI Struct. J. 2007, 104, 570–579. [Google Scholar] [CrossRef]
  34. Munez, P.R. Reinforced Concrete Corbels—Shear Strength Model and Design Formula. ACI Struct. J. 2006, 103, 904–906. [Google Scholar] [CrossRef]
  35. Faleh, S.K.H.; Chkheiwer, A.H.; Saleh, I.S. Structural behavior of high-strength concrete corbels involving steel fibers or closed stirrups. Period. Eng. Nat. Sci. 2022, 10, 239–252. [Google Scholar] [CrossRef]
  36. Fattuhi, N.I. Column-Load Effect on Reinforced Concrete Corbels. J. Struct. Eng. 1990, 116, 188–197. [Google Scholar] [CrossRef]
  37. Yang, J.M.; Lee, J.H.; Yoon, Y.S. Influence of Steel Fibers and Headed Bars on the Serviceability of High-Strength Concrete Corbels. J. Struct. Eng. 2012, 138, 123–129. [Google Scholar] [CrossRef]
  38. Fattuhi, N.I. Strength of SFRC Corbels Subjected to Vertical Load. J. Struct. Eng. 1990, 116, 701–718. [Google Scholar] [CrossRef]
Figure 1. Average stress Mohr’s circle of concrete. (a) Average stress of concrete; (b) Average stress Mohr’s circle.
Buildings 14 00388 g001
Figure 2. The effective orientation of the steel fiber.
Buildings 14 00388 g002
Figure 3. Compatibility conditions for cracked concrete. (a) Average strain for cracked concrete; (b) Mohr’s circle of average stress.
Buildings 14 00388 g003
Figure 4. Stress distribution at the crack and between cracks. (a) Average stress between cracks; (b) Local stress at cracks.
Buildings 14 00388 g004
Figure 5. Calculation flow chart.
Buildings 14 00388 g005
Figure 6. Specimen dimension and reinforcement.
Buildings 14 00388 g006
Figure 7. Failure patterns of specimens: (a) specimen MC01; (b) specimen MC03.
Buildings 14 00388 g007
Figure 8. Comparison between test and prediction values [35,36,37,38].
Buildings 14 00388 g008aBuildings 14 00388 g008b
Table 1. Specimen parameters.
SpecimensMain
Reinforcement
Ratio
of
Reinforcement
StirrupStirrup Reinforcement RatioShear Span RatioEffective DepthSteel Fiber Dosage
MC014C120.55%A10@1000.785%0.24001.5%
MC024C120.55%A10@1000.785%0.34001.5%
MC034C120.55%A10@1000.785%0.44001.5%
MC044C120.55%A10@1000.785%0.34001.5%
MC054C120.55%A10@1000.785%0.34001.5%
MC064C120.75%A10@1500.390%0.34001.5%
MC074C120.98%A10@2000.520%0.34001.5%
MC084C120.55%A10@1000.785%0.34000
MC094C120.55%A10@1000.785%0.34000.75%
Table 2. Measured mechanical properties of reinforcement.
Reinforcement TypeDiameter
(mm)
Cross-Sectional Area (mm2)Yield Strength (MPa)Elastic Modulus (GPa)Ultimate Strength (MPa)
HPB3001078.5333.7195.95535.8
HRB40012113.1425.2172.6541.4
HRB40014153.9467.8185.0582.3
HRB40016201.1427.3192.5587.7
Table 3. Test results and failure patterns of specimens.
Specimens V cr N /kN V cr D /kNVu/kNFailure Patterns
MC01270400879Diagonal shear patterns
MC02220290822Diagonal compression pattern
MC03166.5255695Diagonal compression pattern
MC04220355874Diagonal compression pattern
MC05193386.5981.5Diagonal compression pattern
MC06192234.5670.5Diagonal compression pattern
MC07164240751Diagonal compression pattern
MC08150331775Diagonal compression pattern
MC09180381767Diagonal compression pattern
Table 4. Comparison of experimental and calculated shear bearing capital.
ReferencesSpecimensb/mmh0/mmρfVtestVtest/VFVtest/VCVtest/VRVtest/Vn
This studyMC012004001.50%8790.8591.7681.1201.113
MC022004001.50%8221.1161.4201.2081.041
MC032004001.50%6951.1921.1561.1391.159
MC042004001.50%8740.9781.5341.2011.107
MC052004001.50%981.50.9291.7501.2701.114
MC062004001.50%670.50.9111.1591.2271.102
MC072004001.50%7511.0201.2981.2721.116
MC082004000%7751.0181.3421.1481.144
MC092004000.75%7671.0711.3211.1301.173
Faleh et al. [35]CF3-0.52002500.50%11251.251.4801.3971.162
CF3-1.02002501.00%12200.9601.4351.3561.104
CF3-1.52002501.5%12300.9111.2811.3371.027
Fattuhi et al. [36]11501251.70%1530.9171.4361.4531.132
21501251.70%1600.9901.4491.4701.104
31501291.70%91.20.9471.5801.1301.079
41501271.70%930.9521.6471.2081.029
51501241.70%1031.0081.1211.3251.213
61501251.70%95.70.9401.0751.2761.003
91501251.70%152.90.9541.5581.6801.097
101501241.70%102.91.0241.1661.4181.068
121501270.70%920.7771.9741.2581.145
131501251.70%111.70.9201.6741.4241.143
161501251.70%114.30.9481.6221.3441.103
181501251.00%1190.8201.9211.4221.052
Yang et al. [37]CW12004000%12710.9641.6151.2521.115
CW22004000.50%13671.0051.4991.3901.073
CW32004000.75%14401.0431.1451.3271.110
Fattuhi et al. [38]201531241.75%1260.8511.3421.3131.056
211561221.50%1180.8211.4551.4601.041
231531232.00%126.50.8691.2671.3241.038
27153.51242.50%171.50.8501.6811.3581.204
321541202.00%132.50.8351.1311.2211.044
39153.51242.25%144.50.8431.2311.4201.219
49154.41222.50%164.50.8301.7211.4661.073
Mean 1.4530.9421.3111.103
Variance 0.0610.0090.0170.003
Disclaimer/Publisher’s Note: The statements, opinions and data contained in all publications are solely those of the individual author(s) and contributor(s) and not of MDPI and/or the editor(s). MDPI and/or the editor(s) disclaim responsibility for any injury to people or property resulting from any ideas, methods, instructions or products referred to in the content.

