Article

Exploring Cost Variability and Risk Management Optimization in Natural Disaster Prevention Projects

1
Department of Center for Intelligent Construction Automation, Kyungpook National University, 80 Daehakro, Daegu 41566, Republic of Korea
2
Department of Law School, Kyungpook National University, 80 Daehakro, Daegu 41566, Republic of Korea
3
Department of Civil Engineering, Kyungpook National University, 80 Daehakro, Daegu 41566, Republic of Korea
*
Author to whom correspondence should be addressed.
Buildings 2024, 14(2), 391; https://doi.org/10.3390/buildings14020391
Submission received: 22 December 2023 / Revised: 23 January 2024 / Accepted: 29 January 2024 / Published: 1 February 2024
(This article belongs to the Section Construction Management, and Computers & Digitization)

Abstract

:
The purpose of this study is to analyze the causes of cost variation in natural disaster prevention projects (NDPPs) in Gyeongsangbuk-do, South Korea, and develop tailored cost and risk management strategies. Utilizing a binary logistic regression model, this research uniquely focuses on the Gyeongsangbuk-do region, gathering data from 244 stakeholders through an online survey. The study identifies critical variables influencing cost deviation, including project management risk (PMR), project costing and execution risk (PCER), project execution strategy risk (PESR), construction project risk (CPR), project cost and schedule risk (PCSR), project management challenges (PMCs), and construction project subcontractor and safety management (CPSSM). Significant findings revealed PMR (OR = 3.744, 95% C.I. [1.657, 8.457]), PCER (OR = 5.068, 95% C.I. [2.236, 11.484]), and PESR (OR = 3.447, 95% C.I. [1.853, 6.413]) as the primary causes of cost deviation, alongside the notable impacts of other factors such as CPSSM. The developed predictive model is instrumental for NDPP stakeholders in Gyeongsangbuk-do, providing advanced risk management capabilities and aiding in effective preventive measures. This study not only corroborates theoretical hypotheses from previous research but also offers new insights into cost deviation causes in NDPPs, thereby enhancing strategic decision-making and advancing risk management perspectives.

1. Introduction

1.1. Background and Purpose of the Study

Natural disasters pose severe challenges, including loss of life, economic damage, environmental destruction, and mental health issues [1]. Natural disaster prevention projects (NDPPs) play a crucial role in mitigating these impacts by safeguarding lives, reducing economic losses, and protecting the environment. However, cost deviations due to inconsistent management and construction practices significantly threaten the success of these projects [2].
This study aims to thoroughly analyze the risks associated with cost deviation in NDPPs and develop effective cost control and risk management strategies. The objective is to reduce disputes between stakeholders and enhance the success rate of these projects.
Previous research indicates that cost deviation in construction projects remains a persistent issue [3]. Studies by Ibrahim and Elshwadfy [4] and Raghib et al. [5] have explored various factors influencing cost deviation, including the expertise of cost estimators, completeness of cost information, and external economic influences like inflation. Our study extends this research by focusing on identifying the causes of cost deviations specifically in NDPPs and developing a risk management approach to better predict and manage these deviations.
The findings of this study are expected to significantly reduce cost deviations and improve the effectiveness of NDPPs. Additionally, they underscore the critical role of risk management in policy development and provide vital insights for the successful execution of NDPPs.

1.2. Scope and Methodology

This research focuses on NDPPs within Gyeongsangbuk-do, a region actively engaged in various disaster prevention and maintenance initiatives, including significant budget allocations for river disaster prevention projects [6]. The study’s results, while centered on Gyeongsangbuk-do, are anticipated to offer generalizable insights applicable to similar projects in other regions.
The progression of the study is summarized in Figure 1. The introduction highlights the importance of NDPPs and the causes of cost deviations and presents the research objectives and methods. Next, the theoretical background reviews previous studies and theories related to cost deviation in construction projects. Based on this, the research model and hypotheses are developed. In the empirical study, the collected survey data are analyzed to determine the key factors of cost deviation, and the binary logistic regression analysis is used to derive risk management optimization measures for NDPPs. Finally, the conclusion summarizes the findings and discusses the implications and limitations of the study. This research methodology is not limited to NDPPs in Gyeongsangbuk-do, but is expected to provide generalized results that can be applied to projects in other regions dealing with similar issues.

2. Literature Review

2.1. Construction Project Cost Deviation and Risk Management Theory

Cost deviations in construction projects, including natural disaster prevention projects (NDPPs), significantly impact project success [7,8]. These deviations pose financial risks and challenges, especially for clients and contractors [9]. Annamalaisami and Kuppuswamy [10] highlight the importance of understanding project status and monitoring financial risks to improve project performance. Górecki and Diaz-Madronero [11] emphasize developing frameworks to mitigate variances between planned budgets and actual project costs, considering the uncertainty in the built environment.
Various approaches have been used to predict and control cost deviation. For example, Alsugair [9] analyzed historical and ongoing project data, while Górecki and Diaz-Madronero [11] proposed a research methodology tailored to sustainable construction projects. Przywara and Rak [12] used the earned value method (EVM), and Raut et al. [13] provided guidelines for cost risk management.

2.2. Research on Cost Deviation in Construction Projects

The literature extensively explores cost deviation causes and effects in construction projects, including NDPPs. Górecki and Diaz-Madronero [11] identified project characteristics, contractual procedures, and estimate performance as main causes. Flyvbjerg et al. [3] found that cost deviation has not decreased over decades, with larger projects experiencing greater cost growth. This trend is evident in various regions: Narayanan et al. [14] reported significant overruns in Indian infrastructure projects, and Carr [15] observed a 28% average cost overrun in New York State education construction projects.
External factors like material and labor price volatility are major causes of cost deviations [13,16,17]. In NDPPs, these factors can be even more pronounced due to the unique challenges these projects face. For instance, the unpredictable nature of natural disasters can lead to sudden changes in project scopes and costs.
Specific examples of NDPP cost deviation issues are seen worldwide. For example, the river embankment project in Thailand experienced a 35% cost overrun due to unforeseen geological challenges and scope changes [18]. In Japan, the tsunami barrier project post-2011 earthquake saw a 40% increase in costs attributed to revised safety standards and additional engineering requirements [19].
These examples highlight the need for studies specifically addressing cost deviation in NDPPs. Most current research focuses on general construction projects, with limited emphasis on the unique challenges of NDPPs. Our study aims to fill this gap by focusing on NDPPs, exploring the underlying issues of cost deviation, and proposing innovative and practical management strategies. By doing so, this study aims to provide a different approach from previous research, tailoring a cost deviation risk management plan to the specificities of NDPPs.

3. Research Methodology

3.1. Deriving Cost Variation Influencing Factors

In our comprehensive review of the global research on cost deviation in construction projects, we observe a diverse range of factors influencing these deviations. Studies from the Middle East, Saudi Arabia, and Egypt, such as those by Abdel-Monem et al. [20], Alsugair [9], and Ibrahim and Elshwadfy [4], emphasize aspects like project complexity and estimator competence. In New Zealand, research by Albtoush et al. [21] and Cong et al. [22] focuses on project and client characteristics. Malaysian studies by Azman and Adeleke [23], Endut et al. [16], and Memon et al. [24] concentrate on scope and information quality.
Moreover, Mahamid and Aichouni [25] from Saudi Arabia delve into factors including client and consultant roles, cost estimating, and project characteristics. In the context of India, Raut et al. [13] investigate the influence of time, cost, and quality on cost deviation, particularly in road and highway projects. Gómez Cabrera [8] from Colombia highlights the impact of the competitive bidding process, while Przywara and Rak [12] in Poland examine time variances related to schedule and cost.
This diversity, as shown in the ‘Country’ and ‘Research Field’ columns of Table 1, underlines the global relevance and variability of cost deviation factors in construction projects, supporting the study’s aim to develop a comprehensive understanding of these deviations in various contexts.
These extensive studies show that cost deviation in construction projects is a complex phenomenon that is influenced by a variety of internal and external factors. In particular, project scope, complexity, client and contractor characteristics, design and consultant roles, market conditions, and economic factors have been shown to have a significant impact on cost deviation. Based on the results of these previous studies, this study aims to develop a cost deviation management strategy specialized for NDPPs. This study aims to provide a new perspective to reduce cost deviation in construction projects and support the successful execution of projects.
Figure 2 illustrates a systematic approach to identifying key variables that influence construction project cost deviation using the Delphi technique.
Regarding the selection of experts, we invited professionals based on their extensive experience and contribution to the field of construction project management. These included academic researchers, industry practitioners, and project consultants with a minimum of 10 years of relevant experience. Their demographic information, including their respective fields of expertise, years of experience, and professional backgrounds, has been incorporated into the manuscript to elucidate their qualifications.
Figure 2 outlines the Delphi method used to identify influential variables for construction project cost deviation. Initially, 355 survey questions from prior research were collected, assessing factors impacting cost variations. A refinement phase followed, where duplicate questions were eliminated, resulting in 127 unique items. An expert panel utilizing the Delphi technique further condensed these to 48 critical cost deviation factors, ensuring a focused and expert-driven analysis, as shown in Table 2. In the next step, these factors were reconstructed into seven independent variables through an in-depth exploratory factor analysis (EFA). The EFA was conducted to identify underlying relationships between the observed variables and to consolidate them into coherent factors for our cost deviation model. To finalize this systematic process, a Delphi meeting was held once again to assign definitive names to these independent variables, thus establishing a conceptual framework for a cost deviation model specific to natural disaster prevention.
Table 3 summarizes the questions related to the operationalization of the variables based on the results of the EFA, detailing the different risk management areas of river disaster prevention projects.
PMR reflects the complex impact of these issues on the financial health of the project, including budget deviations, contract terms, environmental impacts, risk management, regulatory compliance, bidding processes, price changes, and stakeholder reactions.
PCER includes the manager’s calculation of labor costs, reliability of cost information, comparison of costs under alternative methods, time allowed for preparation of cost calculations, accuracy of appropriate costing methods, regulatory changes due to legislative/agency changes, and delays in contract execution.
PESR addresses issues related to the duration of the project, including securing financing and budget, experience and performance of the management team, profit and loss information from similar projects, relationships with subcontractors and suppliers, feasibility of design and execution, the client’s financial condition and budget, clear and specific specifications and drawings, budget allocation, and cost control based on project priorities.
CPR covers issues such as possible complaints from residents, construction stoppages during winter, additional costs due to maintenance considerations, delayed compensation, and imbalances between material supply and demand.
PCSR includes reduced productivity and additional costs due to weather conditions, increased budget due to low bids during the project, lack of technical skills of managers, additional costs due to short construction time, and cost reductions or changes due to budget shortfalls.
PMCs include mismatches between design conditions and site conditions, cost increases and schedule delays due to additional work, risk of delayed project start and completion dates, conflicts between consortium members, risk of regulatory changes related to acquisitions, and lack of project risk management experts.
CPSSM emphasizes the importance of managing the risks and safety associated with a project’s subcontractors, including issues such as lack of subcontractor technical capabilities, pressure to meet target execution rates, possible subcontractor bankruptcy, and pressure for zero accidents onsite.

3.2. Research Models and Hypotheses

Based on an in-depth literature review and theoretical foundation, this study empirically analyzes how independent variables such as PMR, PCER, PESR, PCSR, CPR, PMC, and CPSSM affect the cost deviation of river disaster prevention projects. According to Flyvbjerg et al. [3], cost variance in construction projects has been consistently affected by various factors such as time, cost, and organizational changes. Alsugair [9] pointed out that project characteristics, contracting procedures, and the estimator’s competence have a significant impact on cost deviation. In this study, we will establish and test the hypotheses shown in Figure 3:
  • H1: PMR level has a significant effect on cost deviation in NDPPs.
  • H2: PCER level has a significant effect on cost deviation in NDPPs.
  • H3: PESR level has a significant effect on cost deviation in NDPPs.
  • H4: CPR level has a significant effect on cost deviation in NDPPs.
  • H5: PCSR level has a significant effect on cost deviation in NDPPs.
  • H6: PMC level has a significant effect on cost deviation in NDPPs.
  • H7: CPSSM level has a significant impact on cost deviation in NDPPs.
These hypotheses, which were verified through rigorous data analysis, are expected to provide important insights for strategic decisions to minimize cost deviations in NDPPs and ensure successful project implementation.

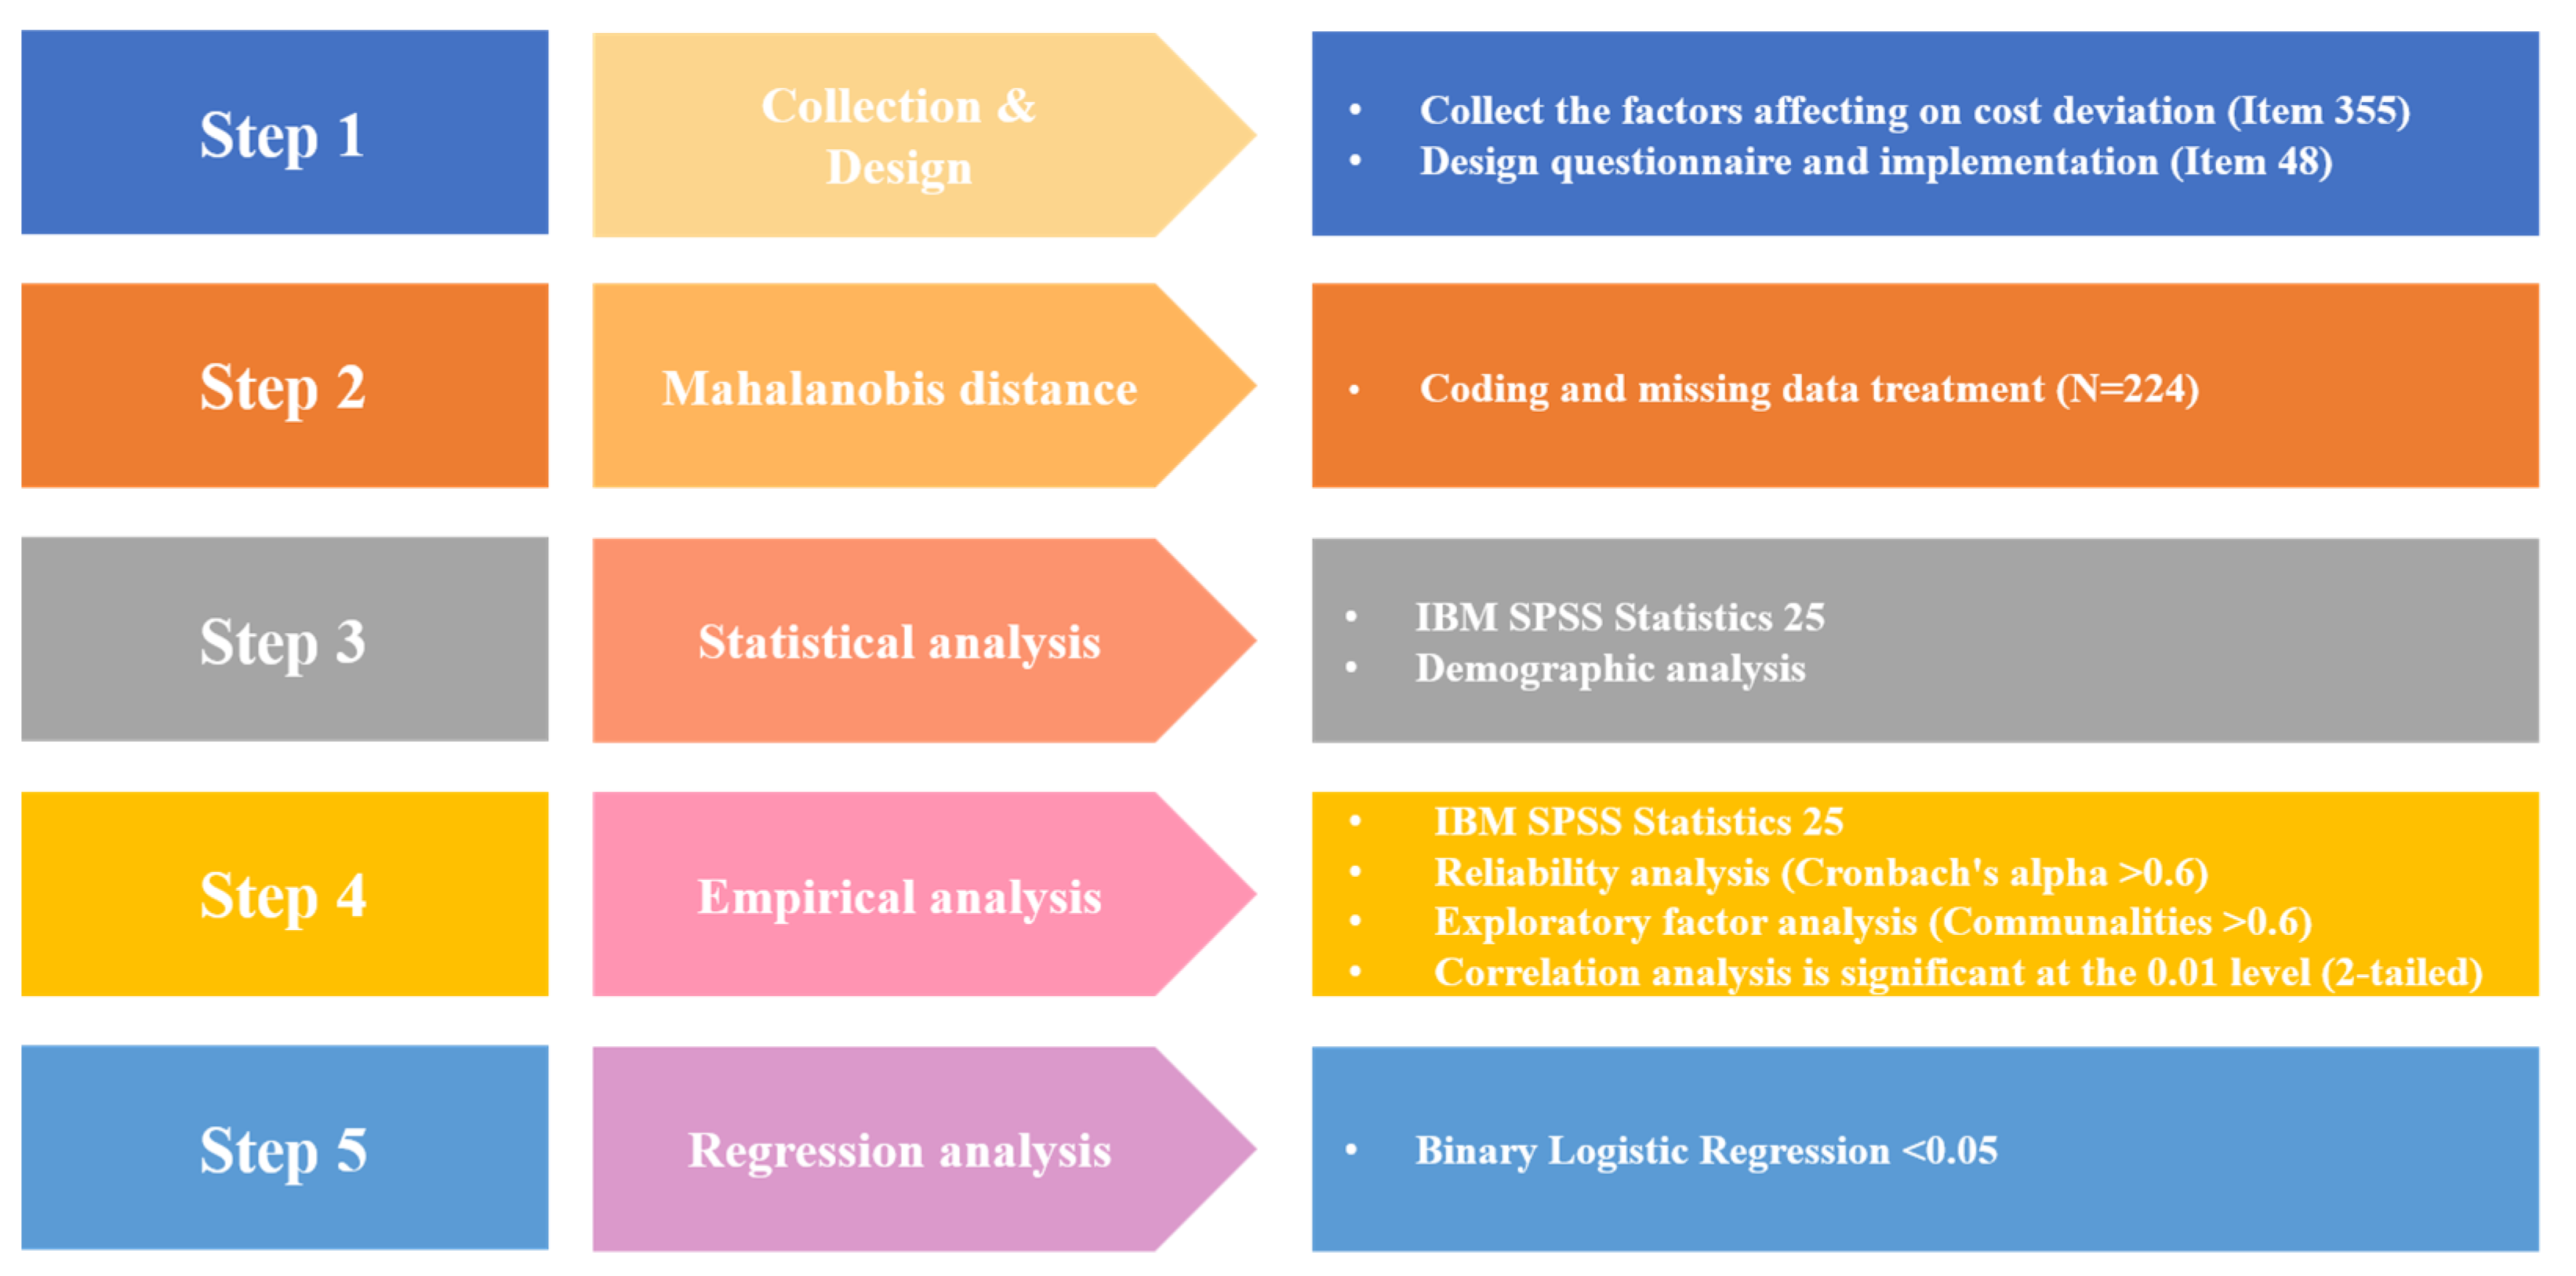
3.3. Research Analysis Methodology

The analysis procedure of this study aims to identify and evaluate the factors affecting the cost deviation of NDPPs, as summarized in Figure 4.
In the first step, we extensively collected various factors that can affect project cost deviation and obtained a total of 355 items. A questionnaire was then designed and administered to refine the data to 48 items.
In the second phase of data analysis, we utilized Mahalanobis distance to identify outliers, coding, and missing data processing for a total of 224 valid data.
In the third step, we conducted a demographic analysis of the collected data using IBM SPSS Statistics 25 software. This process was used to determine the basic statistics of the research data and to explore the basic relationships between the various variables.
In the fourth step, empirical analysis, the same software was used to analyze the reliability of the data by calculating the Cronbach’s alpha value, which is considered reliable only if it is above 0.6. EFA was used to identify structural relationships between the variables, and commonality values were set to 0.6 or higher to assess the fit of the variables. Correlation analysis was conducted to assess the strength and direction of the correlation between the variables by testing for significance using a two-tailed test at the 0.01 level.
Finally, in the regression analysis step, a binary logistic regression was performed to analyze the impact of the independent variables on the dependent variable of cost deviation. The results were considered significant only if the p-value was less than 0.05 to determine the factors affecting cost deviation.
Through this systematic procedure, this study aims to provide an in-depth understanding of the main factors that cause cost deviation in NDPPs and suggest management measures accordingly.
This study utilized a comprehensive approach to survey stakeholders involved in natural disaster prevention projects (NDPPs) in Gyeongsangbuk-do. The survey, conducted from 1–20 July 2023, targeted a wide range of participants to ensure diverse and representative insights.
The target population included all stakeholders actively engaged in NDPPs in Gyeongsangbuk-do. We employed stratified sampling to ensure representation from various groups, including government officials, contractors, engineers, and local community leaders. A total of 244 participants were surveyed. This sample size was determined based on the standard error calculation and confidence level suitable for the population size, ensuring the findings could be reliably generalized to the broader population of NDPP stakeholders in the region. Survey participants were selected based on their direct involvement in NDPPs, their experience level, and their role in the project. This included decision makers, project managers, technical staff, and local community representatives, ensuring a comprehensive understanding of the project landscape. Informed consent was obtained from all participants. The survey was conducted in accordance with ethical standards, including confidentiality and voluntary participation. Data were collected and used strictly for research purposes, respecting the privacy and rights of the respondents.
Responses were measured on a seven-point Likert scale to assess the impact of each independent variable. The dependent variable, “cost deviation”, was quantified using binary categorization (0 for “no cost deviation”, 1 for “cost deviation”).
The details of the metrics can be found in Table 2 of the research paper.
To ensure the reliability of the data, the Mahalanobis distance was calculated during the analysis to detect outliers. Based on the chi-square distribution at the 99% confidence level, we removed 20 data that were deemed to be insincere responses. As a result, 224 valid responses were used in the analysis.
The demographic characteristics of the respondents are summarized in Table 4, with 96.43% of the total 224 respondents being male and 3.57% female. By work position, 78.57% of the respondents were construction managers, followed by 17.86% construction project managers and 3.57% owners. In terms of work experience, 65.18% had less than 10 years of experience, 29.46% had between 11 and 20 years, and 5.36% had more than 21 years. These sample characteristics may affect the generalizability of the findings and should be interpreted with caution.

4. Empirical Analysis

In addressing the intricacies of cost deviation within NDPPs, our empirical analysis, underpinned by a robust binary logistic regression framework, delineates the significant factors contributing to cost variance. Our investigation is anchored in a comprehensive review of the literature and empirical evidence, as underscored by seminal works in the field. We extend previous findings by providing quantitative validation of the influential roles played by PMR, PCER, and PESR. This study also unveils additional determinants, notably CPSSM, which have hitherto received minimal emphasis. By adopting a more granular analytical approach, we refine the predictive capabilities of the model, yielding a strategic tool for stakeholders’ decision-making processes. Consequently, our analysis not only corroborates but augments existing theories, emphasizing a proactive stance in managing risk and preemptive actions in the realm of NDPPs.

4.1. Reliability and Validity Analysis

Following the methodology presented in Figure 4, this study conducted a series of analytical procedures with the aim of exploring the underlying structure of the variables. To ensure a systematic approach to the study, the empirical analysis was conducted using data from a total of 224 respondents. As a basis for this, the results of the analysis are summarized in Table 5. Descriptive statistics were calculated for the survey items (Q1~Q48) and reliability statistics were calculated to assess the reliability of each item.
Reliability statistics were measured using Cronbach’s alpha coefficient, and if the value was greater than 0.6, the item or scale was considered to have a consistent response tendency. The results of the reliability analysis in this study showed high consistency, especially the Cronbach’s alpha value of 0.979, which is very high, indicating high reliability of the responses. In addition, a correlation matrix analysis was conducted to examine the correlation between the variables, and all variables were found to be suitable for factor analysis by recording a correlation coefficient of 0.3 or higher. These analyses contribute to understanding how the variables can be explained by related factors and provide results that further strengthen the validity of this study.

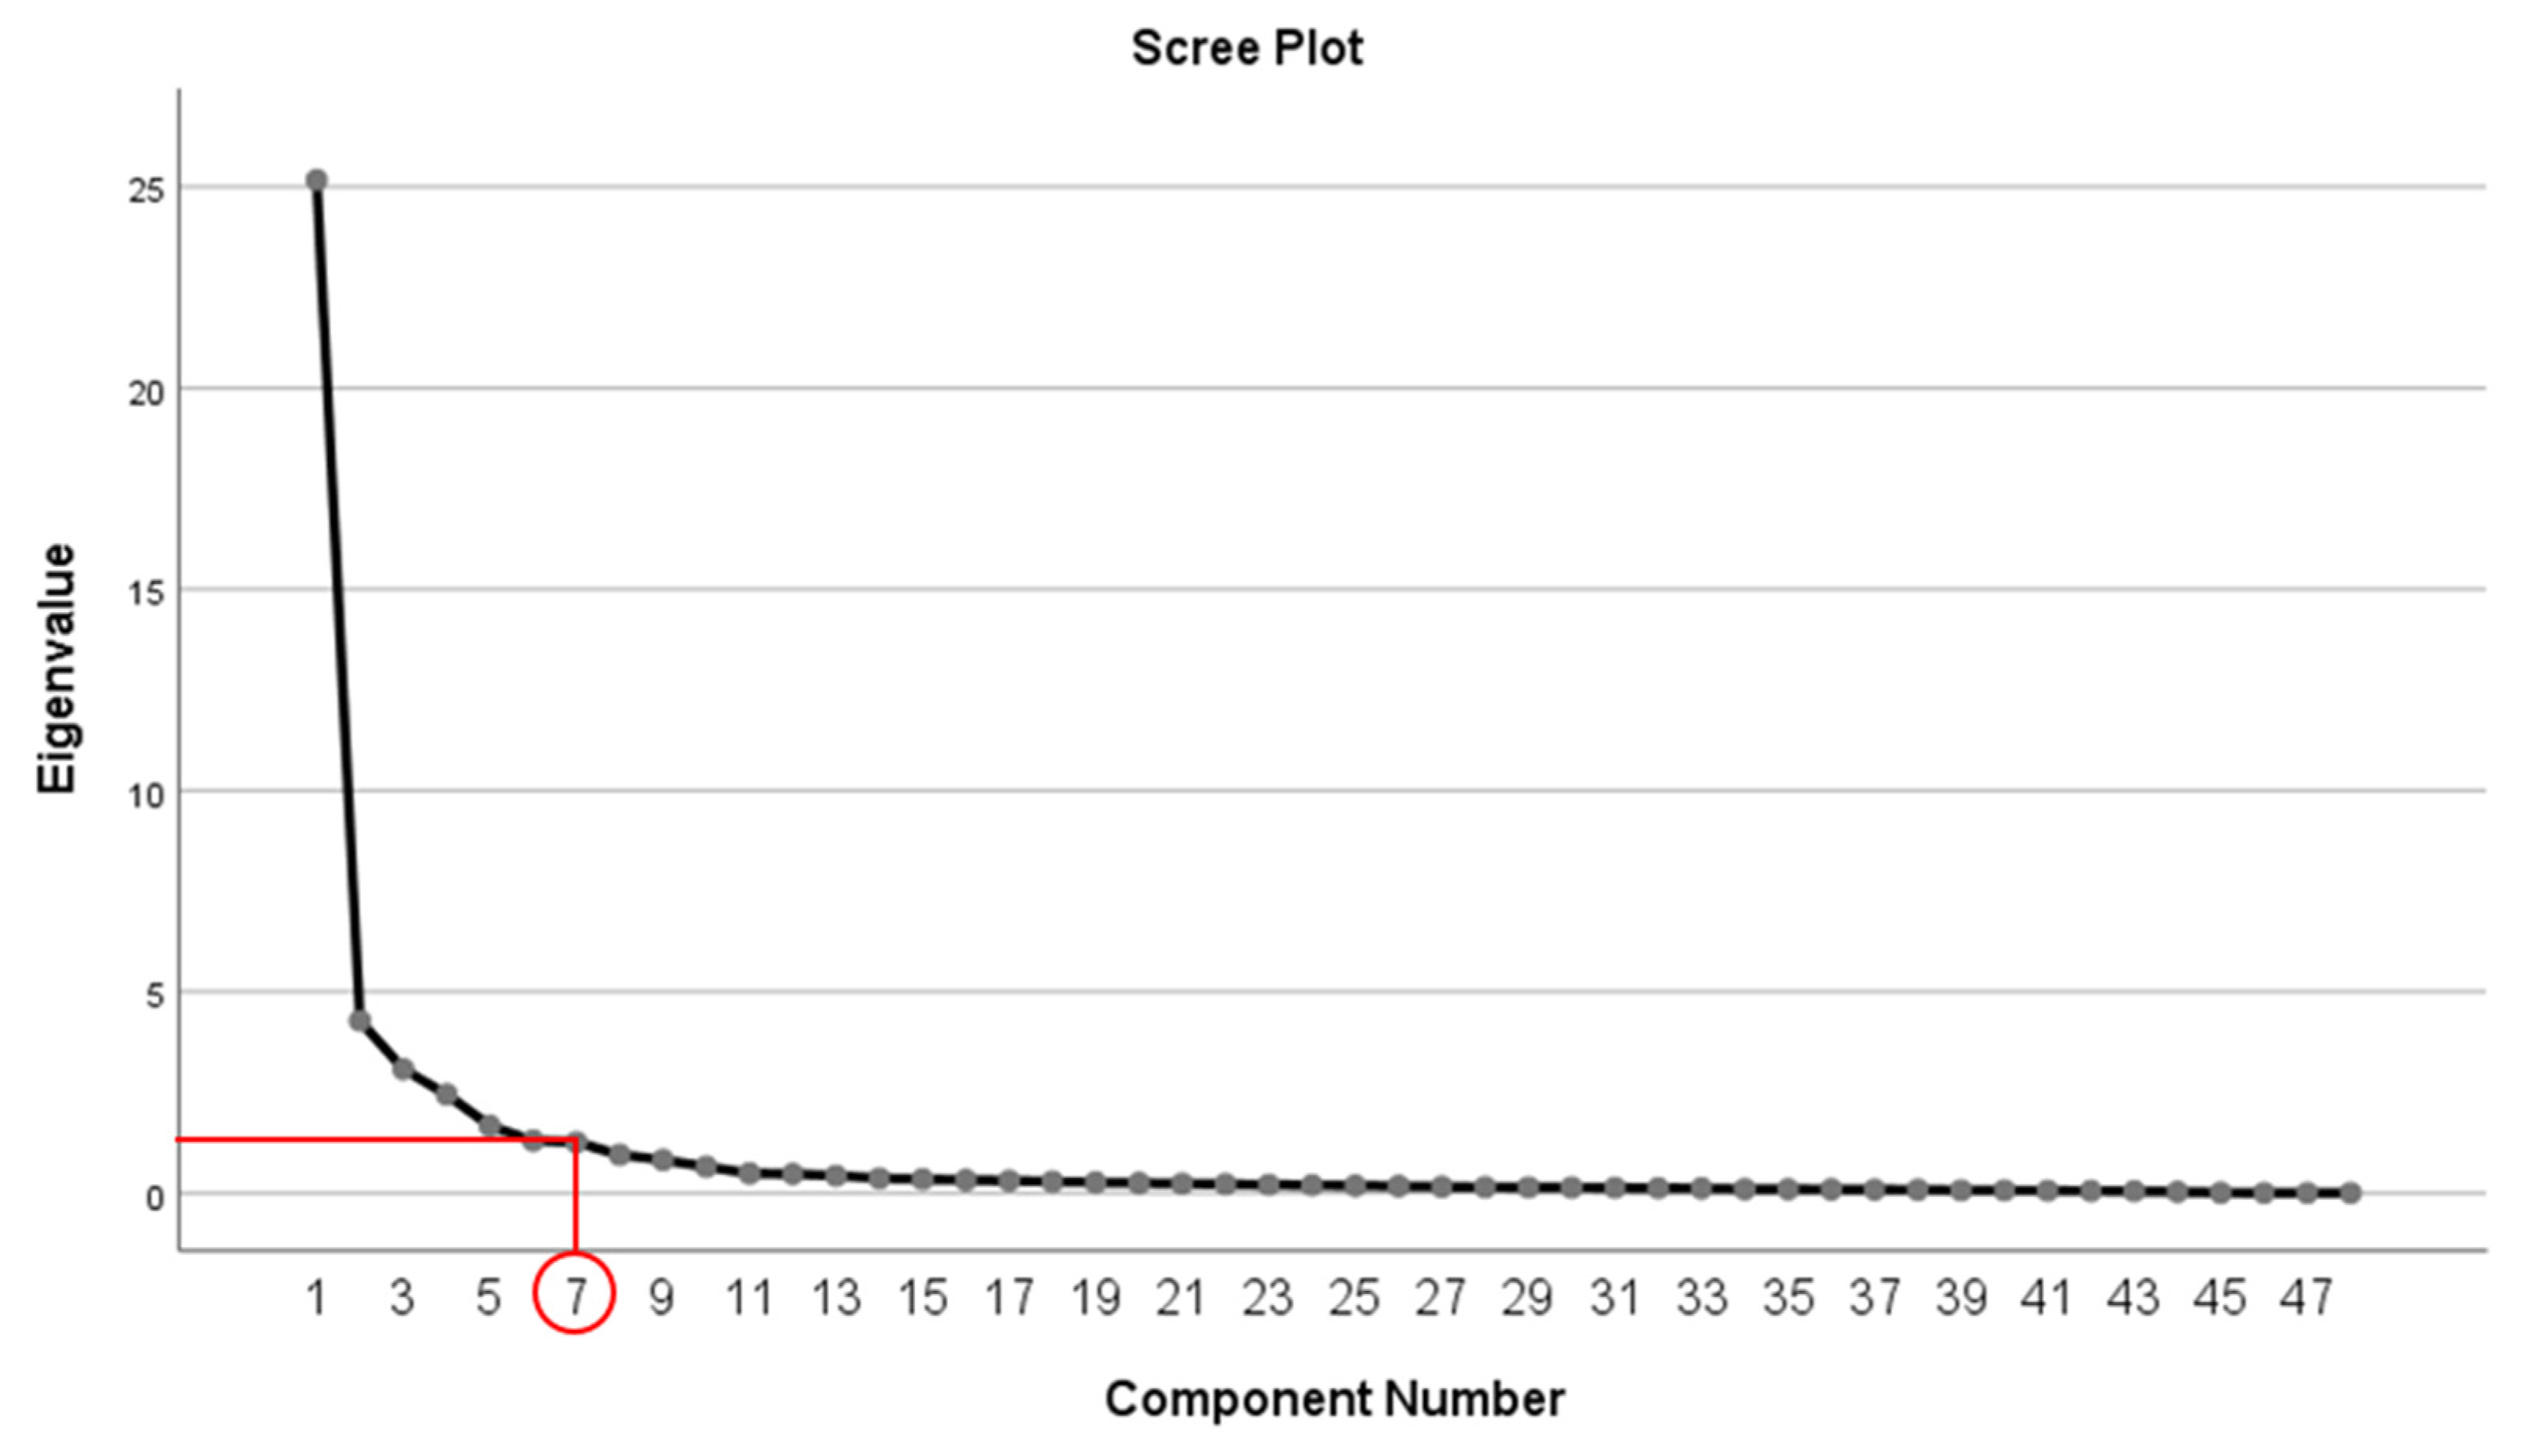
4.2. Exploratory Factor and Correlation Analysis

The results of the KMO and Bartlett’s test in this study strongly support the appropriateness of factor analysis. The KMO measure was 0.838, suggesting that the sample was suitable for factor analysis, and the Bartlett’s test of sphericity was highly significant, with a p-value of less than 0.001. This means that the selected variables are correlated with each other and can be explained by common factors.
The communality analysis showed that all variables had eigenvalues above 0.6, indicating that they share a significant amount of common variance. This indicates that the variables have a strong relationship with the potential factors.
The results of the EFA are summarized in Table 6, and Figure 5 shows that the principal component analysis method was applied to derive a total of seven factors with an eigenvalue of 1 or higher. These factors accounted for approximately 81.655% of the total variance explained, indicating that they consisted of major factors that faithfully reflected the complexity of the research object. The extracted factors were subjected to a varimax orthogonal rotation to optimize the loading values of the variables, and variables with a loading value of ±0.5 or more were assigned to each factor.
Finally, we analyzed the correlations between the factors and measured their reliability. As shown in Table 7, the correlation analysis shows that the correlation between all factors is statistically significant, and the reliability analysis, measured by a Cronbach’s alpha value above 0.8, shows that the internal consistency of these factors is high. These results provide justification for the interpretation of each factor and contribute to increasing the depth and accuracy of the study. These analytical procedures provide an important basis for the empirical chapter of the thesis and strengthen the validity of the overall findings.

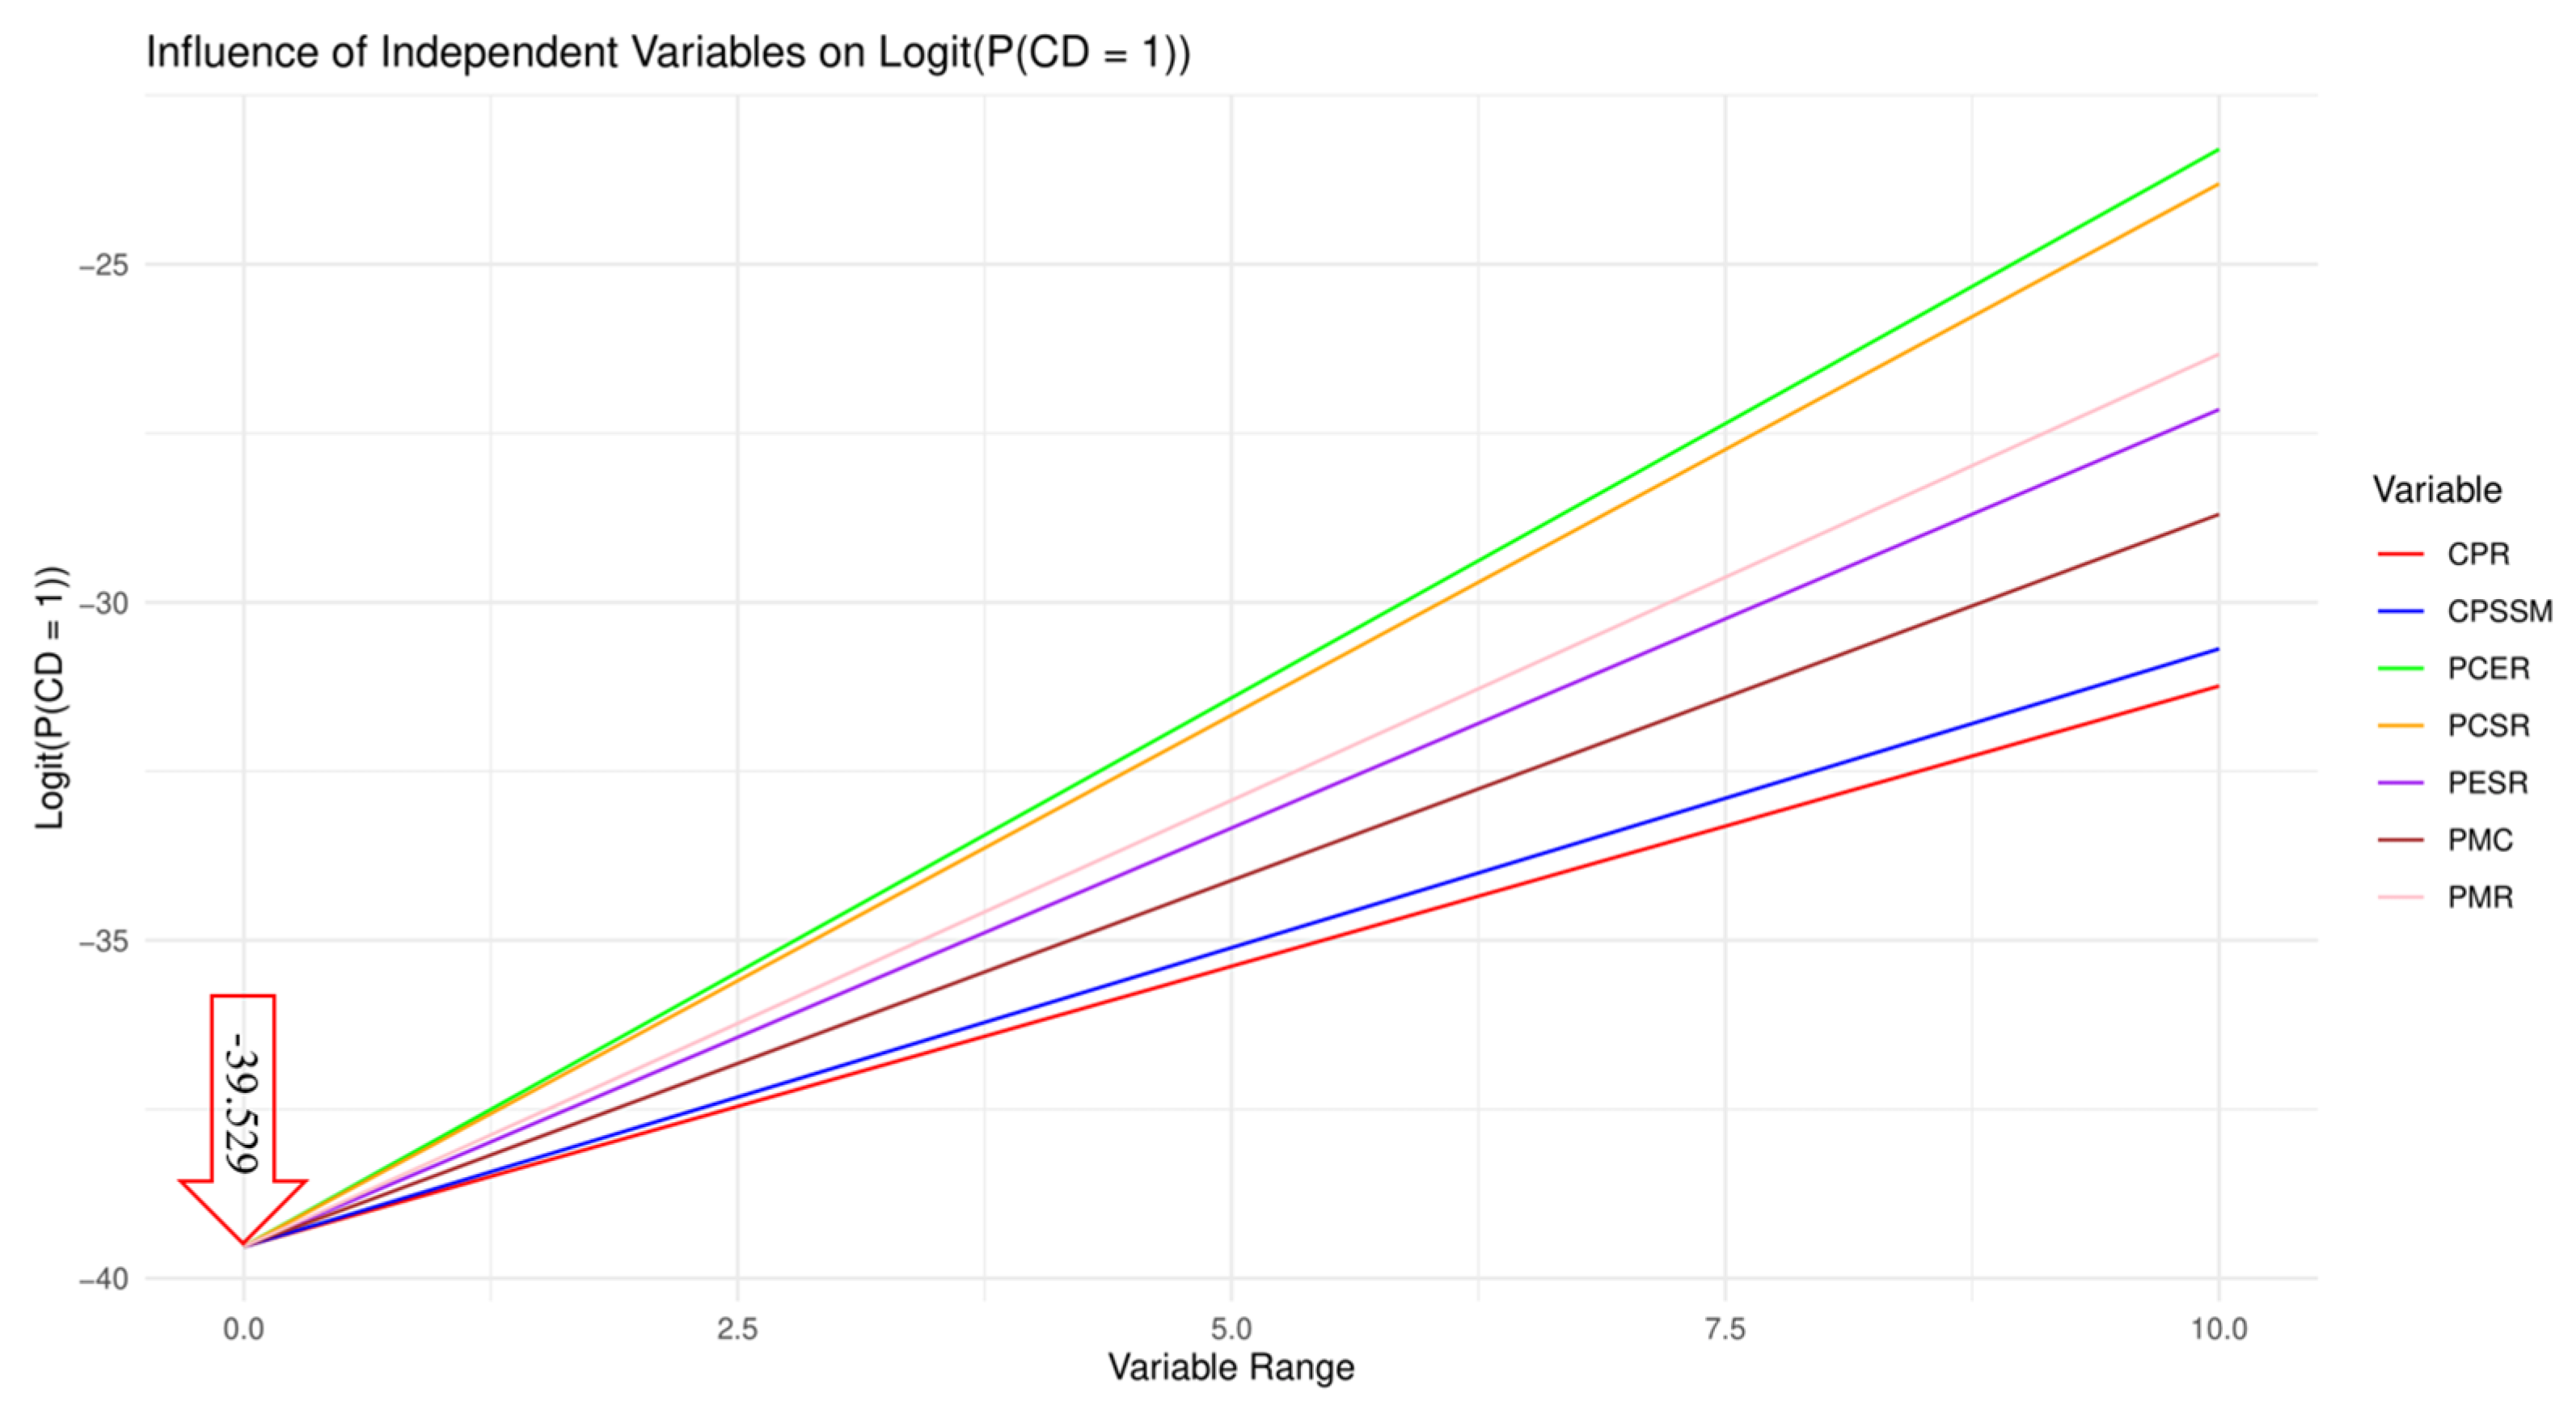
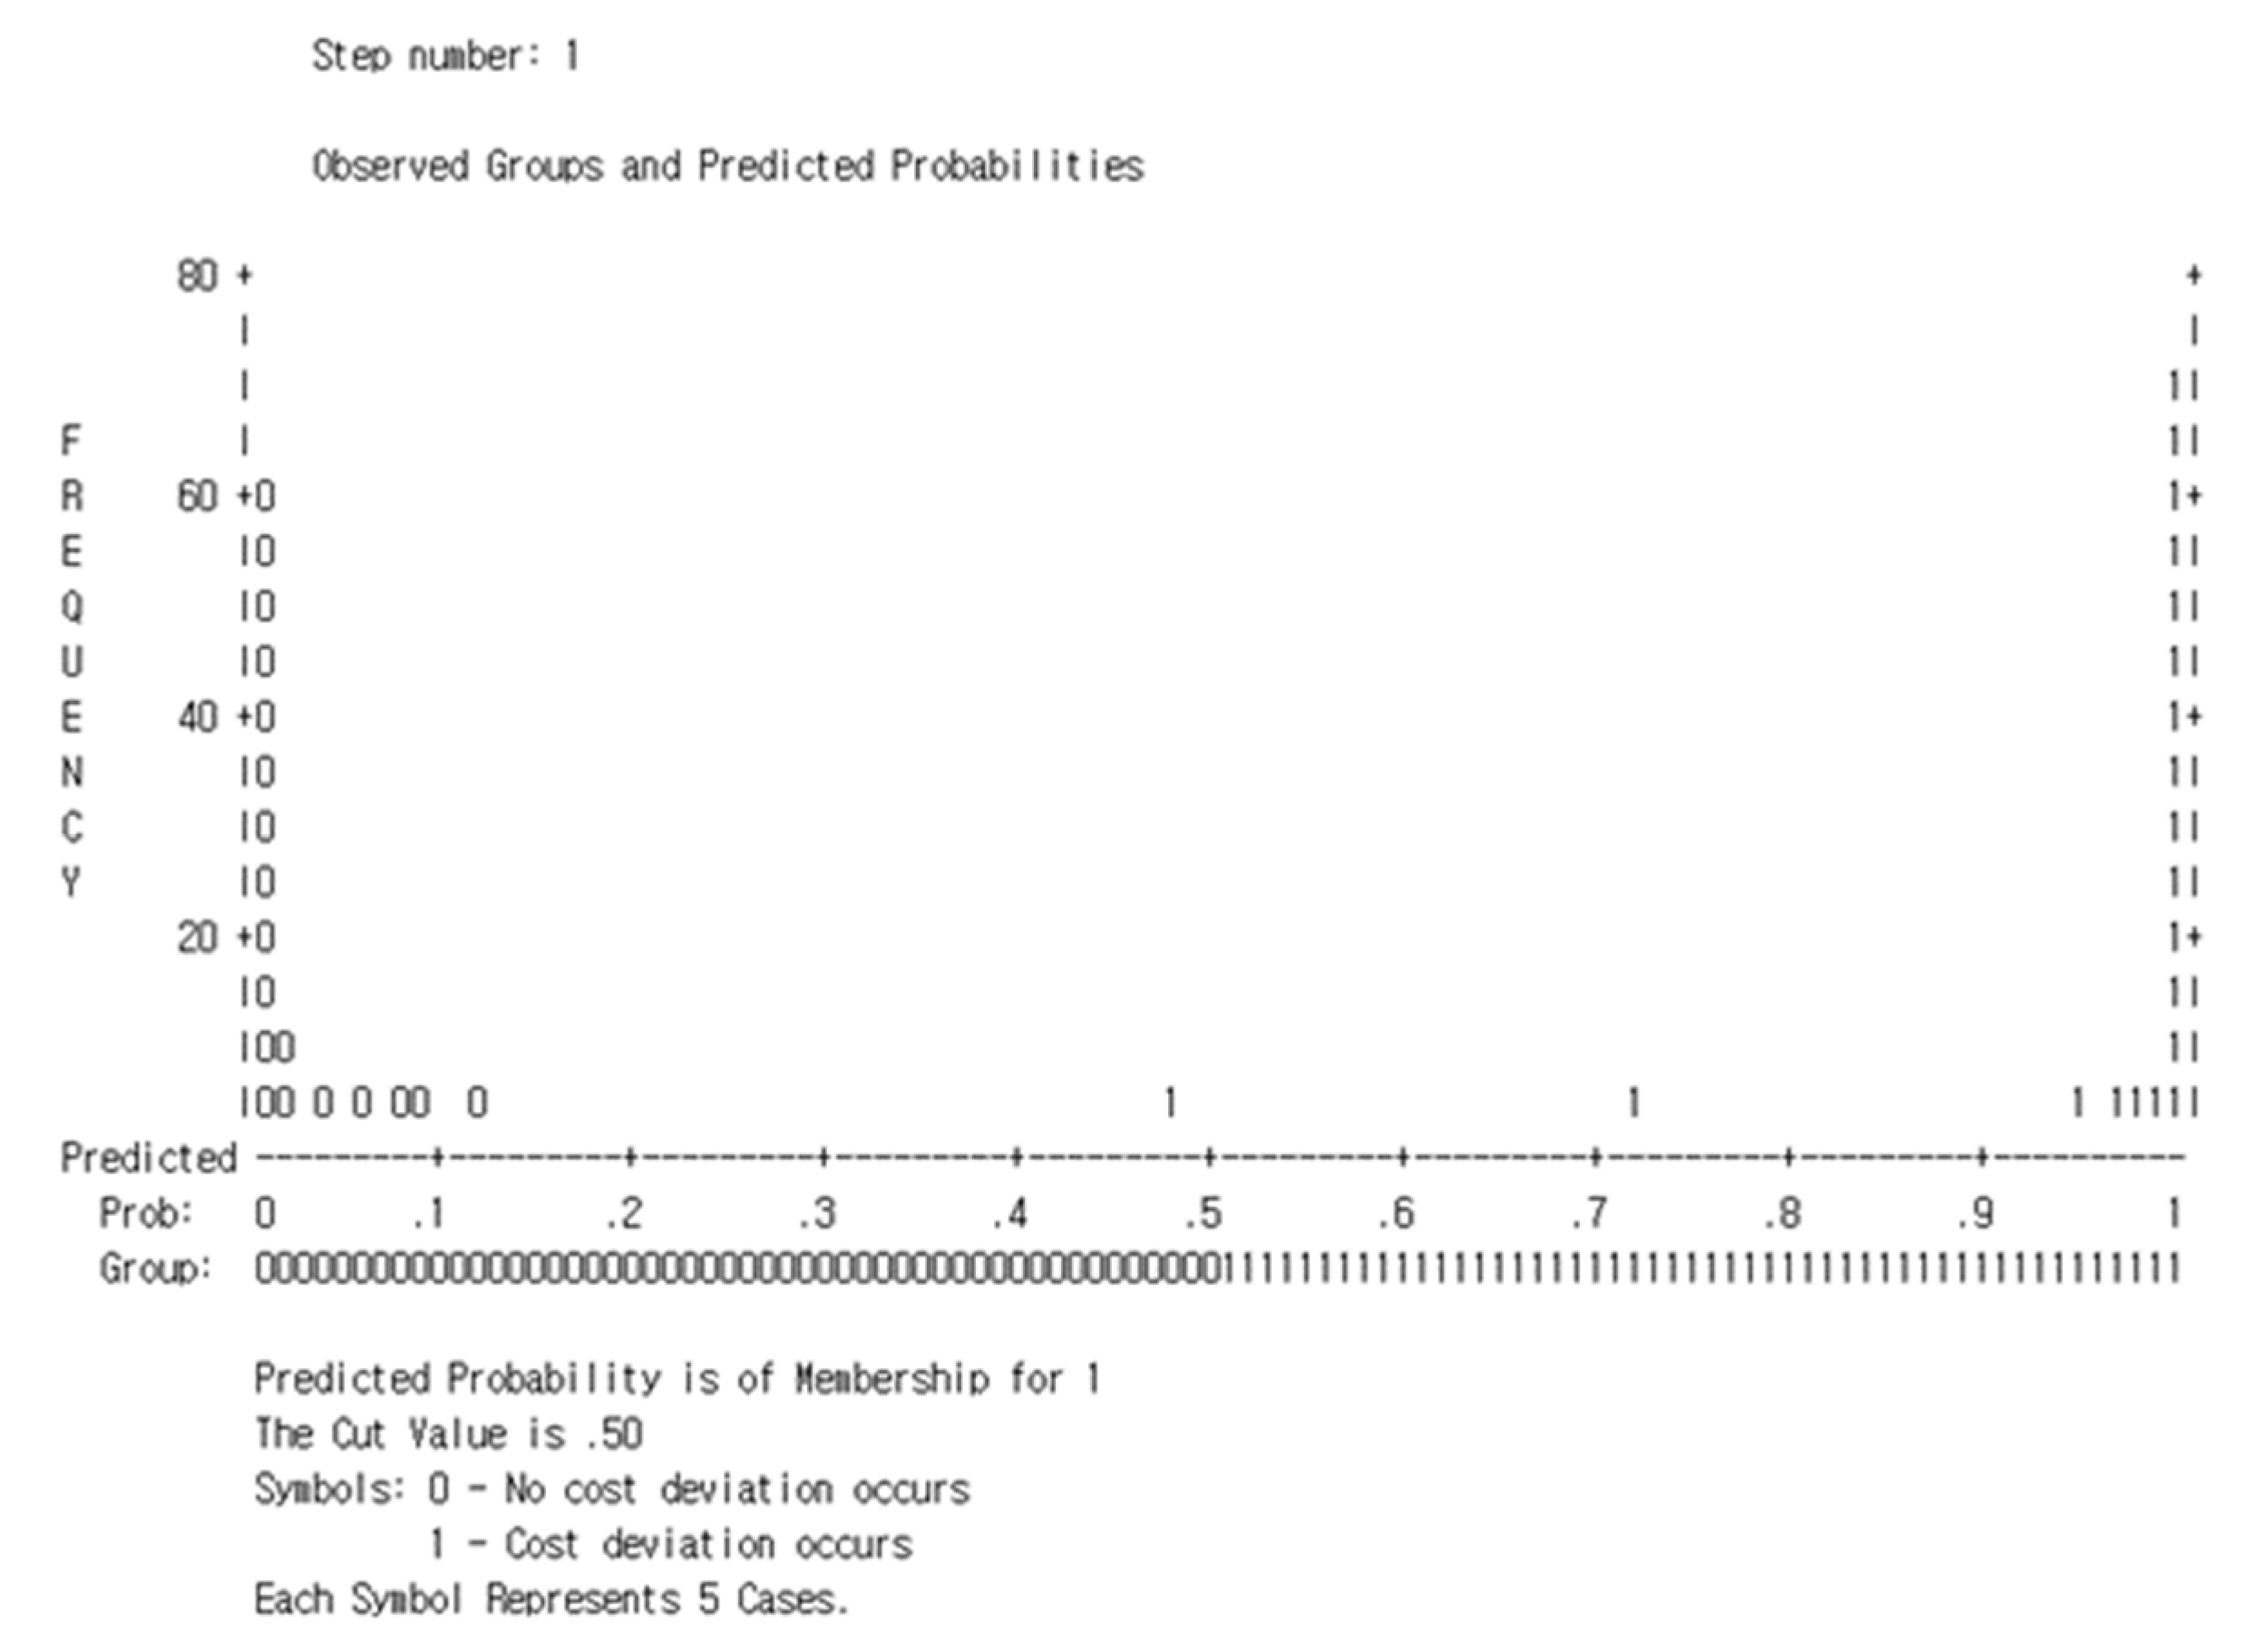
4.3. Binary Logistic Regression Analysis

Binary logistic regression analysis was used to analyze the various factors affecting the cost deviation in NDPPs, and the model fit was statistically significant.
The results of the analysis are summarized in Table 8. The chi-square value of the omnibus tests of model coefficients is 243.734 and the p-value is 0.000, indicating that the selected independent variables have a significant effect on cost deviation.
The Cox and Snell R-square value of 0.663 and the Nagelkerke R-square value of 0.884, which indicate the explanatory power of the model, show high explanatory power.
The chi-square value of the Hosmer–Lemeshow test is 3.559 and the p-value is 0.895, indicating a good fit of the model, and the overall prediction accuracy of the model is 94.2%. Of the independent variables analyzed, seven variables have a statistically significant impact on cost deviation: PMR, PCER, PESR, PCSR, CPR, PMC, and CPSSM.
The regression coefficient B value for each of these variables indicates the magnitude and direction of the variable’s impact on cost deviation. For example, PCER has the largest B value of 1.623, which can be interpreted as PCER having the largest impact on cost deviation. On the other hand, the B-value of CPSSM is 0.884, indicating that it has a relatively small impact.
The results of the Wald analysis confirm that each independent variable has a statistically significant impact on the model, with all independent variables having a Wald test p-value of less than 0.05.
logit[P(CD = 1)] = β0 + (β1 × PMR) + (β2 × PCER) + (β3 × PESR) + (β4 × CPR) + (β5 × PCSR) + (β6 × PMC) + (β7 × CPSSM)
Using a logistic regression Equation (1), we can predict the probability of a cost deviation occurring as follows:
logit[P(CD = 1)] = −39.529 + (1.320 × PMR) + (1.623 × PCER) + (1.238 × PESR) + (0.829 × CPR) + (1.572 × PCSR) + (1.083 × PMC) + (0.884 × CPSSM)
Here, a positive regression coefficient of B indicates that the variable tends to increase the probability of a cost deviation occurring.
The odds ratio (OR) shows how much each variable increases the odds of a cost deviation occurring for a one-unit increase, and the analysis shows that PMR (OR = 3.744, 95% C.I. [1.657, 8.457]), PCER (OR = 5.068, 95% C.I. [2.236, 11.484]), PESR (OR = 3.447, 95% C.I. [1.853, 6.413]), CPR (OR = 2.292, 95% C.I. [1.020, 5.151]), PCSR (OR = 4.817, 95% C.I. [2.250, 10.317]), PMC (OR = 2.954, 95% C.I. [1.452, 6.013]), and CPSSM (OR = 2.419, 95% C.I. [1.297, 4.515]) had a statistically significant effect on cost deviation.
This indicates that the probability of cost deviation increases as these variables increase. This result provides important information for cost deviation management strategies. The classification table’s prediction percentage indicates how well the model predicts the occurrence (CD = 1) and nonoccurrence (CD = 0) of cost deviations, and in this study, the model predicted the nonoccurrence of cost deviations with an accuracy of 95.4% and the occurrence of cost deviations with an accuracy of 93.0%.
These taxonomy results show that the model is classifying the data very accurately, which confirms that the logistic regression model is useful for clearly identifying the likelihood of a cost deviation occurring.
Figure 6 provides a visual representation of the relationship between the independent variables and the probability of having a cost deviation of 1 (CD = 1) through a logistic regression model. Here, the slope of each line represents the predictive power of that variable for cost deviation, with a steeper slope indicating a greater influence of the variable. This visualization plays an important role in analyzing the importance of each variable to cost deviation.
Figure 7 shows a histogram of the expected probability of cost deviation from the logistic regression model. The x-axis shows the expected probability and the y-axis shows the frequency. The symbols ‘0’ and ‘1’ represent the cases of no cost deviation and occurrence, respectively. The ‘cut value’ of 0.50 is a predictive classification criterion, which distinguishes between deviations occurring and not occurring based on this threshold. In the histogram, we can see that the two observed groups are clearly separated, suggesting that the model can clearly identify the likelihood of cost deviations occurring.
For further diagnostics, we performed Cook’s influence statistic and normalized residual analysis to verify the robustness and reliability of the model.
Figure 8 shows a scatter plot of the logistic regression using Cook’s influence statistic. The x-axis represents the observation index and the y-axis represents the Cook’s influence values. This graph evaluates the influence of each data point in the regression model, with influence values above 1.0 indicating points that have a greater impact on the model.
Figure 9 shows a scatterplot of the normalized residuals from a logistic regression model. The x-axis shows the observations, and the y-axis shows the normalized residuals. The residuals are standardized by the estimated standard deviation of the difference between the observed and predicted values and tend to be randomly distributed around the zero line. This indicates the goodness of fit of the model and is useful for checking for problems with model assumptions such as nonlinearity, heterogeneous covariance, and outliers. This sophisticated analysis further strengthens the validity and depth of our findings.

4.4. Analyze Cost Deviation Influence Factors

This study provides an in-depth analysis of the main factors affecting the occurrence of cost deviation in NDPPs and provides a predictive model of the main variables affecting cost variance and deviation through binary logistic regression analysis.
The foundation of the study is rooted in extensive prior research and theoretical foundations, and its importance has already been emphasized through in-depth studies by previous researchers such as Flyvbjerg et al. [3], Ibrahim and Elshwadfy [4], Gómez Cabrera [8], Alsugair [9], Al Saeedi and Karim [26], Albtoush et al. [21], Cho and Kim [27], Memon et al. [24], and Mahamid and Aichouni [25].
The results of this study reveal some important differences and similarities compared to previous studies. Previous studies have emphasized that PMR, PCER, and PESR have a significant impact on cost variance and deviation. This study refines these findings and provides empirical support for the theoretical hypotheses of previous studies by quantitatively analyzing the impact of each variable. In particular, we find that PMR, PCER, and PESR have a significant impact on the occurrence of cost deviations.
In addition to these typical factors, we present new findings that additional variables, such as CPSSM, influence cost deviation. This is an area that has been relatively under-emphasized in the literature, and this study sheds new light on existing research by showing that these factors can play a significant role in cost deviation. Our study also differs from previous studies by more precisely measuring the impact of each variable and building a predictive model of cost deviation. This means that this study goes beyond simply confirming the results of previous studies and provides a new direction to provide practical decision-making tools for stakeholders in NDPPs. Therefore, the analysis in this study is an important study with both theoretical depth and practical applicability, emphasizing the importance of the proactive management of risk factors and appropriate preventive measures for stakeholders in NDPPs.

4.5. Findings and Discussions

This study deepens the understanding of cost deviation factors in NDPPs by building a predictive model based on binary logistic regression analysis. Grounded in a rich tapestry of prior research, it offers fresh empirical backing to the influential variables posited by thought leaders in the field. We confirm the substantial influence of PMR, PCER, and PESR on cost deviations, aligning with previous assertions, yet our approach reveals new dynamics, particularly the impact of CPSSM—a factor not previously accorded sufficient attention. Our nuanced measurement of variable impacts and the subsequent predictive model mark a departure from the extant literature. This research not only corroborates but extends past findings, providing stakeholders with actionable insights and underscoring the need for proactive risk and preventive measures in NDPPs.

4.6. Caveats and Contextualization

In interpreting the findings of this study, it is essential to acknowledge the influence of contemporaneous macro factors and trends [28] that may limit the generalization of our results beyond the specific context of Gyeongsangbuk-do, South Korea, in the year 2023. This section discusses key macroeconomic trends and their implications for the study’s applicability to other settings.
The aftermath of the COVID-19 pandemic saw substantial monetary [29] and fiscal [30,31,32] stimuli globally, which affected the costs of labor and raw materials. South Korea’s domestic policies, alongside international influences such as those from the US Federal Reserve [29,33], have shaped the cost landscape for capital projects in the region.
The surge in ESG investing [34] has likely influenced the costs associated with NDPPs, as such projects align with ESG goals. The increased demand for materials and specialized labor required by these projects should be considered when evaluating cost deviations.
The heightened uncertainty due to recent global events [35,36] may affect the valuation of NDPPs, depending on their reversibility and the nature of the investment. The relevance of this uncertainty should be factored into cost deviation assessments.
In light of these considerations, the study’s findings should be seen as specific to the regional and temporal context of the research. A forthcoming section on the economic repercussions of climate change and natural disasters [37,38,39,40] will further situate this study within the broader climate economics literature.

5. Conclusions

This study delivers a detailed analysis of cost deviation causes in NDPPs in Gyeongsangbuk-do, offering specific risk management and cost optimization strategies for the sector. It quantitatively assesses the impact of various factors, such as PMR, PCER, PESR, PCSR, CPR, PMC, and CPSSM, providing a predictive model for these deviations. This facilitates proactive risk management and the implementation of preventive measures, crucial for project success. Additionally, it sheds light on the role of less-studied factors like CPSSM, enhancing understanding of cost deviation management in NDPPs and aiding strategic decision-making to minimize cost variations.
While the study strengthens existing theoretical frameworks and contributes new perspectives, its generalizability is restricted due to the regional focus and the timing of data collection. Future research should aim to surmount the current limitations by embarking on longitudinal studies that span various regions and encompass a diverse array of project types. Such studies are crucial for delving into the dynamic shifts in risk factors over time and understanding their evolving nature. Additionally, a more nuanced exploration into how these factors interplay and contribute to cost deviations is imperative. This will not only enrich our comprehension of the underlying causes of cost deviations but also pave the way for the formulation of more sophisticated and holistic risk management strategies. By addressing these areas, future investigations can offer more profound insights and practical frameworks for mitigating risk in project management.

Author Contributions

Conceptualization, J.-H.C.; Methodology, J.-H.C.; Software, J.-J.K.; Validation, Y.-S.S.; Investigation, Y.-S.S.; Resources, Y.-S.S.; Data curation, J.-H.C.; Writing—original draft, J.-H.C.; Writing—review & editing, B.-S.K.; Visualization, J.-J.K.; Supervision, B.-S.K.; Project administration, B.-S.K. All authors have read and agreed to the published version of the manuscript.

Funding

This research was supported by the National Research Foundation of Korea (NRF) grant funded by the Korea Government (MSIT) (NRF-2021R1A2C1014267). This research was supported by the Regional University Outstanding Scientist Support Program through the National Research Foundation of Korea (NRF), grant number (NRF-2019R1I1A3A01062229).

Data Availability Statement

The data from this study are restricted due to privacy and ethical considerations but can be accessed upon a justified request to the corresponding author, subject to ethical approval.

Acknowledgments

The authors extend their sincere appreciation to all individuals and teams who contributed to this study’s success. Special thanks go to the technical and administrative staff for their invaluable support and to colleagues who provided insightful feedback on the manuscript. This research was made possible through the generous funding from the National Research Foundation of Korea (NRF), supported by the Korea Government (MSIT), under grants NRF-2021R1A2C1014267 and NRF-2019R1I1A3A01062229. The authors also acknowledge the support of the Regional University Outstanding Scientist Support Program, which significantly contributed to the completion of this project.

Conflicts of Interest

The authors declare no conflict of interest.

References

  1. Simonds, E.A.; Gobenciong, K.A.P.; Wilson, J.E.; Jiroutek, M.R.; Nugent, N.R.; van Tilburg, M.A.L. Trauma Functioning and Well-Being in Children Who Receive Mental Health Aid after Natural Disaster or War. Children 2022, 9, 951. [Google Scholar] [CrossRef]
  2. Kim, S.; Lee, D.S. Development of an Integrated Management System for Disaster Prevention Centered on Living Areas. Nat. Hazards Earth Syst. Sci. 2022, 18, 35–44. Available online: https://www.earticle.net/Article/A424810 (accessed on 25 March 2023). (In Korean).
  3. Flyvbjerg, B.; Skamris Holm, M.K.; Buhl, S.L. How Common and How Large are Cost Overruns in Transport Infrastructure Projects? Transp. Rev. 2003, 23, 71–88. [Google Scholar] [CrossRef]
  4. Ibrahim, A.H.; Elshwadfy, L.M. Factors Affecting the Accuracy of Construction Project Cost Estimation in Egypt. Jordan J. Civ. Eng. 2021, 15, 2021–2329. [Google Scholar]
  5. Raghib, A.T.; Belayutham, S.; Mohammad, M.Z.; Ibrahim, C. Causes, Effects and Potential Measures of Cost Deviations in High-Rise Building Projects in Egypt. Int. J. Constr. Manag. 2023, 23, 1875–1885. [Google Scholar] [CrossRef]
  6. Gyeongbuk Province. Gyeongbuk Province Has Invested the Most in Natural Disaster Prevention Projects in the Country This Year. Available online: https://url.kr/orqkbg (accessed on 25 March 2023).
  7. Bhargava, A.; Labi, S.; Chen, S.; Saeed, T.U.; Sinha, K.C. Predicting Cost Escalation Pathways and Deviation Severities of Infra-structure Projects Using Risk-Based Econometric Models and Monte Carlo Simulation. Comput. Aided Civ. Infrastruct. Eng. 2017, 32, 620–640. [Google Scholar] [CrossRef]
  8. Gómez Cabrera, A. Identification of Factors Generating Time and Cost Deviation in Construction Projects: A Case Study in Rural Roads in Colombia. Available online: https://repositorio.uniandes.edu.co/handle/1992/52996 (accessed on 20 March 2023).
  9. Alsugair, A.M. Cost Deviation Model of Construction Projects in Saudi Arabia Using PLS-SEM. Sustainability 2022, 14, 16391. [Google Scholar] [CrossRef]
  10. Annamalaisami, C.D.; Kuppuswamy, A. Managing Cost Risks: Toward a Taxonomy of Cost Overrun Factors in Building Construction Projects. ASCE-ASME J. Risk Uncertain. Eng. Syst. Part A Civ. Eng. 2021, 7, 04021021. [Google Scholar] [CrossRef]
  11. Górecki, J.; Diaz-Madronero, M. Who Risks and Wins?—Simulated Cost Variance in Sustainable Construction Projects. Sustainability 2020, 12, 3370. [Google Scholar] [CrossRef]
  12. Przywara, D.; Rak, A. Monitoring of Time and Cost Variances of Schedule Using Simple Earned Value Method Indicators. Appl. Sci. 2021, 11, 1357. [Google Scholar] [CrossRef]
  13. Raut, S.; Pimplikar, S.S.; Sawant, K. Effect of Project Cost and Time Monitoring on Progress of Construction Project. Int. J. Res. Eng. Technol. 2013, 2, 796–800. [Google Scholar]
  14. Narayanan, S.; Kure, A.M.; Palaniappan, S. Study on Time and Cost Overruns in Mega Infrastructure Projects in India. J. Inst. Eng. Ser. A 2019, 100, 139–145. [Google Scholar] [CrossRef]
  15. Carr, P.G. Investigation of Bid Price Competition Measured Through Prebid Project Estimates, Actual Bid Prices, and Number of Bidders. J. Constr. Eng. Manag. 2005, 131, 1165–1172. [Google Scholar] [CrossRef]
  16. Endut, I.R.; Akintoye, A.; Kelly, J. Cost and Time Overruns of Projects in Malaysia. In Proceedings of the 2nd Scottish Conference for Postgraduate Researchers of the Built and Natural Environment (PRoBE), Glasgow, UK, 16–17 November 2005; pp. 243–252. [Google Scholar]
  17. Rahman, I.A.; Memon, A.H. The Way Forward in Sustainable Construction: Issues and Challenges. Int. J. Adv. Appl. Sci. 2013, 2, 1321. [Google Scholar]
  18. The World Bank. Geological Complications and Cost Overruns: A Survey of Bank-Financed Hydroelectric Projects. 2015. Available online: https://documents.worldbank.org/en/publication/documents-reports/documentdetail/173901468175733212/geological-complications-and-cost-overruns-a-survey-of-bank-financed-hydroelectric-projects (accessed on 19 January 2024).
  19. Kajitani, Y.; Chang, S.E.; Tatano, H. Economic Impacts of the 2011 Tohoku-Oki Earthquake and Tsunami. Earthq. Spectra 2013, 29, 457–478. [Google Scholar] [CrossRef]
  20. Abdel-Monem, M.; Alshaer, K.T.; El-Dash, K. Assessing Risk Factors Affecting the Accuracy of Conceptual Cost Estimation in the Middle East. Buildings 2022, 12, 950. [Google Scholar] [CrossRef]
  21. Albtoush, F.; Ing, D.S.; Rahman, R.A.; Al-Btoosh, F.A.A.; Albtoush, A.M.F.; Doh, S.I.; Rahman, R.A.; Zaidi, S.M. Factors Affecting the Accuracy of Cost Estimate in Construction Projects: A Review. Available online: https://www.researchgate.net/publication/355041672 (accessed on 15 June 2023).
  22. Cong, J.; Mbachu, J.; Domingo, J. Factors Influencing the Accuracy of Pre-Contract Stage Estimation of Final Contract Price in New Zealand. Int. J. Constr. Supply Chain Manag. 2014, 4, 51–64. [Google Scholar] [CrossRef]
  23. Azman, N.A.M.; Adeleke, A.Q. Effect of Time Overruns on Apartment Building among Kuantan Malaysian Construction Industries. J. Adv. Res. Appl. Sci. Eng. Technol. 2018, 10, 41–47. [Google Scholar]
  24. Memon, A.H.; Rahman, I.A.; Abdullah, M.R.; Asmi, A.; Azis, A. Factors Affecting Construction Cost in Mara Large Construction Project: Perspective of Project Management Consultant. Int. J. Sustain. Constr. Eng. Technol. 2010, 1, 41–54. Available online: https://penerbit.uthm.edu.my/ojs/index.php/IJSCET/article/view/62 (accessed on 25 June 2023).
  25. Mahamid, I.; Aichouni, M. Factors Affecting Accuracy of Pretender Post Estimate: Studies of Saudi Arabia. Available online: https://www.researchgate.net/publication/265377554 (accessed on 5 June 2023).
  26. Al Saeedi, A.S.; Karim, A.M. Major Factors of Delay in Developing Countries Construction Projects: A Critical Review. Sciences 2022, 12, 797–809. [Google Scholar] [CrossRef]
  27. Cho, J.-H.; Kim, B.-S. Risk Influencing Factors in Performance of River Disaster Prevention Project. KSCE J. Civ. Eng. 2020, 40, 417–428. (In Korean) [Google Scholar] [CrossRef]
  28. Campello, M.; Kankanhalli, G.; Muthukrishnan, P. Corporate Hiring Under COVID-19: Financial Constraints and the Nature of New Jobs. J. Financ. Quant. Anal. 2023, 1–79. [Google Scholar] [CrossRef]
  29. Cortes, G.S.; Gao, G.P.; Silva, F.B.; Song, Z. Unconventional Monetary Policy and Disaster Risk: Evidence from the Subprime and COVID–19 Crises. J. Int. Money Financ. 2022, 122, 102543. [Google Scholar] [CrossRef] [PubMed]
  30. Agarwal, I.; Baron, M. Inflation and Disintermediation. J. Financ. Econ. Forthcom. 2023. [Google Scholar] [CrossRef]
  31. Benmelech, E.; Tzur-Ilan, N. The Determinants of Fiscal and Monetary Policies during the COVID19 Crisis; NBER Working Paper; National Bureau of Economic Research: Cambridge, MA, USA, 2020. [Google Scholar] [CrossRef]
  32. Silva, F.B.G. Fiscal Deficits, Bank Credit Risk, and Loan-Loss Provisions. J. Financ. Quant. Anal. 2021, 56, 1537–1589. [Google Scholar] [CrossRef]
  33. Dedola, L.; Georgiadis, G.; Gräb, J.; Mehl, A. Does a Big Bazooka Matter? Quantitative Easing Policies and Exchange Rates. J. Monet. Econ. 2020, 117, 489–506. [Google Scholar] [CrossRef]
  34. Dantas, M. Are ESG Funds More Transparent? California State University: Northridge, CA, USA, 2021; SSRN 3269939. [Google Scholar] [CrossRef]
  35. Bloom, N. The Impact of Uncertainty Shocks. Econometrica 2009, 77, 623–685. [Google Scholar] [CrossRef]
  36. Campello, M.; Cortes, G.S.; d’Almeida, F.; Kankanhalli, G. Exporting Uncertainty: The Impact of Brexit on Corporate America. J. Financ. Quant. Anal. 2022, 57, 3178–3222. [Google Scholar] [CrossRef]
  37. Acharya, V.V.; Johnson, T.; Sundaresan, S.; Tomunen, T. Is Physical Climate Risk Priced? Evidence from Regional Variation in Expo-sure to Heat Stress; NBER Working Paper; National Bureau of Economic Research: Cambridge, MA, USA, 2022. [Google Scholar] [CrossRef]
  38. Addoum, J.M.; Ng, D.T.; Ortiz-Bobea, A. Temperature Shocks and Establishment Sales. Rev. Financ. Stud. 2020, 33, 1331–1366. [Google Scholar] [CrossRef]
  39. Addoum, J.M.; Ng, D.T.; Ortiz-Bobea, A. Temperature Shocks and Industry Earnings News. J. Financ. Econ. 2021, 150, 1–45. [Google Scholar] [CrossRef]
  40. Bernstein, A.; Billings, S.B.; Gustafson, M.T.; Lewis, R. Partisan residential sorting on climate change risk. J. Financ. Econ. 2022, 146, 989–1015. [Google Scholar] [CrossRef]
Figure 1. Research Flowchart.
Buildings 14 00391 g001
Figure 2. Variable derivation process using the Delphi method to develop a cost deviation model.
Buildings 14 00391 g002
Figure 3. Research Model.
Buildings 14 00391 g003
Figure 4. Methodology flowchart.
Buildings 14 00391 g004
Figure 5. Scree plot showing eigenvalues above 1.0.
Buildings 14 00391 g005
Figure 6. Predicting cost deviation (CD = 1) with a regression equation graph.
Buildings 14 00391 g006
Figure 7. Histogram of estimated probability.
Buildings 14 00391 g007
Figure 8. Cook’s influence statistics graph above 1.0.
Buildings 14 00391 g008
Figure 9. Normalized residuals graph above |3.0|.
Buildings 14 00391 g009
Table 1. Cost deviation-related factors, countries, and research fields by researcher.
ResearcherCountryResearch FieldCost-Related FactorsItem
Abdel-Monem et al. [20]Middle EastConstruction projectsProject complexity, site constraints, design changes, unavailability of skilled labor, inflation, market fluctuations, changes in scope, delays in construction, acceleration, claims and disputes57
Alsugair [9]Saudi ArabiaConstruction projectsScope quality, contractor organization, estimator performance, information quality, project characteristics, external factors, contractual procedures73
Ibrahim and Elshwadfy [4]EgyptConstruction projectsConsultants, design parameters, information and estimators, client characteristics, project characteristics, contract requirements, contractor characteristics, external factors70
Albtoush et al. [21]New ZealandConstruction projectsProject characteristics, client characteristics, contractor characteristics, design, consultant and tendering, external factors and market conditions, inaccurate cost estimating-
Przywara and Rak [12]PolandMulti-family housingTime variances from the schedule (T/S), time variances from planned costs (T/C)-
Azman et al. [23]Peninsular MalaysiaConstruction
industry
Scope quality, information quality, uncertainty level, estimator performance, quality of estimating procedure-
Gómez Cabrera [8]ColombiaRural road projectsCompetitive bidding (open data), competitive bidding (web search)51
Cong et al. [22]New ZealandConstruction
industry
Project characteristics, client characteristics, contractor characteristics, tendering conditions, consultants and design, external factors and market conditions, inaccuracies in cost estimation37
Mahamid and Aichouni [25]Saudi ArabiaConstruction
industry
Client, consultants and design, cost estimating, project characteristics, contract and tendering, resources (labor, materials, equipment)43
Raut et al. [13]IndiaRoads,
highways, etc.
Time, cost, quality-
Memon et al. [24]MalaysiaConstruction projectsCauses affecting construction costs24
Table 2. Classification of cost deviation factors using the Delphi technique.
VariableItemQuestionnaire
Project
management risk
(PMR)
Q22Budget variation due to material purchase and rental costs
Q21Difference between project cost and budget
Q20Bond and warranty clauses
Q15Environmental impact of the project
Q19Allowable contingency
Q16Non-provision of regulatory information
Q18Number of bidders participating in the project
Q17Cost variation due to price fluctuation
Q25Possibility of complaints from stakeholders
Q24Additional costs due to inappropriate budget planning
Q26Possibility of design errors and omissions issues
Q27Additional costs and schedule delays due to change orders
Project costing and
execution risk
(PCER)
Q8Managerial labor cost estimation and project efficiency
Q10Reliability and completeness of cost information
Q9Cost comparison and selection according to alternative methods
Q7Allowable time for cost estimation preparation
Q6Accuracy of estimation according to proper estimation method
Q23Regulatory changes due to legal, institutional, and policy changes
Q28Contract execution delay
Project execution
strategy risk
(PESR)
Q3Fundraising and budget securing
Q2Experience and performance of management team
Q4Information on loss/profit experience from similar projects
Q5Relationship with subcontractors and suppliers
Q1Feasibility of design and implementation
Q14Financial situation and budget of the client
Q11Detailed and clear specifications and drawings
Q12Budget allocation and cost management according to project priority
Q13Project duration
Construction
project risk
(CPR)
Q44Possibility of complaints from residents
Q42Winter construction suspension
Q40Additional costs due to maintenance convenience considerations
Q41Compensation delay
Q43Imbalance between supply and demand of materials
Project cost and
schedule risk
(PCSR)
Q37Productivity decline and additional costs due to weather conditions
Q38Budget increase during project progress due to low bidding
Q39Lack of technical competence of the manager
Q36Additional costs due to insufficient construction period
Q35Cost reduction or change due to budget shortage
Project
management
challenges
(PMC)
Q34Mismatch between design conditions and site conditions
Q30Cost increase and schedule delay due to additional work
Q32Risk of delay in project commencement date and completion date
Q31Conflict among consortium members
Q29Risk of regulatory changes related to acquisition
Q33Lack of project risk management experts
Construction project subcontractor and
safety management
(CPSSM)
Q46Lack of subcontractor technical skills
Q47Pressure to achieve target execution rate
Q45Possibility of subcontractor bankruptcy risk occurrence
Q48Onsite accident-free pressure
Table 3. Operational definition of variables according to EFA results.
VariableOperational DefinitionItemNumbers
PMRThese issues include budget deviations, contract terms, environmental impacts, risk management, regulatory compliance, bidding processes, price fluctuation, and stakeholder responses.Q22, Q21, Q20, Q15, Q19, Q16, Q18, Q17, Q25, Q24, Q26, Q2712
PCERIssues related to managers’ labor costings, reliability of cost information, cost comparison according to alternative methods, time allowed for costing preparation, accuracy according to appropriate costing methods, regulatory changes due to legal/institutional changes, delays in contract execution, etc.Q8, Q10, Q9, Q7, Q6, Q23, Q287
PESRThese are issues related to budget allocation, cost management, and project period according to ranking: securing financing and budget, experience and performance of management, profit and loss experience information on similar projects, relationships with subcontractors and suppliers, design and implementation feasibility, client’s financial situation and budget, clear and specific specifications and drawings, and project priorities. Q3, Q2, Q4, Q5, Q1, Q14, Q11, Q12, Q139
CPRThese issues include the possibility of complaints from residents, construction suspension in winter, additional costs due to consideration of maintenance convenience, delayed compensation, and imbalance between material supply and demand.Q44, Q42, Q40, Q41, Q435
PCSRRelated issues include decreased productivity and additional costs due to weather conditions, budget increases during project progress due to low-priced bids, lack of technical capabilities of managers, additional costs due to insufficient construction period, and cost reduction or change due to lack of budget.Q37, Q38, Q39, Q36, Q355
PMCRelated issues include mismatch between design conditions and site conditions, cost increases and schedule delays due to additional work, risk of delaying project start and completion dates, conflicts among consortium members, risk of regulatory changes related to acquisitions, and lack of project risk management experts.Q34, Q30, Q32, Q31, Q29, Q336
CPSSMThese are related issues such as lack of technical capabilities of subcontractors, pressure to achieve target execution rate, possibility of subcontractor bankruptcy risk, and pressure for zero accidents onsite.Q46, Q47, Q45, Q484
Table 4. Demographic characteristics (N = 224).
CategoryN%
GenderMale21696.43
Female83.57
SectorOwner83.57
Construction project manager4017.86
Construction manager17678.57
Period of workLess than 10 years14665.18
11~20 years6629.46
More than 21 years125.36
Table 5. Results of descriptive statistics, reliability statistics, and communalities.
Descriptive StatisticsReliability StatisticsCommunalities
ItemNMinMaxMSDSMIDSVIDCITCCAIDInEx
Q122417.0003.6101.698222.9502422.9800.5160.9791.0000.626
Q222417.0003.7501.835222.8202396.0520.6270.9791.0000.827
Q322417.0003.6701.812222.9002389.0430.6760.9791.0000.903
Q422417.0003.5201.784223.0402403.8590.6000.9791.0000.793
Q522417.0003.8201.795222.7402401.4660.6100.9791.0000.733
Q622417.0004.7101.585221.8502393.3910.7490.9791.0000.886
Q722417.0004.7701.561221.7902395.5210.7470.9791.0000.872
Q822417.0004.8201.573221.7502393.6350.7540.9791.0000.954
Q922417.0004.7701.609221.7902394.6150.7290.9791.0000.892
Q1022417.0004.8201.575221.7502393.4910.7530.9791.0000.947
Q1122417.0004.6301.525221.9402393.2430.7810.9781.0000.832
Q1222417.0004.3201.537222.2502403.3250.7060.9791.0000.692
Q1322417.0004.6301.471221.9402403.6280.7370.9791.0000.743
Q1422417.0004.6301.525221.9402393.2430.7810.9781.0000.832
Q1522417.0004.5901.302221.9702420.4030.7020.9791.0000.770
Q1622417.0004.6001.260221.9602416.9140.7560.9791.0000.756
Q1722417.0004.7401.294221.8302416.4220.7390.9791.0000.695
Q1822417.0004.8601.325221.7102413.1950.7460.9791.0000.747
Q1922417.0005.0401.535221.5302410.6000.6570.9791.0000.682
Q2022417.0005.1401.462221.4202412.8190.6760.9791.0000.788
Q2122417.0004.8701.395221.7002417.7550.6730.9791.0000.806
Q2222417.0004.8801.347221.6902427.8570.6210.9791.0000.745
Q2322417.0004.9501.365221.6202399.8430.8250.9781.0000.792
Q2422417.0004.9201.354221.6402402.2580.8140.9781.0000.753
Q2522417.0004.9401.364221.6202400.9260.8170.9781.0000.756
Q2622417.0004.7701.417221.7902400.2720.7910.9781.0000.685
Q2722417.0004.8101.326221.7502411.3270.7600.9791.0000.645
Q2822417.0004.9501.328221.6202406.2380.7990.9781.0000.724
Q2922417.0004.9301.377221.6302398.3500.8290.9781.0000.867
Q3022417.0004.9701.307221.5902404.2150.8280.9781.0000.878
Q3122417.0004.9601.337221.6002403.8010.8120.9781.0000.835
Q3222417.0005.0801.328221.4802408.2780.7830.9791.0000.815
Q3322417.0004.9301.361221.6302402.5740.8070.9781.0000.808
Q3422417.0004.9401.336221.6202410.3800.7610.9791.0000.800
Q3522417.0005.1101.521221.4502417.2980.6180.9791.0000.816
Q3622417.0004.7701.487221.7902430.8840.5390.9791.0000.804
Q3722417.0004.8501.586221.7102429.3350.5130.9791.0000.867
Q3822417.0005.0101.583221.5502434.4460.4810.9791.0000.845
Q3922417.0005.1301.499221.4302428.1030.5530.9791.0000.846
Q4022417.0004.7001.377221.8602416.6760.6910.9791.0000.983
Q4122417.0004.6701.368221.8902418.9070.6790.9791.0000.932
Q4222417.0004.7001.377221.8602416.6760.6910.9791.0000.983
Q4322417.0004.7201.347221.8402415.6150.7150.9791.0000.944
Q4422417.0004.7001.377221.8602416.6760.6910.9791.0000.983
Q4522417.0004.9501.466221.6202415.2420.6570.9791.0000.799
Q4622417.0004.8201.394221.7502421.8050.6440.9791.0000.834
Q4722417.0005.0401.420221.5202413.3090.6940.9791.0000.876
Q4822417.0005.0901.371221.4702422.6720.6490.9791.0000.804
Note: Min = minimum, Max = maximum, M = mean, SD = std. deviation, S = scale, MID = mean if item deleted, SVID = scale variance if item deleted, CITC = corrected item total correlation, CAID = Cronbach’s alpha if item deleted, In = initial, Ex = extraction.
Table 6. Results of descriptive statistics, EFA, and reliability.
VariableItemRotated Component MatrixReliability
1234567α
PMRQ220.7960.1890.0350.0870.0670.1150.2230.956
Q210.7860.1760.0930.0220.0710.3130.214
Q200.7660.2350.0760.0590.0500.3370.142
Q150.7520.1710.3250.1870.1760.0560.016
Q190.7250.1120.2280.1140.1210.2490.053
Q160.7090.2610.2850.2250.1950.1050.072
Q180.6640.3960.0920.2220.1730.1010.227
Q170.6620.3100.2400.1570.2040.1020.165
Q250.5020.4190.1780.2010.2150.3280.319
Q240.4720.4350.2160.1280.2730.3110.325
Q260.4550.3090.2320.2210.2390.3490.317
Q270.4330.3950.1730.3030.2310.1840.305
PCERQ80.2900.8440.3030.1740.0330.1630.0840.964
Q100.2880.8400.3010.1660.0340.1780.088
Q90.2780.8150.2640.1880.0250.1940.081
Q70.2990.7930.2950.1220.0970.1710.115
Q60.3040.7920.3180.1510.0460.1570.123
Q230.4610.4810.1920.1530.2130.3430.352
Q280.3850.4590.2480.1880.2390.2230.402
PESRQ30.1770.2430.8590.1870.0140.0830.1780.945
Q20.1230.2240.8350.1460.0170.1380.153
Q40.1050.2110.8150.1500.0500.0330.217
Q50.1120.2870.7600.1470.0090.1550.119
Q10.1250.0130.6810.1050.1630.328−0.039
Q140.4890.3380.6120.2130.2090.108−0.055
Q110.4890.3380.6120.2130.2090.108−0.055
Q120.3700.2880.5950.1440.2950.104−0.010
Q130.4960.3700.5130.1770.2010.128−0.092
CPRQ440.1630.1640.1920.8970.1410.1640.2020.992
Q420.1630.1640.1920.8970.1410.1640.202
Q400.1630.1640.1920.8970.1410.1640.202
Q410.1480.1390.2210.8650.1570.1540.215
Q430.1760.1880.1750.8480.1710.1930.248
PCSRQ370.1290.0340.1330.1760.8880.0940.0590.885
Q380.1250.098−0.0200.1000.8780.1580.121
Q390.287−0.0170.0990.0970.8330.0970.203
Q360.0700.0290.1660.1630.8190.1800.200
Q350.1640.1990.0700.1230.7740.1710.319
PMCQ340.3420.1720.2620.2360.2540.6590.1740.962
Q300.3380.3330.2330.2810.2480.6550.171
Q320.3130.3300.1820.2740.1910.6430.223
Q310.3560.2790.2400.2720.2100.6300.240
Q290.4190.2400.2460.3050.2560.6280.140
Q330.3630.2780.2220.2360.2990.6030.204
CPSSMQ460.1110.1360.1390.3670.2280.2410.7350.947
Q470.3390.0960.0650.3640.2870.1520.714
Q450.2130.1010.1550.3270.2780.1640.713
Q480.2070.1650.0820.3120.3290.1200.712
Initial eigenvalues25.1694.2783.0762.4491.6611.3001.261
% of variance52.4358.9136.4085.1033.4612.7082.627
Cumulative %52.43561.34867.75672.85976.32079.02881.655
KMO = 0.838, Bartlett’s chi-square = 2138.321, df = 1128 (p < 0.001)
Note: Extraction method = principal component analysis, Rotation method = varimax with Kaiser normalization and rotation converged in 7 iterations, α = Cronbach’s alpha.
Table 7. Pearson correlation analysis.
PMRPCERPESRCPRPCSRPMCCPSSM
PMRPC1.0000.480 **0.308 **0.335 **0.214 **0.467 **0.322 **
Sig. 0.0000.0000.0000.0010.0000.000
N224224224224224224224
PCERPC0.480 **1.0000.581 **0.451 **0.188 **0.498 **0.381 **
Sig.0.000 0.0000.0000.0050.0000.000
N224224224224224224224
PESRPC0.308 **0.581 **1.0000.463 **0.215 **0.477 **0.363 **
Sig.0.0000.000 0.0000.0010.0000.000
N224224224224224224224
CPRPC0.335 **0.451 **0.463 **1.0000.365 **0.519 **0.607 **
Sig.0.0000.0000.000 0.0000.0000.000
N224224224224224224224
PCSRPC0.214 **0.188 **0.215 **0.365 **1.0000.421 **0.383 **
Sig.0.0010.0050.0010.000 0.0000.000
N224224224224224224224
PMCPC0.467 **0.498 **0.477 **0.519 **0.421 **1.0000.531 **
Sig.0.0000.0000.0000.0000.000 0.000
N224224224224224224224
CPSSMPC0.322 **0.381 **0.363 **0.607 **0.383 **0.531 **1.000
Sig.0.0000.0000.0000.0000.0000.000
N224224224224224224224
Note: PC = Pearson correlation, ** = Correlation is significant at the 0.01 level (2-tailed).
Table 8. Analysis of influencing factors’ cost deviation.
HDVIVBS.E.WaldpOR95% C.I. for EXP(B)
LowerUpper
H1CDPMR1.3200.41610.0820.0013.7441.6578.457
H2CDPCER1.6230.41715.1170.0005.0682.23611.484
H3CDPESR1.2380.31715.2650.0003.4471.8536.413
H4CDCPR0.8290.4134.0300.0452.2921.0205.151
H5CDPCSR1.5720.38916.3750.0004.8172.25010.317
H6CDPMC1.0830.3638.9290.0032.9541.4526.013
H7CDCPSSM0.8840.3187.7050.0062.4191.2974.515
Constant−39.5297.30129.3150.0000.000
Omnibus tests of model coefficients: chi-square = 243.734, df = 7, p = 0.000
Model summary: −2 log likelihood = 66.635, Cox and Snell R-square = 0.663, Nagelkerke R-square = 0.884
Hosmer–Lemeshow test: chi-square = 3.559, df = 8, p = 0.895
Classification table: observed cost deviation predicted percentage 0 = 95.4, 1 = 93.0, overall percentage = 94.2
Note: H = hypothesis, DV = dependent variable, IV = independent variable, CD = cost deviation.
Disclaimer/Publisher’s Note: The statements, opinions and data contained in all publications are solely those of the individual author(s) and contributor(s) and not of MDPI and/or the editor(s). MDPI and/or the editor(s) disclaim responsibility for any injury to people or property resulting from any ideas, methods, instructions or products referred to in the content.

