Abstract
A multi-objective decision method is proposed based on the combining orthogonal test, entropy weight method (EWM) with TOPSIS (technique for order preference by similarity to an ideal solution) in this article. The method is more objective and efficient than traditional methods in the design of green residential buildings. A villa in Nanjing was taken as an example, and the cost, building energy consumption, and daylight factors were used as decision-making indexes. A total of six control factors were selected: terrain elevation, window area, building orientation, the opening ratio of exterior windows, roof structure, and window glass material. Each factor was designed with three levels. First, a design scheme index system was constructed, and the orthogonal experimental design was used to select representative design schemes. Then, the EWM and the TOPSIS method were used to determine the weight of each index, a comprehensive evaluation of the residential building design scheme was conducted, and, finally, the optimal scheme was confirmed via range analysis. The results show that the multi-objective decision-making model based on the orthogonal experiment EWM-TOPSIS is suitable for green residential building design and the optimal solution obtained is “15 m elevation, a 1200 × 1500 mm size vacuum glass, an orientation of 170° and an external window opening ratio 45% with a 40 mm thick expanded insulation board roof”.
1. Introduction
As the global warming trend intensifies, the international community has been trying to establish a low-carbon and environmentally friendly model [1]. Research shows that 40% of global energy consumption comes from buildings [2]. To promote the peak of carbon emissions as soon as possible and achieve carbon neutrality, the development of green buildings faces significant challenges and, at the same time, important development opportunities. Green buildings are widely recognized as an effective solution for reducing energy consumption, conserving resources, and reducing carbon emissions. In addition, they comply with environmental design principles, improve the livability of residents, and positively impact health, becoming a new trend in the development of the global construction industry [3]. Therefore, green buildings that reduce resources, energy consumption, and pollution are the only way for the construction industry to achieve sustainable development [4]. An architectural scheme design should consider the comprehensive performance of environmental protection, energy conservation, emissions reduction, and the harmonious coexistence between man and nature. We can effectively control the growing trend of building energy consumption and carbon emissions by conducting more research on scheme design to select the optimal scheme. The concept of green buildings was proposed to reduce the significant impact of the building stock on the environment, society, and economy. There are many definitions of green buildings in domestic and foreign research. Kibert [5] defined green buildings as “Healthy facilities designed and constructed in a resource-saving manner using ecologically based principles”. Robichaud and Anantatmula [6] identify the four pillars of green buildings: minimizing the environmental impact, improving the health conditions of occupants, the return on investment for developers and local communities, and the life cycle during planning and development. These definitions have some common elements: green buildings have a long enough life cycle, are environmentally sustainable, have the conditions for healthy human life, and so on.
Scheme design is mainly carried out by architects based on their personal experience under the guidance of existing green building evaluation standards. Many experts and scholars have completed scientific green building evaluation experiments and adopted different green building evaluation index systems for different actual situations. Various green building certification systems, such as BREEAM, LEED, and CASBEE [7], have been established worldwide to assess the sustainability of buildings. In addition, relevant Chinese design standards have been reviewed. The control factors mentioned in the Design Standard for Energy Efficiency of Public Buildings (GB50189-2015) [8] may affect building energy consumption including the window area, building orientation, window heat transfer coefficient and solar heat gain coefficient, window air tightness, exterior wall heat transfer coefficient, roof heat transfer coefficient, solar heat gain coefficient, and proportion of exterior windows [8]. The Standard for Daylighting Design of Buildings (GB5003-2013) [9] includes influencing factors such as the window-to-ground area ratio, window area, glass transmittance and radiation ratio, orientation, and site topography (slope), which are related to lighting design the control factors of green buildings. It can be found that for green buildings with different uses, appropriate control factors should be selected based on actual conditions to complete the optimal design of green buildings. Since the complexity of the evaluation system is often inconsistent with the focus of the designer, program design evaluation is usually not based on the optimization of comprehensive performance [10], and it is impossible to fully consider the comprehensive performance of the building for design.
In recent years, domestic and foreign scholars have conducted more research on the design stage of green buildings. Cai et al. [11] proposed a fuzzy multi-level gray method by combining the fuzzy Delphi analytic hierarchy process and gray theory; Yu et al. [12] proposed a chain risk management framework for green building projects under the EPC model from the perspective of a general contractor; Zhang et al. [13] included carbon emissions into the evaluation system for the first time, used the Delphi method to determine 18 key evaluation indexes, and established a green building evaluation index system; Eti et al. [14] designed a DEMATEL decision-making model based on TOPSIS, which determined the priority of each factor during green building renovation and used it for the weight of the green building evaluation system; and Jamaludin et al. [15] used gray relational analysis–analytic hierarchy process to sort and evaluate projects and studied the low-carbon evaluation of green buildings based on the full life cycle theory. In order to reduce the human error of subjective weighting methods such as the AHP, while reducing the experimental workload and improving efficiency, an orthogonal experiment-EWM-TOPSIS model was proposed.
In this study, the comprehensive performance standards of green buildings were considered in a test, and the use of orthogonal experiments was proposed to optimize the design scheme, which improved the test efficiency. Furthermore, an evaluation analysis model combining the EWM [16] (entropy weight method) and the TOPSIS [17] (technique for order preference by similarity to an ideal solution) method was constructed. TOPSIS is a relatively objective method and EWM is applied to reduce TOPSIS’s dependence on weights. Based on orthogonal experiments, the connection EWM and TOPSIS is beneficial for improving the scheme optimization of green building designs.
The rest of the paper is structured as follows: Section 2 is the mathematical theory of the methods used in the study; Section 3 describes the actual case study of the method proposed in the study; Section 4 is a discussion of the method model and actual cases; and Section 5 presents the conclusions of this study.
2. Design of Scheme Optimization
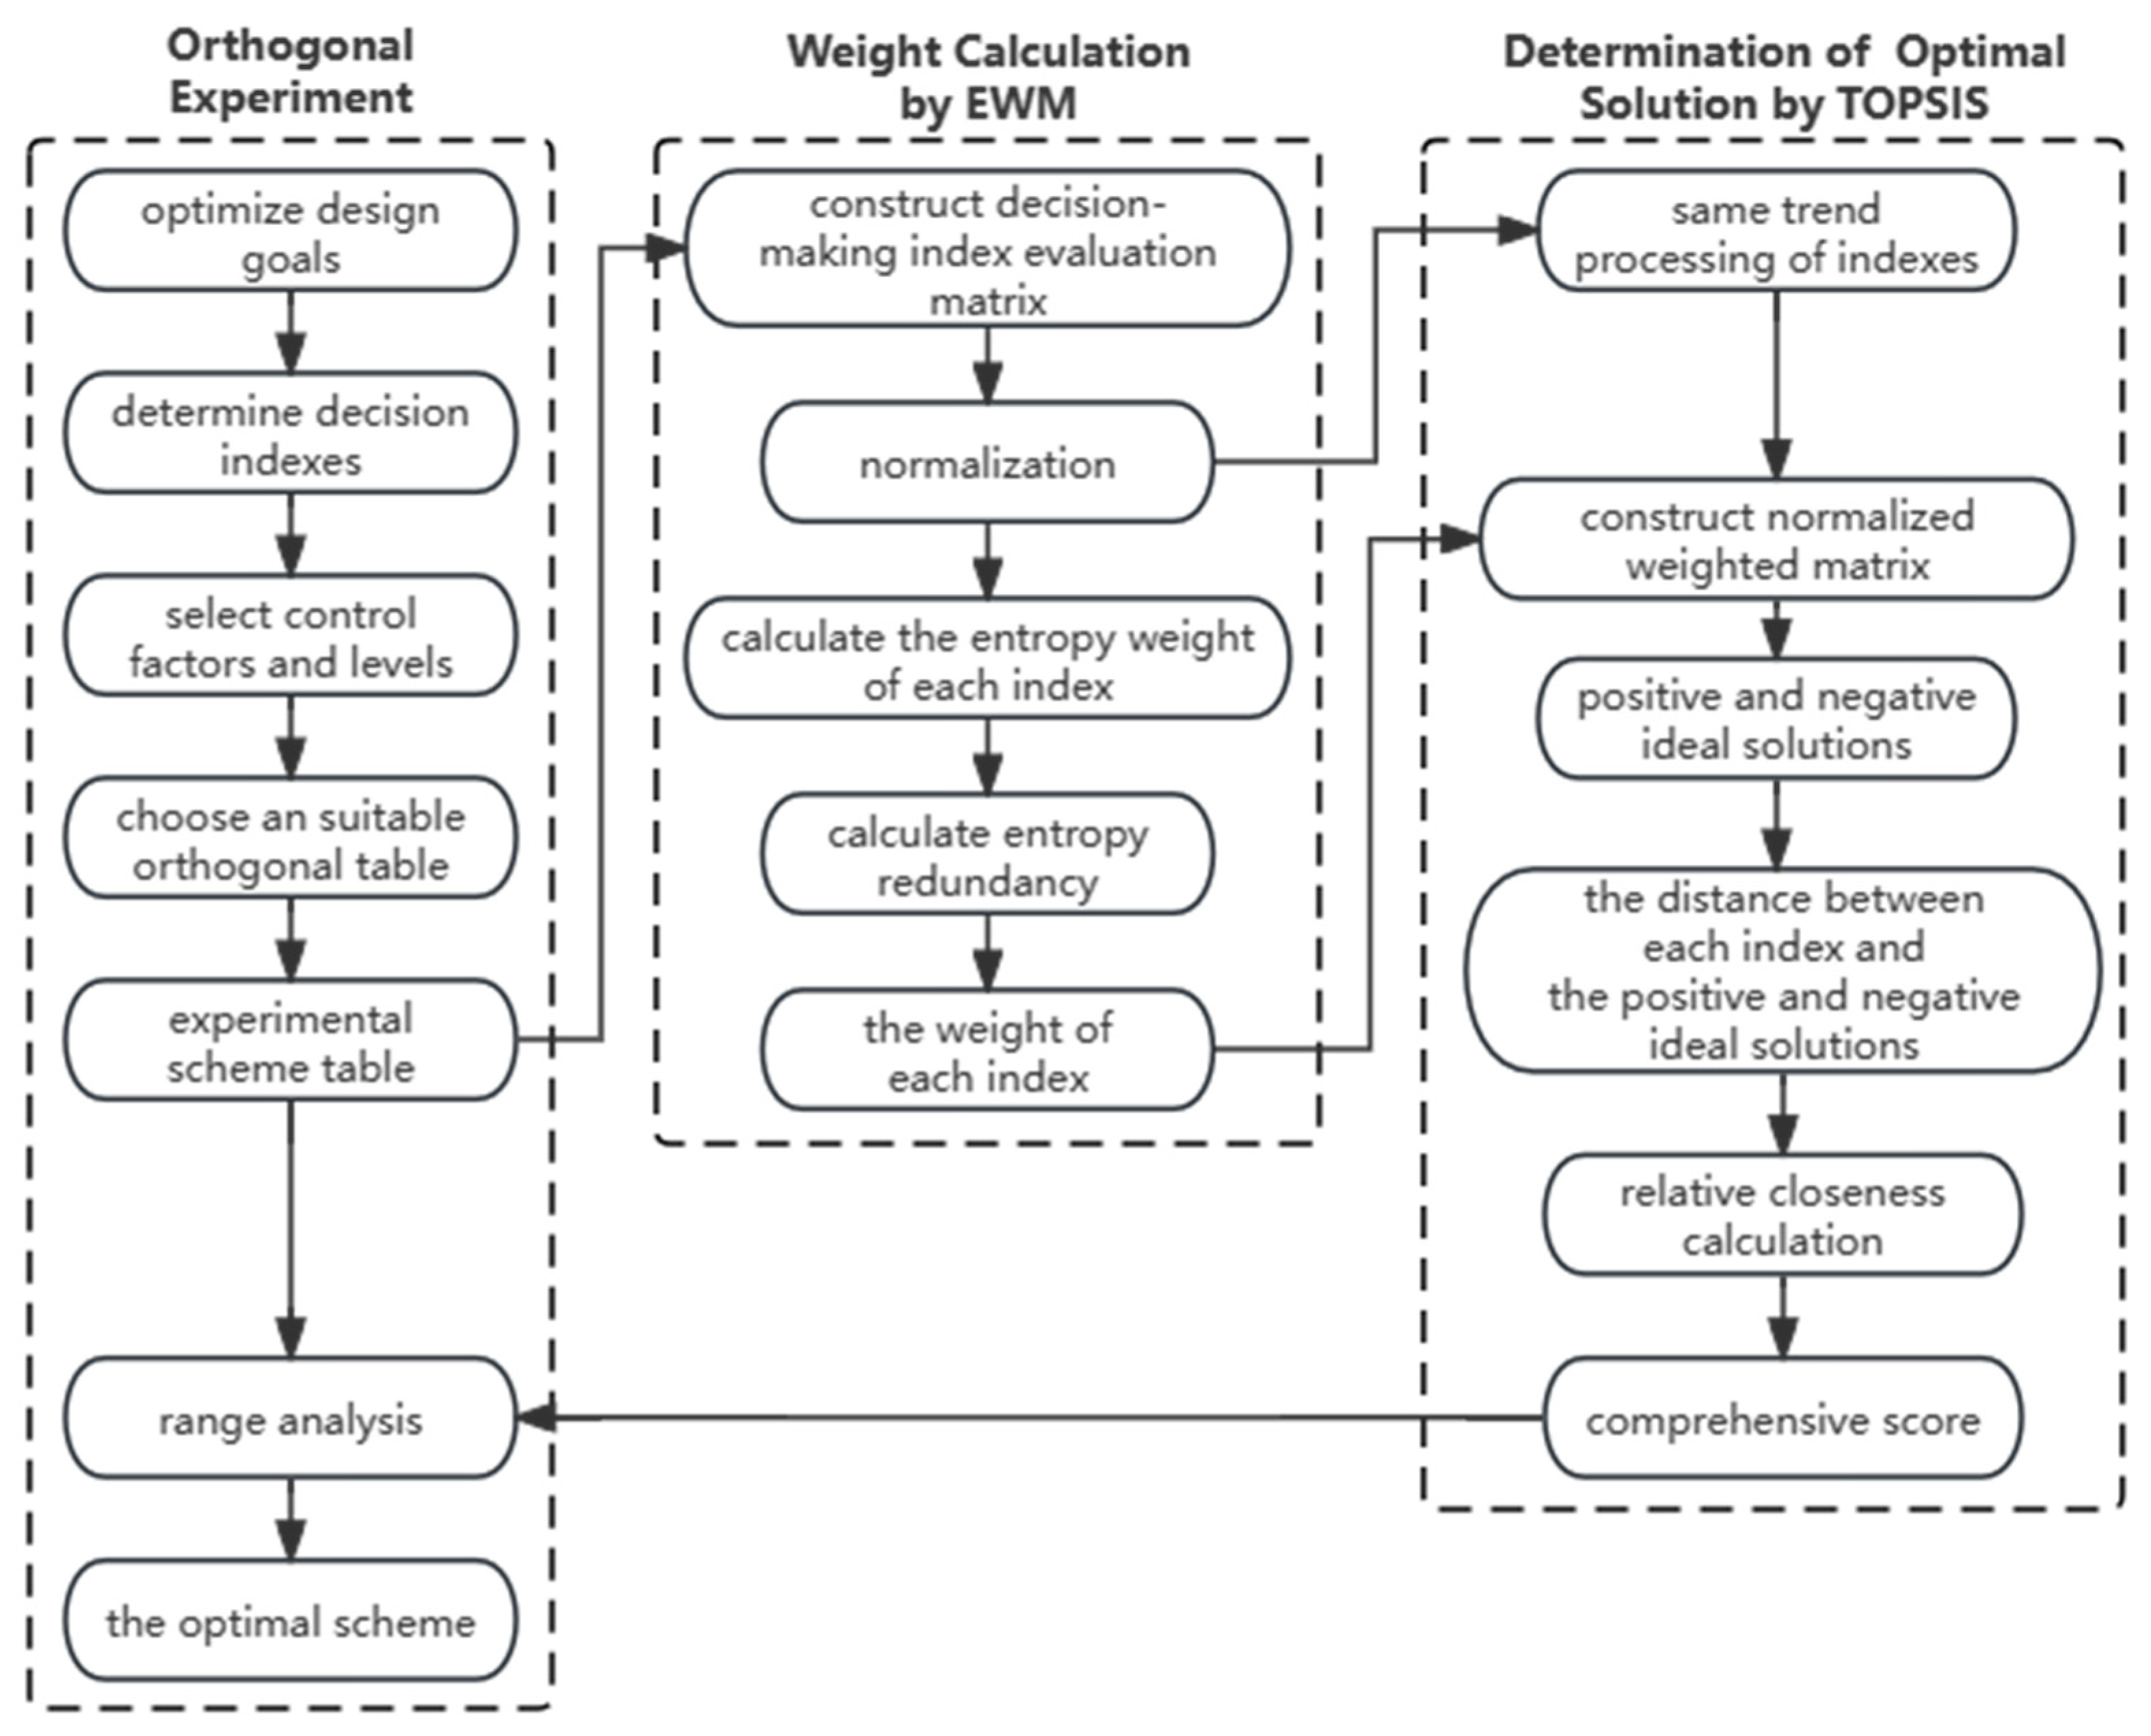
Because the concepts and classifications of various decision-making indexes in green building design plans are different, the dimensions between indexes may not be of the same order of magnitude. Therefore, it is difficult to determine the merits of each experimental design just by directly processing orthogonal experimental data. To control the interference of experimental errors, such as handling indicators of different dimensions to standard, and taking into account various issues such as sustainability and cost in green building design, this paper proposes a multi-objective decision-making approach. This paper combined the EWM with the TOPSIS method to construct a multi-objective decision-making model for green building design solutions and designed its technical process, as shown in Figure 1.
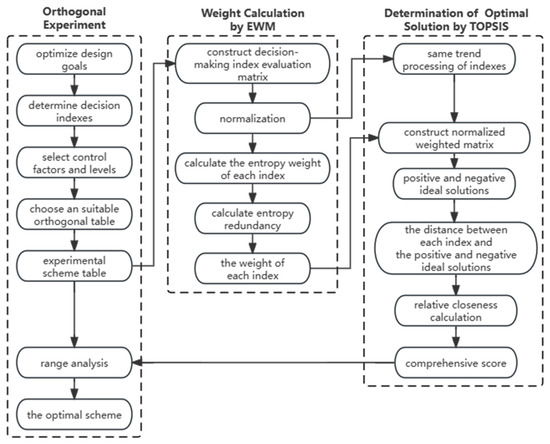
Figure 1.
Algorithm flowchart of multi-objective decision model.
2.1. Principle of Orthogonal Experiment
The optimization design process of green buildings is complex and has many influencing factors. It is difficult for existing overall performance evaluation systems to fully reflect the experimental results [8,18,19]. Faced with this multi-factor decision-making problem, the orthogonal experimental design provides an efficient, fast, and economical solution. The orthogonal experimental method is an experimental design method that reasonably arranges tests via orthogonal tables, selects some representative level combinations for testing, and reflects the situation of all combinations via these representative combinations, thereby finding the best combination of test levels. It is widely used in multi-factor and multi-level experiments [20]. In the orthogonal experimental design, it is necessary to clarify the purpose of the experiment to determine the indexes for evaluating the orthogonal experimental design combination and to determine the control factors that affect the landscape architecture, based on the purpose of the experiment and the evaluation indexes. The orthogonal experimental process is shown in Figure 1.
Orthogonal experiments with different numbers of factors and levels require designing different orthogonal tables, denoted as [21], where is the orthogonal table; is the number of experiments, i.e., the number of rows; is the number of levels contained in each factor; and is the number of factors, i.e., the number of columns.
Based on the design combination results obtained from the orthogonal experiment, this paper used the EWM to calculate the index weight of the design combination and used the TOPSIS method to evaluate the design combination under each weighted index to obtain the comprehensive score of each design scheme in the orthogonal experiment. According to the comprehensive score of each design plan, the impact of each control factor on the design plan was obtained using the range analysis method. The specific steps are as follows:
- (1)
- Obtain the orthogonal experimental scheme and the evaluation index of the merits and demerits of each plan.
- (2)
- Calculate the sum Kl of the evaluation indexes of the scheme when the factor is at level l:where is the comprehensive score, as shown in Formula (16).
- (3)
- Calculate the mean of Kl:where r is the number of orthogonal experimental repetitions for the factor at level l.
- (4)
- Obtain the range value, which is used to rank the influence degree of factors. The larger the range value, the greater the influence of the control factor on the design scheme:
2.2. Determination of Decision-Making Index Weights Based on EWM
Information entropy can be calculated to determine the amount of information, and it can also objectively reflect the original information. Information entropy is inversely related to the information amount, whereby the greater the information entropy, the smaller the index information and the smaller the effect of comprehensive evaluation, and vice versa. Information entropy plays an important role in evaluation [22]. The EWM can reflect the distinguishing abilities of indexes, thereby determining their weights. The EWM is an objective weighting method with higher objectivity than subjective weighting methods such as the analytical hierarchy process (AHP) and decision-making trial and evaluation laboratory (DEMATEL) methods, generating experimental results with relatively better credibility and accuracy.
The EWM method was used to calculate the weight relationships between decision-making indexes to provide a basis for the subsequent comprehensive evaluation of multiple indexes.
The specific steps for determining index weights using the EWM are as follows:
- (1)
- Assume that there are green building evaluation schemes and decision-making indexes, and a decision-making index evaluation matrix with rows and columns is constructed.
- (2)
- Normalize each element of the evaluation matrix. Indexes with larger values that are more beneficial to the decision-making goal are called the positive indexes, and vice versa are the negative indexes. Obtain the normalized matrix :Positive index:Negative index:
- (3)
- Calculate the entropy weight of the index:where . Satisfy .
- (4)
- Calculate the entropy redundancy (coefficient of variation) :
- (5)
- Calculate the weights based on the entropy redundancy :
2.3. Construction of Decision-Making Model Based on TOPSIS
TOPSIS is a common method in multi-objective decision-making analysis. It is a ranking method that is close to the ideal solution, also known as the superior and inferior solution distance method [23]. This method can fully use the information from the original data, and its results can accurately reflect the gaps between various evaluation schemes. Moreover, it is suitable for complex systems with multiple indexes, and its calculation process is clear and convenient, with clear concepts and strong operability [5].
The TOPSIS method constructed an initial matrix, eliminated the influences of different dimensions via normalization, determined the weights of indexes, conducted a comprehensive evaluation of the green building design scheme, and obtained positive and negative ideal solutions. Via the distance of the ideal solution, it calculated the relative closeness to confirm the optimal scheme. The specific steps are as follows:
- (1)
- Construct an initial judgment matrix and process the original data with the same trend.The initial judgment matrix is constructed the same as in step (1) of the EWM. The TOPSIS method requires that all indexes have consistent directions. It is common to distinguish between positive indexes and negative indexes in the data and convert negative indexes into positive indexes (that is, data positive processing). The reciprocal method is used for absolutely negative indexes, and the difference method is used for relatively negative indexes [24].
- (2)
- Make the indexes dimensionless, eliminate the influences of different index measurement units, and obtain the standard matrix :
- (3)
- Via the EWM, the weight of an index was determined to be . As such, the index weight matrix is as follows:
- (4)
- Construct a weighted decision matrix :where , , is the weighted value of the scheme and the evaluation index; and is the weight of the evaluation index.
- (5)
- Determine the positive ideal scheme and the negative ideal scheme . By analyzing the weighted decision matrix, the best value and the worst value of the green building multi-objective optimization design decision-making objective can be obtained. The specific calculation formula is as follows:where is a subset of positive indexes, and is a subset of negative indexes.
- (6)
- Calculate the distance between each index value and the positive and negative ideal scheme values. Comparing the scheme designed using orthogonal experiments with the best optimization scheme and the worst optimization scheme can be calculated using the following formula:where is the distance from the target to the optimal target, and is the distance from the target to the worst target.
- (7)
- Calculate the relative closeness of each index value:where was used as the final comprehensive score, and the goals were sorted according to the size of to form the basis for decision making, thereby determining the optimal scheme. When , , indicating that the scheme was the worst solution. When , it meant that the scheme was optimal. The evaluation schemes were sorted in ascending order according to the value of . A greater value of indicated that the scheme was better. The scheme with the largest value of was the best evaluation scheme.
3. Case Analysis
3.1. Case Overview
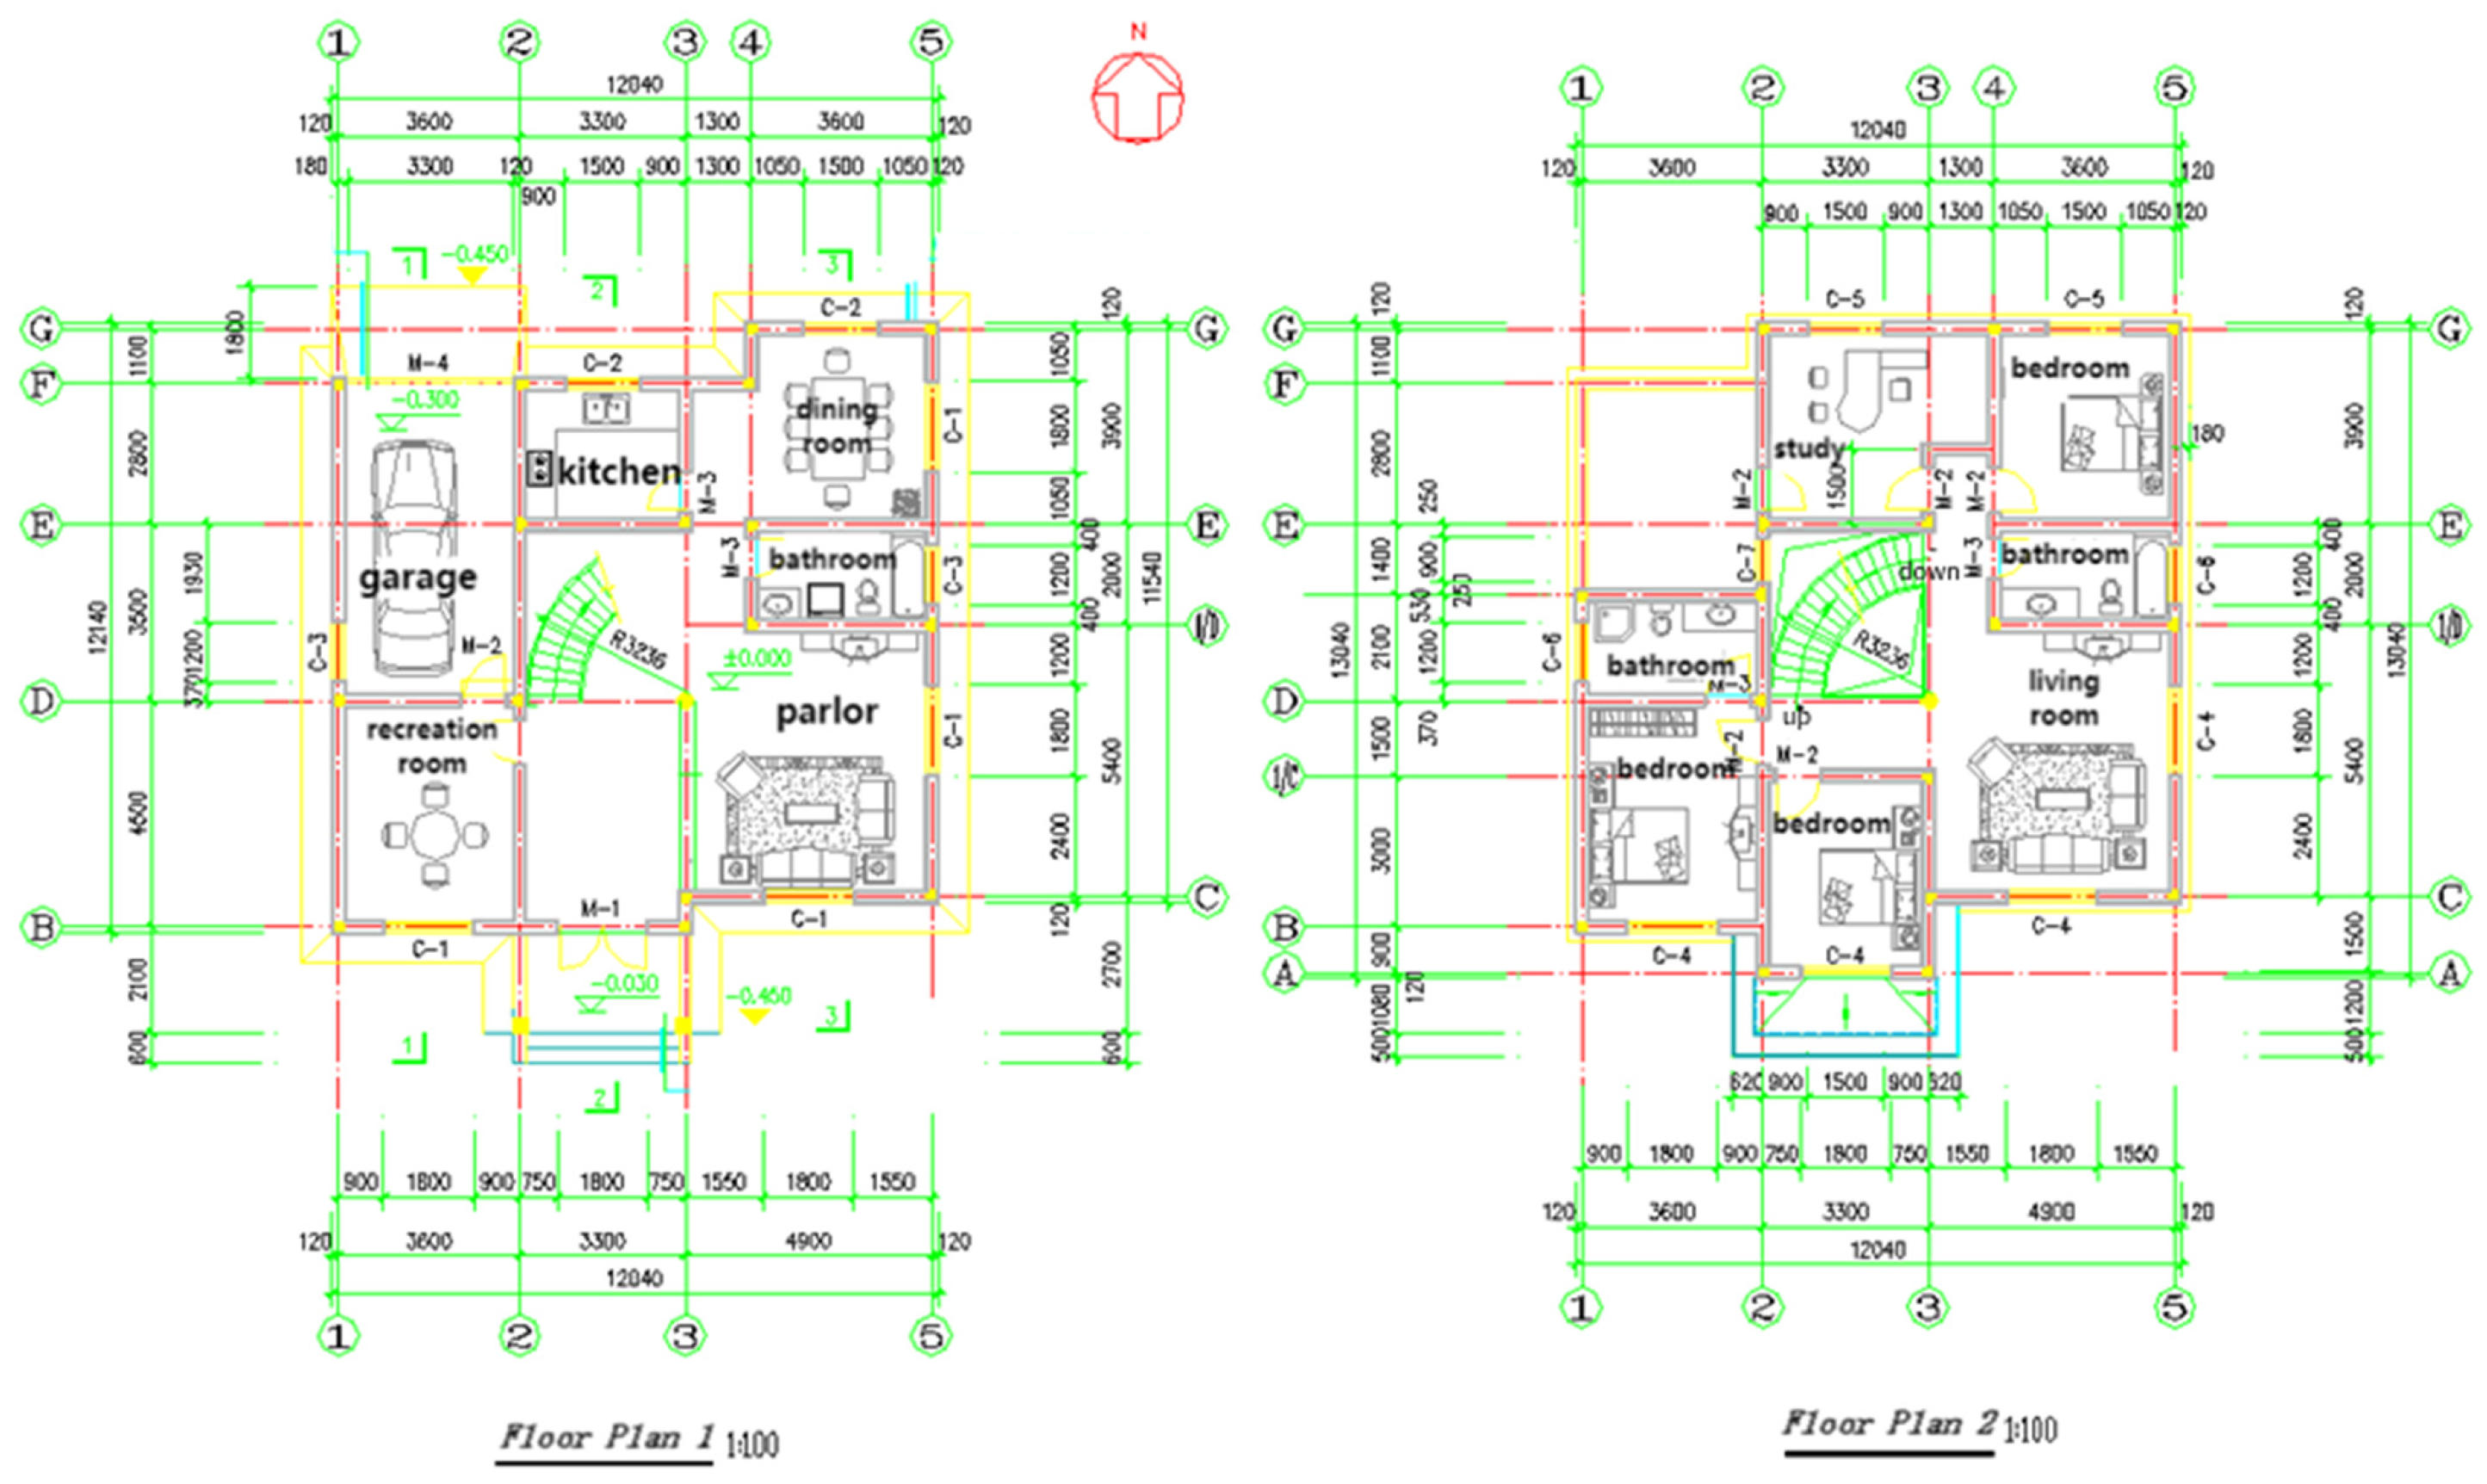
This project was located in Nanjing, the capital of Jiangsu Province. The climate is hot in summer and cold in winter, with an average annual temperature of 13–22 °C and an annual rainfall of 1090.6 mm. It has a humid subtropical monsoon climate with four distinct seasons, with rain and heat in the same season. The dominant wind direction in winter are northeast wind and east wind. The project building was a single-family villa, covering an area of 100 square meters, with a total construction area of 281 square meters, a building height of 11.2 m, no basement, an indoor and outdoor height difference of 0.45 m, and a design service life of 50 years (according to the Unified Standard for Reliability Design of Building Structures GB50068-2018) [25]. The roof waterproofing level was four, and the building fire resistance level was two. According to the Design Standard for Energy Efficiency of Residential Buildings in Hot Summer and Cold Winter Zone (JGJ 134-2010) [26] requirements for the window area in each direction, the window area of the building was designed as 0.30 to the east and west and 0.26 to the south and north. The floor plan of this villa is shown in Figure 2.
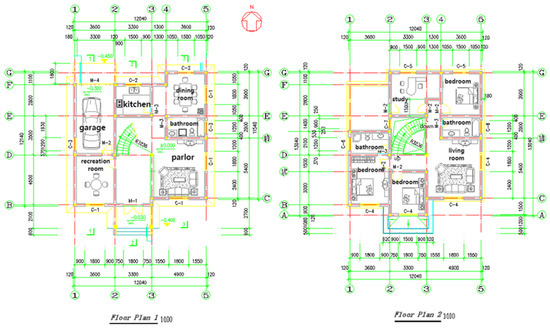
Figure 2.
Floor plan of the first and second floors of the single-family villa.
3.2. Orthogonal Experimental Analysis
3.2.1. Determination of Control Factors
Optimization design is a complex construction process during which it is necessary to strictly follow national and industry design standards. It is also necessary to consider the climate conditions and geographical environment of the project area and comprehensively consider and compare all possible influencing factors. Moreover, China has a vast territory and covers different climate zones, so there is a regional imbalance in the development of green buildings [27].
Because the object of this case study was residential villas, the green building design goals needed to improve the quality of living in addition to key factors such as cost and energy efficiency. Therefore, the Assessment Standard for Green Building (GB50378-2019) [28] was comprehensively integrated, and the related literature [29,30,31,32] indicated the following optimization design goals: the green building cost, daylight factor, and energy consumption.
According to the comprehensive goals of energy-saving building design and the three optimization design goals, the selected control factors needed to meet the requirements of at least two design goals; otherwise, they would not be considered. For different types of buildings, control factors can be selected for the standards in sequence. Therefore, referring to the relevant literature [30,33,34,35,36] and technical specification requirements [8,9,25,26,28,37], considering the Nanjing climate and taking into account that the villa’s location in an area with a sparse population and building distribution, the following control factors were selected: terrain elevation (A), window area (B), building orientation (C), external window opening ratio (D), roof structure (E), and window glass material (F). Each factor was designed with three levels (1, 2, and 3). ArcGIS was used to analyze the villa location site. We concluded that the site’s elevation was in the range of 5 to 25 m, so the elevation could be designed at 5 m (A1), 15 m (A2), and 25 m (A3). According to the Design Standard for Energy Efficiency of Residential Buildings in Hot Summer and Cold Winter Zone (JGJ 134-2010) [26] and aiming to meet indoor lighting requirements and prioritize energy saving, the designed window areas could be 900 × 1200 mm (B1), 1200 × 1500 mm (B2), and 1500 × 1800 mm (B3). Natural ventilation and winter sunlight should be considered in a green building. Moreover, the building’s main orientation should be selected according to the area and should avoid the dominant wind direction in winter. A comprehensive analysis using the Weather Tool plug-in, Ecotect showed that the best orientation in Nanjing was approximately 170°. The orientations deviated by 10° each, forming three orientation designs of green buildings, namely, 160° (C1), 170° (C2), and 180° (C3). According to the Assessment Standard for Green Building (GB50378-2019) [28], the window areas should be designed to be 40% (D1), 45% (D2), and 50% (D3). There were three main forms of roof structure: ordinary roof without special materials (E1), 40 mm thick expansion insulation board roof (E2), and 40 mm thick extruded polystyrene board roof (E3). The window glass materials could be designed as ordinary glass (F1), double-layer insulated glass (F2), and vacuum glass (F3). The results are shown in Table 1.

Table 1.
Multi-objective optimization design scheme for green buildings.
3.2.2. Orthogonal Experimental Analysis Results of Design Scheme
There were 36 = 729 possible full-factor experimental design combinations. The workload to determine the best design scheme from 729 experimental combinations was large and therefore inefficient. Since this case considered a certain interaction between various factors, an orthogonal table was chosen, which greatly improved the design efficiency and accurately selected the best design scheme. The parameter design results of the orthogonal experimental scheme with six factors and three levels are shown in the Table 2.
Table 2.
Orthogonal test results of multi-objective scheme.
Referring to the six-factor and three-level parameter design, the total energy consumption of green buildings was simulated and calculated using the GBS (Green Building Studio) https://gbs.autodesk.com/gbs, the lighting coefficient of green buildings was simulated using Ecotect software (https://www.autodesk.com/), and the cost of green buildings was calculated using the GBQ (Glodon Bill of Quantity).
Take No.1 scheme in the Table 2 as an example. The building energy consumption analysis methods currently used in academia are divided into two categories: one type is the static energy consumption analysis method based on stable heat transfer theory, and the other type is the dynamic energy consumption simulation method based on unstable heat transfer theory [29]. The dynamic energy consumption simulation method is more accurate than static energy consumption analysis and can be realized hour-by-hour and zone-by-zone dynamic simulations of building energy consumption [29]. The energy consumption simulation software GBS used in this case adopts the dynamic simulation method, with a life cycle of 50 years. After modeling according to the parameters of Scheme 1, the energy consumption analysis showed that the life cycle electricity consumption was 1,924,258 kwh. The specific results for each item are shown in Table 3.
Table 3.
Energy consumption analysis results.
This case study was located in Nanjing, which belongs to the class IV light climate zone [9]. The critical illuminance value of outdoor natural light is approximately 4500 Lux (Illuminance). The daylight factor of residential buildings should not be less than 2% [9]. Therefore, in the analysis results of lighting conditions in Scheme 1, the proportion of areas with outdoor natural light daylight factors that met national standards (≥2%) was 53.18%. The specific simulation analysis results of Scheme 1 are shown in Table 4.
Table 4.
Simulation calculation results of daylight coefficient.
The parameters of the constructed single-family villa model in this case, according to Scheme 1, were modified and imported into the GBQ 4.0 software for calculation and setting. When setting up the Scheme 1 model, the unit price and quantity were determined based on the types of different required materials, and the total price of the materials was then calculated. Other design solutions only needed to be compared with the reference solution, which saved a lot of calculation time. The cost of Scheme 1 was calculated as approximately USD 29,500.
The 18 options obtained from the final orthogonal experiment were analyzed in terms of the green building cost, daylight factor, and energy consumption. The results are shown in Table 5.
Table 5.
Analysis results of design schemes.
3.3. Optimized Design Based on EWM-TOPSIS Model
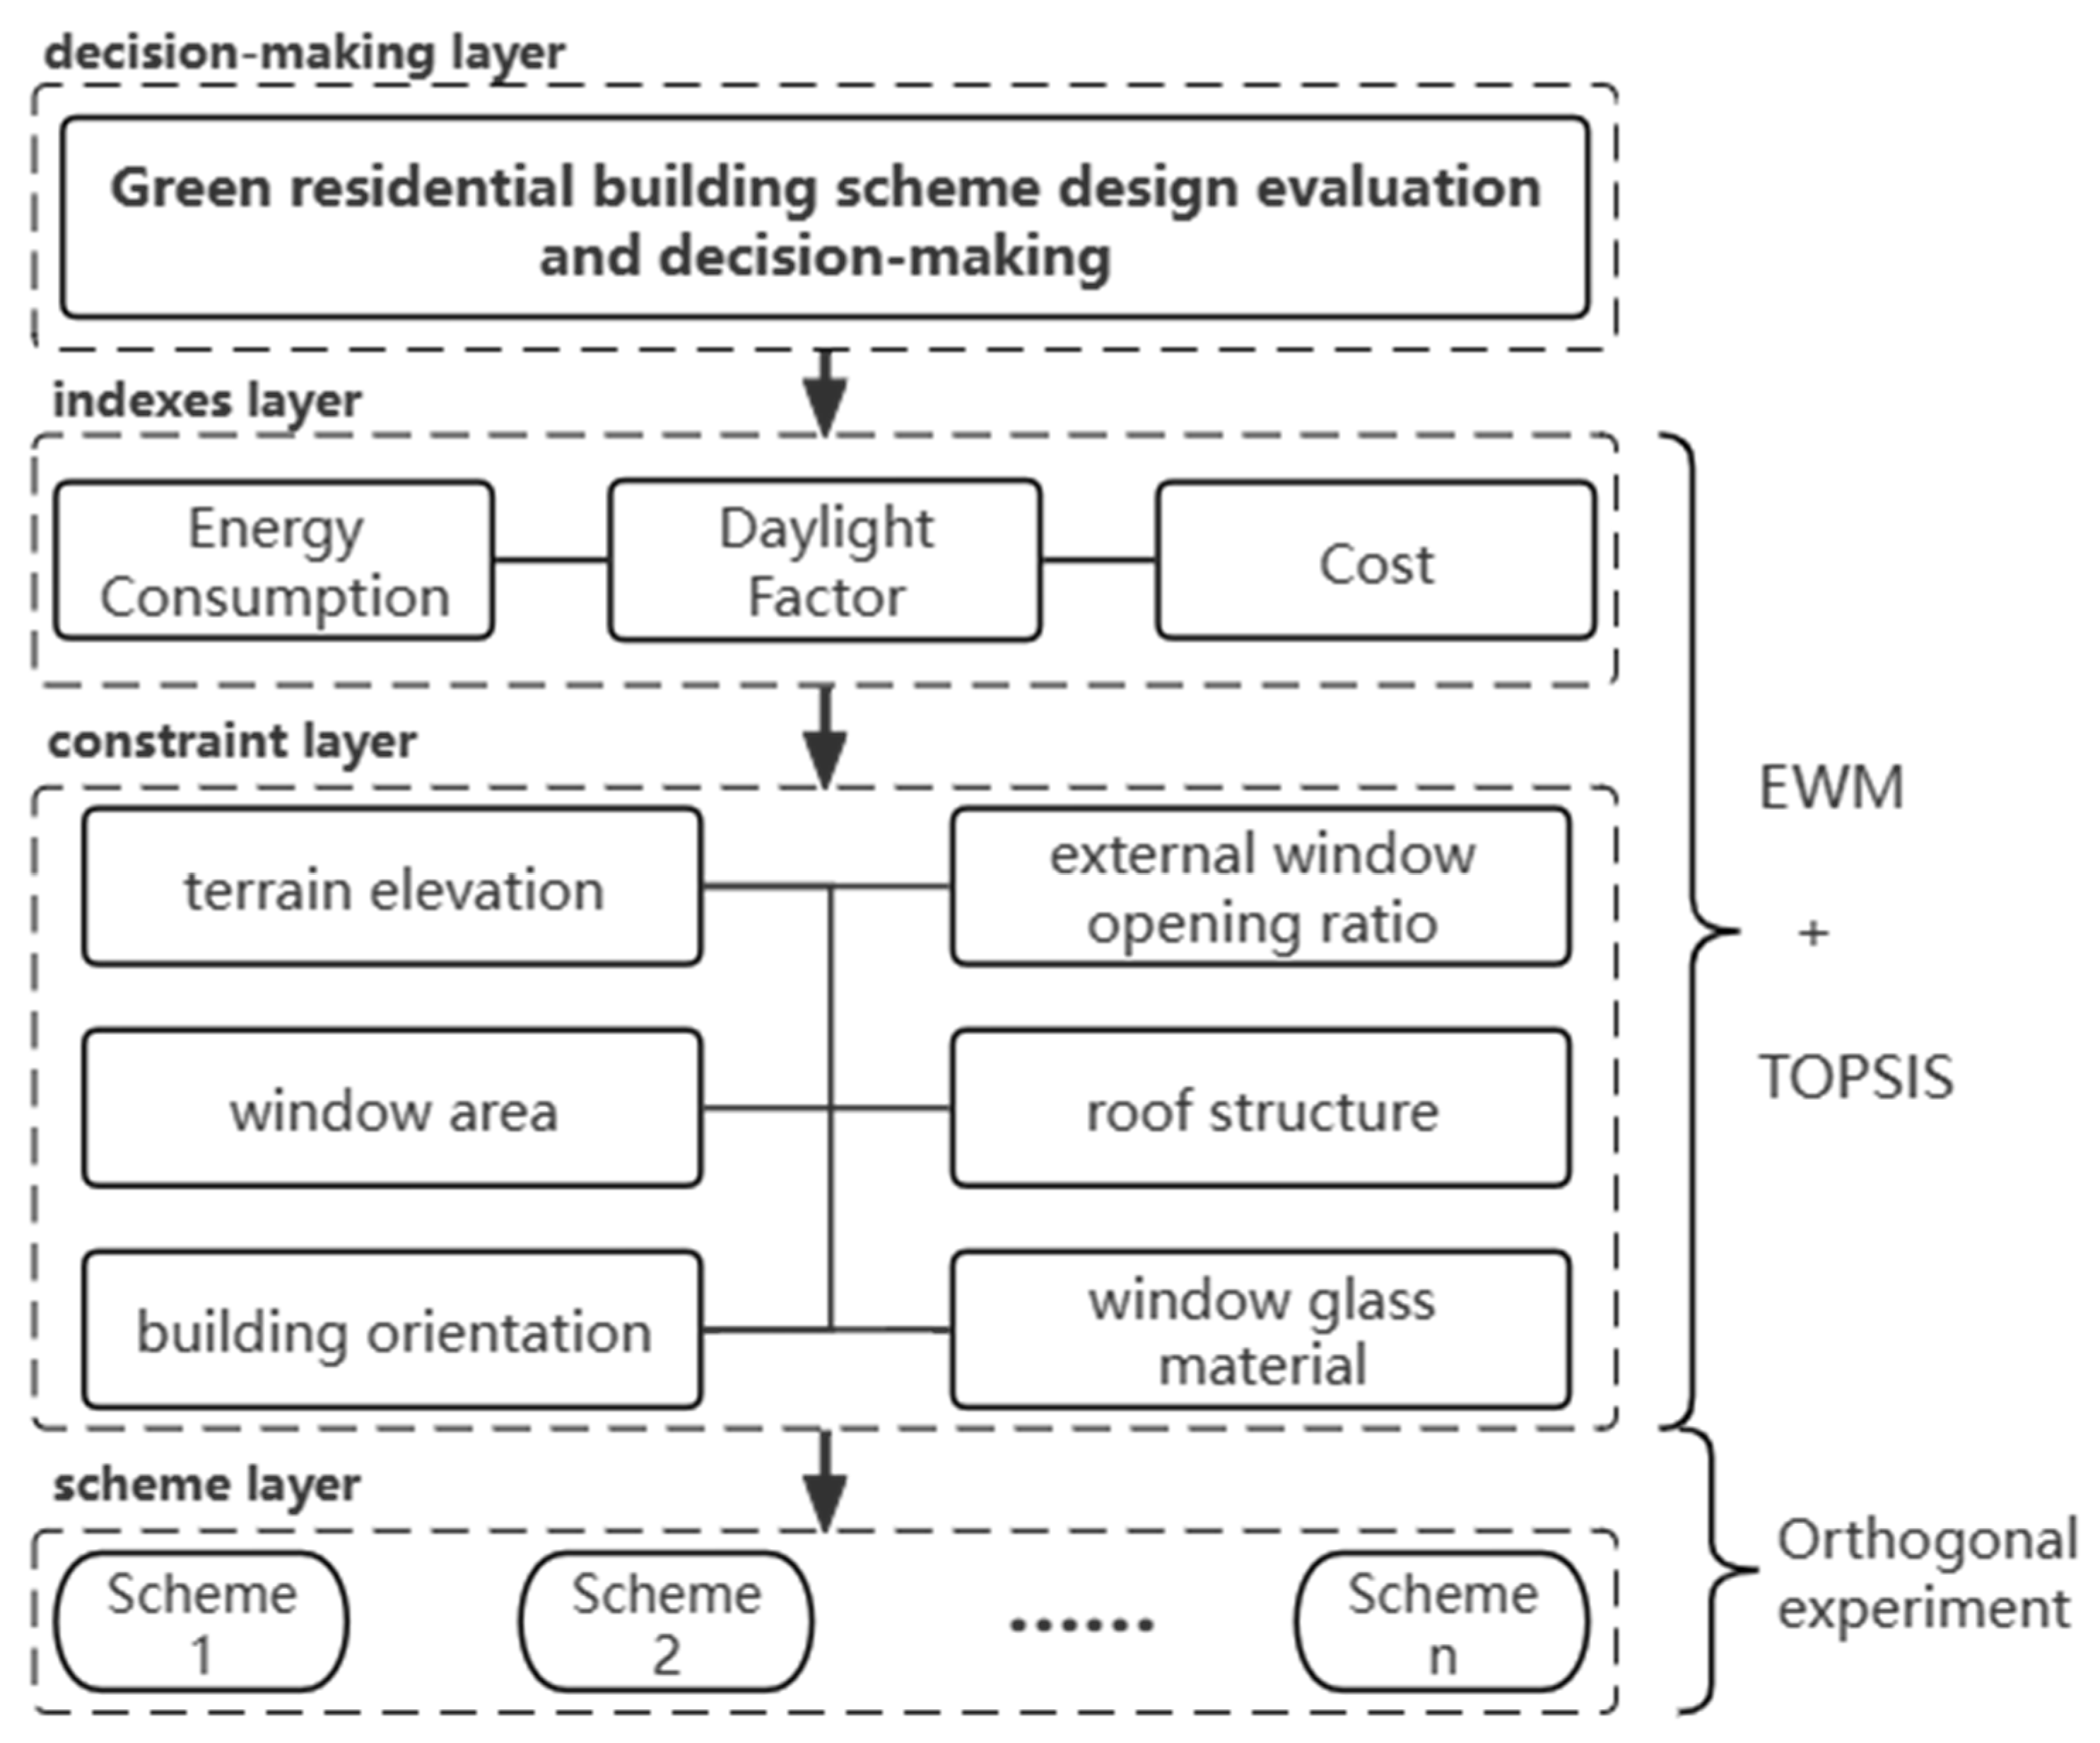
Given the characteristics of the multiple decision-making indexes that must be comprehensively considered in the decision-making process of green building design scheme selection, the decision-making problem was first structured and made hierarchical, and a decision-making index system based on a hierarchical structure was constructed, as shown in Figure 3. The system was divided into four layers: the first layer mainly represented the purpose of decision-making or the results to be achieved, that is, determining the optimal design solution; the second level comprised the subordinate indexes of the previous level, indicating the decision-making goals that must be met first before achieving the decision-making purpose; the third layer was the constraint layer, which represented all factors that affected the index; and the fourth layer was the scheme layer, which represented the resulting design solution.
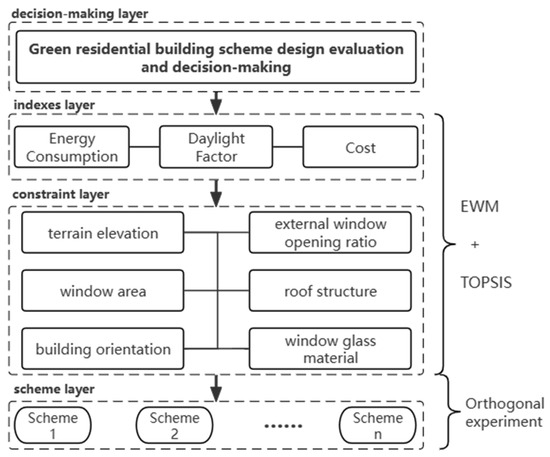
Figure 3.
Decision-making index system for green building design schemes.
3.4. Result Analysis
According to the above EWM formula, the relative weights of the energy consumption, daylight factor, and green building cost were calculated to be 58%, 24%, and 18%. The weights were substituted into the TOPSIS model, the positive and negative ideal solution distances of each experiment combination were obtained according to Formulas (14) and (15), and the comprehensive score of each experimental combination was obtained according to Formula (16).
Finally, the comprehensive evaluation results of the EWM-TOPSIS model were obtained, as shown in Figure 4. From the ranking of the comprehensive score results, it could be concluded that among the 18 design solutions included in the orthogonal experiment, in this case, the optimal design solution was A1B2C2D2E2F2. To obtain the optimal design scheme for the all-factor experiment in this case, based on the calculated comprehensive score of each experimental scheme, the range analysis method was used to calculate the degree of influence of each factor on the design scheme. Simultaneously, the optimal level for each factor was determined, resulting in the optimal design scheme for this case, as shown in Table 6.
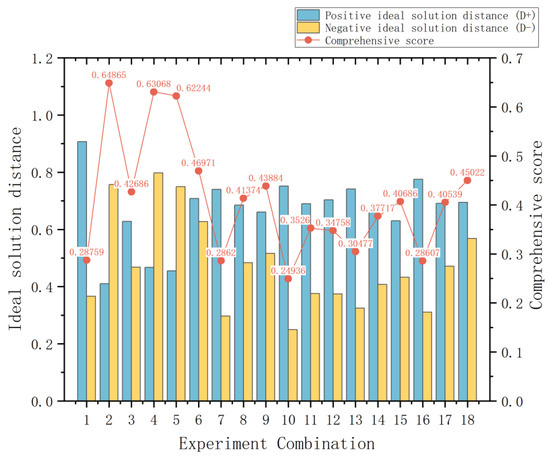
Figure 4.
Comprehensive evaluation results of green building.
Table 6.
Orthogonal test range analysis results.
Finally, the optimal design scheme, in this case, was A2B2C2D2E2F3, i.e., the villa was built on a 15-m-high site, with a vacuum glass window shape of 1200 × 1500 mm, a building orientation of 170°, an external window opening ratio of 45%, and a roof structure consisting of 40 mm thick expanded insulation board roof. It was concluded that the three control factors of terrain elevation, window area, and roof structure had a more significant impact on the evaluation of the green building optimization design scheme in this case. Therefore, if we want to continue to optimize the green building in this case, we should focus on the design of the terrain elevation, window area, and roof structure.
4. Discussion
4.1. For the Method Model
Considering the different environments and conditions of different engineering projects, the orthogonal test EWM + TOPSIS proposed in this article is also applicable to other situations. Compared with the research methods used in the literature mentioned in the Introduction, this method is more objective and efficient. We also reduce the impact of the strong dependence of TOPSIS weights through EWM.
The decision-making goals of green buildings are not limited to the buildings’ energy consumption, daylight factor, and cost. More decision-making goals are conducive to optimizing the evaluation standards of green buildings. The method used in this article is also applicable to more parameters. By selecting different parameters, different types of buildings can also be optimized and designed.
Orthogonal experiments select some representative schemes for the experiments and use them to represent the whole, so the particularities of a certain scheme cannot be completely avoided.
The green building optimization target studied in this case was residential villas. The selected decision-making objectives and control factors should be adapted for different types of buildings. For example, for a green building with the intended purpose to be a library, the decision-making objectives used should focus on factors such as lighting conditions and humidity. Of course, although the same control factors are selected, the different levels of control factors must also be adjusted accordingly.
4.2. For the Case
Compared with previous research, research on green residential buildings targeted energy consumption or environmental protection benefits and comfort. Guo et al. [30] took environmental protection as the primary goal when designing and optimizing green buildings, they believe that the control factors that have a greater impact on the environment include the thickness of the exterior wall insulation, solar heat gain coefficient of exterior windows, indoor design temperature, fresh air volume, air conditioning energy efficiency ratio, window area and natural ventilation that sets the temperature. Hauser et al. [35] conducted experiments to optimize building performance and considered the following control factors to be indispensable: daylight conditions, building orientation, window opening size, and building materials.
However, in practice, the type of building and design purpose also need to be taken into account. Craigale [38] conducted research on the impact of building performance, in which he believed that sunlight conditions were not a necessary control factor, and replaced sunlight conditions with the proportion of exterior windows that can be opened. Li et al. [36] studied green high-rise office buildings, taking into account the actual situation of floor height and office use; they believed that control factors such as sunlight conditions, the proportion of exterior windows that can be opened, building orientation, interior design temperature, and building exterior wall materials can be more consistent with the requirements of green buildings condition. Fu et al. [39] selected control factors such as window glass material, building materials, indoor lighting conditions, and building orientation to complete the low-carbon design of green buildings based on photovoltaic power generation. The reason why the above six control factors were selected in this study, is that the building type is residential and must meet the design goals of environmental protection and comfort.
During the research process, it was found that the key controlling factors for building energy consumption, in this case, were not only the building orientation, window area, and proportion of external windows that can be opened but also the rationality of the roof structure, which impacted energy consumption.
According to the best and worst solutions in this case, the greater the elevation, the higher the proportion of windows that can be opened, resulting in a better lighting effect; however, this also leads to higher energy consumption and an increased initial investment cost. The best villa orientation was only a basis for orientation selection. The larger the window size, the better the lighting effect, but the greater the energy consumption and cost.
5. Conclusions
Given the multi-factor and multi-level scheme design characteristics of green buildings, a decision-making index system for green building evaluation schemes was first constructed, and then, candidate green building schemes were determined via orthogonal experimental methods, with cost, energy consumption, and daylight factor as the main decision-making objectives. Performance simulation analysis was conducted on different design parameter combination schemes. Finally, the EWM-TOPSIS decision-making model was constructed to evaluate the candidate schemes, and the parameter combination for the optimal scheme was determined as “15 m elevation, a 1200 × 1500 mm size vacuum glass, an orientation of 170° and an external window opening ratio 45% with a 40 mm thick expanded insulation board roof”. In existing practice, green building design mainly relies on expert opinions, which is too subjective and requires high experience. Therefore, on the basis of orthogonal experiments, this paper combined the two methods of EWM and TOPSIS and applies them to green buildings, which can achieve objective and fast design.
In the case of residential construction in Nanjing, we selected six control indexes including terrain elevation, window area, building orientation, external window opening ratio, roof structure, and window glass material to complete the green building optimization design. Among the 18 schemes in the orthogonal experiment, according to the results in Table 5, we compared the best scheme A1B2C2D2E2F2 with the worst scheme A1B1C3D3E2F2, where the building energy consumption has been greatly reduced by 724,127 kwh, and the daylight factor is not much different, but it ranks high among the plans, at the same time, the cost has also been reduced by 4.5 thousand USD.
The research results show that the proposed green building scheme design and its multi-objective decision-making model can efficiently select the optimal scheme to achieve the goals of energy conservation and greenness, providing an effective case reference for green building scheme design. However, the decision-making objectives in the optimization model still had limitations. More detailed indicators to improve living comfort, such as daily room temperature, air circulation, etc., could be determined to obtain better green building design schemes.
Author Contributions
Conceptualization and methodology, H.C.; software and formal analysis, Y.-c.A.; supervision, H.C.; project administration, H.C.; funding acquisition, H.C. All authors have read and agreed to the published version of the manuscript.
Funding
This research was funded by the National Natural Science Foundation of China (grant number 42101430).
Data Availability Statement
The original data used in this study is shown in Figure 2. Table 1 and Table 2 are the design options applicable to the residential buildings. Table 3, Table 4 and Table 5 are obtained by analyzing energy consumption, daylight factor, and cost based on the original data. The final conclusion of this study is to use Formula (1) to Formula (16) to perform multi-objective decision-making analysis on the data in Table 5, as shown in Table 6 and Figure 4.
Conflicts of Interest
The authors declare no conflicts of interest.
References
- Li, X.; Damartzis, T.; Stadler, Z.; Moret, S.; Meier, B.; Friedl, M.; Maréchal, F. Decarbonization in complex energy systems: A study on the feasibility of carbon neutrality for Switzerland in 2050. Front. Energy Res. 2020, 8, 549615. [Google Scholar] [CrossRef]
- Wu, Z.; Jiang, M.; Cai, Y.; Wang, H.; Li, S. What hinders the development of green building? An investigation of China. Int. J. Environ. Res. Public Health 2019, 16, 3140. [Google Scholar] [CrossRef] [PubMed]
- Xue, S.; Zhu, J.; Wang, L.; Wang, S.; Xu, X. Research on dissipative structure of China’s green building industry system based on Brusselator model. Environ. Impact Assess. Rev. 2023, 103, 107284. [Google Scholar] [CrossRef]
- Xue, S.; Na, J.; Wang, L.; Wang, S.; Xu, X. The Outlook of Green Building Development in China during the “Fourteenth Five-Year Plan” Period. Int. J. Environ. Res. Public Health 2023, 20, 5122. [Google Scholar] [CrossRef] [PubMed]
- Kibert, C.J. Sustainable Construction: Green Building Design and Delivery; John Wiley & Sons: Hoboken, NJ, USA, 2016; pp. 12–79. [Google Scholar]
- Robichaud, L.B.; Anantatmula, V.S. Greening project management practices for sustainable construction. J. Manag. Eng. 2011, 27, 48–57. [Google Scholar] [CrossRef]
- Doan, D.T.; Ghaffarianhoseini, A.; Naismith, N.; Zhang, T.; Ghaffarianhoseini, A.; Tookey, J. A critical comparison of green building rating systems. Build. Environ. 2017, 123, 243–260. [Google Scholar] [CrossRef]
- GB50189-2015; Design Standard for Energy Efficiency of Public Buildings. Beijing Institute of Architectural Design Co., Ltd.: Beijing, China, 2015.
- GB5003-2013; Standard for Daylighting Design of Buildings. Ministry of Housing and Urban-Rural Development of the People’s Republic of China: Beijing, China, 2013.
- Wu, H. Building Energy-Saving Automatic Design System Based on BIM and Grey Taguchi Method. Master’s Thesis, Southwest Jiaotong University, Chengdu, China, 2018. [Google Scholar]
- Cai, J.; Zhang, Z.; Shi, P.; He, Q. Research on risk evaluation of green building design based on fuzzy multi-hierarchical gray method. J. Hefei Univ. Technol. (Nat. Sci.) 2015, 38, 968–972+983. [Google Scholar]
- Yu, H.; Chen, J. Research on the Risk Chain of Green Building Projects under EPC Mode Based on SEM. Sci. Technol. Manag. Res. 2021, 41, 199–205. [Google Scholar]
- Zhang, J.; Zhao, H.; Li, Z.; Guo, Z. Evaluation of Greenness of Green Buildings Based on Carbon Emissions. Kybernetes 2023, 52, 4645–4667. [Google Scholar] [CrossRef]
- Eti, S.; Dinçer, H.; Yüksel, S.; Uslu, Y.D.; Gökalp, Y.; Kalkavan, H.; Mikhaylov, A.; Pinter, G. Determination of priority criteria in green building transformation: An analysis on the service industry. Res. Glob. 2023, 7, 100164. [Google Scholar] [CrossRef]
- Jamaludin, F.A.B.; Li, J. Research on low-carbon evaluation of green buildings based on the whole life cycle theory. SN Appl. Sci. 2023, 5, 262. [Google Scholar] [CrossRef]
- Shannon, C.E. A mathematical theory of communication. Bell Syst. Tech. J. 1948, 27, 379–423. [Google Scholar] [CrossRef]
- Ching-Lai, H.; Yoon, K. Multiple Attribute Decision Making: Methods and Applications; CRC Press: Calabasas, CA, USA, 1981; pp. 11–13. [Google Scholar]
- Xu, J. Research on Low Energy of Rural Residential Buildings in The Cold Regions Based on Traditional Wisdom Construction. Master’s Thesis, Harbin Institute of Technology, Harbin, China, 2016. [Google Scholar]
- Liu, Y. The Research of Daylighting and Energy Consumption on Office Building. Master’s Thesis, Tianjin University, Tianjin, China, 2008. [Google Scholar]
- Mao, H.J.; Shu, M.; Li, C.; Zhang, B.J. Optimization design for beam structures of rail weld CNC fine milling machine based on Ansys Workbench. Appl. Mech. Mater. 2015, 716–717, 817–824. [Google Scholar] [CrossRef]
- Wang, X.; Liu, W.; Chen, C.; Zhang, Y. Rotor position optimization of a hybrid configuration UAV based on orthogonal experiment. Adv. Aeronaut. Sci. Eng. 2013, 1–12. Available online: http://kns.cnki.net/kcms/detail/61.1479.V.20231101.1323.002.html (accessed on 23 November 2023).
- Tao, M. Research on Risk Evaluation System of Green Building Developer Based on Entropy Weight TOPSIS. Master’s Thesis, Guangzhou University, Guangzhou, China, 2020. [Google Scholar]
- Liu, J. Research on Evaluating Model of Energy-Saving Reconstruction for Historic Office Building—A Case Study in Tianjin. Master’s Thesis, Tianjin University, Tianjin, China, 2017. [Google Scholar]
- Gao, Y.; Wang, J.; Shi, D. Implementation of weighted TOPSIS method comprehensive evaluation in Excel. Chin. J. Health Stat. 2007, 24, 428–429. [Google Scholar]
- GB50068-2018; Unified Standard for Reliability Design of Building Structures. Ministry of Housing and Urban-Rural Development of the People’s Republic of China: Beijing, China, 2018.
- JGJ 134; Design Standard for Energy Efficiency of Residential Buildings in Hot Summer and Cold Winter Zone. Ministry of Housing and Urban-Rural Development of the People’s Republic of China: Beijing, China, 2010.
- Zou, Y.; Zhao, W.; Zhong, R. The spatial distribution of green buildings in China: Regional imbalance, economic fundamentals, and policy incentives. Appl. Geogr. 2017, 88, 38–47. [Google Scholar] [CrossRef]
- GB50378-2019; Assessment Standard for Green Buildings. Ministry of Housing and Urban-Rural Development of the People’s Republic of China: Beijing, China, 2019.
- Xu, F.; Liu, Q. Building energy consumption optimization method based on convolutional neural network and BIM. Alex. Eng. J. 2023, 77, 407–417. [Google Scholar] [CrossRef]
- Guo, K.; Li, Q.; Zhang, L.; Wu, X. BIM-based green building evaluation and optimization: A case study. J. Clean. Prod. 2021, 320, 128824. [Google Scholar] [CrossRef]
- Zhang, S.; Hu, L.; Zhu, M.; Shi, J. Economic Benefit Evaluation of the Assembled Green Roof: Taking the Teaching Building of Hefei Experimental School as an Example. J. Shenyang Jianzhu Univ. (Soc. Sci.) 2022, 24, 592–597. [Google Scholar]
- Gao, B.; Li, X.; Shen, L. Design Optimization of Green Building Schematic Plan Based on Comprehensive Performance Analysis. Constr. Econ. 2014, 378, 90–94. [Google Scholar]
- Xu, X.; Xu, P.; Zhu, J.; Liu, J.; Xue, Q. How to minimize the embodied environmental impact of green building envelope? An automatic optimization method. Environ. Impact Assess. Rev. 2022, 93, 106732. [Google Scholar] [CrossRef]
- Ding, Z.; Chen, W.; Hu, T.; Xu, X. Evolutionary double attention-based long short-term memory model for building energy prediction: Case study of a green building. Appl. Energy 2021, 288, 116660. [Google Scholar] [CrossRef]
- Bansal, N.K.; Hauser, G.; Minke, G. Passive Building Design. A Handbook of Natural Climatic Control; Elsevier Science BV: Amsterdam, The Netherlands, 1994; pp. 35–46. [Google Scholar]
- Li, F.; Zhang, J.; Liu, Y.; Wang, Y.; Qian, Y. Research on Green Building Technology Application Strategies—An Example of Three-Star Green High-Rise Office Building in Hot Summer and Cold Winter Region. Green Build. 2023, 15, 44–46. [Google Scholar]
- GB20376-2012; Design Code for Heating Ventilation and Air Conditioning of Civil Buildings. China Academy of Building Research: Beijing, China, 2012.
- Eddy, K.; Bradley, N. Green BIM; China Architecture & Building Press: Beijing, China, 2016; pp. 150–189. [Google Scholar]
- Fu, X.; Shen, S.G.; Yin, J. Study on Green Low Carbon Building Design Based on Photovoltaic Power Generation Technology. Appl. Mech. Mater. 2012, 193, 239–242. [Google Scholar] [CrossRef]

Disclaimer/Publisher’s Note: The statements, opinions and data contained in all publications are solely those of the individual author(s) and contributor(s) and not of MDPI and/or the editor(s). MDPI and/or the editor(s) disclaim responsibility for any injury to people or property resulting from any ideas, methods, instructions or products referred to in the content. |
© 2024 by the authors. Licensee MDPI, Basel, Switzerland. This article is an open access article distributed under the terms and conditions of the Creative Commons Attribution (CC BY) license (https://creativecommons.org/licenses/by/4.0/).