Abstract
In this research, the optimization of energy consumption of zero-energy buildings using PCMs in the two study cities of Vancouver and Dubai and its energy supply with a multi-generation geothermal system is discussed. PCMs used in the walls and roofs of designed buildings are of two types, namely PCM (solid) and PCM (liquid). By optimizing the energy consumption of the residential complex in two study cities, it is finally possible to choose the best mode in optimal conditions to reduce energy consumption in the residential complex, reduce the costs of the residential complex, and reduce the environmental pollution. The results showed that the amount of electricity consumption, heating, and cooling of the residential complex during the year in the city of Vancouver is 8493.55, 7899.1, and 1083.97 kWh, respectively, and in the city of Dubai, the values are 9572.1, 8.99, and 18,845.44 kW, respectively. Also, by optimizing the energy consumption of residential complexes in Vancouver and Dubai, it is possible to reduce CO2 emissions by 2129.7 and 2773.2 kg/year, respectively. The electricity consumption of the residential complex in Dubai is 11.26% and the carbon dioxide emission is 23.20% more. In the end, a multi-generation system is proposed to meet the energy consumption of a six-unit zero-energy residential complex with 120 m2 and two bedrooms in Vancouver, Canada. By setting up the study system in the city of Vancouver, 237,364.6 kWh of electricity, 425,959.4 kWh of heating, and 304,732.8 kWh of electricity can be produced in one year. According to the investigation, the geothermal system can easily provide the energy consumption required by residential buildings.
Keywords:
residential complex; PCM; heating; cooling; electricity; multi-generation system; geothermal 1. Introduction
Zero-energy building or zero-output building refers to buildings that are powered by renewable energy. The production of carbon pollutants in them is zero. These buildings are modern. A zero-energy building is a building that emits zero or negative carbon dioxide annually [1].
Zero-energy buildings combine energy efficiency and renewable energy production to consume only as much energy as is produced on-site through renewable sources in a given period [2].
There are many long-term benefits of moving towards energy buildings [3], which include lower environmental impacts, lower operating and maintenance costs, better resilience to power outages and natural disasters, and improved energy security. Reducing building energy consumption in construction can be achieved through various methods, including integrated design, retrofitting energy efficiency, reducing plug-in loads, and energy-saving programs [4,5].
PCMs are materials that can absorb and store large amounts of heat energy. Thermal energy storage in these materials occurs during the phase change process. When these materials change phase from solid to liquid or from liquid to solid, they absorb this heat from the environment or give it back to the environment [6,7].
A phase change material, if used in a building, exchanges large amounts of heat with the environment through successive cycles of melting and freezing as a result of severe changes in air temperature, thus providing a more balanced air temperature for the space inside the building [8]. In several studies that have been conducted in the field of the use of such materials in buildings, very favorable results have been obtained in connection with the reduction in energy consumption for cooling and heating, as well as the ease of providing comfort [9,10,11].
In 2023, Zhan et al. investigated the integration of PCM in buildings in hot climates and investigated building energy and thermal comfort. One of the least-consuming alternatives for building coating applications is the use of PCMs. PCMs addressed simulation tools, classification, integration technologies, and impact variables, along with the advantages and disadvantages of widespread adoption in building envelopes that were highlighted hierarchically [12].
In 2024, Sharma et al. investigated a new retrofitting approach based on PCMs in air conditioning systems to reduce building energy demand. Improving air quality and reducing airborne diseases can be effectively achieved by introducing fresh air into buildings. However, this challenges the building’s energy consumption [13].
In 2023, Assareh et al. investigated the strengthening of solar thermal collector systems for hot water production with PCMs. Energy storage and supply in solar thermal collector systems are highly dependent on PCMs. According to the analysis of how the inlet parameters affect the objective functions, the PCM mass is minimized, and the inlet water mass flow rate increases under ideal conditions. The amount of energy stored in the PCM increases when the system parameters are kept constant while the pipe diameter increases [14].
In 2022, Abbasi et al. worked on transient energy storage by PCMs. A mathematical model for the simulation of encapsulated PCMs as a thermal energy storage reservoir for a building’s loads was investigated. Using a tank of PCM for daily energy storage reduces cooling and heating loads by 22.5% and 18%, respectively [14].
In 2022, Salameh et al. investigated an energy-based absorption chiller–absorption cooling system for the climatic conditions of the United Arab Emirates. The optimal angle of inclination, the area of the vacuum tube collector, the volume of the hot water storage tank, and the solar fraction were evaluated. The optimized system reduced costs by 56.8% compared to a conventional vapor compression system [15].
In 2020, Ebrahimi-Moghadam et al. investigated the performance of light shelves to save energy in residential buildings in Mashhad, Iran. The results showed that the use of optimal light shelves causes an average annual improvement of 18%, 11%, and 7% in the heating, cooling, and electricity demand of the building [16].
Behzadi and Arabkoohsar in 2020, studied a new system for building an energy supply using solar energy. In the designed system, a solar panel was used with a heat storage tank, and the lack of battery used in this system led to a reduction in system costs. The results showed that the system, in addition to providing the building with annual domestic hot water, sold 402 m3 of hot water to the regional heating network with local extreme temperatures [17].
In 2021, Arabkoohsar et al. studied a new system for building an energy supply based on the use of renewable energy to create zero-energy buildings in Denmark. The comparison results showed that the proposed solution is the most cost-effective scenario, with the lowest initial cost of about USD 457,000 and a payback period of 6.6 years [18].
In 2022, Ang et al. investigated hybrid renewable energy systems with urban building energy modeling, for example in coastal communities. While different combinations of renewable energy systems can be viable, optimization for cost, energy consumption, and power shortage can be increasingly challenging [19].
In 2023, Lu et al. addressed renewable energy sources and multi-energy hybrid systems for urban buildings in the Nordic climate. This research examined the feasibility of multi-energy systems for a northern Finnish climate city to address the issues of replacing fossil energy with renewable energy sources to achieve zero carbon emissions. The results show that the system can flexibly meet the energy demand for heterogeneous buildings [20].
In 2022, Zhong et al. discussed the feasibility of producing clean electricity from a geothermal system. In this study, based on available geological data, an advanced geothermal system with a vertical well was investigated to investigate the potential for clean electricity production. The feasibility of power generation at depths between 2900 m and 3300 m was reasonably predicted over 30 years at a production rate of 40 kg/s [21].
In 2022, Jiansheng et al. investigated the power generation performance of advanced geothermal systems with horizontal wells. A combination of underground heat extraction and underground electricity generation systems was proposed in this study. The power generation system consisted of ORC, and R245fa was used as the working fluid [22].
In 2023, Dezhdar et al. used a renewable solar and wind system to provide fresh water, electricity, heating, and cooling for a residential apartment. A photovoltaic panel was used to absorb solar energy and a wind turbine was used to absorb wind energy [23].
In 2024, Nizovtsev and Sterlyagov investigated the effect of PCM on the thermal inertia of walls in lightweight buildings. The results showed that the use of PCMs in buildings helps to better save energy [24].
In 2024, Dezhdar et al. investigated a renewable system for providing energy to the residential complex. The energy supply of 100 residential units during the year was investigated using thermal photovoltaic panel units, wind turbines, steam turbines, fuel cells, and batteries. The energy produced by the system during the year was 425,690.937 kWh/year [25].
In this study, the optimization of energy consumption and its energy supply with a geothermal system of multi-energy production consisting of a modified organic Rankine cycle and a compression chiller has been discussed. This research aims to reduce the emission of environmental pollutants and, at the same time, increase the performance of the system. The energy and environmental crisis is one of the issues that have been considered as one of the most important concerns of mankind today. One of the solutions to deal with this crisis is to turn to clean and renewable energies, among which geothermal energy plays an important role. For this reason, multi-production systems based on geothermal energy are a suitable idea for providing energy consumption. One of the new solutions to reduce the energy consumption of residential buildings is the use of PCM. Using PCM in buildings has a significant effect on improving thermal comfort conditions and reducing energy consumption.
2. Research Innovation
In this research, a residential complex including two three-story buildings with one unit per floor and a total of six units in Vancouver and Dubai is simulated in two hot and cold areas to investigate different building materials and the use of PCMs. By using BEopt, energy consumption optimization of residential buildings in two cities in America and Asia with hot and cold climates is carried out. Finally, the best materials for use in buildings are introduced, and then the system designed to calculate the required load of residential buildings is analyzed. The city of Dubai is a very hot city, and the city of Vancouver is a very cold city; thus, the amount of energy consumption in these two cities is different, and phase change materials can be effective in reducing energy consumption. Nowadays, due to the increasing pollution of fossil fuels and the increase in the price of energy, the importance of saving energy in residential complexes has become clear to everyone.
The innovations are as follows:
- Choosing the two cities of Dubai and Vancouver as hot and cold climates.
- Simulation of a six-unit residential complex with an area of 120 m2 in Dubai and Vancouver.
- Using BEopt to analyze residential complexes in the two study cities.
- Analysis of the use of PCM in residential complexes in the two study cities.
- Analysis of the use of different materials in the construction of residential complexes in the two study cities.
- Calculation of electricity load and heating and cooling requirements of residential complexes in the two study cities.
- Optimizing residential complexes in Dubai and Vancouver to save energy and reduce pollution.
- Use of a multi-generation system to supply the required load of the residential complex.
- Investigating the environmental performance of the geothermal system of multiple energy production.
3. Residential Complex Design
In this research, a six-unit residential complex was designed in Dubai and Vancouver and BEopt was used to calculate the electricity, heating, and cooling requirements of the entire residential complex throughout the year. The view of the residential complex is presented in Figure 1. Also, the residential complex information is introduced in Table 1. Two buildings with three floors and one unit per floor were designed; the number of units in the complex is six units, each unit has four people living in it, and the area of each unit is 120 m2. For this reason, the total substructure of the building is 720 m2 with a total of 24 residents, which aims to optimize the energy consumption of buildings by using PCMs in the walls and roofs of buildings. Finally, a renewable multi-energy production system has been presented to provide the three needs of electricity, cooling, and heating of the residential complex.
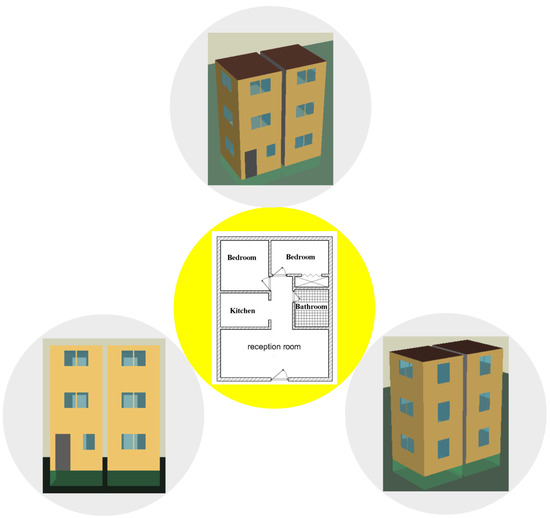
Figure 1.
View of the residential complex.

Table 1.
General information on the residential complex.
BEopt software 3.0.1 is a building energy optimization tool used to evaluate buildings. In BEopt, simulation is performed based on a building’s dimensions, architecture, number of residents, location, and facilities.
In Table 1, the information on the residential complex is presented. This information includes the size of the residential complex, the number of units, and the number of residents.
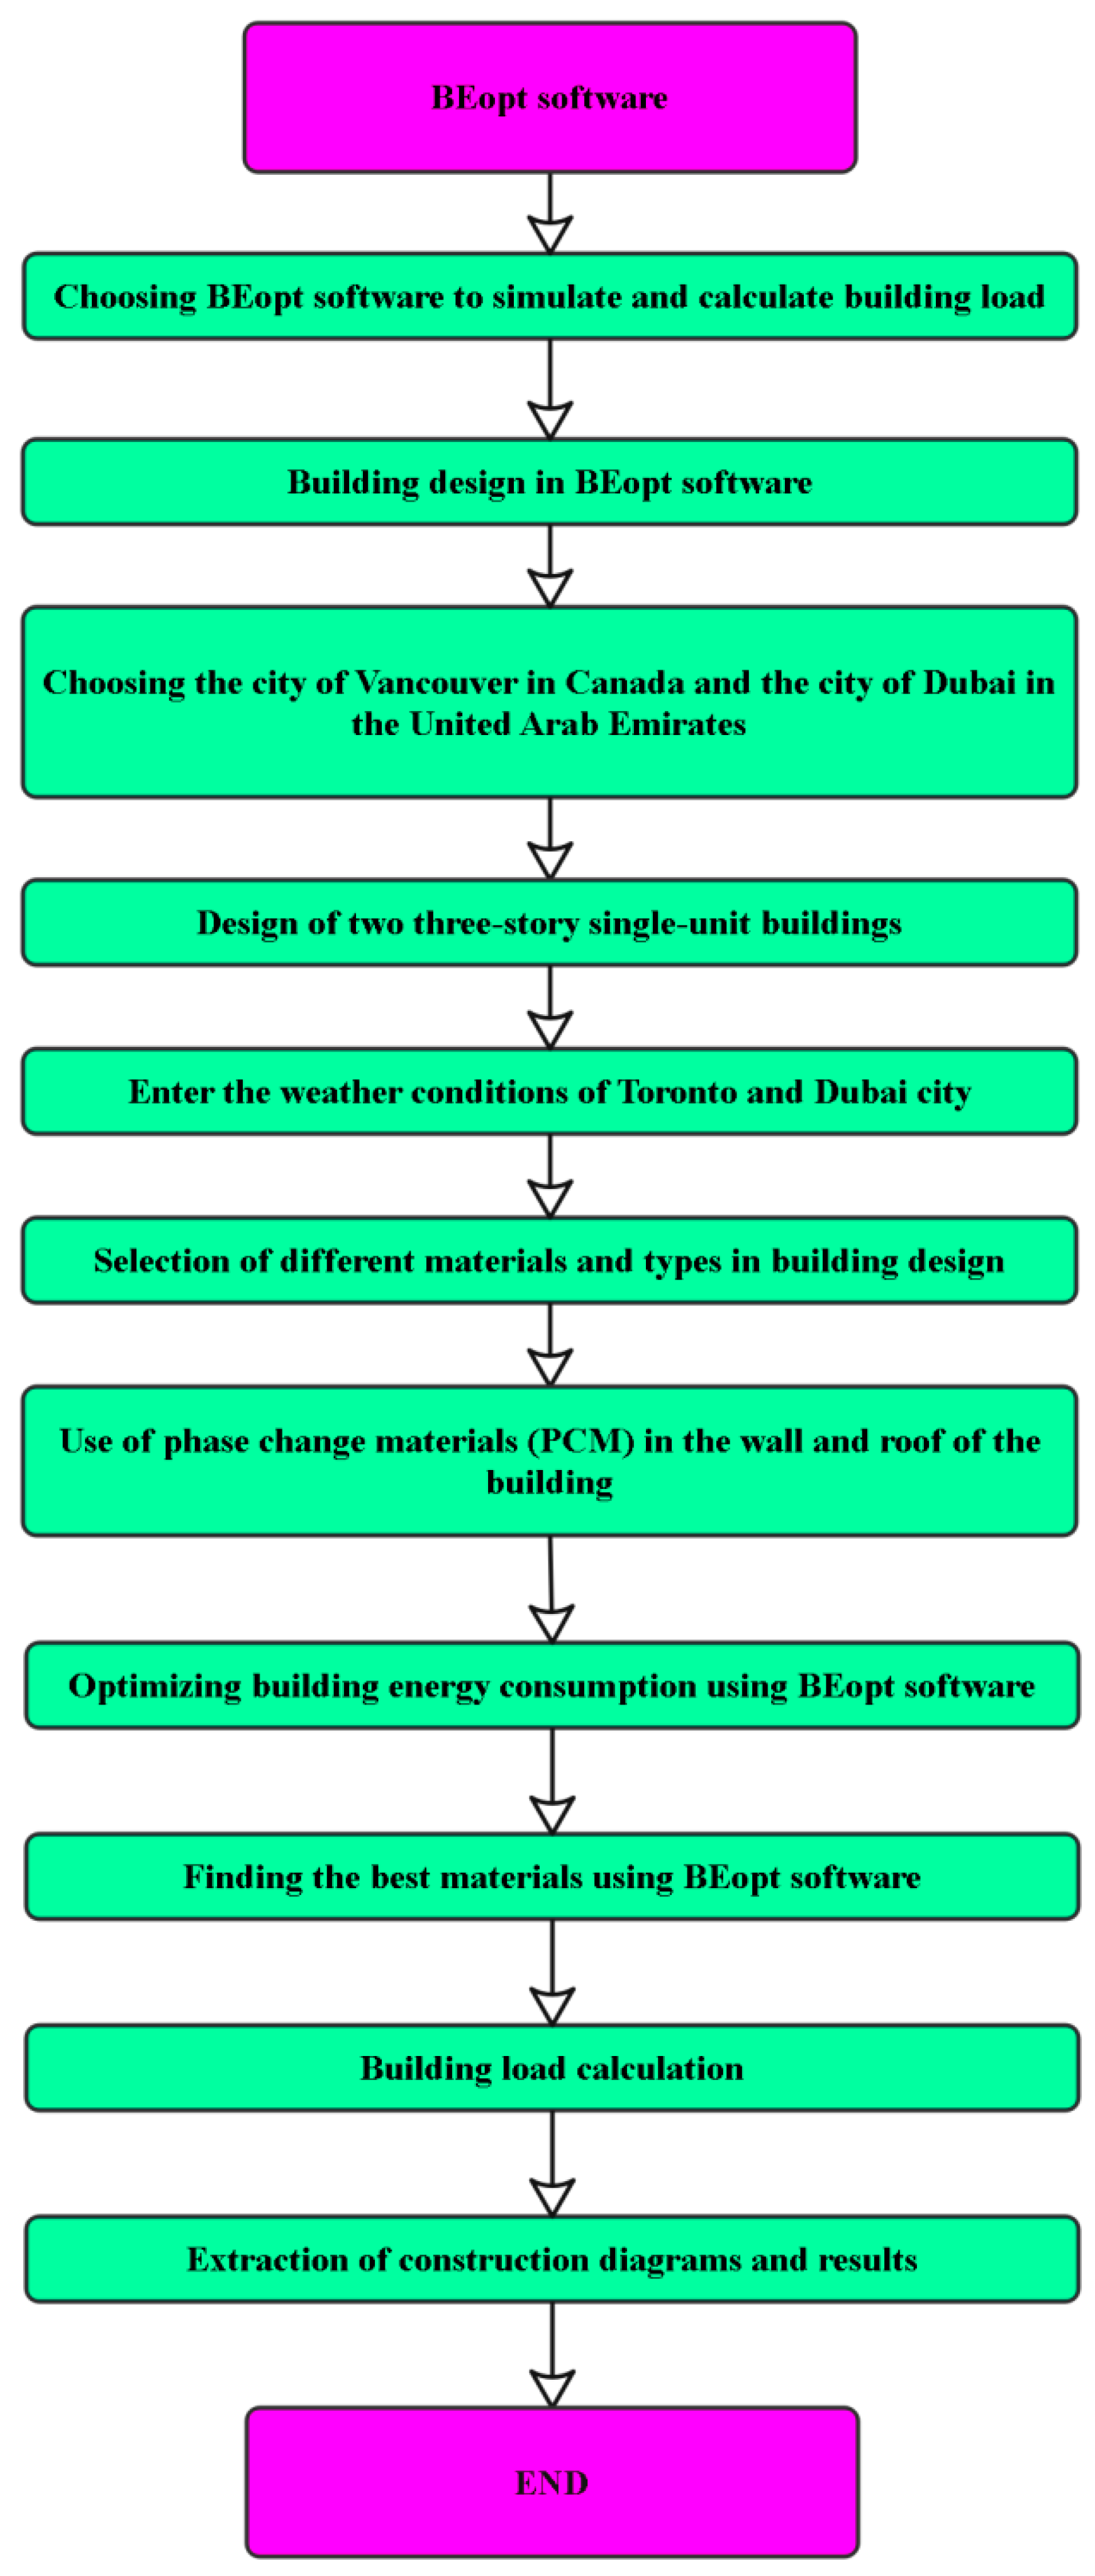
Figure 2 shows the residential complex analysis flowchart for the design and load analysis of the residential complex, including the required electricity load, the heating load of the residential complex, and the cooling load of the residential complex.
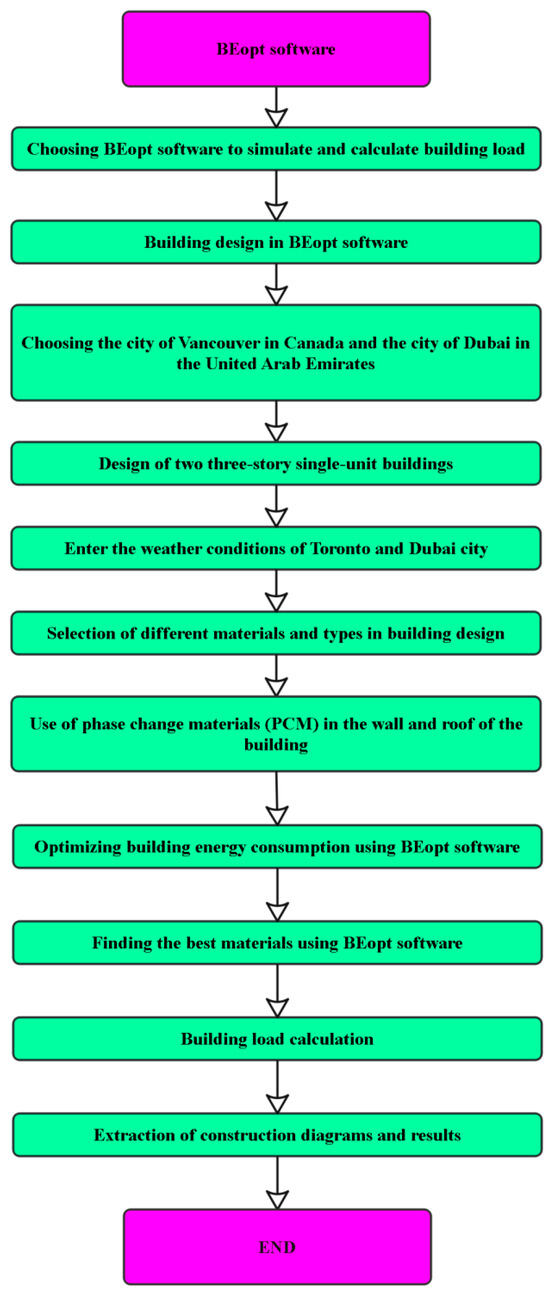
Figure 2.
Residential complex analysis flowchart.
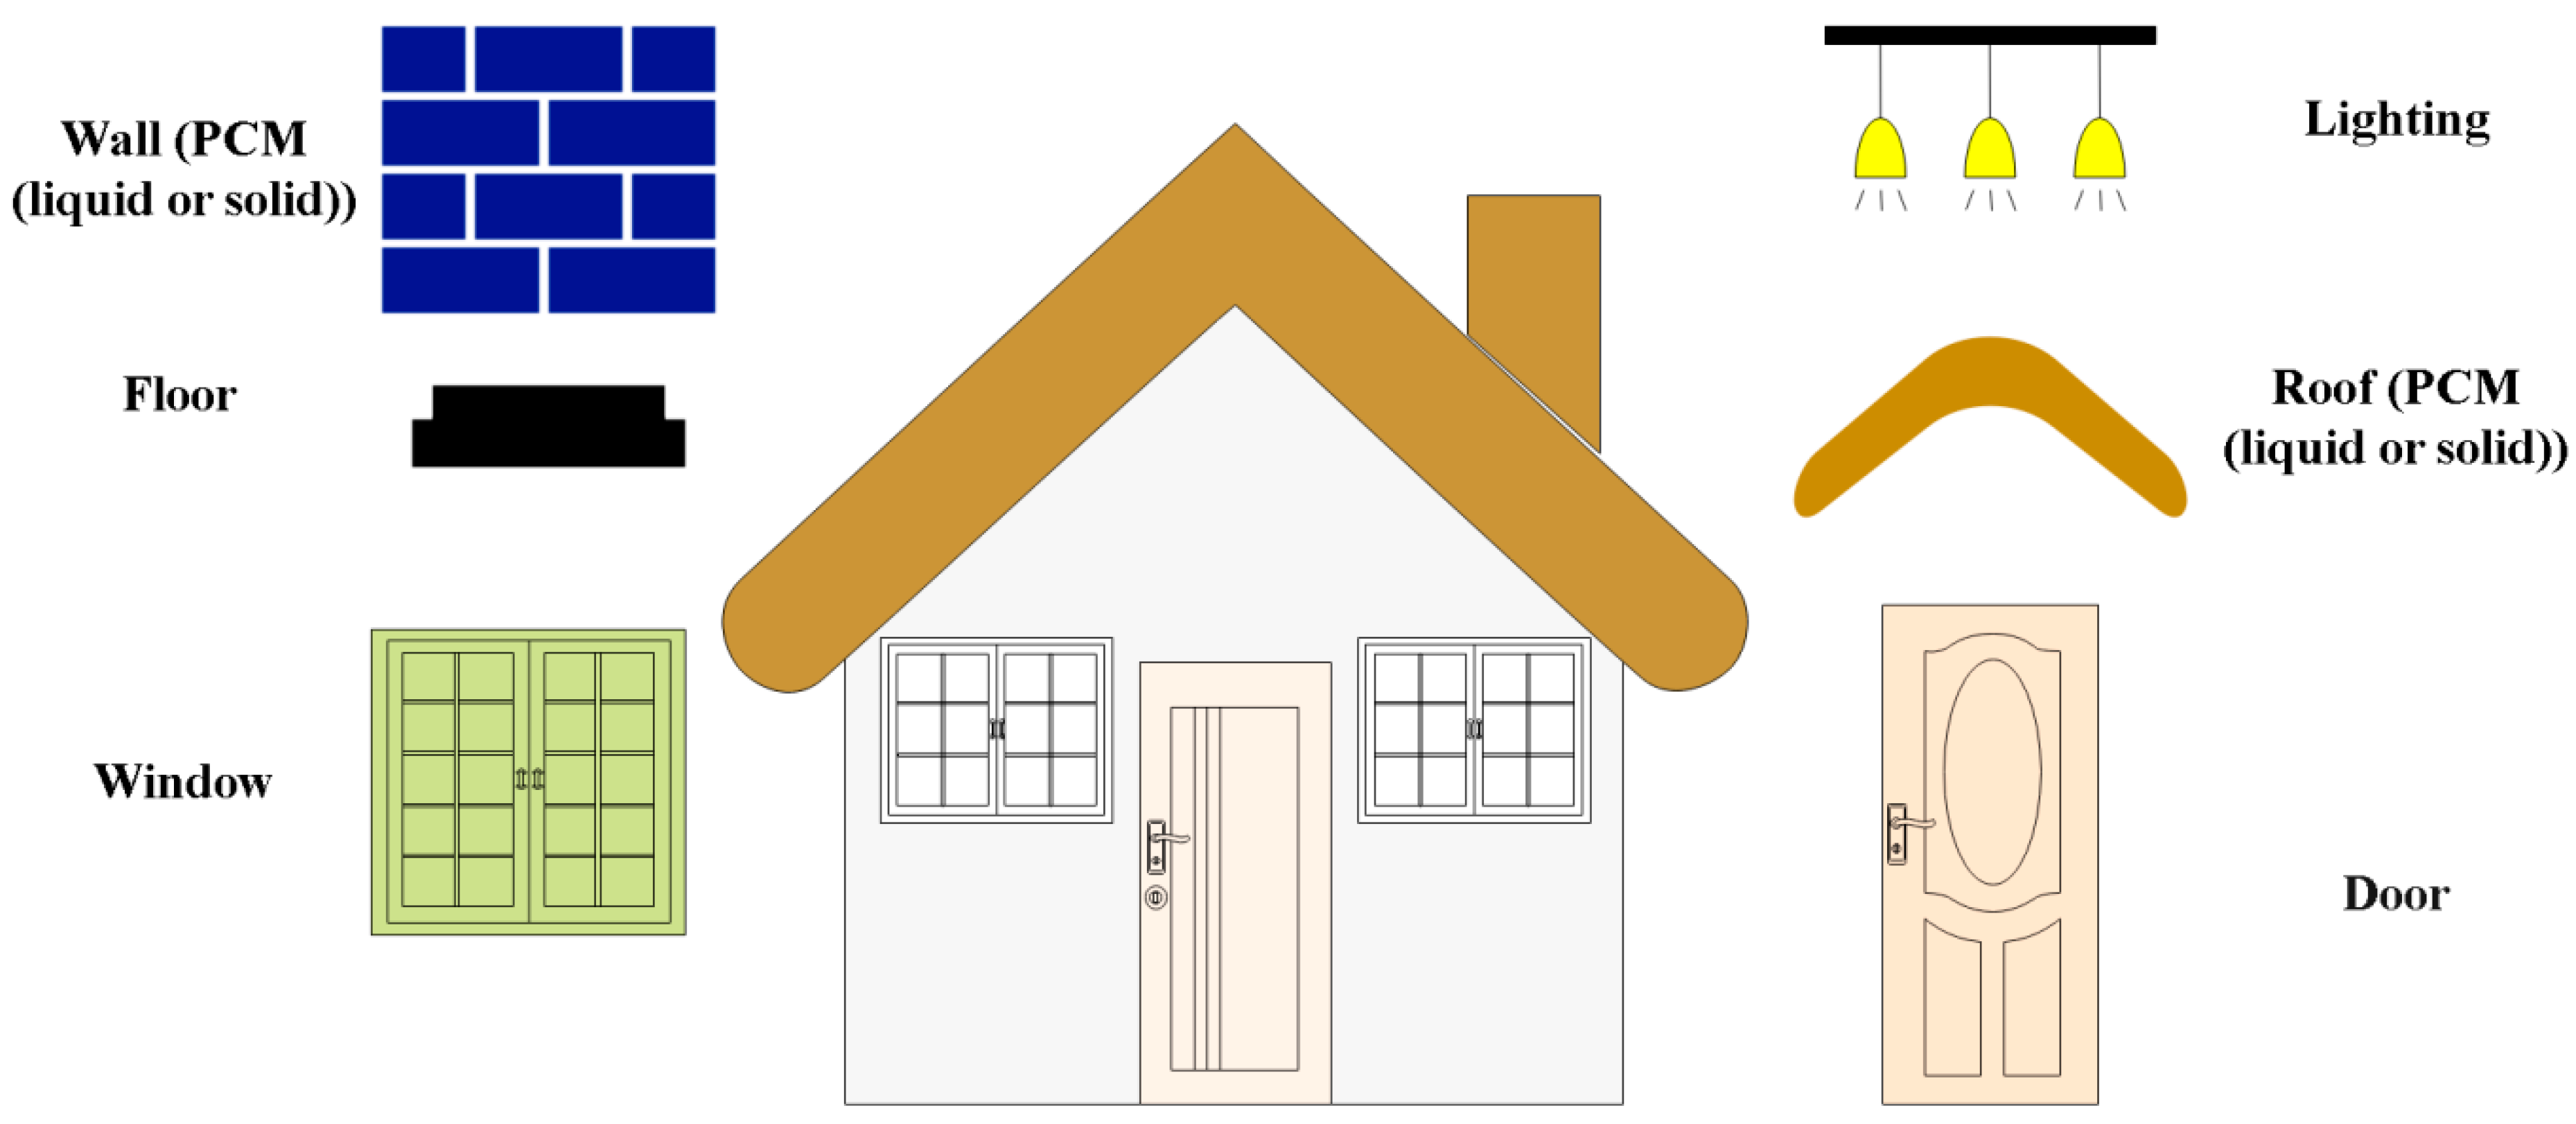
For the design of the residential complex in two study cities, different sizes and types of buildings have been chosen for the construction of buildings, with the purpose of introducing the best structure. It should be noted that the direction of the residential complex is towards the north. Figure 3 presents the main materials examined in this research.

Figure 3.
The structure of the residential complex for the selection of materials.
In Table 2, Table 3, Table 4 and Table 5, the materials investigated to optimize the energy consumption of the residential complex to save consumption have been discussed.
Table 2.
Window materials of the residential complex.
Table 3.
Wall materials of the residential complex.
Table 4.
Roof and floor materials of the residential complex.
Table 5.
Other characteristics of the residential complex.
Table 6 shows the introduction of PCMs. The main use of PCMs in buildings is to encapsulate the building, and in other words, the use of these materials in the walls and roof prevents the increase in the temperature of the environment inside the building and keeps the temperature balanced. The efficiency of PCM walls depends on several factors, which include the melting temperature of PCMs, the range of wall temperature changes, heat capacity per unit of wall surface, how PCMs are applied inside the wall, and weather conditions.
Table 6.
Properties of PCMs [26,27].
In this research, various features and materials for the construction and design of the proposed six-unit residential complex have been investigated, and the aim is to introduce the best features and materials to be used in the construction of the residential complex to save energy. The solution information for the residential complex is presented in Table 7.
Table 7.
Residential complex solution information.
Dubai is one of the emerging cities in the world that is expanding. Dubai is one of the most important commercial cities in the world and is one of the most modern cities in Asia and the world. The population of Dubai in 2023 was estimated at 3.6 million people.
Vancouver is an important coastal and port city in Canada, with an estimated population of 3 million people, which makes it the third largest city in Canada. Vancouver has always been chosen as one of the top five cities in the world in terms of quality and livability, making it one of the best cities in the world to live in.
In the following study, the changes in climate parameters and environmental conditions of the two cities of Dubai and Vancouver have been investigated. It should be noted that the environmental parameters throughout the year are the main factors of energy consumption in buildings.
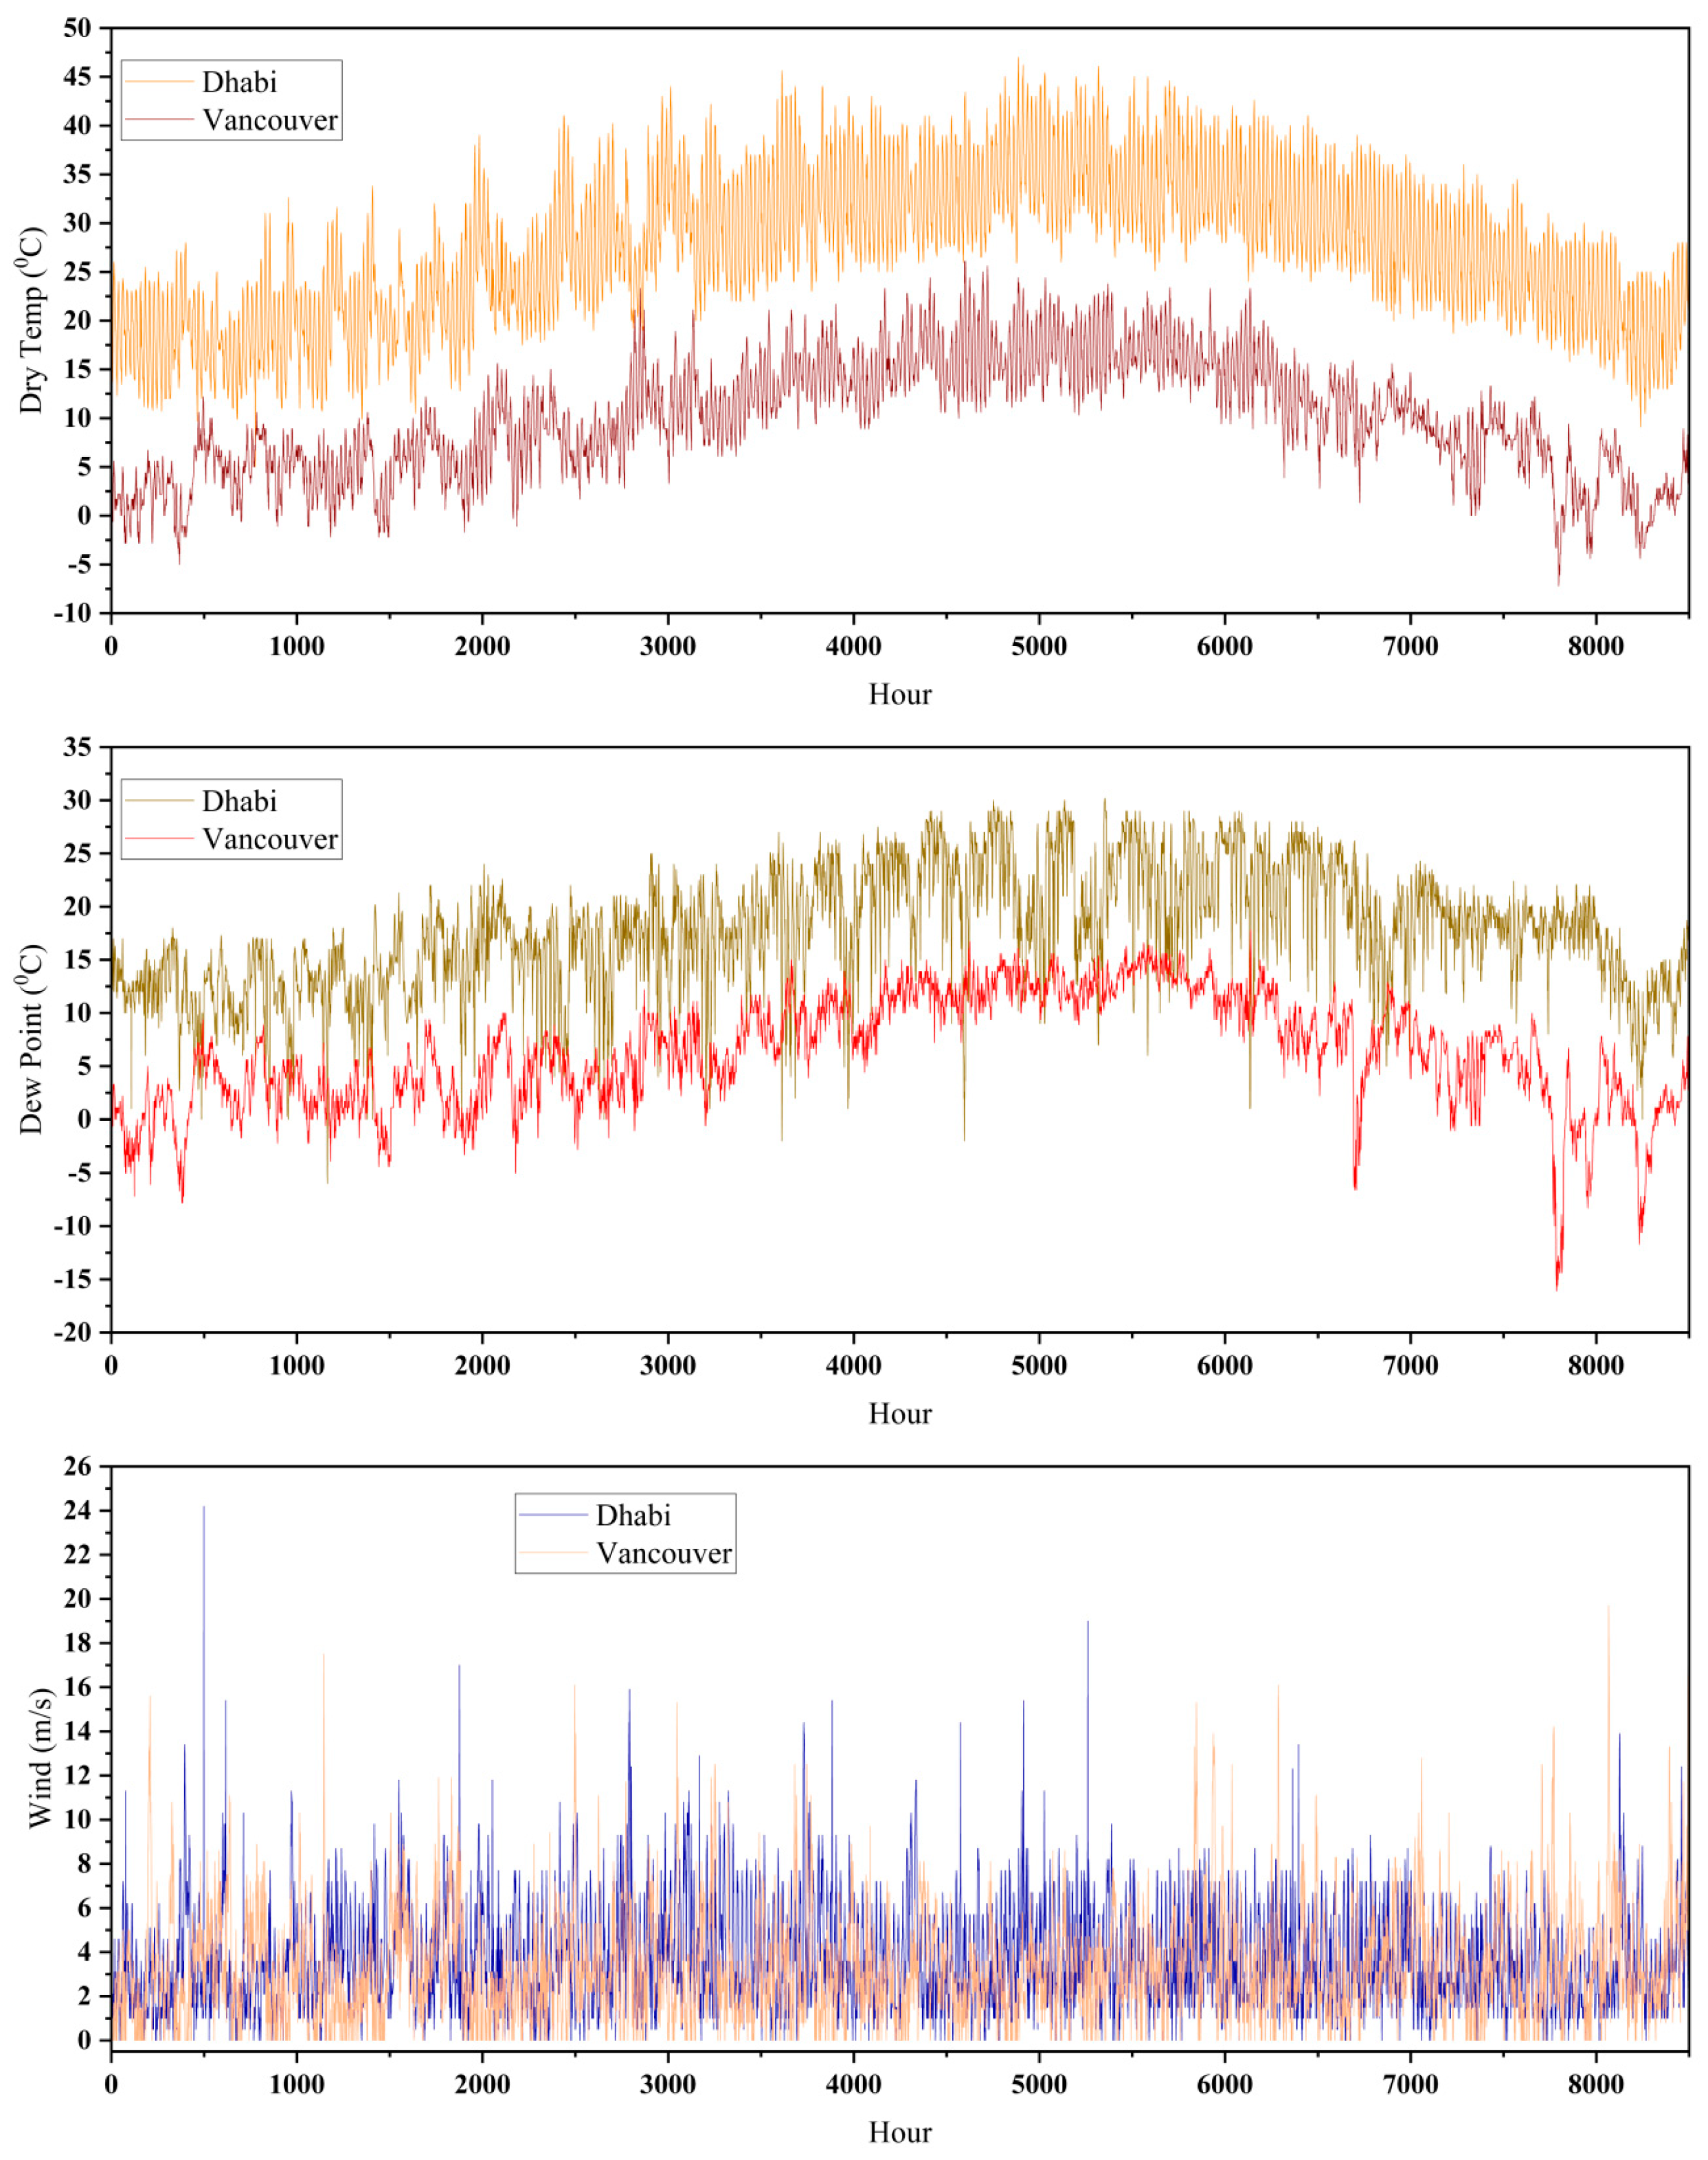
In Figure 4, hourly changes in ambient temperature (8760 h) are plotted for the cities of Dubai and Vancouver. The temperature changes in Vancouver are between −10 °C and 25 °C, and in Dubai the temperature is between 0 °C and 50 °C.
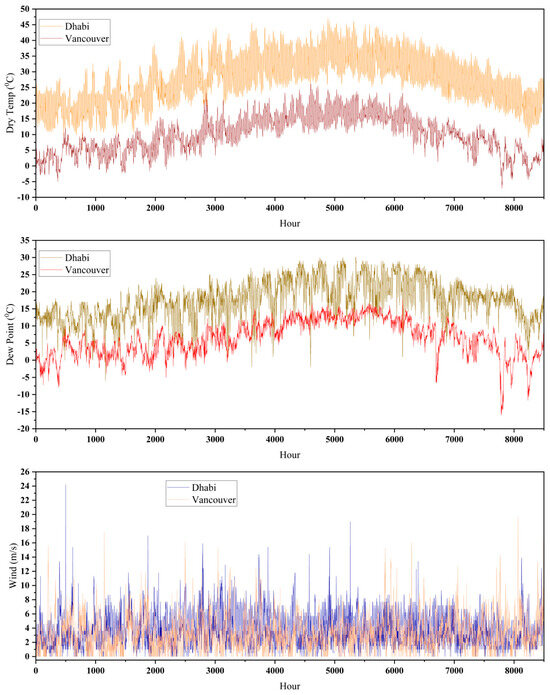
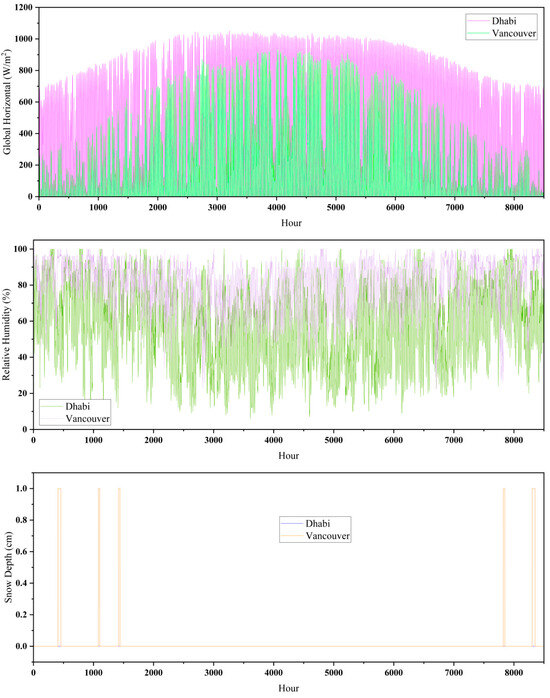
Figure 4.
Hourly changes in Vancouver and Dubai weather parameters during a year.
Also, the hourly changes in the dew point temperature of Vancouver and Dubai have been plotted during the year. The results show that the dew point of Vancouver is between −15 and 15 °C, while in Dubai it is between 0 and 25 °C. There is some moisture in the air, which is in the form of water vapor and a superheated state. When the air temperature drops enough, this water vapor reaches a saturated state and is distilled, which is called the dew point temperature of the air. The dew point has many uses in air conditioning and meteorology. As the results show, the wind speed changes in Dubai are between 0 and 24 m/s, while in Vancouver the changes are between 0 and 18 m/s.
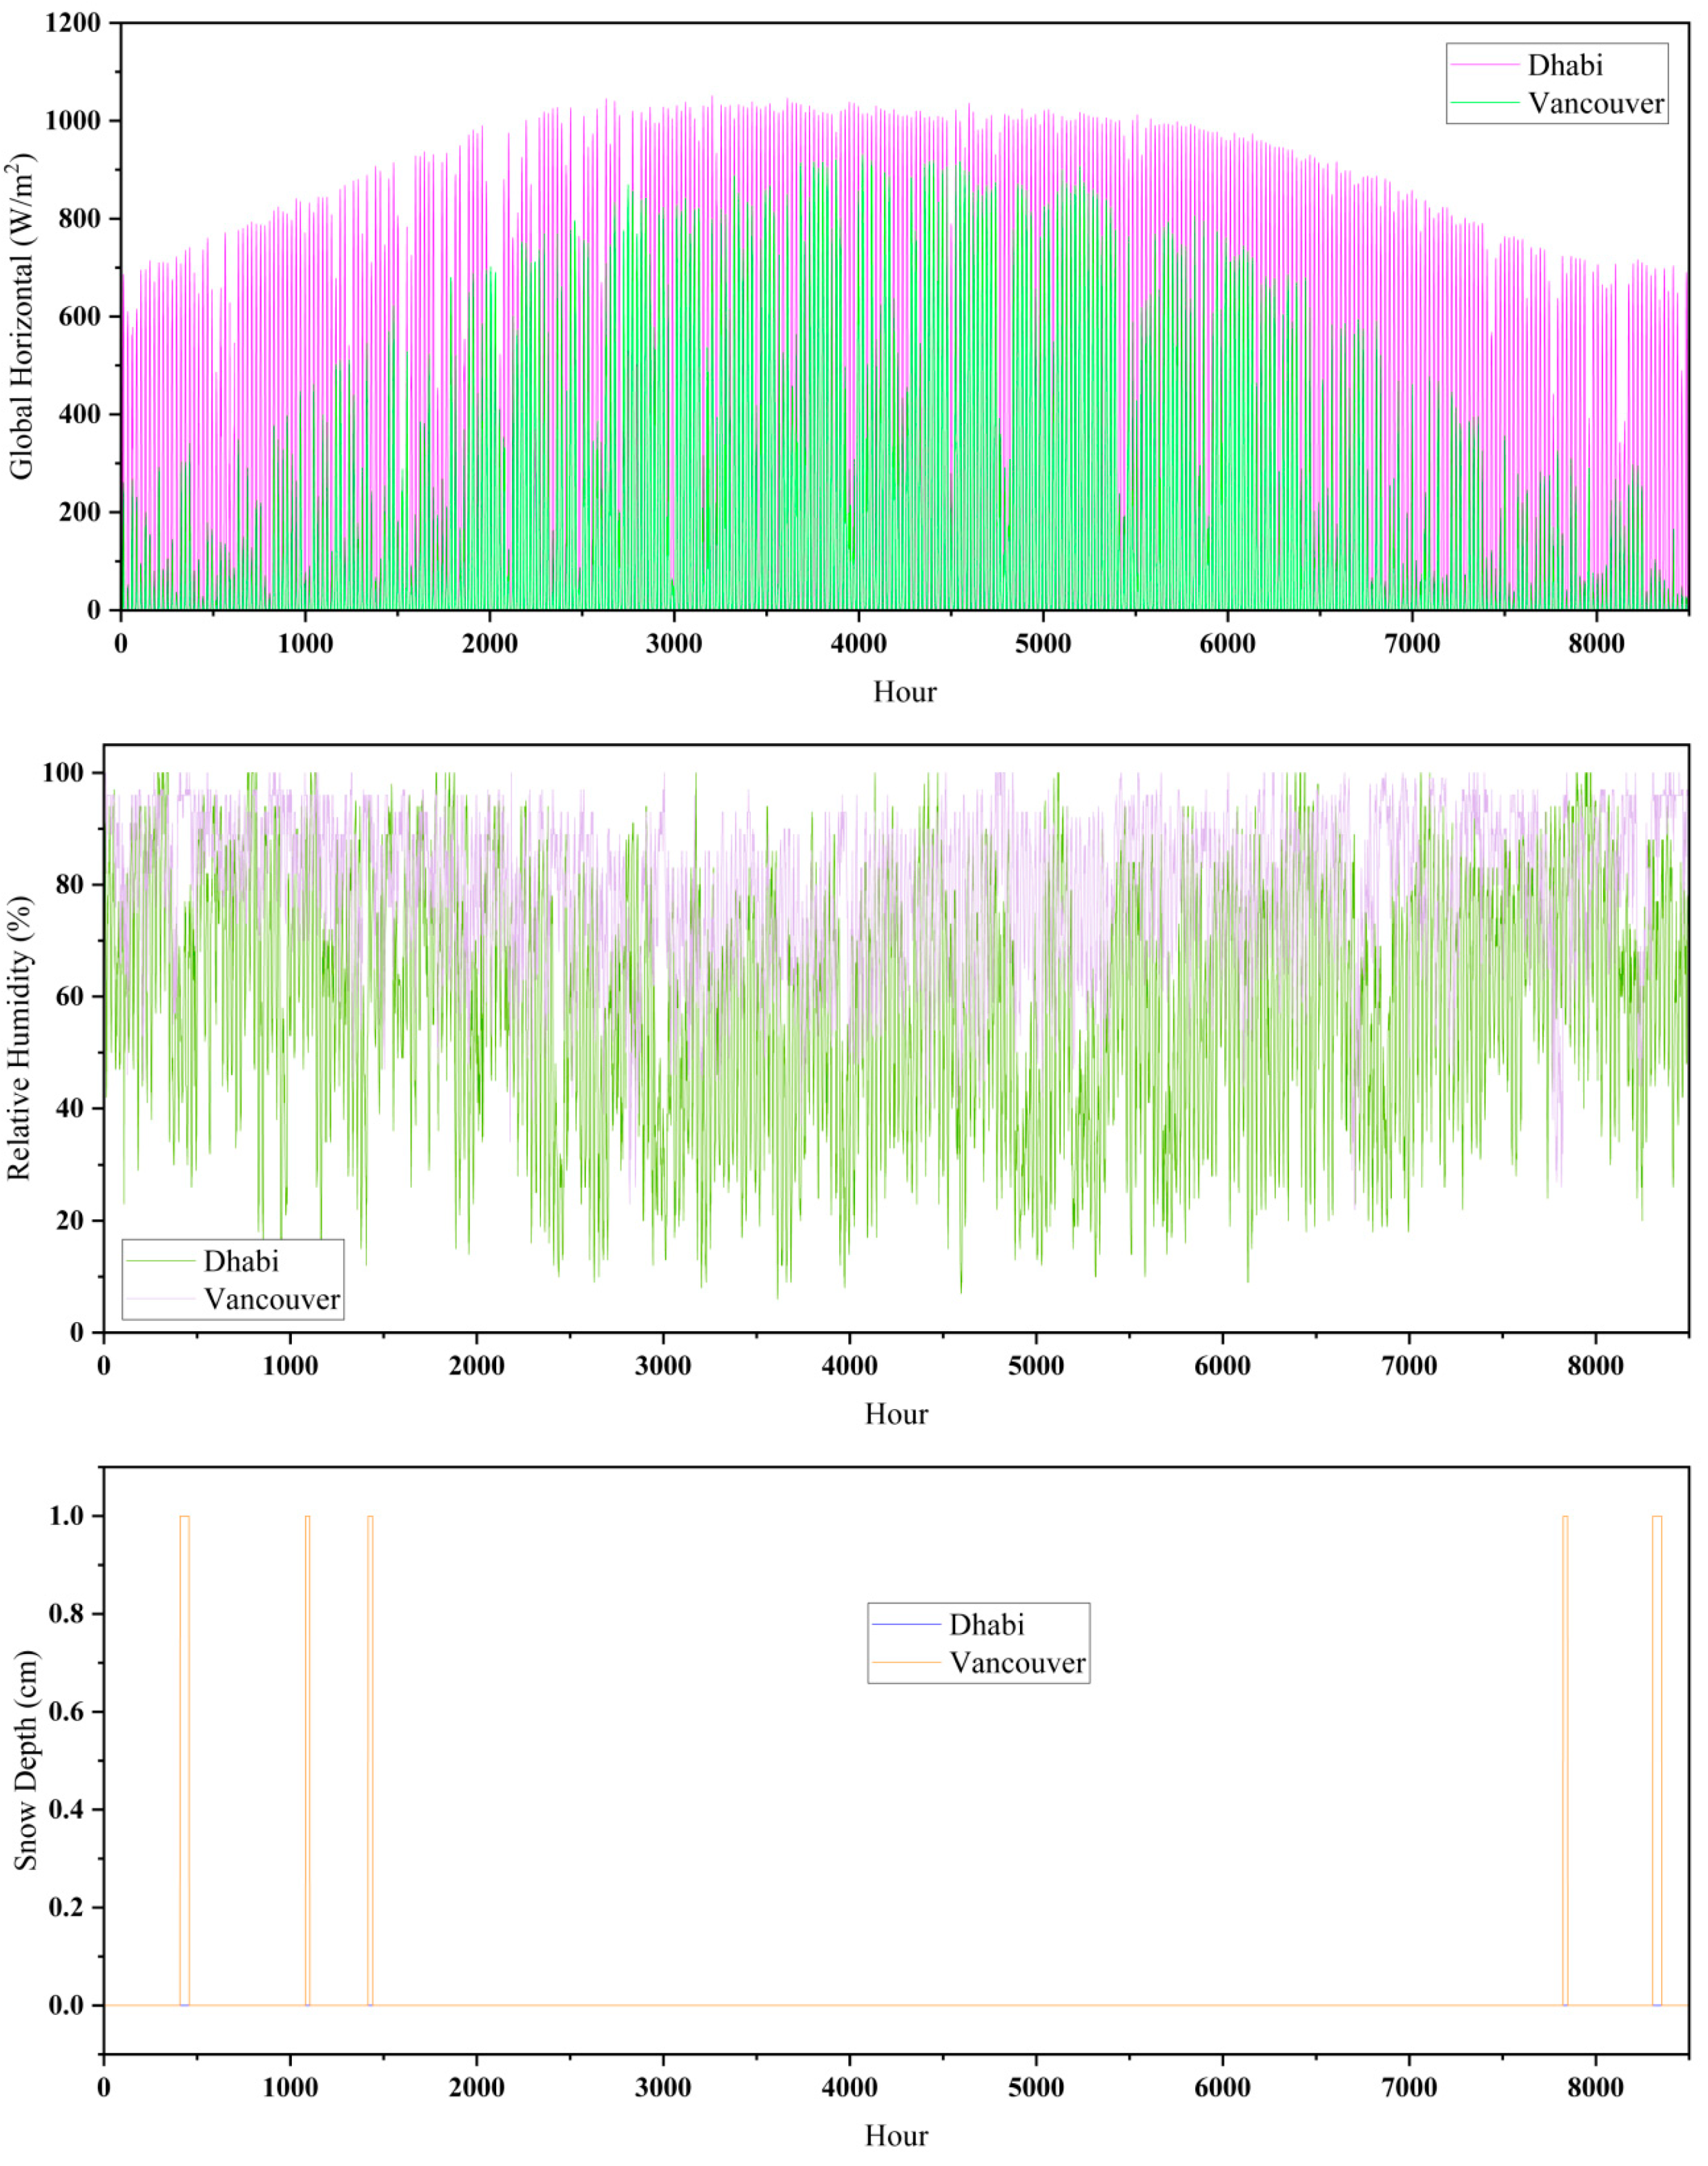
Figure 4 shows the hourly changes in the intensity of solar radiation in Vancouver and Dubai during the year. As the results show, solar radiation has more potential in Dubai. In the city of Dubai, the changes in radiation are between 0 and 1000 W/h, and in the city of Vancouver, the changes in radiation are between 0 and 800 W/h.
The dew point in thermodynamic science is very close to the concept of relative humidity. Relative humidity is determined at a certain temperature. Therefore, at this specific temperature, the ratio of water vapor pressure in a part of the air to the saturation pressure of water vapor in the same part of the air is called relative humidity. In mechanics, relative humidity is usually expressed as a percentage. Figure 4 shows the relative humidity of Vancouver and Dubai throughout the year and hourly. The temperature of the air in the room and even its humidity is very influential in our health and feeling of freshness and vitality. The meaning of humidity is the amount of water vapor in the air. Ideally, the relative humidity of the air in the house should be raised to 45% so that the air in the house becomes completely favorable. A humidity level of less than 30% turns the air in the house into very dry air. Living or working in an environment with humidity below 30% can cause dry skin, eye irritation, and respiratory problems. Therefore, adjusting the temperature and humidity of the work and home environment is extremely important. Also, the amount of snowfall in Vancouver and Dubai has been checked on an hourly basis throughout the year, and the results show that due to the geographical location of Dubai and the hotness of this area, the rainfall in Dubai is zero.
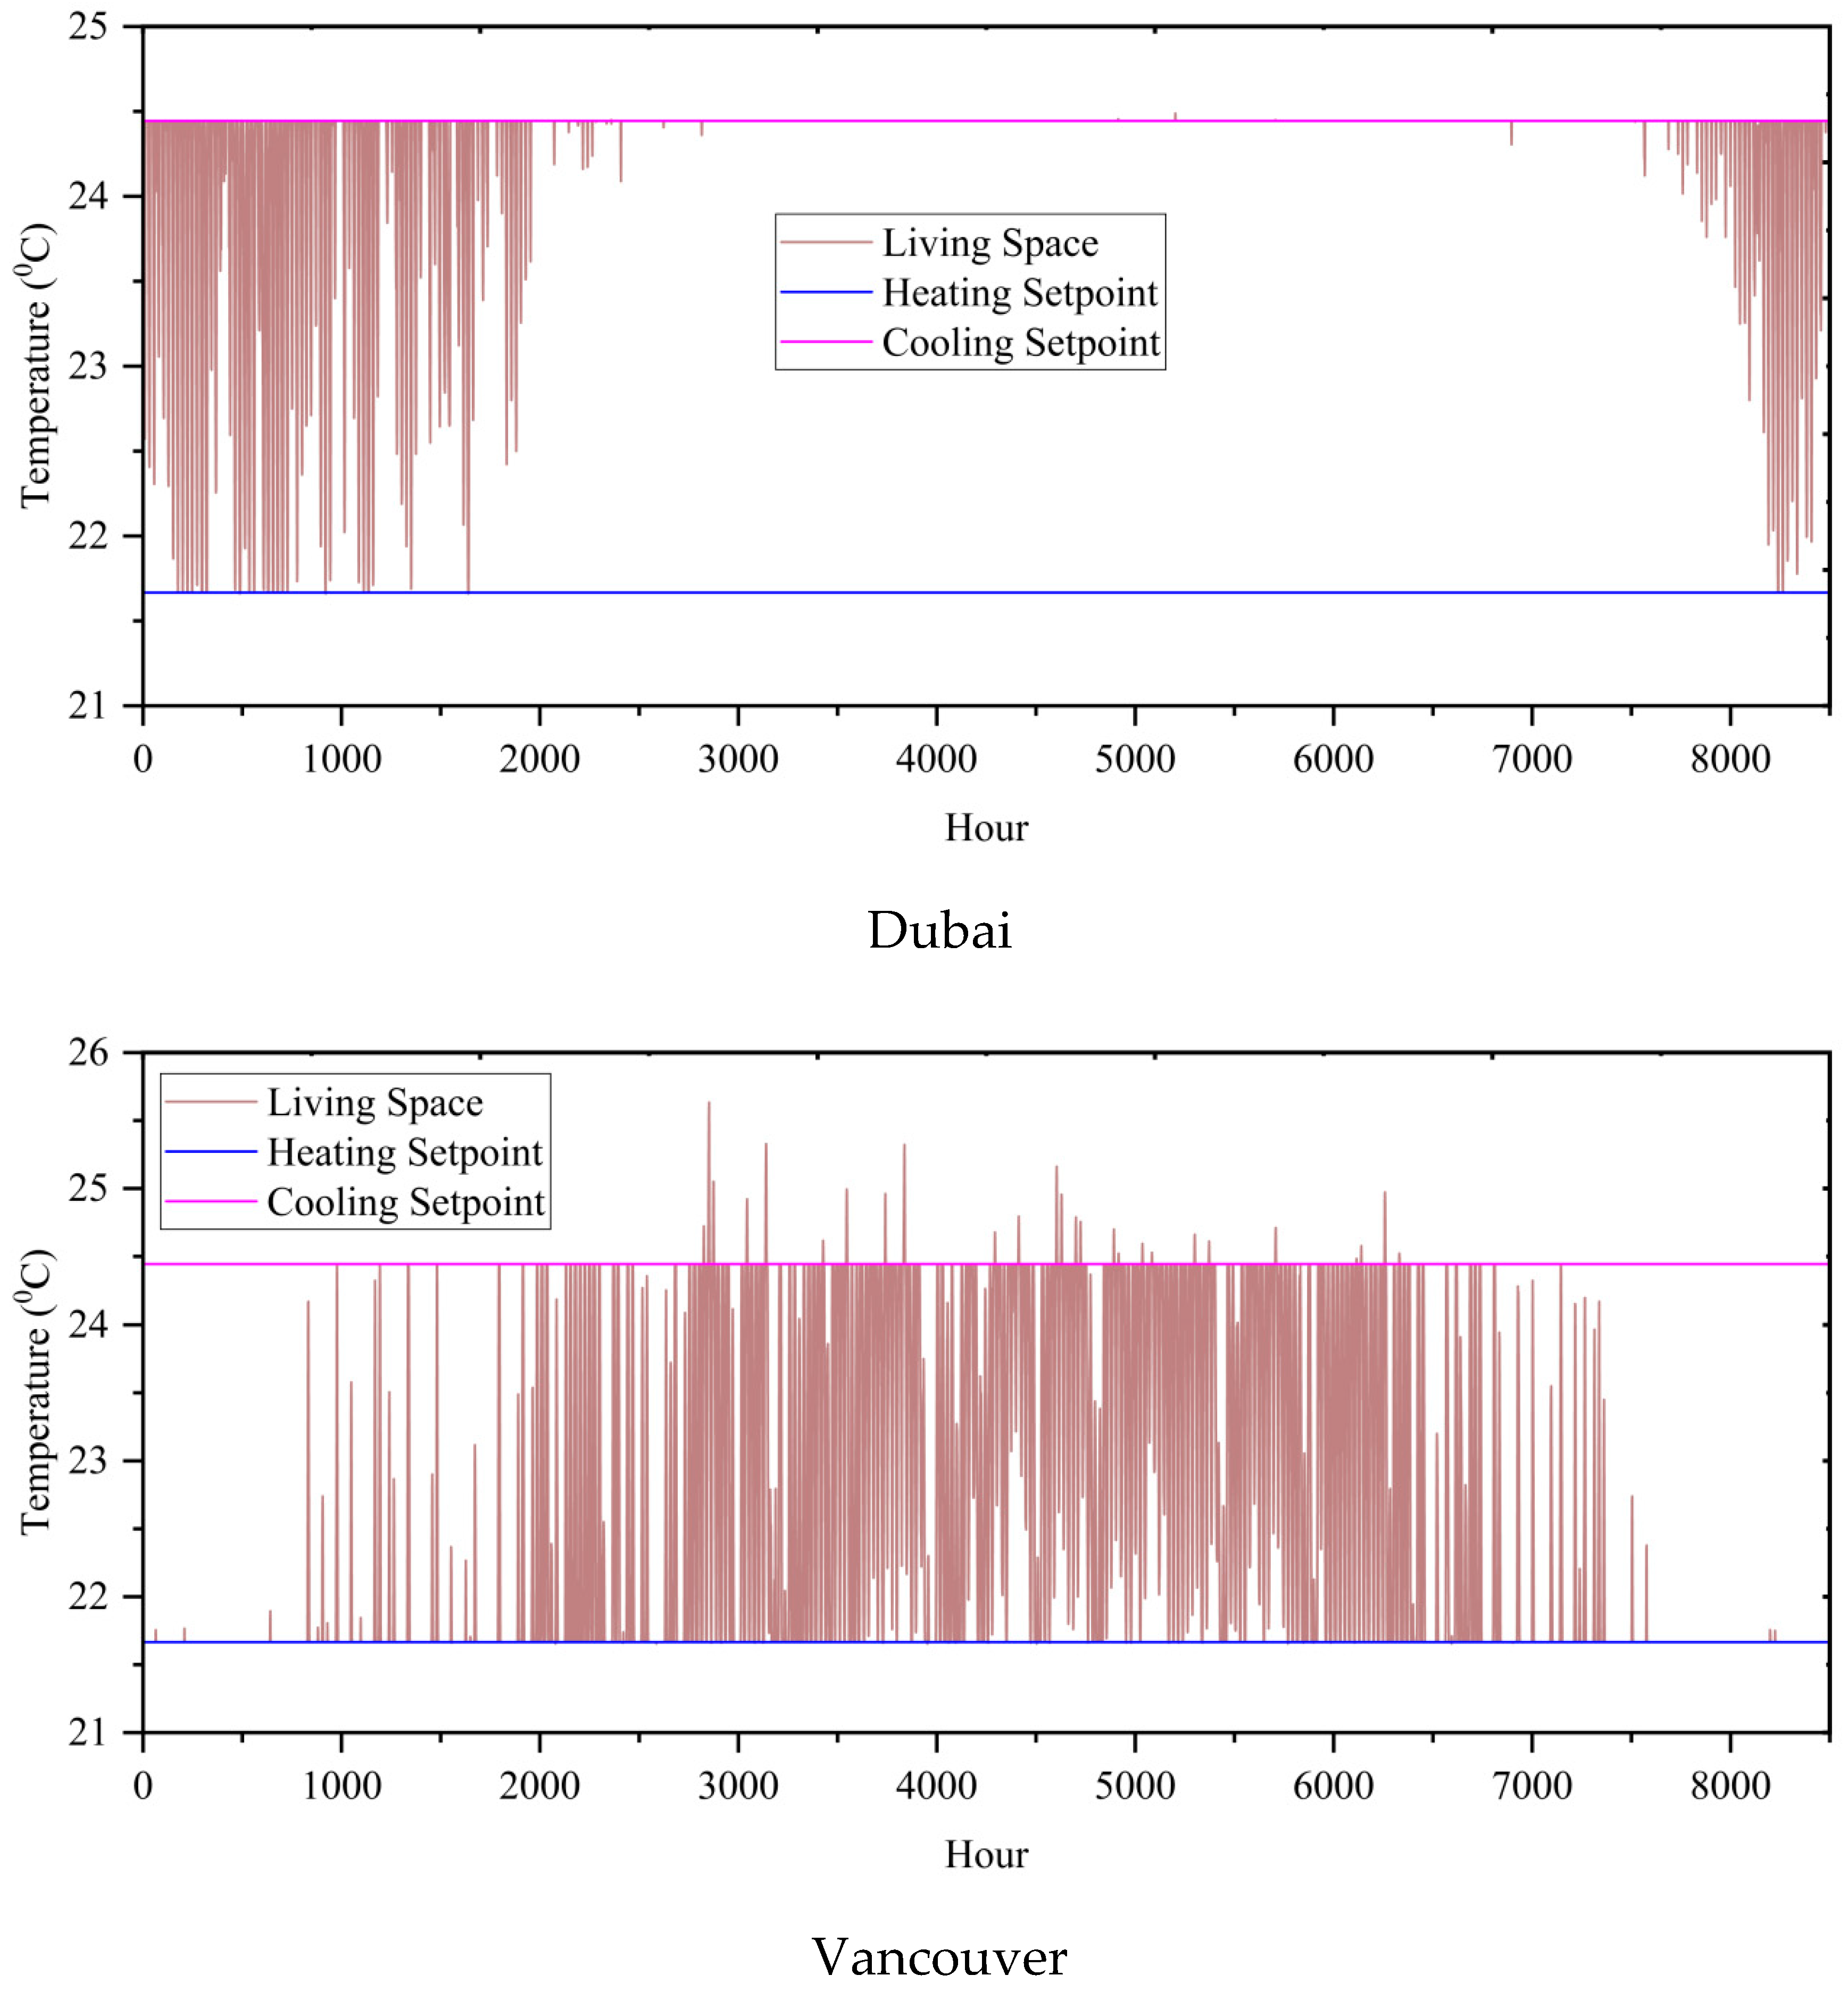
Figure 5 shows the temperature of the living space. The ideal temperature of the house should be between 70 and 78 °F or 21 and 25.5 °C; so, it is important to use central heating and other forms of temperature regulation to keep the temperature healthy and comfortable. Also, Figure 5 shows the temperature of the cooling and heating load adjustment point of the residential complex throughout the year to reach the temperature of the living space. Too hot or too cold a temperature causes physical and mental discomfort and disrupts performance. Working in a very hot environment causes fatigue, headaches, and body numbness. The cold environment also reduces the sensitivity and tingling of the fingers.

Figure 5.
Living space temperature.
Analysis of Residential Complex Results
Among the selected materials and features in Table 2, Table 3, Table 4 and Table 5, using the BEopt optimization method, the best features and materials for the residential complex designed in the two study cities of Dubai and Vancouver are presented in Table 8.
Table 8.
Optimum materials of residential complex in study cities.
To find the best city for setting up a renewable geothermal system, the electricity consumption of two residential complexes in the studied cities of Dubai and Vancouver is investigated and compared. The use of different materials in the construction of the building, as well as the use of PCMs in the roof and walls of two residential complexes, were used to optimize the energy consumption of the residential complex and the cost of building the residential complex and to reduce CO2 emissions. To choose the best city in terms of energy consumption and pollution reduction, considering that the population size of the study cities is similar and they are suitable cities for living, the effect of PCM on the energy consumption of the buildings designed in these cities is investigated and compared.
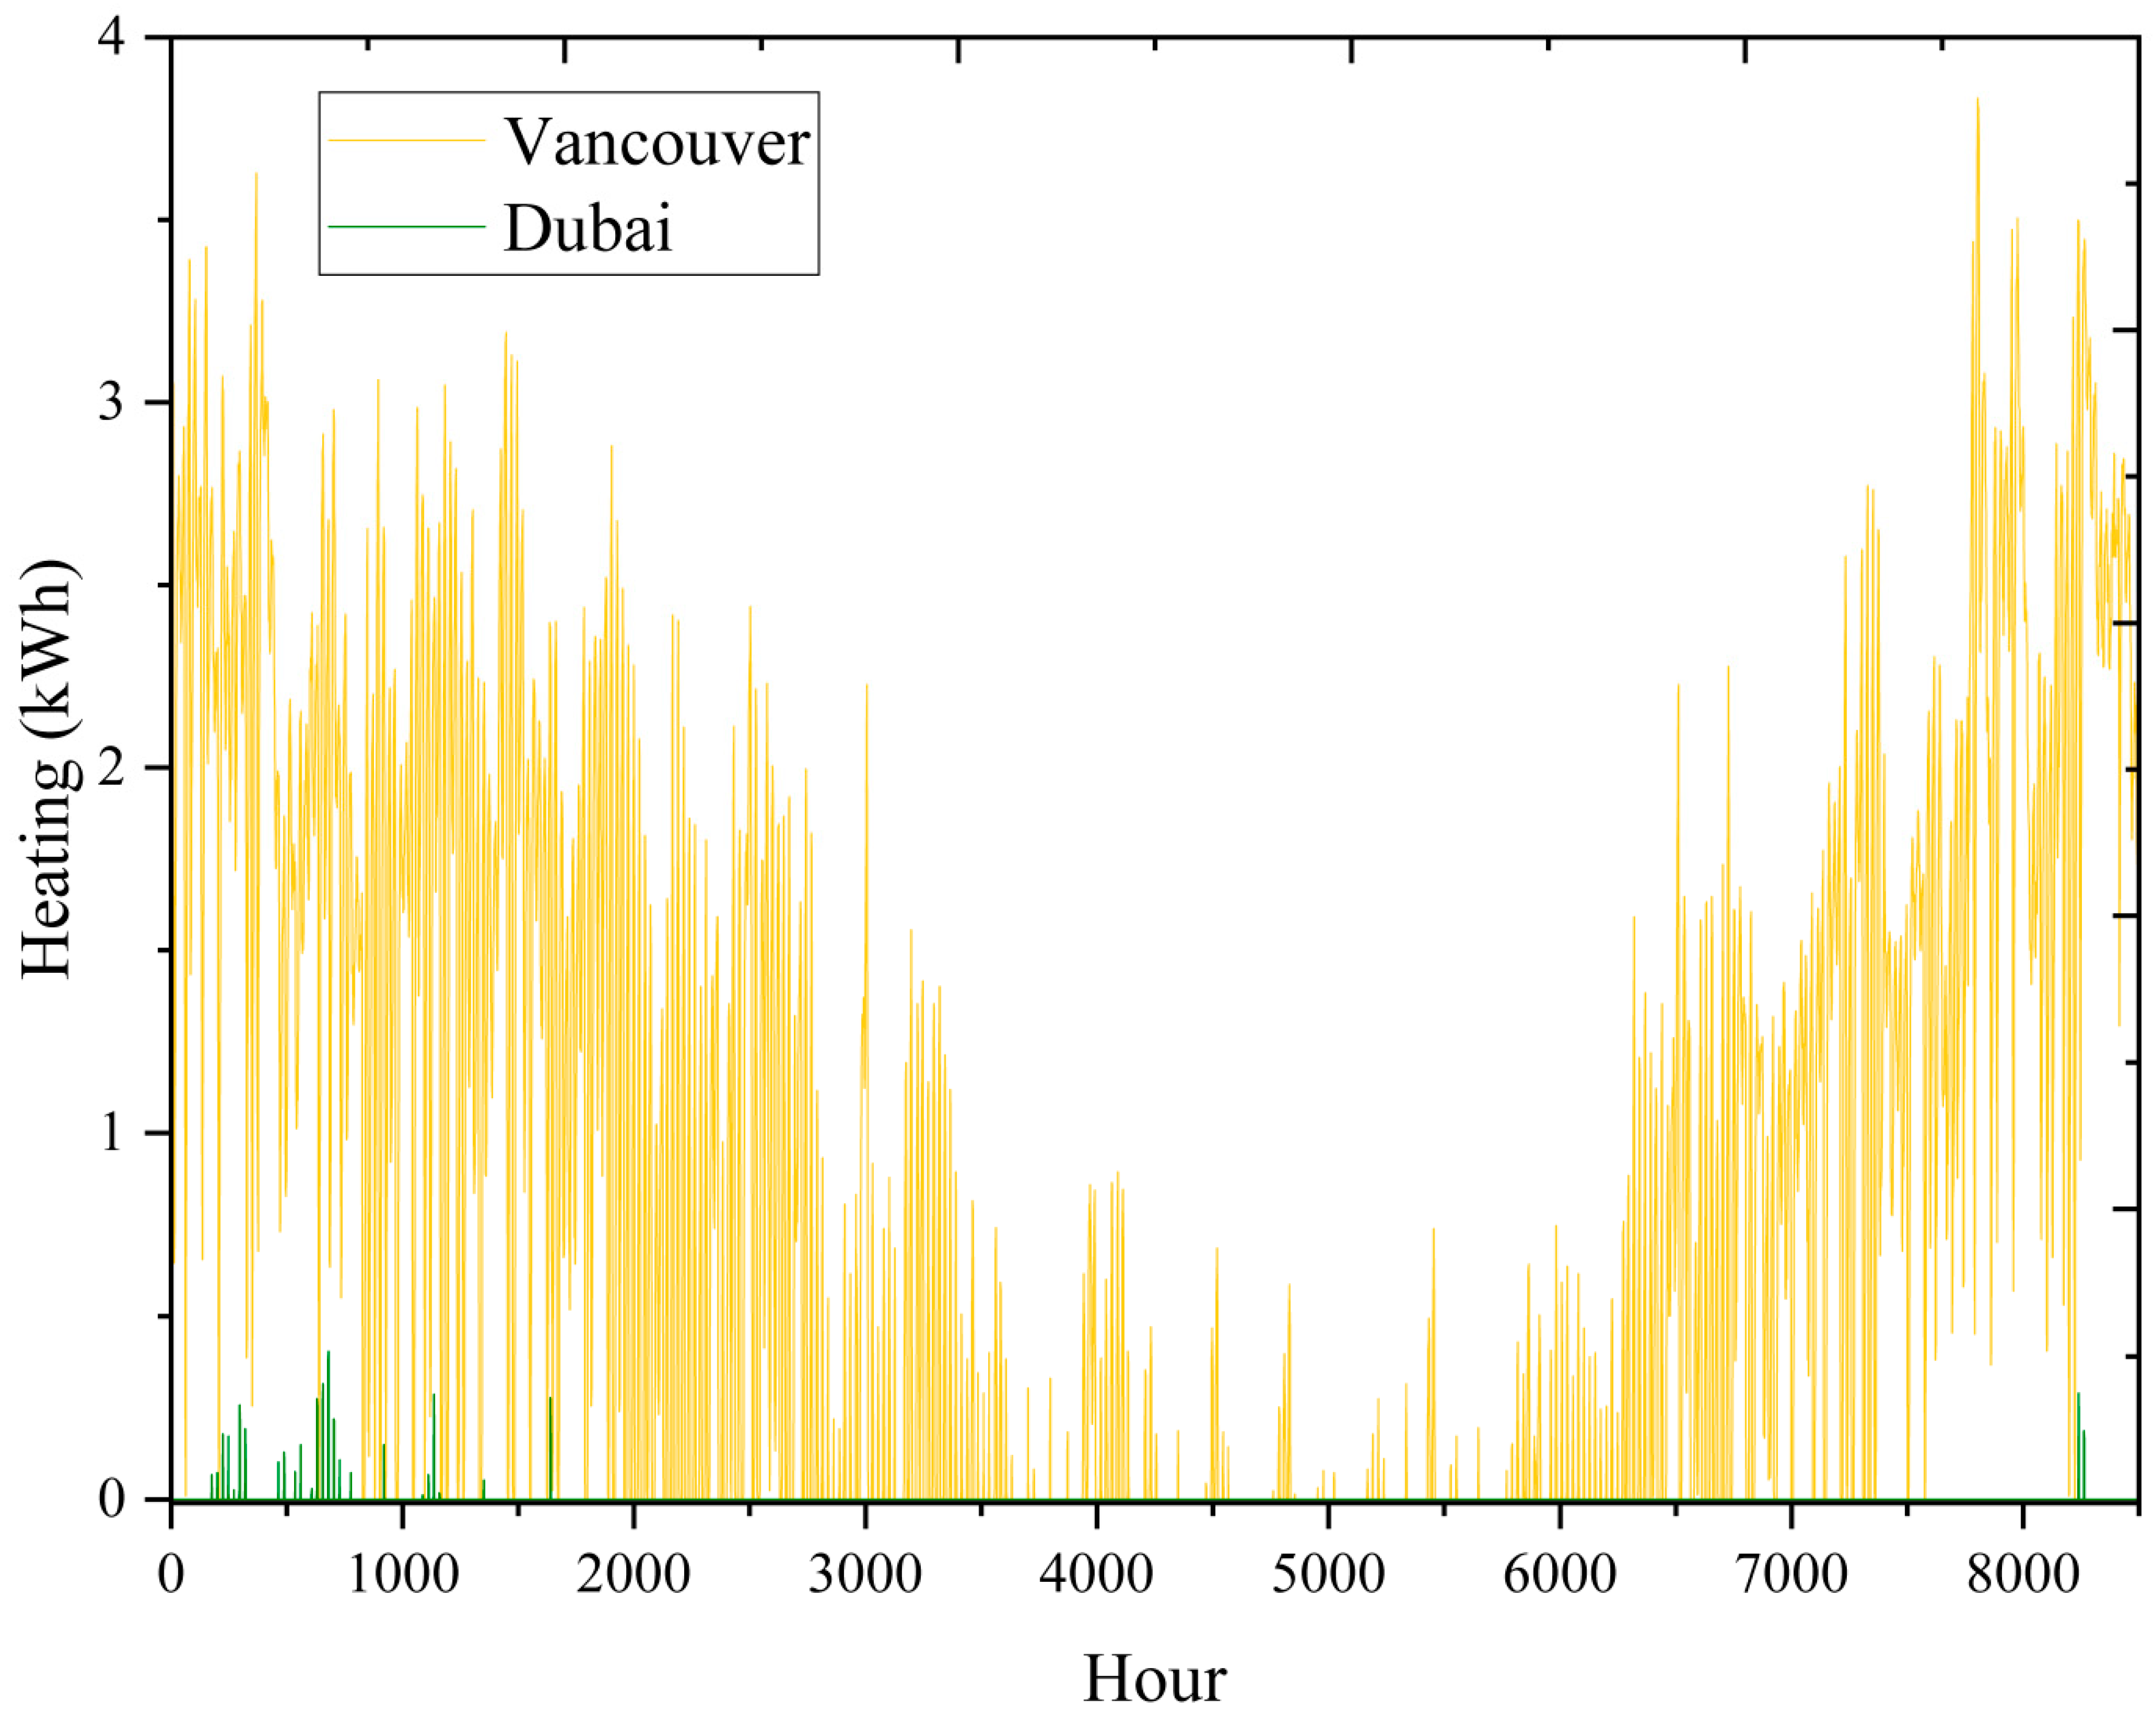
In the following paragraphs, the load analysis of the residential complex and the conditions of the residential complex in the two study cities will be discussed. In Figure 6, the results of the amount of heating load consumed by the residential complex are presented hourly for two study cities. As the results show, in the city of Vancouver, the amount of heating load required by the residential complex is higher than the cooling load, and in the city of Dubai, the cooling load is higher due to the hotness of the area. The annual heating consumption of the Vancouver residential complex is between 0 and 4 kWh, and in Dubai it is between 0 and 0.5 kWh.
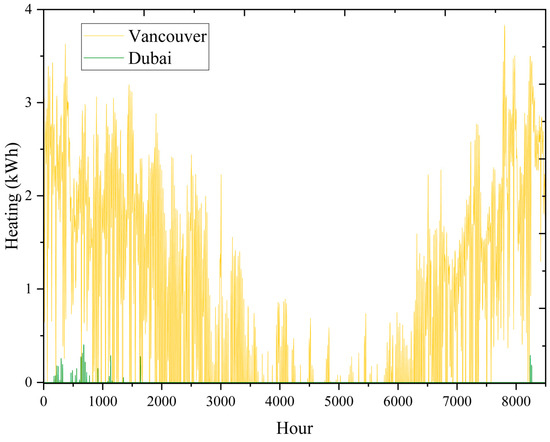
Figure 6.
The amount of heating load consumed.
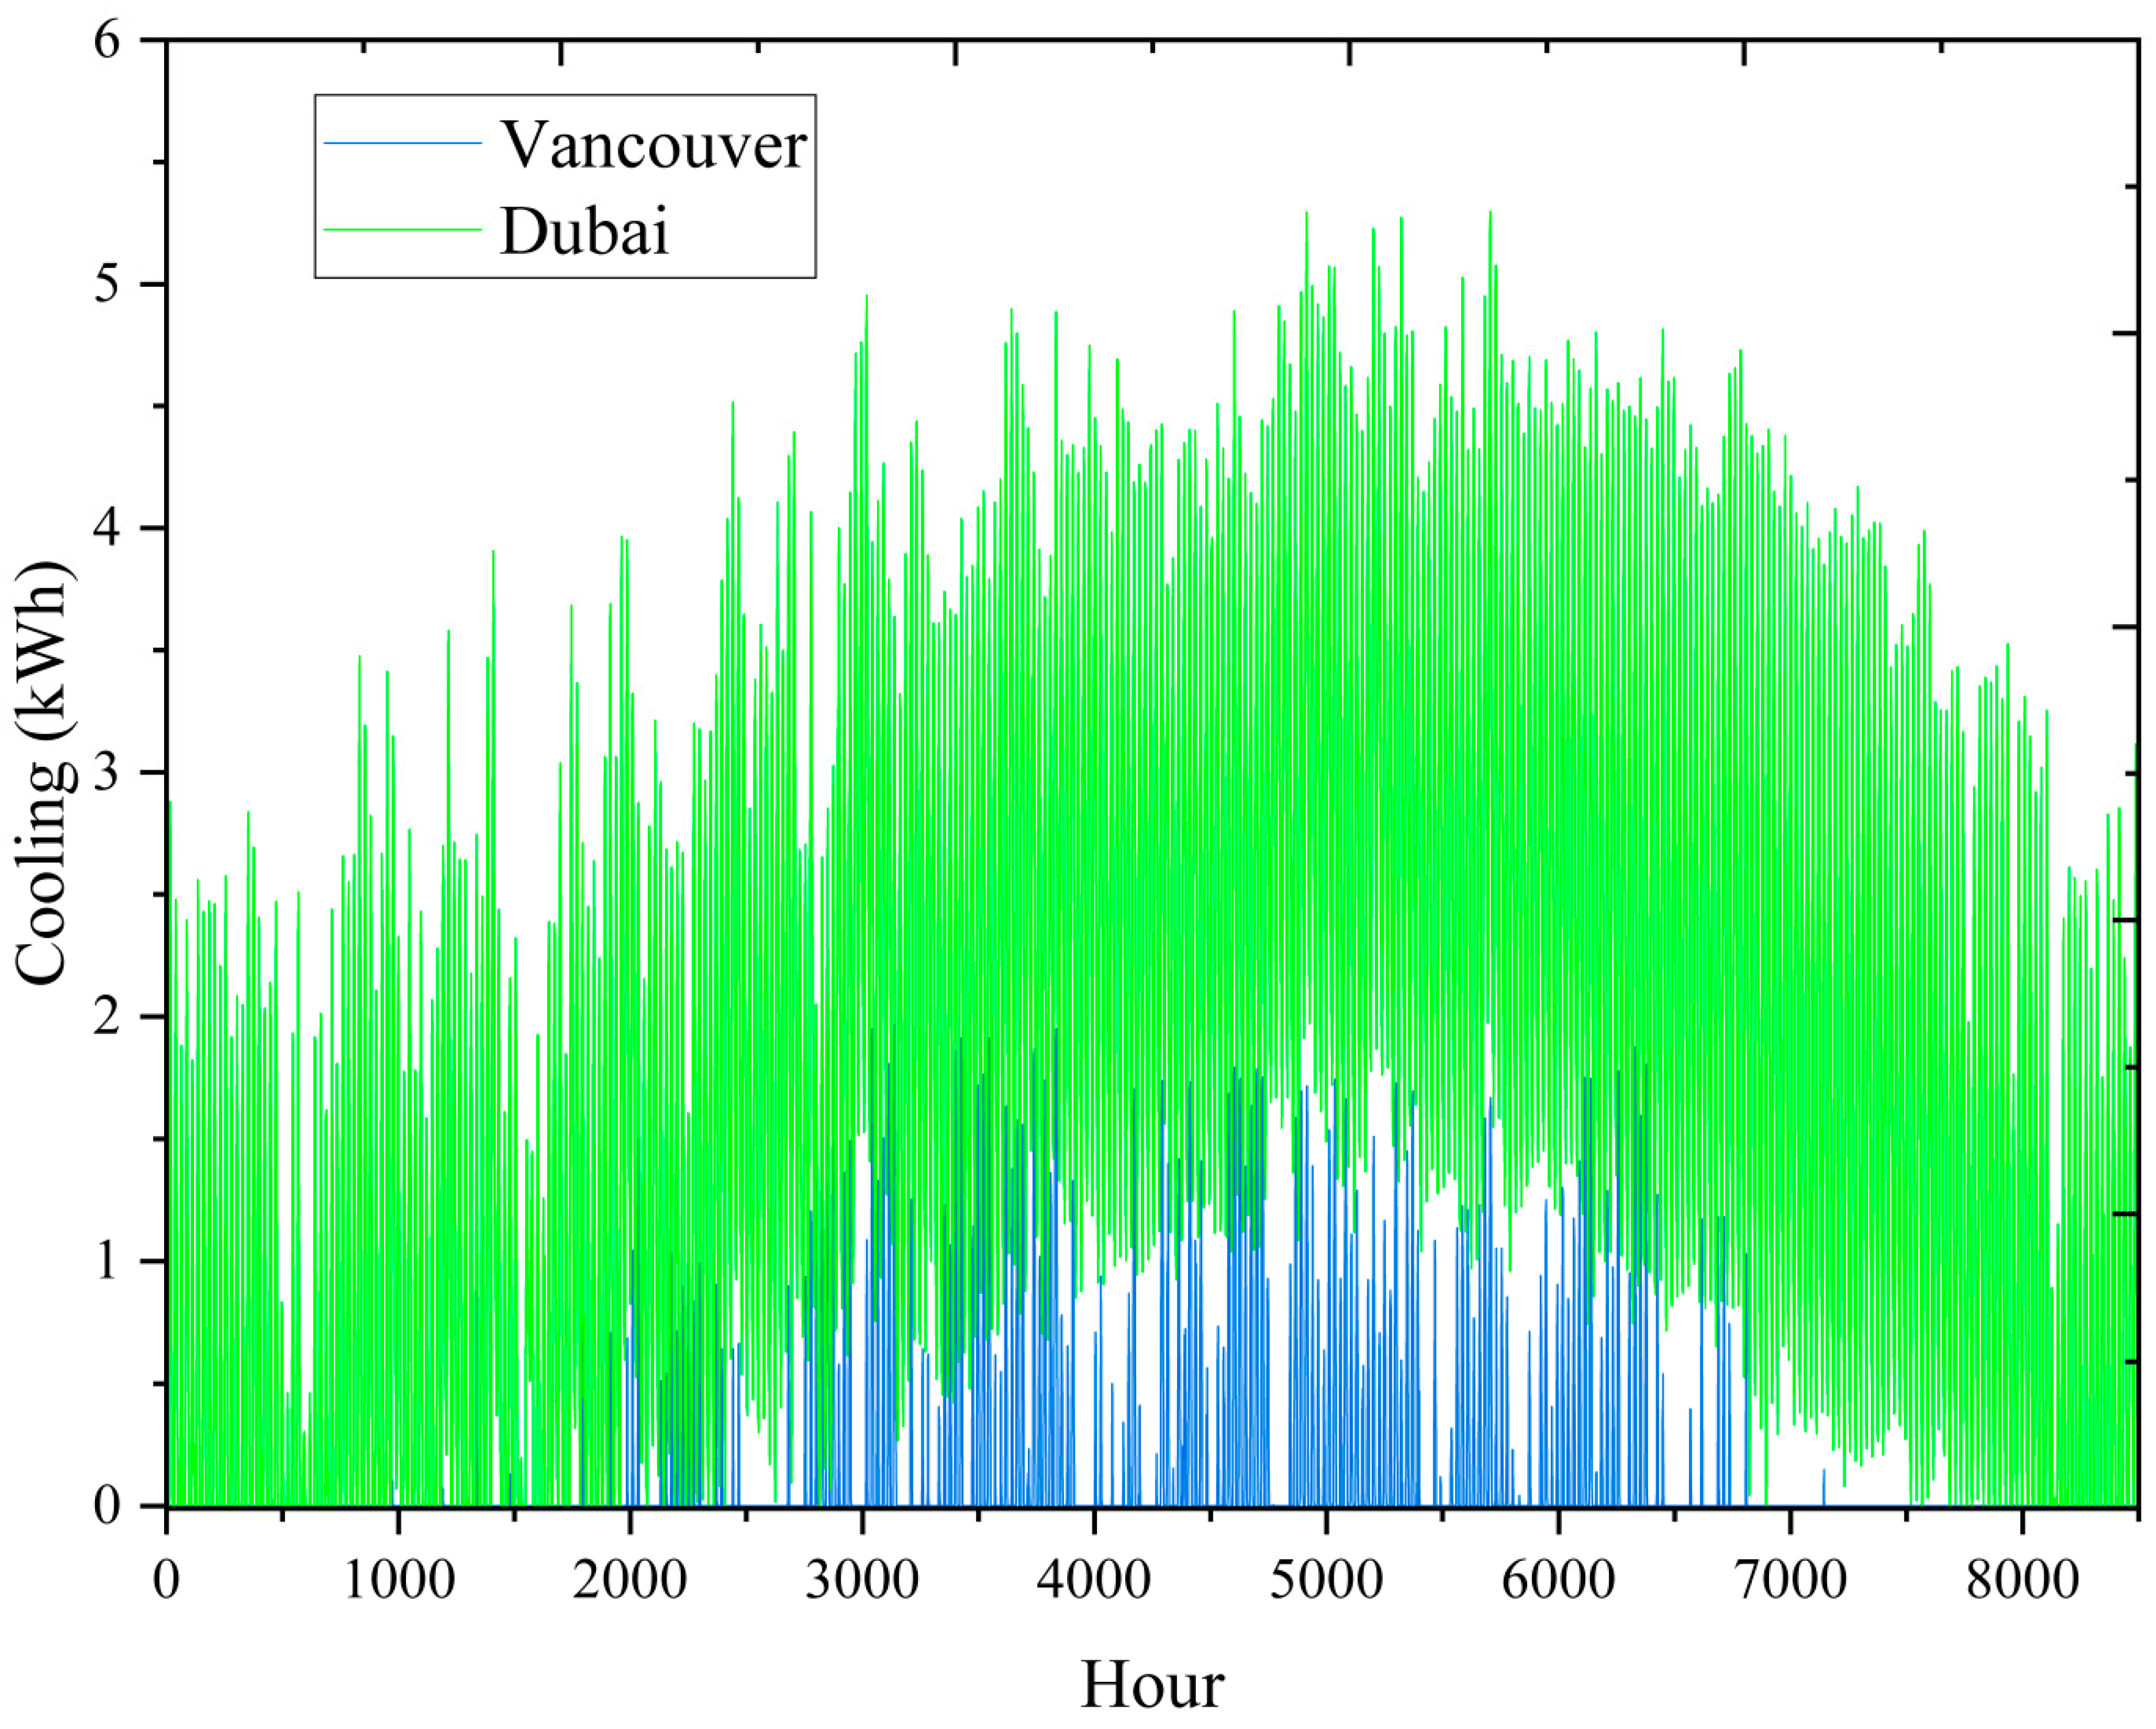
Figure 7 shows the changes in cooling energy consumption of the residential complex hourly and monthly for one year. As the results show, in the city of Vancouver, the amount of cooling load required by the residential complex is low, but in the city of Dubai, due to the high solar potential and also the high temperature of the environment, the cooling load is very high. The cooling consumption of the Vancouver residential complex is between 0 and 2 kWh, and in Dubai it is between 0 and 5.5 kWh.
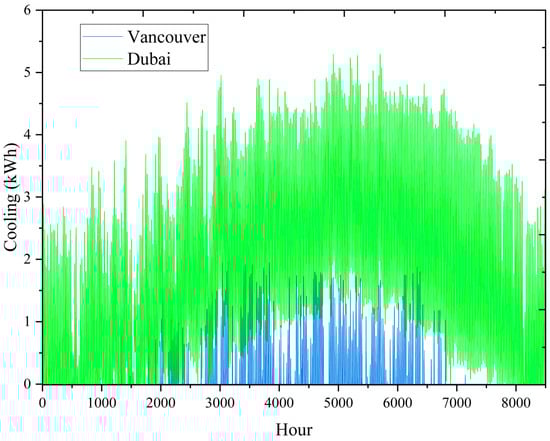
Figure 7.
The amount of cooling load consumed.
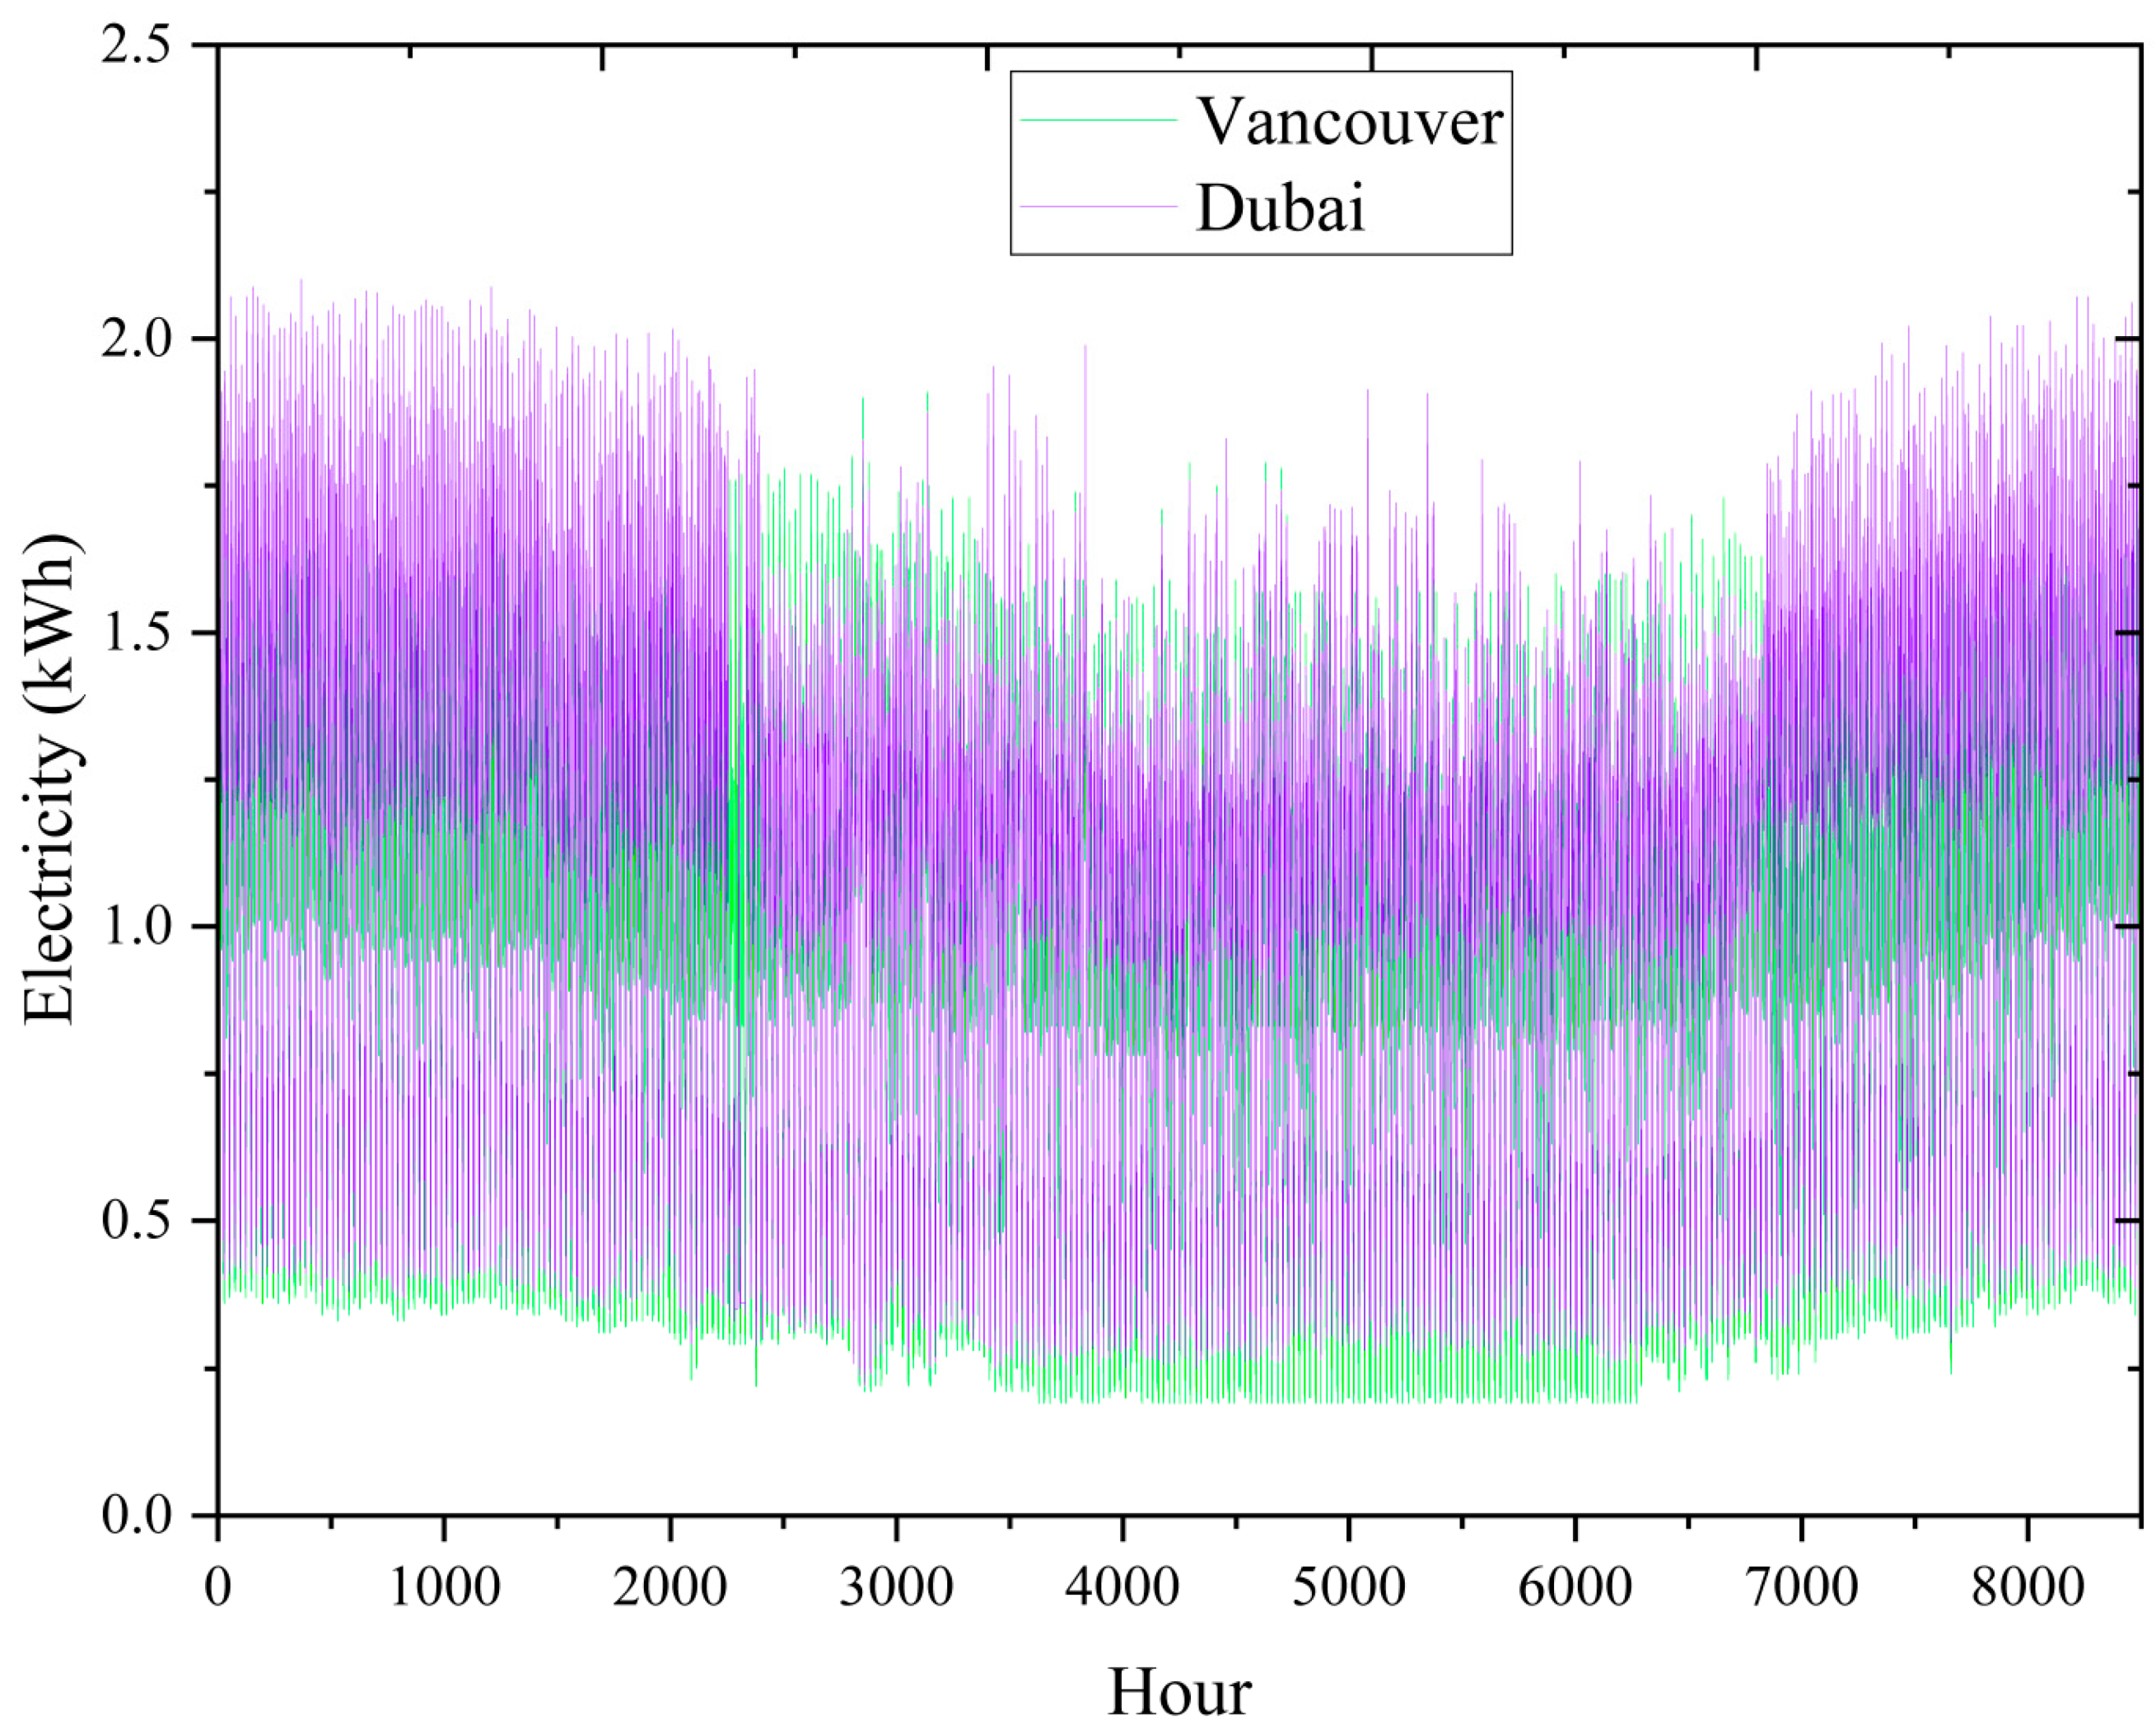
In Figure 8, the results of the electricity load of the residential complex are presented hourly for one year. The electricity consumption of the residential complex in the two study cities is between 0.1 and 2.2 kWh during the year.

Figure 8.
The amount of electrical load consumed.
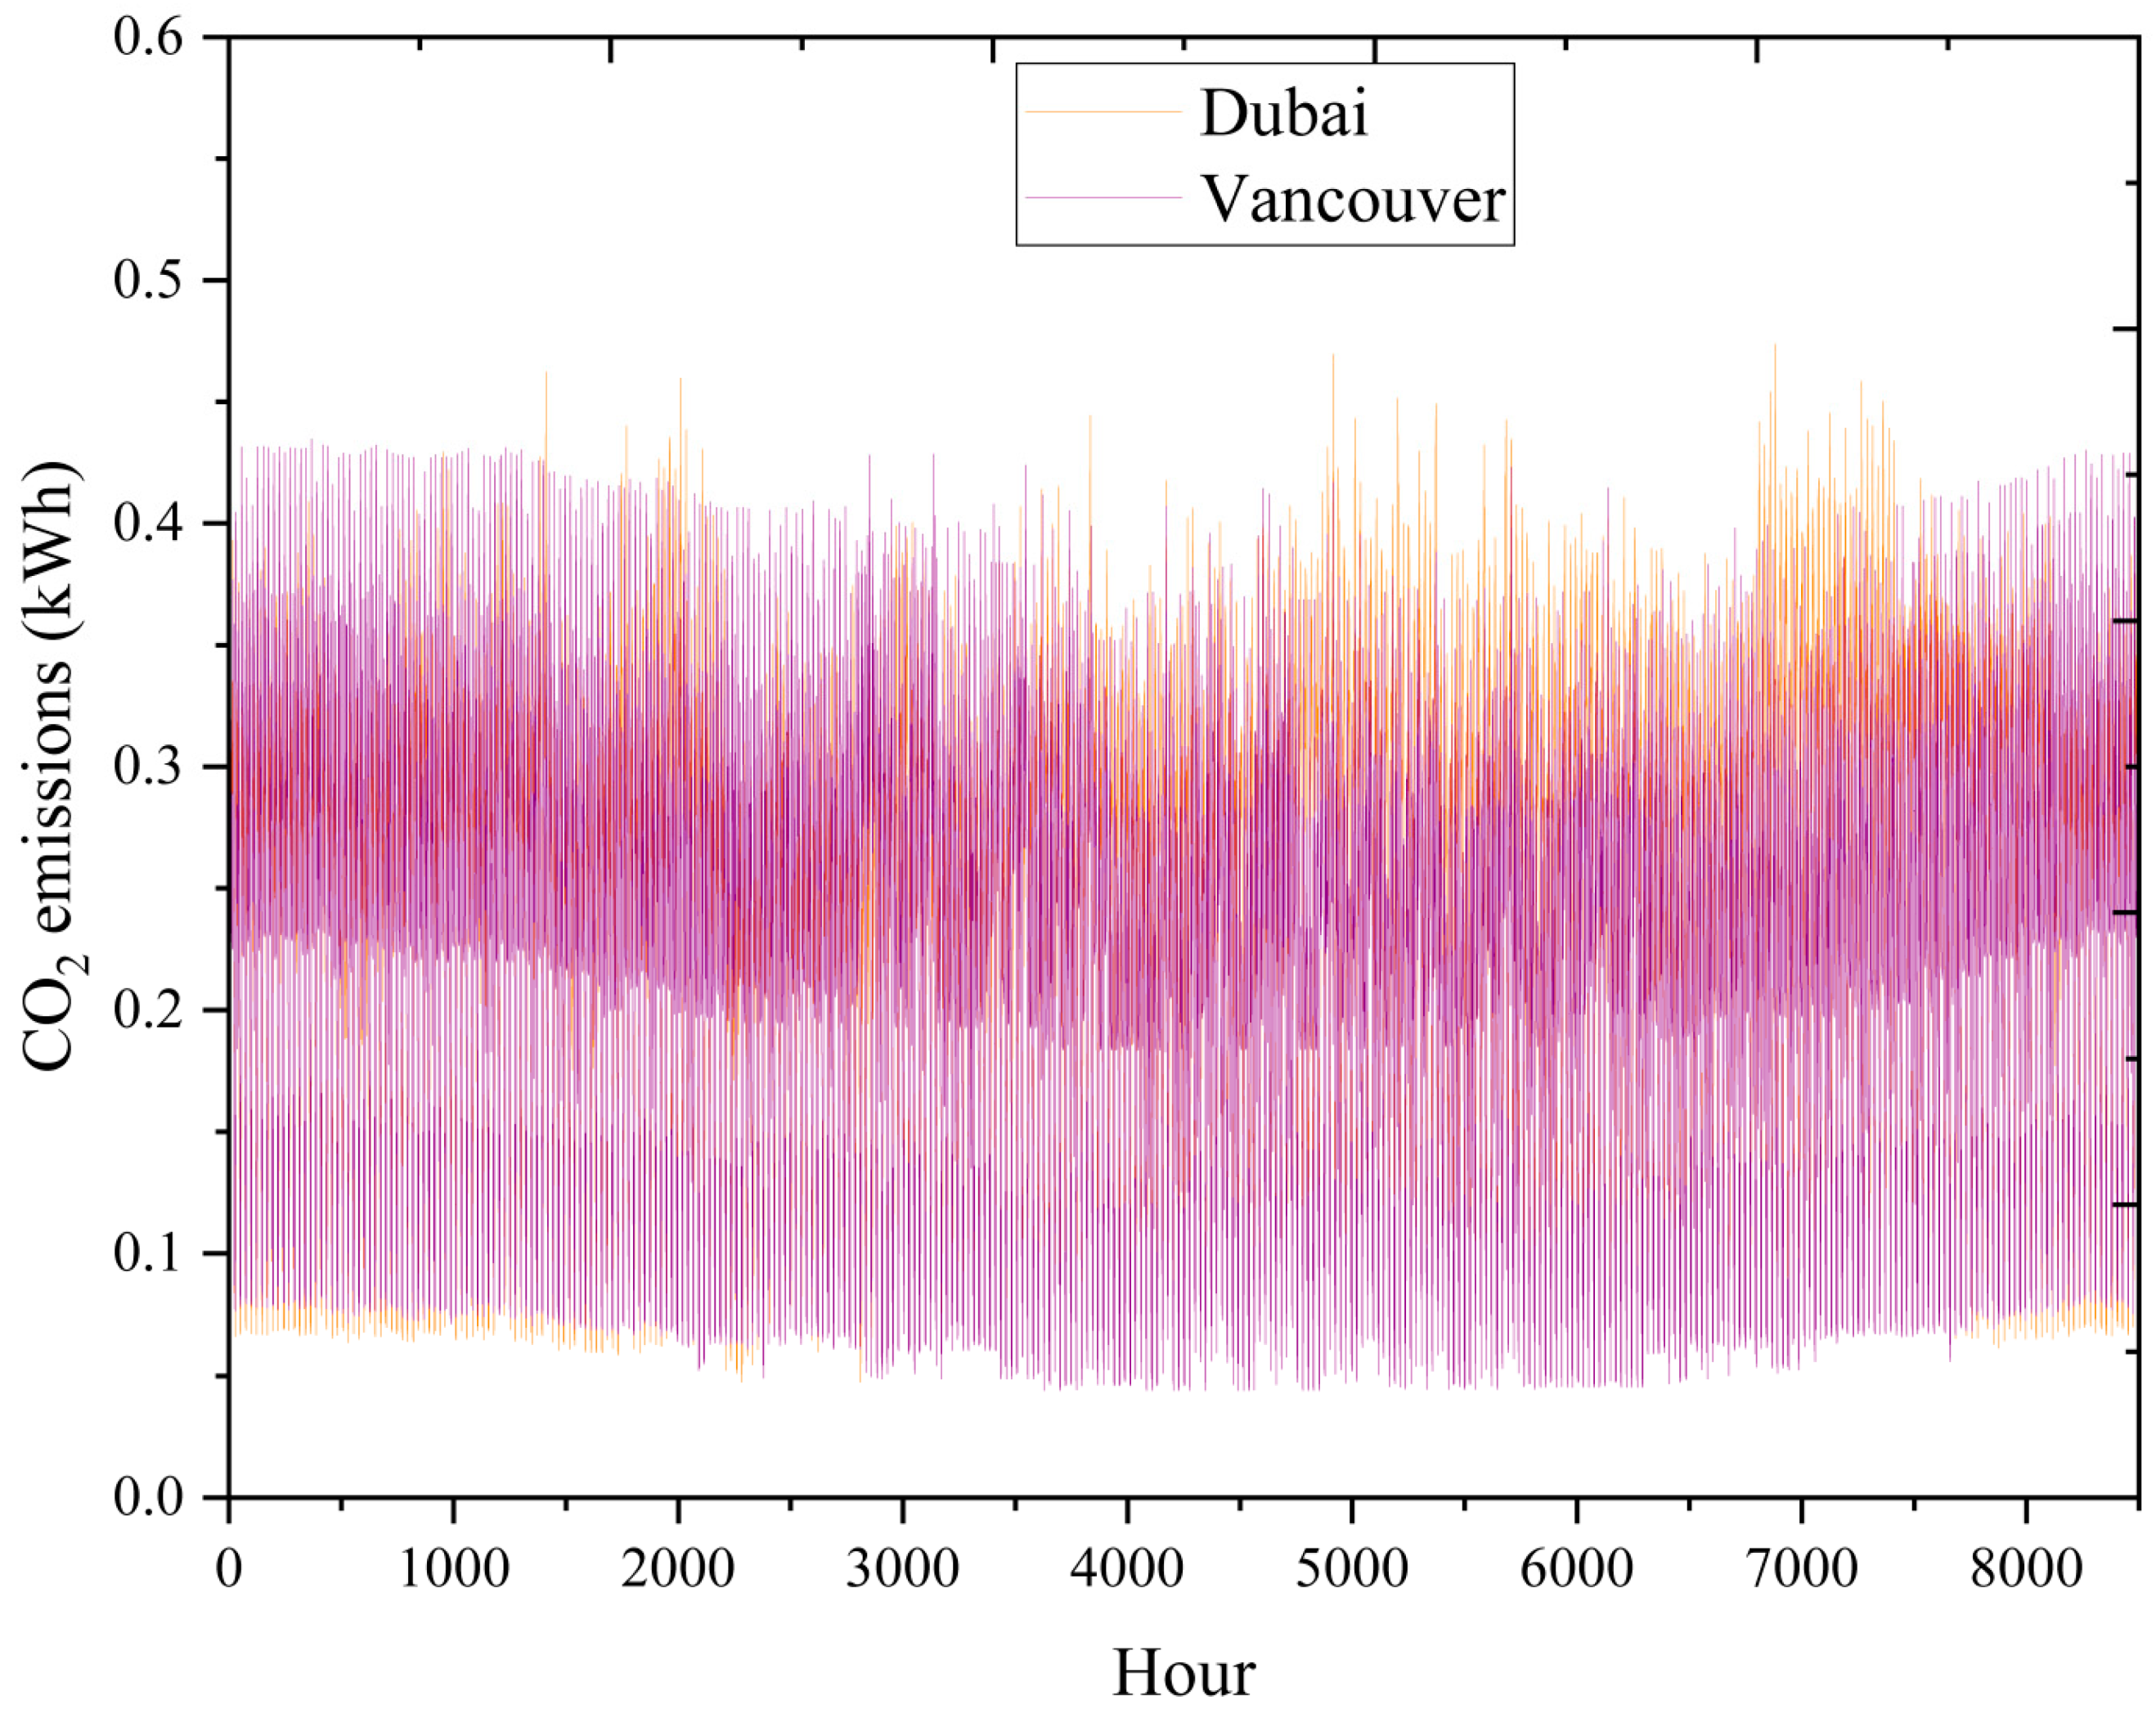
In Figure 9, the results of the reduction in CO2 emissions for one year according to the optimization of residential complex energy consumption in two study cities are presented. As the results show, with the reduction in electricity consumption, carbon dioxide emissions also decrease, and electricity consumption is the main option for carbon dioxide emissions.

Figure 9.
The reduction in CO2 emissions throughout the year.
Dubai and Vancouver are among the cities with the greatest potential for expansion, and are also considered a suitable place to live. With two different climates, there are changes in the amount of energy consumption. By optimizing residential buildings in Dubai and Vancouver, it is possible to save energy and reduce environmental pollution, which is important because the population of these cities is high and the population of these cities increases every year.
Table 9 compares the energy consumption of residential complexes in Vancouver and Dubai.
Table 9.
Comparison of consumption load of residential complexes in the study cities.
As the results show, the electricity consumption of the residential complex in Dubai is 11.26%, and the carbon dioxide emission is 23.20% higher. The consumption of heating and cooling in the studied cities depends on the ambient temperature.
4. Optimum Building Analysis in the Best Study City
In this research, a six-unit residential building was designed in the two cities of Dubai and Vancouver with different hot and cold climates, the energy consumption was calculated in terms of electricity consumption, cooling, and heating, and the best materials were selected for the construction. The aim was to investigate the impact of using PCMs in the walls and roofs of buildings in Dubai and Vancouver, and finally to calculate the energy consumption of the building when PCMs are used. It was concluded that phase change materials can be effective in reducing energy consumption.
To find the best city for setting up a renewable geothermal system, the electricity consumption of two residential complexes in the study cities of Dubai and Vancouver was investigated and compared. The use of different materials and PCMs in the roof and walls of two residential complexes was carried out to optimize the energy consumption and the cost to build, and to reduce CO2 emissions. The energy consumption results of two complexes were presented in Table 9, and an optimization was carried out using BEopt. In this optimization, according to the location of the area, changes in weather conditions, as well as the materials and sizes of the materials used, were considered as input conditions. The optimization solutions by BEopt were obtained after analyzing the problem with different iterations, which resulted in lower energy consumption in the residential complex in the city of Vancouver. For this reason, the city of Vancouver was chosen for the final study.
In Table 10, the consumption load of the residential complex is analyzed in three result modes, including optimal, reducing the cost of building the residential complex, and also the most saving in energy consumption. The results are presented for comparison that the main selected scenario of this research was the optimal state. At the optimal point, the goal is to simultaneously save all the energy of the building along with the appropriate cost and reduce the environmental pollution of residential buildings. However, in the case of the maximum saving in energy consumption, the only goal is to save energy consumption, and in the case of reducing the cost of building a residential complex, the goal is to reduce the construction costs. For this reason, in this research, the optimal mode is chosen due to the simultaneous optimization of energy consumption, cost, and pollution reduction.
Table 10.
Comparison of residential complex consumption in different modes.
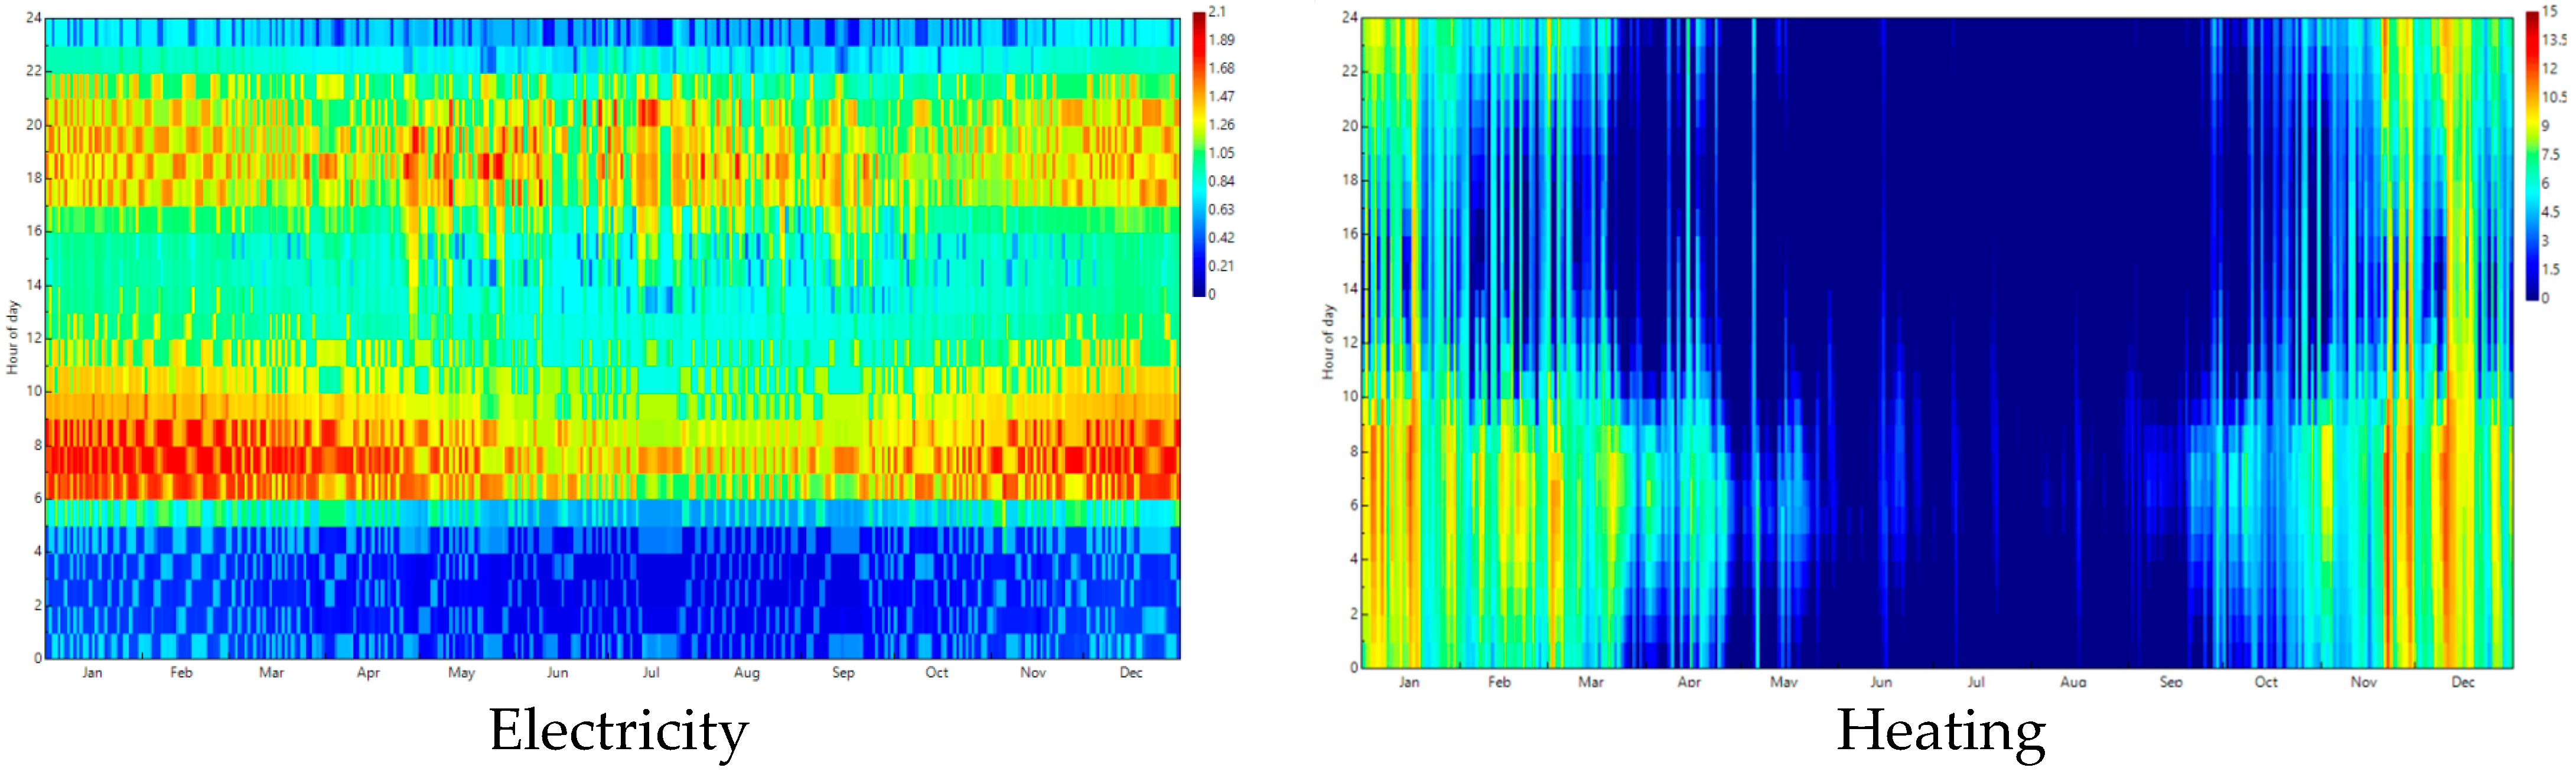
Figure 10 shows the thermal contours of the residential complex in Vancouver. These figures show the schematic of energy and energy distribution in an hourly manner. The amount of energy consumption required by the residential complex in different seasons according to the materials used in the construction of the residential complex has been calculated in this figure. In this figure, the contours of electricity, heating, and cooling consumption as well as CO2 emissions throughout the year are shown, and the decrease or increase in their amount throughout the year and based on the environmental conditions affecting the residential complex is obtained.

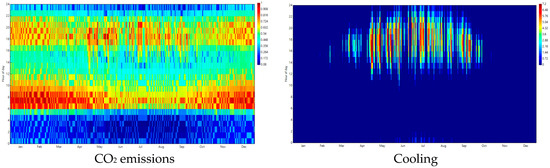
Figure 10.
Energy consumption contour.
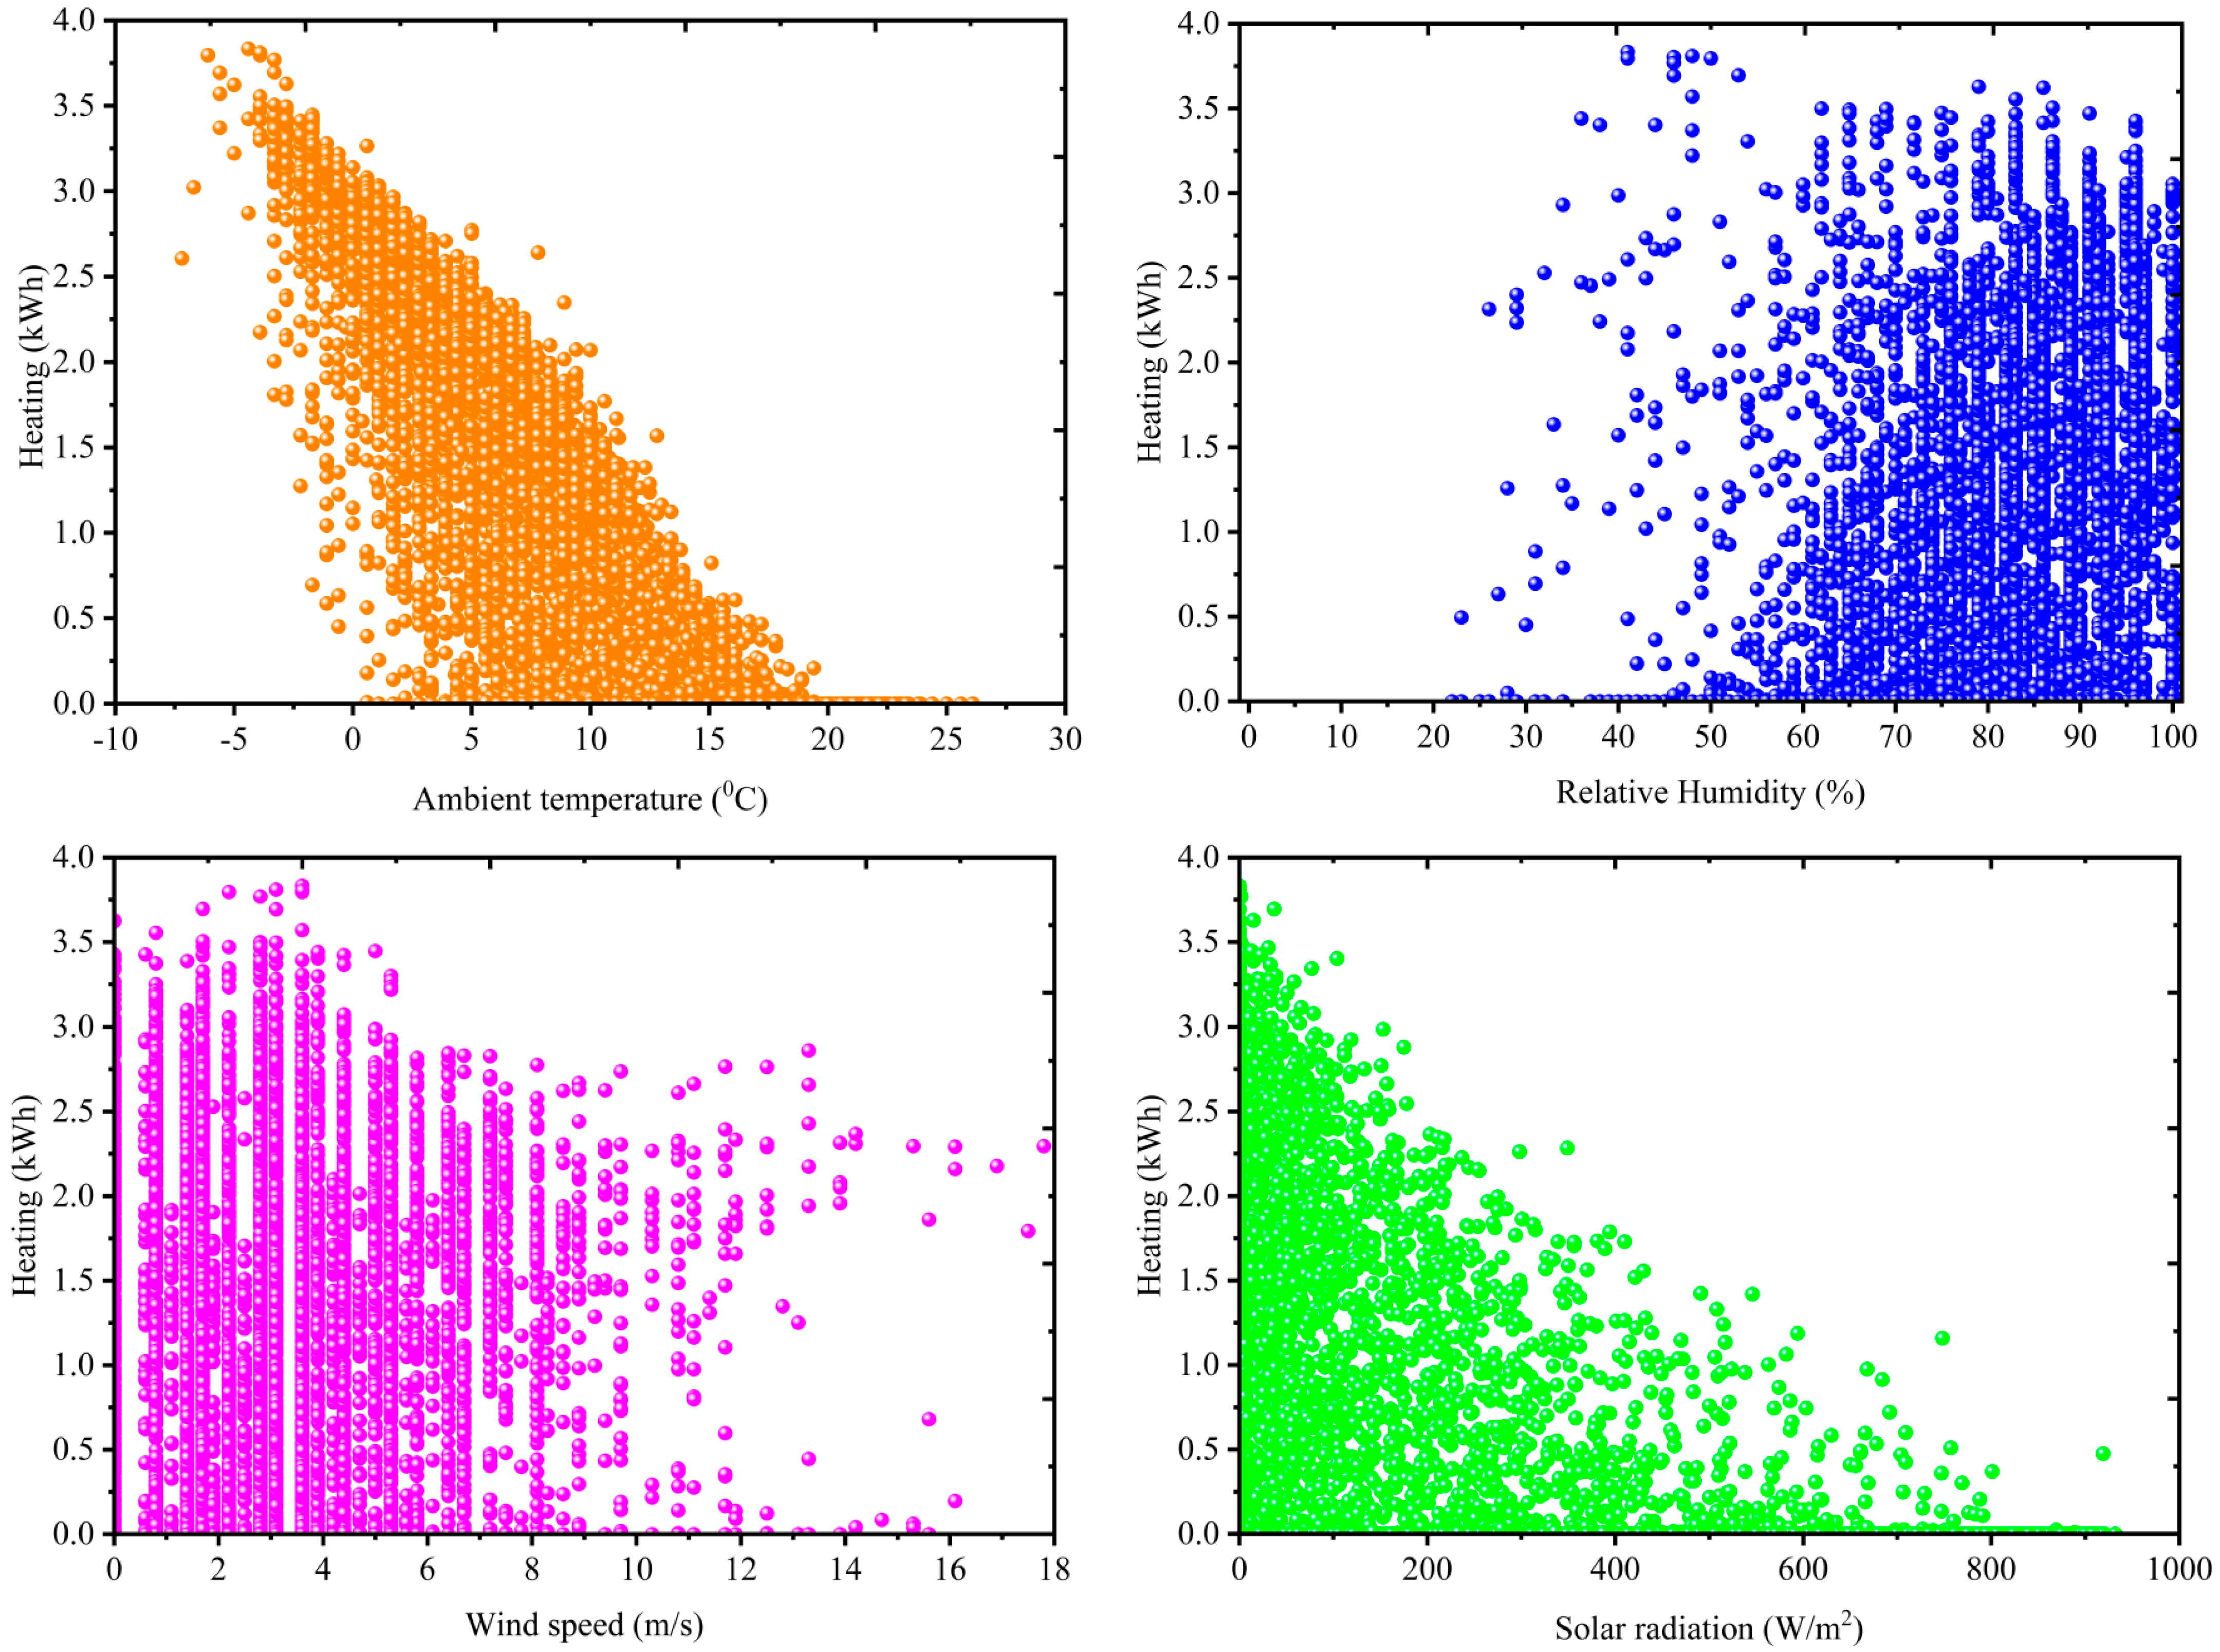
The influence of Vancouver’s environmental climate parameters on the residential complex’s heating consumption is shown in Figure 11. The impact of the changes in the weather parameters of the city of Vancouver is shown separately from the amount of heating consumption.
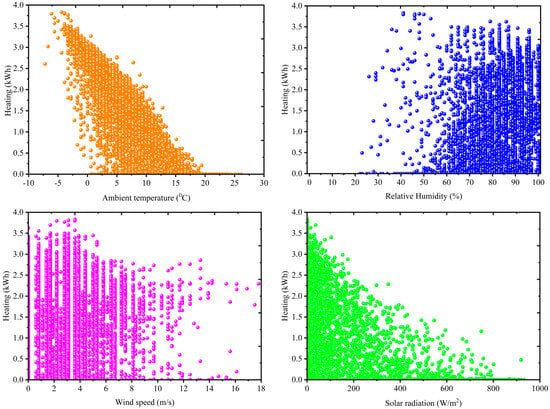
Figure 11.
Load distribution of the effects of weather parameters on the heating consumption of the residential complex.
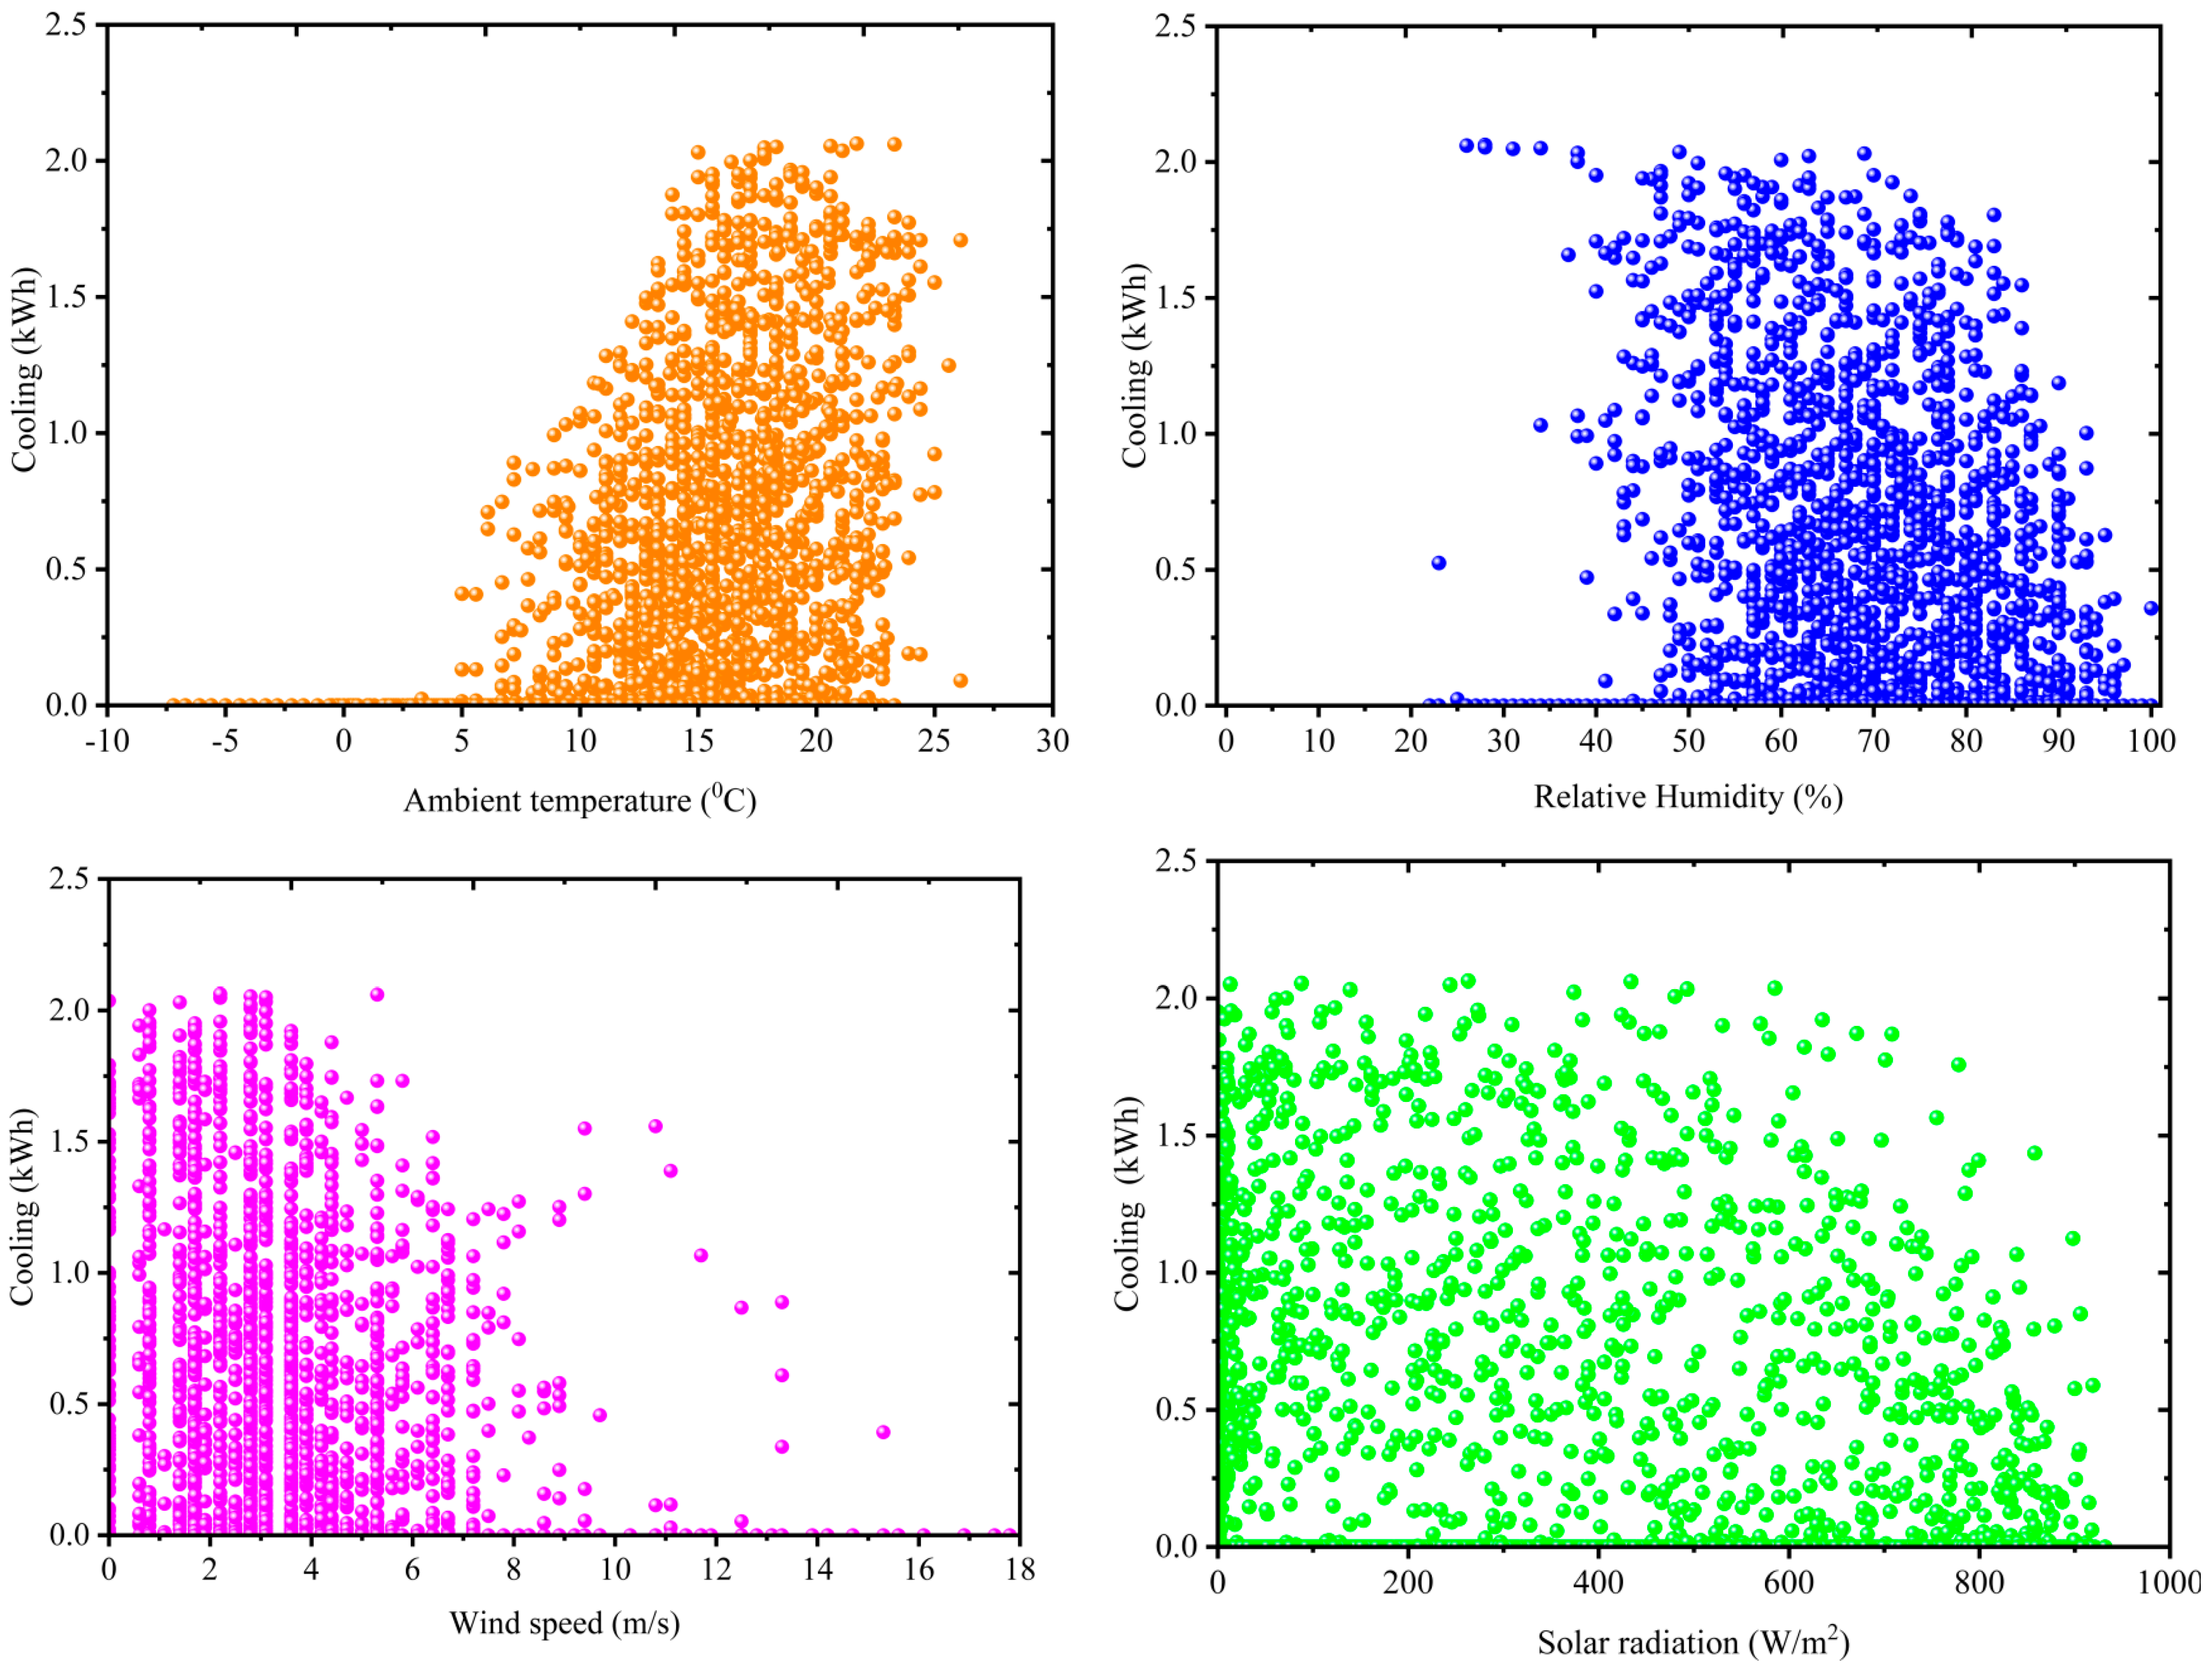
Figure 12 shows the distribution of changes in environmental parameters on the cooling consumption in the residential complex. The impact of the changes in the weather parameters of the city of Vancouver is shown separately from the cooling consumption.

Figure 12.
Load distribution of the effects of weather parameters on the cooling consumption of the residential complex.
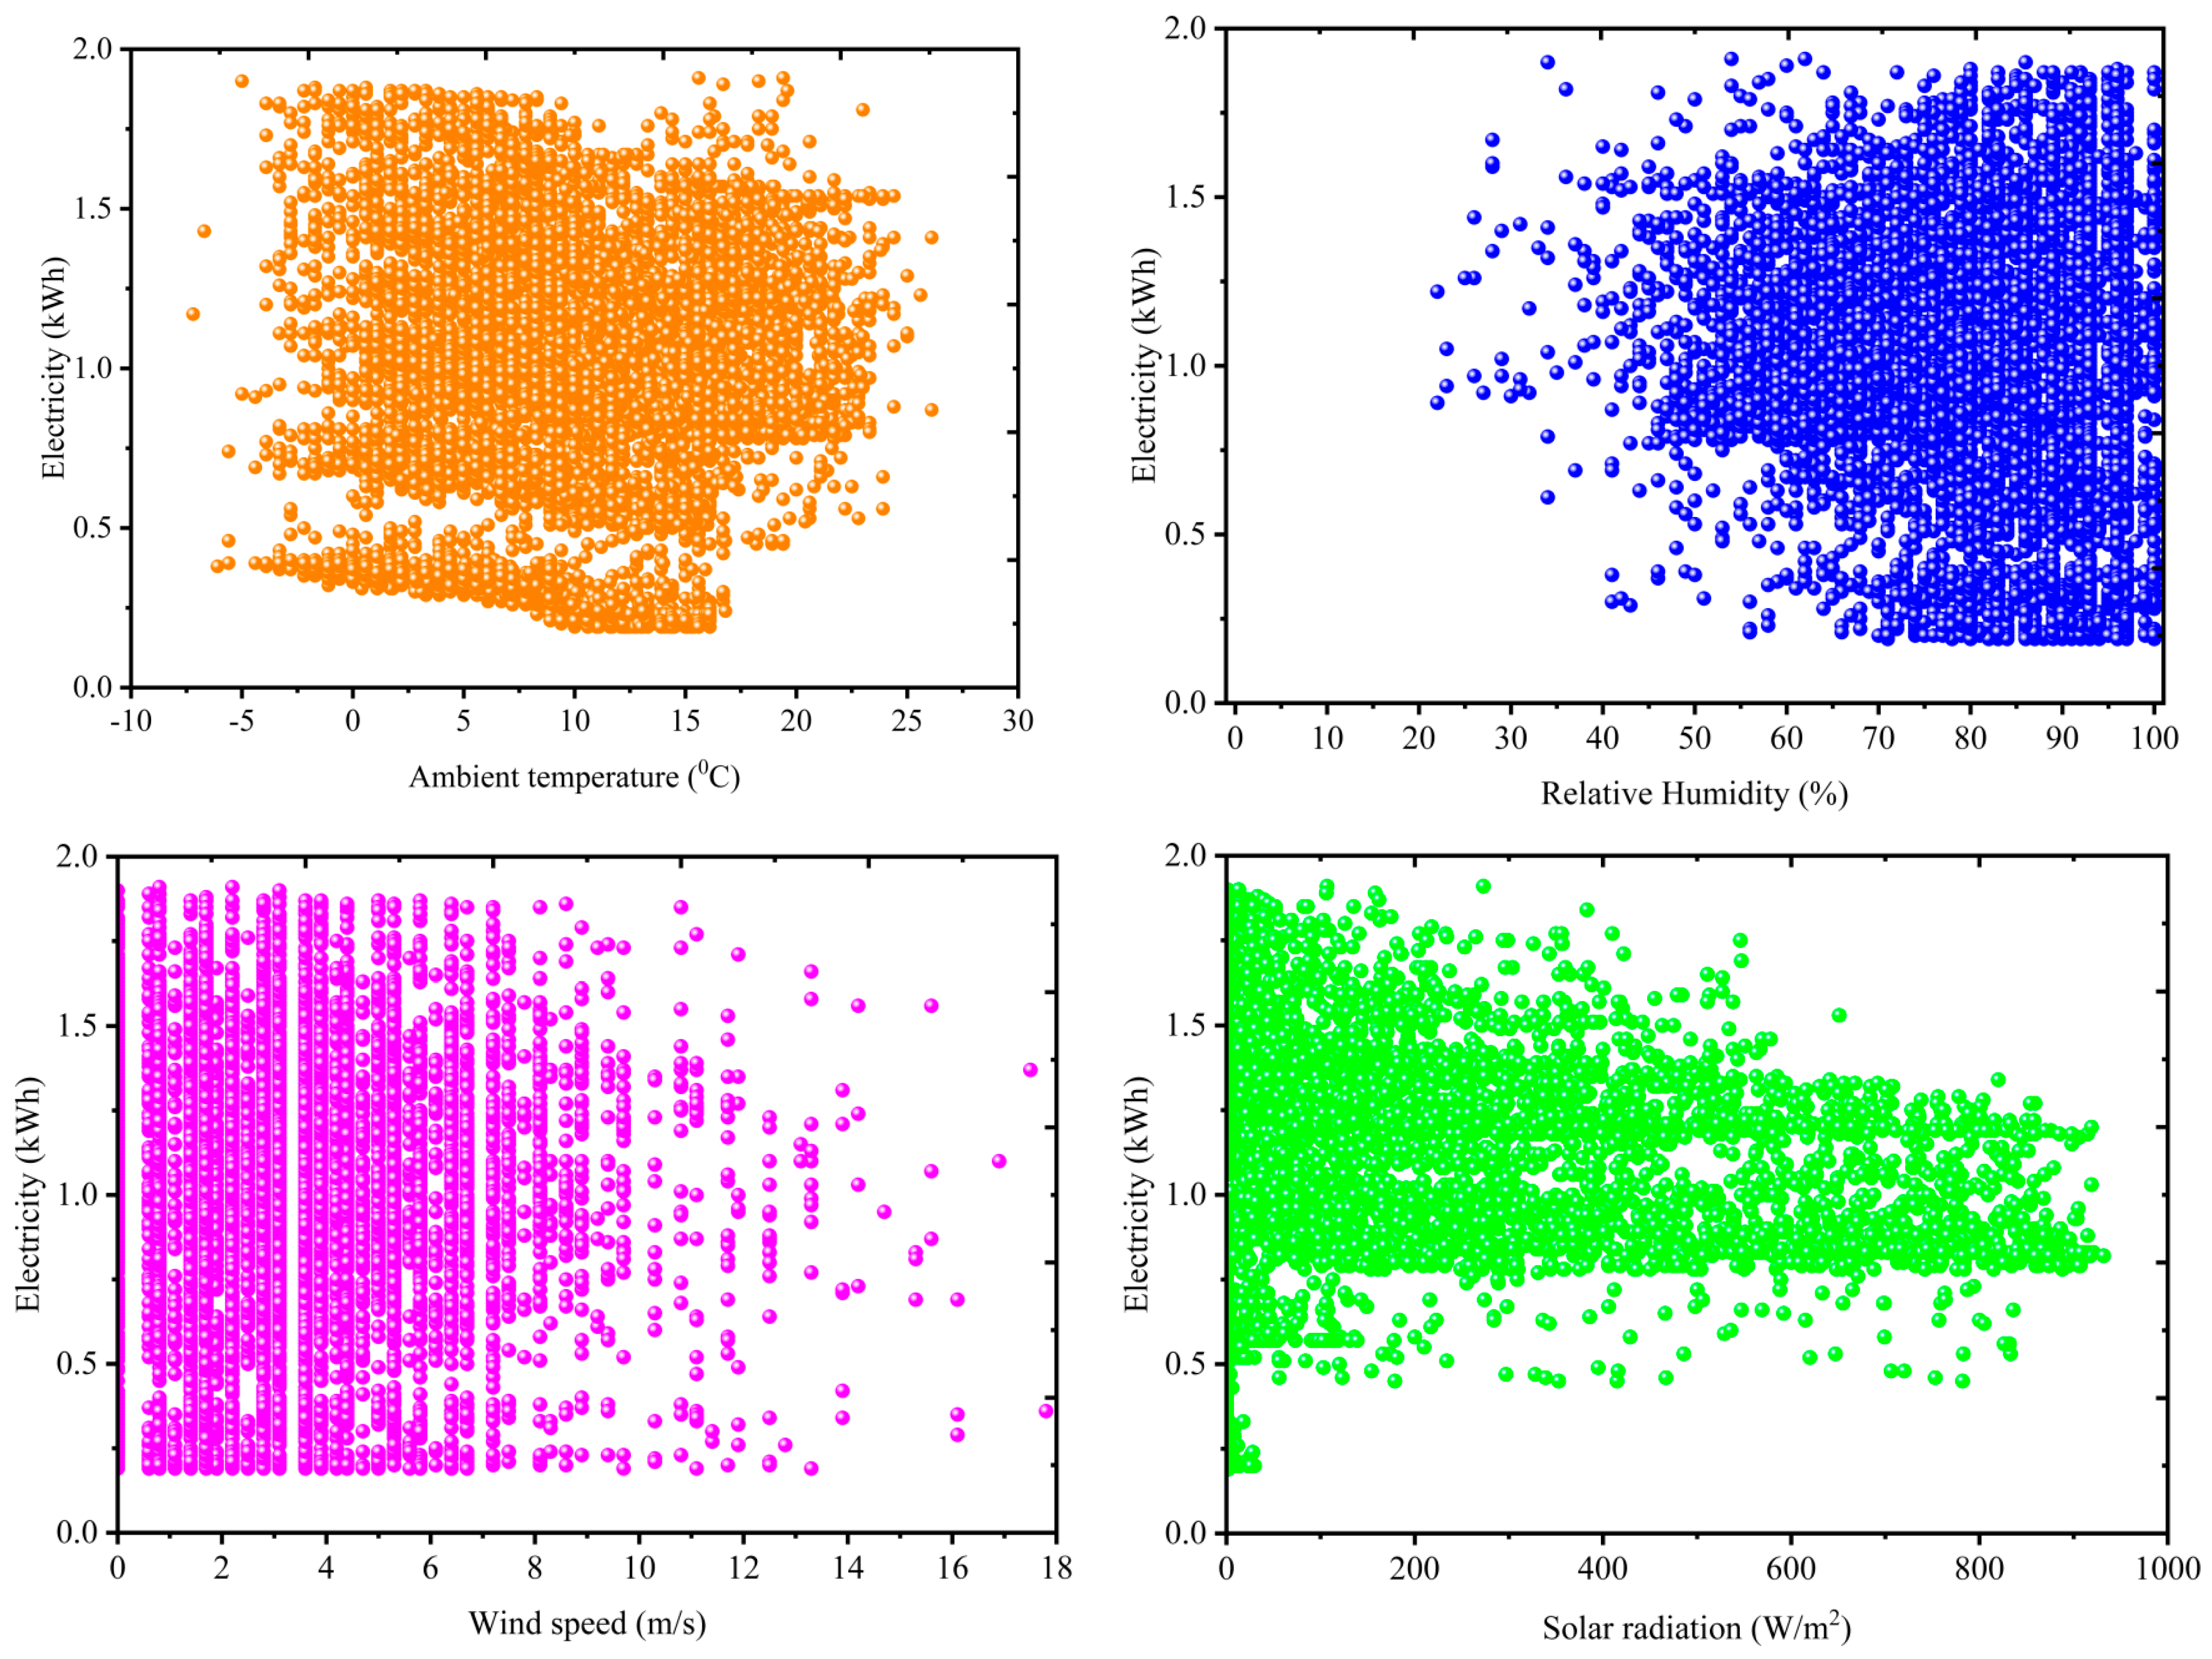
Figure 13 shows the distribution of changes in environmental parameters on the electricity consumption of the residential complex. The impact of the changes in the weather parameters of the city of Vancouver is shown separately from the electricity consumption.

Figure 13.
Load distribution of the effects of weather parameters on the electricity consumption of the residential complex.
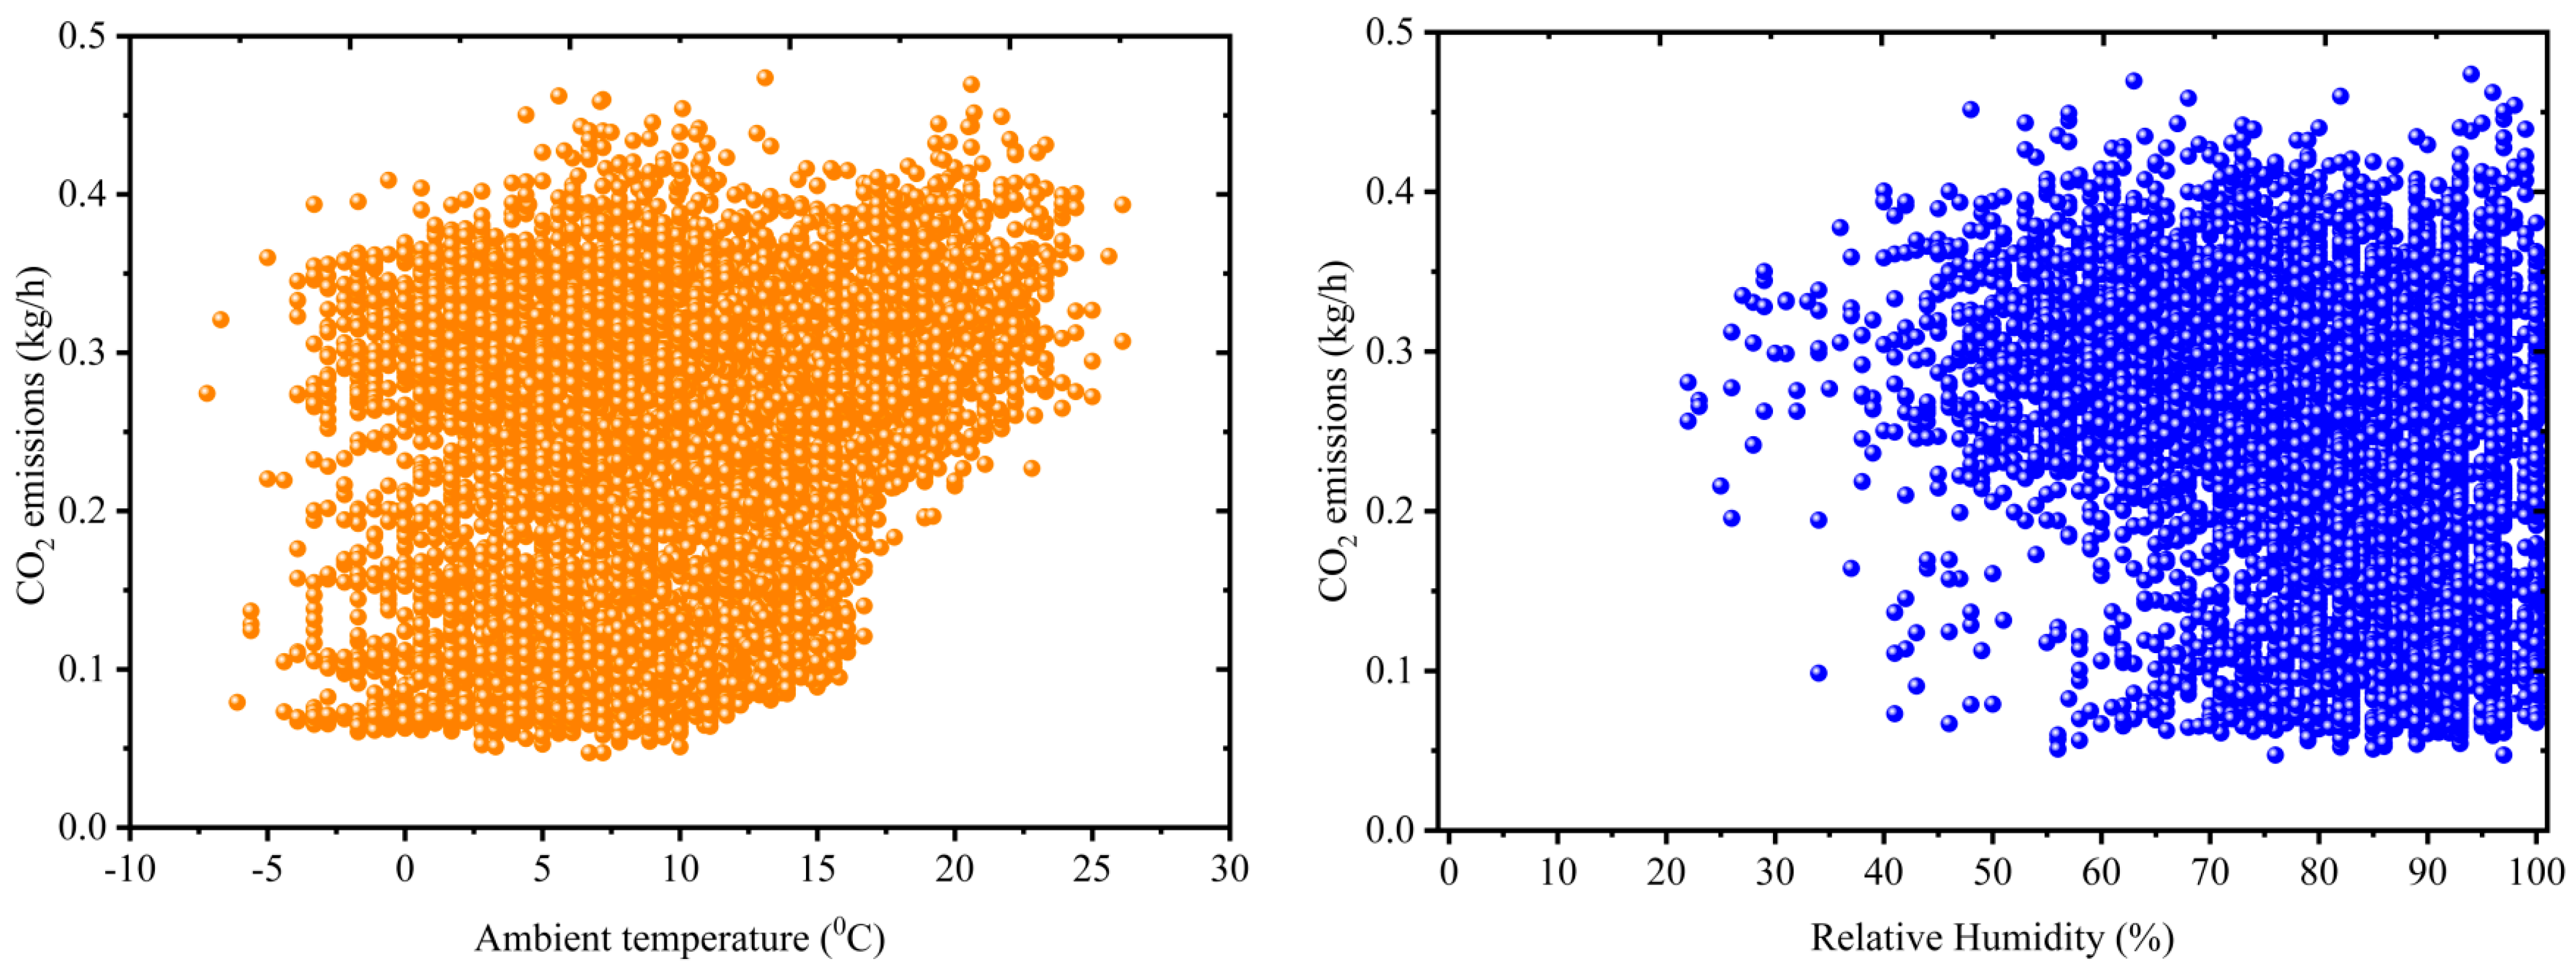
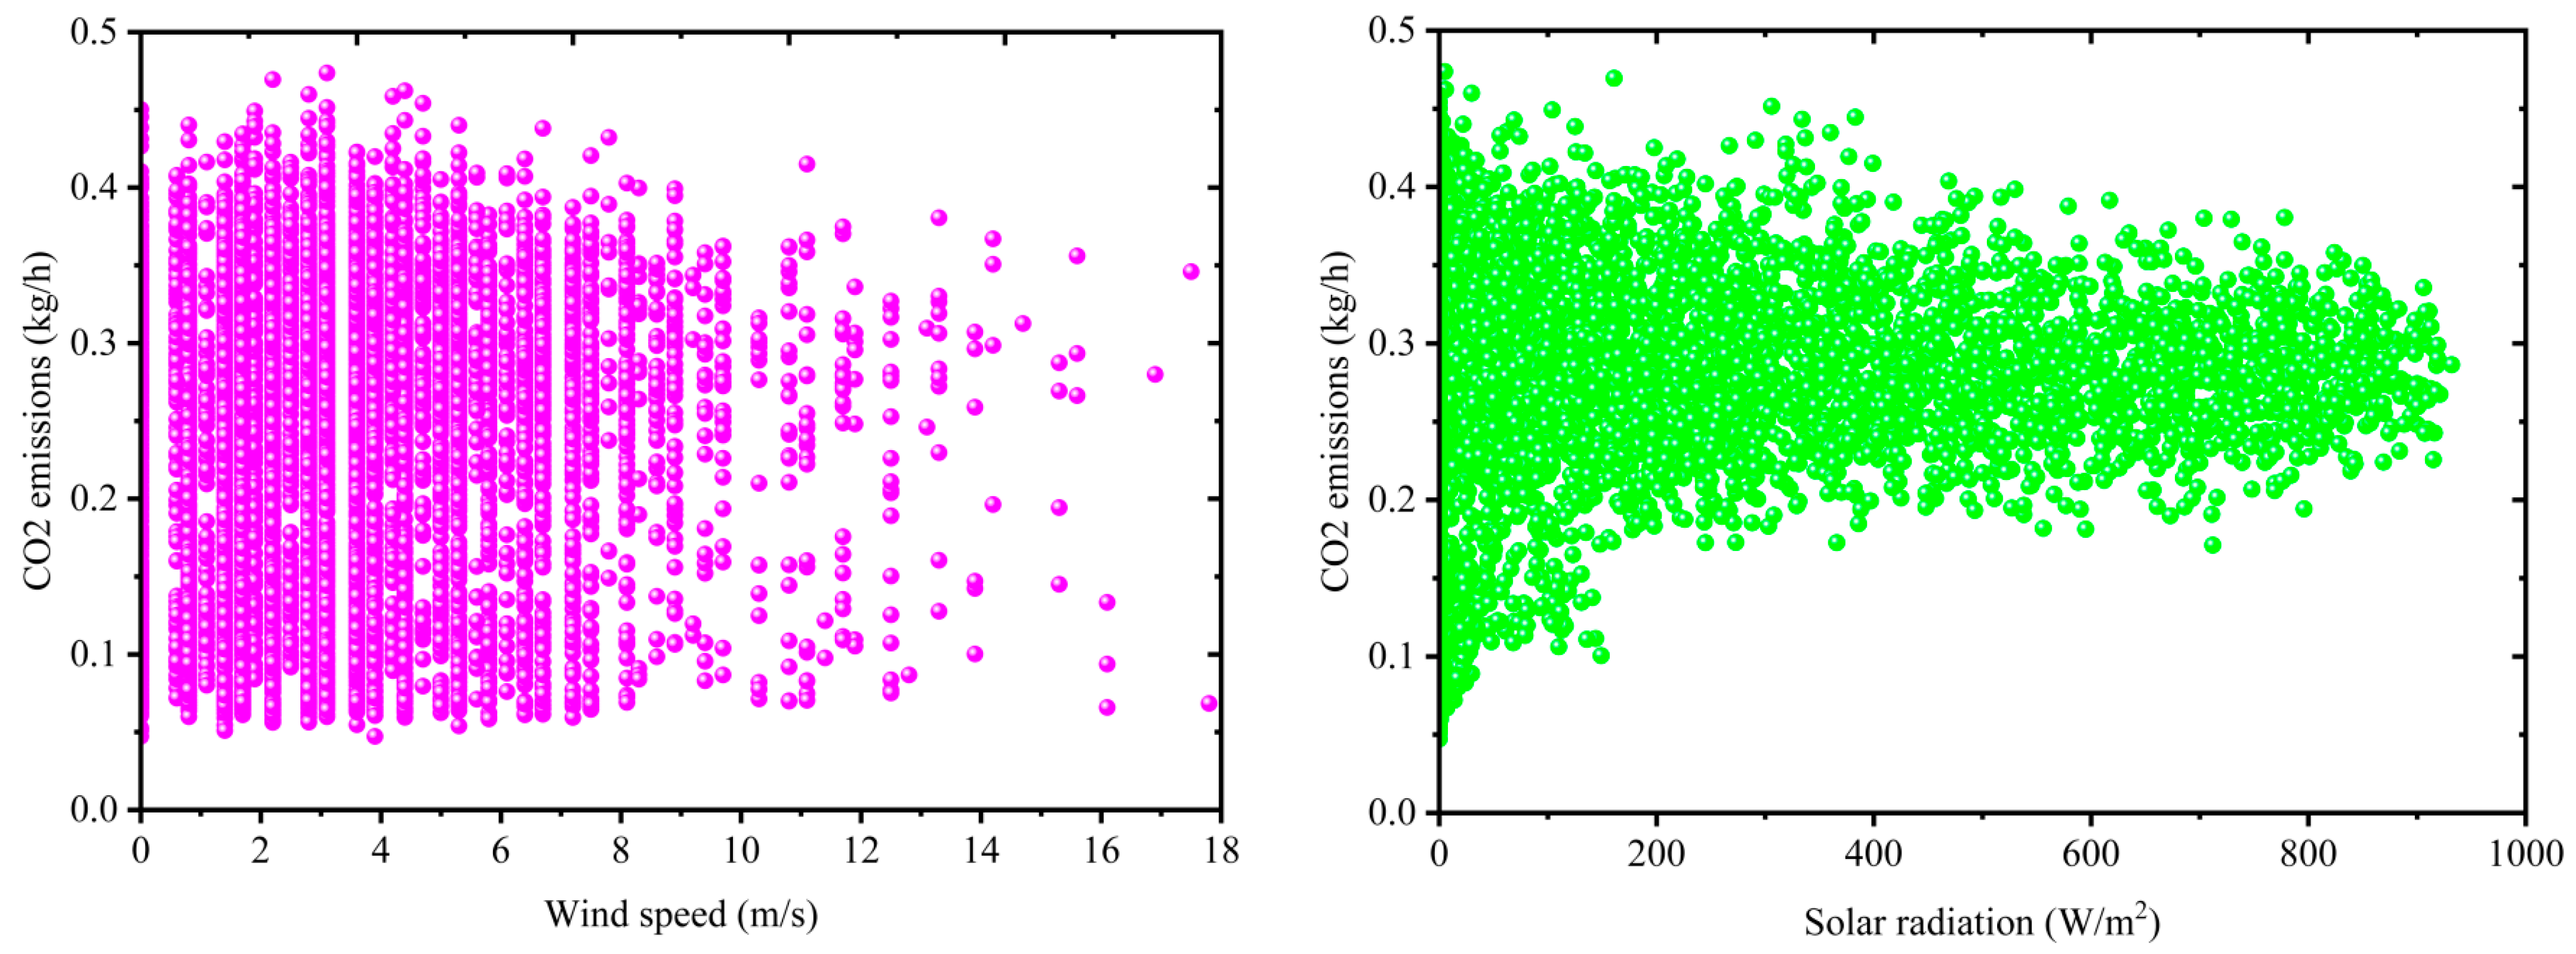
Figure 14 shows the distribution of changes in environmental parameters on the reduction in CO2 emissions in the residential complex. The impact of the changes in the weather parameters of the city of Vancouver is shown separately from the reduction in CO2 emissions.

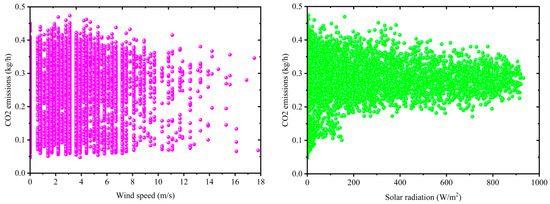
Figure 14.
Load distribution of the effects of weather parameters on the reduction in the CO2 emissions of the residential complex.
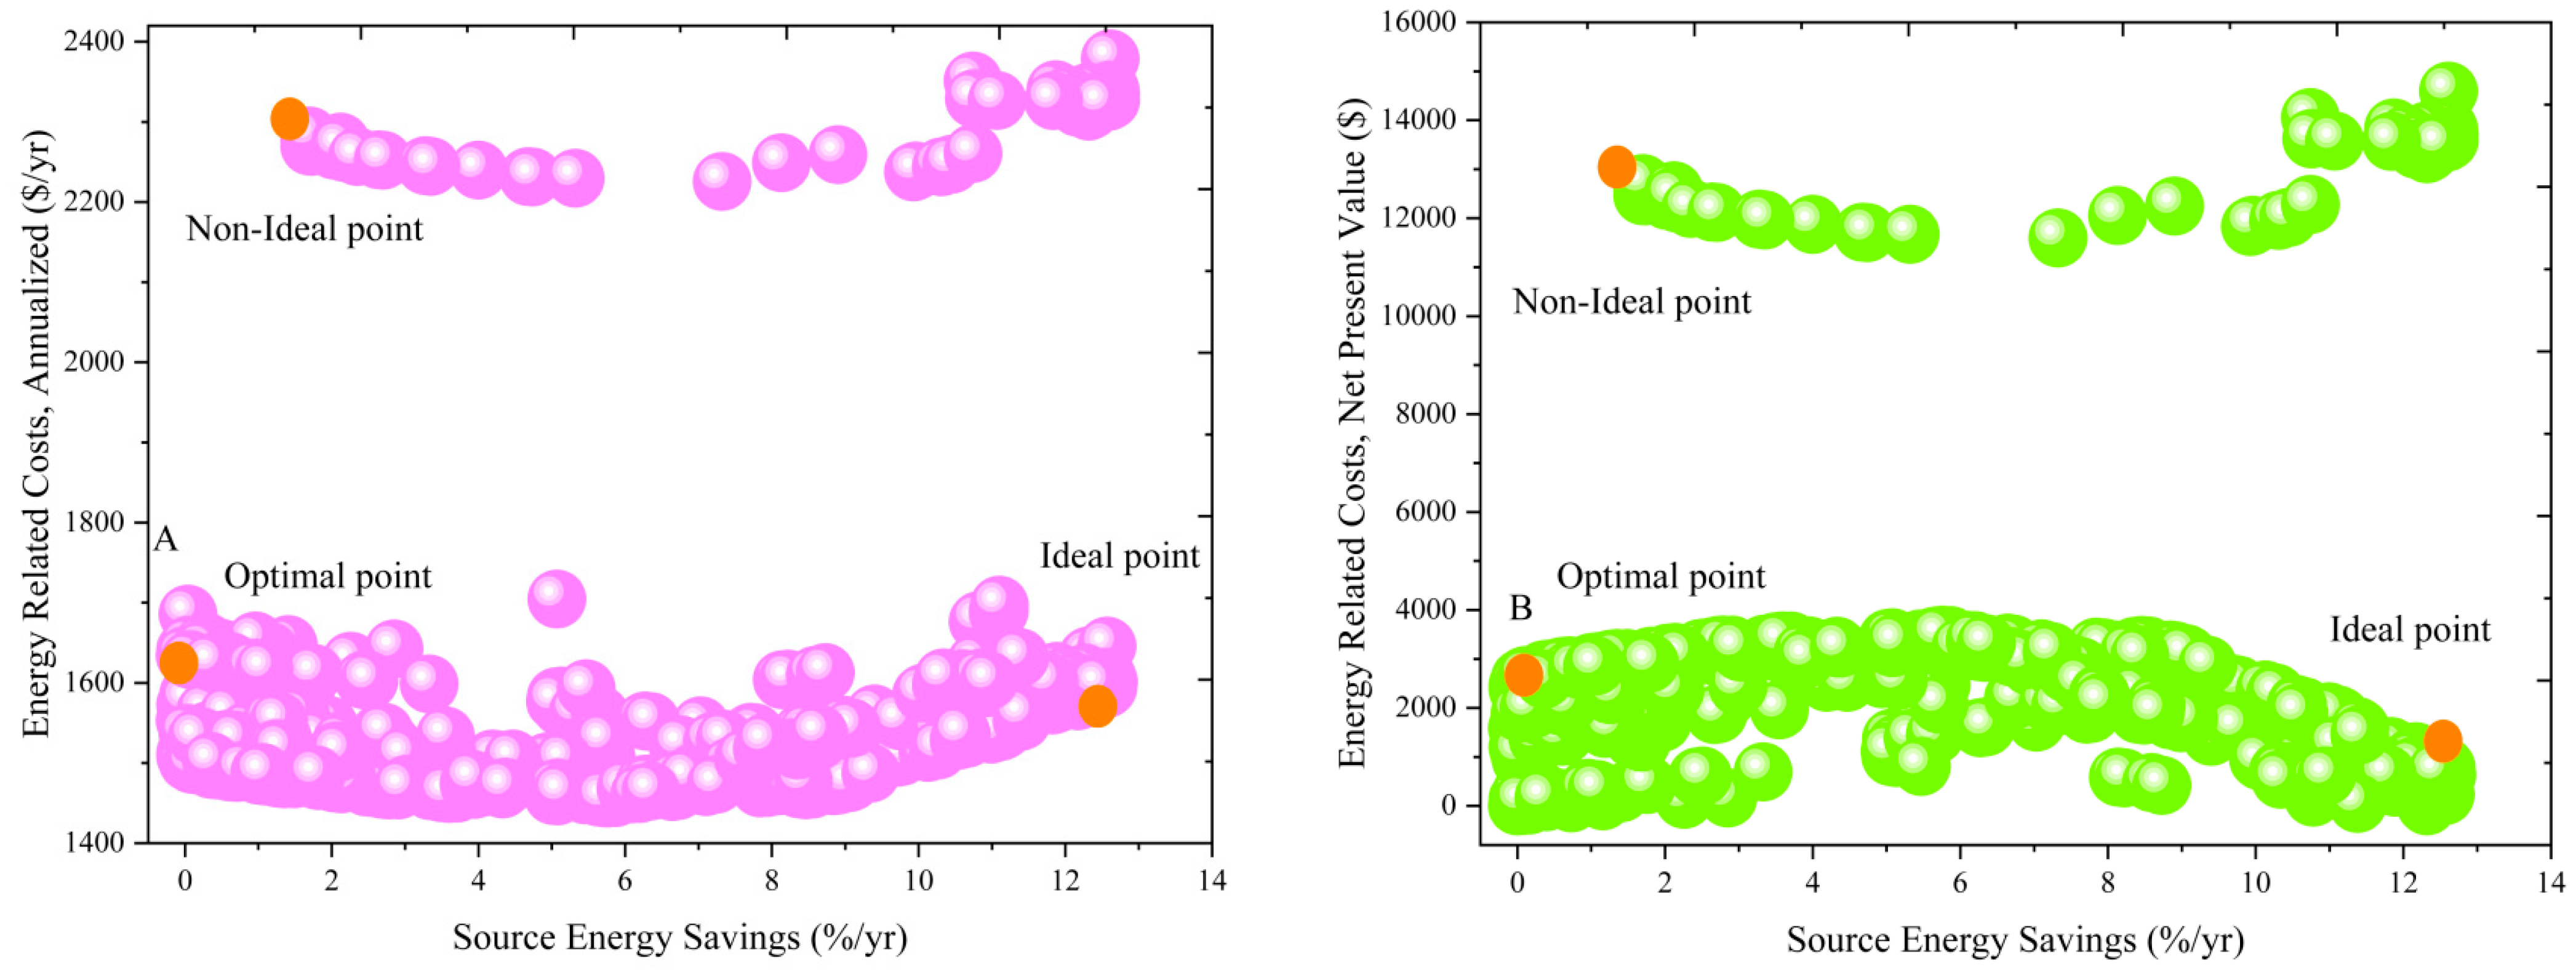
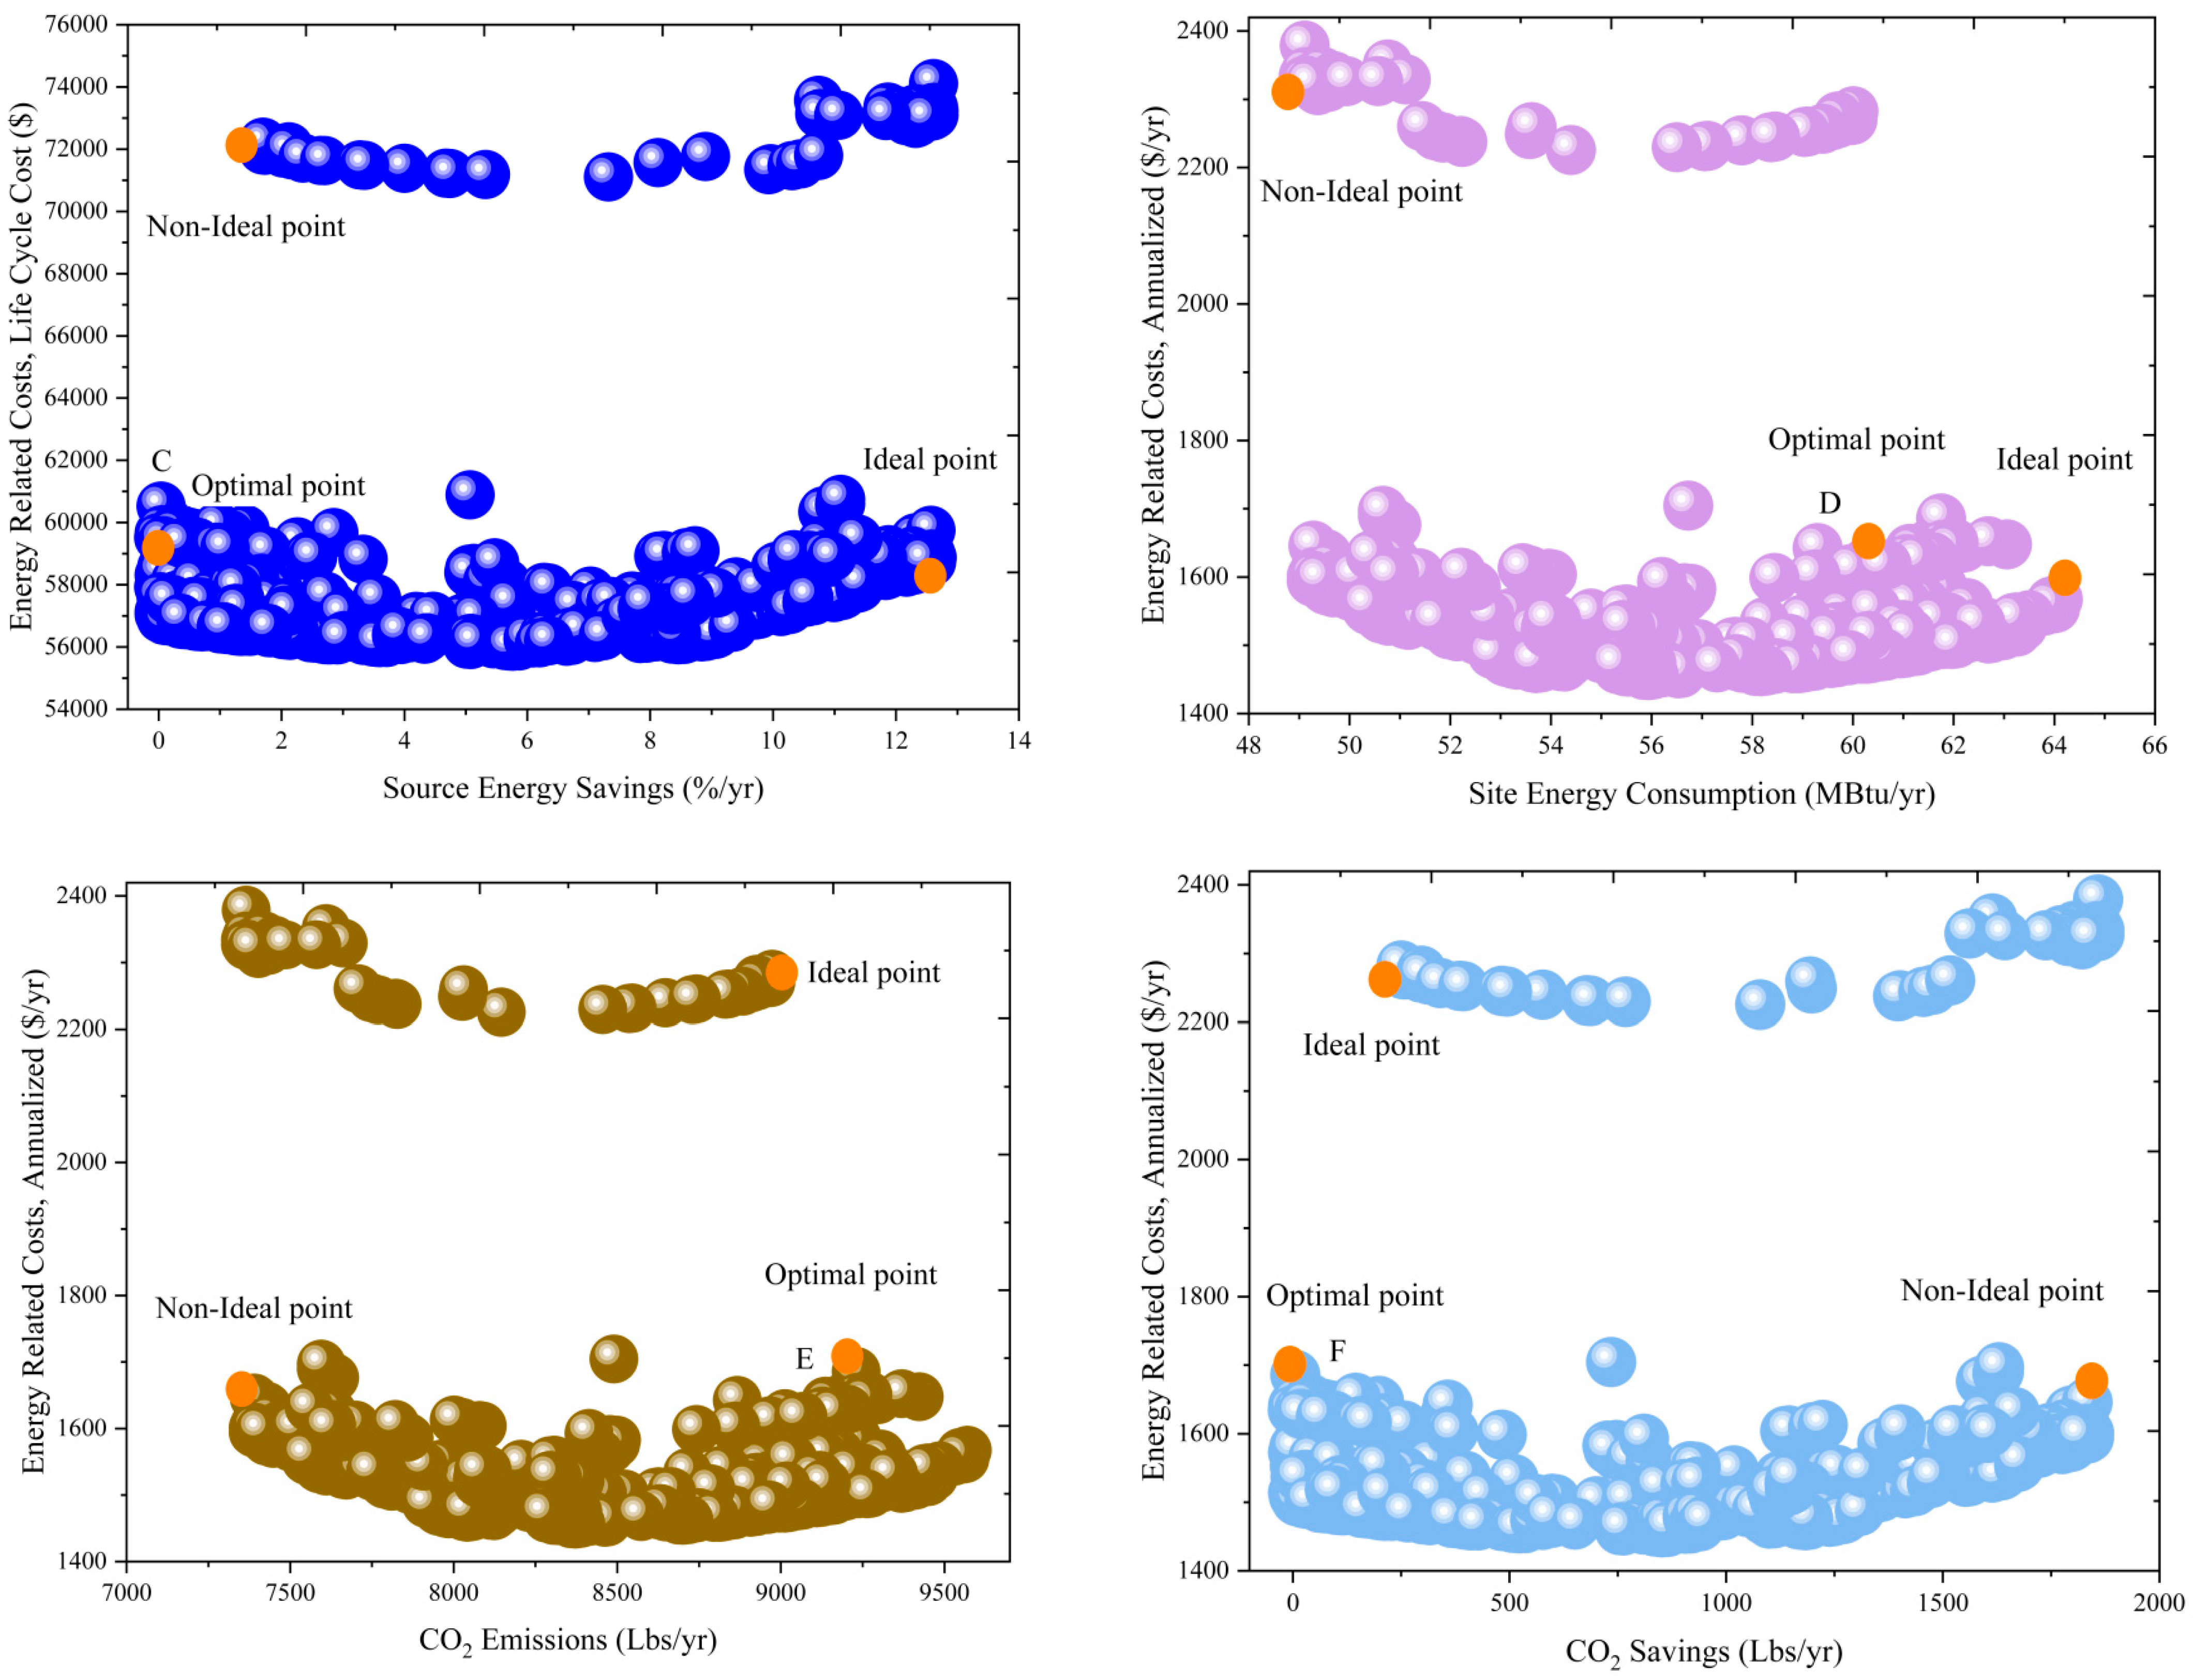
In Figure 15, the cost of energy consumption and the amount of savings in energy consumption can be seen, as well as the amount of emissions and the reduction in CO2 emission for one year in the building. Each point represents a state of building optimization. In this research, the initial point where the cost of energy consumption is maximum is considered as the reference point. Obviously, at this point, the amount of energy saving is considered to be zero. Then, the amount of savings in energy consumption is measured for other modes compared to the reference mode. As can be seen, at the last point, the greatest amount of saving in energy consumption is obtained.
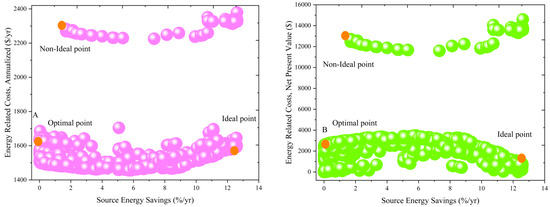

Figure 15.
Annual energy cost for different optimization modes.
In Table 11, the optimized points of the building’s performance have been investigated to find the best consumption conditions, the best economic conditions, and the best environmental conditions. The six optimal points, which are identified in alphabetical order, pursue three common goals, including reducing building energy consumption, reducing carbon dioxide emissions, indicating building energy consumption, and reducing building costs. As the results show, the energy saving rate of the Vancouver residential complex is 0.01%/year, with the amount of USD 1634.06 energy-related costs, annualized.
Table 11.
The most optimal values for saving energy and reducing CO2.
In this optimization, according to the location of the area, the changes in weather conditions, as well as the materials and the size of the materials used, were considered as input conditions. The optimization solutions by BEopt were obtained after analyzing the problem with different iterations, which resulted in lower energy consumption in the residential complex in the city of Vancouver. For this reason, the city of Vancouver was chosen for the final study.
5. Analysis Geothermal System
5.1. System Description
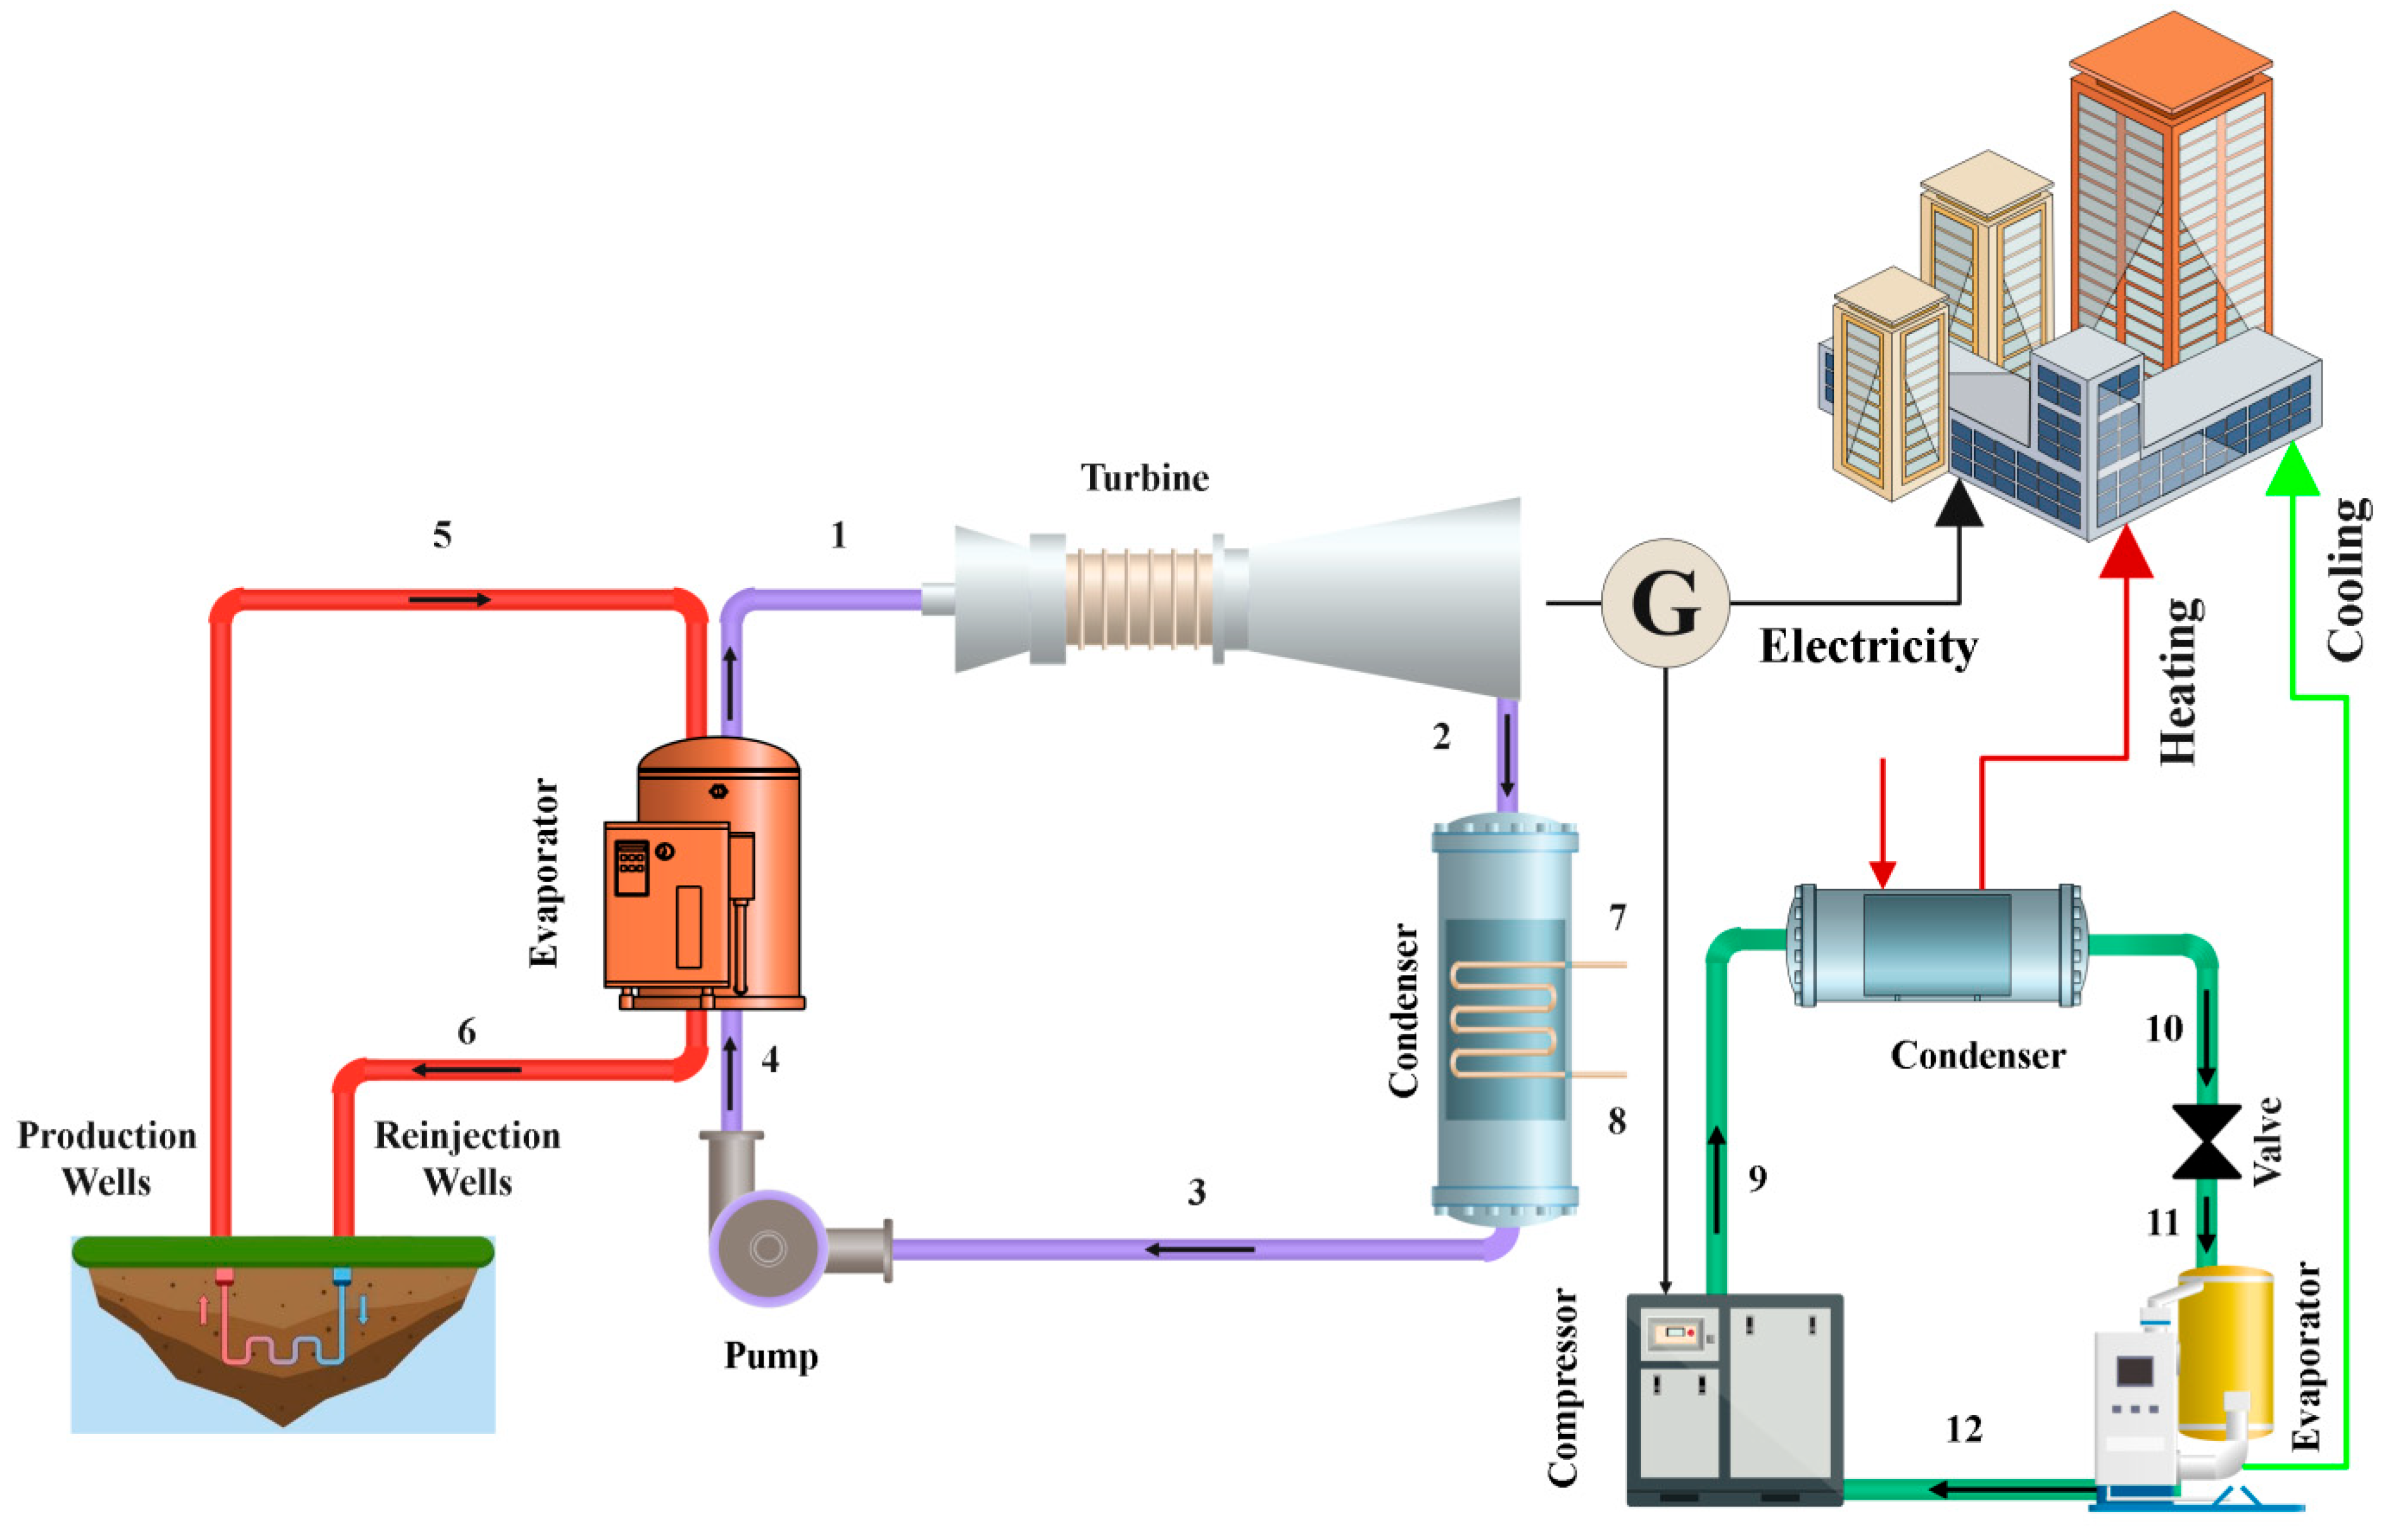
Figure 16 shows the proposed schematic. The system investigated in this research consists of a geothermal system, organic Rankine cycle, and compression chiller for cooling and heating production. Using the geothermal heat source, the thermal energy needed by the evaporator for operation is supplied and then transferred to the turbine to generate power. The temperature of the fluid that this tank injects into the cycle is equal to 180 °C. Also, the fluid mass flow rate is considered to be 1 kg/s. The organic fluid used in the current system is R123. When it enters the evaporator, it reaches the boiling point by absorbing minimal heat from the fluid around the tubes and evaporates, and, as a result, its phase changes from liquid to gas.

Figure 16.
Geothermal system.
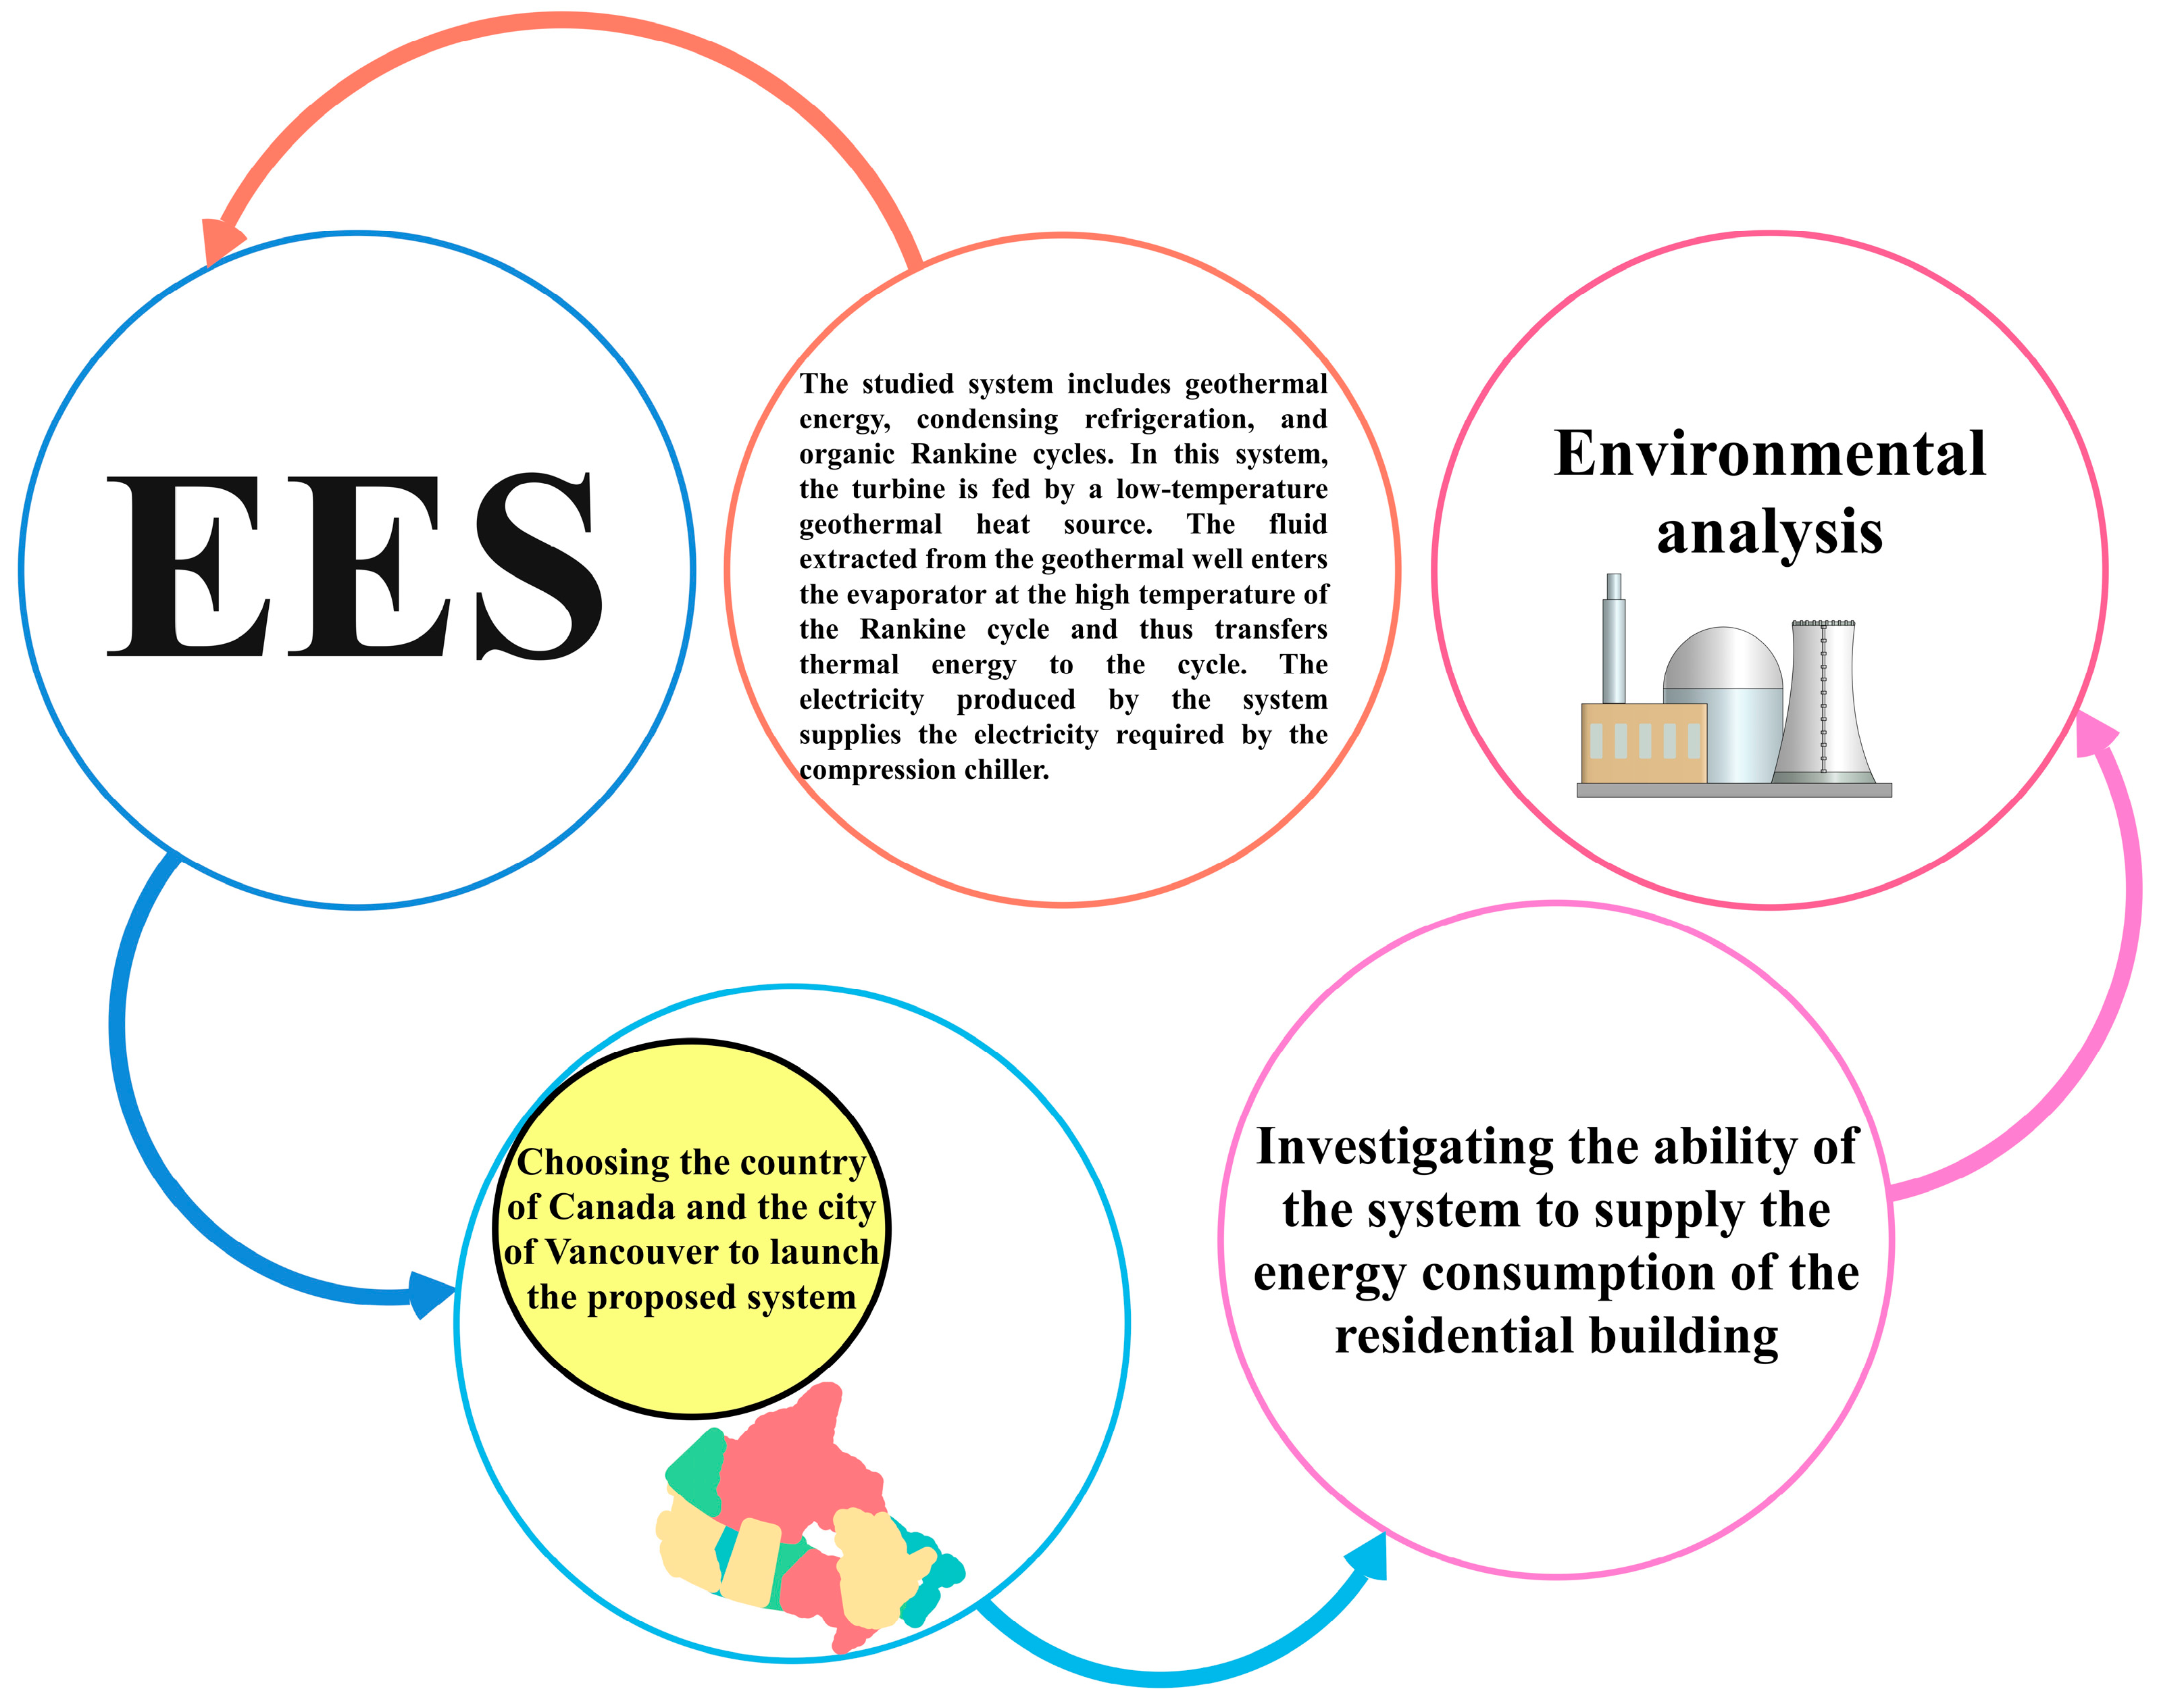
To model the system designed based on a specific framework. The methodology is presented in Figure 17.

Figure 17.
System modeling methodology.
The summary of this method is as follows:
- System modeling is carried out using EES software 10.2.
- Choosing the city of Vancouver in Canada for the study system case study.
- Extraction of weather information for Vancouver from Meteonorm software 8.
- Environmental analysis of the geothermal system.
5.2. System Balance
Mass and energy balance is established for each control volume for thermodynamic analysis of the study system.
The following assumptions are made to simplify the problem:
- The pump is isentropic.
- The turbines are isentropic.
- Steady-state conditions.
- The condenser and evaporator outlet is a saturated liquid [28].
- Changes in kinetic and potential energy are insignificant [29].
Table 12.
Thermodynamic analysis.
5.3. Case Study (Vancouver)
Vancouver is one of the western cities of Canada, located in the southwest of British Columbia. This city is located between the Rang Mountains and the Pacific Ocean. Vancouver has good geothermal potential. In Figure 4, the hourly changes in the ambient temperature during one year in Vancouver are plotted and the effects of these parameters on the performance of the system of multi-energy production are investigated.
Figure 18 shows the hourly changes in the amount of heating produced by the system using a compression chiller concerning changes in weather parameters. An innovative idea in this research is the use of a compression chiller, where the electricity required by the compression chiller is provided by the electricity produced by the system, and the compression chiller reduces system waste by simultaneously producing cooling and heating. Because the compression chiller works with electricity to produce heating, any change in the system’s production power will also affect the production of heating.
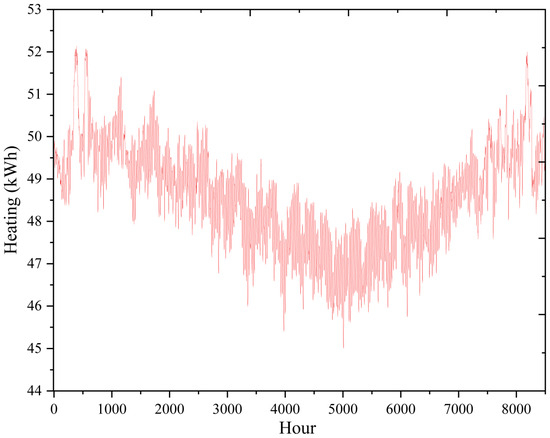
Figure 18.
System heating production changes throughout the year.
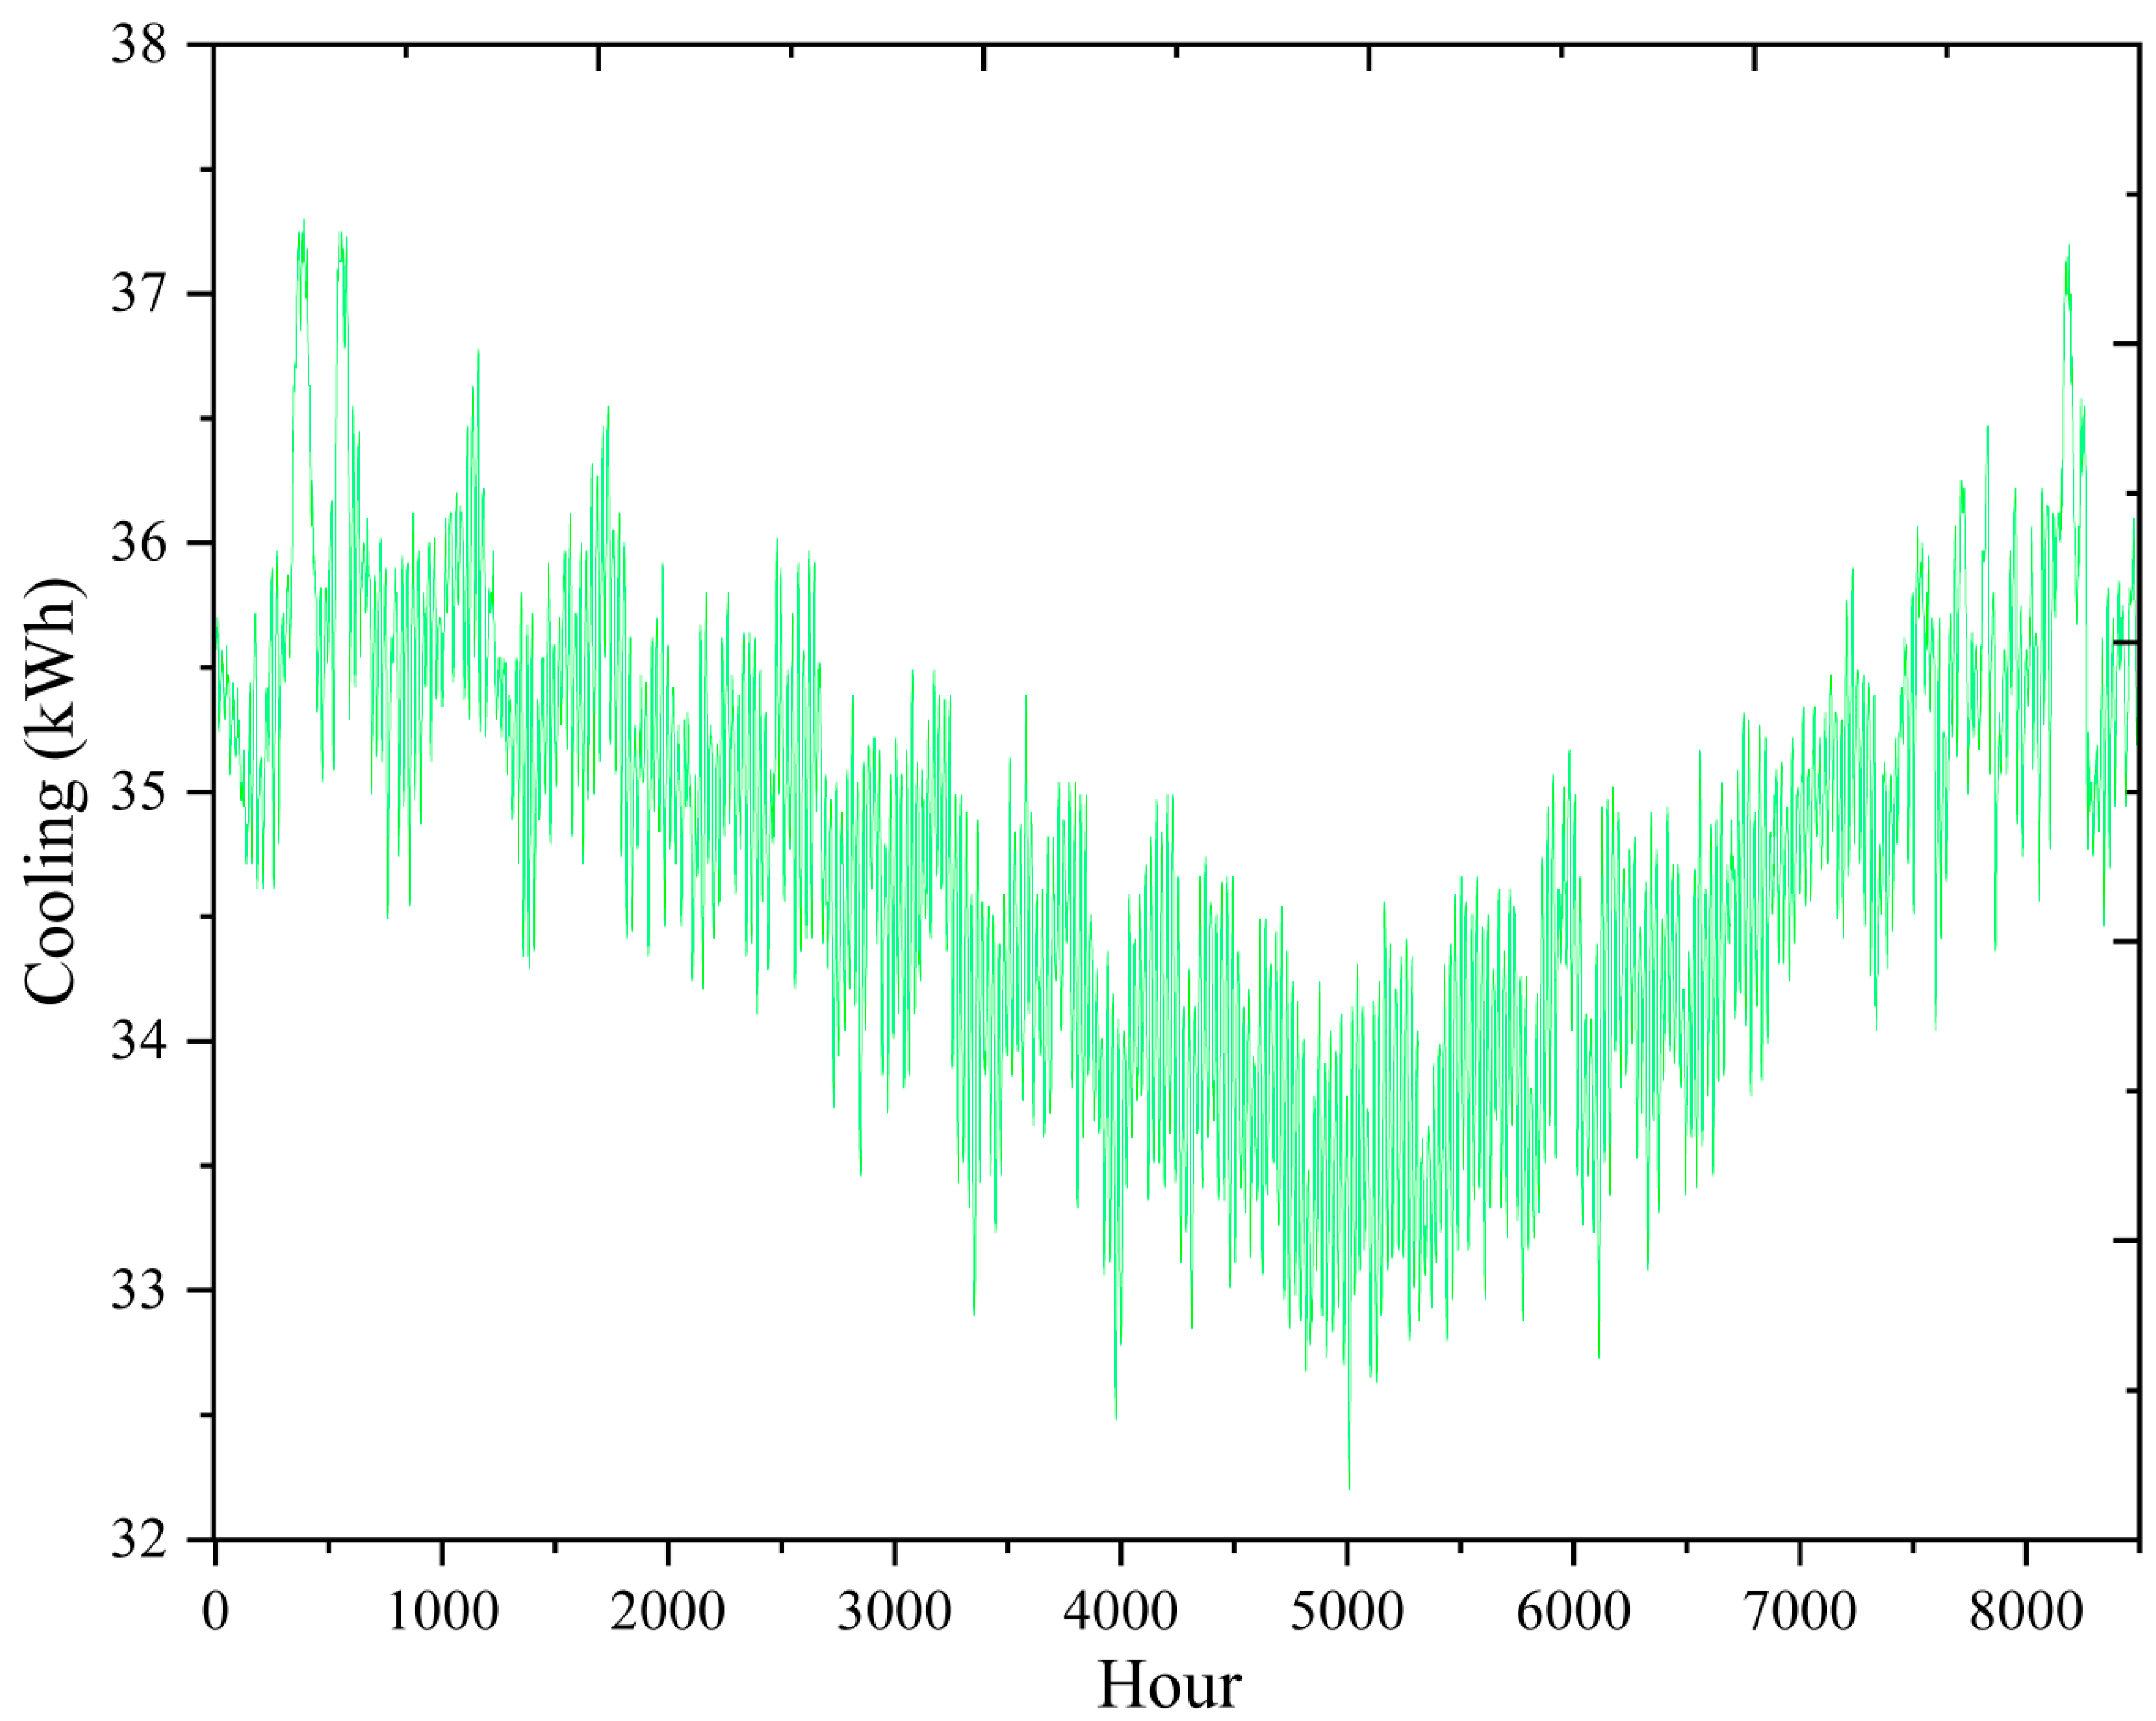
Figure 19 shows the hourly changes in the amount of cooling produced by the system using the compression chiller unit in response to the changes in weather parameters. An innovative idea in this research is to use the production power of the studied geothermal system to supply the electricity required by the compression chiller and produce cooling. For this reason, the changes in the amount of cooling production are the same as the changes in the electricity production rate of the system.

Figure 19.
System production cooling changes throughout the year.
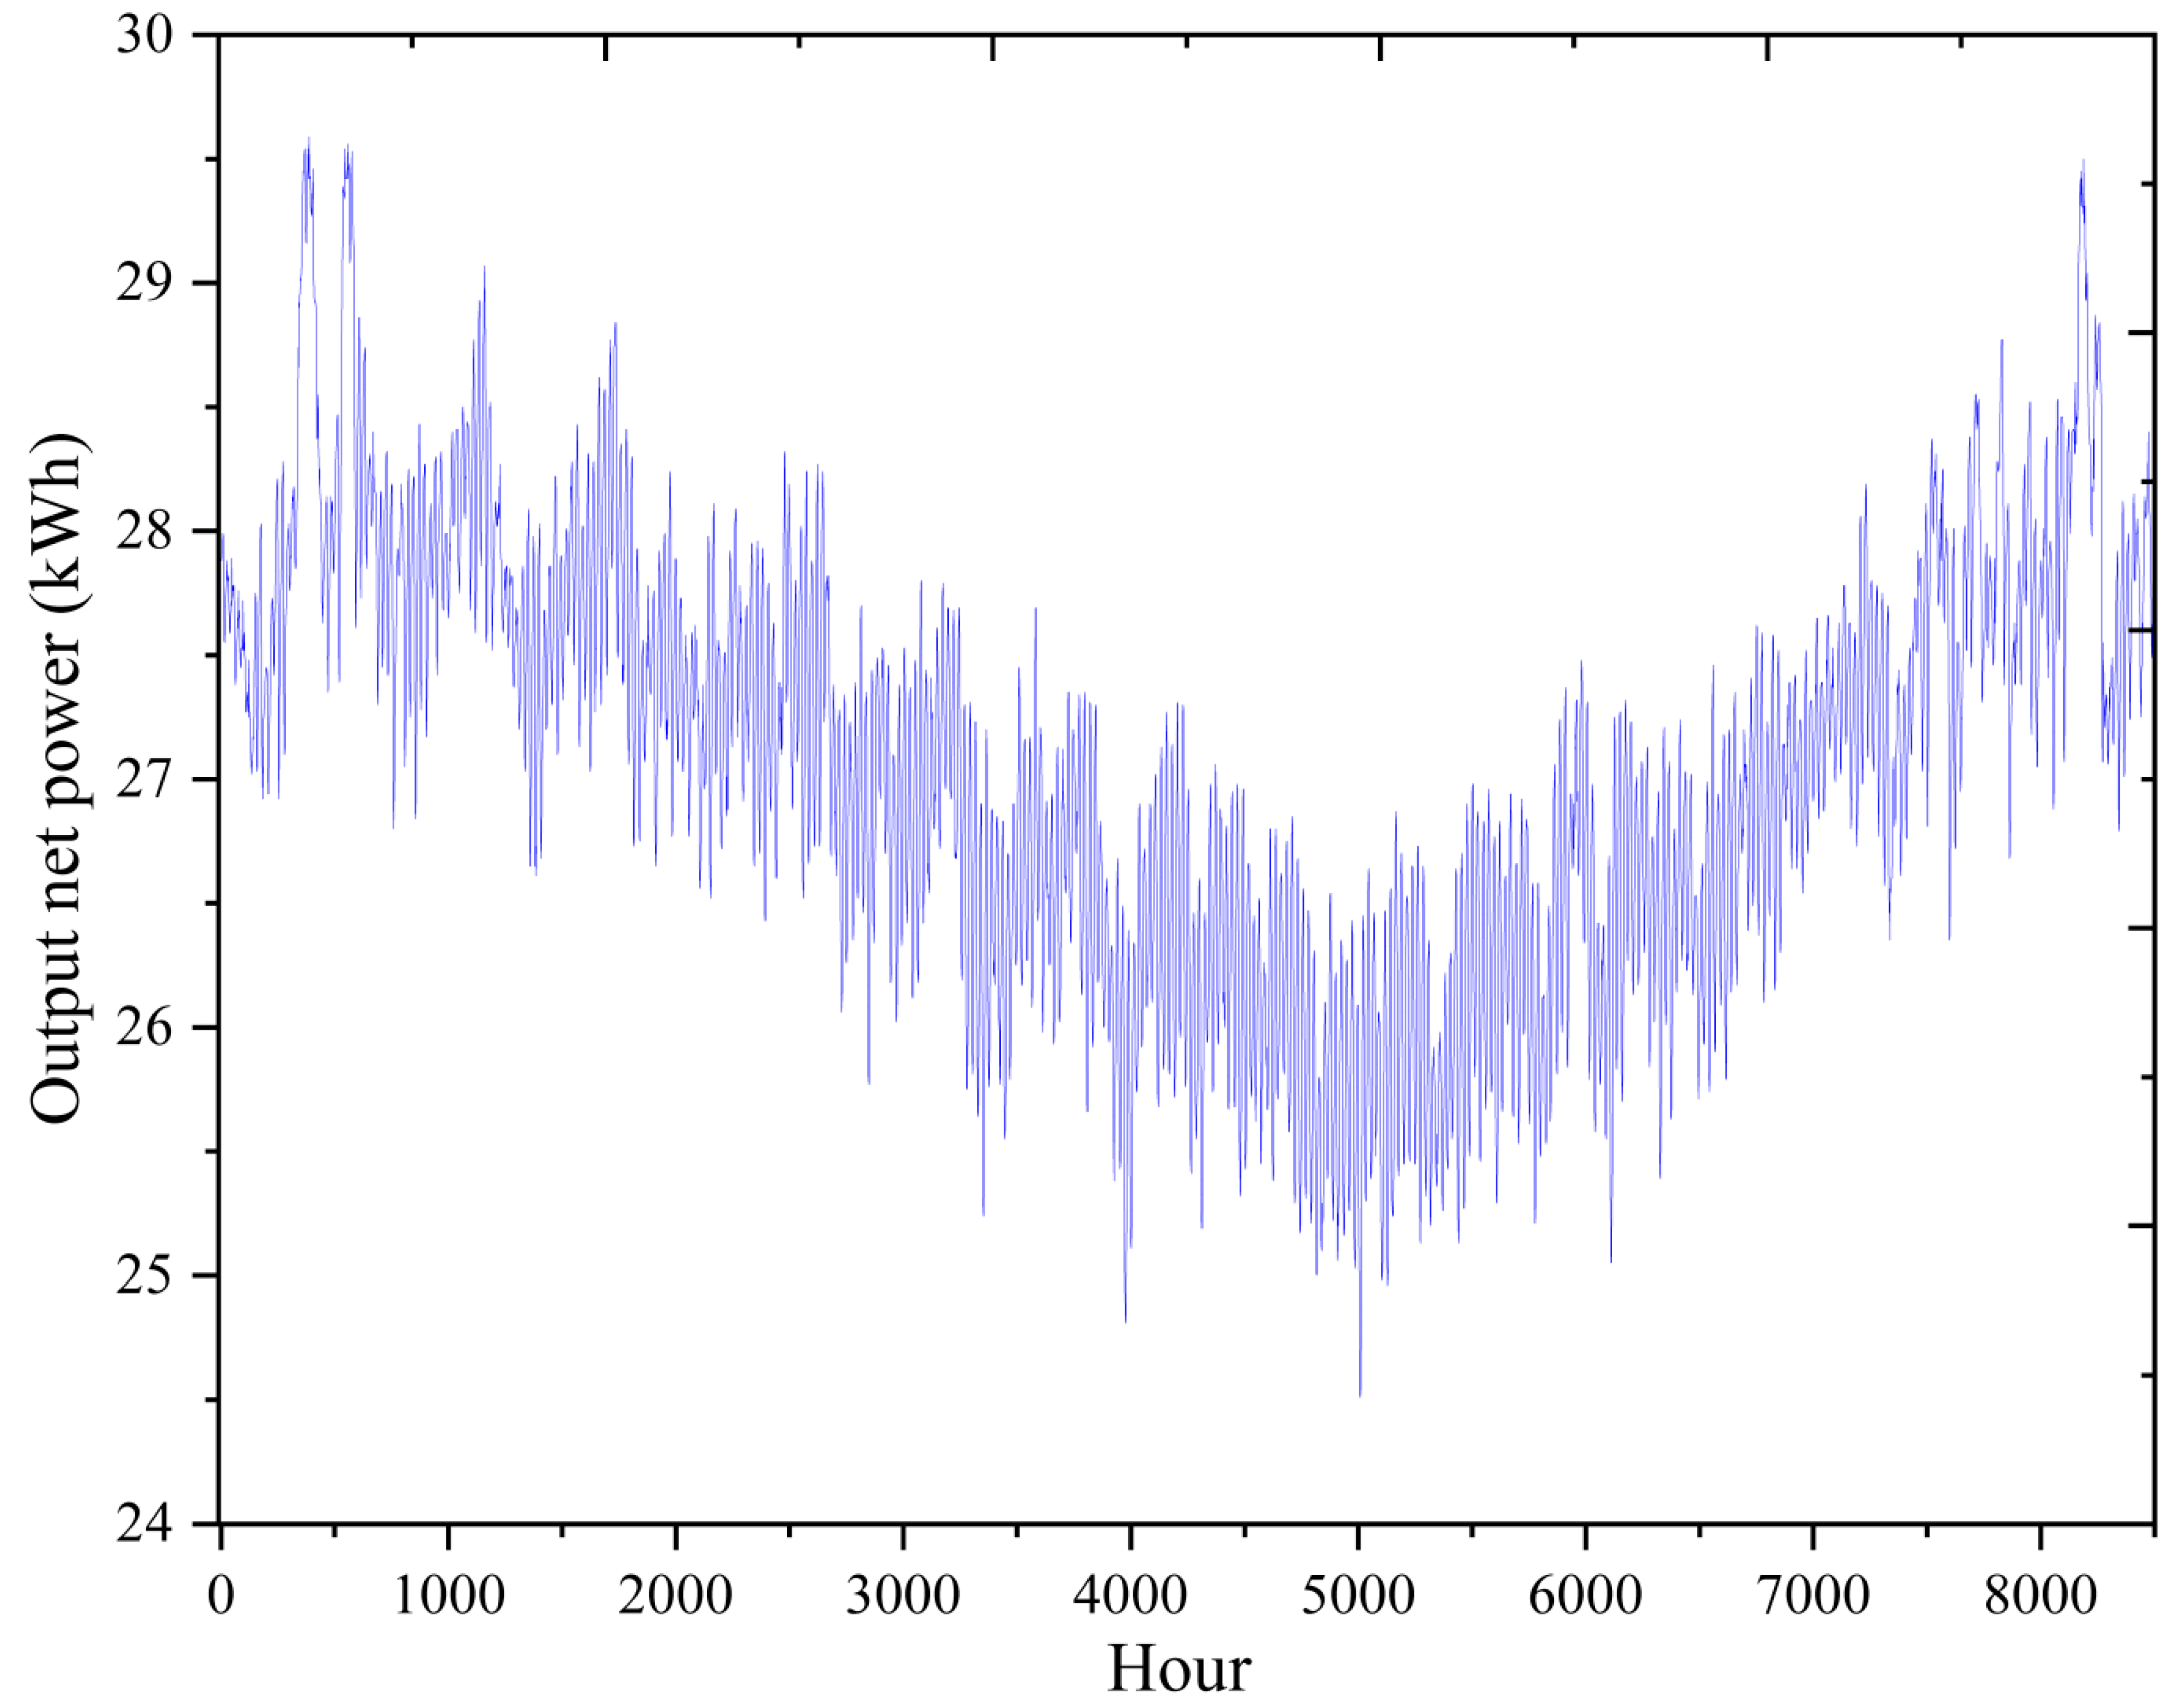
In Figure 20, the changes in the net production power of the entire study system are shown hourly in response to the changes in weather parameters. As the ambient temperature increases, the performance of the organic Rankine cycle decreases, and the best performance of the system is achieved in winter and spring.
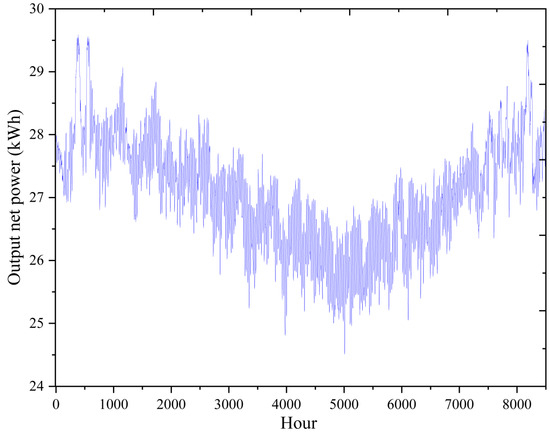
Figure 20.
System production power changes throughout the year.
6. Analysis of the Performance of the System in Providing the Energy Consumption of the Building
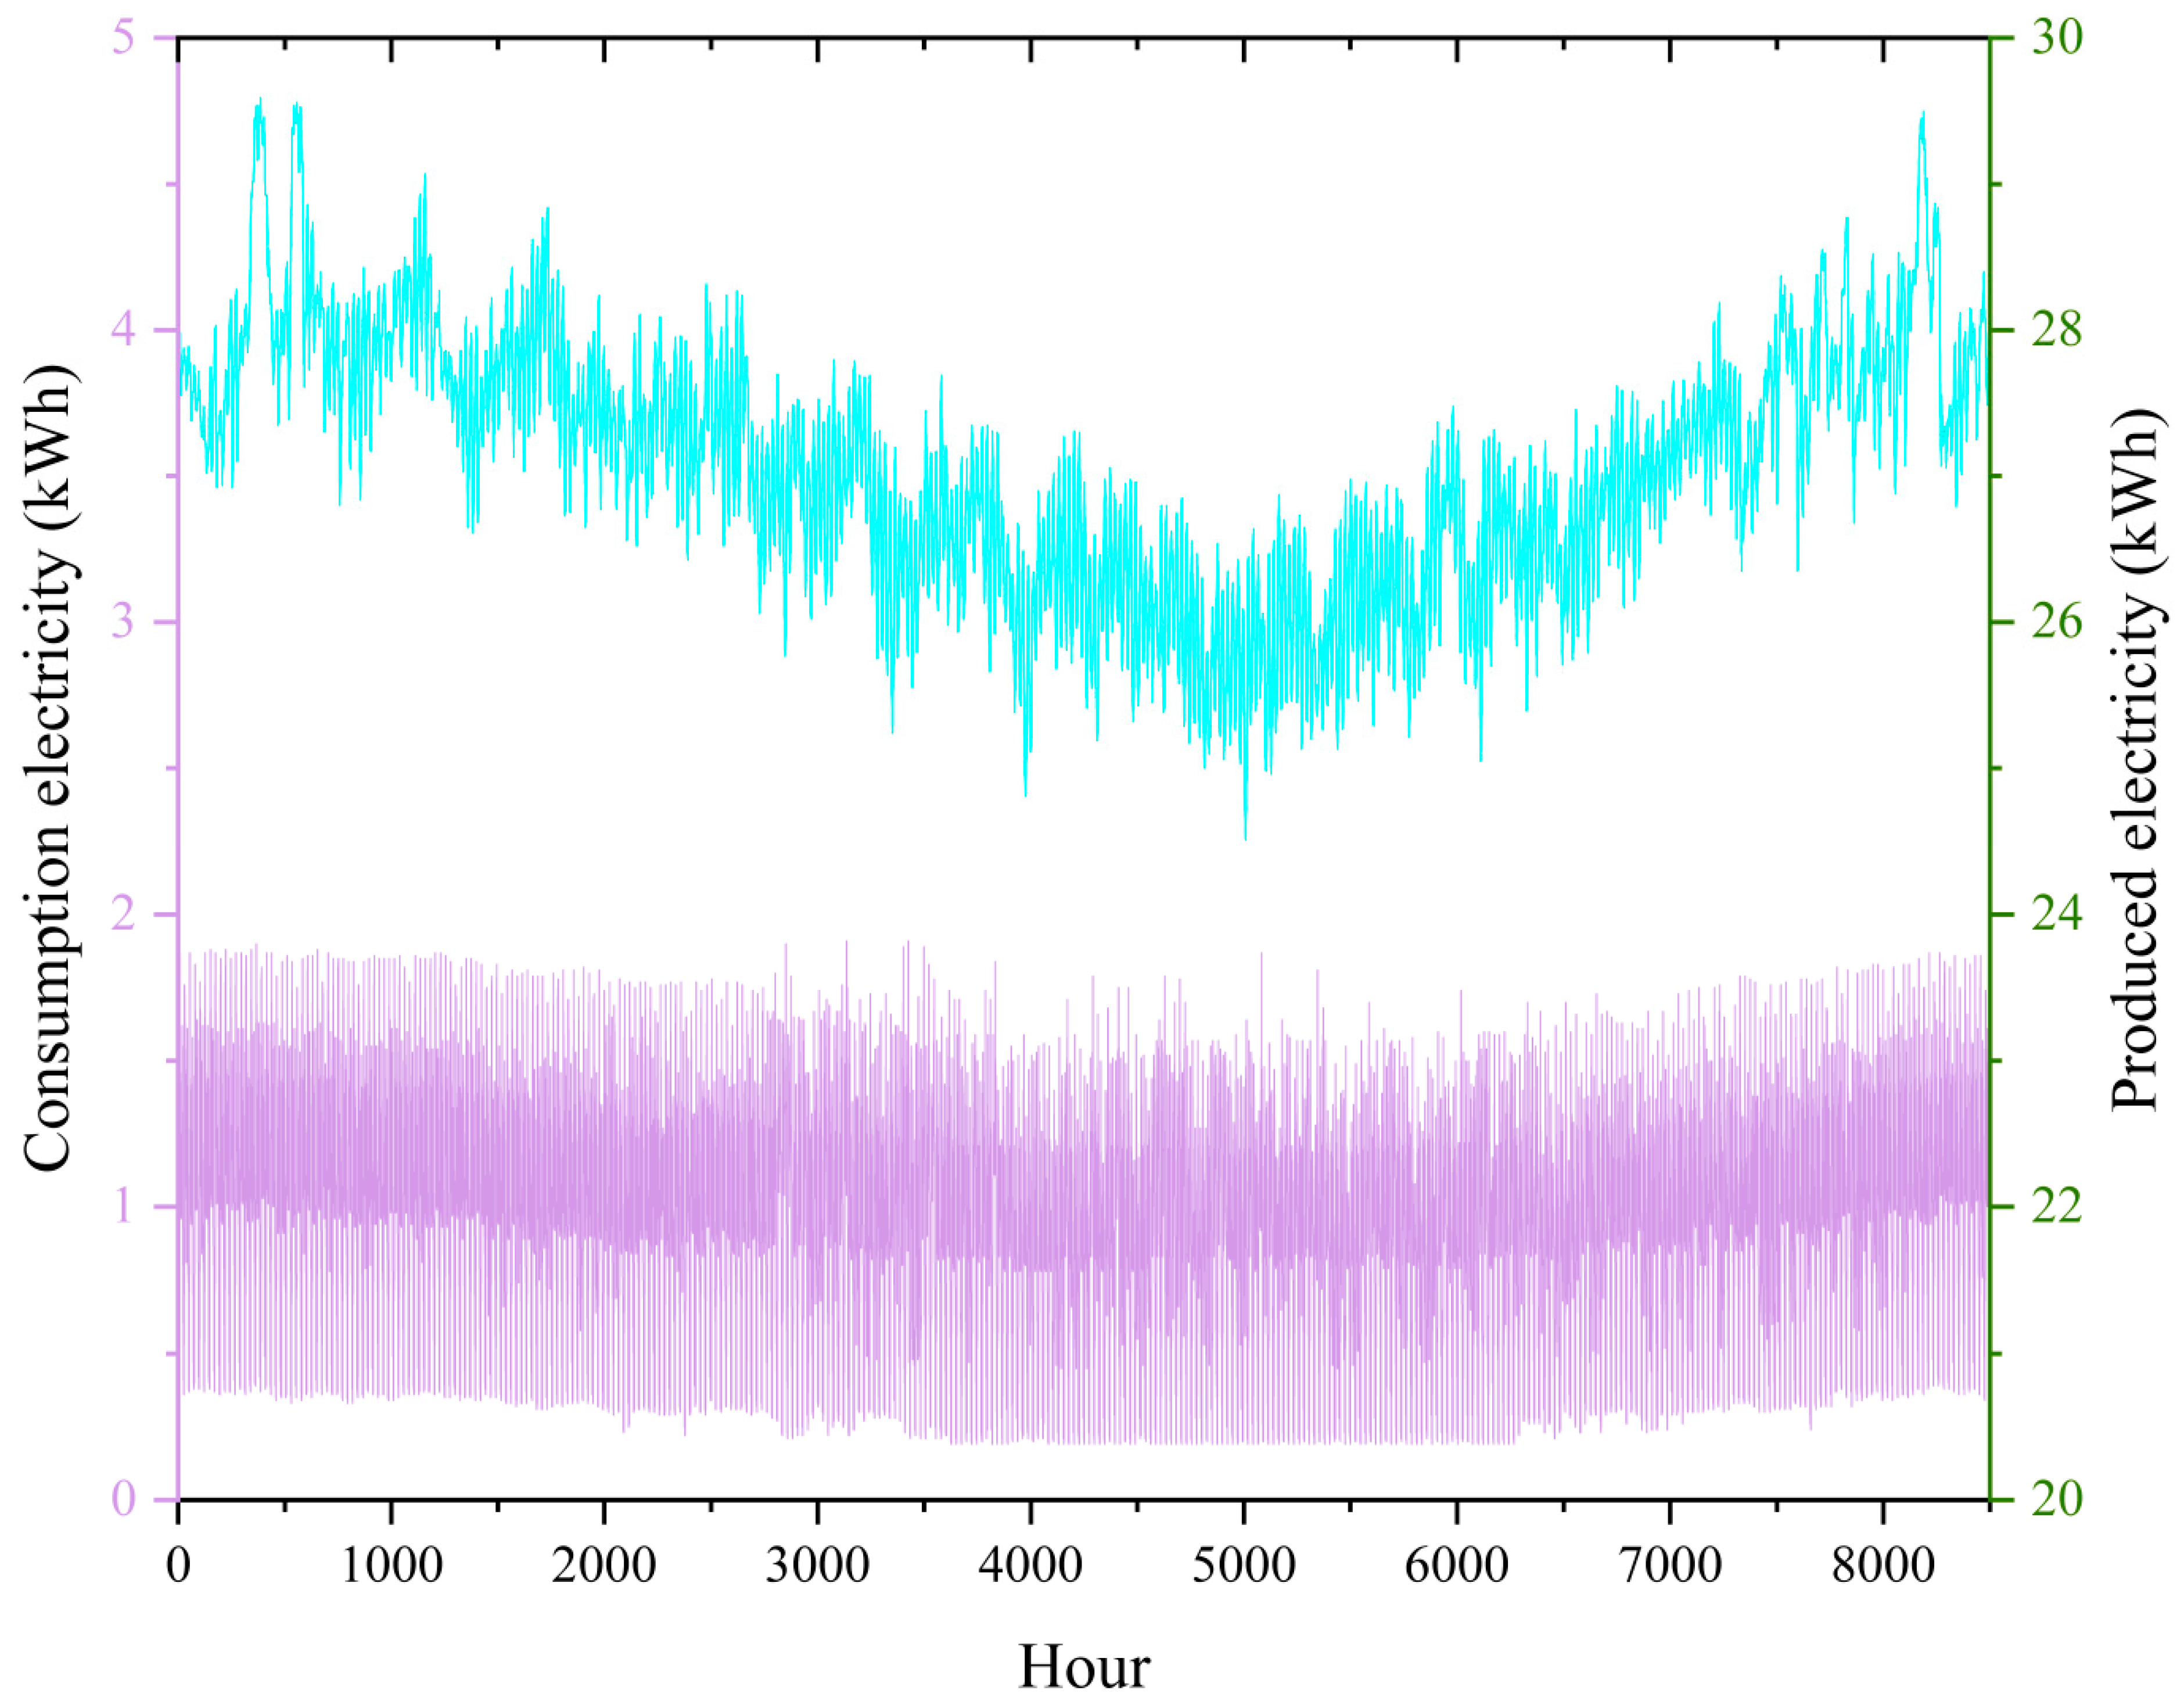
Figure 21 compares the amount of electricity consumed by the simulated buildings in the city of Vancouver and the amount of electricity produced by the study system in relation to the weather changes in the city of Vancouver on an hourly basis. The geothermal system can supply the electricity needed by the building, and, in addition, the amount of surplus electricity produced throughout the year can be sold to the national electricity grid and used to reduce system costs.

Figure 21.
Comparison of consumed electricity and produced electricity.
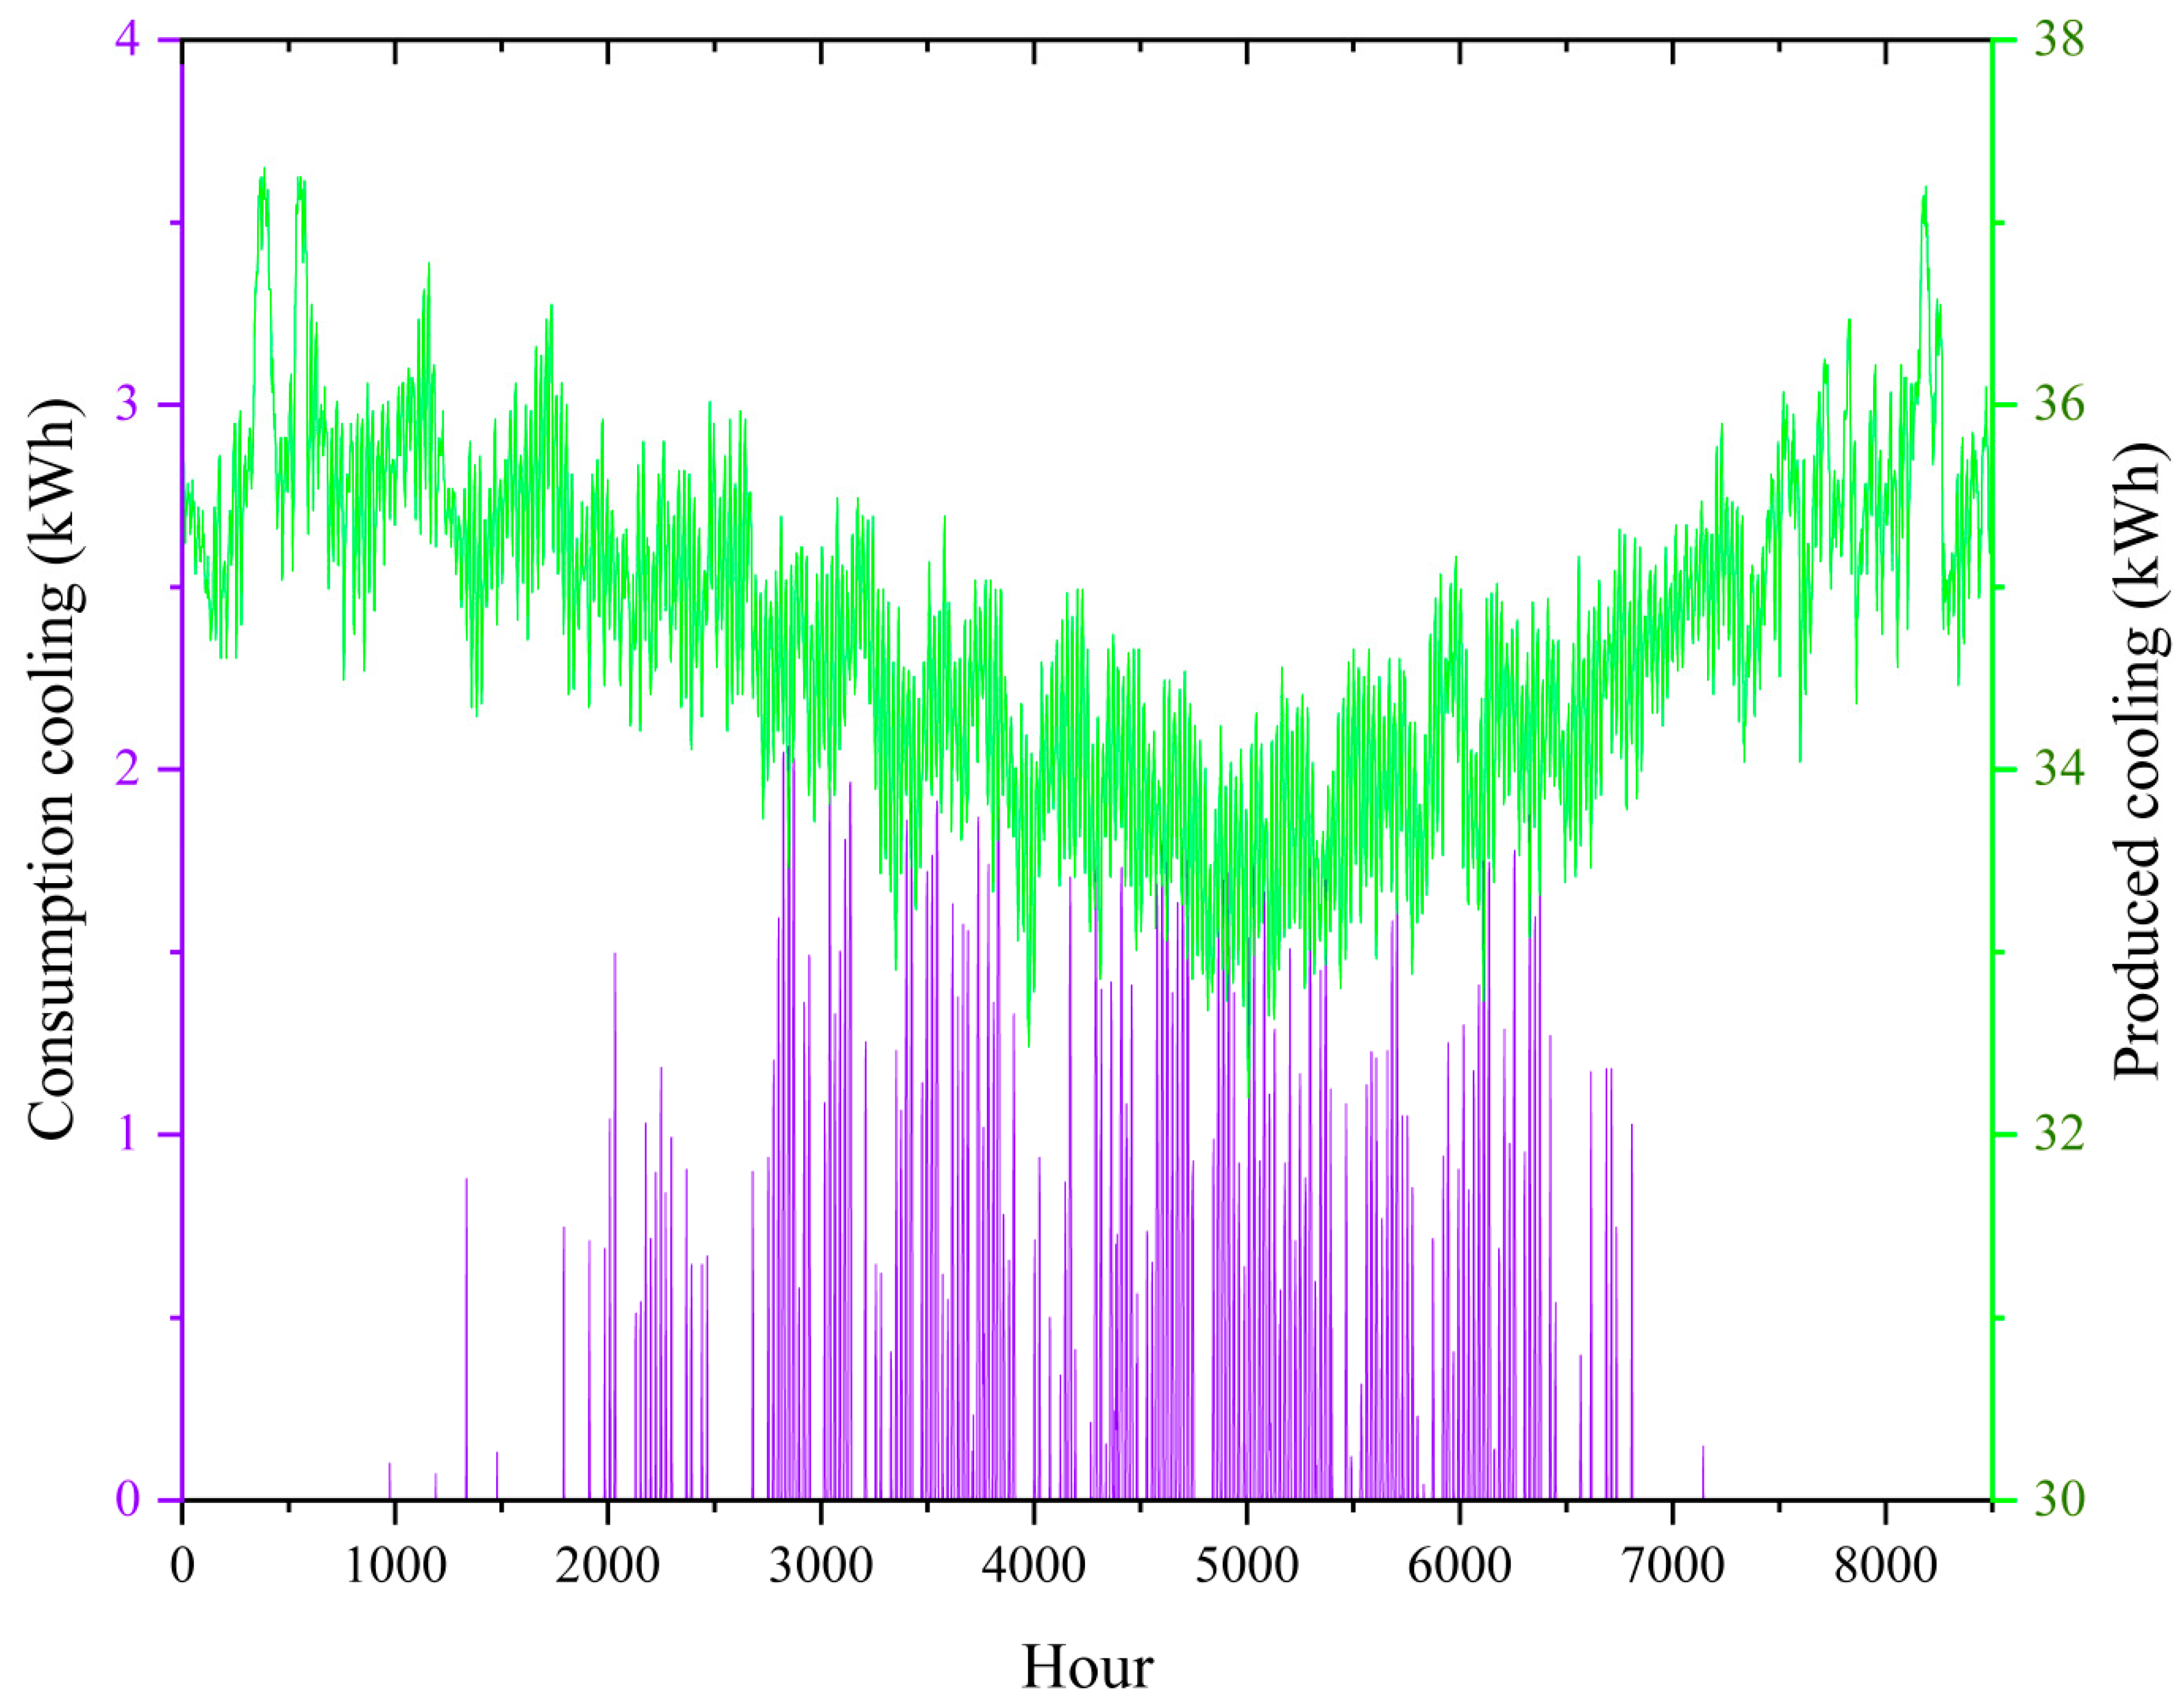
Figure 22 compares the amount of cooling energy consumed by the simulated buildings in Vancouver and the amount of cooling produced by the system in response to the weather changes in Vancouver on an hourly basis. The geothermal system can provide the required cooling of the residential complex, and, in addition, it is possible to store the amount of surplus production cooling throughout the year and use it for other purposes.

Figure 22.
Comparison of cooling energy consumption and production cooling.
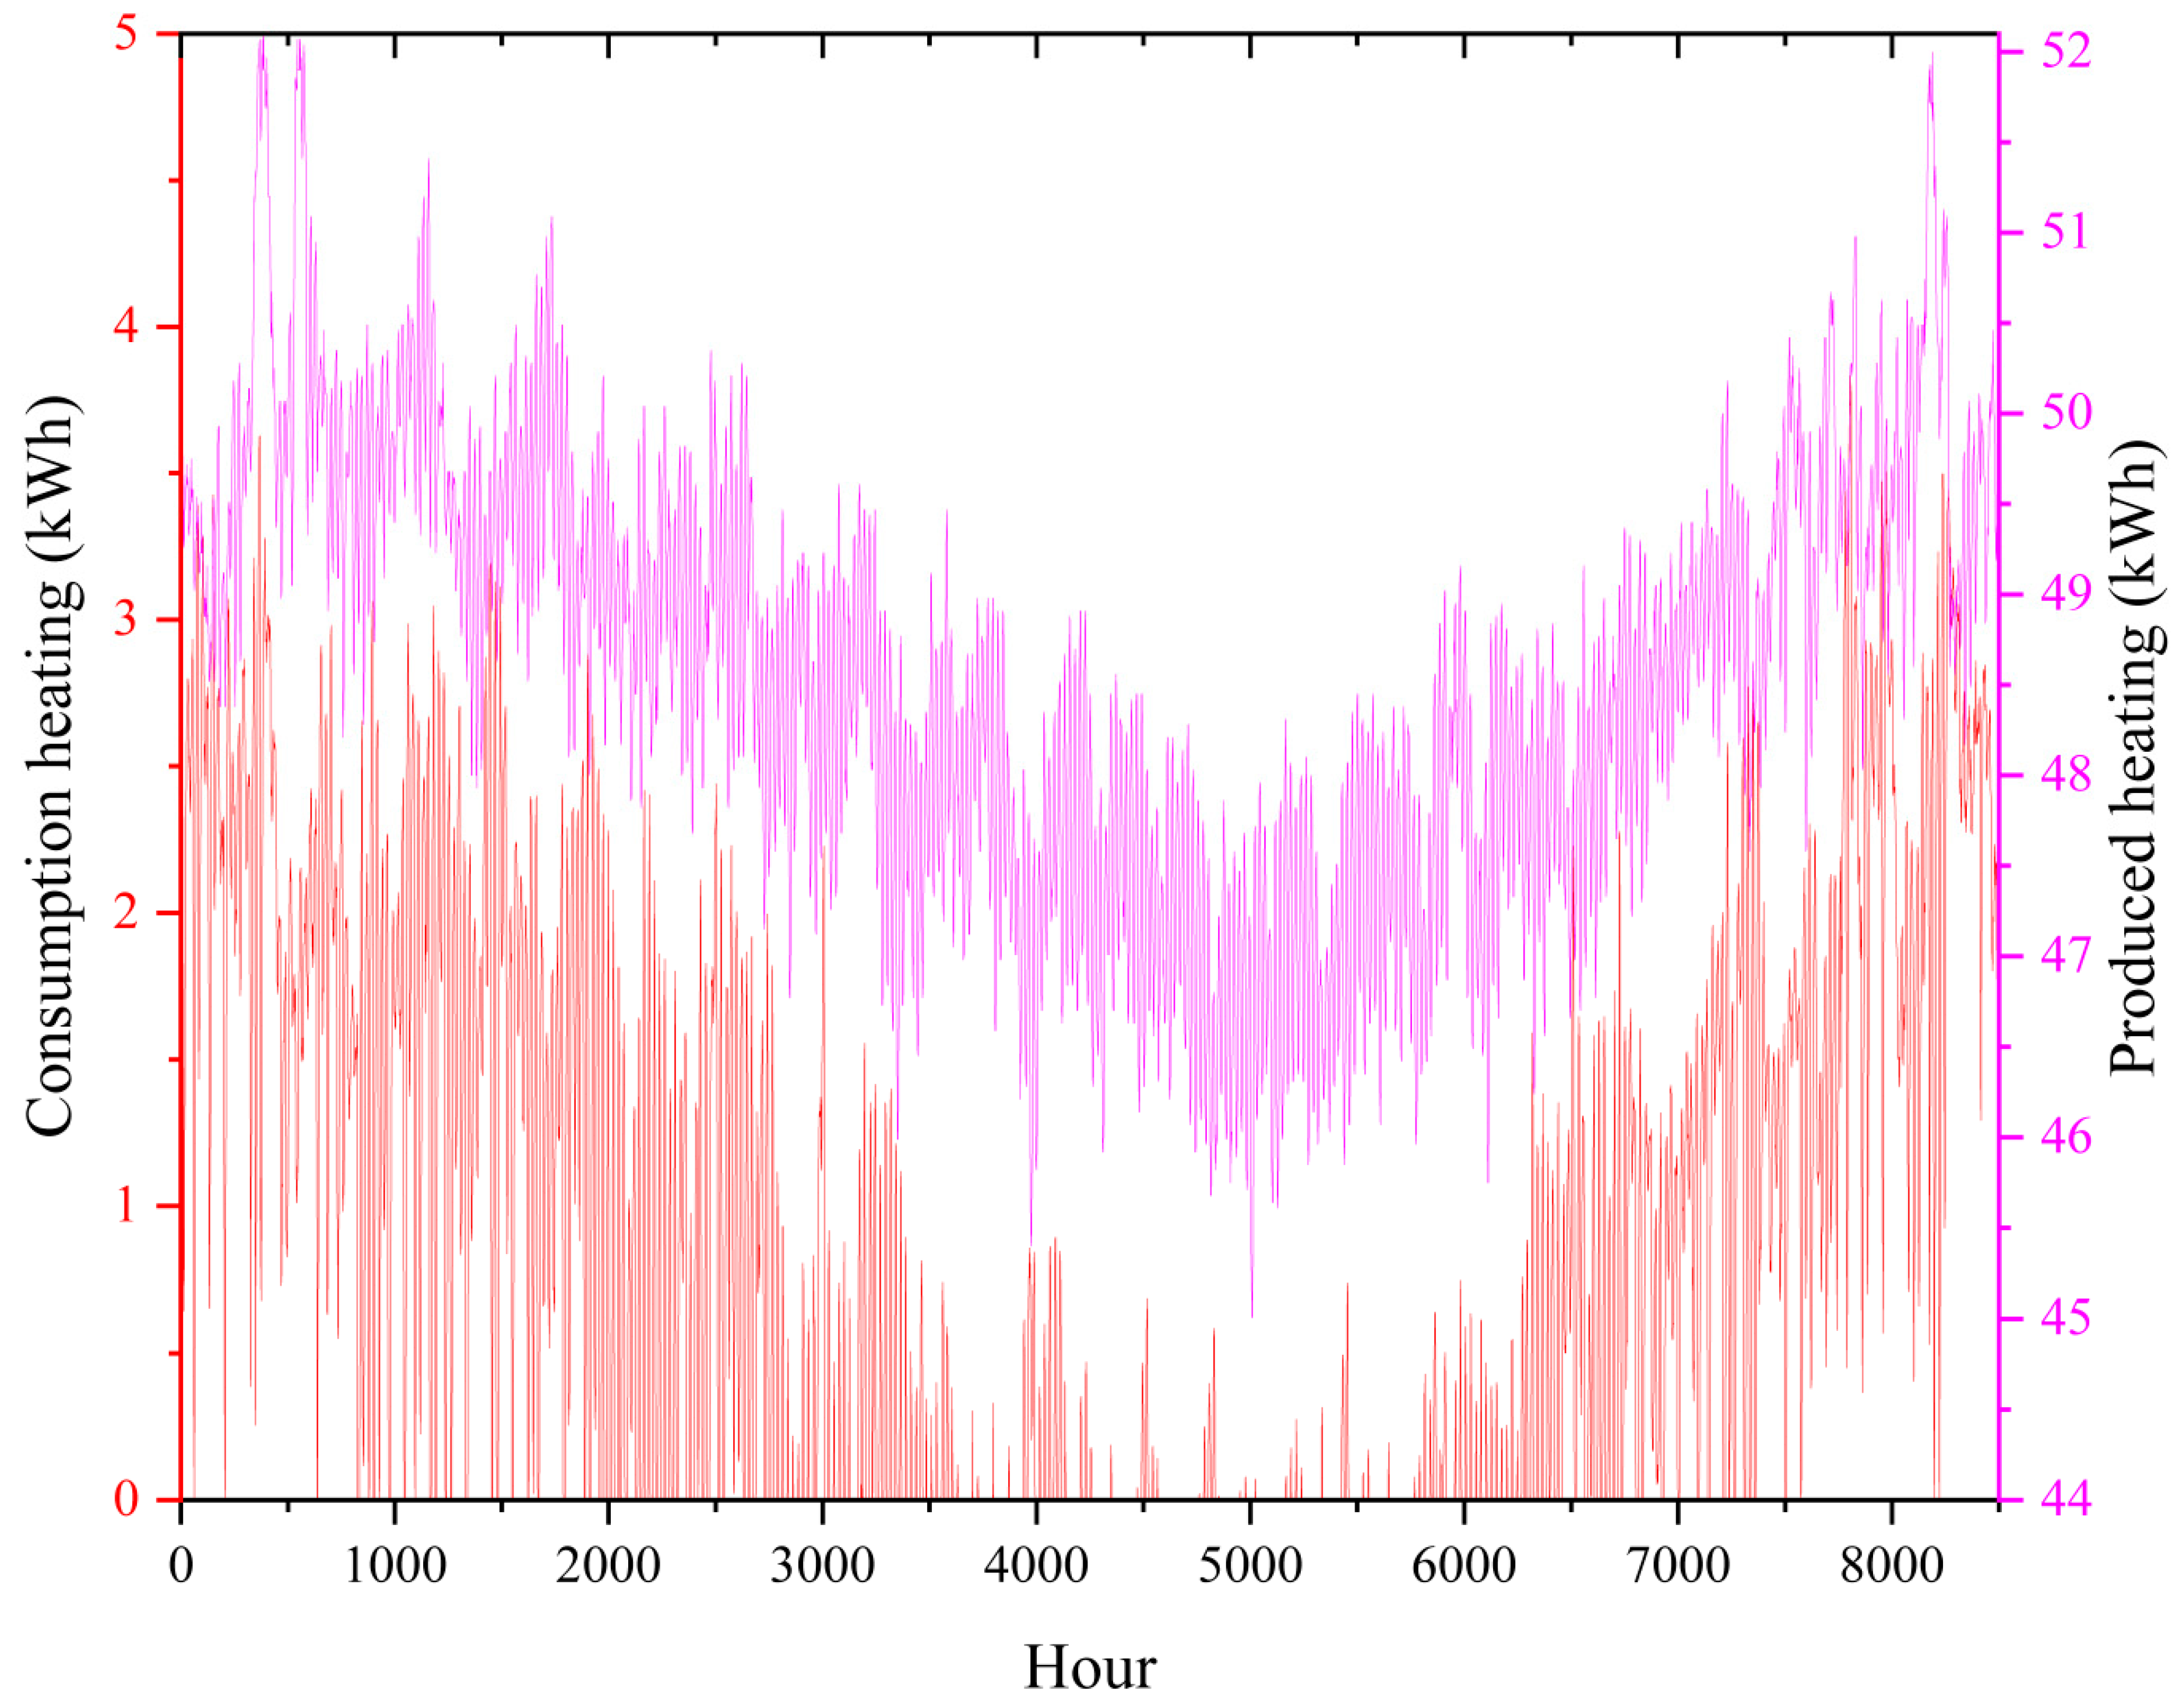
Figure 23 compares the heating energy consumption of the simulated residential complex in the city of Vancouver and the amount of heating produced by the system with the climate changes in the city of Vancouver on an hourly basis. As the results show, the proposed geothermal system can provide the required heating for the building.
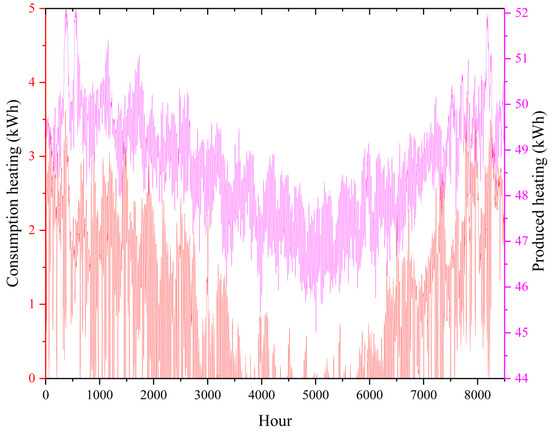
Figure 23.
Comparison of consumed heating energy and heating production.
Finally, in Table 13, the energy stored in the study geothermal system is calculated throughout the year, which is more than the needs of the Vancouver residential complex.
Table 13.
Stored energy.
7. Conclusions
This research discussed the optimization of energy consumption of zero-energy buildings using PCMs in the two study cities of Vancouver and Dubai. A multi-generation geothermal system was proposed to supply energy to the building. In this research, PCMs are used to optimize the energy consumption of buildings in two study cities.
The summary of the results is as follows:
- The consumption of electricity, heating, and cooling of the residential complex during the year in the city of Vancouver is 8493.55, 7899.1, and 1083.97 kWh, respectively.
- The consumption of electricity, heating, and cooling of the buildings during the year in Dubai is 9572.1, 8.99, and 18,845.44 kWh, respectively.
- By optimizing the energy consumption of buildings in Vancouver and Dubai, CO2 emissions can be reduced by 2129.7 and 2773.2 kg/year, respectively.
- The city of Vancouver, Canada, was chosen as the most suitable city for the study due to having more suitable weather conditions, reducing building energy consumption and carbon dioxide emissions.
- The multiple production system was proposed to meet the energy consumption of a six-unit zero-energy residential building with 120 m2 and two bedrooms in Vancouver, Canada.
- The study system can produce 237,364.6 kWh of electricity, 425,959.4 kWh of heating, and 304,732.8 kWh of cooling in one year.
- The results showed that 229,465.5 kWh of electricity was sold to the electricity distribution network during the year and that 417,465.8 kWh of heating and 303,648.8 kWh of cooling were saved throughout the year to compensate for the costs of the system.
Author Contributions
Conceptualization, E.A., A.K. and S.H.; methodology, E.A., A.K., S.H. and D.A.G.; software, E.A. and A.K.; validation, E.A. and A.K.; formal analysis, E.A., A.K. and S.H.; investigation, E.A., A.K. and S.H.; resources, E.A., A.K., S.H. and D.A.G.; data curation, E.A. and A.K.; writing—original draft preparation, E.A., A.K. and S.H.; writing—review and editing, E.A., A.K., S.H. and D.A.G.; visualization, E.A., A.K., S.H. and D.A.G.; supervision, E.A., S.H. and D.A.G.; project administration, E.A., A.K. and S.H.; All authors have read and agreed to the published version of the manuscript.
Funding
This research received no external funding.
Data Availability Statement
All data used to support the findings of this study are included in the article.
Conflicts of Interest
The authors declare no conflict of interest.
References
- Jaysawal, R.K.; Chakraborty, S.; Elangovan, D.; Padmanaban, S. Concept of net zero energy buildings (NZEB)—A literature review. Clean. Eng. Technol. 2022, 11, 100582. [Google Scholar] [CrossRef]
- Lo, K.-Y.; Yeoh, J.H.; Hsieh, I.-Y.L. Towards Nearly Zero-Energy Buildings: Smart Energy Management of Vehicle-to-Building (V2B) Strategy and Renewable Energy Sources. Sustain. Cities Soc. 2023, 99, 104941. [Google Scholar] [CrossRef]
- Lyu, W.; Wang, Z.; Li, X.; Yu, Z.; Yang, Y.; Li, J.; Wang, Z.; Sun, X.; Sun, G.; Han, L.; et al. Energy-efficient fresh air system with pressure-independent dampers for nearly zero energy buildings. Appl. Therm. Eng. 2023, 234, 121240. [Google Scholar] [CrossRef]
- Mohammed, B.U.; Wiysahnyuy, Y.S.; Ashraf, N.; Mempouo, B.; Mengata, G.M. Pathways for efficient transition into net zero energy buildings (nZEB) in Sub-Sahara Africa. Case study: Cameroon, Senegal, and Côte d’Ivoire. Energy Build. 2023, 296, 113422. [Google Scholar] [CrossRef]
- Shirinbakhsh, M.; Harvey, L.D. Feasibility of achieving net-zero energy performance in high-rise buildings using solar energy. Energy Built Environ. 2023; in press. [Google Scholar] [CrossRef]
- Amini, M.H.M.; Temiz, A.; Zuraik, M.A.; Hermawan, A.; Sulaiman, N.S. Shape stabilized phase change material by pine wood absorption. Mater. Today Proc. 2023; in press. [Google Scholar]
- Mohammed, M.A.; Ali, B.M.; Yassin, K.F.; Ali, O.M.; Alomar, O.R. Comparative study of different phase change materials on the thermal performance of photovoltaic cells in Iraq’s climate conditions. Energy Rep. 2024, 11, 18–27. [Google Scholar] [CrossRef]
- Elenga, R.G.; Zhu, L.; Defilla, S. Performance evaluation of different building envelopes integrated with phase change materials in tropical climates. Energy Built Environ. 2023; in press. [Google Scholar] [CrossRef]
- Paul, J.; Jacob, J.; Pandey, A.; Vaka, M.; Samykano, M.; Kadirgama, K.; Rahim, N.A.; Selvaraj, J. Meta data analysis on building thermal management using phase change materials. J. Energy Storage 2024, 76, 109760. [Google Scholar] [CrossRef]
- Tan, Q.; Liu, H.; Shi, Y.; Zhang, M.; Yu, B.; Zhang, Y. Lauric acid/stearic acid/nano-particles composite phase change materials for energy storage in buildings. J. Energy Storage 2024, 76, 109664. [Google Scholar] [CrossRef]
- Vega, M.; Marín, P.E.; Ushak, S.; Shire, S. Research trends and gaps in experimental applications of phase change materials integrated in buildings. J. Energy Storage 2024, 75, 109746. [Google Scholar] [CrossRef]
- Zhan, H.; Mahyuddin, N.; Sulaiman, R.; Khayatian, F. Phase change material (PCM) integrations into buildings in hot climates with simulation access for energy performance and thermal comfort: A review. Constr. Build. Mater. 2023, 397, 132312. [Google Scholar] [CrossRef]
- Sharma, R.K.; Kumar, A.; Rakshit, D. A phase change material (PCM) based novel retrofitting approach in the air conditioning system to reduce building energy demand. Appl. Therm. Eng. 2024, 238, 121872. [Google Scholar] [CrossRef]
- Assareh, E.; Riaz, A.; Ahmadinejad, M.; Hoseinzadeh, S.; Abdehvand, M.Z.; Keykhah, S.; Jafarinejad, T.; Moltames, R.; Lee, M. Enhancing solar thermal collector systems for hot water production through machine learning-driven multi-objective optimization with phase change material (PCM). J. Energy Storage 2023, 73, 108990. [Google Scholar] [CrossRef]
- Abbassi, Y.; Baniasadi, E.; Ahmadikia, H. Transient energy storage in phase change materials, development and simulation of a new TRNSYS component. J. Build. Eng. 2022, 50, 104188. [Google Scholar] [CrossRef]
- Ebrahimi-Moghadam, A.; Ildarabadi, P.; Aliakbari, K.; Arabkoohsar, A.; Fadaee, F. Performance analysis of light shelves in providing visual and thermal comfort and energy savings in residential buildings. J. Braz. Soc. Mech. Sci. Eng. 2020, 42, 484. [Google Scholar] [CrossRef]
- Behzadi, A.; Arabkoohsar, A. Feasibility study of a smart building energy system comprising solar PV/T panels and a heat storage unit. Energy 2020, 210, 118528. [Google Scholar] [CrossRef]
- Arabkoohsar, A.; Behzadi, A.; Alsagri, A.S. Techno-economic analysis and multi-objective optimization of a novel solar-based building energy system; An effort to reach the true meaning of zero-energy buildings. Energy Convers. Manag. 2021, 232, 113858. [Google Scholar] [CrossRef]
- Ang, Y.Q.; Polly, A.; Kulkarni, A.; Chambi, G.B.; Hernandez, M.; Haji, M.N. Multi-objective optimization of hybrid renewable energy systems with urban building energy modeling for a prototypical coastal community. Renew. Energy 2022, 201, 72–84. [Google Scholar] [CrossRef]
- Lü, X.; Lu, T.; Karirinne, S.; Mäkiranta, A.; Clements-Croome, D. Renewable energy resources and multi-energy hybrid systems for urban buildings in Nordic climate. Energy Build. 2023, 282, 112789. [Google Scholar] [CrossRef]
- Zhong, C.; Xu, T.; Yuan, Y.; Feng, B.; Yu, H. The feasibility of clean power generation from a novel dual-vertical-well enhanced geothermal system (EGS): A case study in the Gonghe Basin, China. J. Clean. Prod. 2022, 344, 131109. [Google Scholar] [CrossRef]
- Jiansheng, W.; Lide, S.; Qiang, Z.; Jintao, N. Numerical investigation on power generation performance of enhanced geothermal system with horizontal well. Appl. Energy 2022, 325, 119865. [Google Scholar] [CrossRef]
- Dezhdar, A.; Assareh, E.; Agarwal, N.; Bedakhanian, A.; Keykhah, S.; Fard, G.Y.; Zadsar, N.; Aghajari, M.; Lee, M. Transient optimization of a new solar-wind multi-generation system for hydrogen production, desalination, clean electricity, heating, cooling, and energy storage using TRNSYS. Renew. Energy 2023, 208, 512–537. [Google Scholar] [CrossRef]
- Nizovtsev, M.I.; Sterlyagov, A.N. Effect of phase change material (PCM) on thermal inertia of walls in lightweight buildings. J. Build. Eng. 2024, 82, 107912. [Google Scholar] [CrossRef]
- Dezhdar, A.; Assareh, E.; Agarwal, N.; Baheri, A.; Ahmadinejad, M.; Zadsar, N.; Fard, G.Y.; Bedakhanian, A.; Aghajari, M.; Ghodrat, M.; et al. Modeling, optimization, and economic analysis of a comprehensive CCHP system with fuel cells, reverse osmosis, batteries, and hydrogen storage subsystems Powered by renewable energy sources. Renew. Energy 2024, 220, 119695. [Google Scholar] [CrossRef]
- Biswas, K.; Abhari, R. Low-cost phase change material as an energy storage medium in building envelopes: Experimental and numerical analyses. Energy Convers. Manag. 2014, 88, 1020–1031. [Google Scholar] [CrossRef]
- Biswas, K.; Lu, J.; Soroushian, P.; Shrestha, S. Combined experimental and numerical evaluation of a prototype nano-PCM enhanced wallboard. Appl. Energy 2014, 131, 517–529. [Google Scholar] [CrossRef]
- Dezhdar, A.; Assareh, E.; Keykhah, S.; Bedakhanian, A.; Lee, M. A transient model for clean electricity generation using Solar energy and ocean thermal energy conversion (OTEC)—Case study: Karkheh dam—Southwest Iran. Energy Nexus 2023, 9, 100176. [Google Scholar] [CrossRef]
- Mehrpooya, M.; Raeesi, M.; Pourfayaz, F.; Delpisheh, M. Investigation of a hybrid solar thermochemical water-splitting hydrogen production cycle and coal-fueled molten carbonate fuel cell power plant. Sustain. Energy Technol. Assess. 2021, 47, 101458. [Google Scholar] [CrossRef]
- Delpisheh, M.; Haghghi, M.A.; Athari, H.; Mehrpooya, M. Desalinated water and hydrogen generation from seawater via a desalination unit and a low temperature electrolysis using a novel solar-based setup. Int. J. Hydrogen Energy 2021, 46, 7211–7229. [Google Scholar] [CrossRef]
- Dincer, I.; Rosen, M.A.; Ahmadi, P. Optimization of Energy Systems; John Wiley & Sons, Ltd.: Chichester, UK, 2017. [Google Scholar]
- Bedakhanian, A.; Assareh, E.; Agarwal, N.; Lee, M. Thermoeconomical, wind assessments and environmental analysis of compressed air energy storage (CAES) integrated with a wind farm by using RSM as a machine learning optimization technique—Case study—Denmark. J. Energy Storage 2024, 78, 110059. [Google Scholar] [CrossRef]
- Razmi, A.R.; Janbaz, M. Exergoeconomic assessment with reliability consideration of a green cogeneration system based on compressed air energy storage (CAES). Energy Convers. Manag. 2020, 204, 112320. [Google Scholar] [CrossRef]


Disclaimer/Publisher’s Note: The statements, opinions and data contained in all publications are solely those of the individual author(s) and contributor(s) and not of MDPI and/or the editor(s). MDPI and/or the editor(s) disclaim responsibility for any injury to people or property resulting from any ideas, methods, instructions or products referred to in the content. |
© 2024 by the authors. Licensee MDPI, Basel, Switzerland. This article is an open access article distributed under the terms and conditions of the Creative Commons Attribution (CC BY) license (https://creativecommons.org/licenses/by/4.0/).