NLFEA of the Behavior of Polypropylene-Fiber-Reinforced Concrete Slabs with Square Opening


Abstract
1. Introduction
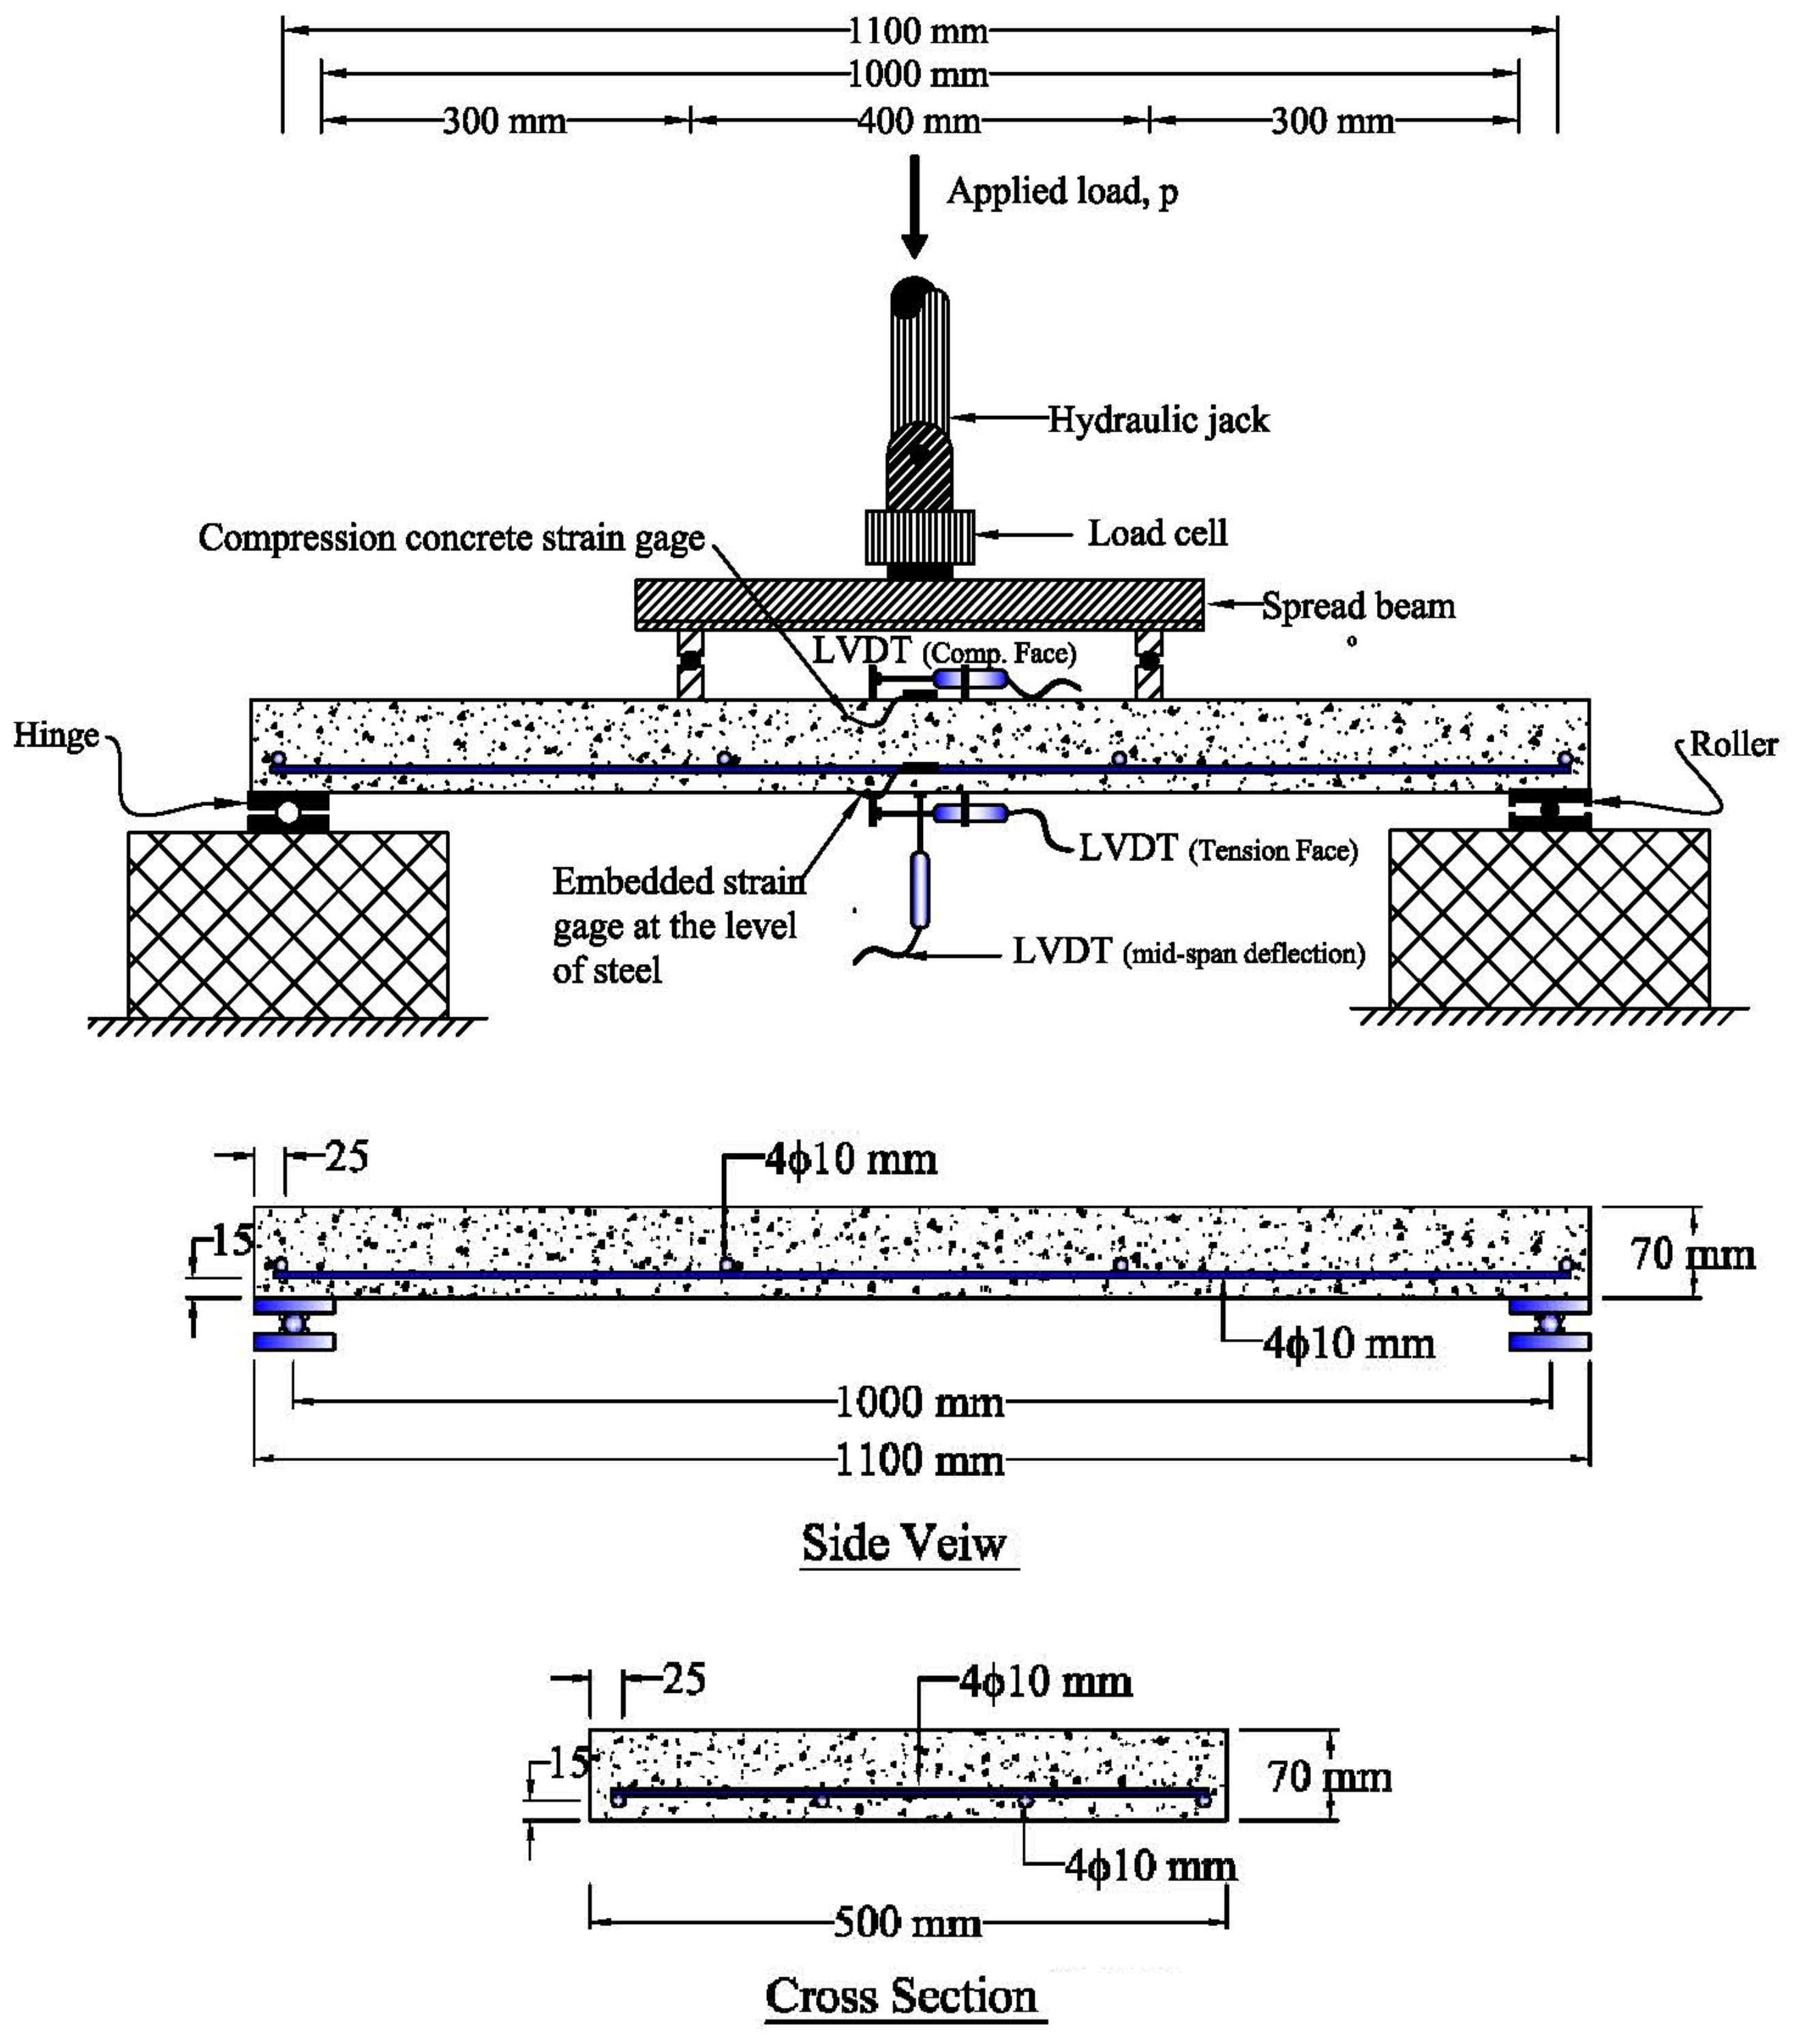
2. Experimental Work Review
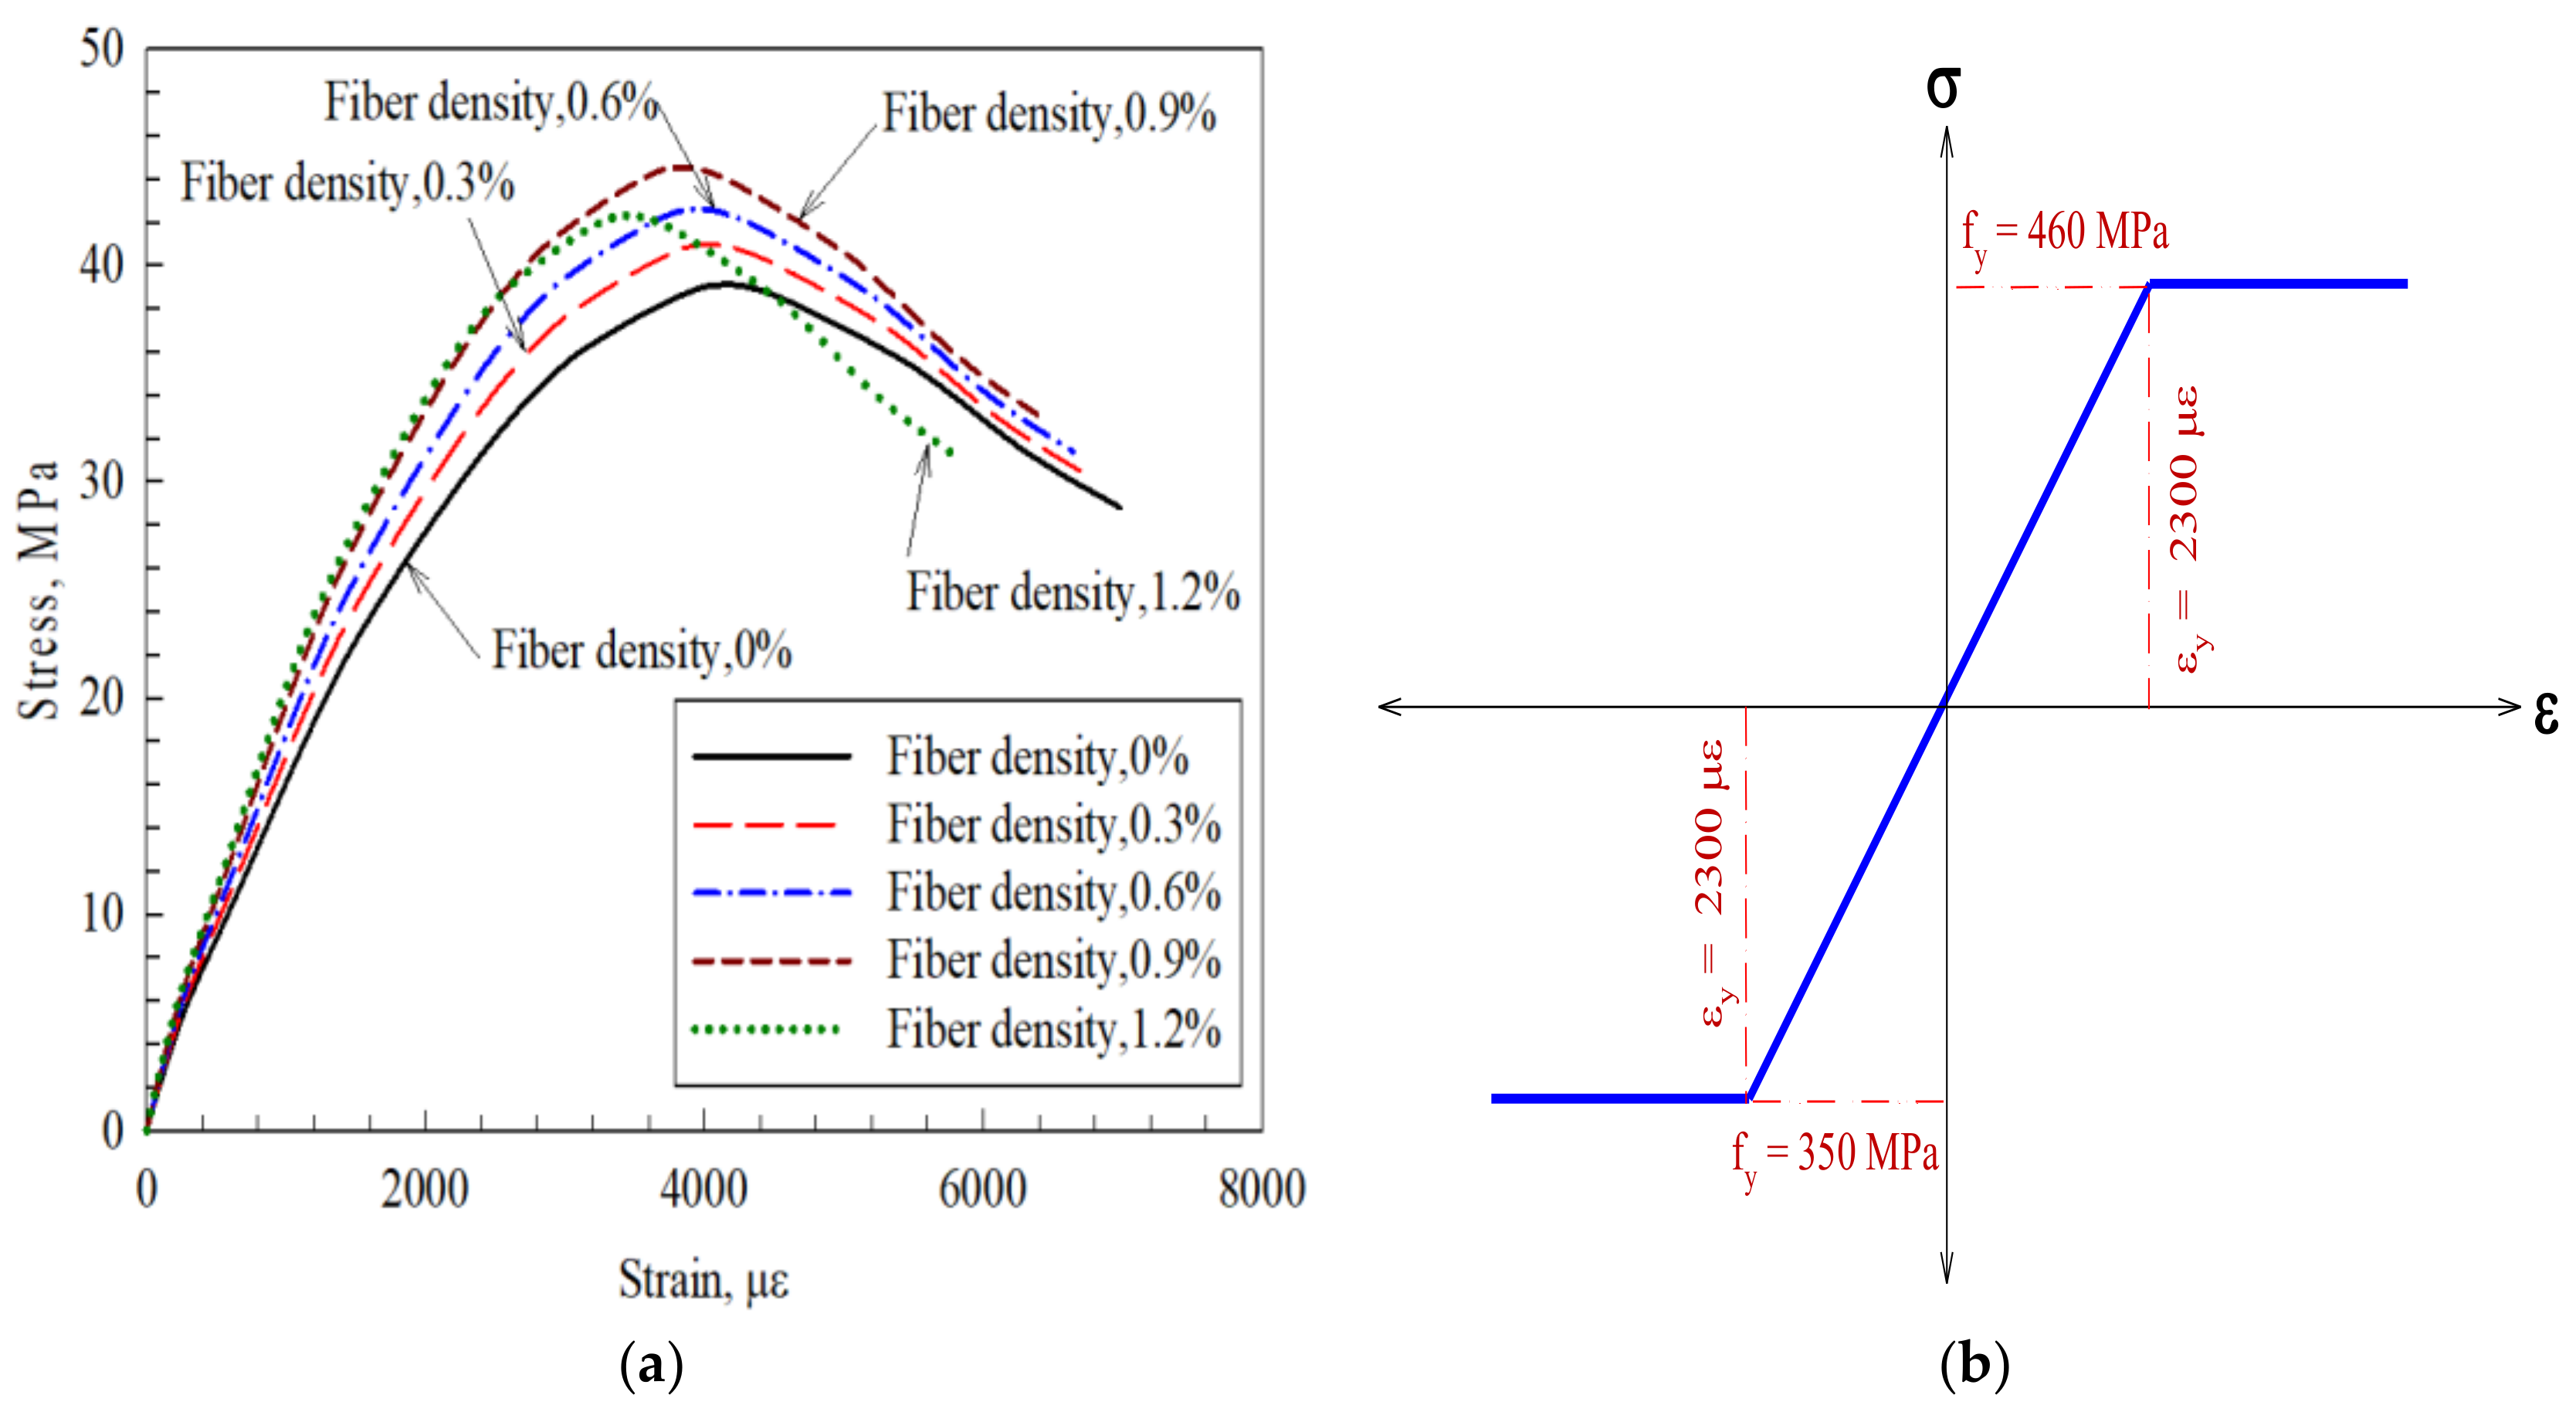
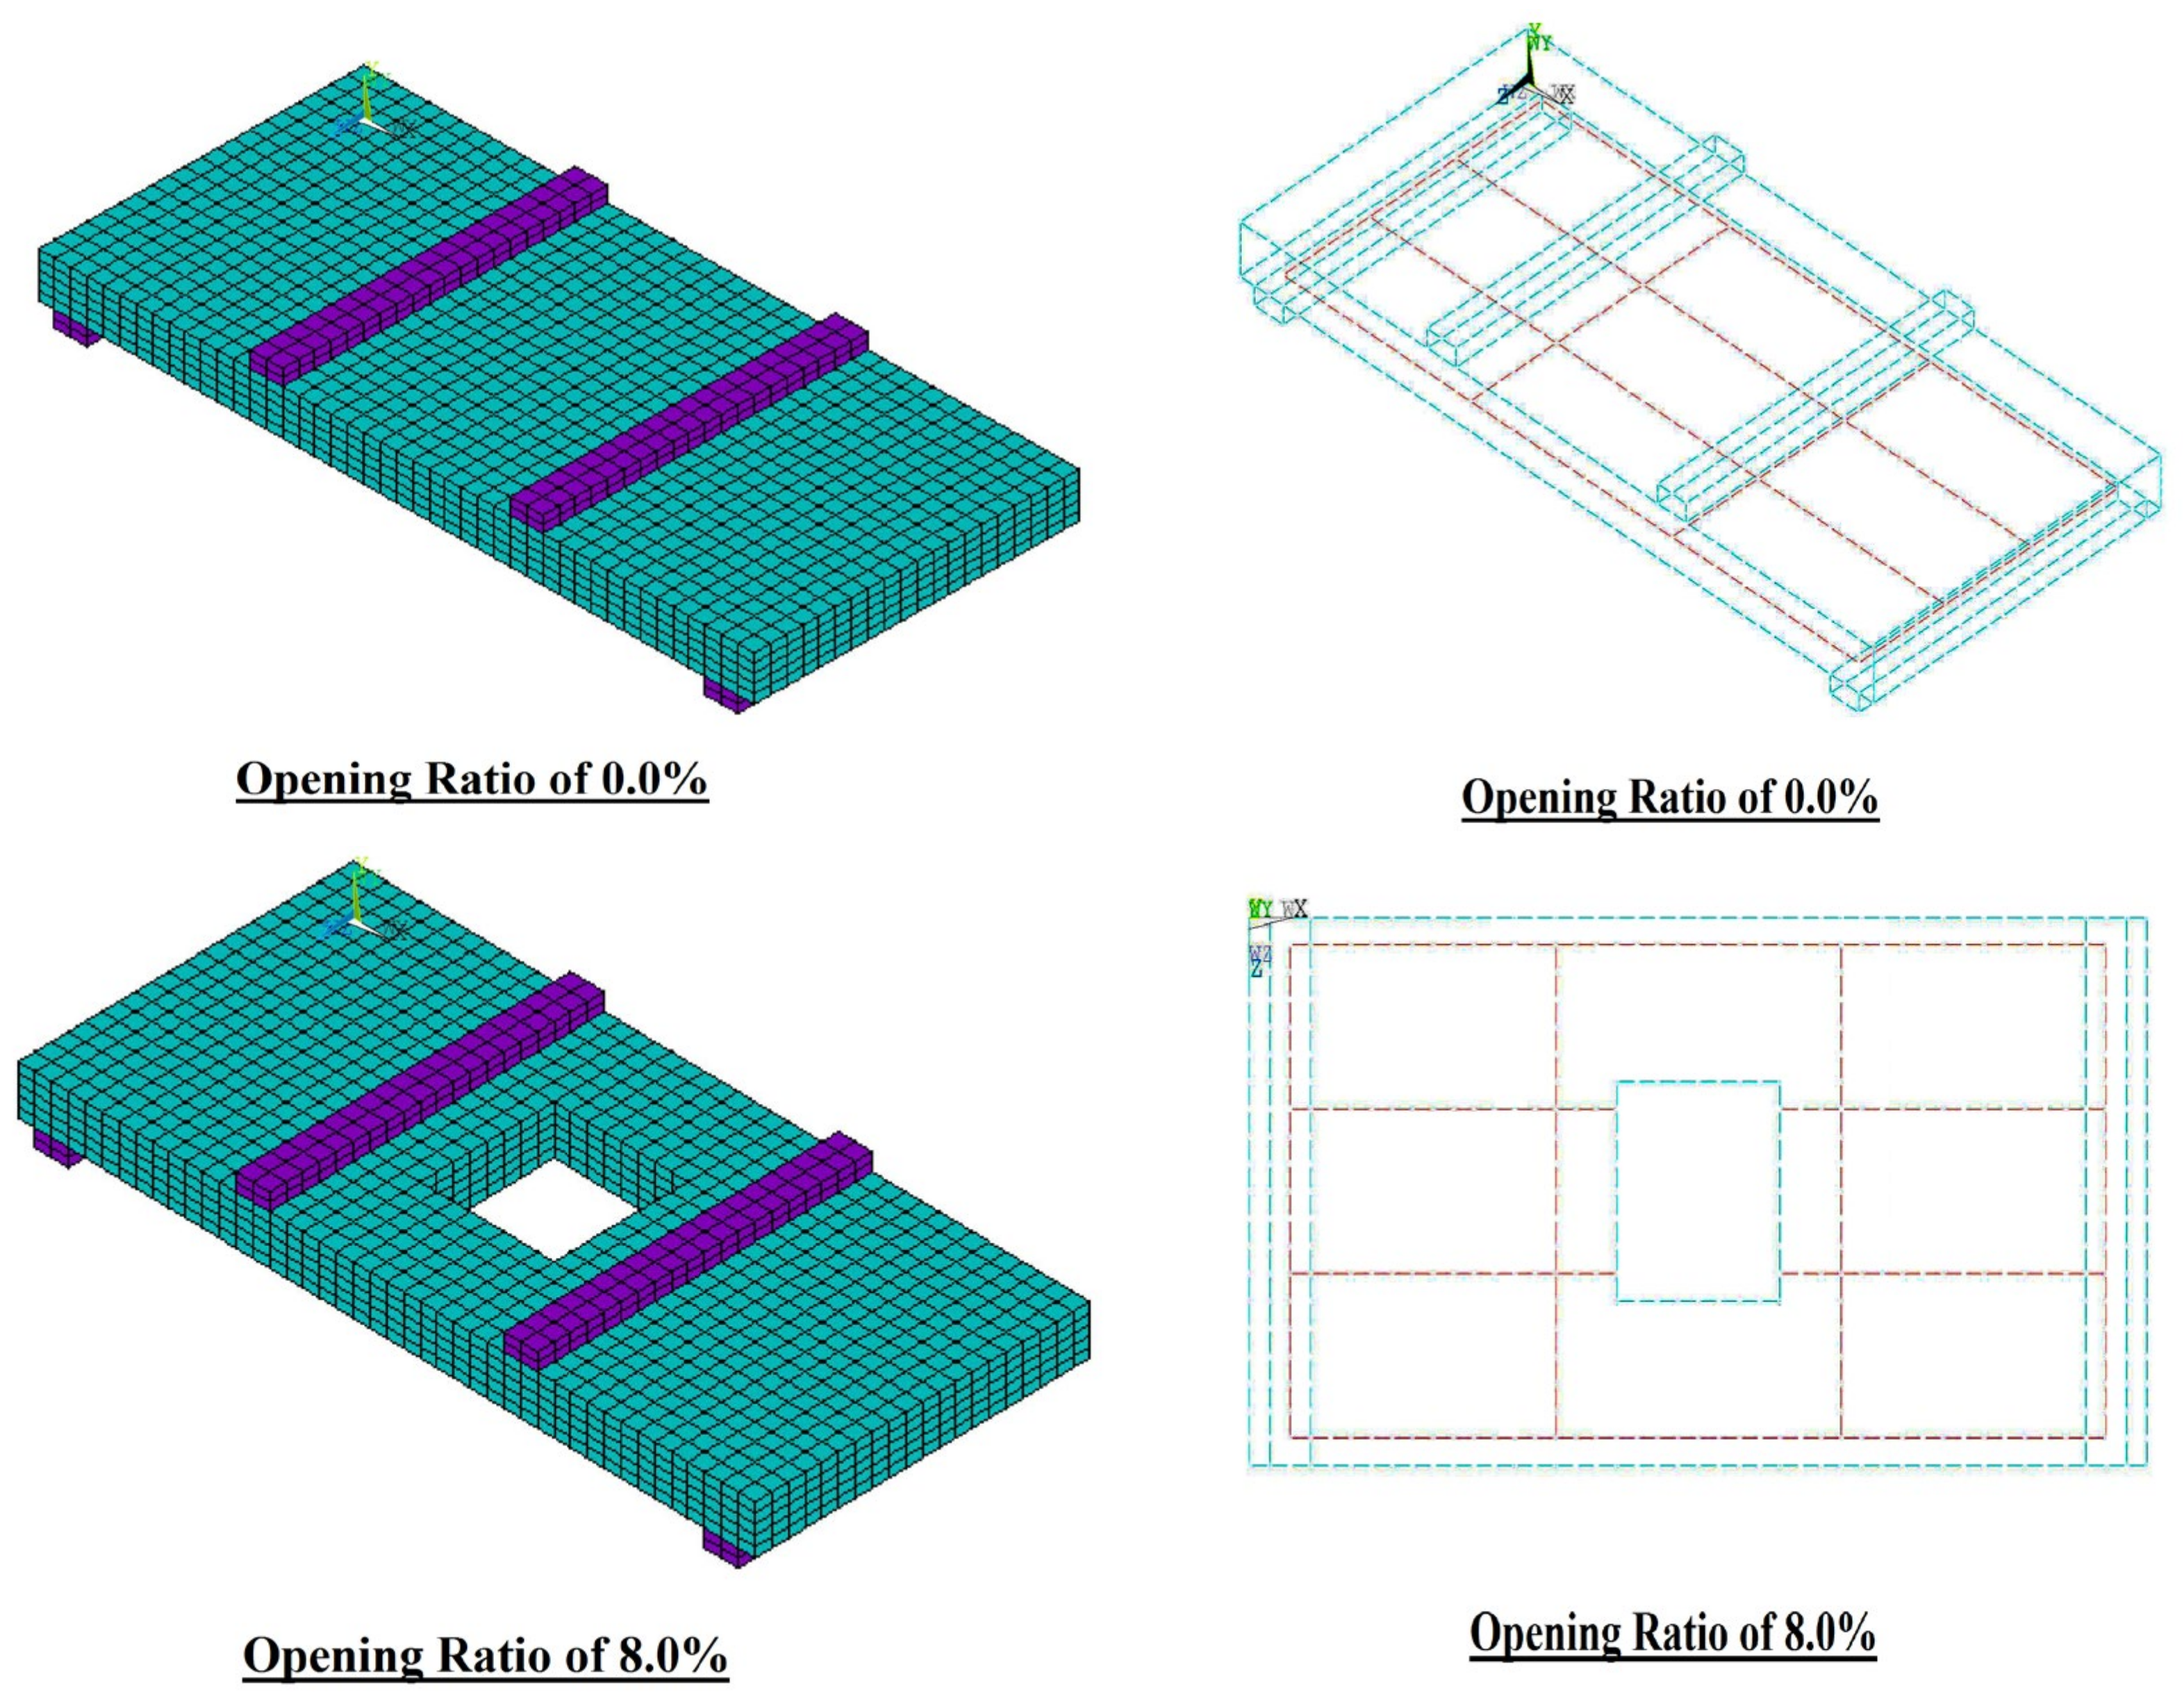
3. Numerical Modeling Methodology
4. Results and Discussion
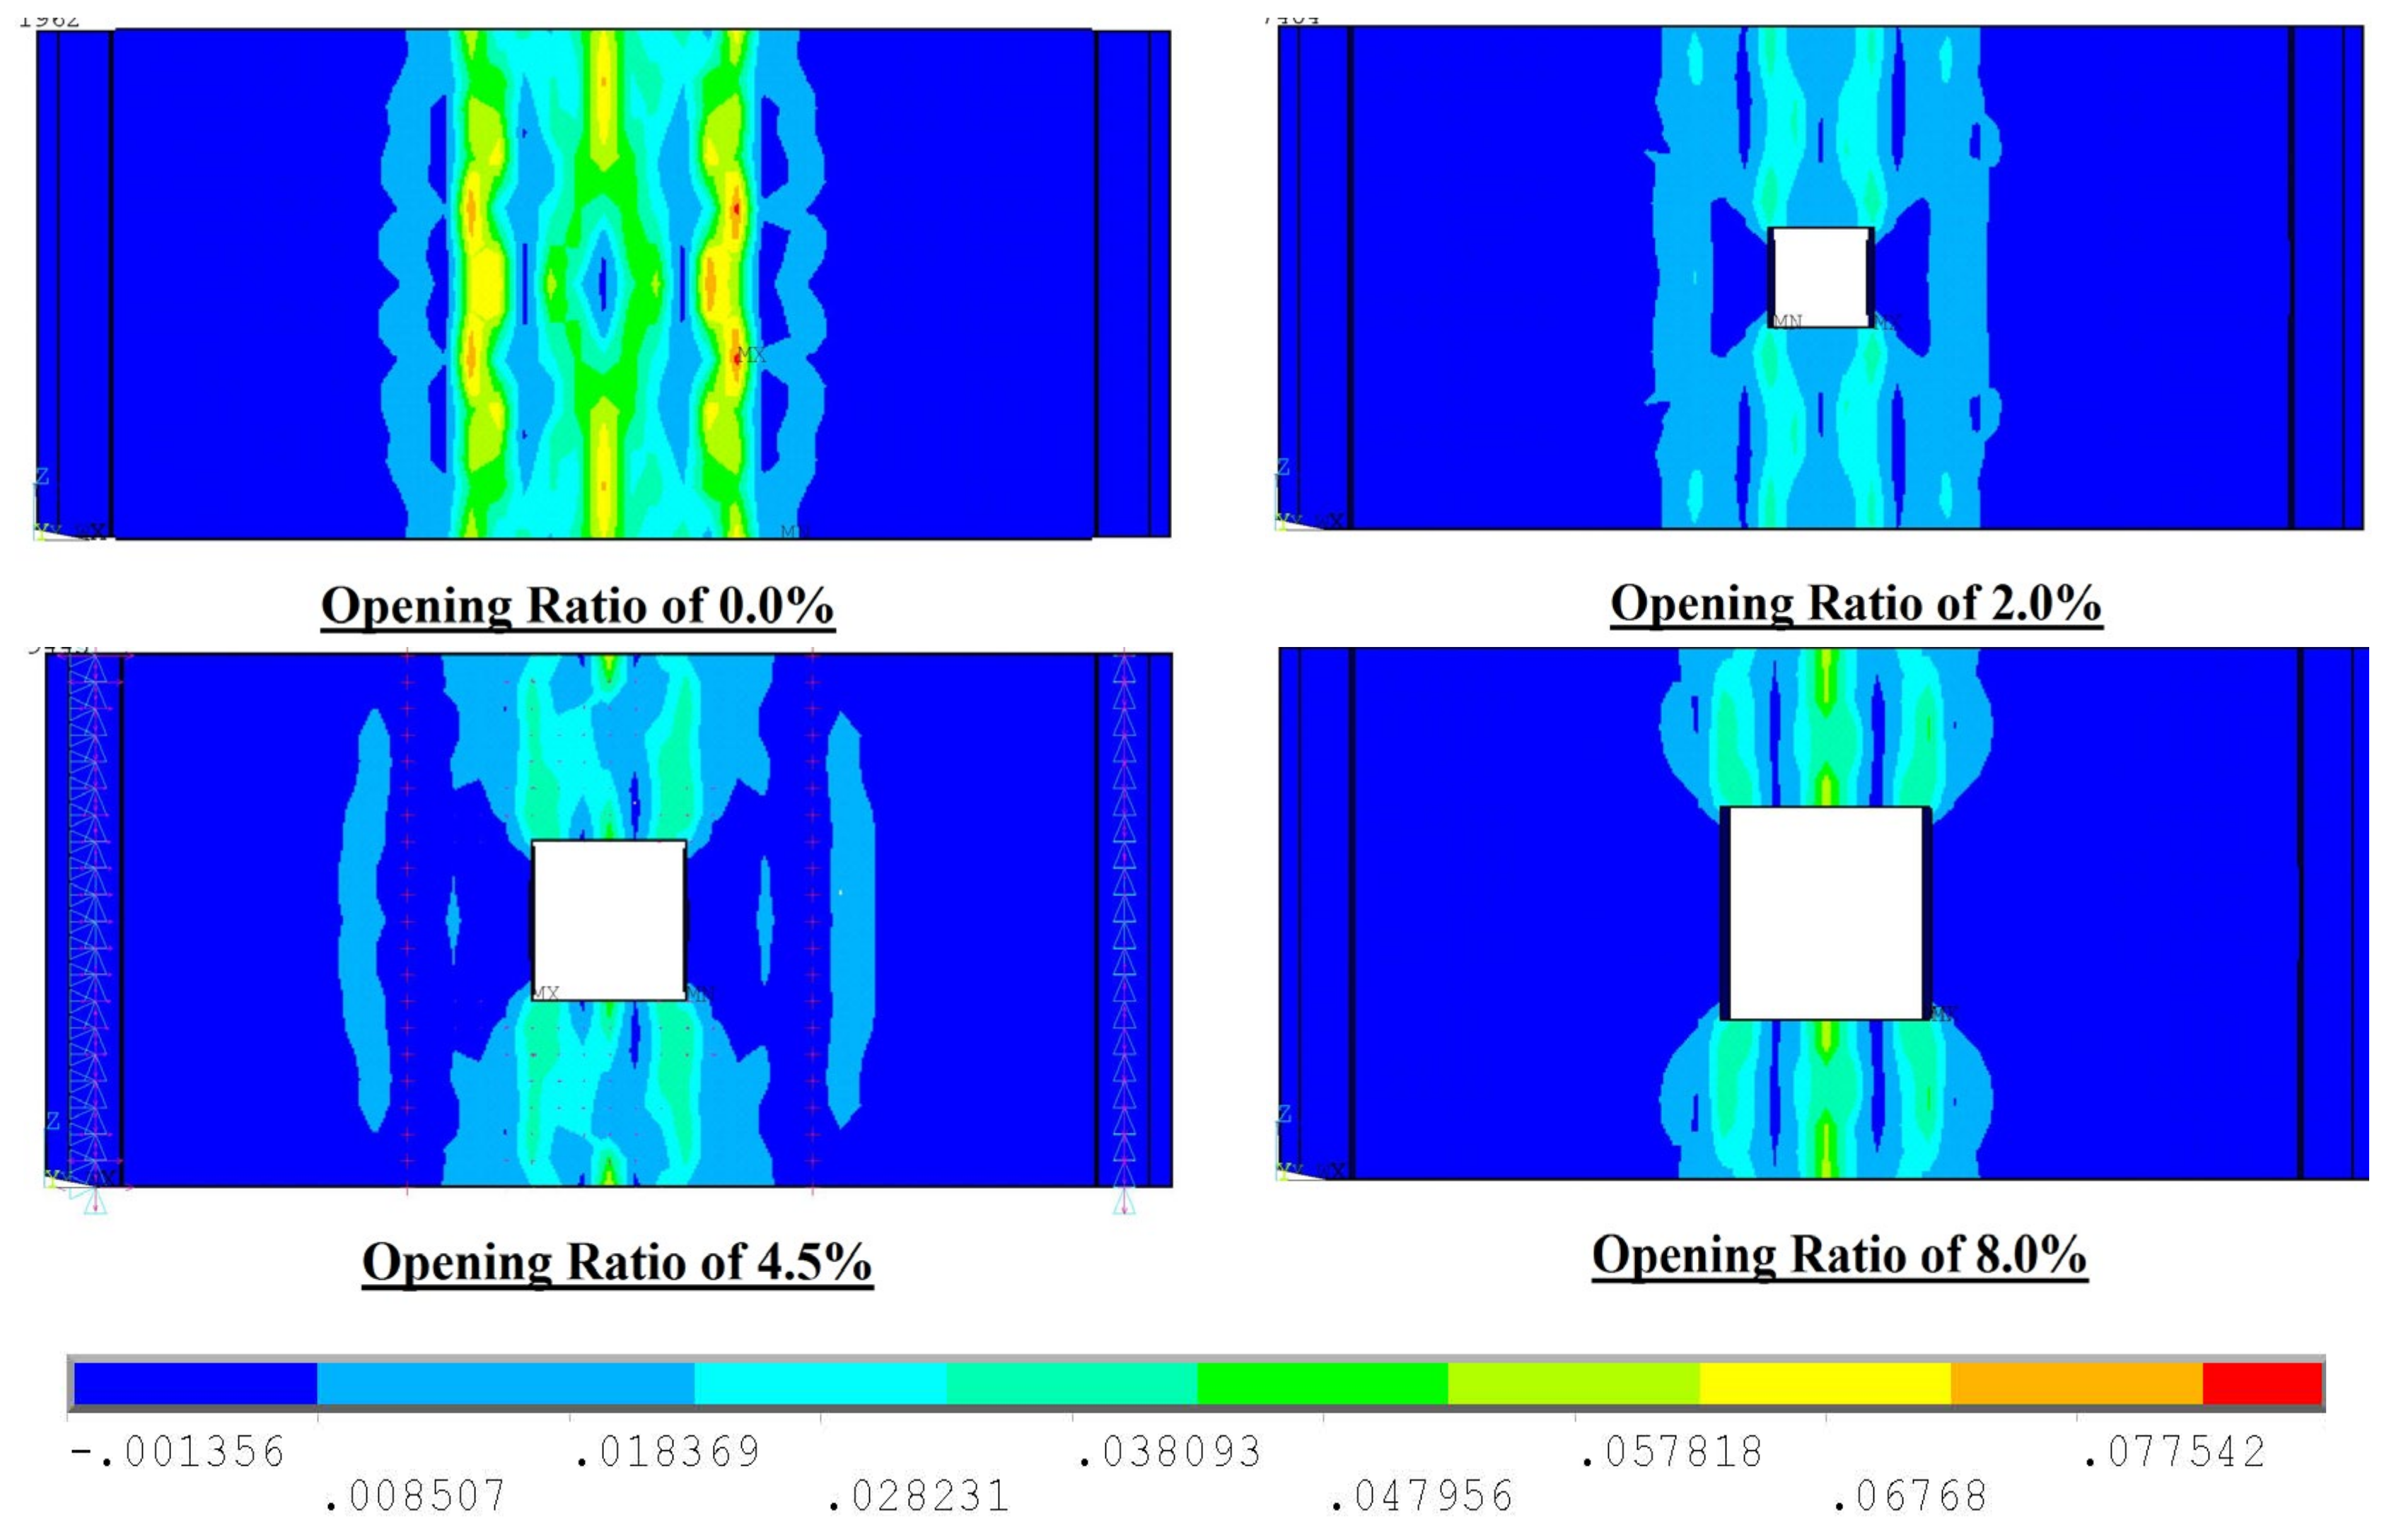
4.1. Failure Modes
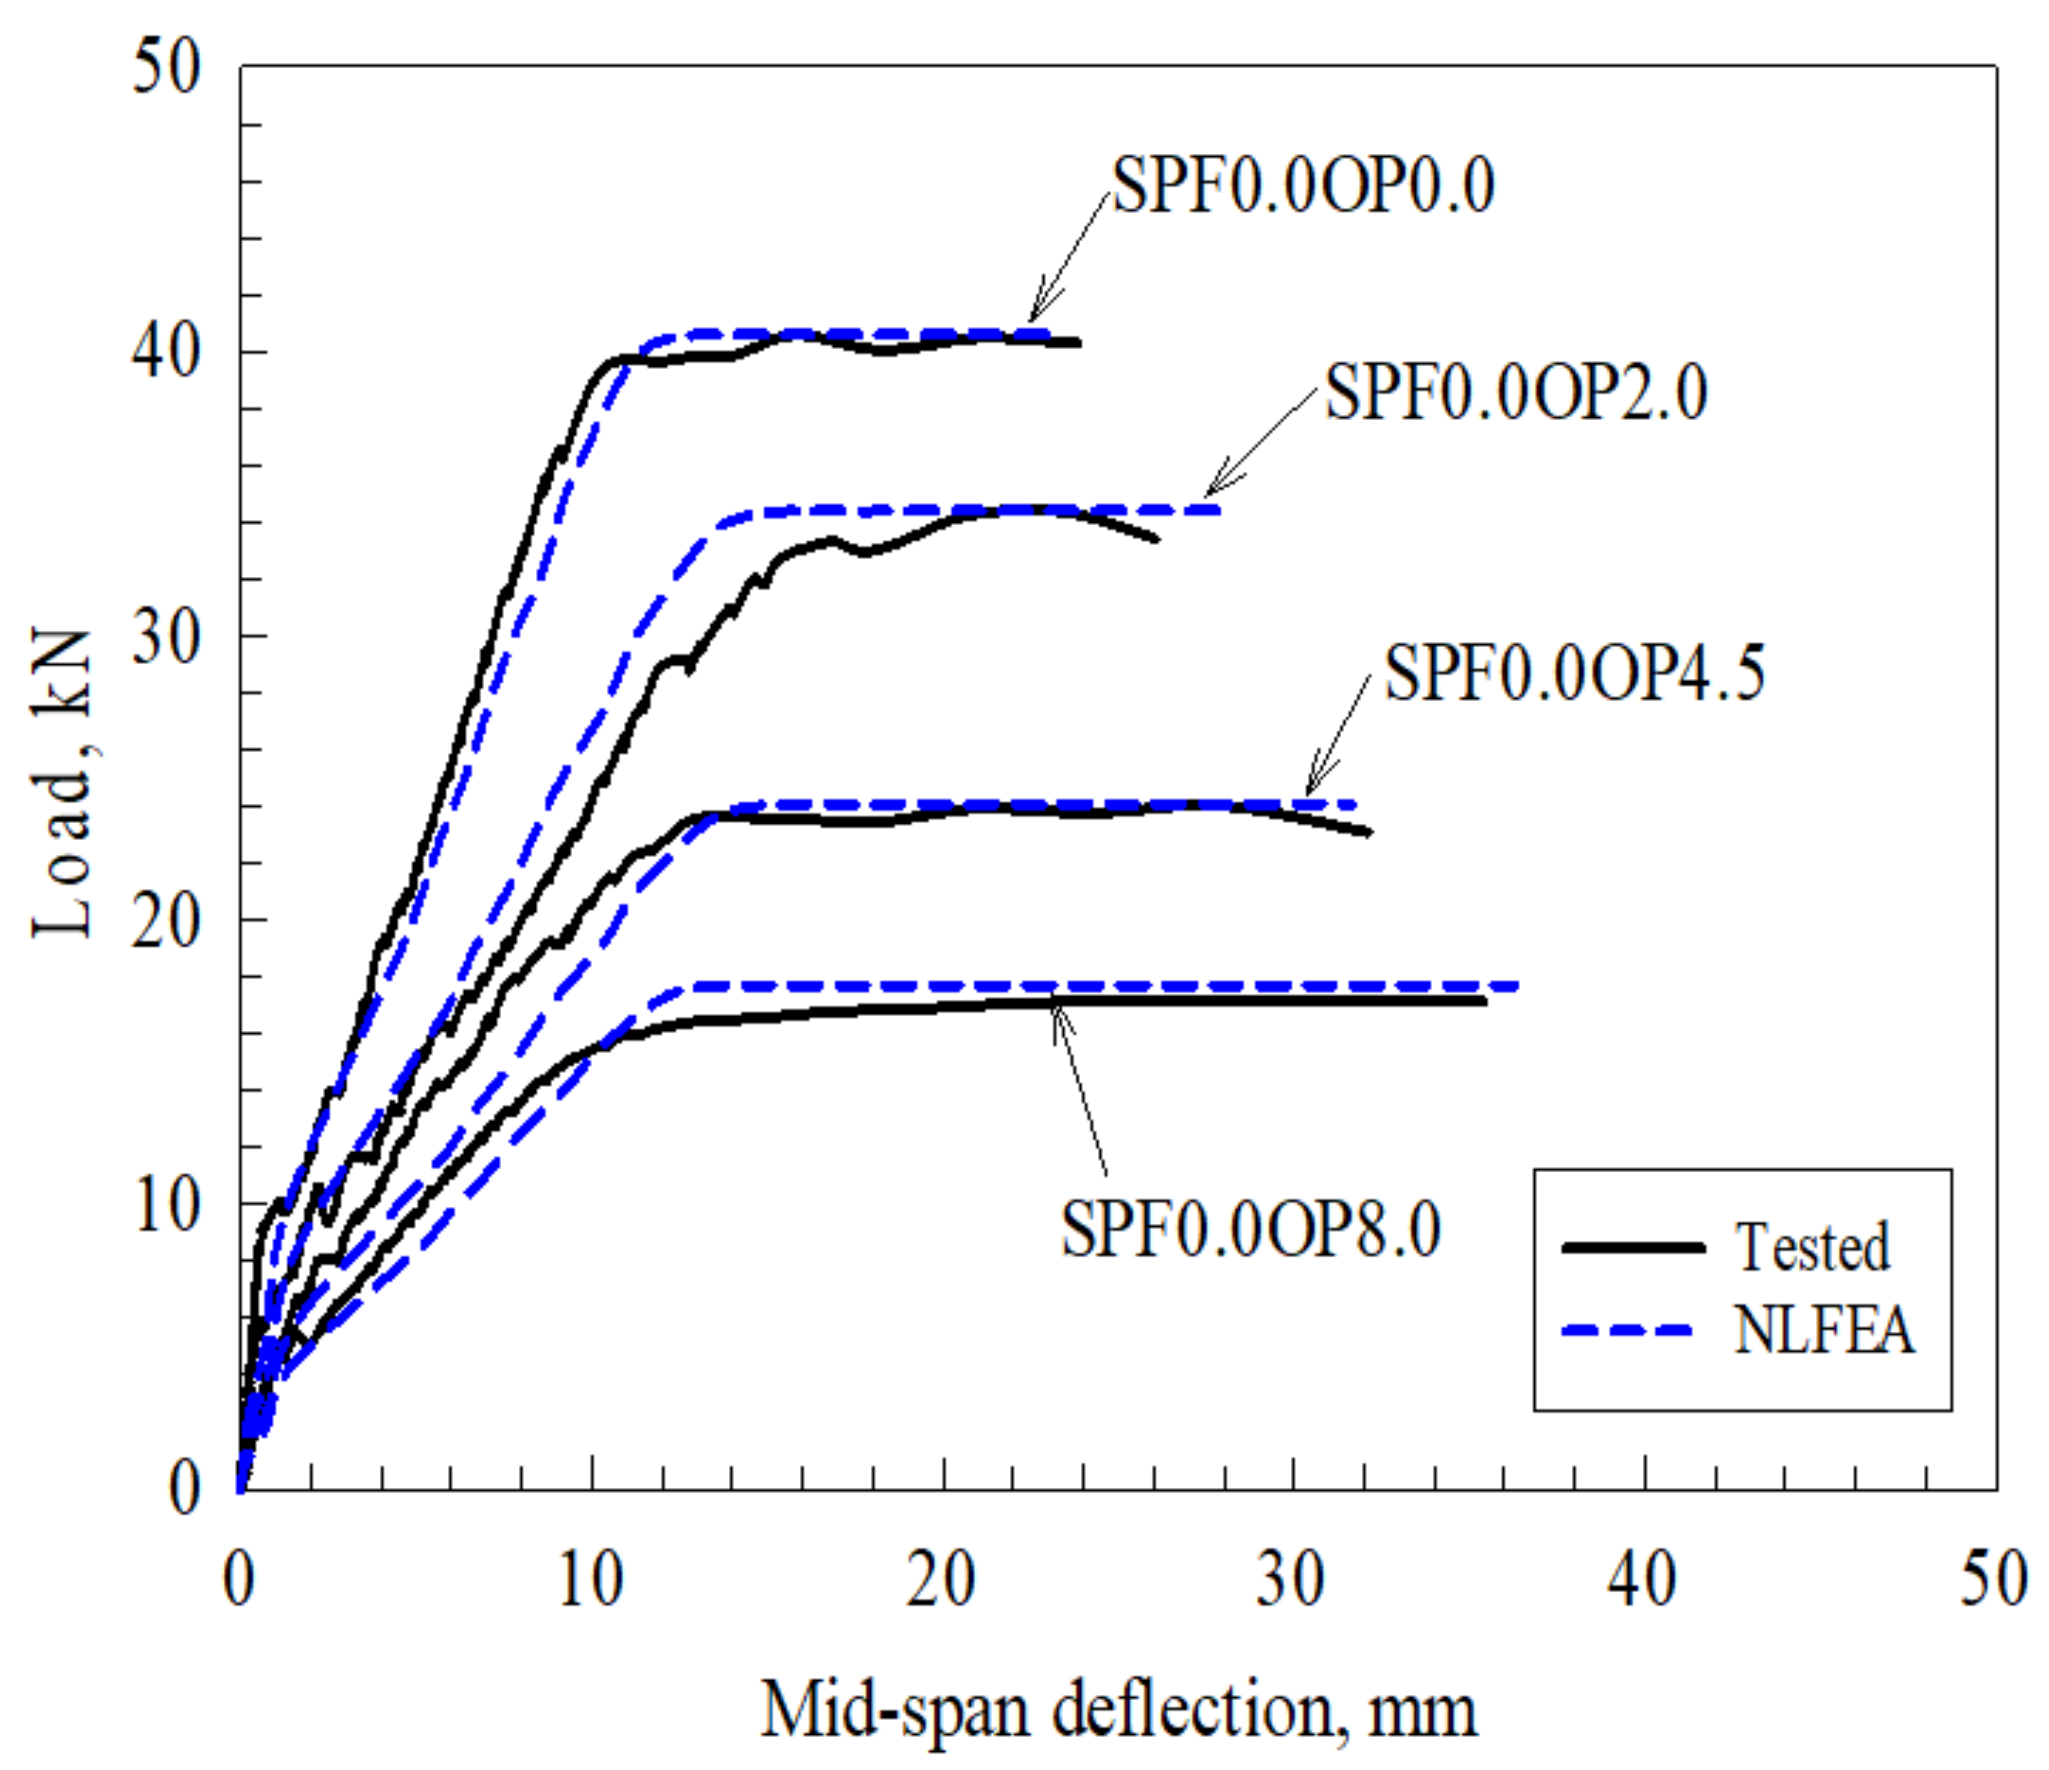
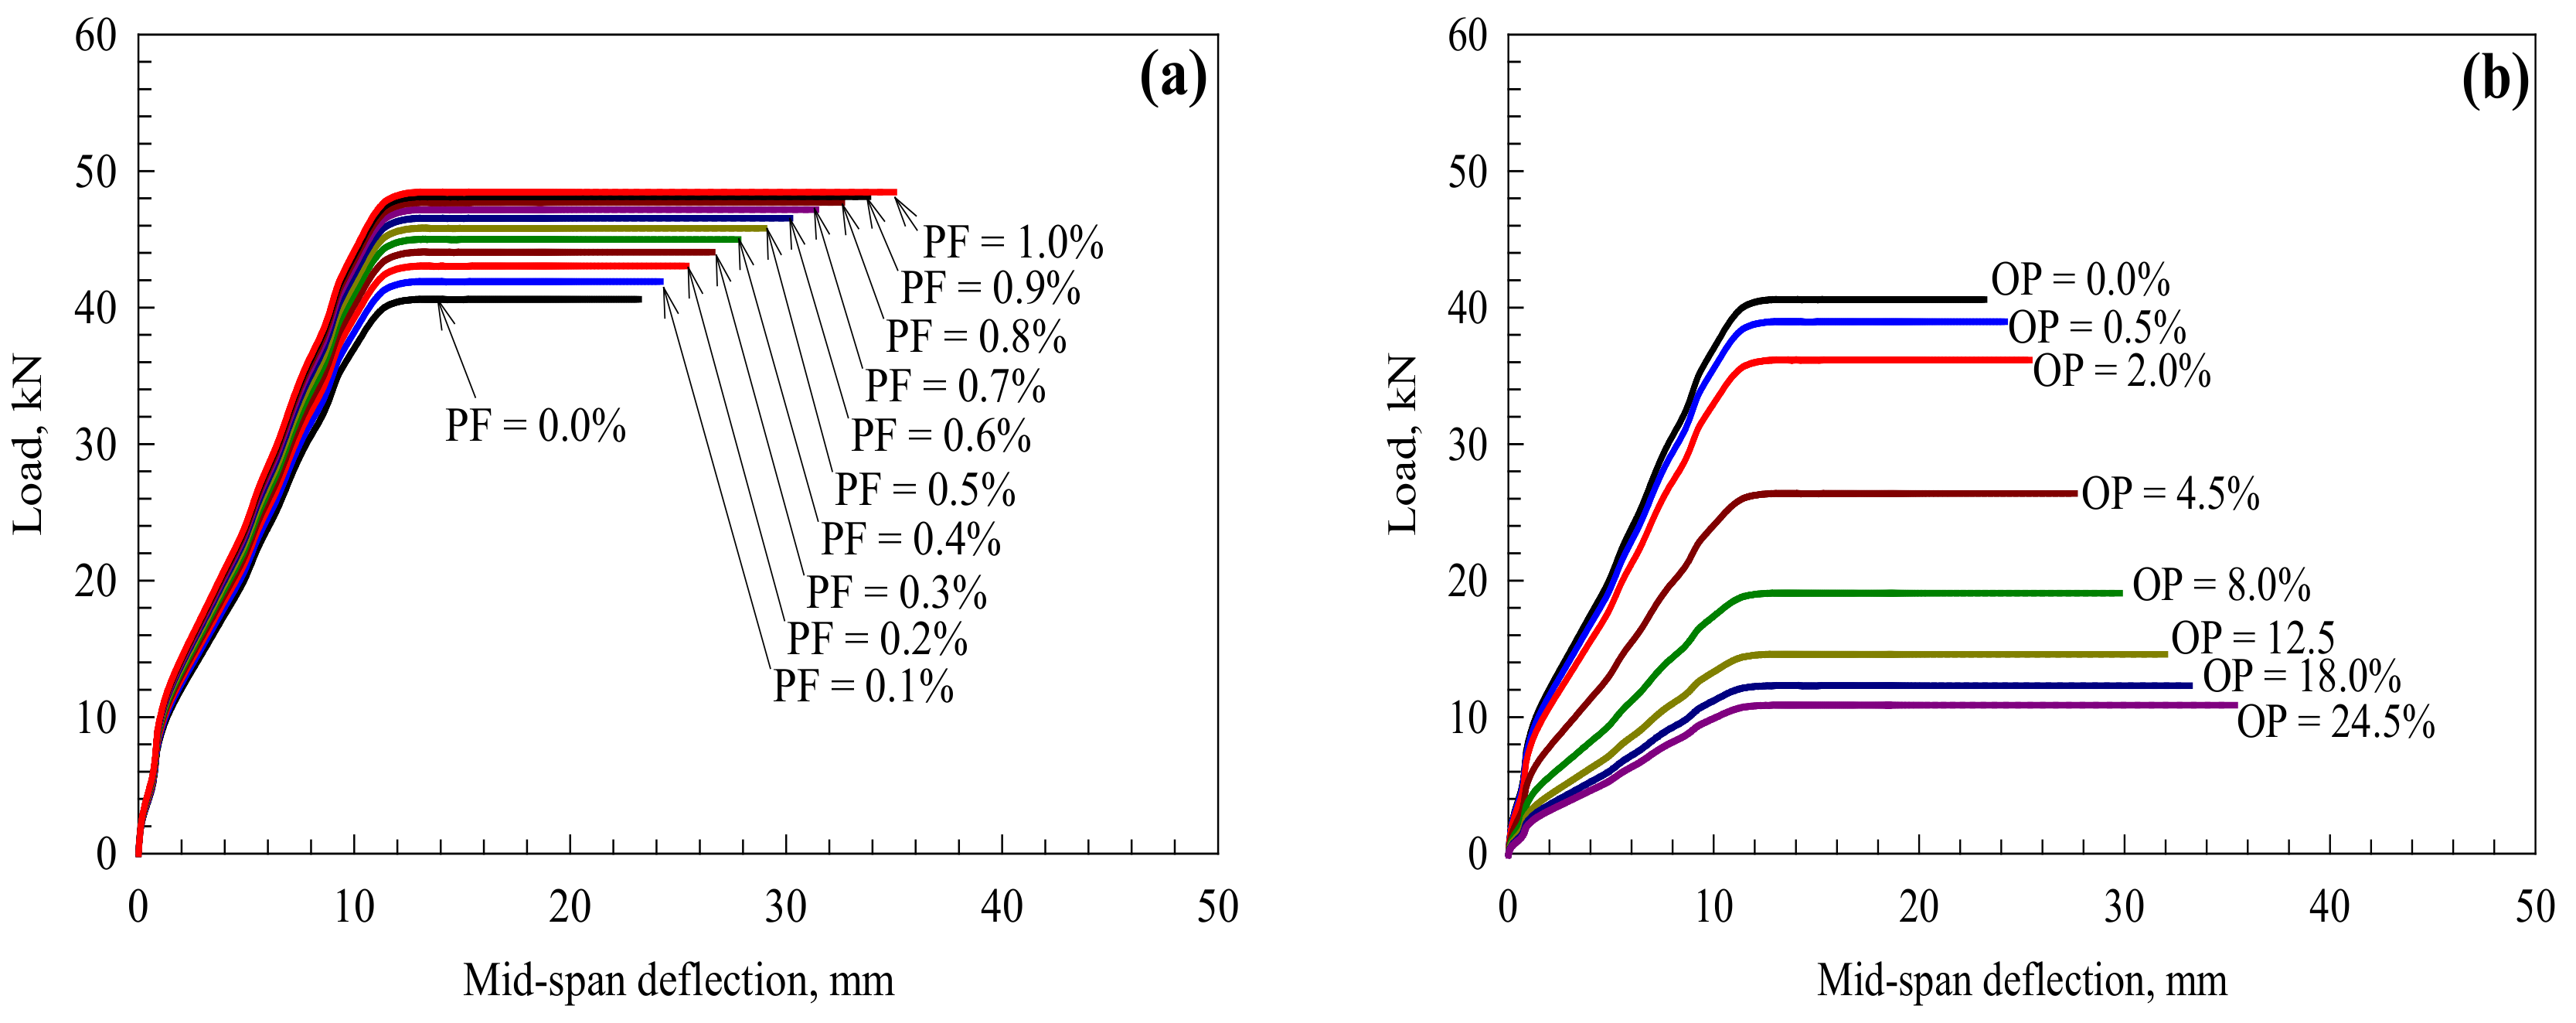
4.2. The Load vs. Deflection Behavior
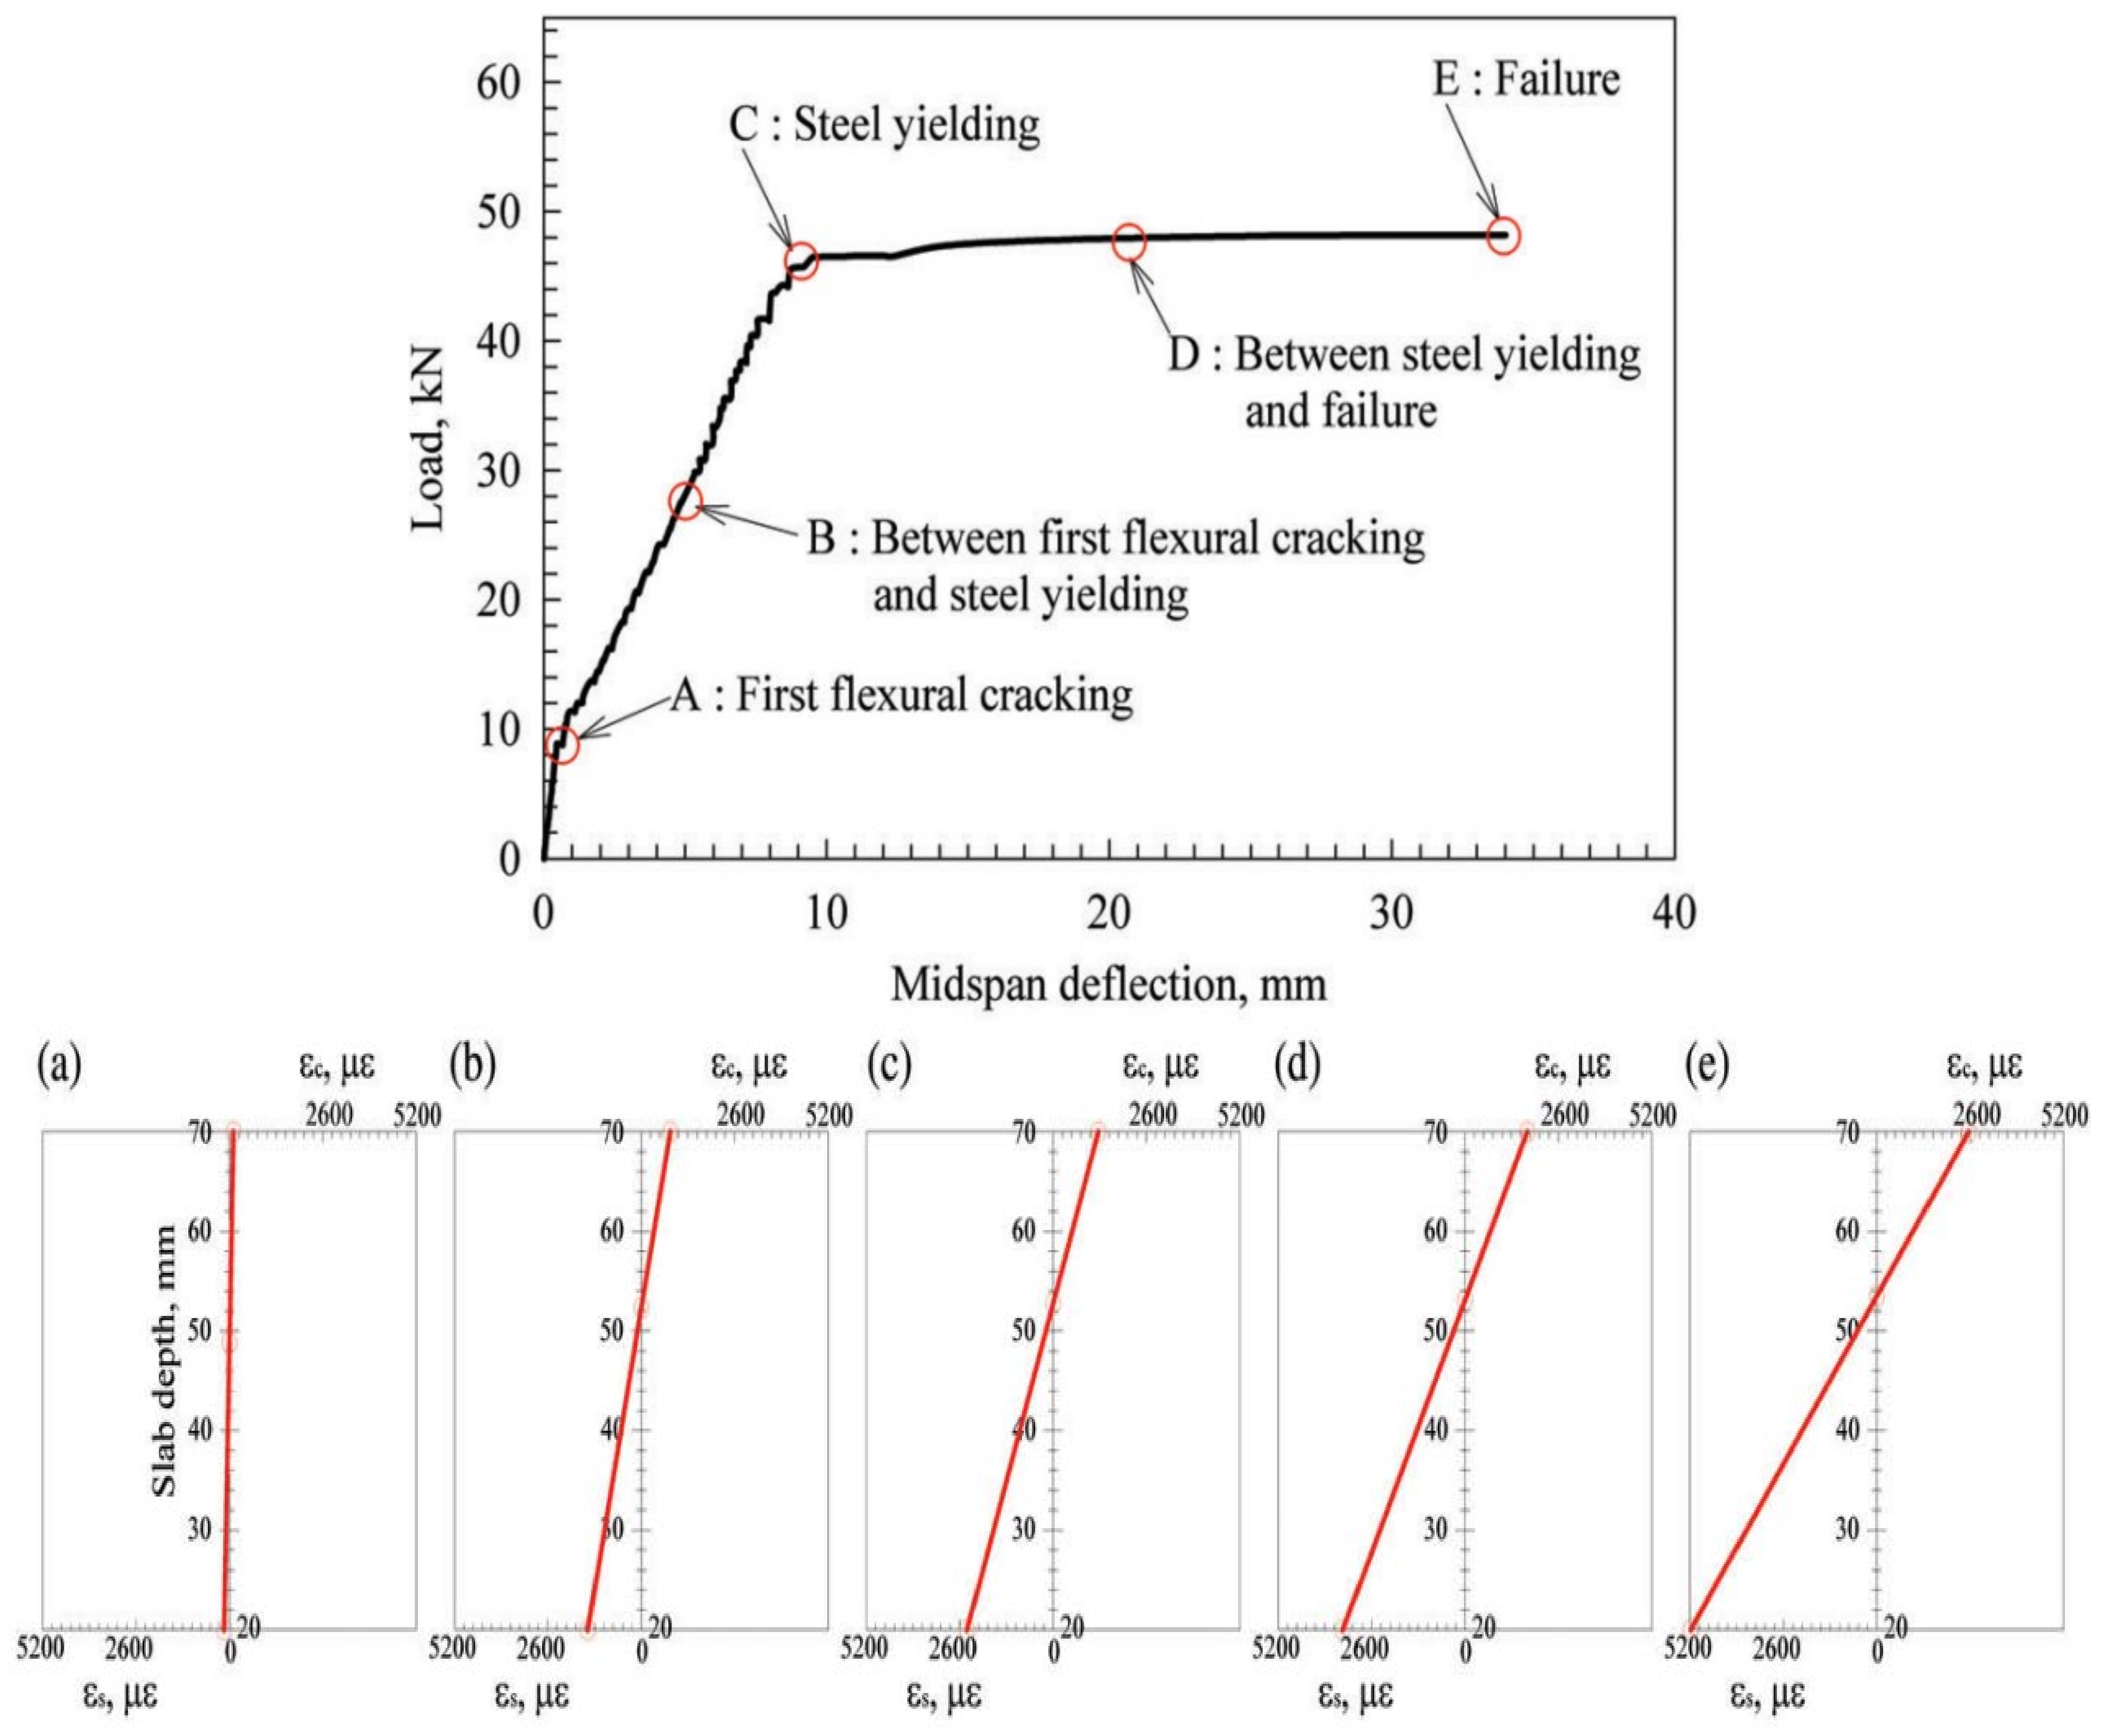
4.3. Concrete and Steel Strain Behavior
4.4. Yielding Stiffness
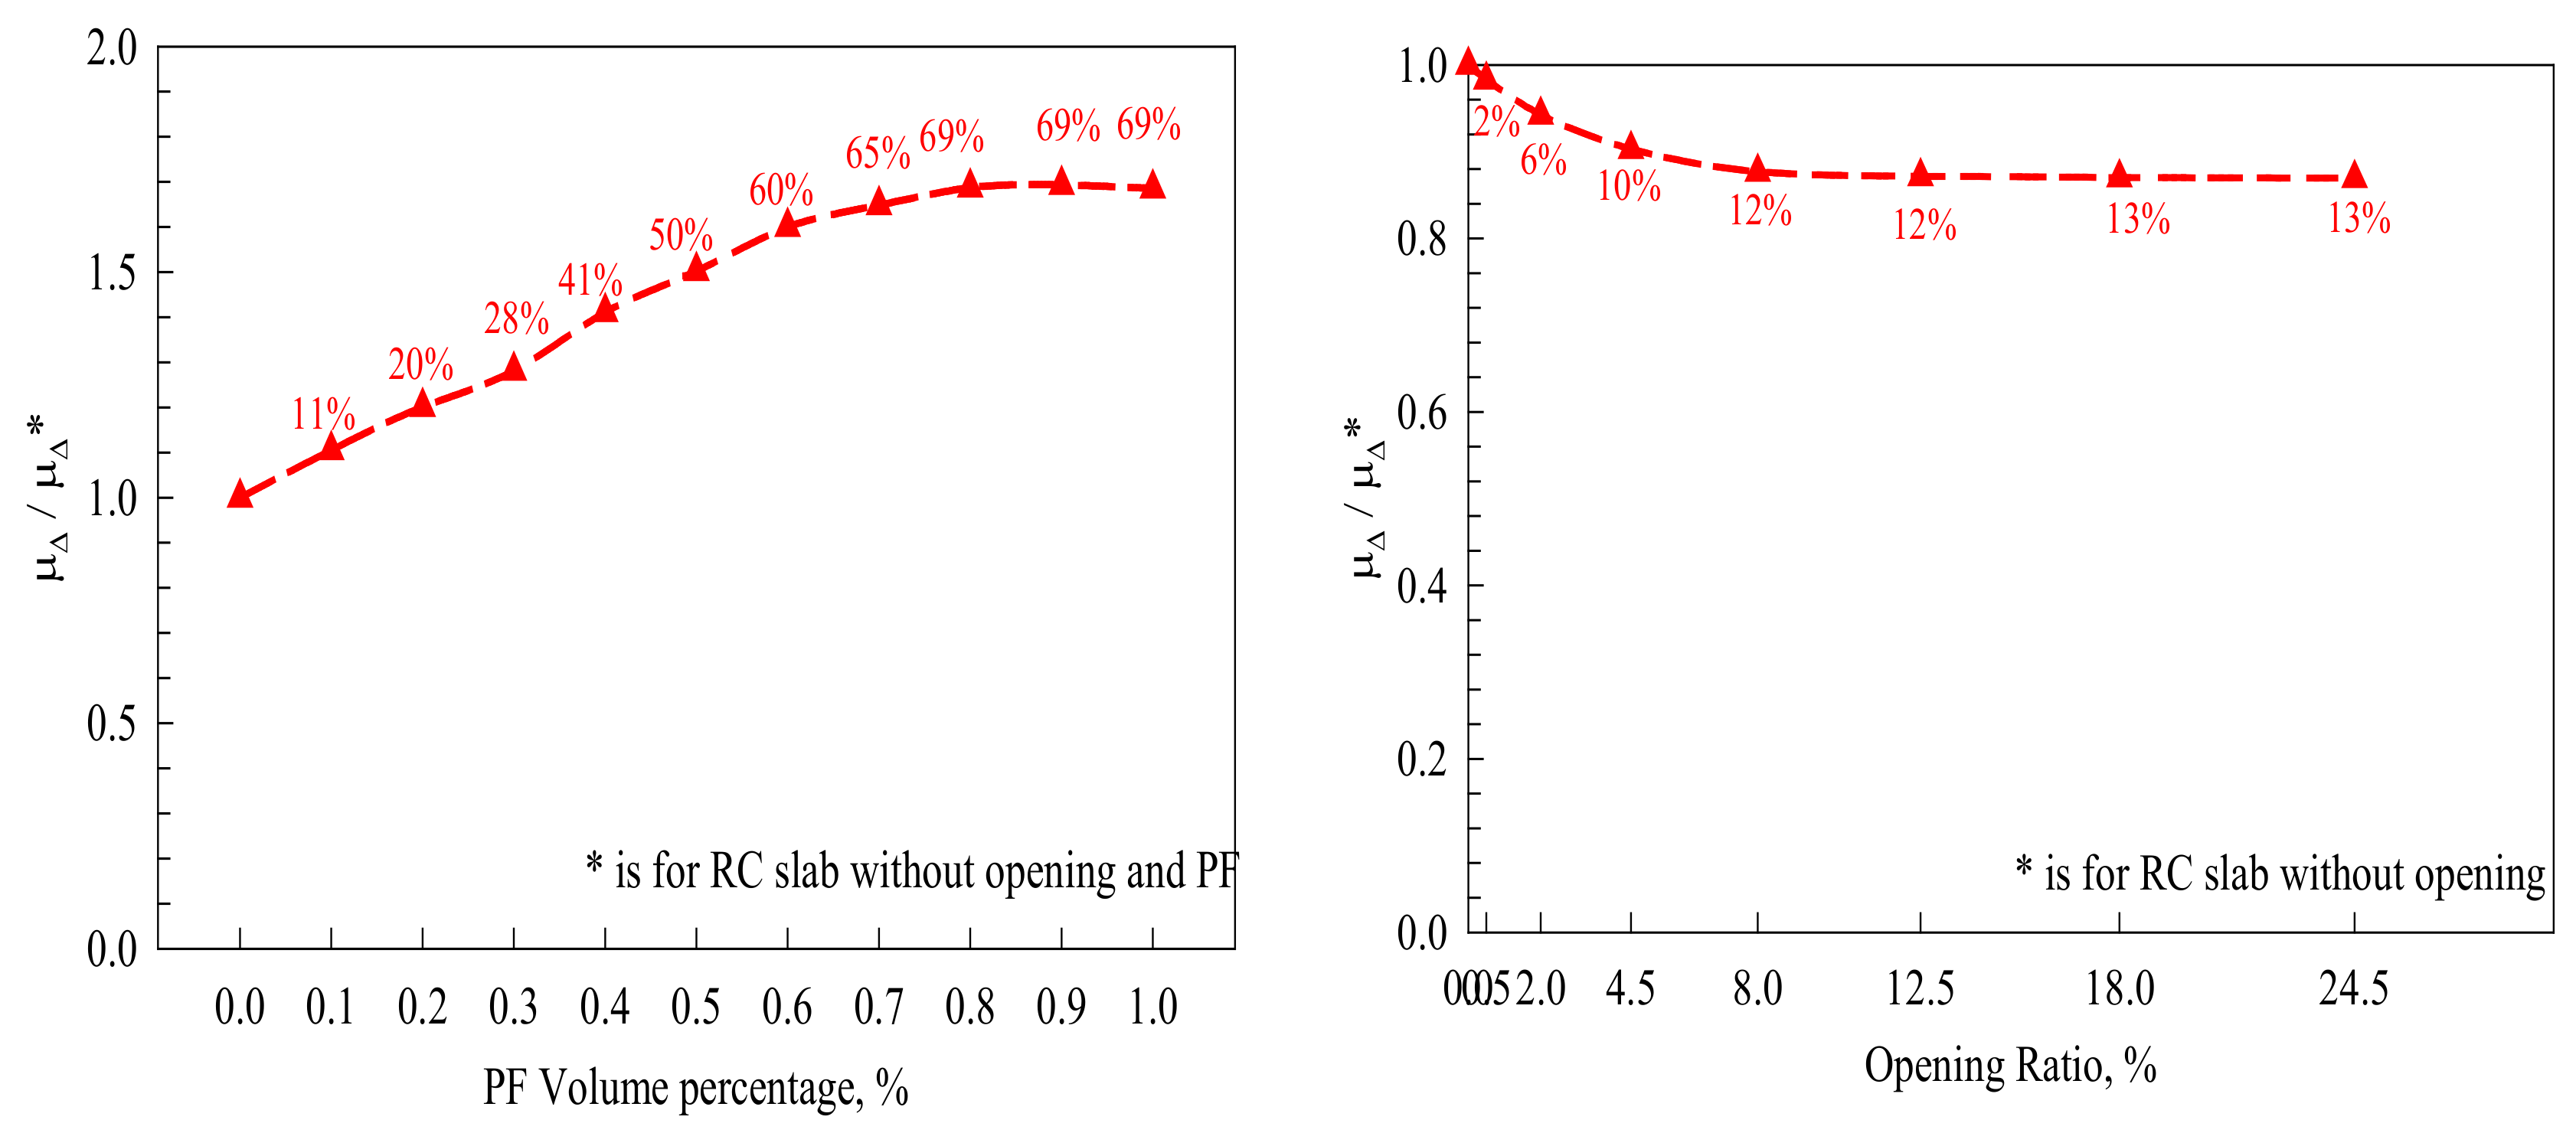
4.5. Ductility Index (Displacement-Based Approach)
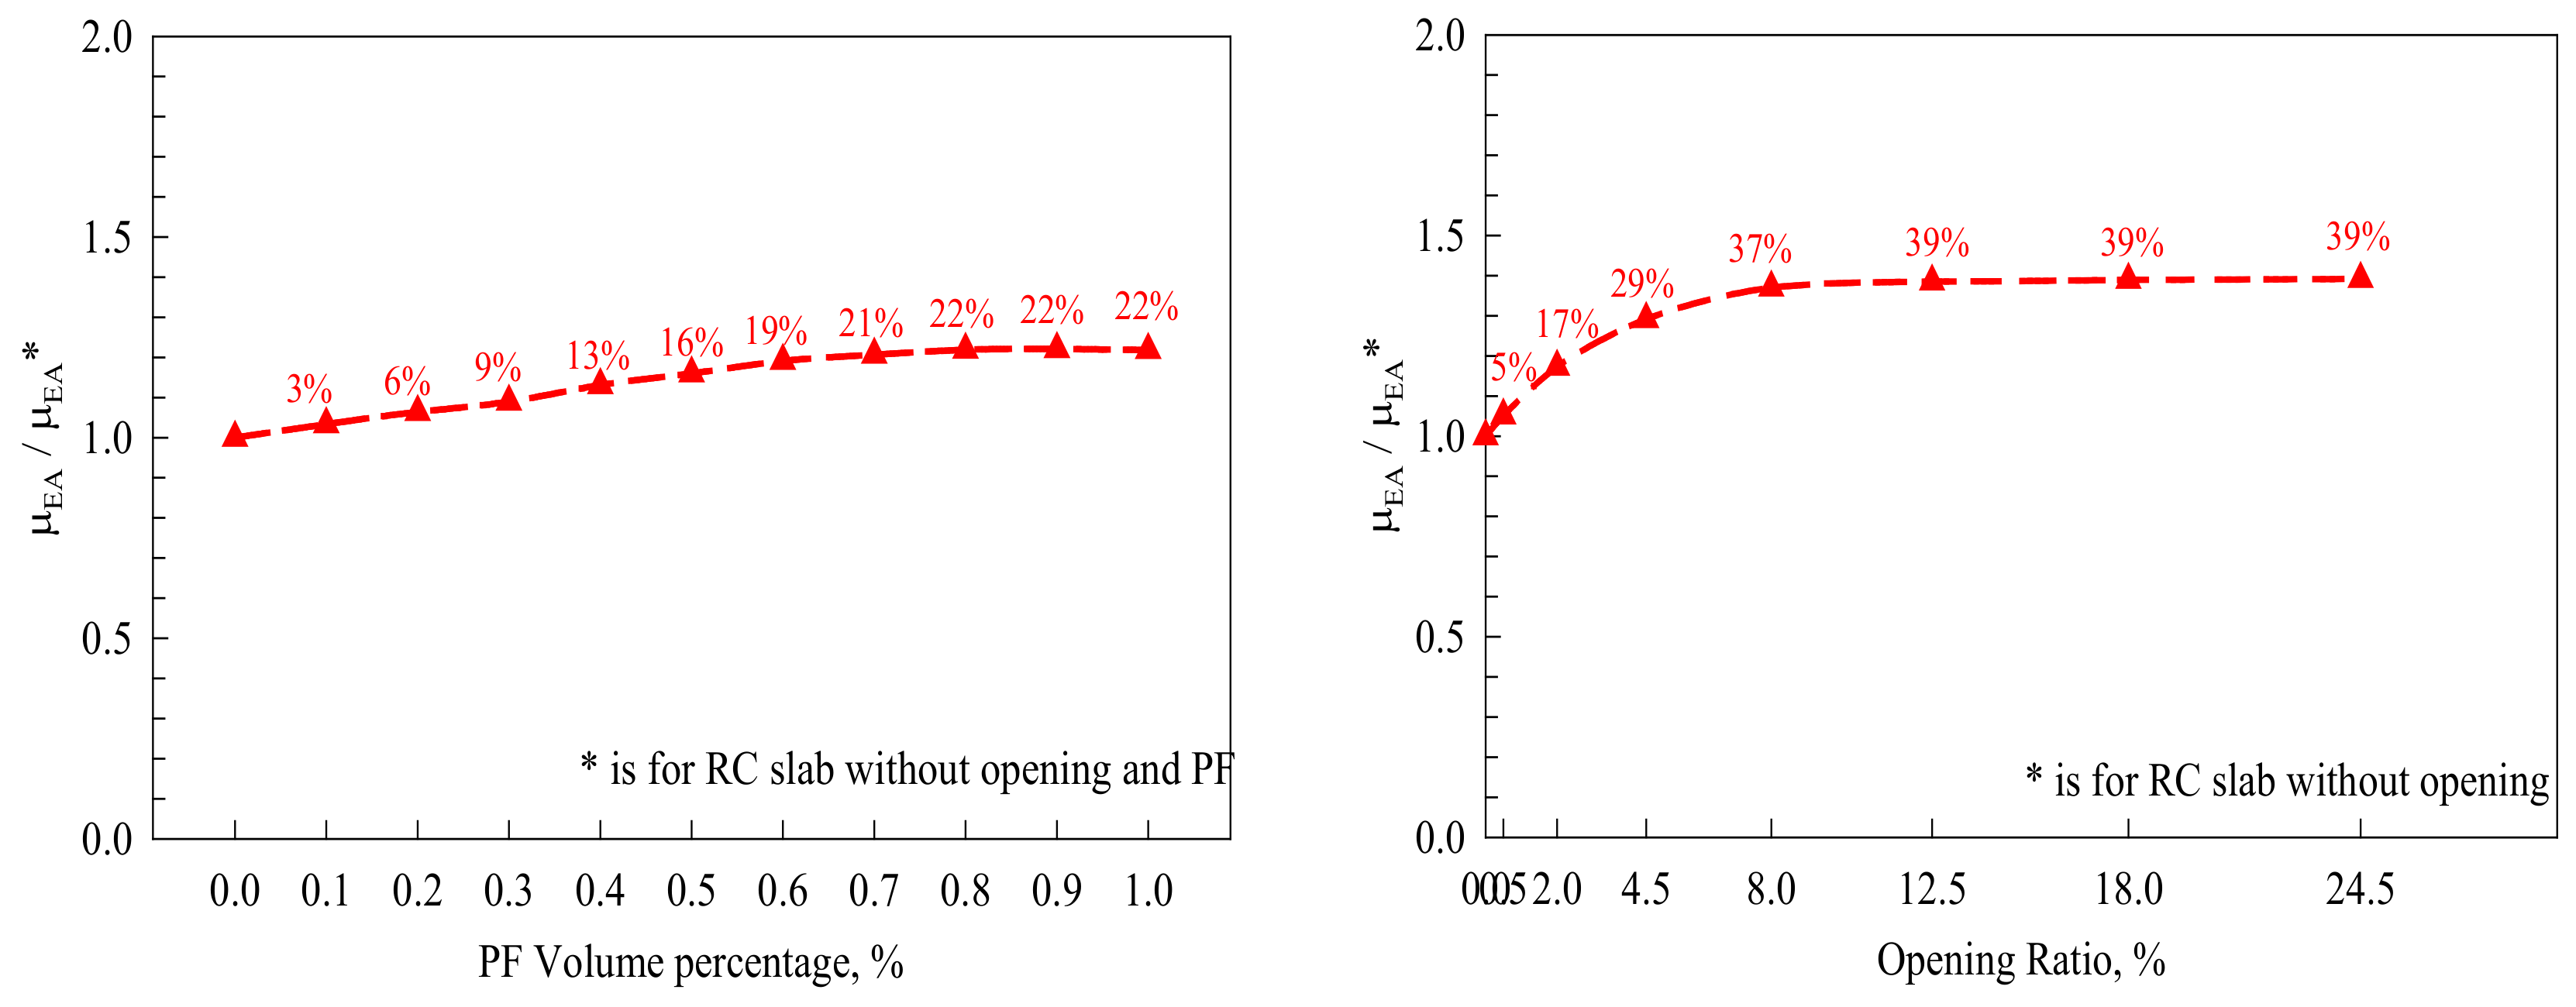
4.6. Ductility Index (Energy-Based Approach)
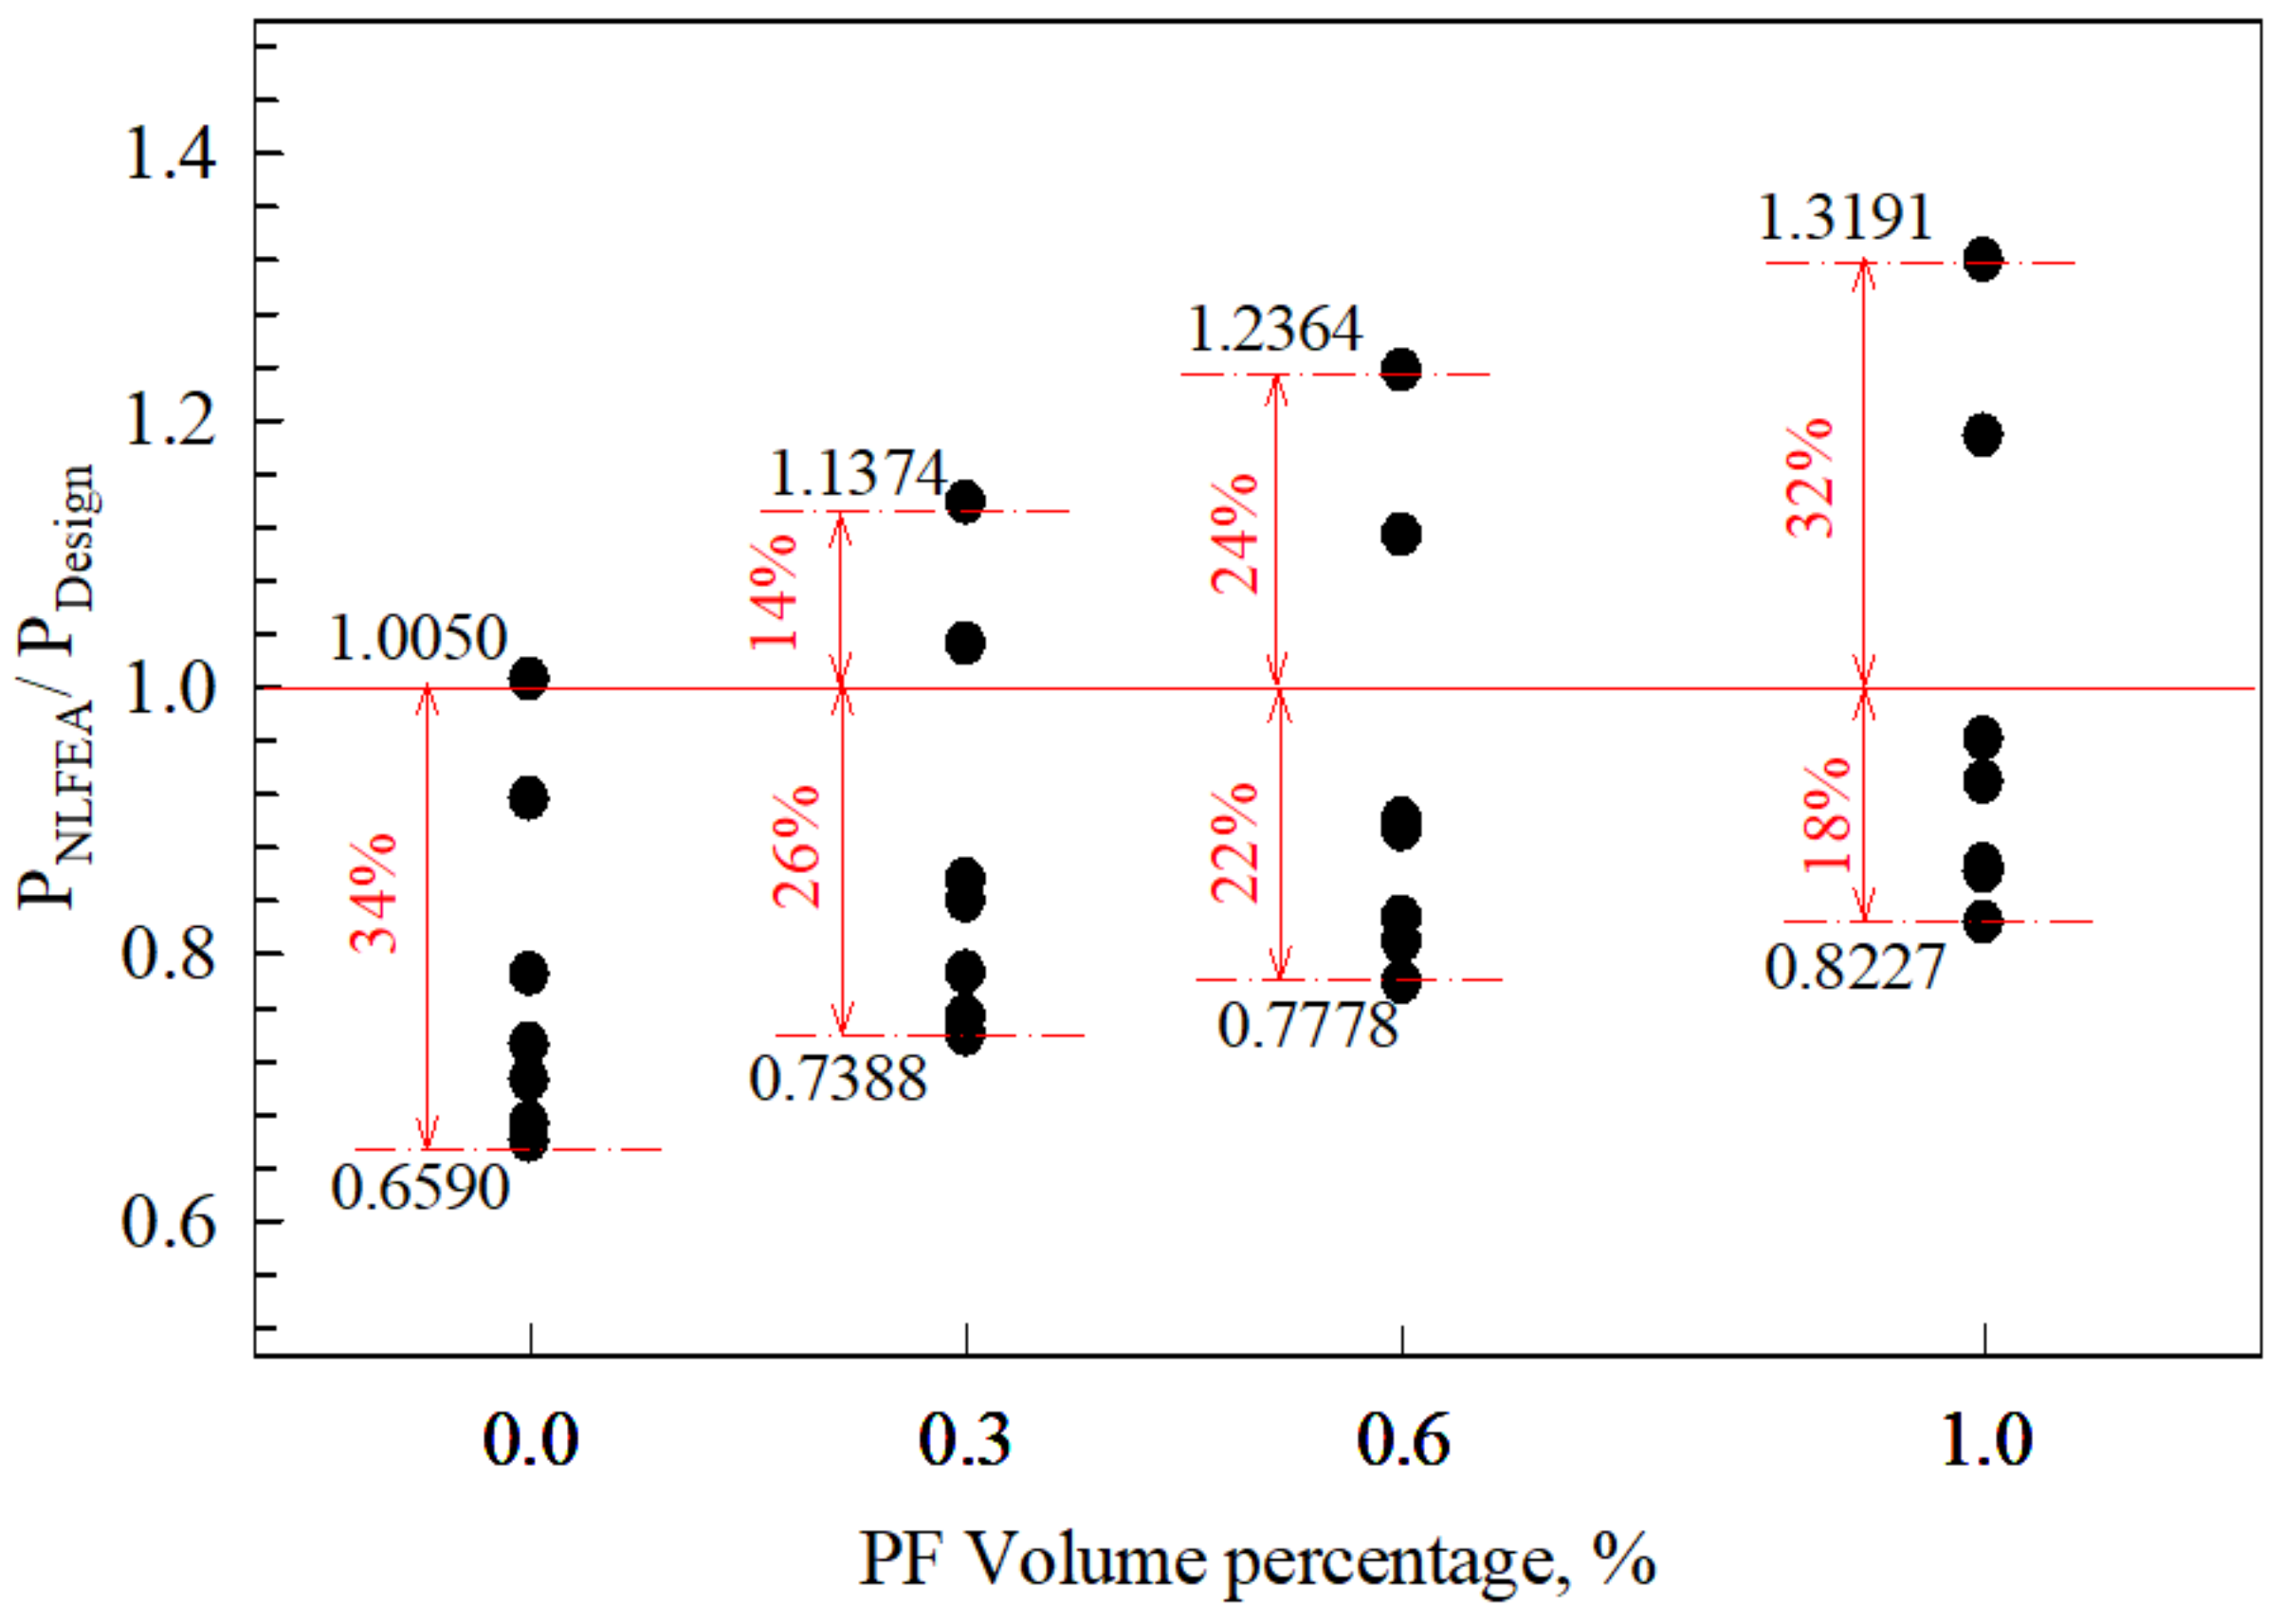
4.7. Strength Capacity Comparison
5. Conclusions
- The slab’s performance is improved proportionally by different percentages depending on the added PF volume fraction, including the slab’s overall structural characteristics, such as the ultimate and cracking load capacities, stiffness, and internal cracking stability.
- The slab’s opening ratio has an inversely proportional relationship with the slab’s behavior related to the stress concentration at the corners of the square openings and their associated cracking intensity.
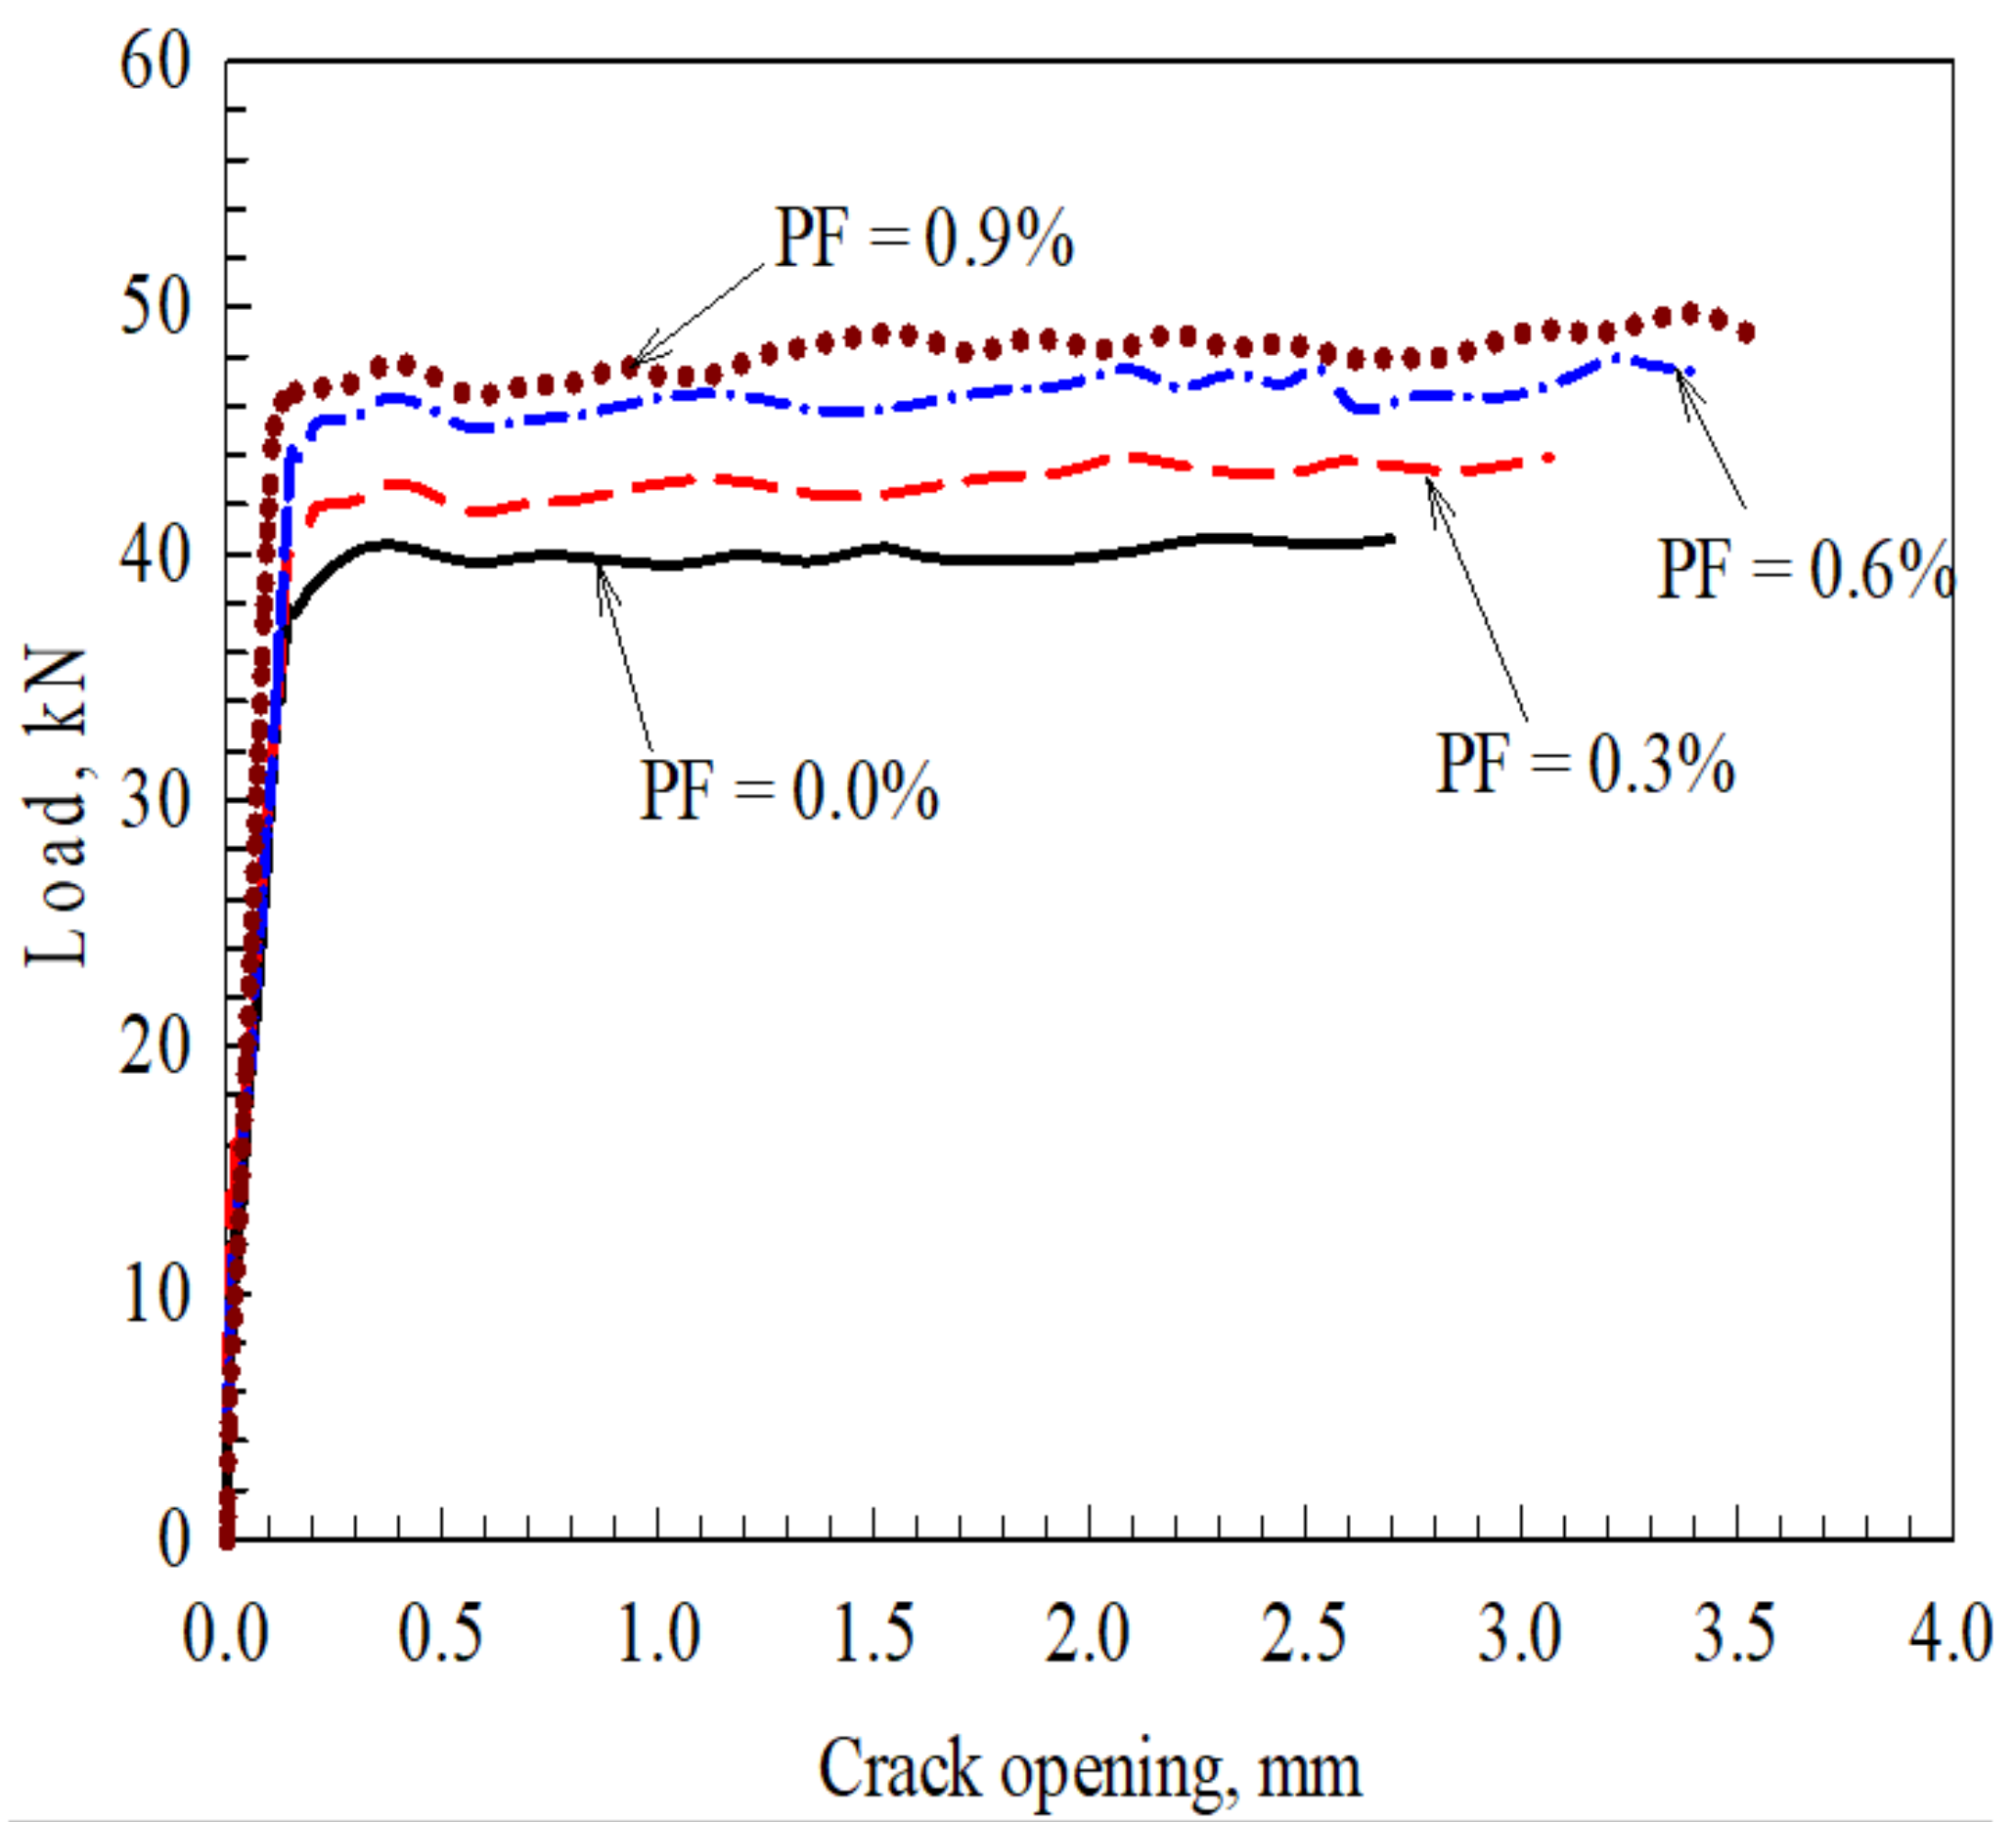
- PF’s ability to stabilize the propagated cracks is improved by 5, 13, and 16% for PF percentages of 0.3, 0.6, and 0.9%, respectively.
- Increasing the PF percentage or the opening size ratio resulted in a simultaneous increase in the concrete compressive strain and the steel tensile strain by different percentages. Moreover, a slab with an opening experienced larger steel strain values caused by the opening that was created as a result of the increased distance between the slab’s fiber at the compression side and the neutral axis of the flexural member.
- The slab’s load capacity could be predicted using the sectional analysis method with a 14–34% margin of safety resulting from the inclusion of the PF reinforcements.
- Based on the innovative NLFEA models, new guidelines were proposed to address the ultimate load-carrying capacity of the one-way RC slabs in terms of the PF percentage and the square opening ratio.
6. Recommendations
Author Contributions
Funding
Data Availability Statement
Acknowledgments
Conflicts of Interest
References
- Enochsson, O.; Lundqvist, J.; Täljsten, B.; Rusinowski, P.; Olofsson, T. CFRP strengthened openings in two-way concrete slabs—An experimental and numerical study. Constr. Build. Mater. 2007, 21, 810–826. [Google Scholar] [CrossRef]
- Alhassan, M.A.; Al Rousan, R.Z.; Hejazi, M.A.; Amaireh, L.K. Approximate analysis of quadrilateral slabs having various cases of boundary conditions and aspect ratios. Adv. Struct. Eng. 2021, 24, 1782–1797. [Google Scholar] [CrossRef]
- El-Mandouh, M.A.; Omar, M.S.; Abd El-Maula, A.S. RETRACTED: Behaviour of RC flat slabs with openings strengthened with CFRP. Case Stud. Constr. Mater. 2021, 15, e00587. [Google Scholar] [CrossRef]
- Al-Rousan, R.; Abo-Msamh, I. Bending and torsion behaviour of CFRP strengthened RC beams. Mag. Civ. Eng. 2019, 8, 48–62. [Google Scholar] [CrossRef]
- Oukaili, N.K.; Merie, H.D. CFRP strengthening efficiency on enhancement punching shear resistance of RC bubbled slabs with openings. Case Stud. Constr. Mater. 2021, 15, e00641. [Google Scholar] [CrossRef]
- El-Mandouh, M.A.; El-hassan, K.A. Cyclic behavior of high strength lightweight concrete slab-edge column connections with and without openings. Case Stud. Constr. Mater. 2022, 16, e00832. [Google Scholar] [CrossRef]
- Hussein, M.J.; Jabir, H.A.; Al-Gasham, T.S. Retrofitting of reinforced concrete flat slabs with cut-out edge opening. Case Stud. Constr. Mater. 2021, 14, e00537. [Google Scholar] [CrossRef]
- Yousef, A.M.; El-Metwally, S.E.; Askar, H.H.; El-Mandouh, M.A. Behavior of high-strength concrete interior slab-column connections with openings under seismic loading. Constr. Build. Mater. 2019, 214, 619–630. [Google Scholar] [CrossRef]
- Al-Rousan, R.; Al-Tahat, M. An Anchoring Groove Technique to Enhance the Bond Behavior between Heat-Damaged Concrete and CFRP Composites. Buildings 2020, 10, 232. [Google Scholar] [CrossRef]
- Mahlis, M.; Shoeib, A.E.; Abd Elnaby, S.; Sherif, A. The Effect of Cutting Openings on the Behavior of Two-way Solid Loaded Slabs. Structures 2018, 16, 137–149. [Google Scholar] [CrossRef]
- Keyvani, S.; Hoseini Vaez, S.R. Using DLO procedure to investigate the effect of openings on ultimate load and collapse pattern of slabs. Structures 2019, 20, 717–727. [Google Scholar] [CrossRef]
- Al-Rousan, R.Z. Failure analysis of polypropylene fiber reinforced concrete two-way slabs subjected to static and impact load induced by free falling mass. Lat. Am. J. Solids Struct. 2018, 15, e05. [Google Scholar] [CrossRef]
- Zainal, S.M.I.; Hejazi, F.; Mafaileh, A.M.A. Strengthening of Reinforced Concrete slabs using macro and micro synthetic fibers. Structures 2023, 51, 1579–1590. [Google Scholar] [CrossRef]
- Khajehdehi, R.; Panahshahi, N. Effect of openings on in-plane structural behavior of reinforced concrete floor slabs. J. Build. Eng. 2016, 7, 1–11. [Google Scholar] [CrossRef]
- Di Prisco, M.; Plizzari, G.; Vandewalle, L. Fibre reinforced concrete: New design perspectives. Mater. Struct. 2009, 42, 1261–1281. [Google Scholar] [CrossRef]
- Mohammed, N.S.; Hamza, B.A.; AL-Shareef, N.H.; Hussein, H.H. Structural Behavior of Reinforced Concrete Slabs Containing Fine Waste Aggregates of Polyvinyl Chloride. Buidings 2021, 11, 26. [Google Scholar] [CrossRef]
- Orouji, M.; Najaf, E. Effect of GFRP rebars and polypropylene fibers on flexural strength in high-performance concrete beams with glass powder and microsilica. Case Stud. Constr. Mater. 2023, 18, e01769. [Google Scholar] [CrossRef]
- Vafaei, D.; Ma, X.; Hassanli, R.; Duan, J.; Zhuge, Y. Experimental study on cyclic flexural behaviour of GFRP-reinforced seawater sea-sand concrete slabs with synthetic fibres. Ocean. Eng. 2023, 273, 114014. [Google Scholar] [CrossRef]
- Hassanli, R.; Manalo, A.; Vafaei, D.; Yekrangnia, M.; Elchalakani, M.; Noël, M. Cyclic behavior of GFRP-reinforced concrete one-way slabs with synthetic fibers. J. Build. Eng. 2023, 65, 105741. [Google Scholar] [CrossRef]
- Luca, G.; Sorelli, A.M.; Giovanni, A.P. Steel Fiber Concrete Slabs on Ground: A Structural Matter. ACI Struct. J. 2006, 103, 551–558. [Google Scholar] [CrossRef]
- Tiberti, G.; Minelli, F.; Plizzari, G. Reinforcement optimization of fiber reinforced concrete linings for conventional tunnels. Compos. Part B Eng. 2014, 58, 199–207. [Google Scholar] [CrossRef]
- Mobasher, B.; Yao, Y.; Soranakom, C. Analytical solutions for flexural design of hybrid steel fiber reinforced concrete beams. Eng. Struct. 2015, 100, 164–177. [Google Scholar] [CrossRef]
- Chiaia, B.; Fantilli, A.P.; Vallini, P. Combining fiber-reinforced concrete with traditional reinforcement in tunnel linings. Eng. Struct. 2009, 31, 1600–1606. [Google Scholar] [CrossRef]
- Barros, J.A.O.; Taheri, M.; Salehian, H. A model to simulate the moment–rotation and crack width of FRC members reinforced with longitudinal bars. Eng. Struct. 2015, 100, 43–56. [Google Scholar] [CrossRef]
- Sajedi, F.; Razak, H.A. Comparison of different methods for activation of ordinary Portland cement-slag mortars. Constr. Build. Mater. 2011, 25, 30–38. [Google Scholar] [CrossRef]
- Pujadas, P.; Blanco, A.; de la Fuente, A.; Aguado, A. Cracking behavior of FRC slabs with traditional reinforcement. Mater. Struct. 2012, 45, 707–725. [Google Scholar] [CrossRef]
- Fausto, M.; Giovanni, A.P. On the Effectiveness of Steel Fibers as Shear Reinforcement. ACI Struct. J. 2013, 110, 379–390. [Google Scholar] [CrossRef]
- Neil, M.H.; Denis, M. Progressive Collapse of Flat Plate Structures. ACI J. Proc. 1979, 76, 775–808. [Google Scholar] [CrossRef]
- Mitchell, D.; Cook, W.D. Preventing Progressive Collapse of Slab Structures. J. Struct. Eng. 1984, 110, 1513–1532. [Google Scholar] [CrossRef]
- Michels, J.; Waldmann, D.; Maas, S.; Zürbes, A. Steel fibers as only reinforcement for flat slab construction—Experimental investigation and design. Constr. Build. Mater. 2012, 26, 145–155. [Google Scholar] [CrossRef]
- Michels, J.; Christen, R.; Waldmann, D. Experimental and numerical investigation on postcracking behavior of steel fiber reinforced concrete. Eng. Fract. Mech. 2013, 98, 326–349. [Google Scholar] [CrossRef]
- Özkılıç, Y.O.; Aksoylu, C.; Yazman, Ş.; Gemi, L.; Arslan, M.H. Behavior of CFRP-strengthened RC beams with circular web openings in shear zones: Numerical study. Structures 2022, 41, 1369–1389. [Google Scholar] [CrossRef]
- Pujadas, P.; Blanco, A.; Cavalaro, S.; Aguado, A. Plastic fibres as the only reinforcement for flat suspended slabs: Experimental investigation and numerical simulation. Constr. Build. Mater. 2014, 57, 92–104. [Google Scholar] [CrossRef]
- Al-Rousan, R. Influence of polypropylene fibers on the flexural behavior of reinforced concrete slabs with different opening shapes and sizes. Struct. Concr. 2017, 18, 986–999. [Google Scholar] [CrossRef]
- ANSYS. ANSYS User’s Manual Revision 16.0; ANSYS, Inc.: Lebanon, NH, USA, 2016. [Google Scholar]
- Parviz, S.; Cha-Don, L. Distribution and Orientation of Fibers in Steel Fiber Reinforced Concrete. ACI Mater. J. 1990, 87, 433–439. [Google Scholar] [CrossRef]
- Alnemrawi, B.R.; Al-Rousan, R.Z.; Ababneh, A.N. The Structural Behavior of Heat-Damaged Flat Slabs with Openings of Different Sizes and Locations. Arab. J. Sci. Eng. 2023, 1–28. [Google Scholar] [CrossRef]


| PF Volume Fraction | Opening Ratio | |||||||
|---|---|---|---|---|---|---|---|---|
| 0.0% | 0.5% | 2.0% | 4.5% | 8% | 12.5% | 18.0% | 24.5% | |
| 0.0% | 40.68 [40.60] | 39.00 | 36.20 [34.40] | 26.44 [24.10] | 19.16 [17.20] | 14.70 | 12.41 | 11.00 |
| 0.1% | 41.91 | 39.74 | 37.58 | 27.65 | 20.09 | 15.14 | 12.89 | 11.54 |
| 0.2% | 43.03 | 40.94 | 38.84 | 28.79 | 20.96 | 15.55 | 13.32 | 12.03 |
| 0.3% | 44.06 [44.30] | 42.03 | 39.99 [37.90] | 29.86 [27.20] | 21.75 [19.70] | 15.92 | 13.72 | 12.49 |
| 0.4% | 44.99 | 43.00 | 41.02 | 30.86 | 22.48 | 16.26 | 14.07 | 12.91 |
| 0.5% | 45.81 | 43.87 | 41.93 | 31.78 | 23.14 | 16.56 | 14.38 | 13.29 |
| 0.6% | 46.54 [46.30] | 44.63 | 42.72 [39.9] | 32.63 [29.30] | 23.73 [21.10] | 16.82 | 14.65 | 13.62 |
| 0.7% | 47.17 | 45.28 | 43.39 | 33.41 | 24.25 | 17.04 | 14.88 | 13.92 |
| 0.8% | 47.69 | 45.82 | 43.95 | 34.11 | 24.70 | 17.23 | 15.07 | 14.18 |
| 0.9% | 48.12 [48.20] | 46.25 | 44.38 [42.30] | 34.75 [31.30] | 25.08 [22.50] | 17.39 | 15.22 | 14.40 |
| 1.0% | 48.45 | 46.57 | 44.70 | 35.31 | 25.40 | 17.51 | 15.33 | 14.58 |
| Slab | Cracking | Yielding | Ultimate | ||||||
|---|---|---|---|---|---|---|---|---|---|
| Load, kN | Deflection, mm | Stiffness, kN/mm | Load, kN | Deflection, mm | Stiffness, kN/mm | Load, kN | Deflection, mm | Stiffness, kN/mm | |
| SPF0.0OP0.0 | 10 | 1.34 | 7.46 | 40.00 | 11.39 | 3.51 | 40.68 | 23.19 | 1.75 |
| SPF0.0OP0.5 | 9.61 | 1.34 | 7.17 | 38.42 | 11.39 | 3.37 | 39 | 24.19 | 1.61 |
| SPF0.0OP2.0 | 8.92 | 1.34 | 6.66 | 35.71 | 11.39 | 3.14 | 36.2 | 25.39 | 1.43 |
| SPF0.0OP4.5 | 6.51 | 1.34 | 4.86 | 26.05 | 11.39 | 2.29 | 26.44 | 27.59 | 0.96 |
| SPF0.0OP8.0 | 4.72 | 1.34 | 3.52 | 18.88 | 11.39 | 1.66 | 19.16 | 29.79 | 0.64 |
| SPF0.0OP12.5 | 3.62 | 1.34 | 2.7 | 14.48 | 11.39 | 1.27 | 14.7 | 31.99 | 0.46 |
| SPF0.0OP18.0 | 3.06 | 1.34 | 2.28 | 12.23 | 11.39 | 1.07 | 12.41 | 33.19 | 0.37 |
| SPF0.0OP24.5 | 2.71 | 1.34 | 2.02 | 10.84 | 11.39 | 0.95 | 11.00 | 35.39 | 0.31 |
| SPF0.1OP0.0 | 10.32 | 1.34 | 7.70 | 41.28 | 11.39 | 3.62 | 41.91 | 24.19 | 1.73 |
| SPF0.2OP0.0 | 10.6 | 1.34 | 7.91 | 42.20 | 11.39 | 3.71 | 43.03 | 25.39 | 1.69 |
| SPF0.3OP0.0 | 10.85 | 1.34 | 8.10 | 43.41 | 11.39 | 3.81 | 44.06 | 26.59 | 1.66 |
| SPF0.4OP0.0 | 11.08 | 1.34 | 8.27 | 44.33 | 11.39 | 3.89 | 44.99 | 27.79 | 1.62 |
| SPF0.5OP0.0 | 11.28 | 1.34 | 8.42 | 45.13 | 11.39 | 3.96 | 45.81 | 28.99 | 1.58 |
| SPF0.6OP0.0 | 11.46 | 1.34 | 8.55 | 45.85 | 11.39 | 4.03 | 46.54 | 30.19 | 1.54 |
| SPF0.7OP0.0 | 11.62 | 1.34 | 8.67 | 46.47 | 11.39 | 4.08 | 47.17 | 31.39 | 1.50 |
| SPF0.8OP0.0 | 11.75 | 1.34 | 8.77 | 46.99 | 11.39 | 4.13 | 47.69 | 32.59 | 1.46 |
| SPF0.9OP0.0 | 11.85 | 1.34 | 8.84 | 47.41 | 11.39 | 4.16 | 48.12 | 33.79 | 1.42 |
| SPF1.0OP0.0 | 11.93 | 1.34 | 8.90 | 47.73 | 11.39 | 4.19 | 48.45 | 34.99 | 1.38 |
| Slab | Energy Absorption, kN.mm | Ductility | ||||
|---|---|---|---|---|---|---|
| Elastic | Yielding | Ultimate | Total | Displacement | Energy | |
| SPF0.0OP0.0 | 7.38 | 253.84 | 478.6 | 739.82 | 2.04 | 1.89 |
| SPF0.0OP0.5 | 7.08 | 243.83 | 498.74 | 749.65 | 2.12 | 2.05 |
| SPF0.0OP2.0 | 6.57 | 226.33 | 506.37 | 739.27 | 2.23 | 2.24 |
| SPF0.0OP4.5 | 4.80 | 165.41 | 428.01 | 598.22 | 2.42 | 2.59 |
| SPF0.0OP8.0 | 3.48 | 119.79 | 352.32 | 475.59 | 2.62 | 2.94 |
| SPF0.0OP12.5 | 2.67 | 91.91 | 302.65 | 397.23 | 2.81 | 3.29 |
| SPF0.0OP18.0 | 2.25 | 77.59 | 270.39 | 350.23 | 2.91 | 3.48 |
| SPF0.0OP24.5 | 2.00 | 68.77 | 232.08 | 302.85 | 3.11 | 3.37 |
| SPF0.1OP0.0 | 7.61 | 261.96 | 535.81 | 805.38 | 2.12 | 2.05 |
| SPF0.2OP0.0 | 7.82 | 269.07 | 601.99 | 878.88 | 2.23 | 2.24 |
| SPF0.3OP0.0 | 8.00 | 275.47 | 669.19 | 952.66 | 2.33 | 2.43 |
| SPF0.4OP0.0 | 8.14 | 281.4 | 737.3 | 1026.84 | 2.44 | 2.62 |
| SPF0.5OP0.0 | 8.32 | 286.41 | 805.71 | 1100.44 | 2.55 | 2.81 |
| SPF0.6OP0.0 | 8.45 | 290.98 | 874.4 | 1173.83 | 2.65 | 3.01 |
| SPF0.7OP0.0 | 8.56 | 294.91 | 960.78 | 1264.25 | 2.76 | 3.26 |
| SPF0.8OP0.0 | 8.66 | 298.16 | 1010.46 | 1317.28 | 2.86 | 3.39 |
| SPF0.9OP0.0 | 8.74 | 300.85 | 1077.32 | 1386.91 | 2.97 | 3.58 |
| SPF1.0OP0.0 | 8.80 | 302.92 | 1142.84 | 1454.56 | 3.07 | 3.77 |
Disclaimer/Publisher’s Note: The statements, opinions and data contained in all publications are solely those of the individual author(s) and contributor(s) and not of MDPI and/or the editor(s). MDPI and/or the editor(s) disclaim responsibility for any injury to people or property resulting from any ideas, methods, instructions or products referred to in the content. |
© 2024 by the authors. Licensee MDPI, Basel, Switzerland. This article is an open access article distributed under the terms and conditions of the Creative Commons Attribution (CC BY) license (https://creativecommons.org/licenses/by/4.0/).
Share and Cite
Al-Rousan, R.; Alnemrawi, B.R. NLFEA of the Behavior of Polypropylene-Fiber-Reinforced Concrete Slabs with Square Opening. Buildings 2024, 14, 480. https://doi.org/10.3390/buildings14020480
Al-Rousan R, Alnemrawi BR. NLFEA of the Behavior of Polypropylene-Fiber-Reinforced Concrete Slabs with Square Opening. Buildings. 2024; 14(2):480. https://doi.org/10.3390/buildings14020480
Chicago/Turabian StyleAl-Rousan, Rajai, and Bara’a R. Alnemrawi. 2024. "NLFEA of the Behavior of Polypropylene-Fiber-Reinforced Concrete Slabs with Square Opening" Buildings 14, no. 2: 480. https://doi.org/10.3390/buildings14020480
APA StyleAl-Rousan, R., & Alnemrawi, B. R. (2024). NLFEA of the Behavior of Polypropylene-Fiber-Reinforced Concrete Slabs with Square Opening. Buildings, 14(2), 480. https://doi.org/10.3390/buildings14020480