Article

Plastic Zone Radius Criteria for Crack Propagation Angle Evaluated with Experimentally Obtained Displacement Fields

by
Jorge Guillermo Díaz-Rodríguez
1,*,
Alberto David Pertúz-Comas
2,
Oscar Rodolfo Bohórquez-Becerra
3,
Arthur Martins Barbosa Braga
4 and
Darío Prada-Parra
4
1
Escuela de Ingeniería y Ciencias, Tecnológico de Monterrey, Guadalajara 45201, Mexico
2
GIC, Grupo de Investigaciones en Corrosión, Escuela de Ingeniería Mecánica, Universidad Industrial de Santander, Bucaramanga 680002, Colombia
3
GIEMA, Grupo de Investigación en Energía y Medio Ambiente, Escuela de Ingeniería Mecánica, Universidad Industrial de Santander, Bucaramanga 680002, Colombia
4
Department of Mechanical Engineering, Pontifical Catholic University of Rio de Janeiro, Gávea, Rio de Janeiro 22451-900, Brazil
*
Author to whom correspondence should be addressed.
Buildings 2024, 14(2), 495; https://doi.org/10.3390/buildings14020495
Submission received: 15 December 2023 / Revised: 1 February 2024 / Accepted: 7 February 2024 / Published: 10 February 2024
(This article belongs to the Special Issue Research on the Crack Control of Concrete)

Abstract

:
The monitoring and maintenance of cracked structures are generally carried out using structural integrity assessments. The plastic zone (PZ) crack path (CP) criteria state that a crack grows in a specific direction when the radius of the plastic zone ahead of the crack tip reaches a minimum value. The PZ can be evaluated using stress intensity factors (SIFs). The SIFs under mixed-mode loading were extracted from the literature from three samples: two single edge notch tension (SENT) samples (E = 2.5 GPa, v = 0.38) made from polycarbonate and one modified compact test (C(T)) sample made from low-carbon steel (E = 200 GPa, v = 0.3). In addition, the CP angle was evaluated for the W and R criteria with experimental data, which included non-linear effects such as fatigue-induced plasticity, crack roughness, and debris. It was found that both can predict the CP for lateral cracks in both tested materials and monotonic and cyclic load when the mode mixity does not change considerably from one crack length to the next or goes beyond 0.2. Moreover, the R criterion exhibited an error as high as 1.7%, whereas the W criterion showed a 6% error on the last crack length for the low-carbon steel sample under cyclic load, which had a 100% increase in mode mixity. Finally, the applicability of LEFM was checked, while the CP was sought by finding the size of the PZ.

1. Introduction

In the maintenance of cracked components and structures, the crack front advance rate needs to be established and monitored [1,2,3]. However, in the case of mixed-mode loading, factors such as plasticity [4], crack interlocking, crack rugosity [5], trapped debris [6], and crack tip vicinity to defects [7], among others, may affect the crack growth rate and crack path (CP). Thus, CP prediction is not entirely understood [1,2,4,5,8,9,10]. According to [11], the more kinked the crack is, the more crack growth might be retarded. Nevertheless, for crack kinking and equivalent SIFs, there are already several postulated criteria [1,12], mainly based on linear elastic fracture mechanics (LEFM), with the maximum tangential stress criteria being the most used for mixed-mode loading [10]. However, the applicability of LEFM must be checked [13,14] before a suitable model can be applied. Using a model that checks the applicability and predicts CP simplifies those two tasks.
Overall, it can be said that all CP prediction models state a hypothesis for a crack to change direction by a small Δθ from its original path. Such an increment is generally created when an equivalent SIF (Keq) exceeds material toughness (KIc) [10,13] in the LEFM approach. Wasiluk and Golos [8] proposed a model based on a dimensionless plastic zone radius, Pzr. Ren et al. [15] proposed a model based on the plastic zone radius and evaluated it for plane stress and plane strain conditions. Both models were devised for a central crack. Comprehensive reviews of CP models can be found in [1,12].
Although the CP models described here use SIFs (monotonic load), in the literature [12,16,17], a swap between monotonic SIF (K) and fatigue SIF range (ΔK) for proportional load was found to be acceptable. This means that a crack grows under fatigue loading if ΔKeq exceeds the fatigue threshold (ΔKth), or the crack grows under static loading when the equivalent SIF (Keq) exceeds the fracture toughness (Kc), as has been postulated before [16]. Finally, we can say that SENT samples have gained popularity in testing pipelines [18] and welds or offer less restriction [6,19], and C(T) samples offer a larger space to observe CP evolution [20,21,22]. Lately, some researchers have devoted efforts to evaluating CP in complex problems using artificial intelligence, such as heterogeneous materials [7], metamaterials [23], or composites [24]. However, the computational cost might not be worth it for isotropic materials where parametric and less computationally costly models are sufficient for prediction.
Although both evaluated models were proposed for monotonic central cracks in infinite plates, this paper evaluates them on lateral cracks and, at the same time, assesses the applicability of LEFM in fatigue and monotonic loading. Furthermore, the models are evaluated with experimental data that include non-linear effects such as fatigue-induced plasticity (which induces hardening ahead of the crack tip, which may produce crack retardation), crack roughness, crack interlocking (which might hinder the full development of mode II), and trapped debris (which keep the crack open, thus accelerating mode I propagation). Our literature review revealed that the combination of such non-linearities cannot yet be numerically reproduced. Therefore, the first set of experimental data is for proportional fatigue load [25], whereas the second set is for proportional monotonic load [26], both under different mode mixity ratios (KII/KI). The first data set was obtained using the digital image correlation (DIC) technique, whereas the second set was obtained through finite element modeling (FEM) and validated with photoelasticity. The performance of both CP models is shown along the crack length.
The rest of the paper is organized as follows: Section 2 describes the basis for the CP used; Section 3 explains the experimental details of where the data were obtained from; Section 4 groups the CP prediction and discusses the results attributable to the appropriate phenomena; and Section 5 draws the conclusions and presents the findings.

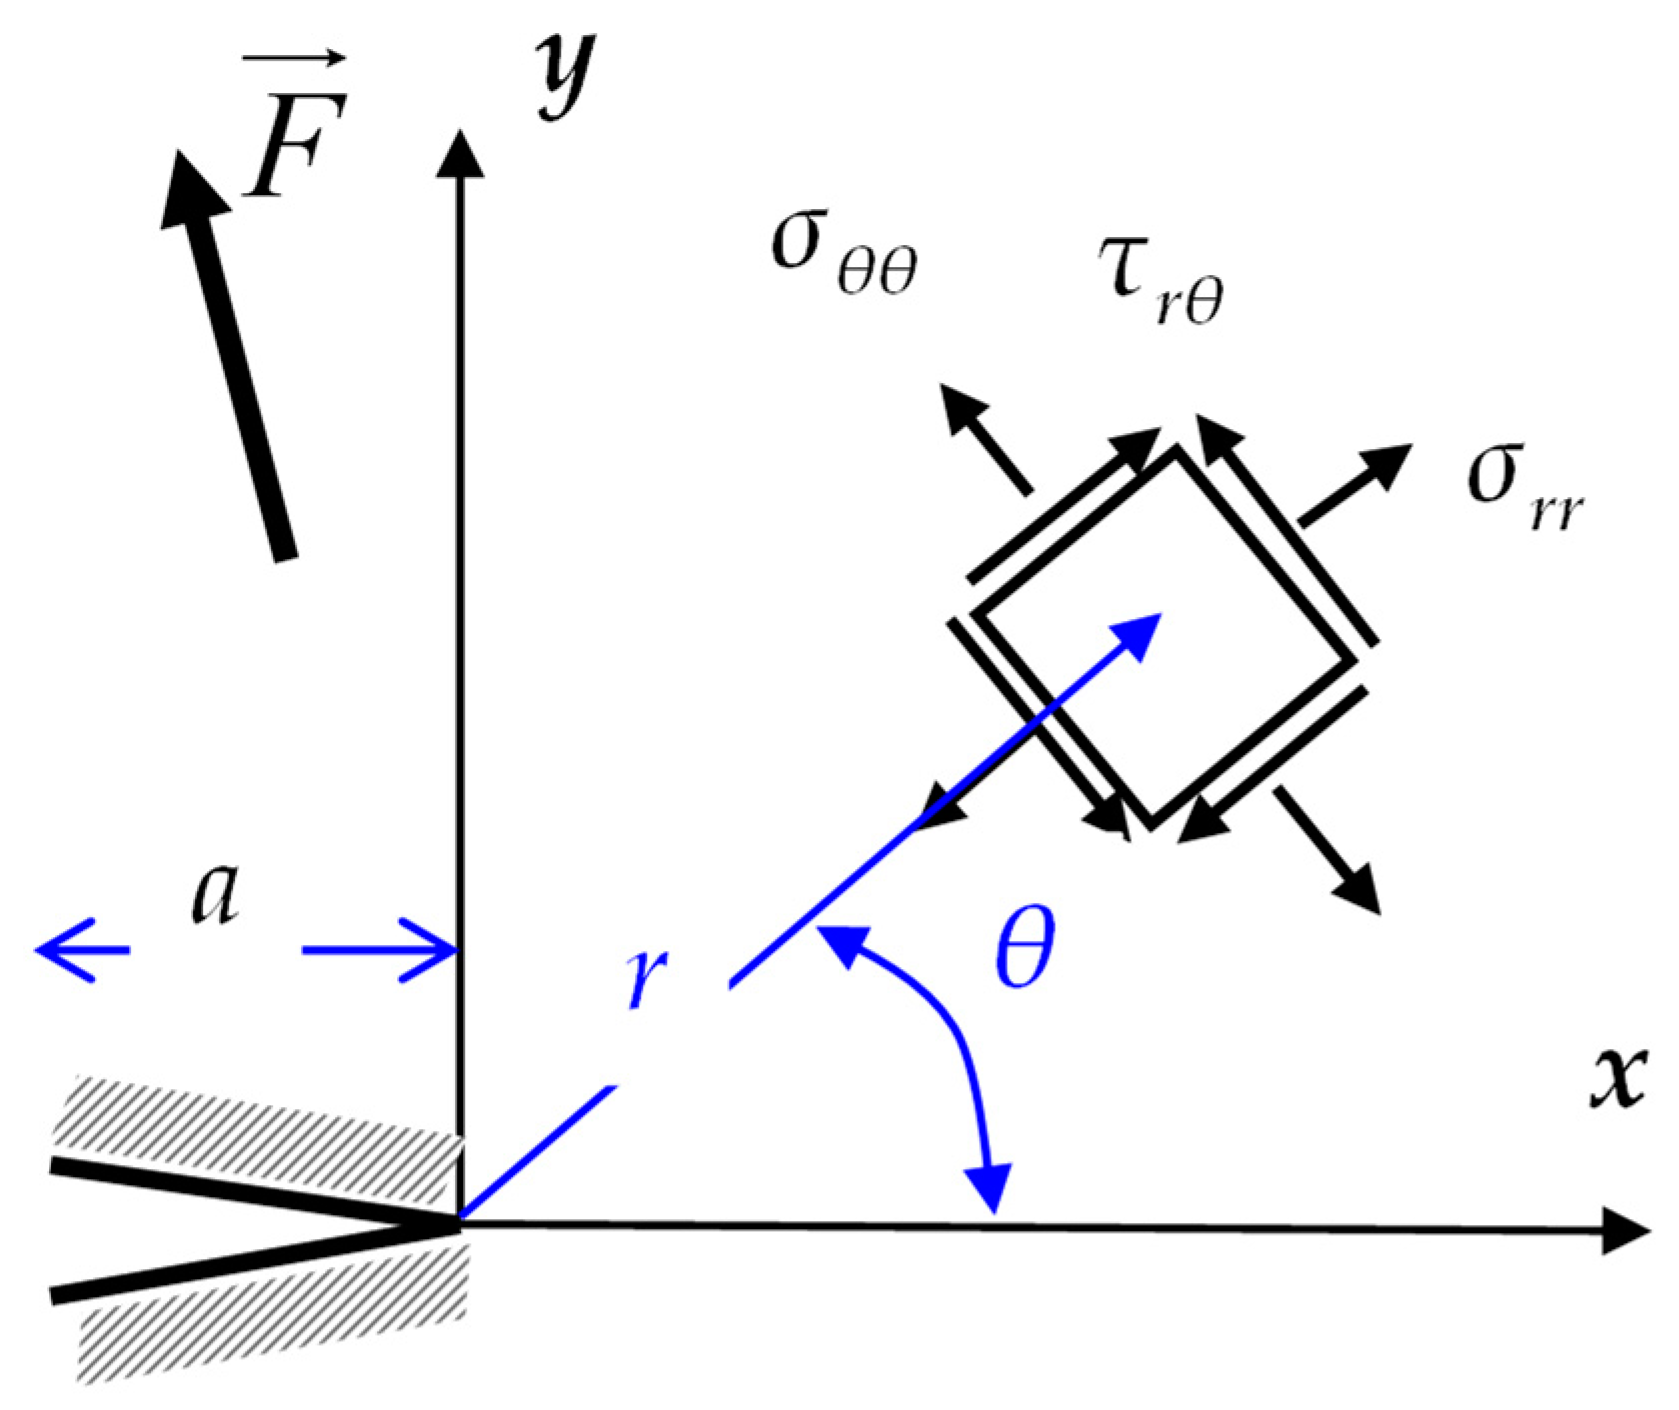
2. Criteria for the Crack Path

The stress field in a cracked body under an applied force F is schematically represented in Figure 1, where σ and τ are the normal and shear stress, respectively, r and θ are the radial and tangential directions, respectively, and a is the crack length.
In 2000, Wasiluk and Golos proposed the W criterion [8]. It states that a central crack under mixed-mode loading grows in the direction where the radius from the crack tip to the boundary of the plastic zone is the shortest [8]. They started from the radius of the plastic zone, rpz, proposed by Pook [27] for mode I and II loading and compared the stress field with the von Misses yield criteria for a plate with a centrally inclined crack, as shown in Equation (1).
r p z = 1 2 π σ y 2 K I 2 cos 2 θ 2 1 + 3 sin 2 θ 2 + K I K I I sin θ 3 cos θ 1 + K I I 2 3 + sin 2 θ 2 1 9 sin 2 θ 2
where σy is the yield stress and KI and KII are the SIFs in modes I and II, respectively. Then, W is the factor of dividing rpz over half the crack length, and using KI = σsinπa and KII = σsinθcosθπa, we obtained Equation (2).
W = σ 2 2 σ y 2 sin 4 θ W cos 2 θ 2 1 + 3 sin 2 θ 2 + + sin 4 θ W sin θ 3 cos θ 1 + sin 2 θ W cos 2 θ W 3 + sin 2 θ 2 1 9 sin 2 θ 2
Thus, taking the first and second derivative of W, Equation (2) with respect to θ, as seen in Equation (3), gives a Wmin at which the direction of crack growth, θW, will happen.
W ( θ , θ * , σ ) θ | θ = θ * = 0   and   2 W ( θ , θ * , σ ) θ 2 | θ = θ * > 0
Then, if the applied load is cyclic, SIF, K, becomes the SIF range, ΔK, and the fracture toughness, Kc, becomes the fatigue threshold, ΔKth, as proposed and tested in [17], so Equation (1) can be rewritten as Equation (4).
r p z W = 1 2 π σ y 2 Δ K I 2 cos 2 θ 2 1 + 3 sin 2 θ 2 + Δ K I Δ K I I sin θ 3 cos θ 1 + + Δ K I I 2 3 + sin 2 θ 2 1 9 sin 2 θ 2
On the other hand, in 2014, Ren [15] proposed a model based on the PZ radius and evaluated it for plane stress and plane strain conditions for a centrally inclined crack. The radius of the plastic zone is shown in Equation (5).
r p z = 1 2 π σ y 2 K I 2 2 1 2 ν 2 3 1 + cos θ + sin 2 θ + 2 K I K I I sin 2 θ 2 1 2 ν 2 3 + + K I I 2 1 + 2 1 2 ν 2 3 1 cos θ 3 + cos 2 θ
where ν is Poisson’s modulus. Moreover, assuming the interchangeability of K and ΔK and Kc with ΔKth, Equation (5) for monotonic loading can be rewritten as Equation (6) for fatigue loading.
r p z = 1 2 π σ y 2 Δ K I 2 2 1 2 ν 2 3 1 + cos θ + sin 2 θ + 2 Δ K I Δ K I I sin 2 θ 2 1 2 ν 2 3 + + Δ K I I 2 1 + 2 1 2 ν 2 3 1 cos θ 3 + cos 2 θ
where ΔK is the SIF range, and ΔKth is the fatigue threshold. It is noted how the PZ can give an insight into crack initiation at the shortest radius. Furthermore, an analysis of Equations (4) and (6) gives the angles at which the minimum radius occurs. This is 0° for mode I and 82.5° for pure mode II in the R criterion and 77° in the W criterion. Furthermore, Figure 2 shows how the PZ changes for different mode mixity (KII/KI) ratios for both the W and R criteria, with the latter plotted for plain stress. The PZ is plotted for different mode mixity ratios, from pure mode I, KII/KI = 0, until pure mode II, KII/KI = ∞, but keeping Keq constant, Keq = √(KI2 + KII2) = 1. Both KI and KII were always kept positive. A negative KI does not make physical sense as it requires the crack lips to overlap, whereas a negative KII implies the relative displacements of two opposite-to-crack points. It can be seen how the PZ changes the applied load’s direction.
One can see in Figure 2 that the crack orientation of the PZ changes from perpendicular to the tensile stress, mode I, to parallel to the shear stress, mode II. Therefore, a parameter, M [9,28], is used to tell whether the crack growth is dominated by the tensile mode or the shear mode, as shown in Equation (7).
M = 2 π tan 1 K I I K I

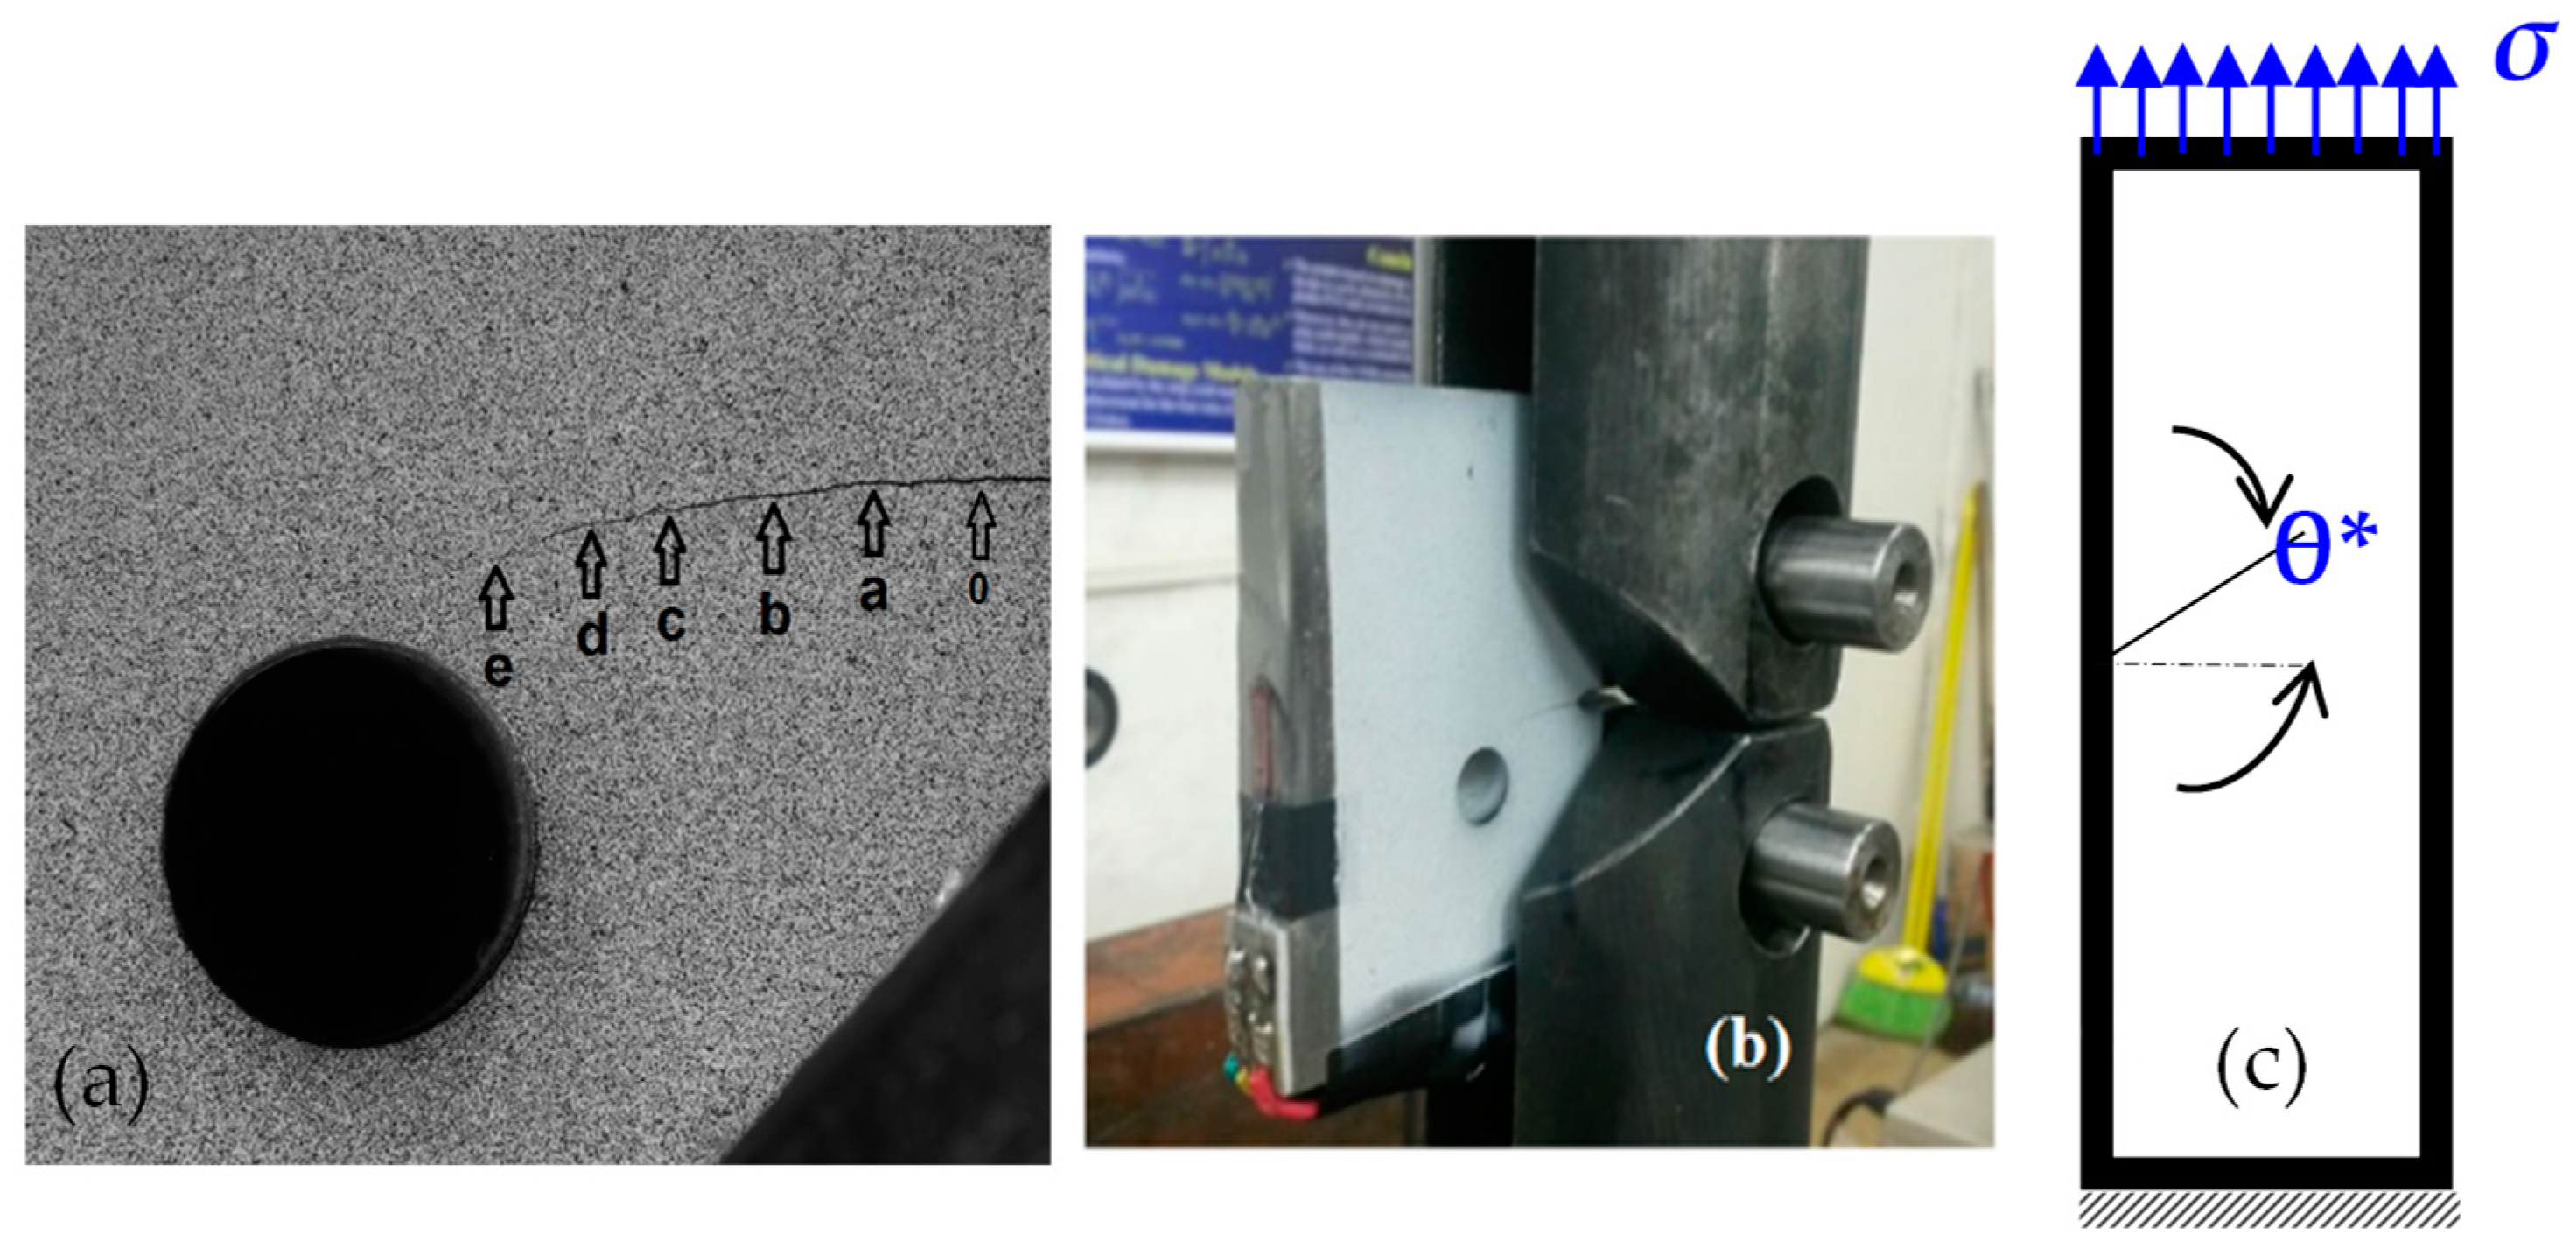
3. Materials and Methods

The data used to evaluate the two CP models were obtained from two samples subjected to proportional loading tests. The first was an 8.7 mm thick modified compact test C(T) specimen made out of low-carbon steel (E = 200 GPa, v = 0.3) with a drilled hole in front of the CP to modify the stress field [25], as seen in Figure 3a, with the testing setup shown in Figure 3b. Miranda tested a similar sample [29], with the results computationally verified later on [22]. The experimentally observed CP for this sample and the six measured points are shown in Figure 3a. The hole modified the stress field, which curved the crack and induced opening mode II over the applied mode I load. Moreover, because the load inversion ratio was 0.1, the SIF range (ΔK) was calculated as Kmax–Kmin from DIC displacement measurements and verified through FEM [30]. Table 1 shows this sample’s retrieved crack length, CP angle, SIF ranges, and mode mixity for the six measured points. Finally, the fatigue loading rate for the modified C(T) sample was applied at 10 Hz, and for about every 1 mm of crack growth, the load frequency was lowered to 0.1 Hz to allow for image recording for DIC analysis.
Because the applied load on this sample was cyclic, Equations (4) and (6) were used to establish the sample’s PZ radius and shape. Extensive details about this test and specifics on how the SIFs were calculated can be found in [25].
As stated before, the displacement fields for the modified C(T) were measured using the DIC technique. It provides independent displacement fields using non-contact optical measurements. Once displacements are obtained, one can compute strains, and by using a constitutive law, stresses can be calculated. In-depth details for DIC, including its capabilities, limitations, and implementation, can be found in [30].
The second type of samples was two 3 mm thick polycarbonate (E = 2.5 GPa, v = 0.38) SENT samples [26], see the schematics in Figure 3c, subjected to simple remote tension with a 22.5°crack and another with a 45° inclined pre-existing crack producing mixed-mode (I and II) loading conditions. The retrieved data included SIF modes I and II, obtained through numerical simulation and validated with photoelasticity, shown in Table 2, where a/W is the dimensionless residual ligament. Because the applied loading on these samples was monotonic, Equations (1) and (5) were used to establish the PZ radius and shape.
Finally, the performance of the CP models was evaluated with the expression proposed in Equation (8), as recently proposed [31].
e r r = θ exp θ * π
where θexp is the experimental CP angle and θ* is the angle predicted by either model.

4. Results and Discussion

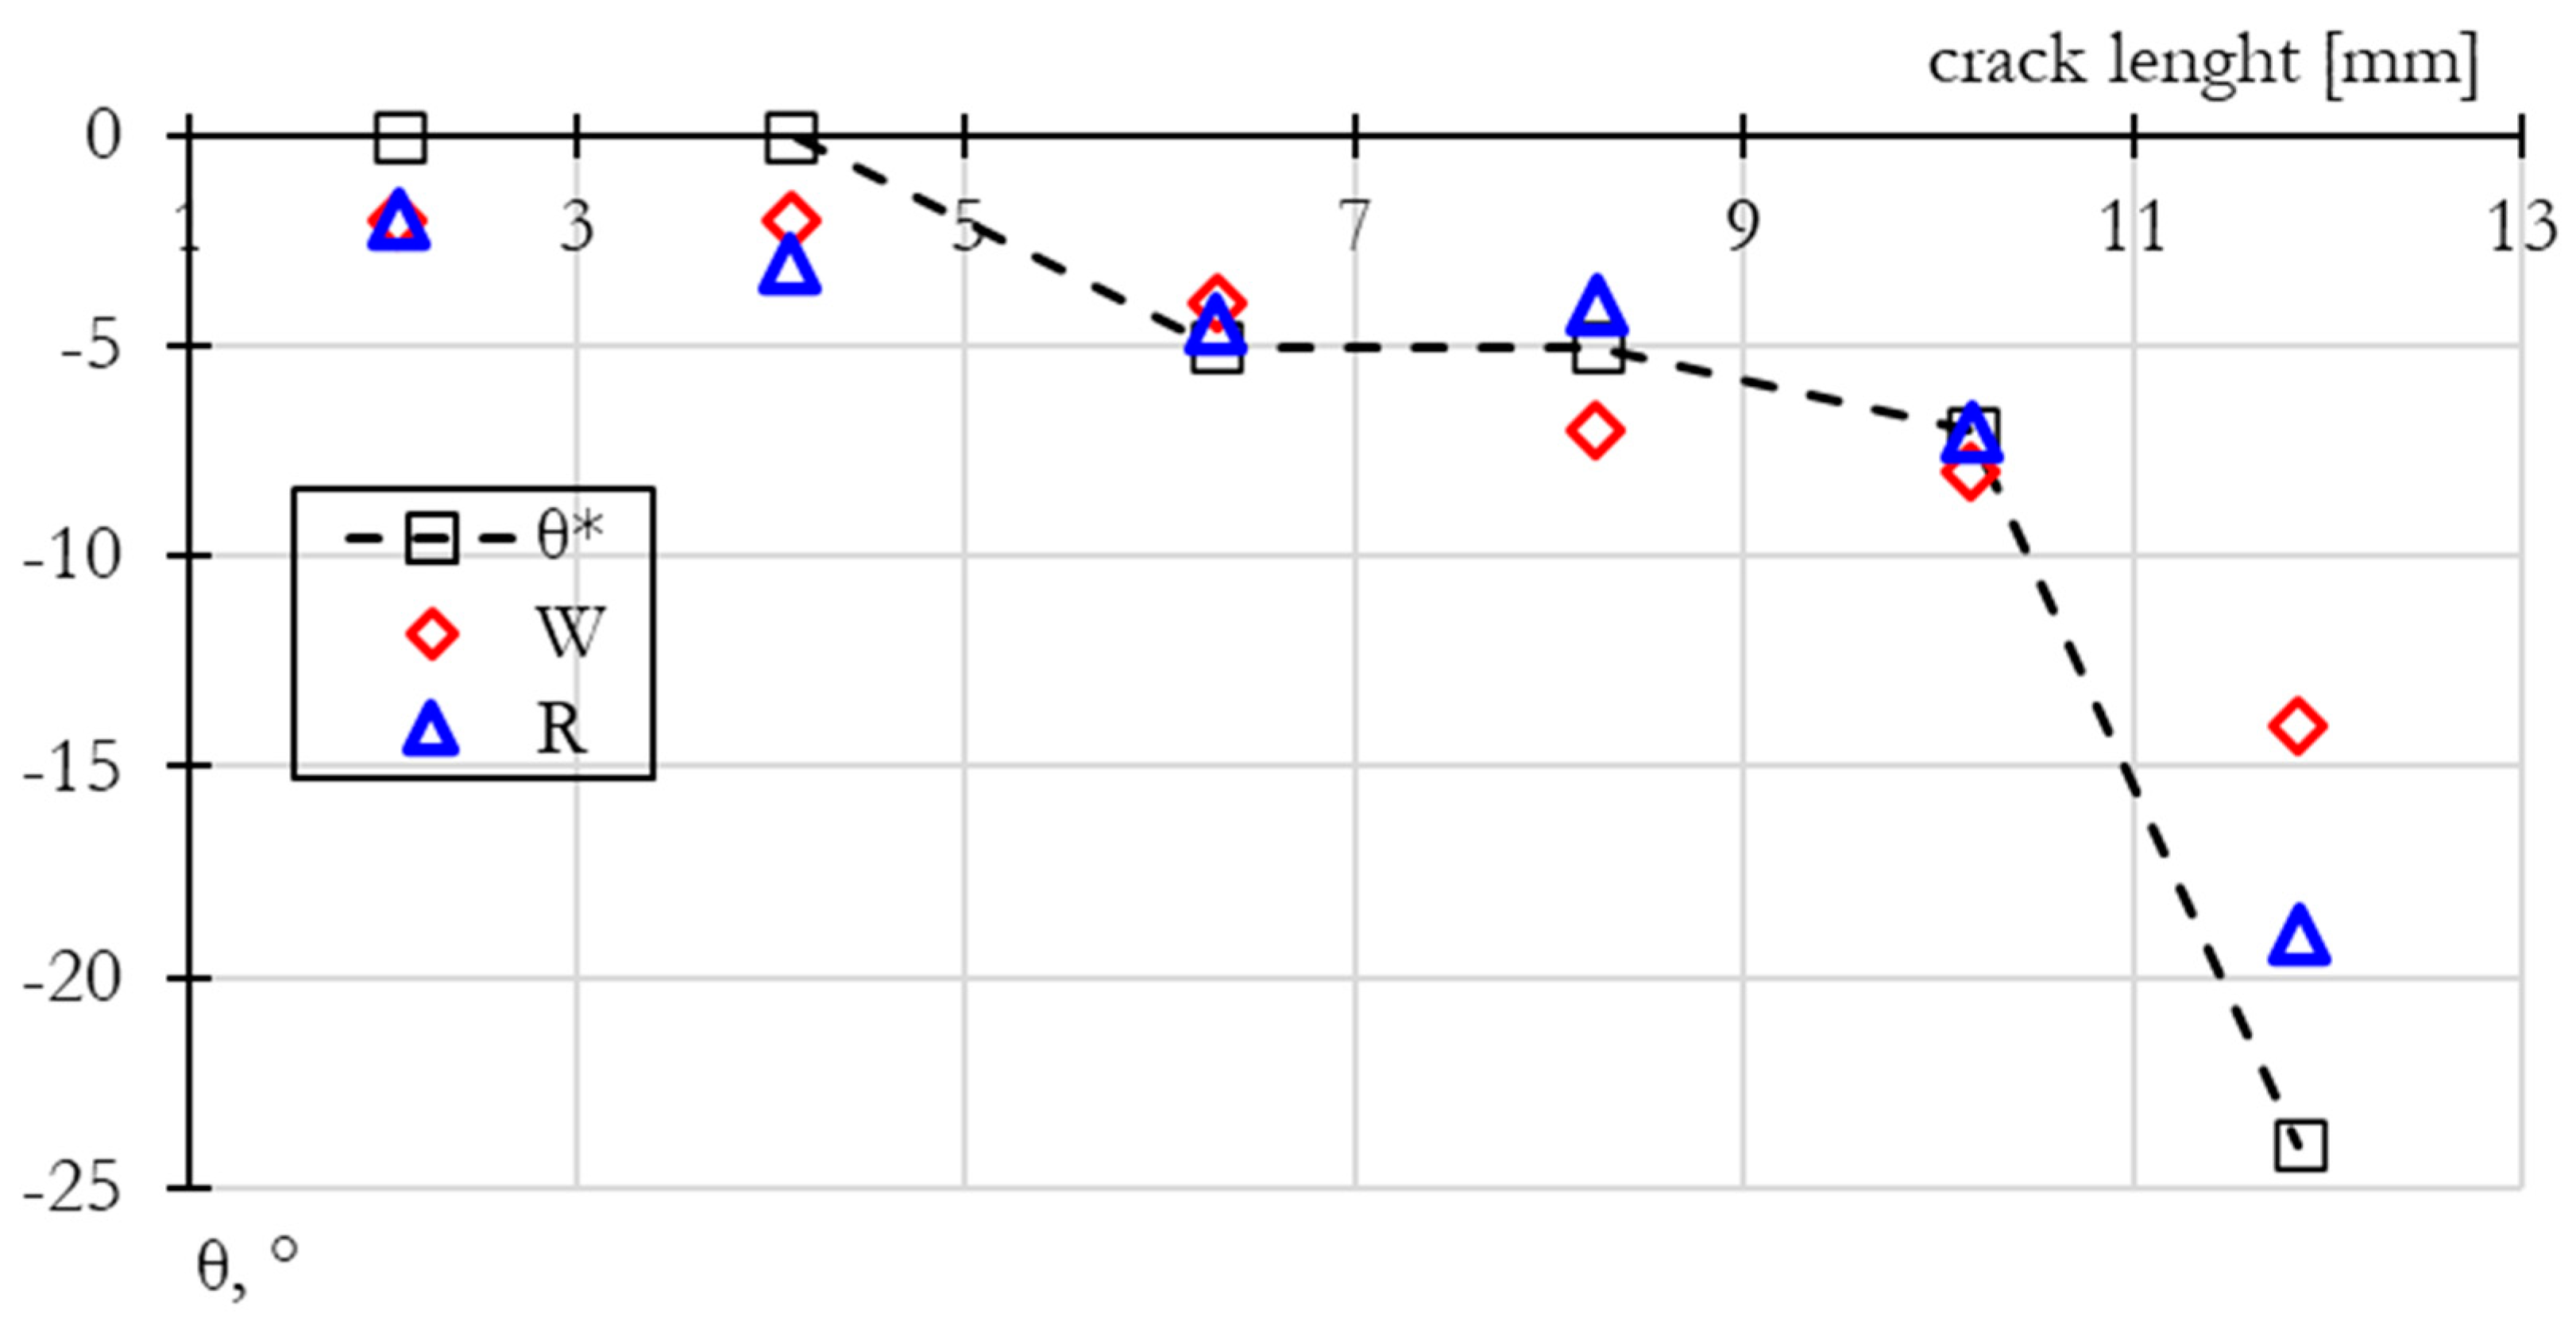
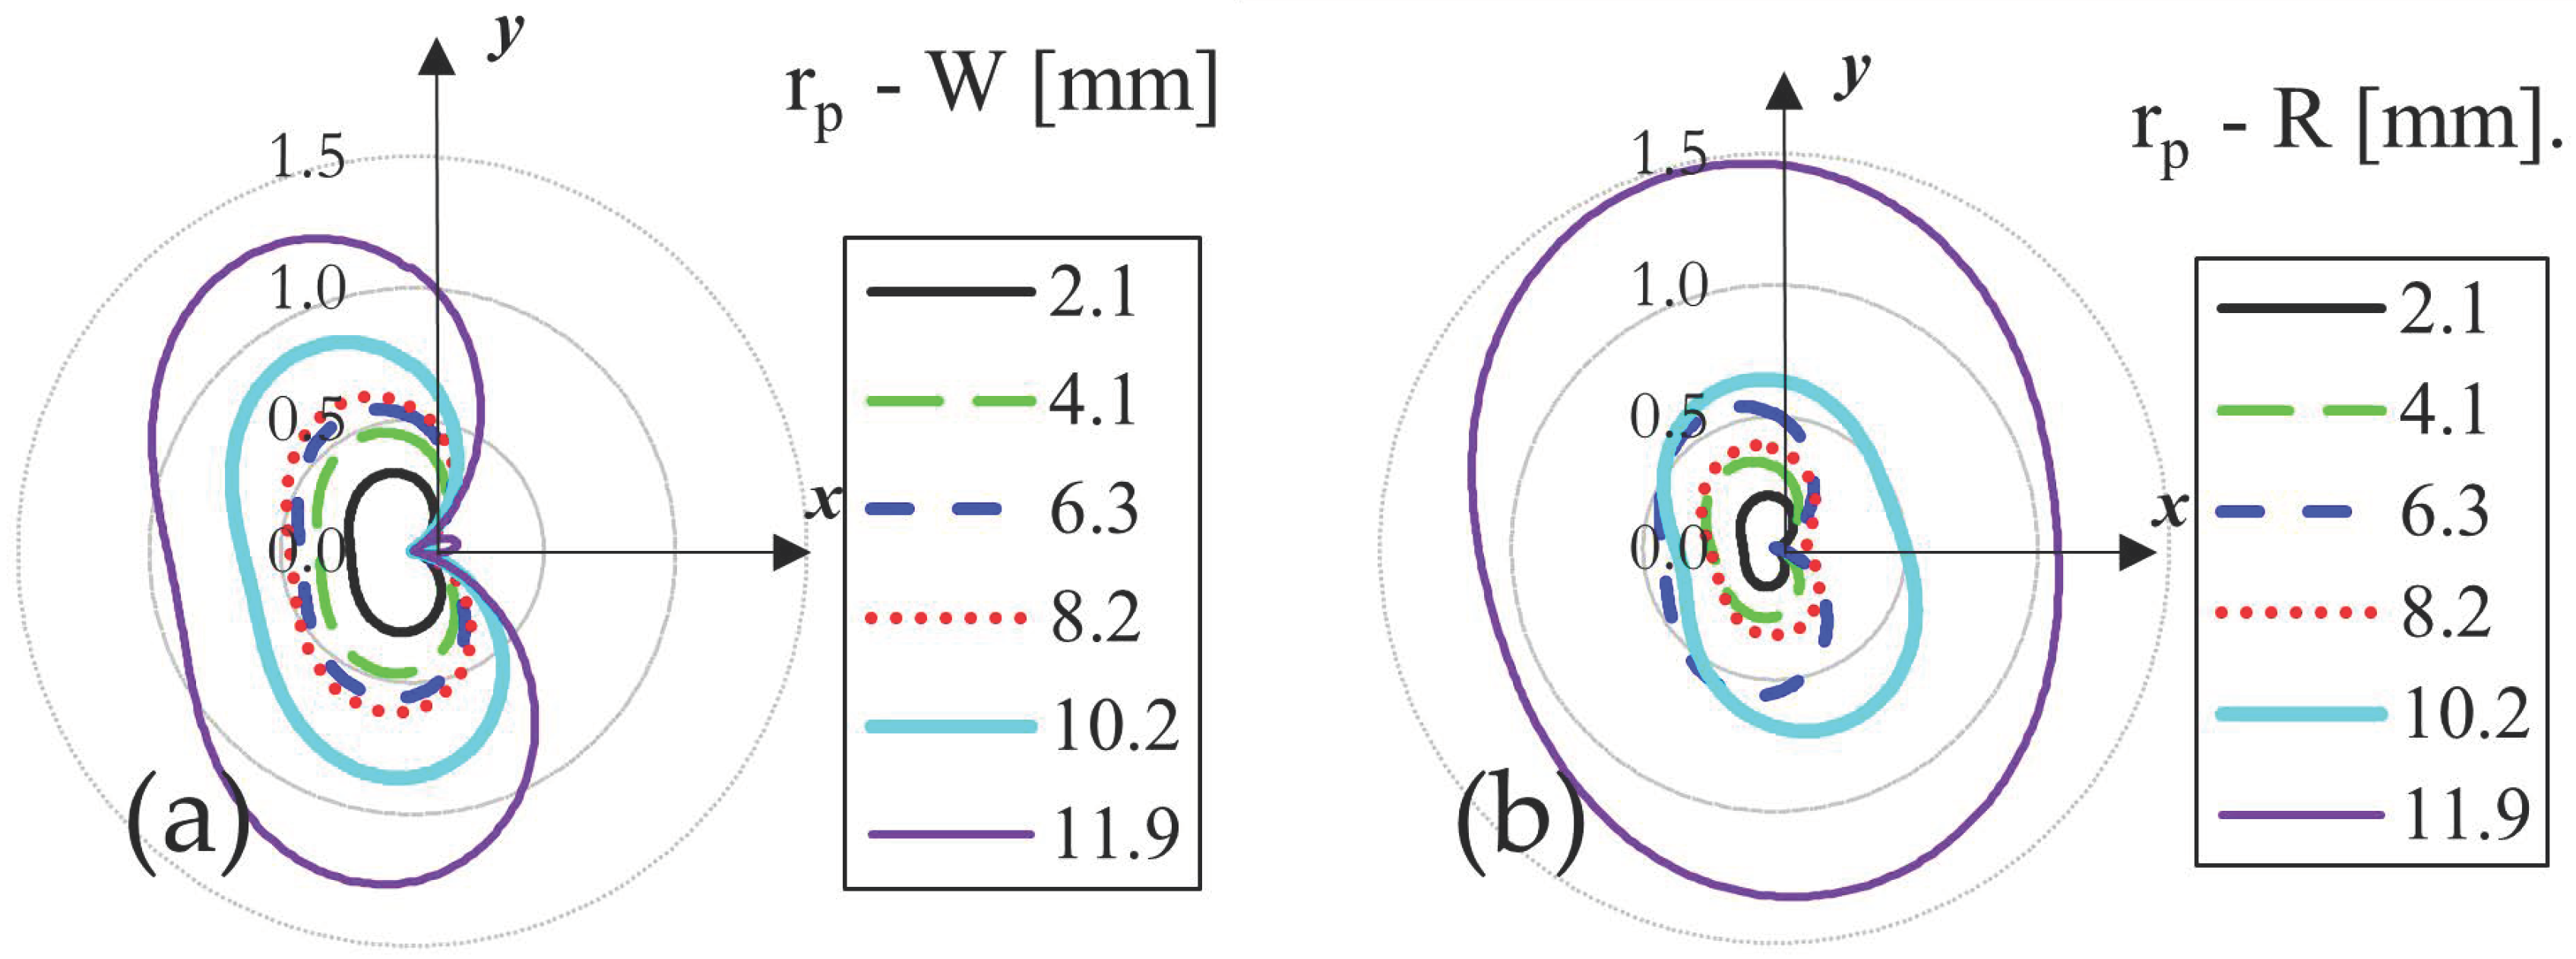
4.1. CP Prediction for Modified C(T)

Figure 4 compares the experimentally observed CP for the W and R criteria predicted angle for the six measured points in the modified C(T) sample. One can see that the prediction is very close for short cracks as the mode mixity ratio, ΔKII/ΔKI, is low. However, at the last measurement before unstable crack growth, the ΔKII/ΔKI rises to 0.13, and the predicted angle gives a 6% error for the W criterion. In contrast, the R criterion shows a 1.7% error. The incremental change in mode mixity is attributed to the machined hole, which caused an asymmetry to the stress field, producing larger stresses toward the hole that ultimately caused the crack to kink towards it. As the crack grew, the stress field became even more asymmetric, continuously increasing KII, kinking the crack more pronouncedly every loading cycle until it finally met the hole.
The W criteria made a close prediction for most of the crack lengths. Figure 5 shows the comparative size and shape of the PZ, Equation (4) W criterion, and the Equation (5) R criterion, for six different crack lengths in this specimen. It can be seen how the PZ orientation turns as the crack length increases and the mode mixity changes. This turning is attributed to the increase in ΔKII, which makes the crack deviate from the applied mode. I load Moreover, it can be observed that the size of the largest PZ, about 2.54 mm for the W criterion and about 2.9 mm for the R criterion, in their largest axis, which are below the thickness of the specimen, 8.7 mm. Thus, LEFM adequately describes the stress field. For this sample, the W criterion showed larger PZ for the first five crack sizes, whereas the R criterion retrieved a more extensive zone for the last one, where KII reaches 3.55 MPa√m and the mode mixity ratio, KII/KI, is 0.13.

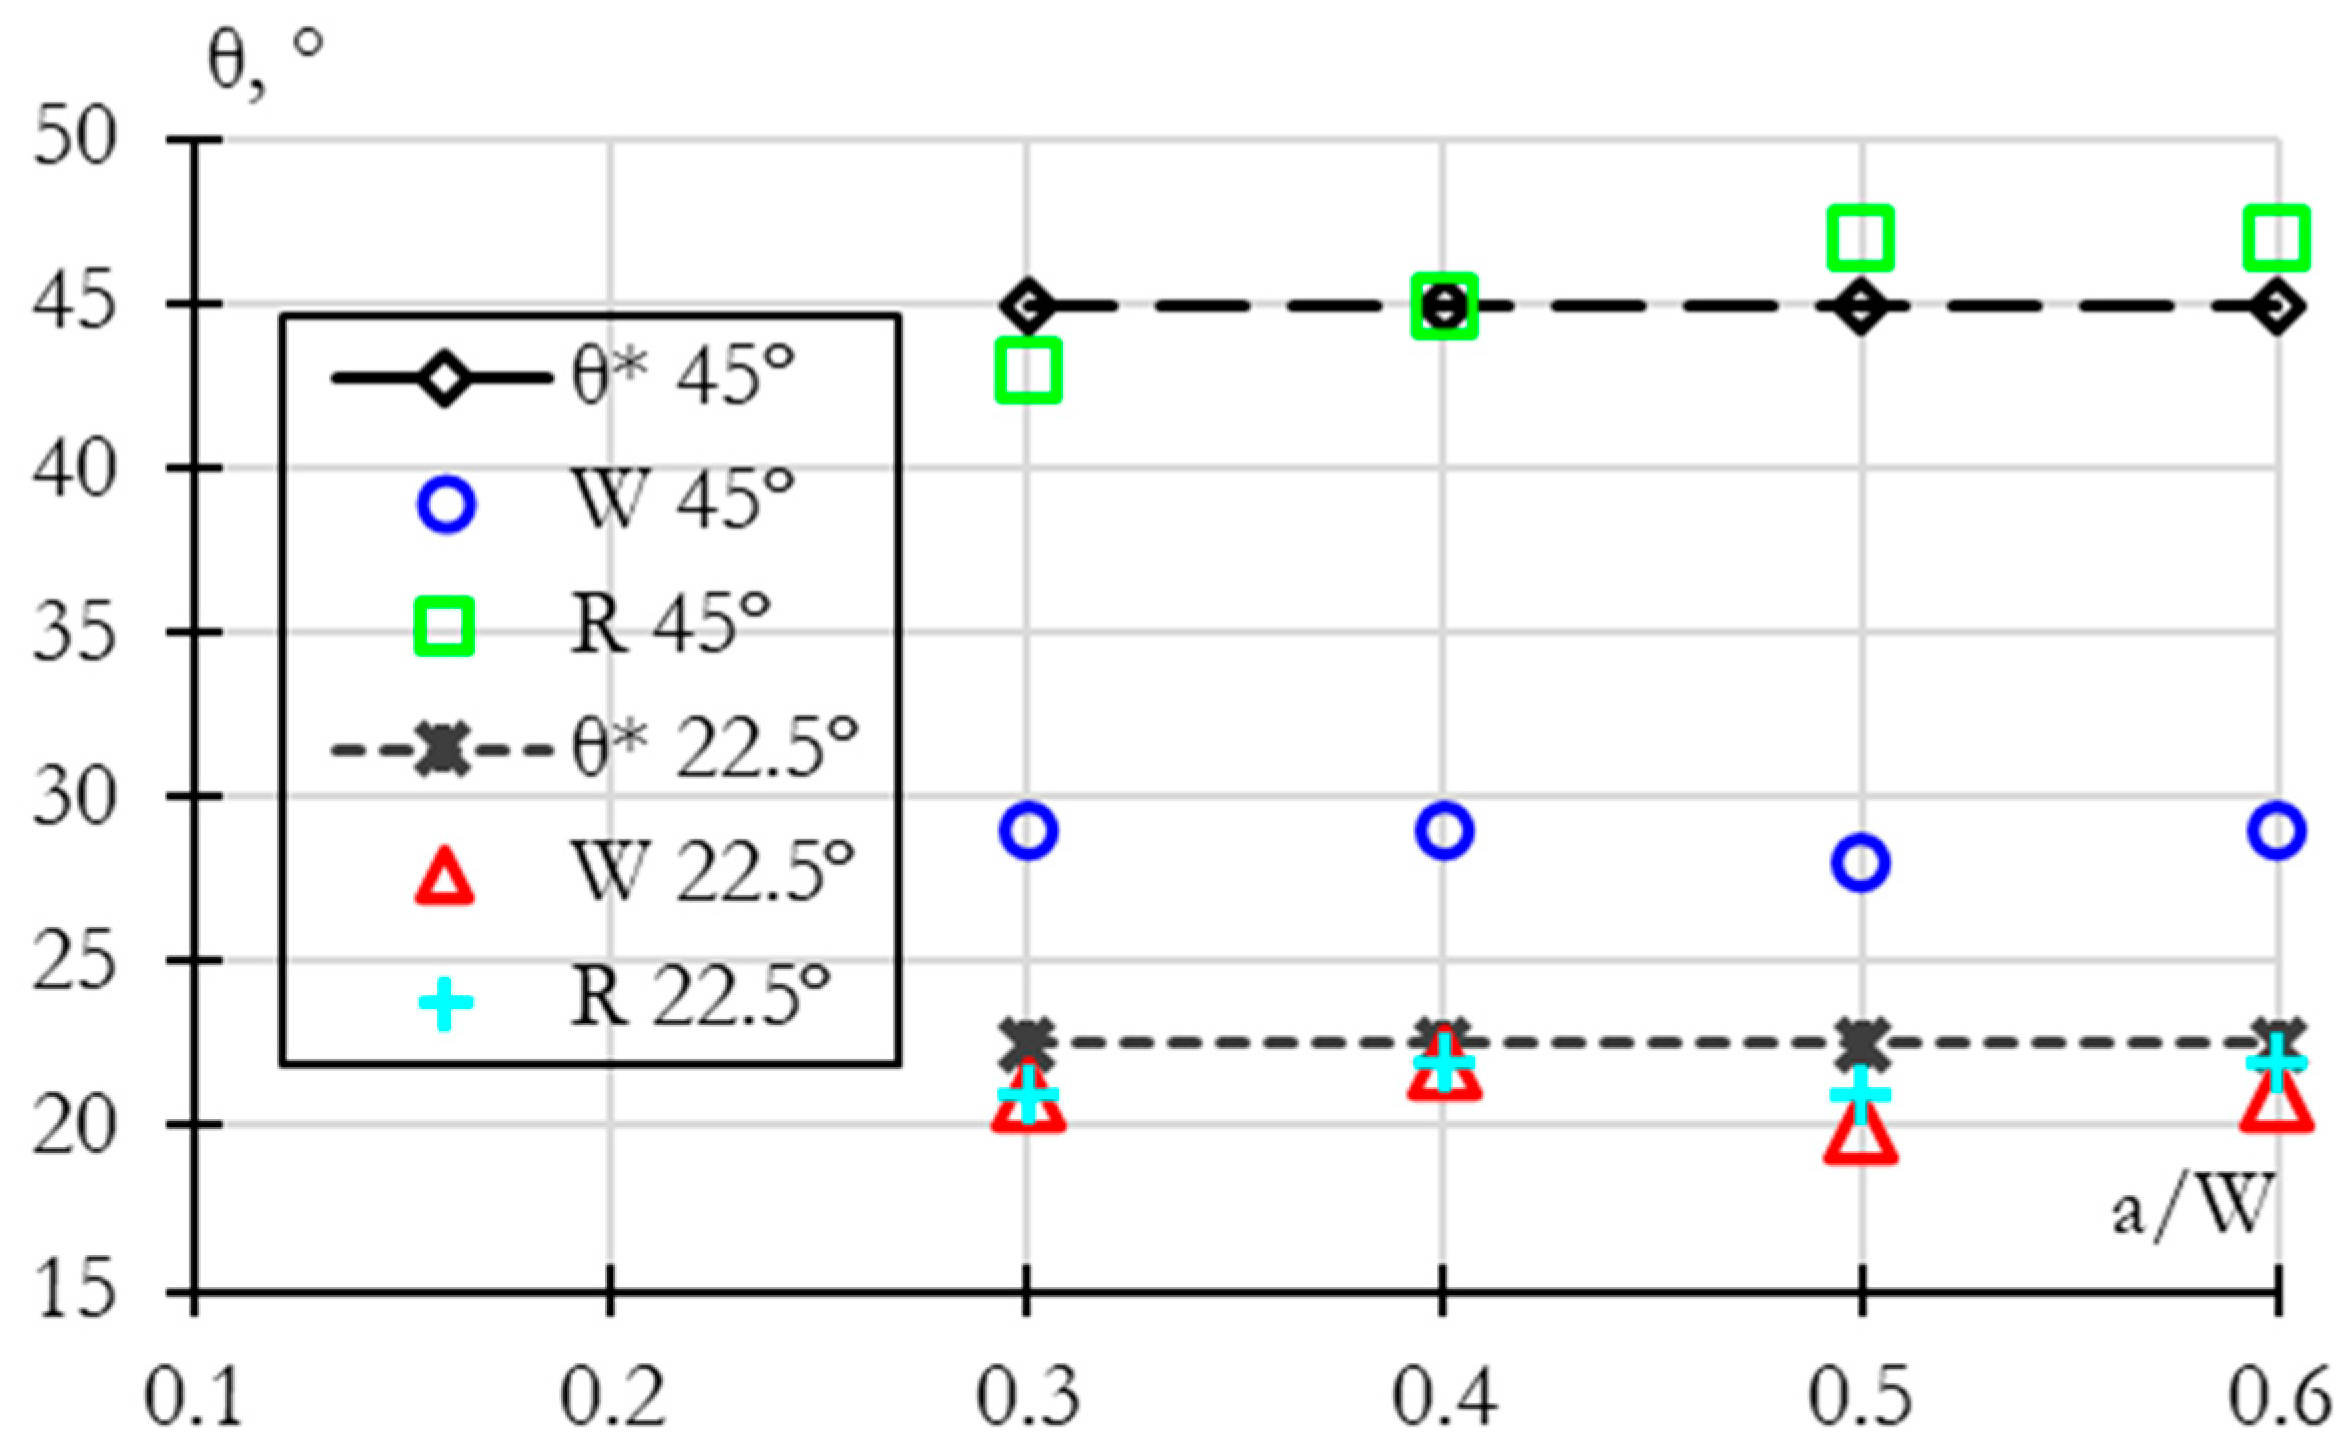
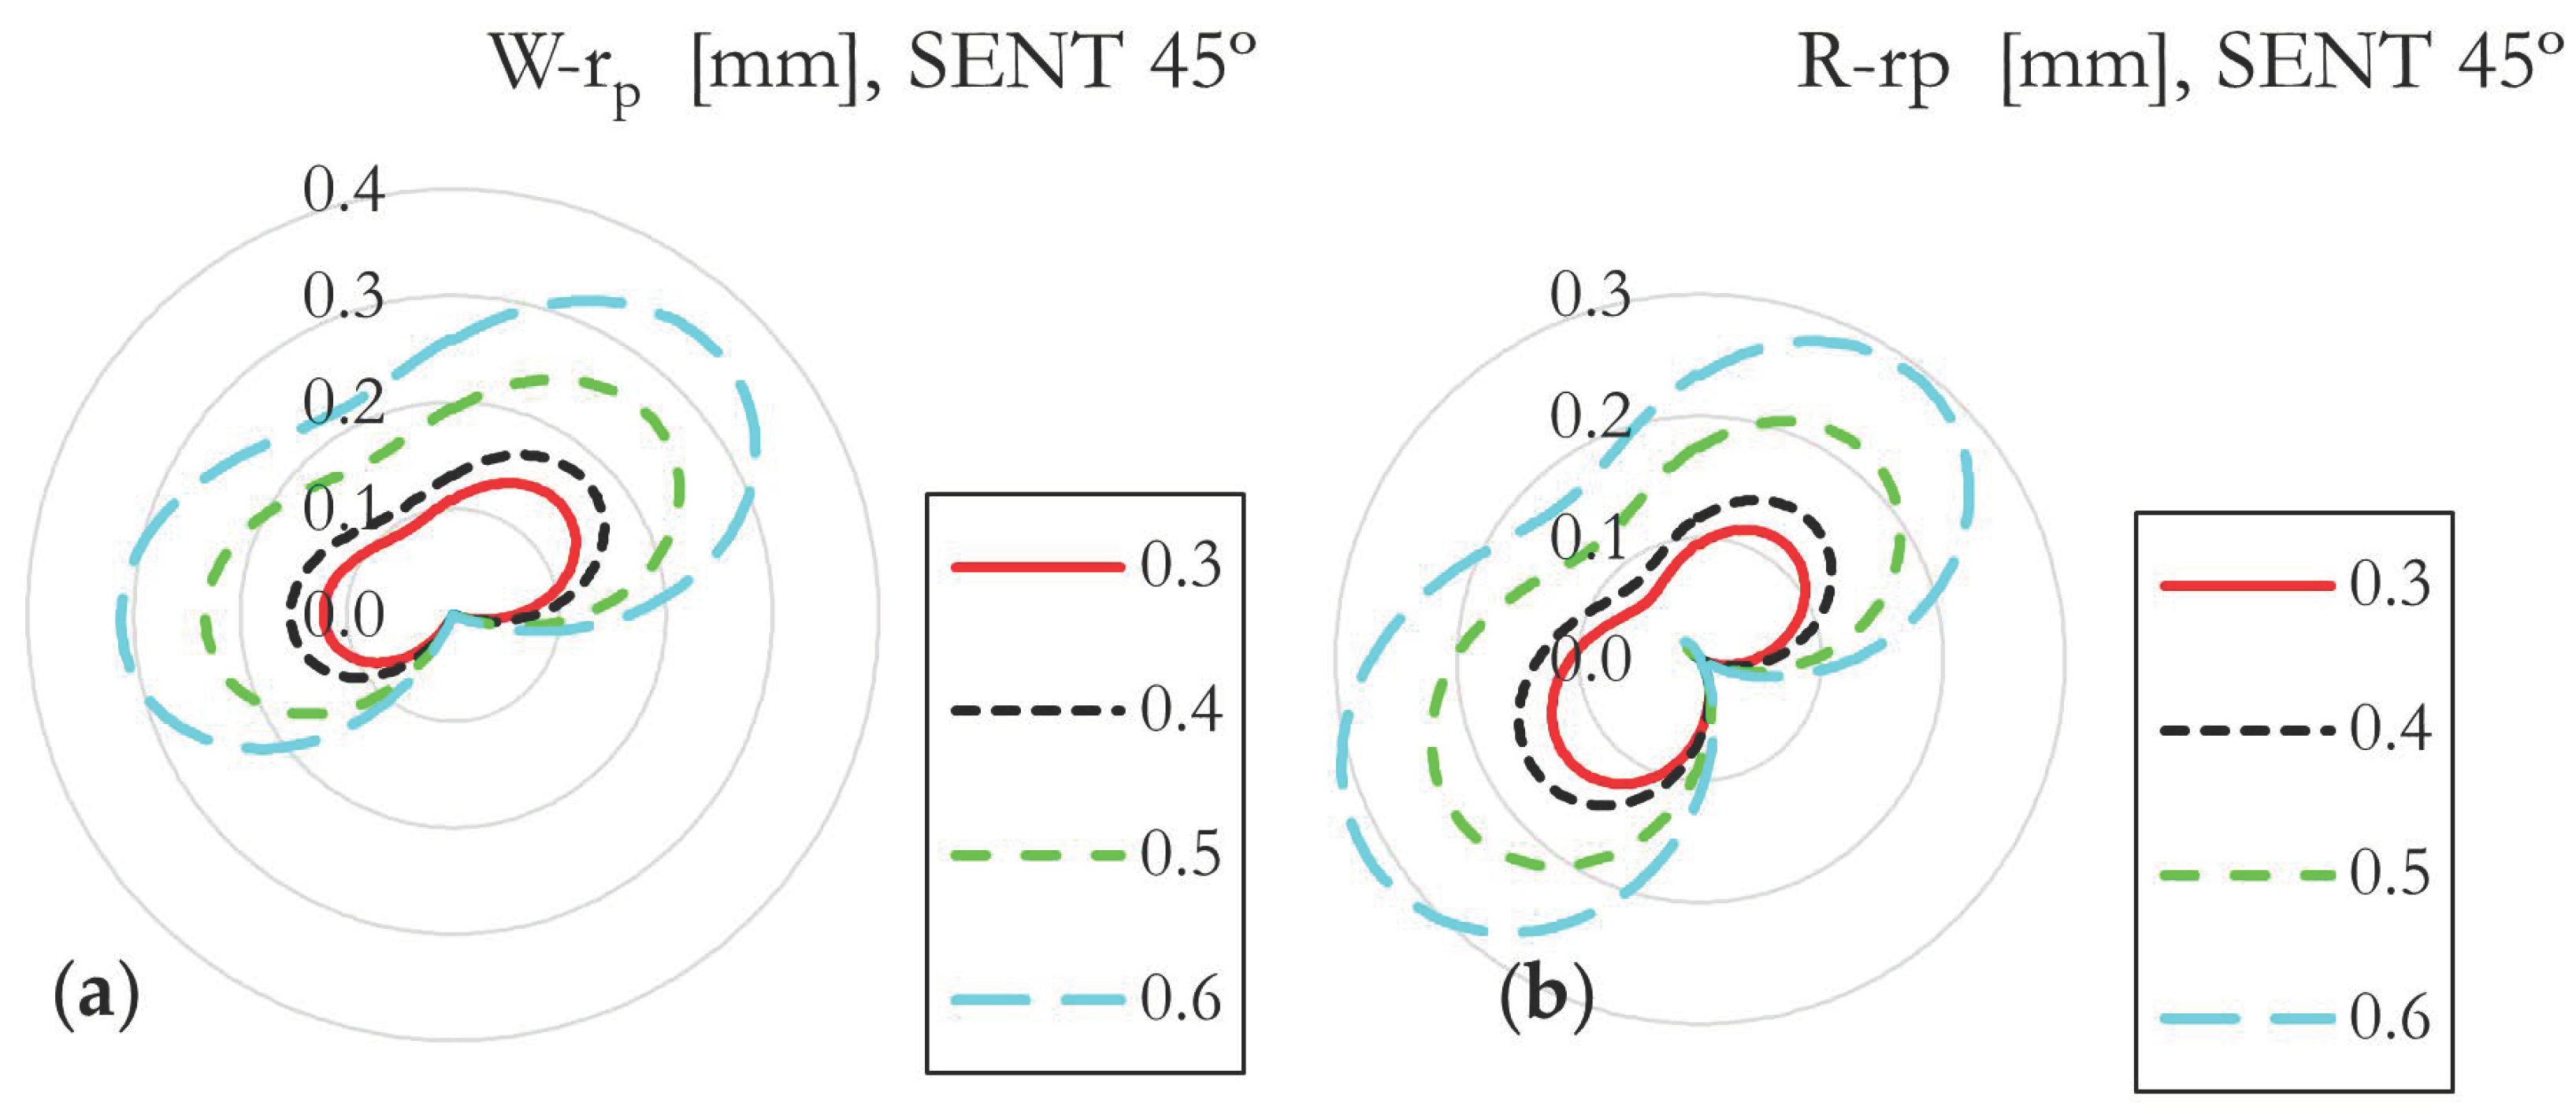
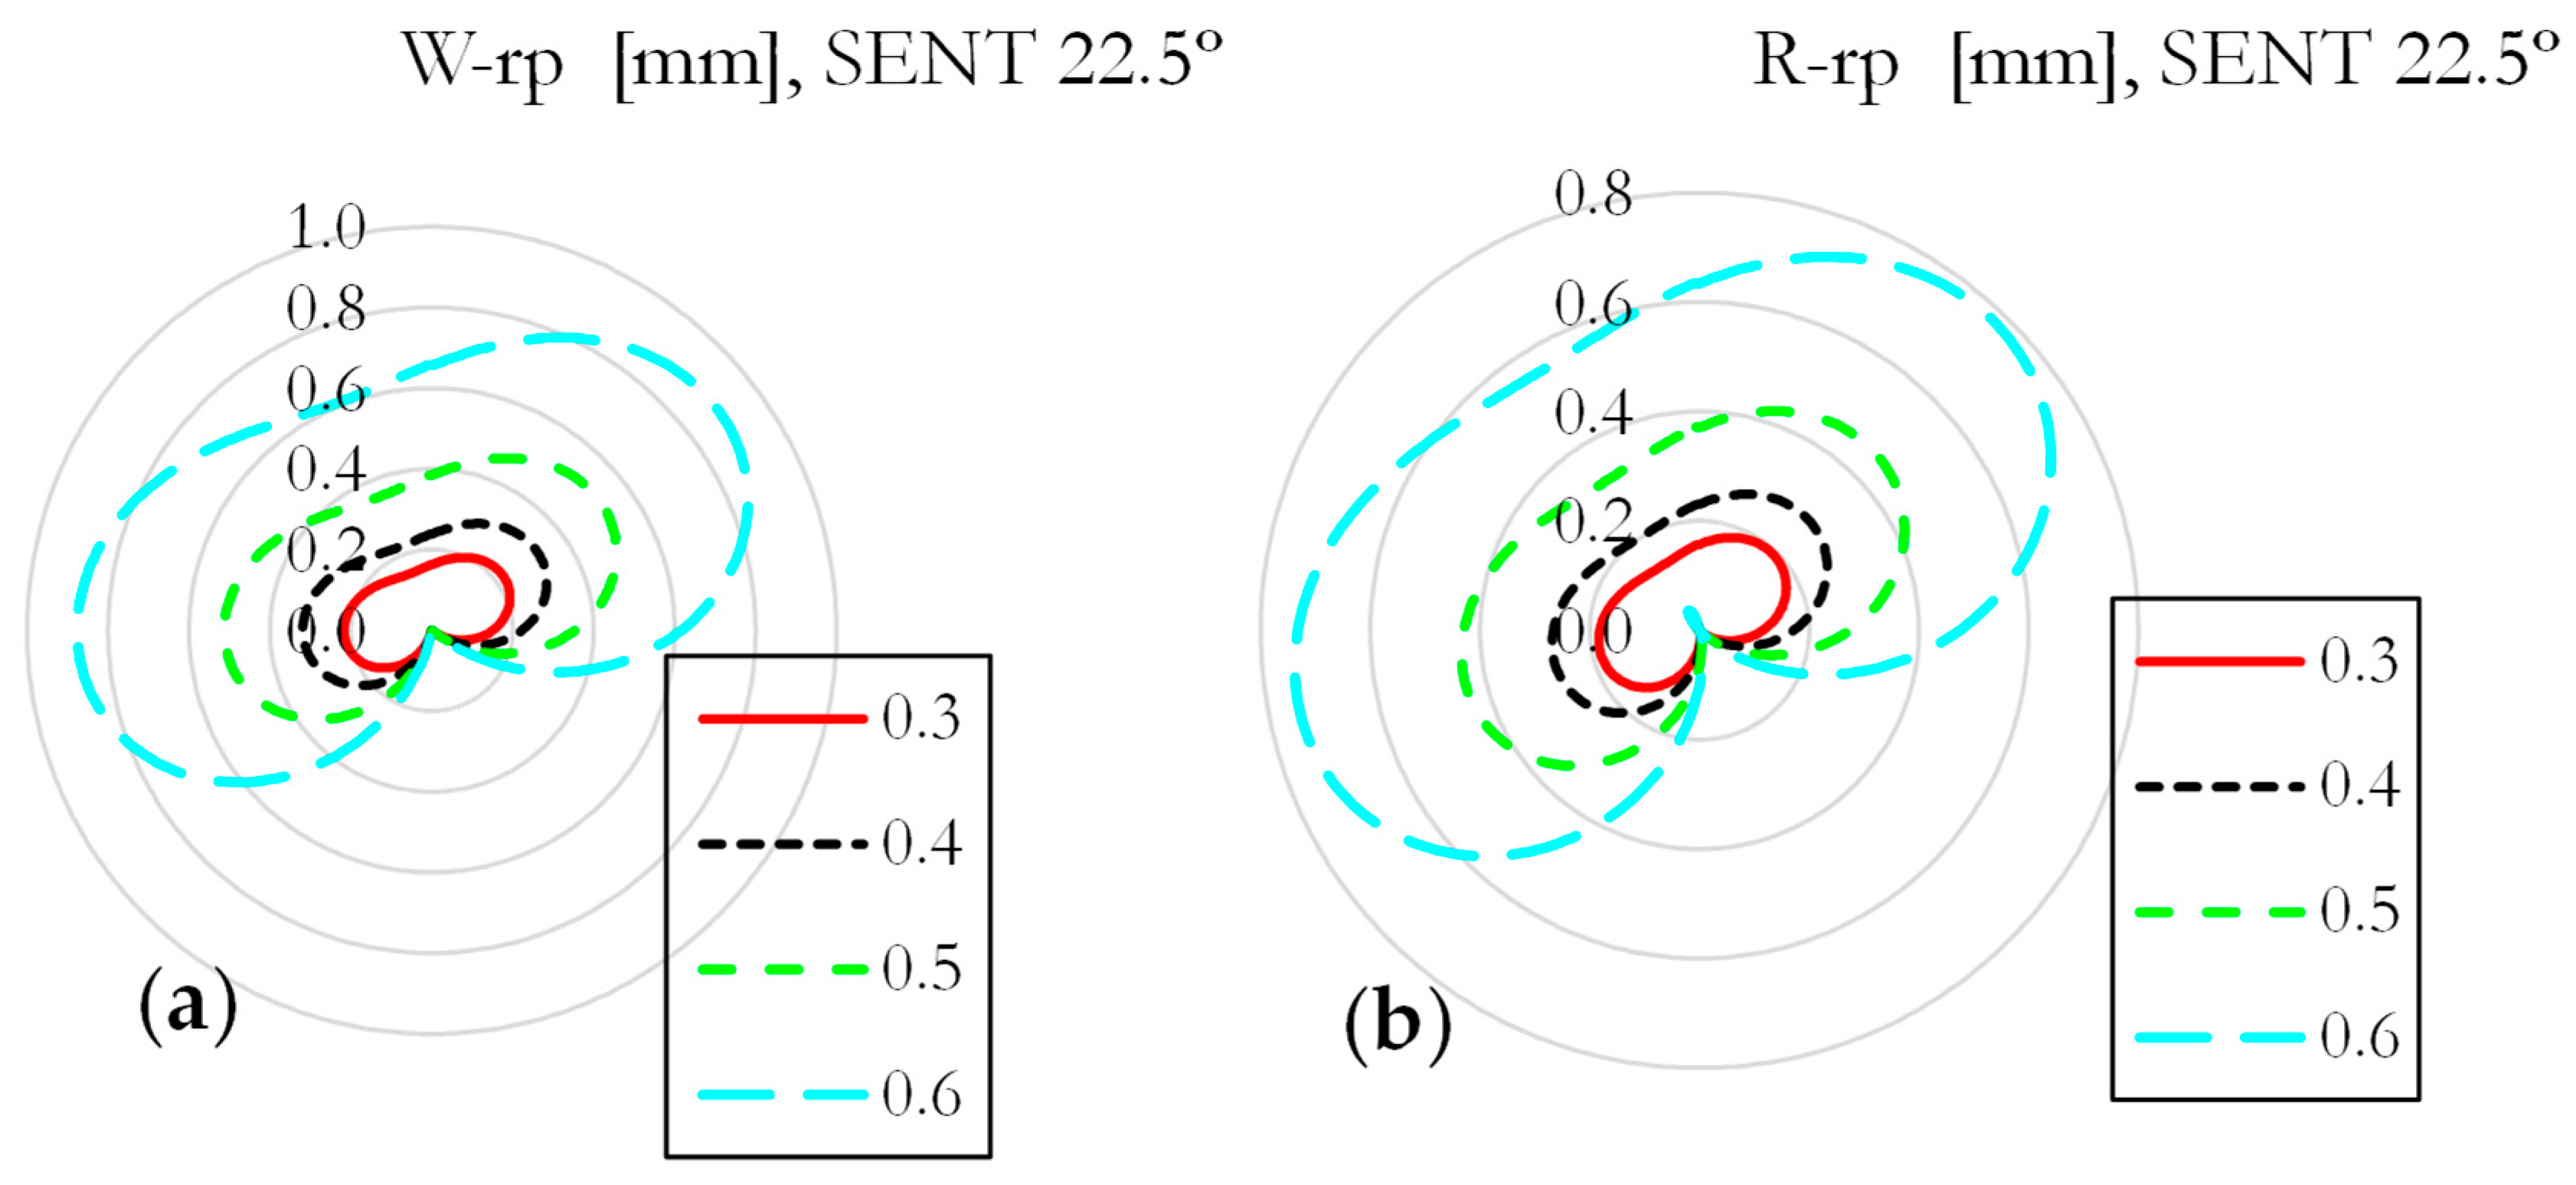
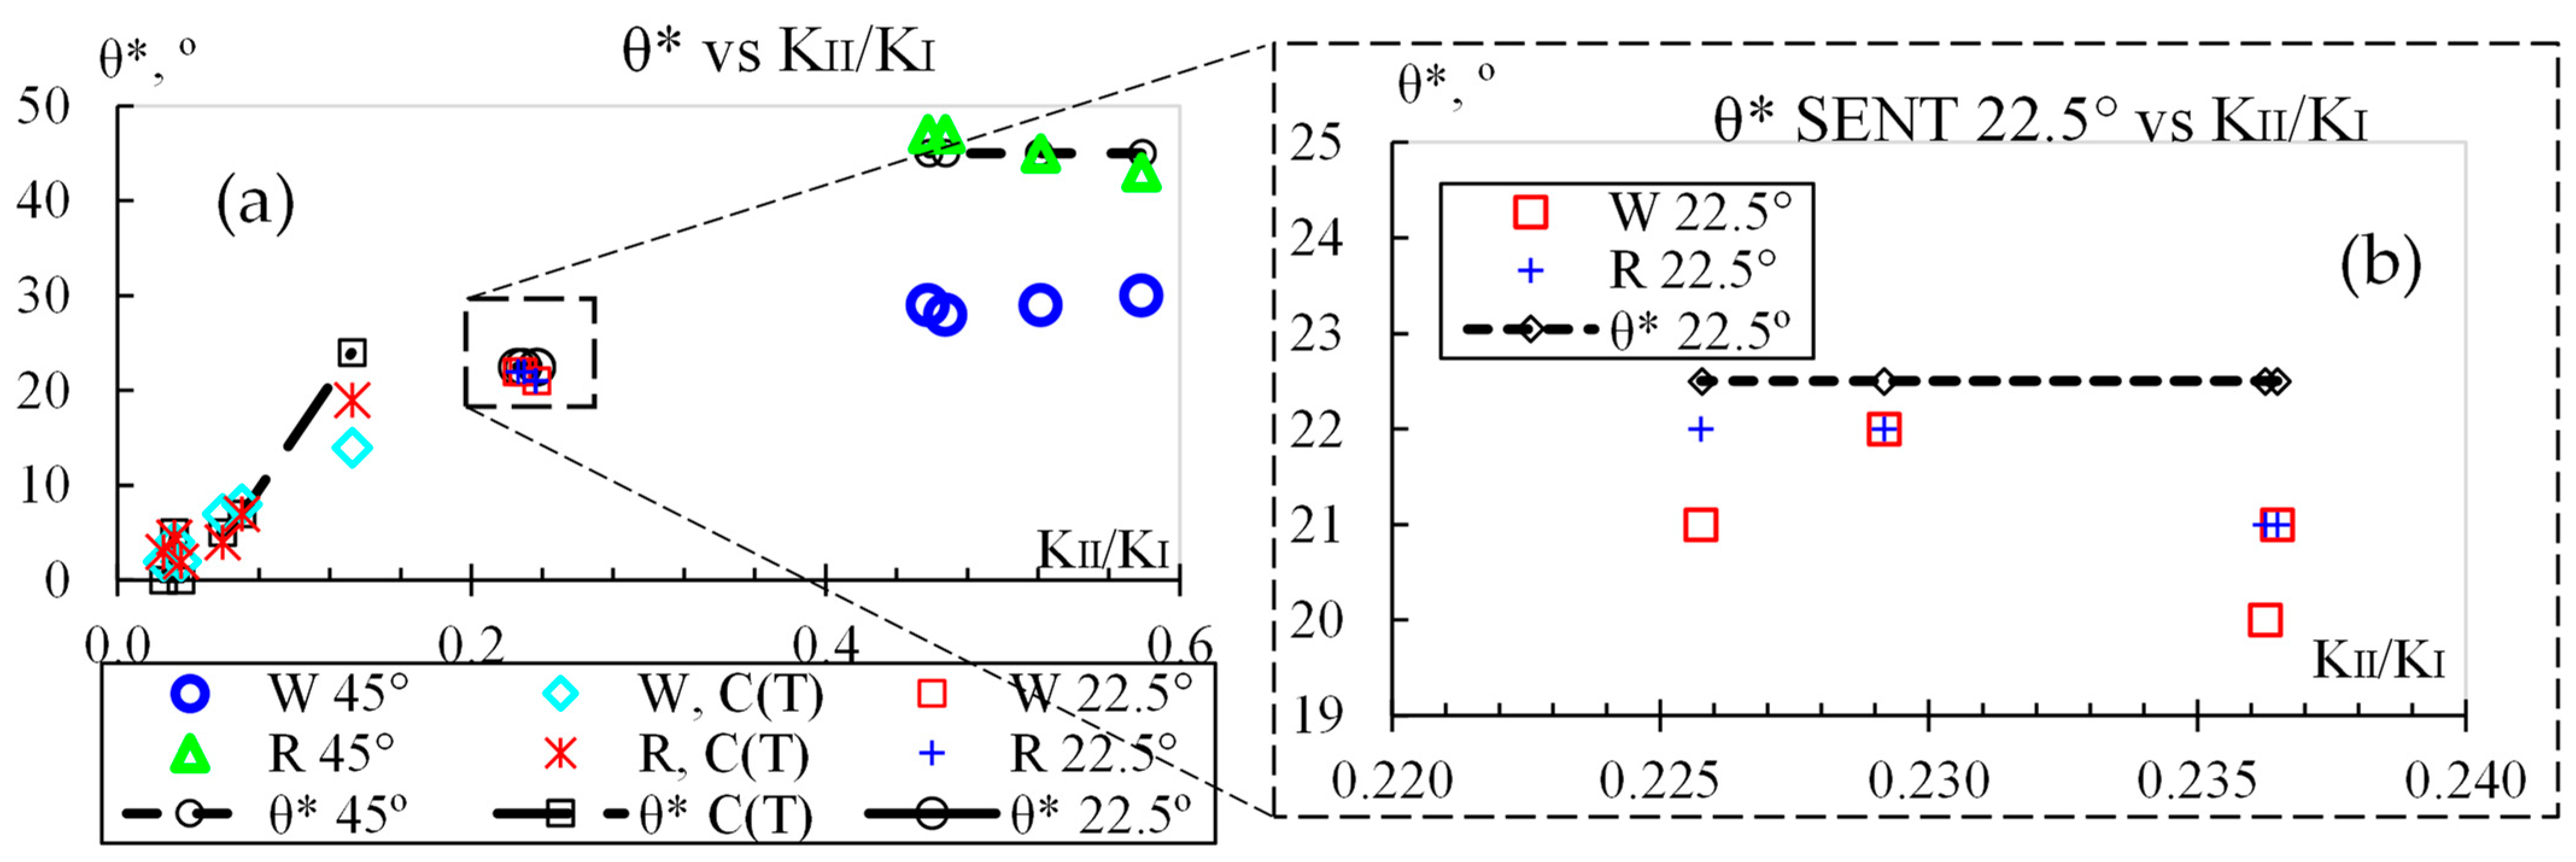
4.2. CP Prediction for SENT Samples

On the other hand, the performance of the CP models for both SENT specimens for dimensionless crack length is shown in Figure 6. The models were evaluated with the retrieved KI and KII. Unlike the C(T) sample, the applied load is monotonic, so there is no need to assume that K is ΔK and Kc is ΔKth. The SENT with a 45° crack showed a KII/KI ratio from 0.46 at the longest to 0.58 for the shortest a/W. Polycarbonate is a material prone to shear-dominated failure, and the 45° crack induces a high KII/KI ratio. Therefore, the W criterion is not expected to perform well under these conditions, so it predicts a quasi-constant 29°, whereas the R criterion predicts a closer CP between 43 and 47°.
Conversely, the SENT with a 22.5° crack showed a quasi-constant KII/KI ratio of 0.23. Because of this constant KII/KI ratio, the predicted CP angle is also quasi-constant, about 21° degrees for the W criterion, very close to the experimentally observed angle of 22.5°. Conversely, the R criterion predicts a quasi-constant angle of 17°.
The shape and size of the plastic zone are shown in Figure 7 for the SENT sample with an initial crack of 45° for the four different reported crack lengths. It can be seen how the orientation of the plastic zone stays pretty much constant as the crack length increases for the W and R criteria. This situation is attributed to the steady KII/KI ratio, as seen in Table 2, making the crack grow straight from its original path, even though only mode I is applied. Moreover, it can be observed that the size of the largest plastic zone on its largest axis is about 0.7 mm for the W criterion and 0.58 mm for the R criterion. In both cases, this size is below the thickness of the specimen, 3.0 mm, so LEFM can be used to describe the stress field satisfactorily. Finally, it is noted that the W criterion predicts a slightly larger PZ than the R criterion.
Figure 8 shows the PZ size for the SENT sample with an initial crack of 22.5° for the four different reported crack lengths. It can be seen how the orientation of the plastic zone stays pretty much constant as the crack length increases. This situation is attributed to the steady KII/KI ratio, making the crack grow straight from its original inclined path, even though there is an applied load in mode I. Moreover, it was observed that the size of the largest PZ, about 1.8 mm for the W criterion and about 1.54 mm for the R criterion in its largest axis, is below the thickness of the specimen, 3.0 mm, so LEFM can be used to properly describe the stress field. In this sample, it was also observed that the W criterion predicts a slightly larger PZ than the R criterion.

4.3. Discussion

Highsmith [10] stated that a crack under mixed mode will grow when the equivalent SIF exceeds the material toughness, Kc, or the equivalent SIF range exceeds the material fatigue threshold, Kth. In both cases, the crack grew under either monotonic or fatigue loading. Therefore, the Keq was larger than the Kc for the monotonic load, and the ΔKeq was larger than the Kth for the cycling load. However, because more than one loading mode was present, the CP must be established to describe crack growth completely [31].
On the other hand, Vormwald et al. [9] argued that the mode mixity ratio [28] might be the parameter that can be used to tell when a crack growth scenario can change from tensile to shear-dominating load. It could make a crack turn when it reaches 0.5. Figure 9 shows the variation in the CP angle with mode mixity for both samples. For the SENT samples, neither the load nor the mode mixity changed much with crack length. For the 22.5° SENT sample, the KII/KI ratio kept a 0.24 constant value, whereas for the 45° sample, the KII/KI ratio went from 0.56 to 0.46, as seen in Figure 6. Vormwald et al. [9] argued that when transitioning from tensile to entirely dominated shear crack growth, such mode mixity parameters might not be able to tell the CP. Therefore, the CP for the SENT samples was not expected to deviate from its initial angle. This can be seen in Figure 9a for the three samples and Figure 9b for a close-up of the SENT 22.5° sample.
On the other hand, for the modified C(T) sample, the mode mixity changes constantly, as explained in Section 4.1, and is attributed to the constant change in the stress field, starting at 0.04 and reaching 0.13. As a result, the CP for the modified C(T) sample changes as well, as seen in Figure 9 in the black squares. Thus, the mode mixity indeed influences the CP angle. This analysis shows that a change in the KII/KI ratio involves changing the CP angle.
Furthermore, in Figure 8, one can see that the size of the largest plastic zone is about 1.5 mm, so it does not exceed the holed C(T) sample thickness, 8.7 mm. On the other hand, the largest plastic zone size for the SENT sample is seen in Figure 7 for the 22.5° sample and Figure 8 for the 45° sample, where the plastic zone does not exceed the 3 mm sample thickness. Therefore, the applicability of LEFM is checked at once.
In [25], one can see how the traditional butterfly-like plastic zone in the modified C(T) evolved to be asymmetric, showing larger areas and higher stress values towards one side, the side of the stress concentrator. That stress asymmetry is assumed to cause the crack to kink. One can see in Figure 5 how the PZ turns. Although [26] did not show the evolution of the fringes for the SENT samples, they show how the fringes also exhibit asymmetry, piling up on one side. This fringe concentration reflects the stress gradient that most likely produces the crack to deviate from the direction of the applied load. The orientation change of the PZ on the C(T) or the quasi-constant orientation for the SENT is interpreted as the angle for crack kinking. Therefore, the PZ stays the same, even for the relatively large error shown by the W model. In addition, it is important to note that the C(T) sample was produced via fatigue loading, whereas the SENT sample was initially cut with a sharp razor blade and later propagated under monotonic loading. This is important because a flaw with a blunt radius does not fully comply with LEFM.
On the other hand, the CP prediction error is shown in Table 3. Both criteria are close in prediction, with errors as low as 0.28% and as high as 1.67% for the modified C(T) sample. For the largest mode mixity on the modified C(T) sample, the W criterion gives 5.56, whereas the R criterion shows a 2.78% error. The same case for the SENT 45° sample is 8.33 versus 1.11% error. In both cases, the mode mixity (ΔKII/ΔKI) had a wide range of about 0.1. For the SENT 22.5 sample, both are close to each other; the largest difference is 0.56%. In this case, this could be explained by the quasi-constant ΔKII/ΔKI.
As a final note, it has to be said that the computational cost of these two criteria is high compared to other ones, as recently evaluated [31]. For this reason, the computational cost, in terms of floating-point operations (FLOPS), using a benchmark from [32], is compared in Table 4. The R criterion is slightly less costly than the W criterion.

5. Conclusions

The crack path was calculated for specimens under fatigue and monotonic load using the LEFM-based plastic zone radius criteria. The LEFM parameters for the fatigued sample were characterized experimentally with DIC, whereas the monotonic samples’ SIFs were obtained numerically through FEM and validated with photoelasticity; for both samples, SIFs were obtained from the literature. An advantage of the plastic zone-based criteria is that the applicability of LEFM is checked in the same equation. Furthermore, using prediction models rather than FEM modeling or re-meshing makes a faster prediction by avoiding time-consuming modeling and simulation. Finally, the selected models worked for numerical and experimentally obtained SIFs. The literature has discussed how the experimentally acquired SIFs include non-linear effects such as rugosity, plasticity-induced closure, trapped debris, and crack flank interlocking.
The W and R criteria were devised for monotonic load, and here, they were tested for monotonic and fatigue load. The swap of K with ΔK was checked, which was applicable in these cases. The error analysis showed that the W and R criteria predicted angles very close for short cracks as the mode mixity ratio, ΔKII/ΔKI, is below 0.25, with the R criterion exhibiting lower error values. However, at the last measurement for the modified C(T) low carbon steel sample before unstable crack growth, the ΔKII/ΔKI doubles its value and makes an unstable W criterion prediction. The R criterion has about 88% of the W criterion’s computational cost, which could impact performance for recurrent calculations. Furthermore, the models were devised for central cracks, and here, they were tested in lateral cracks. The predicted versus experimental CP comparison showed that the models could be used for fatigue and monotonic loads.

Author Contributions

Conceptualization, J.G.D.-R.; Software, J.G.D.-R.; Writing—original draft, J.G.D.-R., O.R.B.-B. and D.P.-P.; Writing—review & editing, J.G.D.-R., A.D.P.-C. and A.M.B.B.; Formal analysis, J.G.D.-R. and D.P.-P.; Investigation, A.D.P.-C.; Methodology, A.D.P.-C.; Supervision, A.D.P.-C.; Visualization, O.R.B.-B.; Validation, O.R.B.-B.; Resources, A.M.B.B. and D.P.-P.; Funding acquisition, A.M.B.B.; Data curation, D.P.-P. All authors have read and agreed to the published version of the manuscript.

Funding

The authors acknowledge the financial support from Pontifícia Universidade Católica do Rio de Janeiro—PUC-RJ.

Data Availability Statement

Data is available upon reasonable request.

Conflicts of Interest

The authors declare no conflict of interest.

Acronyms and Nomenclature

Plastic zonePZ
Crack path CP
Single edge notch tension SENT
Compact test C(T)
Linear elastic fracture mechanics LEFM
Floating-point operations FLOPS
Increment in crack kinking angle Δθ
Stress intensity factorSIF, K
Equivalent stress intensity factor Keq
Stress intensity factor range factorΔK
Plastic zone radiusPzr.
Fatigue threshold ΔKth
Digital image correlation DIC
Finite element modelingFEM
Applied forceF
Normal stress σ
Shear stress τ
Radial direction r
Tangential direction θ
Yield stress σy
Poisson’s modulus ν
Residual ligament size (a/W)
Measure crack kinking angle θexp
Predicted crack kinking angleθ*

References

  1. Mróz, K.P.; Mróz, Z. On Crack Path Evolution Rules. Eng. Fract. Mech. 2010, 77, 1781–1807. [Google Scholar] [CrossRef]
  2. Yu, X.; Li, L.; Proust, G. Fatigue Crack Growth of Aluminium Alloy 7075-T651 under Proportional and Non-Proportional Mixed Mode I and II Loads. Eng. Fract. Mech. 2017, 174, 155–167. [Google Scholar] [CrossRef]
  3. Kujawski, D. Discussion and Comments on KOP and ∆Keff. Materials 2020, 13, 4959. [Google Scholar] [CrossRef]
  4. Kibey, S.; Sehitoglu, H.; Pecknold, D.A. Modeling of Fatigue Crack Closure in Inclined and Deflected Cracks. Int. J. Fract. 2004, 129, 279–308. [Google Scholar] [CrossRef]
  5. Vormwald, M.; Hos, Y.; Freire, J.L.F.; Gonzáles, G.L.G.; Díaz, J.G. Crack Tip Displacement Fields Measured by Digital Image Correlation for Evaluating Variable Mode-Mixity during Fatigue Crack Growth. Int. J. Fatigue 2018, 115, 53–66. [Google Scholar] [CrossRef]
  6. Maneschy, J.E.; Miranda, C.A.d.J. Application of Fracture Mechanics in the Nuclear Industry, 1st ed.; Eletrobras: Rio de Janeiro, Brazil, 2023; ISBN 9788599092026. [Google Scholar]
  7. Worthington, M.; Chew, H.B. Crack Path Predictions in Heterogeneous Media by Machine Learning. J. Mech. Phys. Solids 2023, 172, 105188. [Google Scholar] [CrossRef]
  8. Wasiluk, B.; Golos, K. Prediction of Crack Growth Direction under Plane Stress for Mixed-Mode I and II Loading. Fatigue Fract. Eng. Mater. Struct. 2000, 23, 381–386. [Google Scholar] [CrossRef]
  9. Vormwald, M.; Hertel, O.; Zerres, P. Fatigue of Engineering Structures under Combined Nonproportional Loads: An Overview. Fatigue Fract. Eng. Mater. Struct. 2018, 41, 1449–1468. [Google Scholar] [CrossRef]
  10. Highsmith, S. Crack Path Determination for Non-Proportional Mixed-Mode Fatigue; Georgia University of Technology: Atlanta, GA, USA, 2009. [Google Scholar]
  11. Toribio, J.; Matos, J.C.; Gonzalez, B. Numerical Modeling of Plasticity-Induced Fatigue Crack Growth Retardation Due to Deflection in the Near-Tip Area. Metals 2021, 11, 541. [Google Scholar] [CrossRef]
  12. Rozumek, D.; Macha, E. A Survey of Failure Criteria and Parameters in Mixed-Mode Fatigue Crack Growth. Mater. Sci. 2009, 45, 190–210. [Google Scholar] [CrossRef]
  13. Zhu, X.K.; Joyce, J. Review of Fracture Toughness (G, K, J, CTOD, CTOA) Testing and Standardization. Eng. Fract. Mech. 2012, 85, 1–46. [Google Scholar] [CrossRef]
  14. Wang, Y.; Wang, W.; Zhang, B.; Li, C.-Q. A Review on Mixed Mode Fracture of Metals. Eng. Fract. Mech. 2020, 235, 107126. [Google Scholar] [CrossRef]
  15. Ren, L.; Zhu, Z.; Wang, M.; Zheng, T.; Ai, T. Mixed-Mode Elastic-Plastic Fractures: Improved R-Criterion. J. Eng. Mech. 2014, 140, 04014033. [Google Scholar] [CrossRef]
  16. Richard, H.A.; Fulland, M.; Sander, M. Theoretical Crack Path Prediction. Fatigue Fract. Eng. Mater. Struct. 2005, 28, 3–12. [Google Scholar] [CrossRef]
  17. Vormwald, M.; Hos, Y.; Freire, J.L.F.; Gonzáles, G.L.G.; Díaz, J.G. Variable Mode-Mixity during Fatigue Cycles—Crack Tip Parameters Determined from Displacement Fields Measured by Digital Image Correlation. Frat. Ed Integrità Strutt. 2017, 11, 314–322. [Google Scholar] [CrossRef]
  18. Blanco, E.; Martínez, M.; González, J.; González, M. Fatigue Crack Growth Numerical Analysis of CPVC: Effect of Temperature and Load Frequency. Rev. UIS Ing. 2019, 18, 177–186. [Google Scholar] [CrossRef]
  19. Fageehi, Y.A.; Alshoaibi, A.M. Investigating the Influence of Holes as Crack Arrestors in Simulating Crack Growth Behavior Using Finite Element Method. Appl. Sci. 2024, 14, 897. [Google Scholar] [CrossRef]
  20. Berrios-Barcena, D.R.; Franco-Rodríguez, R.; Rumiche-Zapata, F.A. Calibration of Nasgro Equation for Mixed-Mode Loading Using Experimental and Numerical Data. Rev. Fac. De Ing. Univ. De Antioq. 2019, 97, 65–77. [Google Scholar] [CrossRef]
  21. Shahani, A.R.; Shakeri, I.; Rans, C.D. Fatigue Crack Growth of Al 5083-H111 Subjected to Mixed-Mode Loading. J. Braz. Soc. Mech. Sci. Eng. 2020, 42, 442. [Google Scholar] [CrossRef]
  22. Chatzigeorgiou, A.; Theotokoglou, E.; Tsamasphyros, G.I. Code Development for the Computational Analysis of Crack Propagation in Structures. Frat. Ed Integrità Strutt. 2020, 14, 306–324. [Google Scholar] [CrossRef]
  23. Pierson, K.; Rahman, A.; Spear, A.D. Predicting Microstructure-Sensitive Fatigue-Crack Path in 3D Using a Machine Learning Framework. JOM 2019, 71, 2680–2694. [Google Scholar] [CrossRef]
  24. Ricoeur, A.; Lindner, F.; Zarjov, K. Stochastic Aspects of Crack Deflection and Crack Path Prediction in Short Fiber Reinforced Polymer Matrix Composites. Eur. J. Mech.—A/Solids 2022, 95, 104598. [Google Scholar] [CrossRef]
  25. Díaz-Rodríguez, J.G.; Gonzales, G.L.; Ortiz Gonzalez, J.A.; Freire, J.L.d.F. Analysis of Mixed-Mode Stress Intensity Factors Using Digital Image Correlation Displacement Fields. In Proceedings of the 24th ABCM International Congress of Mechanical Engineering, Curitiba, Brazil, 3–8 December 2017; ABCM: Curitiba, Brazil, 2017. [Google Scholar]
  26. Merah, N.; Albinmousa, J. Experimental and Numerical Determination of Mixed Mode Crack Extension Angle. J. Test. Eval. 2009, 37, 95–107. [Google Scholar] [CrossRef]
  27. Pook, L.P. The Effect of Crack Angle on Fracture Toughness. Eng. Fract. Mech. 1971, 3, 205–218. [Google Scholar] [CrossRef]
  28. Aliha, M.R.M.; Berto, F.; Mousavi, A.; Razavi, S.M.J. On the Applicability of ASED Criterion for Predicting Mixed Mode I+II Fracture Toughness Results of a Rock Material. Theor. Appl. Fract. Mech. 2017, 92, 198–204. [Google Scholar] [CrossRef]
  29. Miranda, A.C.O.; Meggiolaro, M.A.; De Castro, J.T.P.; Martha, L.F. Fatigue Life Prediction of Complex 2D Components under Mixed-Mode Variable Amplitude Loading. Int. J. Fatigue 2003, 25, 1157–1167. [Google Scholar] [CrossRef]
  30. Sutton, M.A.; Orteu, J.J.; Schreier, H. Image Correlation for Shape, Motion and Deformation Measurements: Basic Concepts, Theory and Applications; Springer: Boston, MA, USA, 2009; ISBN 978-0-387-78746-6. [Google Scholar]
  31. Díaz, J.G.; Freire, J.L.d.F. LEFM Crack Path Models Evaluation under Proportional and Non-Proportional Load in Low Carbon Steels Using Digital Image Correlation Data. Int. J. Fatigue 2022, 156, 106687. [Google Scholar] [CrossRef]
  32. Atkinson, L. A Simple Benchmark of Various Math Operations. Available online: https://latkin.org/blog/2014/11/09/a-simple-benchmark-of-various-math-operations/ (accessed on 2 November 2023).
Figure 1. Schematics and notation of acting stress in a cracked body.
Buildings 14 00495 g001
Figure 2. Dimensionless PZ for different mode mixity ratios (KII/KI). (a) W criterion; (b) R criterion.
Buildings 14 00495 g002
Figure 3. Schematics of the tests. (a) Measured points for the holed CT specimen; (b) testing setup for the holed CT sample; (c) SENT with the inclined crack. (a,b) from [25].
Buildings 14 00495 g003
Figure 4. Evaluation of crack kinking models for the modified C(T) sample.
Buildings 14 00495 g004
Figure 5. Size and shape or plastic zone for the modified C(T) specimen at different crack lengths: (a) from the W criterion and (b) from the R criterion.
Buildings 14 00495 g005
Figure 6. Evaluation of crack kinking models for SENT samples.
Buildings 14 00495 g006
Figure 7. Size and shape of the plastic zone for the SENT sample 45°: (a) from the W criterion, (b) from the R criterion.
Buildings 14 00495 g007
Figure 8. Size and shape of the plastic zone for the SENT sample 22.5°: (a) from the W criterion and (b) from the R criterion.
Buildings 14 00495 g008
Figure 9. CP angle variation with mode mixity: (a) modified C(T) and SENT samples and (b) close-up of the SENT 22.5° sample.
Buildings 14 00495 g009
Table 1. Experimental parameters for the modified C(T) at different crack lengths, from [25].
Pointa [mm]θ*ΔKI, MPa√mΔKII, MPa√mΔKII/ΔKI
02.1013.120.460.04
a4.1017.780.470.03
b6.3−518.140.590.03
c8.2−519.671.170.06
d10.2−722.001.550.07
e11.9−2426.853.550.13
Table 2. Experimental parameters for the thin strips from [26].
a/WKI/(σ√πa)KII/(σ√πa)KII/KI
45°
0.30.830.480.58
0.40.960.500.52
0.51.220.570.47
0.61.420.650.46
22.5°
0.31.480.350.24
0.41.800.410.23
0.52.280.540.24
0.62.990.680.23
Table 3. Error percentage in crack kinking angle prediction.
C(T)SENT 45°SENT 22.5°
ΔKII/ΔKIW, C(T)R, C(T)ΔKII/ΔKIW 45°R 45°ΔKII/ΔKIR 22.5°R 22.5°
0.04−1.11−1.110.588.331.110.240.830.83
0.03−1.11−1.670.528.890.000.230.280.28
0.030.560.280.479.44−1.110.241.390.83
0.06−1.110.560.468.89−1.110.230.830.28
0.07−0.560.00
0.135.562.78
Table 4. Computational cost for the evaluated criteria; baseline values from [32].
Operator+, −, ×, /Sin, Cos, AtanAcosTanABS, SGN^Total Cost
Operator Cost2254628
Cost in W model2301000010176
Cost in R model33050008155
Disclaimer/Publisher’s Note: The statements, opinions and data contained in all publications are solely those of the individual author(s) and contributor(s) and not of MDPI and/or the editor(s). MDPI and/or the editor(s) disclaim responsibility for any injury to people or property resulting from any ideas, methods, instructions or products referred to in the content.

