Article

Evaluation of Design Parameters for Daylighting Performance in Secondary School Classrooms Based on Field Measurements and Physical Simulations: A Case Study of Secondary School Classrooms in Guangzhou

1
School of Architecture, State Key Laboratory of Subtropical Building and Urban Science, South China University of Technology, Guangzhou 510641, China
2
Architectural Design and Research Institute of SCUT, South China University of Technology, Guangzhou 510641, China
*
Author to whom correspondence should be addressed.
Buildings 2024, 14(3), 637; https://doi.org/10.3390/buildings14030637
Submission received: 13 January 2024 / Revised: 14 February 2024 / Accepted: 19 February 2024 / Published: 28 February 2024

Abstract

:
The quality of natural lighting within secondary school classrooms can significantly affect the physical and mental well-being of both teachers and students. While numerous studies have explored various aspects of daylighting performance and its related factors, there is no universal standard for predicting and optimizing daylighting performance from a design perspective. In this study, a method was developed that combines measurements and simulations to enhance the design parameters associated with daylighting performance. This approach facilitates the determination of precise ranges for multiple design parameters and allows for the efficient attainment of optimal daylighting performance. Daylight glare probability (DGP), point-in-time illuminance (PIT), daylight factor (DF), and lighting energy consumption were simulated based on existing control parameters of operational classrooms. The simulation results were then validated using field measurements. Genetic algorithms (GAs) were employed to optimize the control parameters, yielding a set of optimal solutions for improving daylight performance. The differences between daylighting performance indicators corresponding to the optimal solution set and those of the basic model were compared to test the performance of the optimized parameters. The proposed method is a robust process for optimizing daylight design parameters based on GAs, which not only enhances daylighting performance but also offers scientifically grounded guidelines for the design phase. It is a valuable framework for creating healthier and more productive educational environments within secondary school classrooms.

1. Introduction

The secondary-school teaching building serves as the central hub for daily teaching activities within a secondary school. A well-designed indoor daylight environment in such buildings can enhance learning efficiency, promote the physical and mental wellness of both students and educators, and reduce the prevalence of myopia [1,2,3,4,5]. Natural light provides the necessary illumination for teachers and students to do their work, while also introducing thermal radiation into the indoor space. Inappropriate thermal radiation levels can result in indoor temperatures and air quality exceeding human comfort thresholds, as well as cause eye and upper respiratory tract irritation, headaches, fatigue, drowsiness, and even breathing difficulties or asthma. Additionally, the quality of the indoor environment can affect students’ attention and memory, thereby indirectly impacting their learning efficiency [6,7,8,9,10]. Adverse health issues stemming from subpar indoor environmental conditions can diminish performance and learning efficiency.
Today, the myopia rate among Chinese adolescents exceeds 50% [11]. Contemporary medical research indicates that short-wavelength blue light found in natural daylight can promote healthy eye development, with the quantity of natural light received during adolescence affecting the likelihood of myopia [12]. Natural light provides a high-quality light source for vision, which enhances color perception and visual performance, helping students observe details more effectively. Therefore, a favorable natural light environment is an essential factor in preventing myopia among teenagers. Considering the substantial impact of natural lighting on the health and learning efficiency of teachers and students, research into the daylighting environment has considerable significance.
Moreover, properly managing the relationship between buildings and the environment can reduce energy consumption and carbon emissions [13,14]. By the end of 2021, China had a total of 52,900 junior high schools with 50.1844 million students, occupying a building area of 75.5937 million square meters. There were 14,600 regular senior high schools with 26.0503 million students, occupying a building area of 64.3621 million square meters. These figures exclude special education, vocational education, and private education [15]. As the country’s educational infrastructure has improved, the continual expansion of building footprints has increased the energy consumption and carbon emissions of buildings. From 2006 to 2030, the energy demand for educational buildings is expected to grow at an annual rate of 1.2%. Currently, primary and secondary school buildings account for 7% of China’s total public building energy consumption. The energy consumption per unit area in secondary schools is two to three times that of typical urban residential buildings [16].
The depth of typical Chinese secondary school classrooms is considerable, despite the presence of exterior corridors. Though windows line both sides of the classroom, the central area is not sufficiently illuminated and daylighting across the room is uneven. Due to a lack of experience and guidance in classroom daylighting design, certain educational buildings are designed without thorough consideration of the building’s orientation, leading to excessive window area. This oversupply of windows results in overheating and glare during summer months. The resulting reliance on artificial lighting to compensate for insufficient natural light not only fails to conserve energy but also creates unfavorable conditions for adolescents’ visual health. There are currently approximately 600 million myopia cases in China, with the rates of visual impairment among primary school students (ages 7–12), middle school students (ages 13–15), and high school students (ages 16–18) reaching 45.71%, 74.36%, and 83.28%, respectively [11]. The prevalence of visual impairment among middle school students is particularly high, warranting close attention.
Recent medical research has highlighted the role of short-wavelength blue light in natural light promoting eyeball development [17]. Adolescents who are exposed to more natural light during their growth are less likely to develop myopia [18]. Proposed classroom lighting standards recommend an average indoor illuminance of at least 300 lux, with a natural light design illuminance of at least 450 lux, and an average daylight factor of 3% at minimum [19]. While a window-to-floor area ratio of no less than 20% is suggested in design guidelines, other directives affecting indoor natural lighting seem to be lacking.
Researching the indoor lighting environment of secondary school classrooms can address the high rate of myopia among students while also filling gaps in lighting design guidelines and advancing energy-saving and emission reduction objectives. The design optimization can enhance indoor lighting comfort and decrease energy consumption; effective natural daylighting conserves energy while also mitigating solar radiation effects, consequently lowering the emissions from air conditioning. Therefore, successful daylighting design should not only introduce ample natural light but also address concerns related to glare and overheating.
Architectural design shapes the quality of indoor daylighting, with various design control parameters influencing the distribution and intensity of daylight. In today’s architectural design process, the optimization of building daylighting performance mainly revolves around optimizing the parameters of enclosure components such as the window-to-wall ratio (WWR), window materials, and shading materials during the construction drawing phase. By altering WWR, the amount of daylight entering the interior can be adjusted, thus affecting indoor illuminance [20]. Increasing facade shading can reduce the amount of daylight entering the interior, thereby lowering the DGP value [21]. Ensuring sufficient indoor light when adjusting both windows and blinds as necessary can prevent overheating while conserving energy [22]. Some studies have also focused on existing buildings and lighting systems, conducting physical environment data tests to summarize energy consumption patterns [23,24,25,26].
Previous researchers have generally conducted performance predictions after a design scheme has already been determined, or focused on the outcomes of building performance predictions, often overlooking the scientific exploration of acquiring measurement data and the selection and assessment of relevant parameters.
Performance optimization design should begin during the architectural design phase, considering the overall design for daylight in secondary school classrooms. This process should center not only on building components but also integrate various factors, such as building orientation, facade elements, and the optical properties of interior materials, in accordance with regulations. It is important to emphasize that the design of window openings and walls between windows is subject to regulatory constraints; the latter cannot serve as a substitute for casement requirements. Enhancing performance should be a design objective in the early stages of the design process [27] and isolating the control parameters that affect daylighting performance is crucial. The number and type of control parameters can influence the accuracy and complexity of such models.
There are many control parameters that can influence natural daylighting in buildings, including building orientation, WWR, shading form, room dimensions, the reflectance coefficients of interior surfaces, and the position, size, and visible light transmittance of windows. These control parameters can affect various daylighting performance indicators, which serve as predicted target parameters. These indicators encompass elements like the magnitude and distribution of indoor illuminance, DF, luminance, glare, and lighting energy consumption. The building’s control parameters should be oriented towards building performance, health, and comfort throughout the entire design phase, resulting in architectural expressions that harmoniously integrate regional characteristics adapted to the local climate and environment. To this effect, design control parameters significantly impact the daylighting environment and lighting energy consumption.
In simulations of daylight performance, commonly used evaluation indexes are daylight autonomy (DA) or spatial daylight autonomy (sDA), as well as useful daylight illuminance (UDI) as recommended for climate-based daylight modeling (CBDM). These metrics aid in assessing how well an indoor space is lit by natural light. Reinhart [28] summarized the limitations of traditional, static daylight performance metrics and introduced the concept of dynamic daylight performance metrics, which can more effectively reflect the interactions between a building, its occupants, and the climate. This information assists in making sound design-related decisions regarding daylight illuminance. CBDM metrics can be employed to assess indoor daylight levels [29,30], primarily reflecting the average daylight conditions on the horizontal plane. For non-horizontal surfaces, other metrics can be utilized to evaluate vertical illuminance and real-time illuminance as per the actual circumstances at hand.
Currently, there are two methods primarily used to predict building performance using design control parameters: physical modeling and data-driven approaches [31]. Physical modeling, or “white-box” modeling [32], relies on thermodynamic principles and the use of simulation software to make performance predictions [33,34]. It operates on the principle of predicting building behavior based on the physical properties of simulated objects, with mathematical equations of building performance operations as a simulation engine. These physical properties are usually derived from design plans, product specifications, or field measurements. In contrast, data-driven methods, or “black-box” modeling, utilizes historical empirical data to predict building performance [35]. The accuracy of black-box models depends on extended training periods and comprehensive datasets. Both performance-prediction methods are significantly influenced by the selection of input parameters, the quality of recorded measured data, and the specific algorithms utilized [36]. Both methods also require the collection of physical measurements; however, the objectives of these measurements differ.
Physical modeling requires measured data for comparison and validation against simulation results, a crucial step in assessing the accuracy of predictions [37]. Data-driven approaches necessitate measuring data prior to making predictions to create a dataset for training the prediction model. For physical modeling, the conditions in which measurements are taken (e.g., weather, room shape, material selections) should closely match the simulated objects. Data-driven methods, conversely, may be based on measurements from similar types of buildings, gathered with less emphasis on specific building parameters while prioritizing variables such as temperature, humidity, solar radiation, illuminance, luminance, and energy consumption over a specific time period. The measurement data from the two prediction methods all reflect the selection of parameters relevant to building performance under a given condition; both also involve determining the accuracy of the performance predictions. Considering the respective principles and characteristics of these two performance prediction methods, physical modeling was better suited to the purposes of this study.
In accordance with the above considerations, this study began with an investigation on middle school classrooms with comparable control parameters. Measurements, simulations, and optimization processes for daylighting performance were conducted. The primary aim was to identify important parameters related to daylighting performance and to use GAs to optimize these parameters. Design strategies were formulated accordingly to improve daylighting performance in middle school buildings. The results of this work may provide valuable insights for researchers and designers to better understand the parameters governing daylighting performance in schools, and for architectural designs that seamlessly integrate performance predictions.

2. Methodology

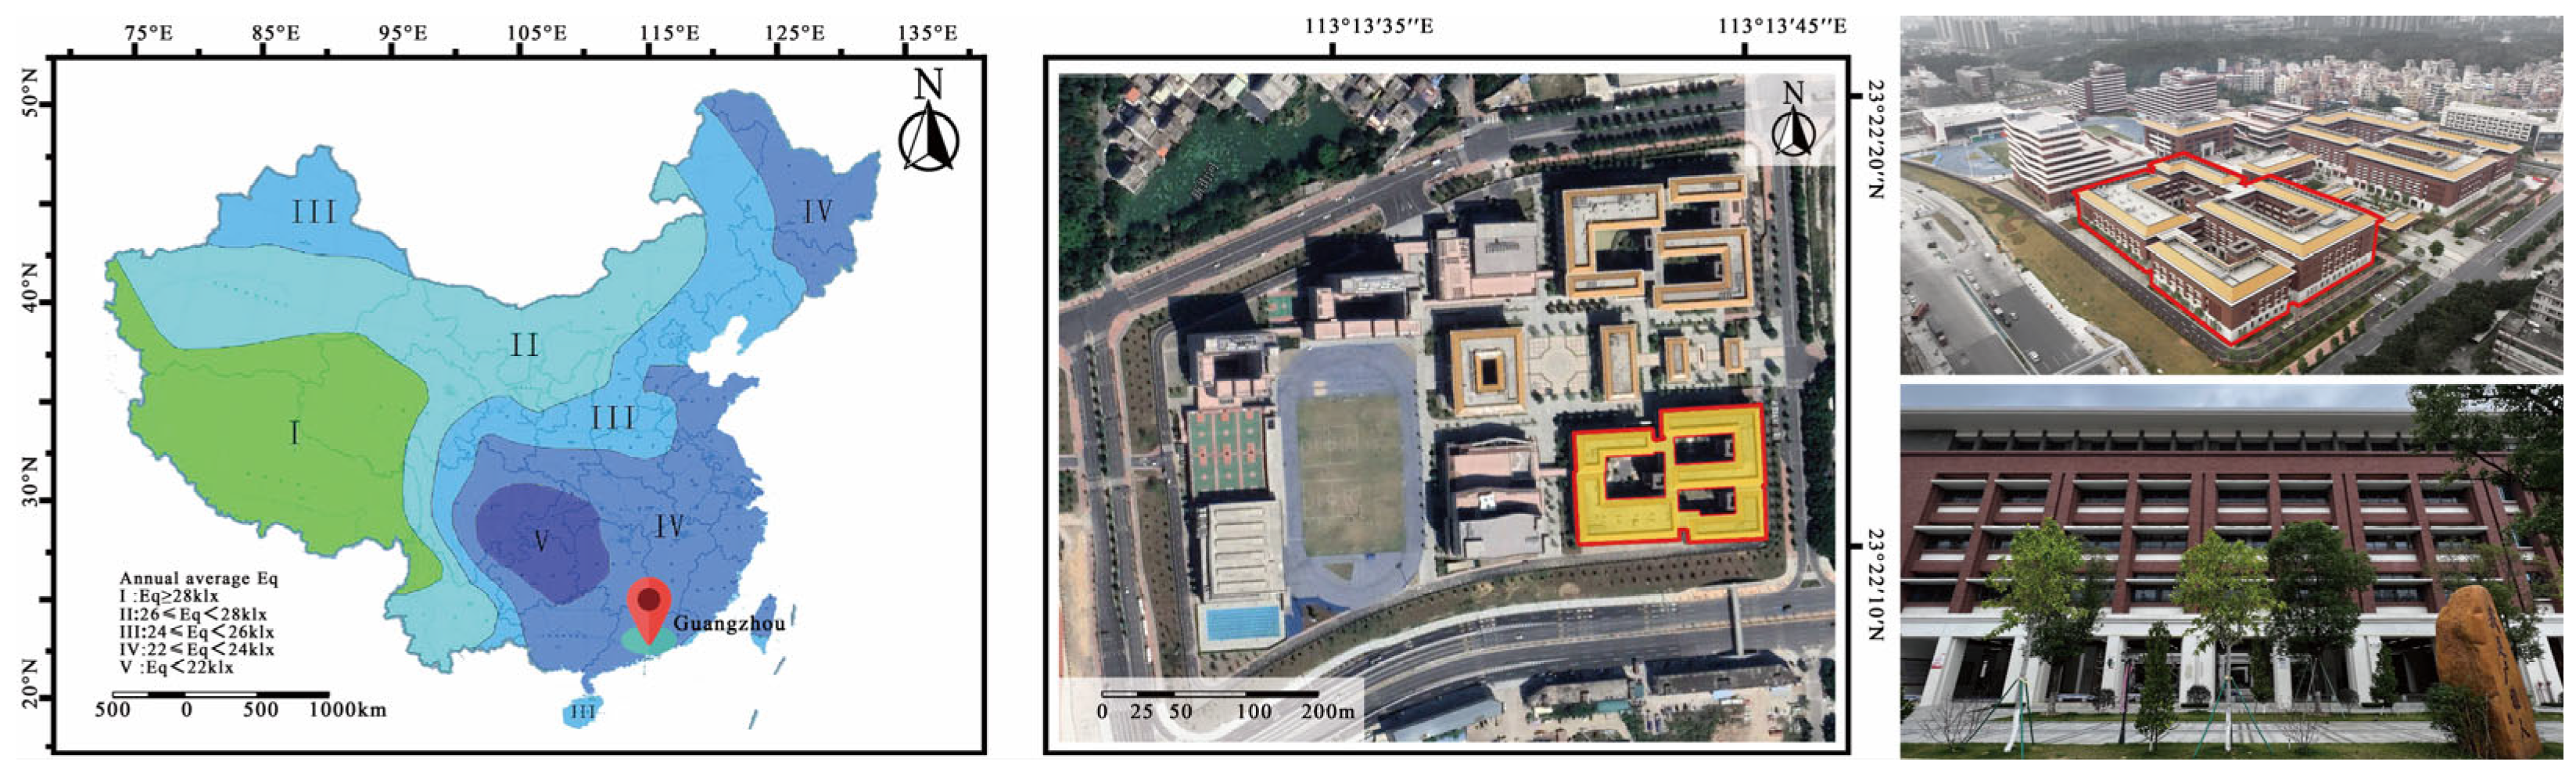
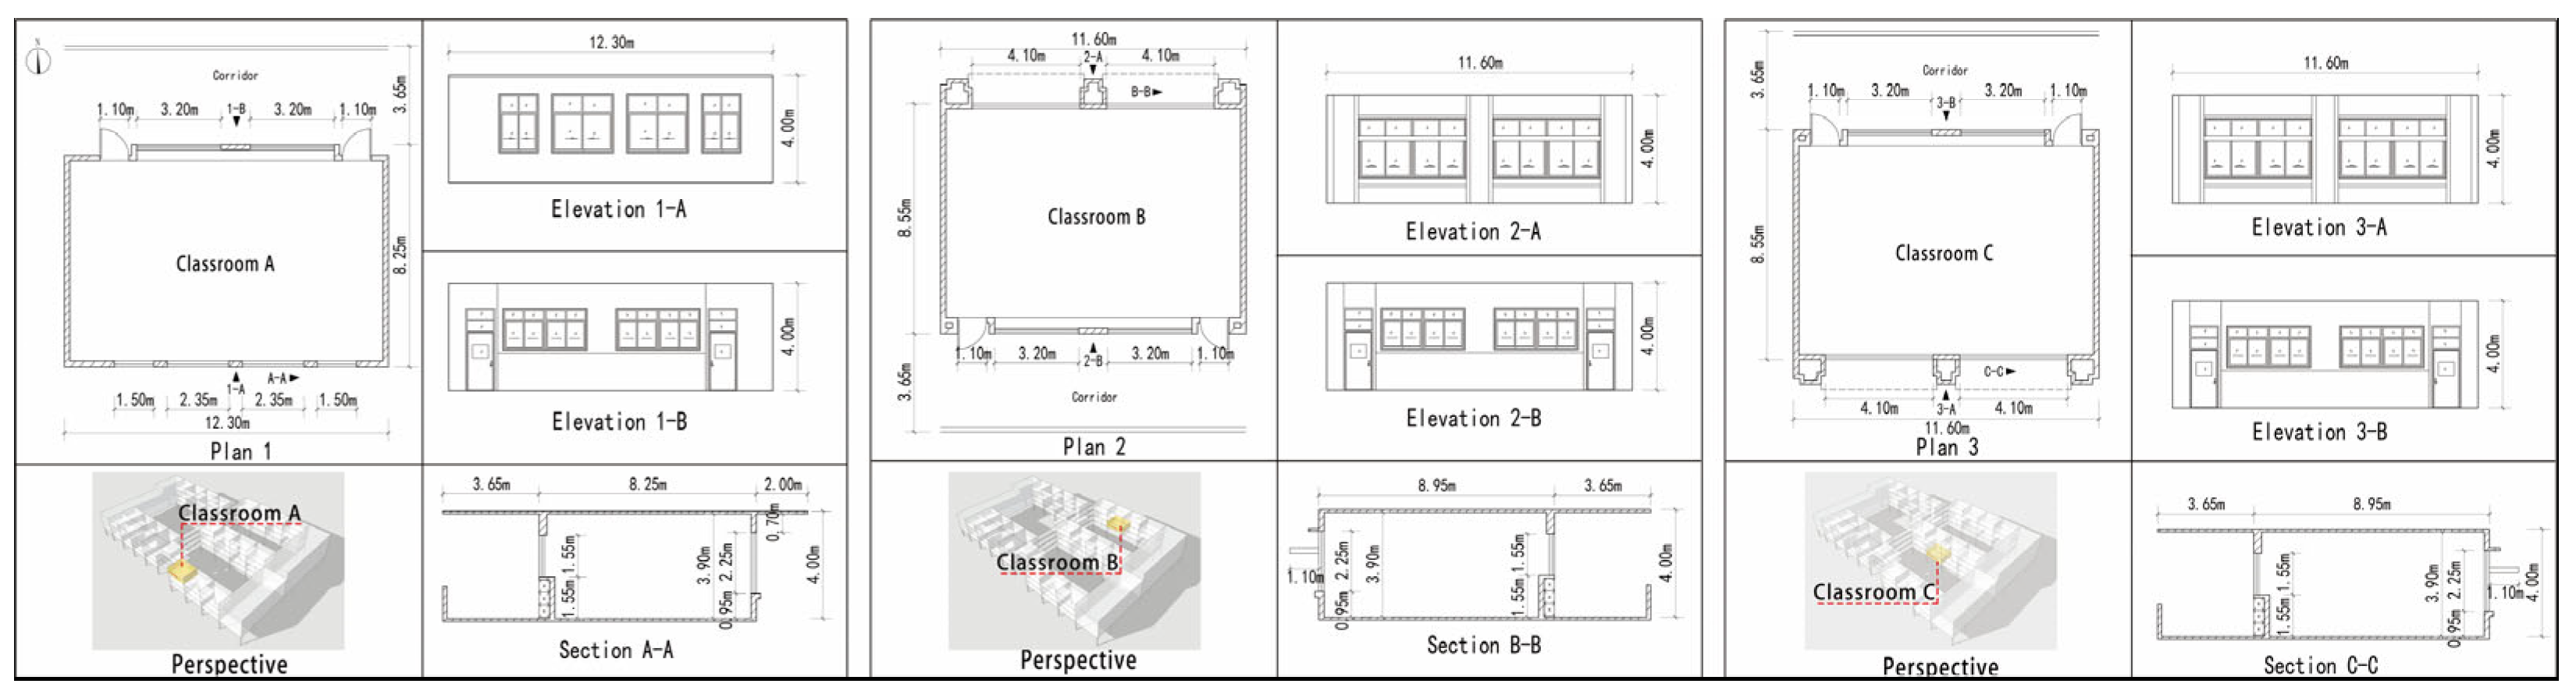
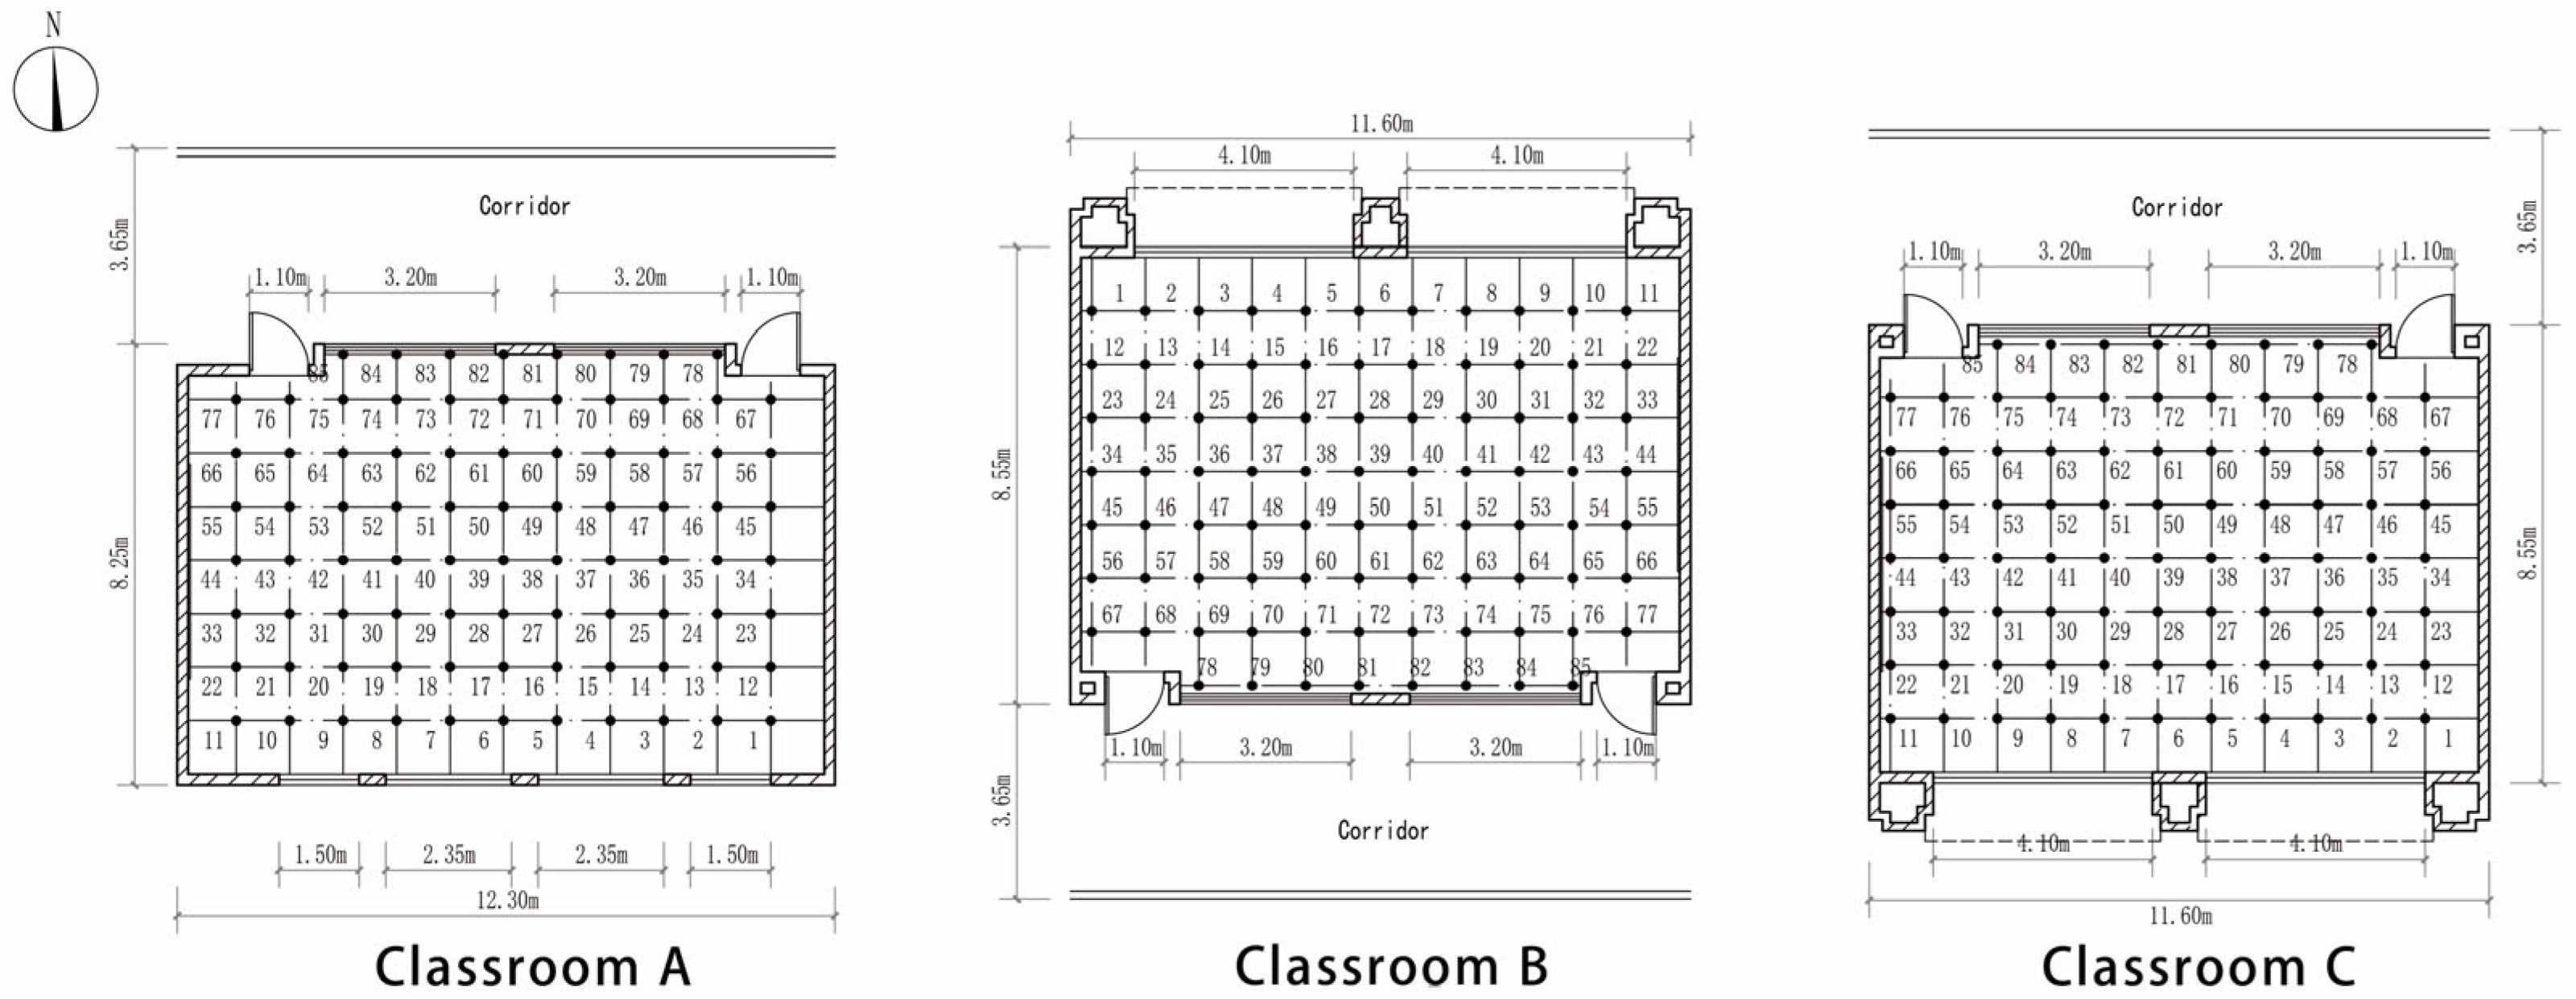
2.1. Basic Information
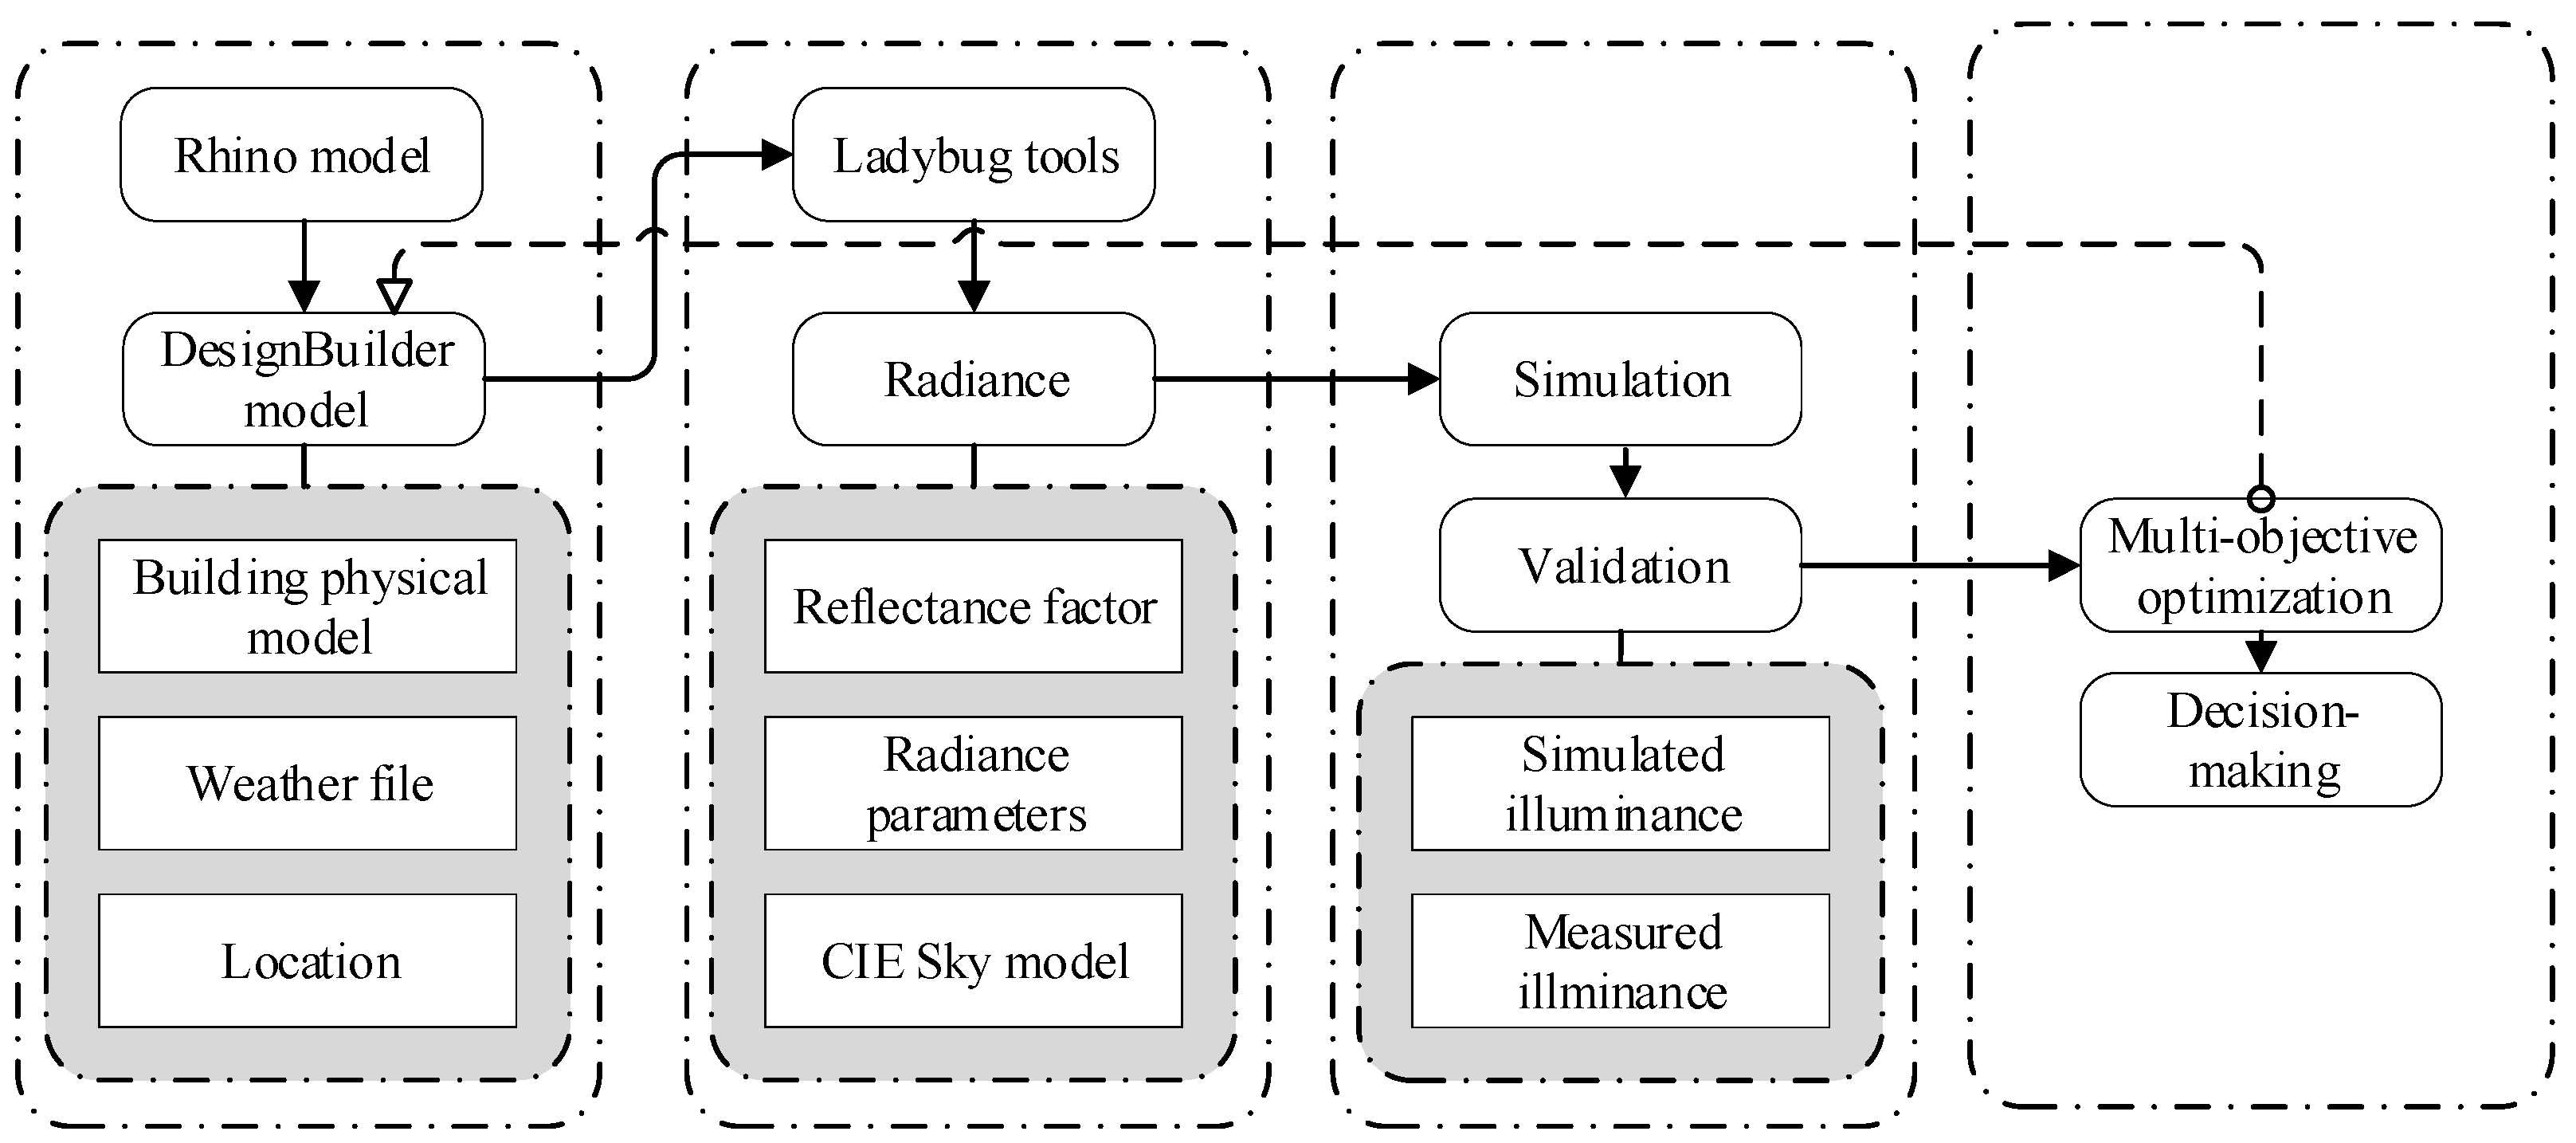
The case-study classroom is located in the junior high school section of Guangya Middle School in Huadu District, Guangzhou, China. Guangzhou is situated in southern China (112°57′~114°3′ E, 22°26′~23°56′ N), downstream of the Pearl River and near the South China Sea. The Tropic of Cancer crosses its northern region. Guangzhou has a maritime subtropical monsoon climate characterized by warm and rainy conditions, abundant sunshine, long summers, and brief frost periods. It falls under category IV of China’s solar climate classification [38]. The location of this case corresponds to the solar climate classification zone shown in Figure 1.
The monthly average solar climate conditions in Guangzhou are described in Table 1 [39].
Ghangzhou receives a total of 1628 annual sunshine hours, with solar radiation ranging from 1213.1 to 1277 kWh/m2. The distribution of solar radiation is higher in the south and lower in the north. The most intense solar radiation occurs in June and the weakest is in February. The city has an average annual temperature of 22.8 °C and a relative humidity of 73%. Middle school teaching typically takes place from February to July and from September to the following January. High temperature, high humidity, and intense radiation in the environment can reduce both comfort and learning efficiency for teachers and students. At times when the solar altitude angle is low, radiation from the east and west directions can also cause indoor glare problems.
The construction of the junior high school section of Guangya Middle School in Huadu District, Guangzhou, comprises a five-story reinforced concrete structure with a compact layout, facing 3°18′ east of south. The building has a length of 124.5 m (408.46 ft), a width of 86.1 m (282.48 ft), and a height of 21.9 m (71.85 ft), covering a total area of 27,336 m2 (294,268 sq. ft). The building is divided into two parts: the east side is a teaching area and the focus of this research, while the west side is a laboratory that falls outside of the scope of this study (Figure 2a). The external configuration of the teaching building resembles the letter “E” in shape, with classrooms connected in a linear pattern. The ground floor is elevated, serving as a flexible space for various activities, professional communications, socializing, and relaxation.
Three classrooms with distinct parameters from the teaching area were selected from the junior high school section for field testing and performance simulation. These classrooms have varying orientations and heights. As shown in Figure 2b, Classroom A is located in the middle of the fourth floor on the south side of the building, where south-facing daylight conditions are favorable. Classroom B is situated in the middle of the third floor on the north side of the building, which mainly receives north-facing daylight. Classroom C is on the second floor in the central part of the building, where it receives daylight from both the north and south courtyards. All three classrooms are aligned along the same longitudinal axis and have a height difference of 4 m.
The geometric attributes of the three classrooms are illustrated in Figure 3. External side windows are each 0.9 m in height while side windows facing the corridor are 1.5 m in height. In Classroom A, roof eaves provide shading; they have the same height as the roof slab and project 2.0 m outward. In Classrooms B and C, horizontal shading devices made of brown metal are positioned at 2/3 of the window height. The shading devices have the same width as the windows, with a thickness of 0.2 m and a projection of 1.1 m. The top of the shading devices enhances the diffusion of light and improves indoor daylighting uniformity by reflecting light onto the interior ceiling. The bottom of the shading devices weakens direct sunlight, preventing excessively strong illuminance in the areas close to the windows.
In all three classrooms, the windows are furnished with double-layer insulated transparent glass (6 + 12 air + 6) and are designed to slide open. The interior ceiling is coated with white emulsion paint and surfaces below 1.5 m are covered with white matte tiles. The upper portions of walls, beyond 1.5 m, are also coated with white emulsion paint. The flooring consists of dark grey matte tiles. The classrooms are equipped with a multi-split central air conditioning system. Other energy-consuming equipment includes lighting, fans, multimedia devices, and charging cabinets for student tablets. Learning hours in the teaching building are scheduled on weekdays from 8:00–12:20, 14:05–17:40, and 19:00–22:10.
The main parameters affecting natural daylighting in the three classrooms were compared, as described in Table 2.

2.2. Workflow

A framework for the evaluation and optimization of building daylighting performance was developed in this study based on field testing and physical modeling. The specific workflow (Figure 4) has four main steps.
Step 1: Using a parametric platform for physical modeling, establish classroom models with different parameters and comparable characteristics.
Step 2: Utilize the performance simulation program “Ladybug Tools” to operate the simulation models, obtaining daylighting performance simulation results.
Step 3: Conduct field measurements on the simulated classrooms and compare the simulation results with the actual test data to analyze their common features and differences.
Step 4: According to these comparisons, identify significant control parameters and their reasonable ranges that affect classroom daylighting. These control parameters can then be used as optimization control factors. Daylighting performance indicators serve as objective parameters for an optimization calculation. By employing a GA, we can obtain the optimal solution set and summarize the design strategies for optimizing the building’s daylighting.

2.2.1. Modeling

In this study, Rhino 7.26/Grasshopper 1.0 software was used for modeling. A digital analysis model was created based on design drawings of the middle school teaching building and data collected from field surveys. External decorative elements that had no impact on daylighting were simplified. The orientation and geometric dimensions of the classrooms, performance parameters of the building envelope, optical characteristics of various material interfaces, and the operating schedule of building equipment were all set according to the actual on-site conditions.

2.2.2. Daylighting Performance Simulation

The availability of sky conditions is a prerequisite for conducting daylighting simulations. The EPW-format meteorological data for Guangzhou provided by the Energy Plus official website, which provides a sky model under specific conditions, was used for the purposes of this study. Indoor daylighting evaluation standards are mostly based on illuminance and can be divided by whether they are static or dynamic criteria. There are various dynamic daylighting evaluation standards available. Dynamic metrics that can be compared with real-time measurements include the PIT and DGP, which accurately reflect illuminance and glare conditions at specific time points.
CBDM simulations typically rely on two indicators, DA (or sDA) and UDI, to evaluate lighting performance. However, these indicators do not reflect real-time illumination and cannot be compared with experimental data. The most widely used static daylight evaluation standard, the DF, was utilized in this study. DF measurements can be used to assess the building’s spatial form, the geometric dimensions of openings, shading strategies, and the optical properties of interior and exterior surfaces. Additionally, during each illumination energy simulation, artificial lighting was activated when the natural daylight illuminance on the desktop fell below 450 lux [40]. Ladybug Tools were used to simulate the DF, PIT, DGP, and lighting energy consumption of the three case-study classrooms. The simulation time for each performance indicator was synchronized with the field measurement time.

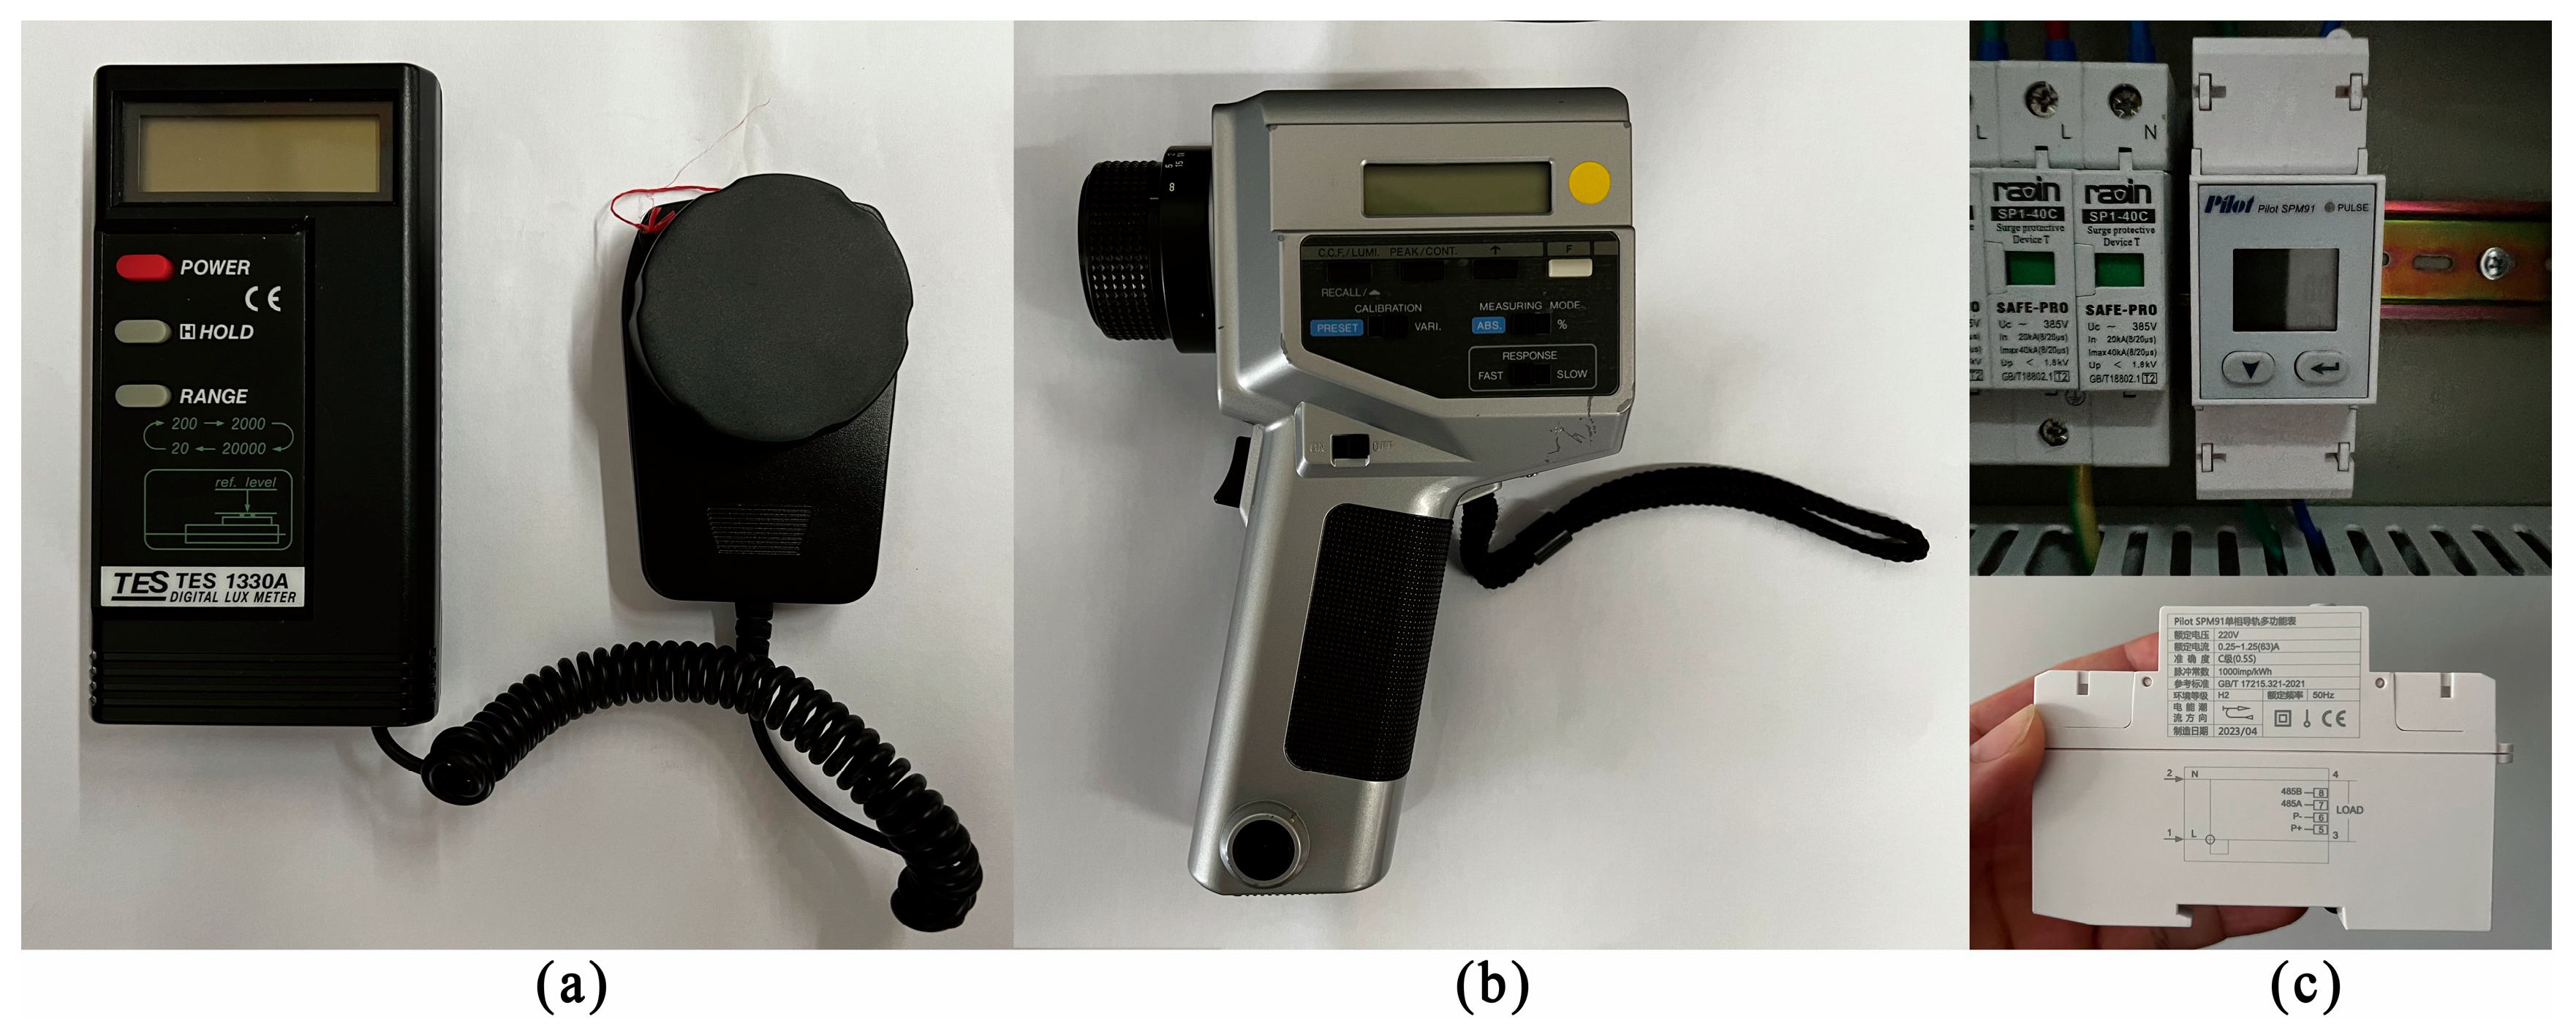
2.2.3. Testing Tools and Methods

Data collection in this study involved illuminance measurements, luminance measurement, and lighting electrical energy monitoring. A TES1330A (by TES Electrical Electronic Corp. The company is based in Taipei, Taiwan) portable illuminance meter was used for illuminance measurements (Figure 5a), a Konica Minolta LS-110 (Konica Minolta Sensing Americas Inc., Ramsey, NJ, USA) was used for luminance measurements (Figure 5b), and a Pilot SPM91 electric meter (Zhuhai Pilot Technology Co., Ltd., Zhuhai, China) was used to sub-meter the lighting electrical energy in the classrooms (Figure 5c). The key parameters of these three testing tools are listed in Table 3.
Illuminance testing was conducted following the Indoor Illuminance Testing Guide by the Illuminating Engineering Society of North America (IESNA) [41]. The test was performed on 18 May 2023, from 12:00 to 13:00 under partly cloudy sky conditions. The indoor scenario involved drawing open the curtains and ensuring that artificial lighting remained switched off throughout the testing process. The test area was divided into a grid of 1 m × 1 m squares and measurements were taken at 0.8 m above the ground. The arrangement of measurement points is illustrated in Figure 6.
The average indoor illuminance was calculated by Equation (1). DF, which represents the illuminance level at a specific point indoors and is used to evaluate the daylighting level in different areas of a building, was calculated by Equation (2).
Average illuminance (Eavg) is calculated as follows:
E a v g = E 1 + E 2 + + E 85 / 85
where E represents the illuminance measured at each point; there are 85 measurement points in each classroom under analysis here.
DF is calculated as follows:
D F = E n / E w × 100 %
where En represents the illuminance of a specific point on a given indoor plane under diffuse sky illumination, and Ew represents the illuminance of the unobstructed horizontal plane outdoors at the same time and location as the indoor point under diffuse sky illumination.
The reflectance and transmittance coefficients of various material surfaces in the tested classrooms were determined using Equations (3) and (4), respectively [42]. The visible light transmittance coefficient of the classroom windows in this study is 0.70 (with a maximum value of 1). The measured reflectance coefficients for different interior surfaces and the industry-recognized standard reflectance coefficients are listed in Table 4 [19]. The reflectance coefficients of interior surfaces have a certain impact on indoor daylighting and are important parameters for daylighting simulations. The measured material reflectance and transmittance coefficients were used throughout the simulation process, with an overall environmental reflectance coefficient of 0.2.
The reflectance coefficient ρ can be calculated as follows:
ρ = E ρ / E
and the transmittance coefficient τ as:
τ = E τ / E
where E represents the incident illuminance, Eρ is the reflected illuminance, and Eτ is the transmitted illuminance.
The luminance test was conducted on selected classrooms [43] to evaluate the DGP inside the windows. The test was carried out on 16 May 2023, at 13:00, under clear sky conditions. DGP [44,45] was evaluated based on the vertical illuminance, luminance, size, and position of the windows relative to the eye by Equation (5). Appendix A describes the impact of different DGP ranges on human visual perception.
DGP can be calculated as follows:
D G P = 5.87 × 10 5 × E υ + 9.18 × 10 2 log 10 1 + i L s , i 2 ω s , i E υ 1.87 P i 2 + 0.16
where Eυ represents the vertical illuminance of the eye, Ls is the luminance of the glare source, ω denotes the solid angle of the glare source, and P is the position index.
For the three selected test classrooms, monitoring electricity meters were installed in lighting distribution boxes to record the usage time and energy consumed by indoor lights on weekdays. Each classroom is equipped with 18 linear lamps arranged vertically, each with a power of 22 W. There are also three specialized asymmetrically distributed light fixtures to illuminate the blackboard, each with a power of 36 W. The layout of the classroom lighting fixtures is shown in Figure 7.
In real-time monitoring of the lighting energy consumption, artificial lighting was activated for supplementary illumination when the indoor natural light intensity cannot reach 450 lux. This activation can be adjusted according to outdoor weather conditions and daily schedules. During lighting energy consumption simulations, referring to the school schedule as shown in Table 5, the 450 lux threshold served as the boundary. Artificial lighting was activated when the illumination fell below this value, while it remained fully active during nighttime study periods.

2.2.4. Multi-Objective Optimization Design

The control parameters affecting the daylighting performance of the classrooms were discerned based on simulation and field measurement results. They include building orientation, window size, shading form, and the optical properties of material surfaces (e.g., reflection and transmittance coefficients). The dimensions and heights of the classrooms, which are typically constrained by design specifications and objective conditions, were not considered as control parameters in this study.
The DF, PIT, DGP, and lighting energy consumption values were set as objective parameters for optimization. To achieve the best possible daylighting performance, DF and PIT should be maximized, DGP should be kept below 0.4, and lighting energy consumption should be minimized. The multi-objective optimization program “Octopus”, which utilizes a GA, was employed for the optimization process. A total of 50 iterations (max generations) were operated with a population size of 50 individuals in each iteration.

3. Results

3.1. Simulated Daylighting Performance

DF, PIT, DGP, and daylighting energy consumption were simulated for the three classrooms to evaluate the impact of different design parameters on daylighting performance.

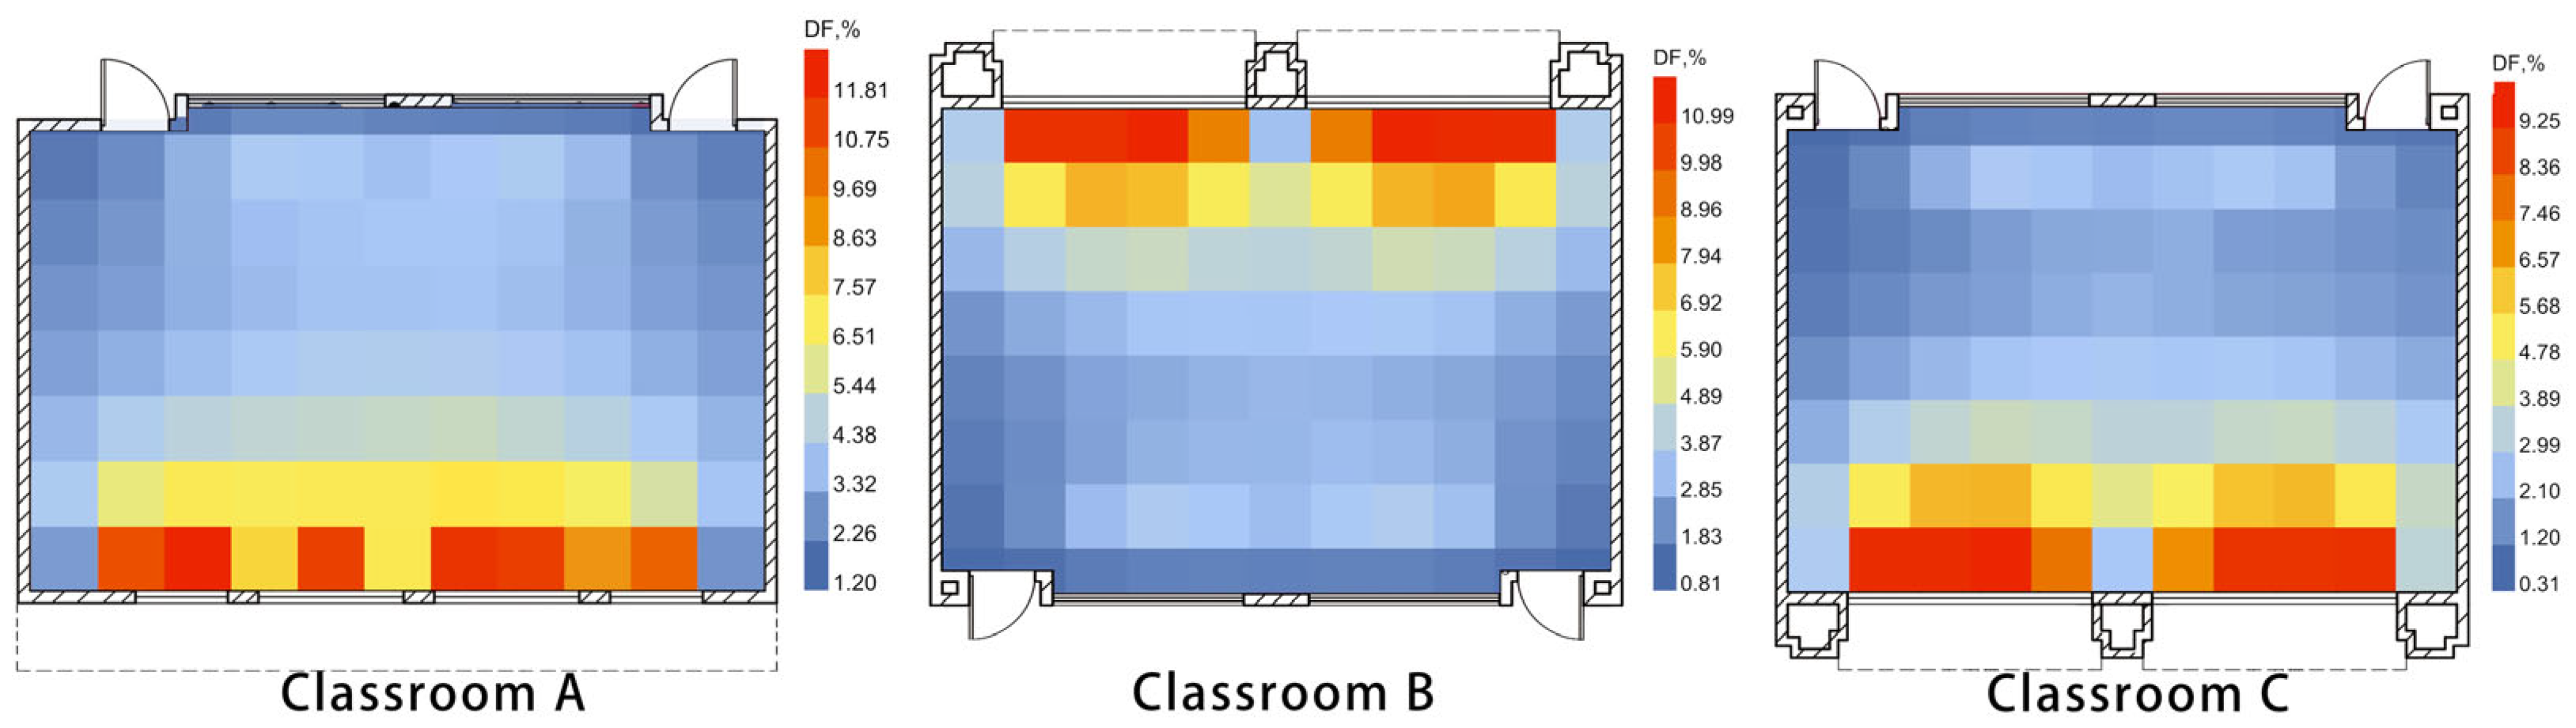
3.1.1. Simulated DF Distribution

The DF distribution simulation results for the three classroom desktops are shown in Figure 8.
Due to differences in the orientation, window size, window quantity, shading form, and external daylighting conditions, the DF simulation results show significant variations among the three classrooms. Classroom A exhibited the best daylighting performance, with a DF range of 11.81–1.20%. This is attributed to its predominant south-facing orientation, unobstructed surroundings, and advantageous position on the fourth floor. The southern window area inside this classroom receives the maximum illuminance, gradually decreasing towards the central area. The northern part of the classroom receives daylight through the corridor, leading to an increase in illuminance, while the east and west ends of the classroom have the poorest daylighting conditions.
Classroom B shows the second-best daylighting performance, with a DF range from 10.99–0.81%. It is situated on the third floor and mainly receives north-facing daylight, which is unobstructed, while daylight from the north is dominated by diffuse light from the sky. Except for areas near the windows, the whole classroom receives relatively uniform daylighting, with higher illuminance close to the north windows that decreases gradually towards the central area. The presence of the courtyard provides additional daylight near the south windows, resulting in a slight increase in illuminance. The illuminance is lowest at the east and west walls.
Classroom C exhibits the poorest daylighting performance, with a DF range from 9.25–0.31%. Being located on the lowest (second) floor, it relies on daylight from the courtyard for both north- and south-facing orientations. The southern wall directly facing the courtyard receives the highest illuminance, which gradually decreases towards the northern part of the classroom and reaches its lowest value near the northern wall.

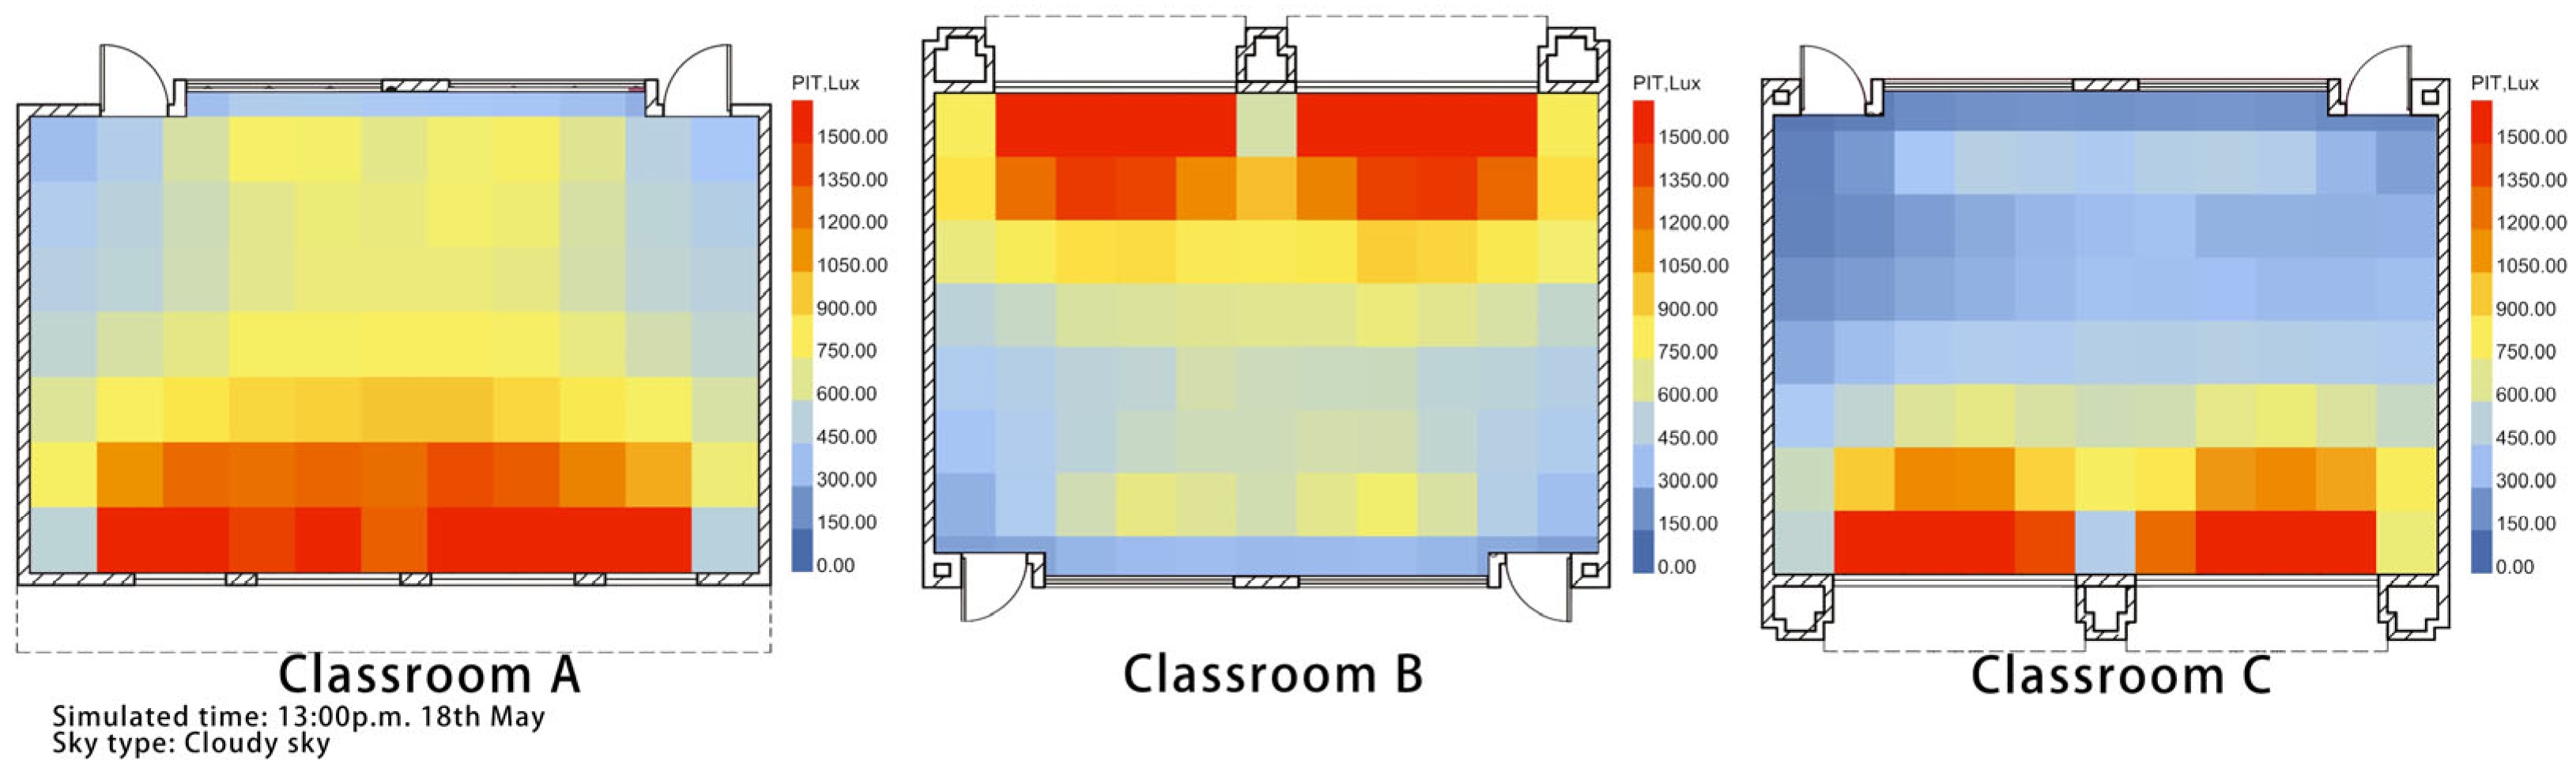
3.1.2. Simulated PIT

The PIT simulation results for the three classroom desktops are shown in Figure 9.
The PIT simulation results show that areas near light sources receive higher illuminance. In Classroom A, the size of the wall between the windows on the light side is 0.5 m, which does not significantly affect the illuminance distribution in the areas close to the windows. However, in Classrooms B and C, the window-wall dimensions are 1.0 m, resulting in noticeably lower illuminance in those areas. Classroom C is most affected, underscoring the significant impact of window-wall dimensions on indoor illuminance when daylight conditions are suboptimal.
Though both Classroom A and Classroom C face south, Classroom A has better daylight conditions due to the absence of external obstructions. Further, while both Classroom A and Classroom B lack external obstructions, they have different orientations; Classroom A faces south and Classroom B faces north. As a result, the indoor illuminance in Classroom A is higher than in Classroom B.

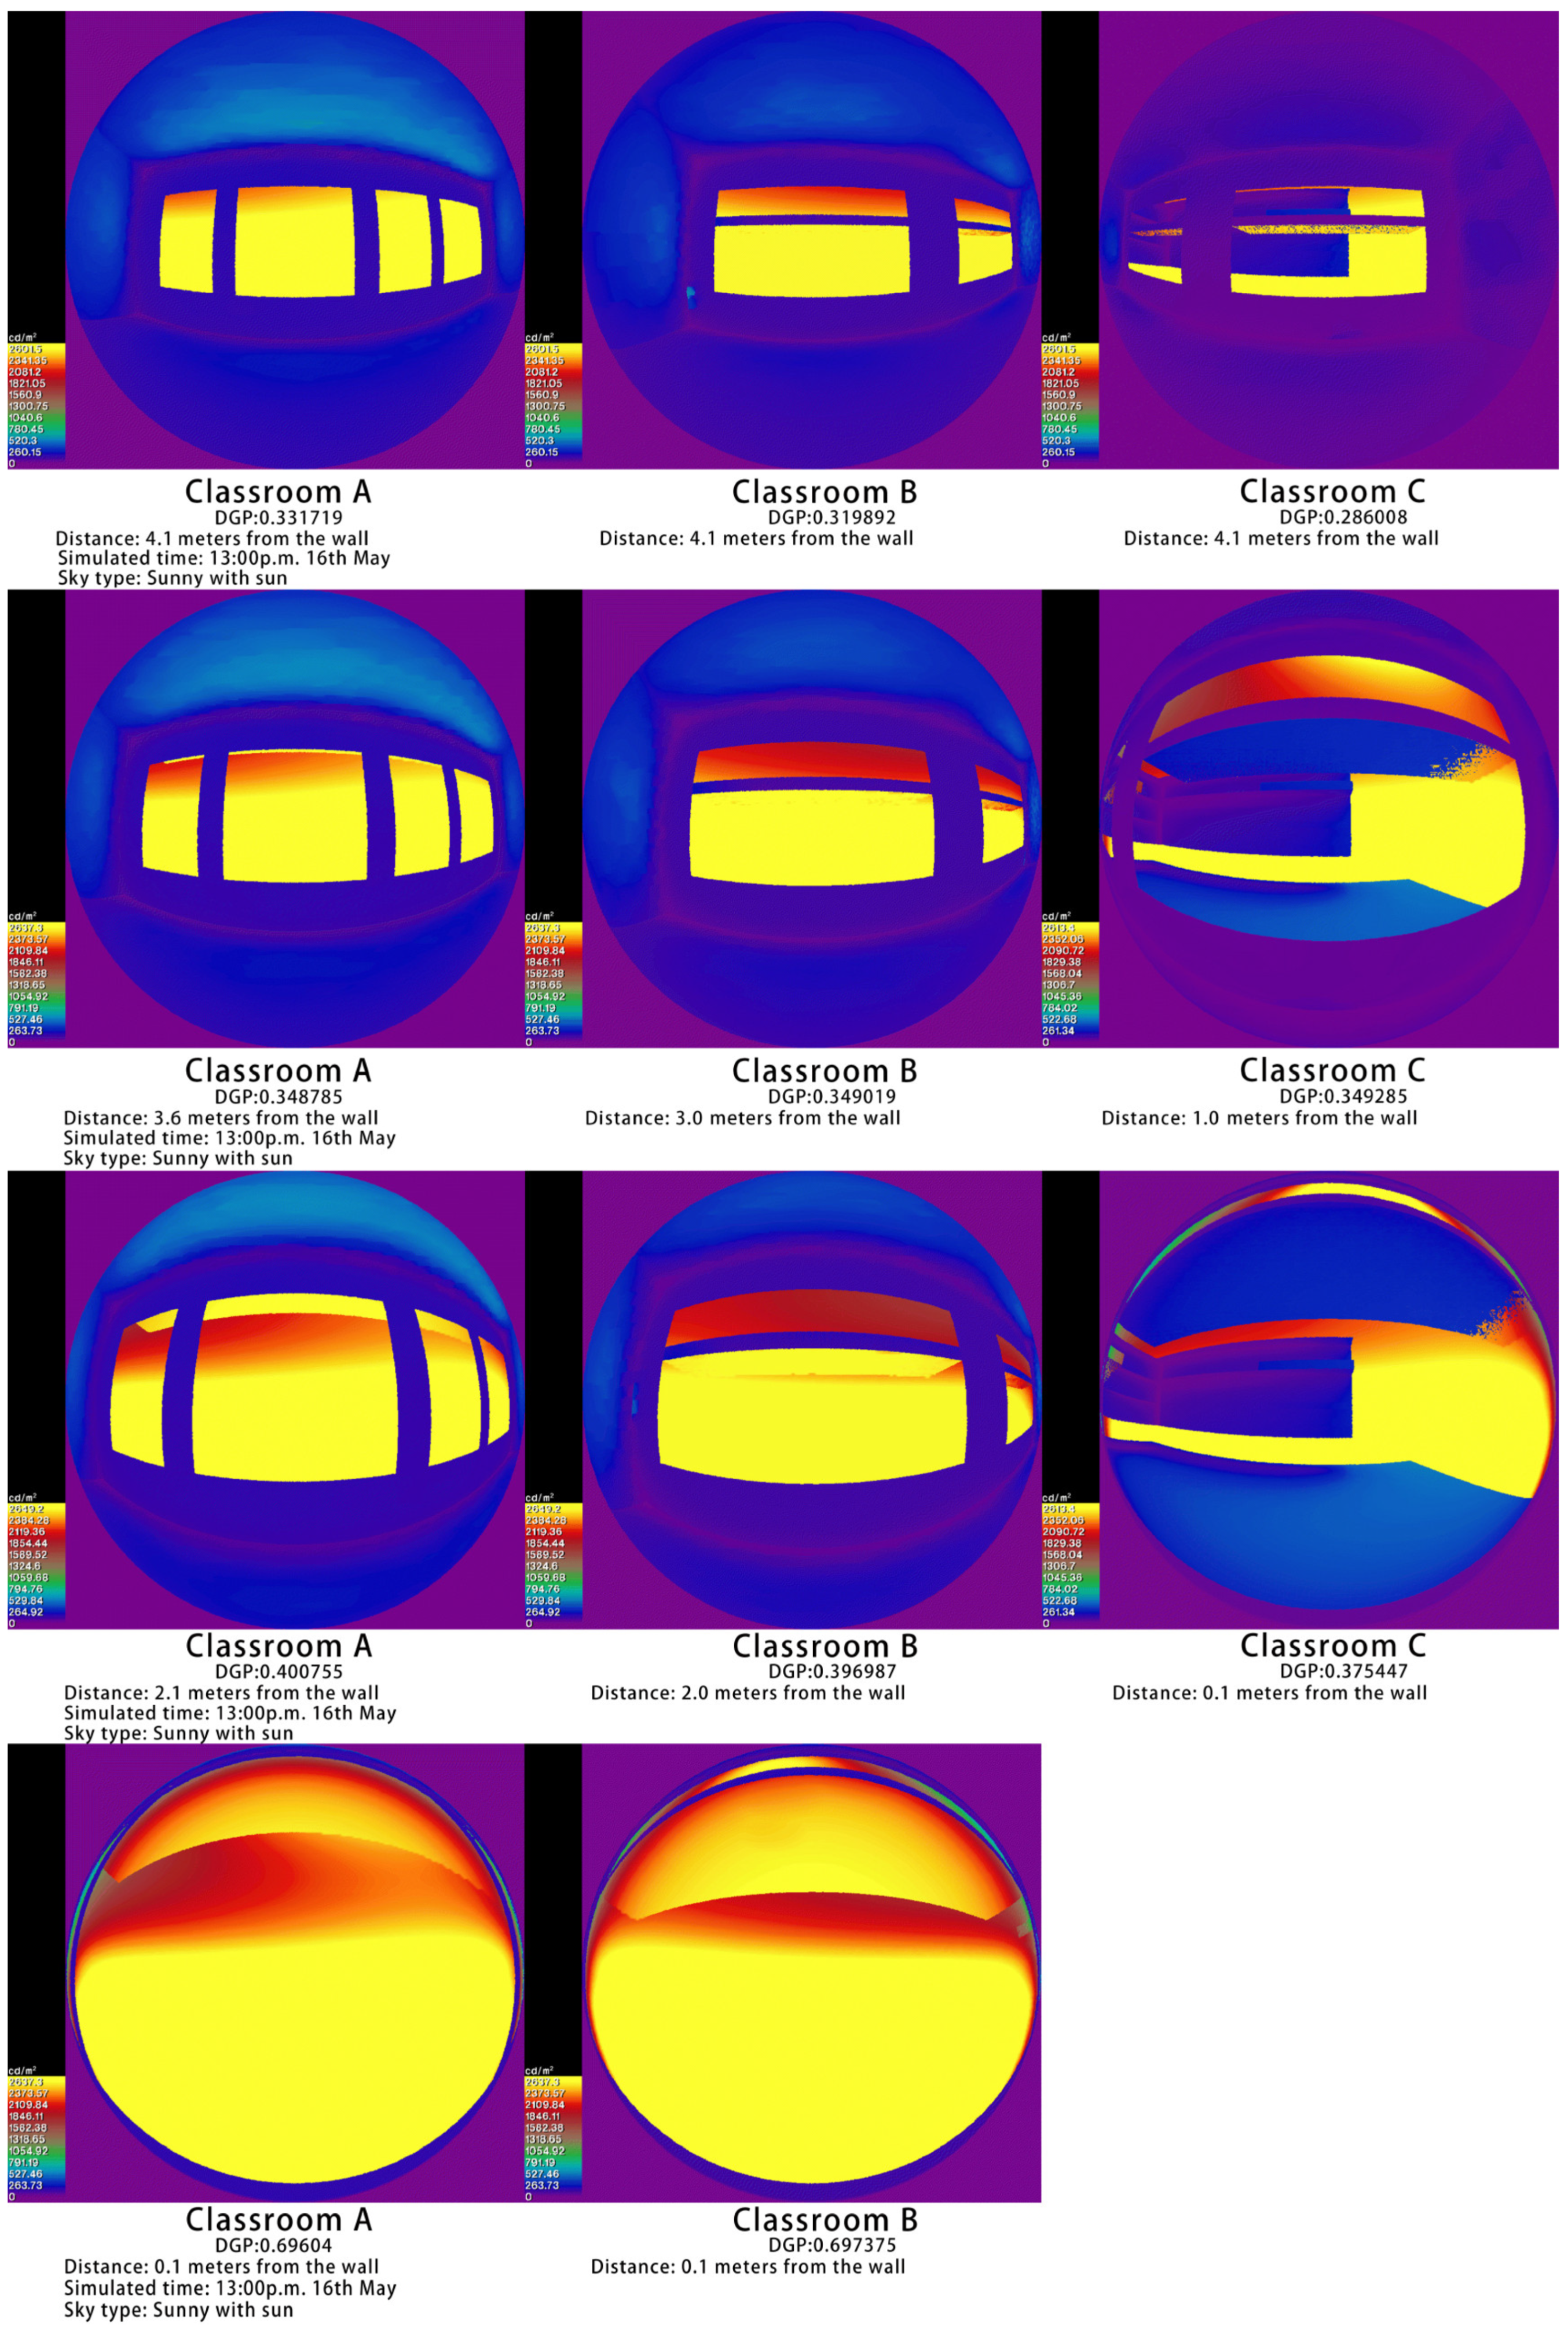
3.1.3. Simulated DGP

The DGP simulation results for different observation points in the three classrooms are shown in Figure 10.
DGP simulations were conducted for all three classrooms. Firstly, the midline position of each room was selected at a distance of 4.1 m from the daylighting wall. The DGP simulation results for all three classrooms were below 0.35, with the highest DGP value observed at the mid-point of Classroom A and the lowest DGP value at the mid-point of Classroom C.
Next, the observation point distance was adjusted to identify the distance between the point and wall at which DGP reached 0.35. The observation point was 3.6 m away from the wall for Classroom A, 3.0 m away for Classroom B, and 1.0 m away for Classroom C. Beyond this area, glare would not be perceived by teachers and students. Further adjusting the observation point distance was performed to identify the point at which DGP reached 0.40. This distance was 2.1 m for Classroom A, 2.0 m for Classroom B, and 0.1 m for Classroom C. In this area, teachers and students would experience discomfort due to glare.
Finally, when the observation point was moved closer to the wall at 0.1 m, Classroom A’s DGP reached 0.696 and Classroom B’s DGP reached 0.697, indicating significant glare. In the summer season in the Guangzhou area, both south-facing and north-facing orientations would cause strong glare. When comparing Classroom B to Classroom A, differences in orientation and shading dimensions caused a rapid decrease in Classroom B’s DGP value. Classroom C experienced the least glare due to the shading from its south-facing orientation.

3.1.4. Simulated Lighting Energy Consumption

The lighting energy consumption simulation results of the three classrooms are shown in Figure 11.
The May lighting energy simulation for Classroom A indicated a consumption of 76.71 kWh, for Classroom B it was 85.44 kWh, and for Classroom C was 86.75 kWh. After excluding the noon break period, the energy consumption in the afternoon was lower than that in the morning, mainly due to higher indoor illuminance in the evening compared to the morning. Classroom A was superior to B and C in its conditions of orientation, total window width, and window-wall width, resulting in a shorter duration and lower energy consumption for artificial lighting. Classrooms B and C had similar lighting energy consumption results. As per the distribution of DF values, the main illuminance in Classrooms B and C was concentrated near the windows, while the central area had poorer daylight conditions, requiring additional artificial lighting.

3.2. Classroom Daylighting Performance Measurement

Field tests were conducted to validate the daylighting performance simulation results, including real-time illuminance, luminance, and lighting energy consumption.

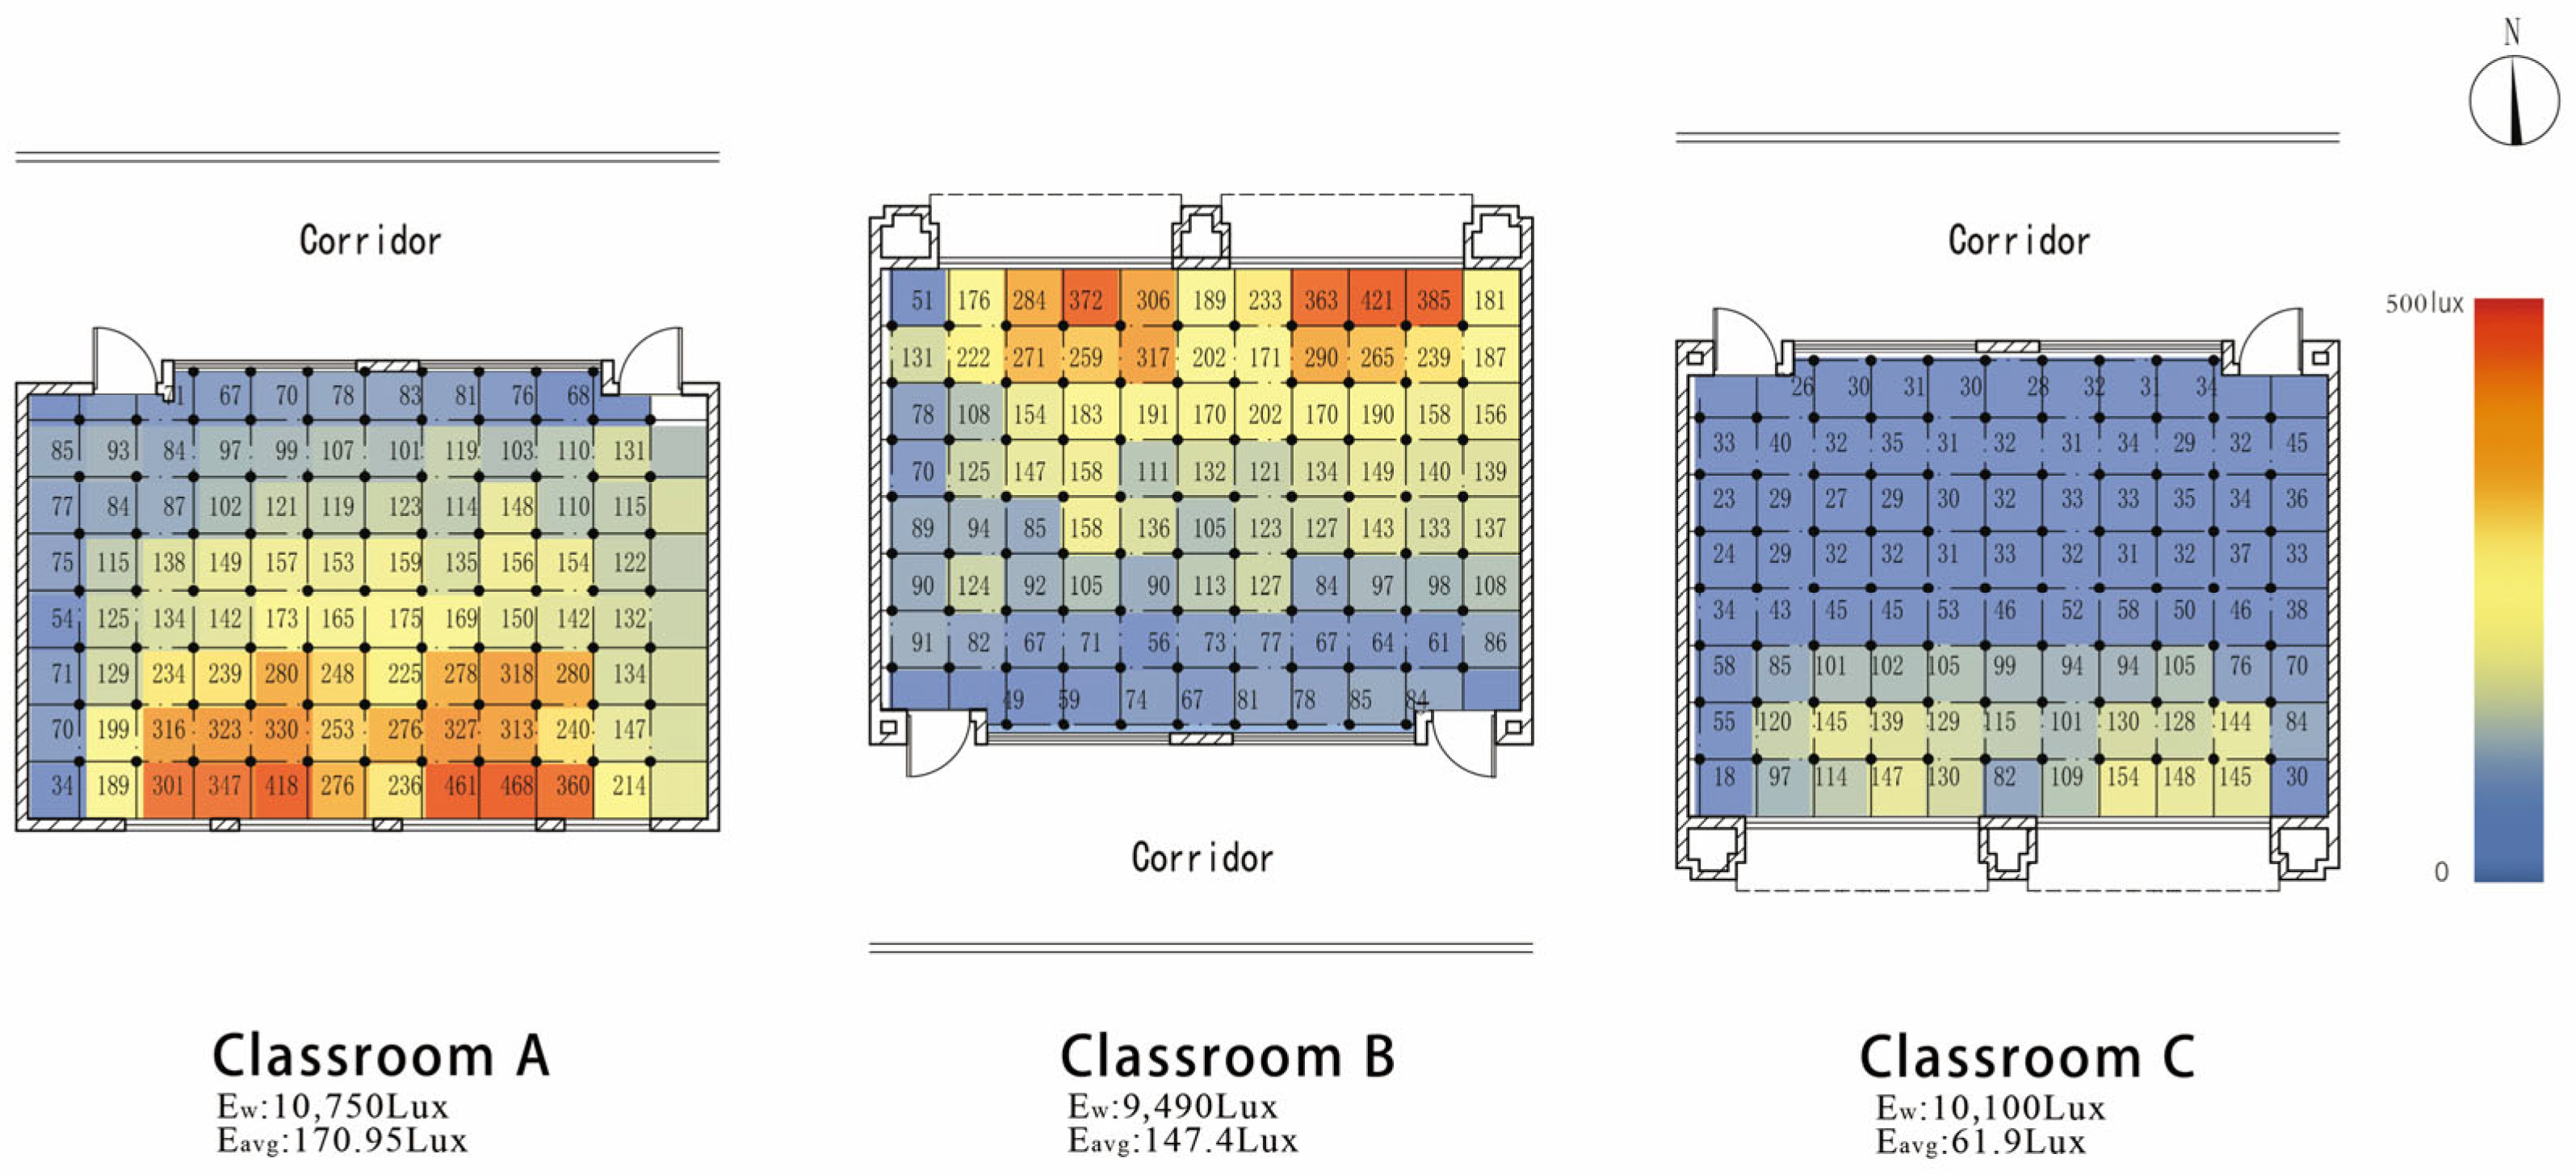
3.2.1. Classroom Illuminance Field Measurement

Real-time illuminance test results from the three classrooms were processed visually to obtain the illuminance distributions shown in Figure 12.
The overall distribution of real-time illuminance from field testing closely mirrors the PIT distribution, characterized by generally low illuminance levels. The highest illuminance within Classroom A was 468 lux, the lowest was 34 lux, the average illuminance was 170.95 lux, the daylight uniformity was 0.20, and the percentage of the DF greater than or equal to 3% was 8%. In Classroom B, the highest illuminance was 421 lux, the lowest was 49 lux, the average illuminance was 147.4 lux, the daylight uniformity was 0.33, and the percentage of the DF greater than or equal to 3% was 9%. In Classroom C, the highest illuminance was 154 lux, the lowest was 17.8 lux, the average illuminance was 61.9 lux, the daylight uniformity was 0.29, and the percentage of the DF greater than or equal to 3% was 0%. Classroom B, which utilizes north-facing daylight, primarily receives diffuse sky light, resulting in relatively uniform daylight coverage. Classroom A, which receives south-facing daylight, has the largest total window width among the three classrooms, and is externally unobstructed, receiving the highest illuminance distribution.
Within the same room, regardless of north or south orientation, windows directly facing open outdoor areas were found to receive more daylight compared to windows facing the corridor. When directly facing open outdoor areas, south-facing daylight (Classroom A) created higher indoor illuminance than north-facing daylight (Classroom B), while north-facing daylight showed better uniformity. Additionally, increasing the window width was beneficial for sidelight daylighting.

3.2.2. Luminance Measurement

Luminance and illuminance tests were conducted on the windows of the three classrooms, with measurements taken perpendicular to the eyes. The testing method is shown in Figure 13. The DGP for each classroom was calculated using Equation (5).
The measurement points were located at 1/4, 1/2, and 3/4 of the classroom depth along the central axis of the exterior window. The DGP values at 1/4, 1/2, and 3/4 perpendicular to the direction of the exterior window of the three classrooms were calculated based on the luminance of the glare source (Ls), the vertical illuminance of the light source (Eυ), the solid angle of the glare source (ω), and the position index (P) at each measurement point. The test results and calculated DGP values are listed in Table 6.
A comparison between the DGP values obtained from the actual measurements of glare source luminance (Ls) and vertical illuminance of the light source (Eυ) against the simulated DGP values indicated smaller measured values, with deviations ranging from 2.7% to 5.9%. Given the influence of the actual measurement environment, this range of error is acceptable. The building orientation, shading, and presence of daylight obstructions outdoors can still be used as parameters to determine whether there is excessive glare caused by daylight. Optimizing these parameters can help to resolve glare-related issues.

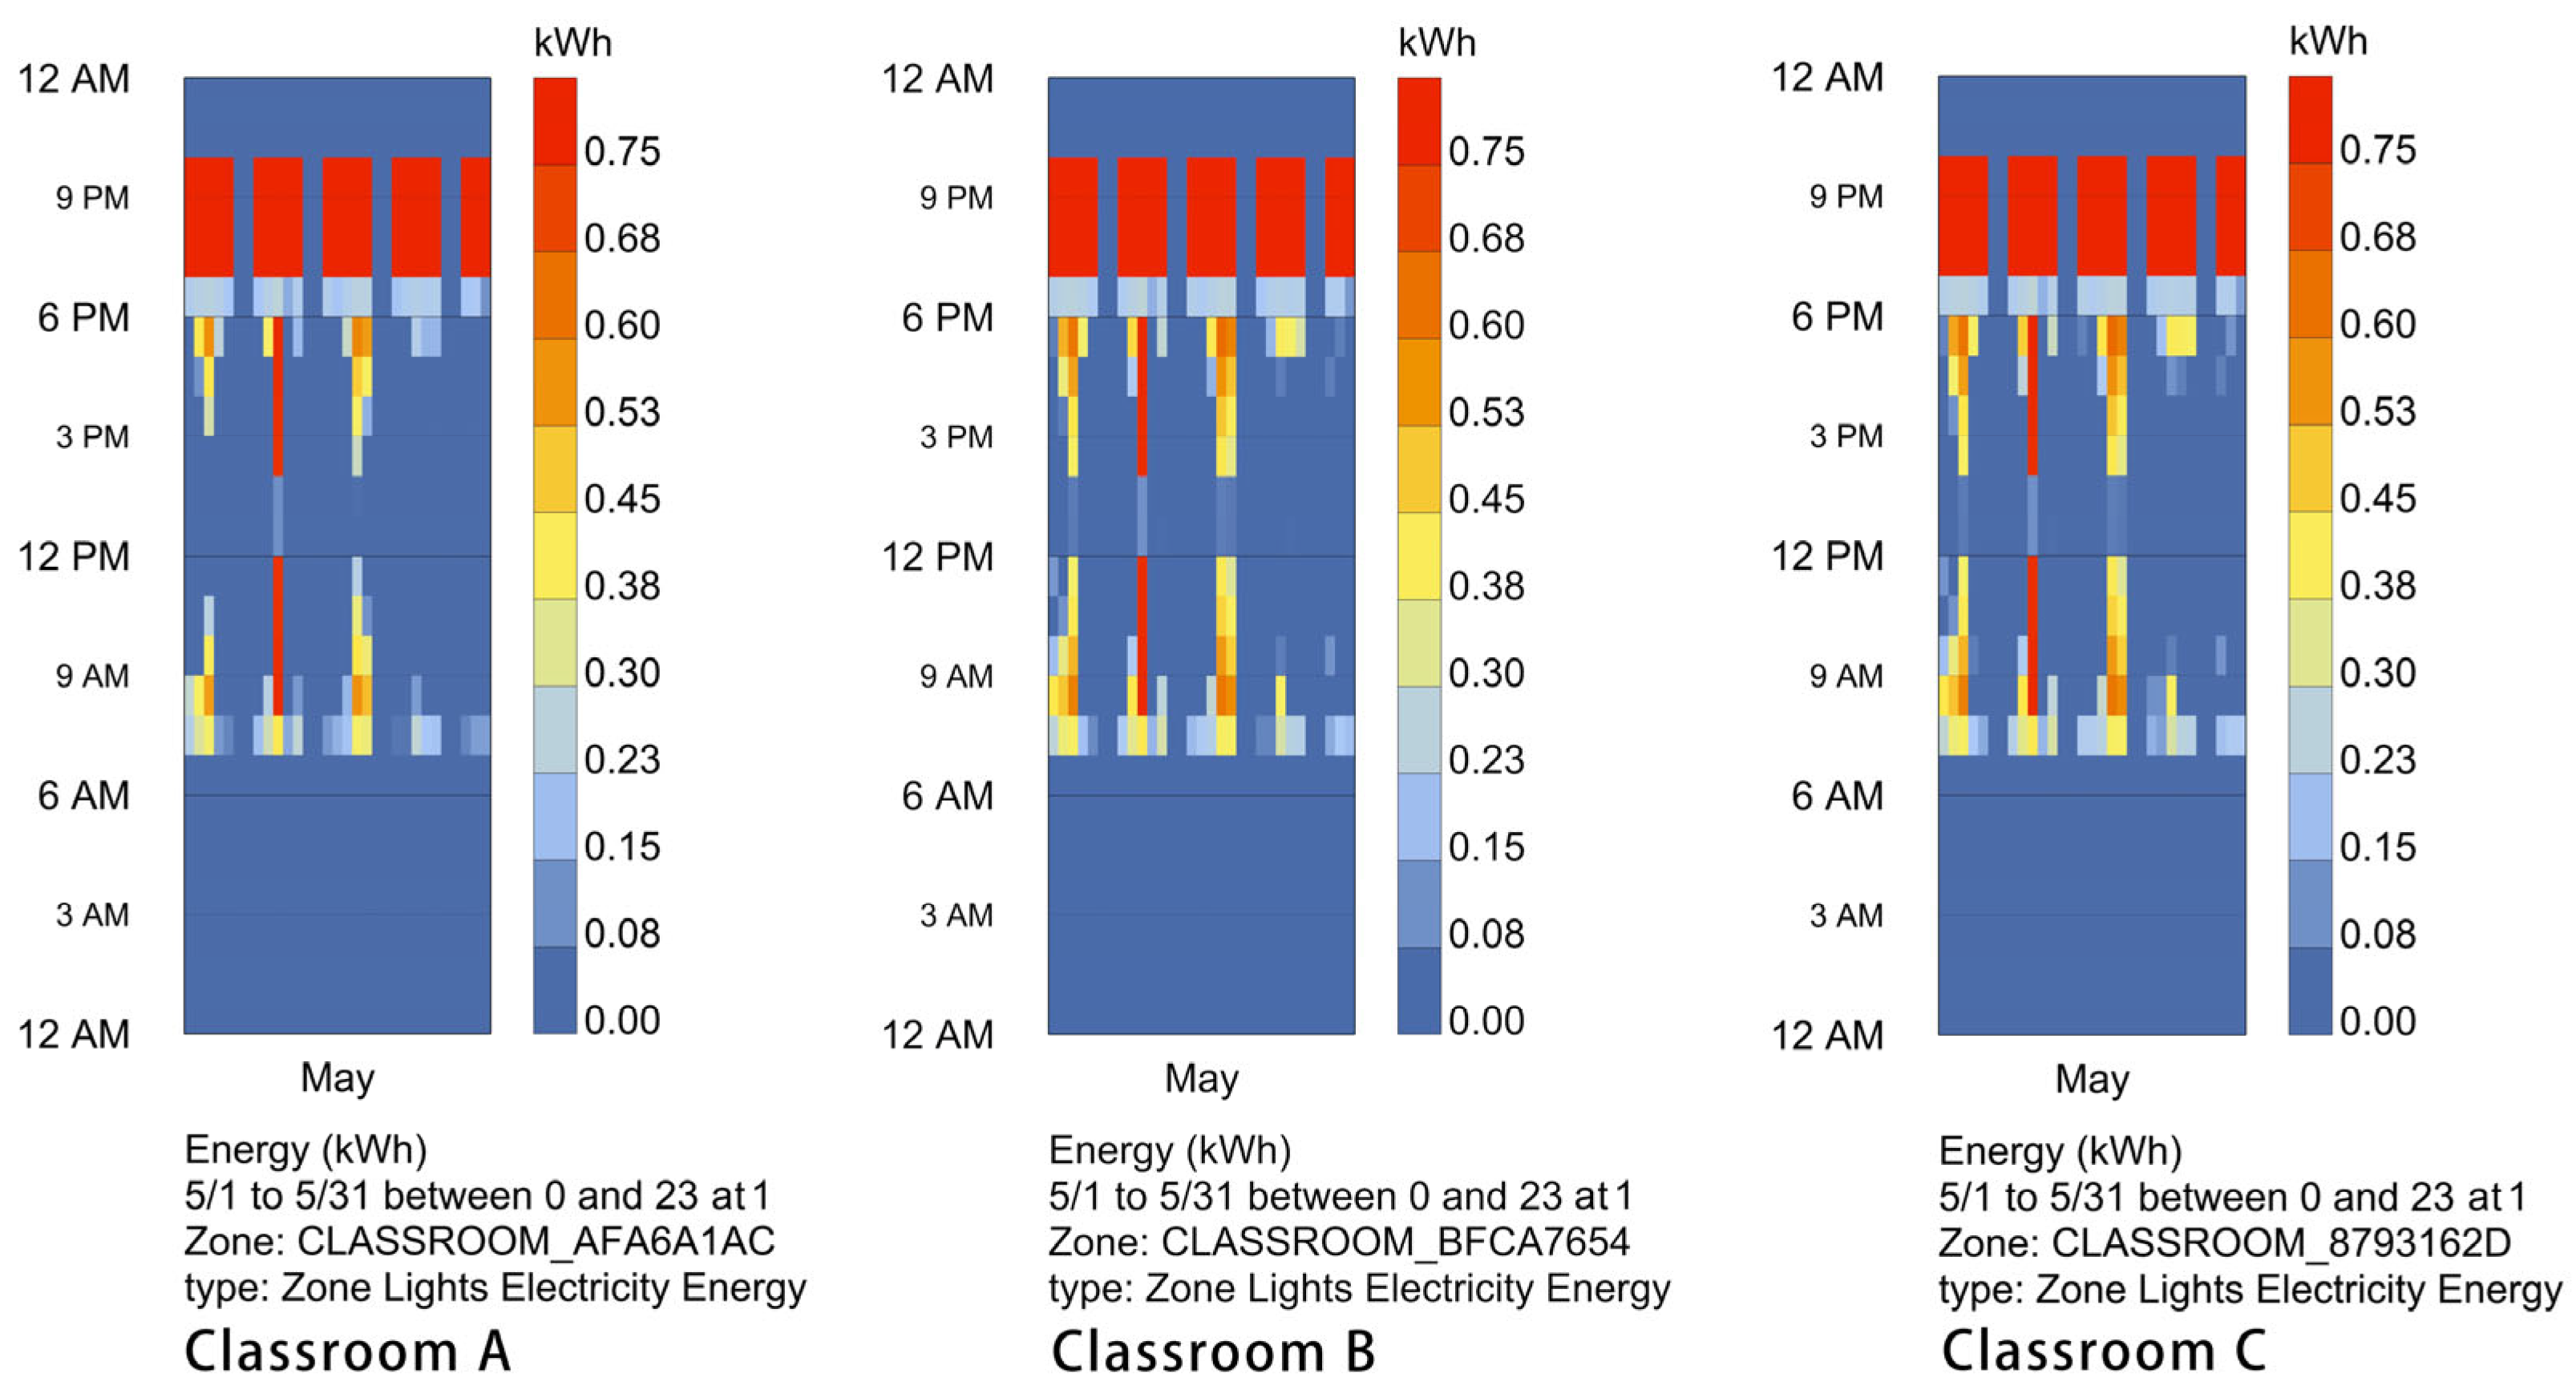
3.2.3. Lighting Energy Consumption Monitoring

Monitoring electricity meters were installed on the lighting circuits of the three classrooms, including the energy consumption of the blackboard lighting and general classroom lighting on the same circuit. The meter readings for May are given in Table 7.
The monitored electricity meter data were significantly higher than the actual measured data, with deviations ranging from 9.45% to 37%. Among them, Classroom C shows the highest deviation. The actual weather conditions in Guangzhou in May included 18 days of rainy or overcast weather, 9 days of cloudy weather, and only 4 days of clear weather. The classrooms needed more artificial lighting on non-clear days. Classroom C, in particular, had poor daylighting in certain areas, necessitating that artificial lighting was switched on during all study hours.

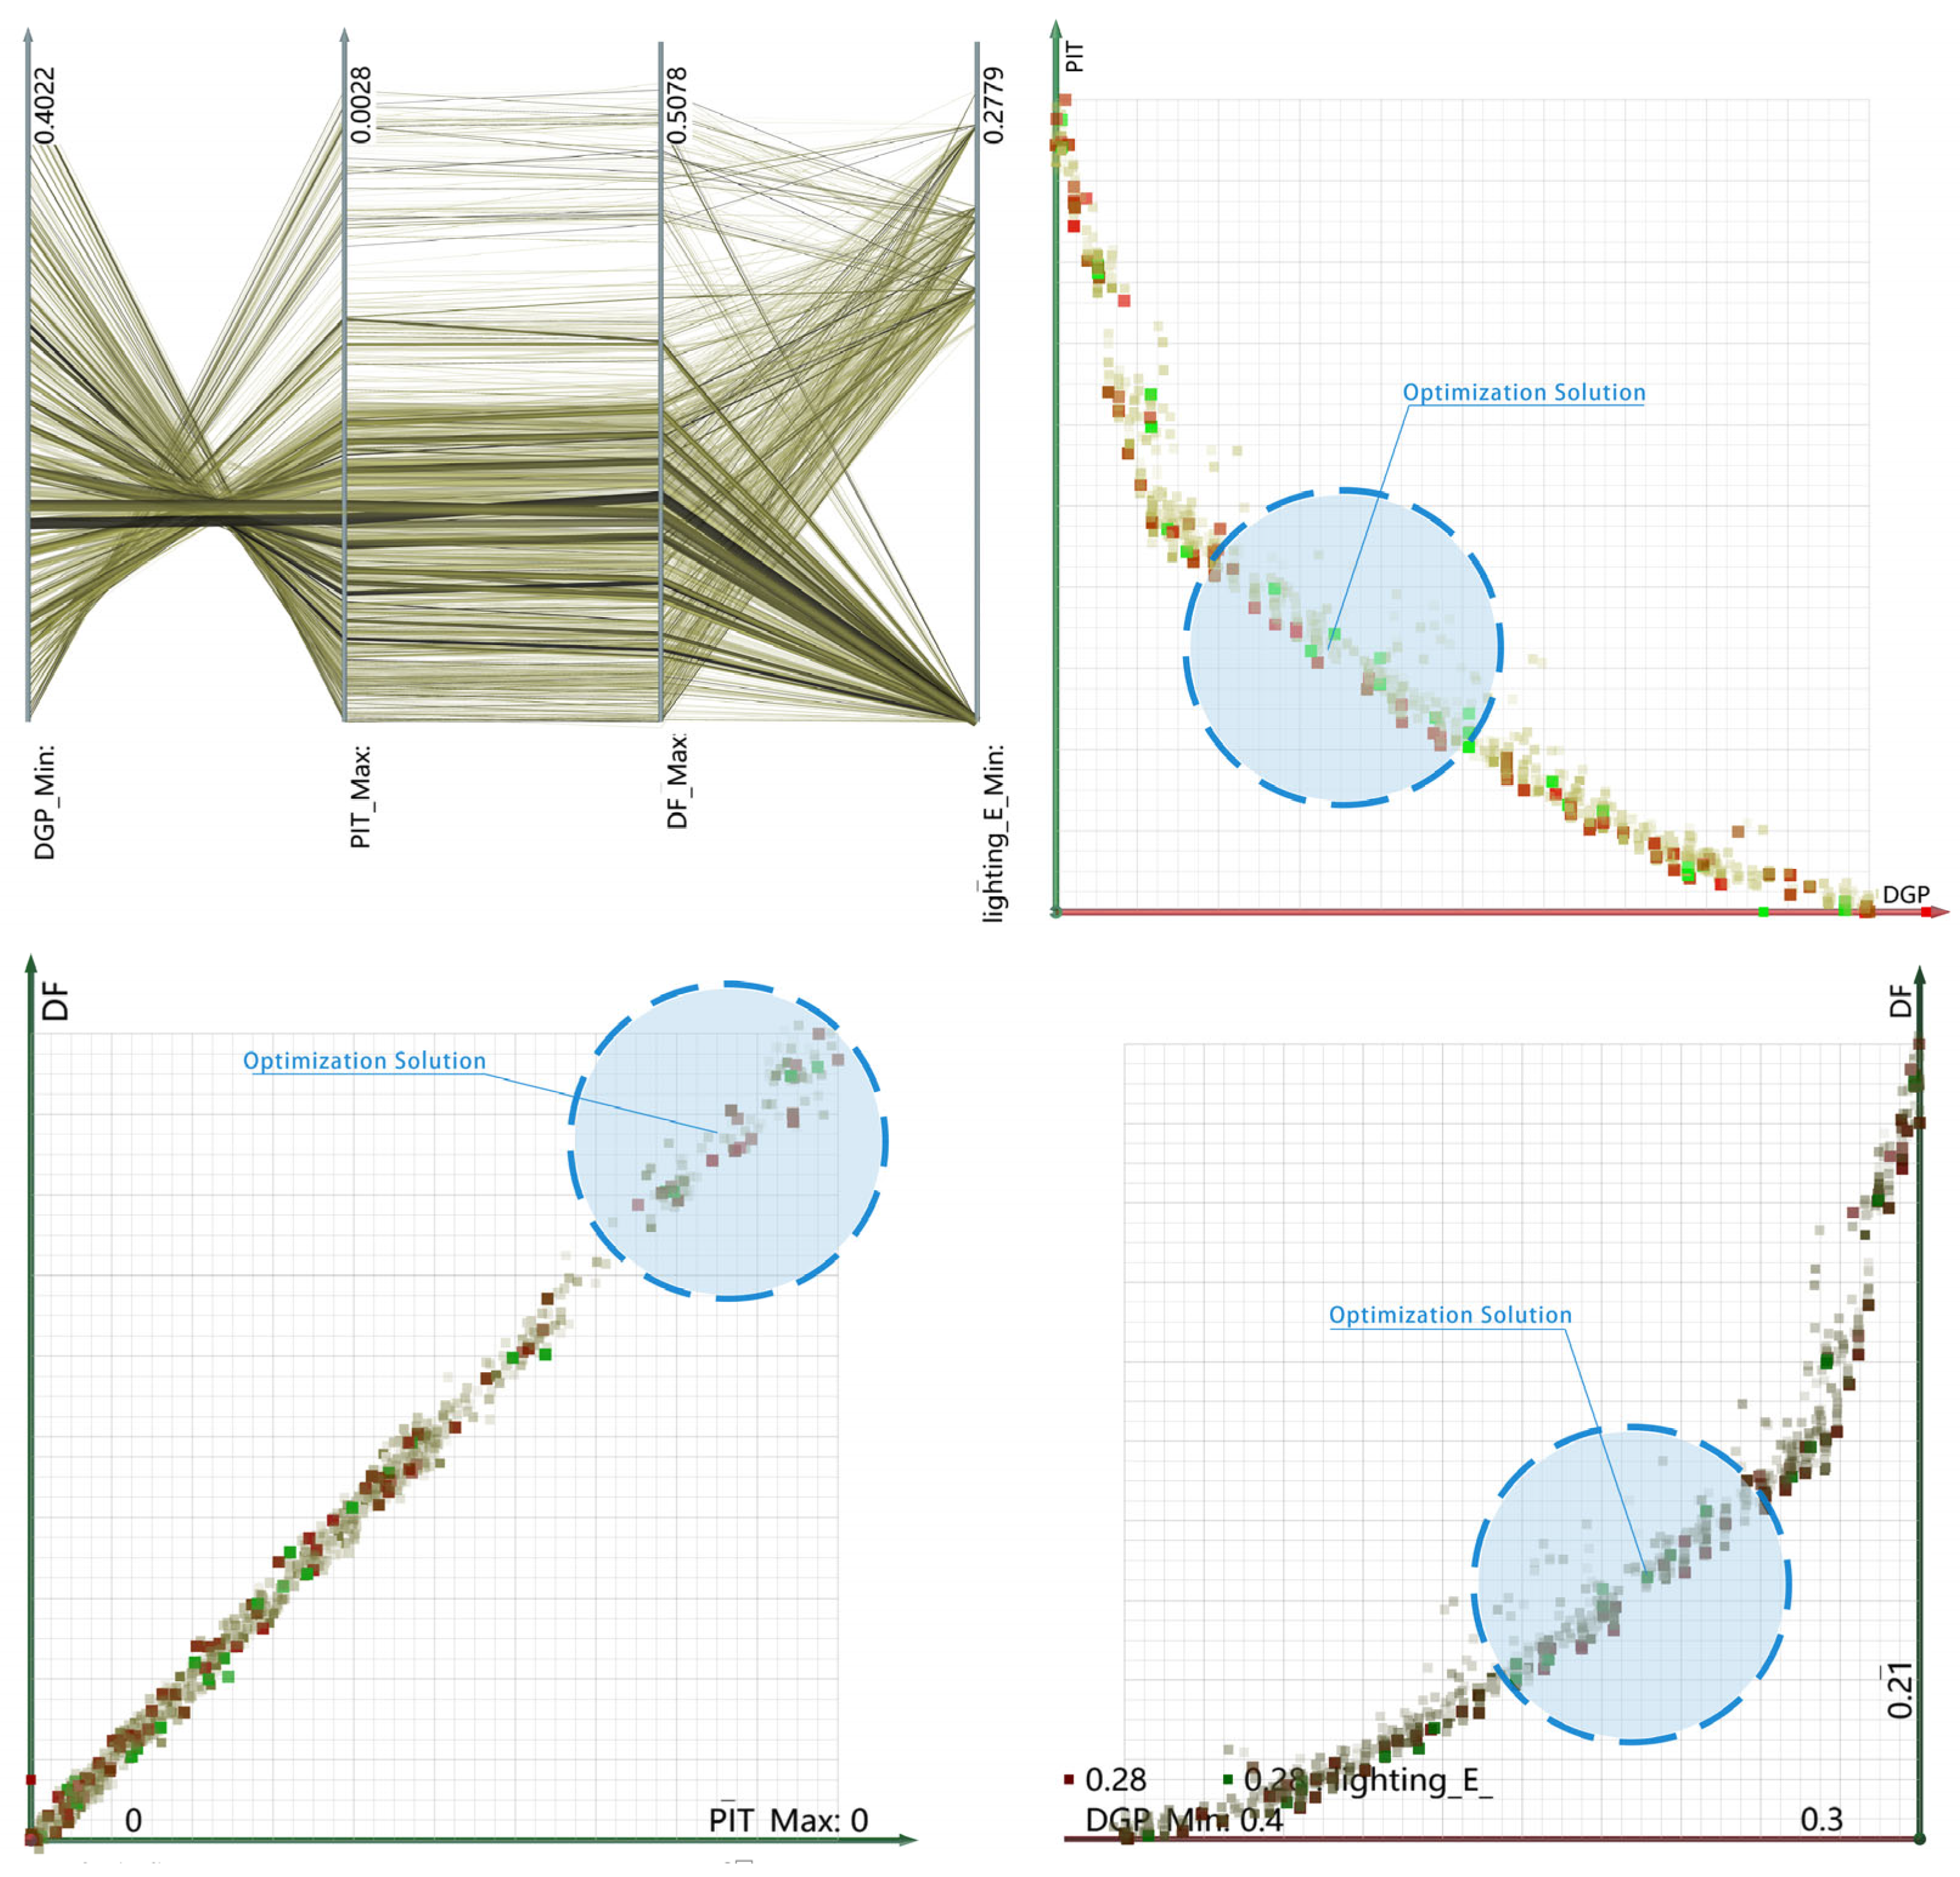
3.3. Multi-Objective Optimization Design

The “genome” of the GA used in this study represents the control parameters. The objective parameters are the daylighting performance indicators. Among them, control parameters provide a range of values based on the design experience, classroom dimensions, structural layout, and regulatory requirements: Classroom orientation ranges from 45° east of south to 45° west of south, total main daylighting surface window width between 7.8 m and 8.8 m, window height between 1.6 m and 2.4 m, shading overhang width between 0 and 2.0 m, and window transmittance coefficient between 0.6 and 0.9. The multi-objective optimization results are shown in Figure 14.
In the late stages of iteration, there was a noticeable expansion in the Pareto-optimal front region and the corresponding genome density. When the iteration stopped, the best genome and the set of objective parameters exhibited similar characteristics, resulting in a high fitness function. A state of equilibrium became evident upon scrutinizing the optimal genome and objective parameters, at which point all four objective parameters were balanced. The range of genome parameters encompass classroom orientation in the south-west direction ranging from 27°30′ to 28°44′, total main daylighting surface window width between 8.5 m and 8.8 m, window height between 2.32 m and 2.4 m, shading overhang width between 1.85 m and 1.94 m, and window transmittance coefficient between 0.87 and 0.9. The ranges of objective parameters were also determined. The optimal solution set was compared with the objective parameters obtained from the performance simulation of the actual model classrooms (Table 8).
Using the optimal solution set allows for the DGP values to effectively be controlled within a range below 0.4. Compared to Classroom A, DGP1/4 decreased by 10.8%, DGP1/2 decreased by 3.1%, and DGP3/4 decreased by 4.1%. Compared to Classroom B, DGP1/4 decreased by 8%, DGP1/2 increased by 0.9%, and DGP3/4 increased by 1.7%. Compared to Classroom C, DGP1/4 increased by 11.4%, DGP1/2 increased by 11.2%, and DGP3/4 increased by 7.1%. DGP tends to increase when there is excessive daylight, and vice versa. Utilizing an optimal solution set ensures that the DGP remains within a reasonable range and exhibits uniform changes. Further, when using the optimal solution set, both the PIT and DF are effectively optimized. Compared to Classroom A, PITavg increased by 41.4% and DFavg increased by 41.3%. Compared to Classroom B, PITavg increased by 59.1% and DFavg increased by 52.2%. Compared to Classroom C, PITavg increased by 96.1% and DFavg increased by 102.5%.
Using the optimal solution set also ensures favorable illuminance and DF values while reducing the energy consumed by artificial lighting. Compared to Classroom A, the lighting energy consumption was reduced by 10.9%. Compared to Classroom B, the lighting energy consumption was reduced by 20%. Compared to Classroom C, the lighting energy consumption was reduced by 21.2%.
In summary, the parameters of the optimal solution set represent an effective design strategy that considers multiple indicators of daylight performance.

4. Discussion

4.1. Evaluating Design Parameters by Measured vs. Simulated Daylighting Performance Index

With a primary focus on enhancing the daylighting performance of secondary school classrooms, a method was developed in this study to evaluate design parameters through daylighting performance indicators derived from field measurements and physical simulations. The proposed method solves the problem whereby important parameters cannot be correctly selected to predict daylighting performance in the early phases of design. It also provides architects with recommended design parameters and parameter value ranges in the design scheme phase. Compared to Classroom A, which has inherently favorable lighting conditions, the daylighting performance obtained by using the recommended parameters was found to effectively reduce the indoor DGP. Simultaneously, PITavg increased by 41.4%, DFavg increased by 41.3%, and lighting energy consumption decreased by 10.9%. The value ranges of these parameters are correlated with regional climate and building types, rendering the proposed method applicable to other similar cases.

4.2. Accuracy of Physical Simulations and Field Measurements

To improve prediction accuracy, this study adopted a combination of physical simulations and field measurements. First, the reflection and transmittance coefficients based on field measurements were input to the simulation program. It is worth noting that these coefficients can vary for the same material under different conditions. To assess the impact of these coefficients, a sensitivity analysis was conducted on control parameters while adjusting their values at appropriate stages, as illustrated in Figure 15.
Following optimization, among the four control parameters, the window’s transmittance coefficient exhibited the most significant effect on the target parameters. Increasing the window’s transmittance coefficient strengthened the trends in DF, PIT, and DGP. Conversely, changes in building orientation, shading size, and window width did not show consistent patterns or significant trends in daylighting performance indicators.
A variation of 0.1 in the window’s reflectance coefficient exerted a substantial impact on the simulation results. Therefore, meticulous measurement of the window’s transmittance coefficient is crucial. To account for this, multiple measurement points were taken for the same material and averaged when measuring material reflectance or transmittance coefficients, minimizing the impact on simulation accuracy.
Secondly, to ensure consistency with the field measurements, the dynamic indicator PIT was chosen over UDI, as UDI primarily focuses on assessing the average illuminance level in a room and is not suitable for direct comparison with measured illuminance levels. Guangzhou is a city with indistinct seasons, characterized by predominantly hot and humid weather throughout the year. Winter is mild and brief. Seasons can be categorized using climatic statistics to define spring (March, April, May), summer (June, July, August), autumn (September, October, November), and winter (December, January, February) [46].
Spring and autumn, transitional seasons in Guangzhou, are the times of year that secondary school students predominantly spend at school. The month of May was selected as the timing for both measurements and simulations, as it is highly representative of the typical weather conditions in Guangzhou during the school year. The physical environment of transitional season buildings significantly affects comfort and learning efficiency [47,48], making research on transitional seasons critically important. If measurements and simulations are conducted during winter and summer, adjustments to the size of shading devices are needed to increase or decrease indoor daylighting levels. Therefore, it is recommended to use adjustable shading systems to meet the lighting requirements during different seasons.
Field measurements were conducted concurrently in three classrooms and involved a single test session, which may have impacted the accuracy of illuminance measurements. However, from the perspective of overall performance evaluation and design parameters, this did not significantly impact the study’s conclusions. Future research endeavors will involve multiple tests conducted at different time periods to expand the sample size and more comprehensively evaluate daylighting performance.
Additionally, the field measurements were conducted in an existing teaching building, and the recommended parameters were designed under conditions similar to those of the measured samples. Considering that the dimensions of current secondary school classrooms are already well-established and stable, the recommended parameters can be effectively applied to classrooms of this type. The simulation model used in this study is comprehensive and well-established. Parametric design offers a significant advantage by allowing adaptation to diverse regions through fine-tuning geographical climate conditions, meteorological data, and control parameter ranges. However, it is not suitable for buildings other than educational buildings.

4.3. Advantages and Disadvantages of Genetic Algorithms

The GA proved to be an efficient optimization method in this study. Control parameters were treated as genes, then randomly selected and combined to quickly calculate the optimal solution set. This approach was particularly effective for optimizing the objective parameter DGP, which has specific range requirements. The GA was implemented through the Design Explorer platform to restrict parameter values within predefined ranges, facilitating the rapid identifications of optimal solutions. However, it is important to note that the quality of the solution set was influenced by the choices made regarding the elitism rate, mutation rate, and crossover rate when configuring the GA. The algorithm also demonstrated a degree of sensitivity to the initial population selection, necessitating skillful guidance in establishing the initial population parameters.

4.4. Data-Driven Performance Prediction

Data-driven approaches have significant potential for predicting building performance. In this study, the GA provided gene sets and solution sets that can serve as valuable inputs for data-driven applications. These datasets could be harnessed in machine learning processes to accurately predict daylighting performance in buildings, offering promising avenues for future research. The design parameters derived in this study also may provide a workable foundation for exploring new design approaches and expanding the scope of research in this field.

5. Conclusions

An effective method for evaluating design parameters related to daylighting performance was established in this study based on measurements and simulations. This method can be used to identify precise ranges for multiple design parameters, enabling the rapid attainment of optimized daylighting performance. Focused on secondary school classrooms in the Guangzhou region, building daylighting performance was evaluated based on DGP, PIT, DF, and lighting energy consumption. The conclusions of this work can be summarized as follows.
(1)
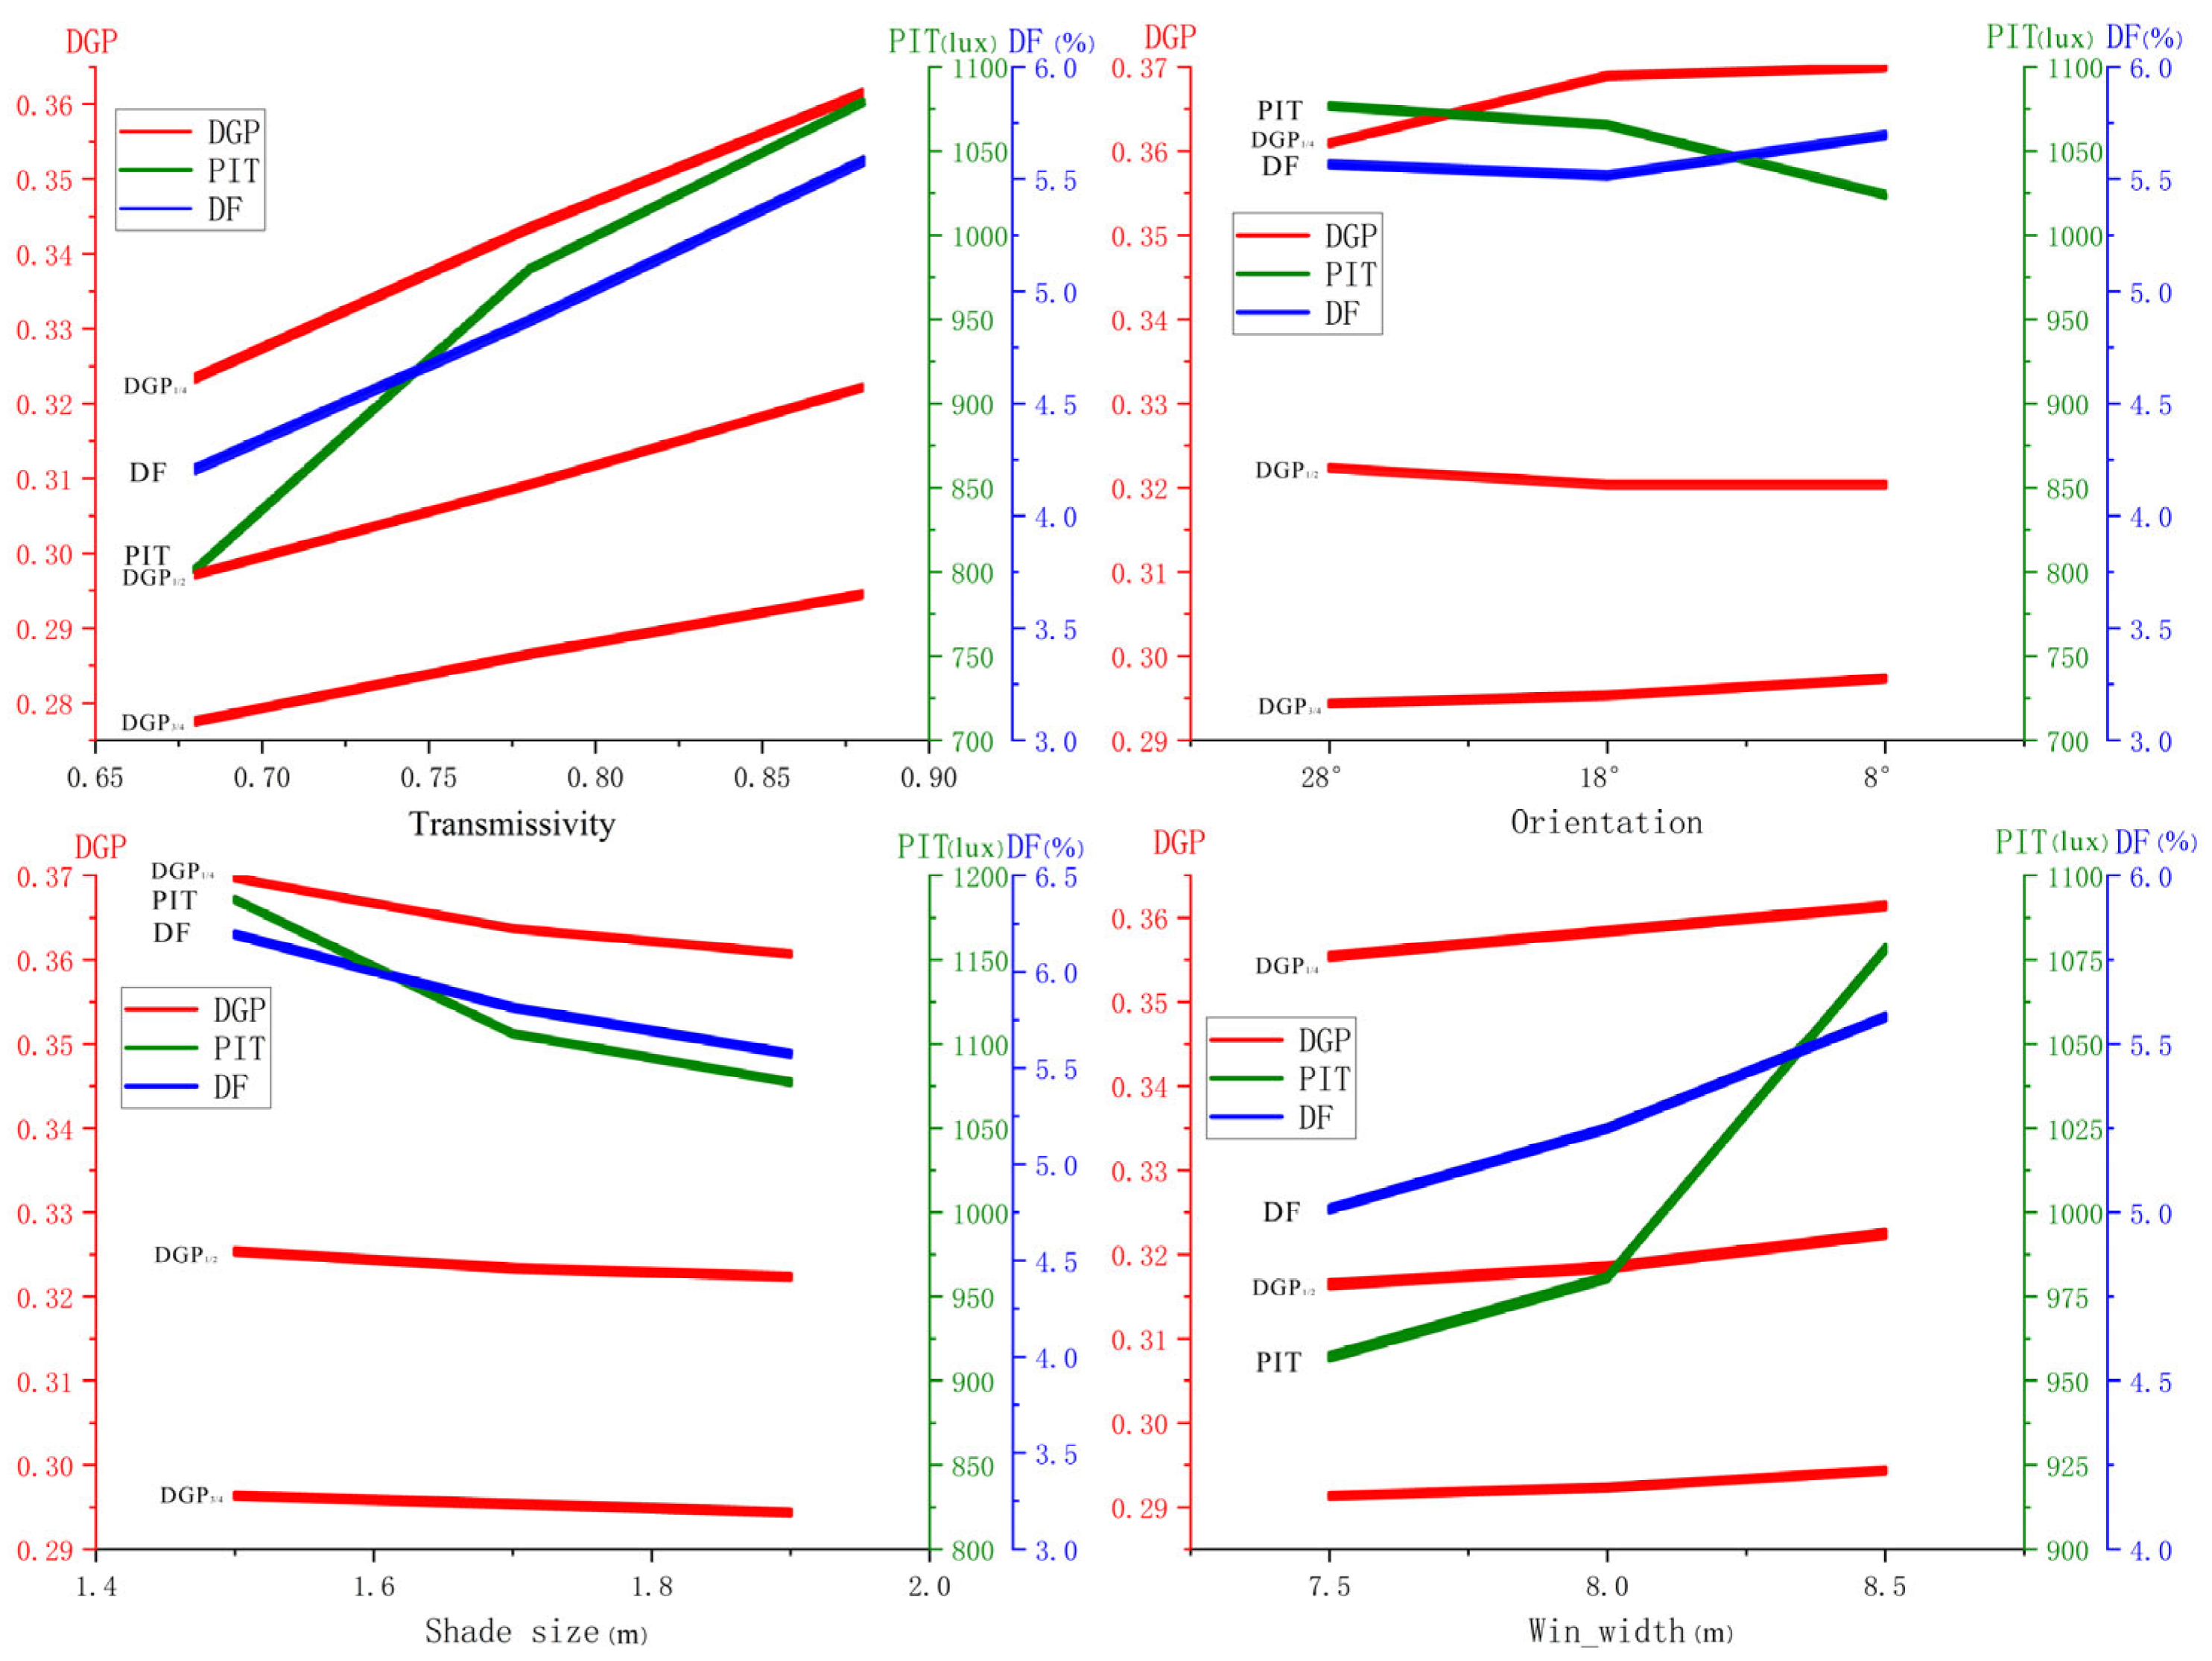
Small variations in the window transmittance coefficient exerted a significant impact on the simulation results. A reduction of 0.1 in the transmittance coefficient resulted in a 10.1% decrease in the average PIT and a 14.6% decrease in the average DF. A further reduction of 0.2 in the coefficient led to a 40.4% decrease in the average PIT and a 32.6% decrease in the average DF.
(2)
In accordance with established architectural design standards, four design parameter ranges that impact classroom daylighting performance were delineated: orientation within 27°30′ to 28°44′ south of west, total window width of 8.5 m to 8.8 m on the main daylighting facade, window height of 2.32 m to 2.4 m, sunshade overhang width of 1.85 m to 1.94 m, and window transmittance coefficient of 0.87 to 0.9.
(3)
Compared to Classroom A, which exhibited better daylighting conditions than other classrooms included in the case study, the daylighting performance obtained by using the recommended parameters can effectively reduce the indoor DGP, increase the average PIT by 41.4%, increase the average DF by 41.3%, and decrease the energy consumed by artificial lighting by up to 10.9%.
In summary, the results of this study may provide architects with a method to predict daylighting performance and optimal parameter ranges during the early design phase. This holds practical significance for the swift prediction and assessment of building daylighting performance.

Author Contributions

Conceptualization, J.L. and L.Z.; Methodology, X.Z.; Software, G.Y.; Validation, G.Y.; Formal analysis, G.Y.; Investigation, G.Y. and X.S.; Writing—original draft, J.L. and G.Y.; Writing—review & editing, G.Y., X.Z. and X.S.; Supervision, J.L. and L.Z.; Project administration, L.Z.; Funding acquisition, J.L. All authors have read and agreed to the published version of the manuscript.

Funding

This research was funded by [National Natural Science Foundation of China] grant number [52278107]; and [Guangdong Department of Housing and Urban-Rural Development 2022 Science and Technology Innovation Plan] grant number [2022-K2-450970]; and [Natural Science Foundation of Guangdong Province] The title of the project: [Multi-objective optimization design strategy for the daylighting and thermal performance of secondary school teaching buildings in Guangdong Province]. The APC was funded by [Natural Science Foundation of Guangdong Province].

Data Availability Statement

The data presented in this study are available on request from the corresponding author (privacy reasons).

Conflicts of Interest

The authors declare no conflict of interest.

Nomenclature

DGPDaylight glare probability
PITPoint-in-time illuminance
DFDaylight factor
GAsGenetic algorithms
WWRWindow-to-wall ratio
DADaylight autonomy
sDASpatial daylight autonomy
UDIUseful daylight illuminance
CBDMClimate-based daylight modeling
IESNAIlluminating Engineering Society of North America
EIlluminance
EavgAverage illuminance
EnIndoor illuminance
EwOutdoor illuminance
ρReflectance coefficient
EρReflected illuminance
τTransmittance coefficient
EτTransmitted illuminance
EυVertical illuminance
LruanjLuminance
ωSolid angle
PPosition index

Appendix A

Classification of DGP ranges on human visual perception.
DGP ClassificationDGP Range
Imperceptible Glare0.35 > DGP
Perceptible Glare0.4 > DGP ≥ 0.35
Disturbing Glare0.45 > DGP ≥ 0.4
Intolerable GlareDGP ≥ 0.45

References

  1. Mendell, M.J.; Heath, G.A. Do indoor pollutants and thermal conditions in schools influence student performance? A critical review of the literature. Indoor Air 2005, 15, 27–52. [Google Scholar] [CrossRef] [PubMed]
  2. Shen, J.Y.; Kojima, S.; Ying, X.Y.; Hu, X.J. Influence of Thermal Experience on Thermal Comfort in Naturally Conditioned University Classrooms. Lowl. Technol. Int. 2019, 21, 107–122. [Google Scholar]
  3. Ramírez-Dolores, C.; Lugo-Ramírez, L.A.; Hernández-Cortaza, B.A.; Alcalá, G.; Lara-Valdés, J.; Andaverde, J. Dataset on thermal comfort, perceived stress, and anxiety in university students under confinement due to COVID-19 in a hot and humid region of Mexico. Data Brief 2022, 41, 107996. [Google Scholar] [CrossRef] [PubMed]
  4. Lovec, V.; Premrov, M.; Leskovar, V.Ž. Practical impact of the COVID-19 pandemic on indoor air quality and thermal comfort in kindergartens. A case study of Slovenia. Int. J. Environ. Res. Public Health 2021, 18, 9712. [Google Scholar] [CrossRef] [PubMed]
  5. Luo, W.; Kramer, R.; Kompier, M.; Smolders, K.; de Kort, Y.; Lichtenbelt, W.V.M. Effects of correlated color temperature of light on thermal comfort, thermos physiology and cognitive performance. Build. Environ. 2023, 231, 109944. [Google Scholar] [CrossRef]
  6. Castilla, N.; Higuera-Trujillo, J.L.; Llinares, C. The effects of illuminance on students′ memory. A neuroarchitecture study. Build. Environ. 2023, 228, 109833. [Google Scholar] [CrossRef]
  7. Al Junaibi, A.A.; Al Zaabi, E.J.; Nassif, R.; Mushtaha, E. Daylighting in Educational Buildings: Its Effects on Students and How to Maximize Its Performance in the Architectural Engineering Department of the University of Sharjah. In Proceedings of the 3rd International Sustainable Buildings Symposium (ISBS 2017), Dubai, United Arab Emirates, 15–17 March 2017; Springer International Publishing: Cham, Switzerland, 2018; Volume 1, pp. 141–159. [Google Scholar]
  8. Choi, S.; Guerin, D.; Kim, H.-Y.; Brigham, J.K.; Bauer, T. Indoor Environmental Quality of Classrooms and Student Outcomes: A Path Analysis Approach. J. Learn. Spaces 2014, 2, 14. [Google Scholar]
  9. Dahlan, A.S.; Eissa, M.A. The Impact of Day Lighting in Classrooms on Students’ Performance. Int. J. Soft Comput. Eng. 2015, 6, 2231–2307. [Google Scholar]
  10. Fielding, R. Learning, Lighting and Color: Lighting Design for Schools and Universities in the 21st Century; DesignShare (NJ1): Minneapolis, MN, USA, 2006. [Google Scholar]
  11. Huaxia Ophthalmology. White Paper on National Prevention and Control of Myopia Among Children and Adolescents; Huaxia Ophthalmology: Xiamen, China, 2021. [Google Scholar]
  12. Guo, Y.; Liu, L.J.; Xu, L.; Tang, P.; Lv, Y.Y.; Feng, Y.; Meng, M.; Jonas, J.B. Myopic shift and outdoor activity among primary school children: One-year follow-up study in Beijing. PLoS ONE 2013, 8, e75260. [Google Scholar] [CrossRef]
  13. Zhao, T.; Zhang, C.; Xu, J.; Wu, Y.; Ma, L. Data-driven correlation model between human behavior and energy consumption for college teaching buildings in cold regions of China. J. Build. Eng. 2021, 38, 102093. [Google Scholar] [CrossRef]
  14. Wu, Y.; Li, Y.; Gao, S.; Liu, S.; Yin, H.; Zhai, Y. Carbon dioxide generation rates for children and adolescents. Build. Environ. 2023, 237, 110310. [Google Scholar] [CrossRef]
  15. Ministry of Education of the People’s Republic of China. Statistical Bulletin on Education Development in 2021; Ministry of Education of the People’s Republic of China: Beijing, China, 2022. [Google Scholar]
  16. Tsinghua University Building Energy Research Center. China Building Energy Annual Development Research Report 2022: Public Building Special Topic; China Architecture & Building Press: Beijing, China, 2022; p. 160. ISBN 9787112271948. [Google Scholar]
  17. Rose, K.A. Time spent outdoors can prevent the development of myopia. Acta Ophthalmol. 2008, 86. [Google Scholar] [CrossRef]
  18. He, M.; Xiang, F.; Zeng, Y.; Mai, J.; Chen, Q.; Zhang, J.; Smith, W.; Rose, K.; Morgan, I.G. Effect of Time Spent Outdoors at School on the Development of Myopia among Children in China: A Randomized Clinical Trial. J. Am. Med. Assoc. 2015, 314, 1142–1148. [Google Scholar] [CrossRef]
  19. GB 7793-2010; Hygienic Standard for Day Lighting and Artificial Lighting for Middle and Elementary School. China Standards Press: Beijing, China, 2010; p. 2, ISBN 155066141915.
  20. Rashwan, A.; El Gizawi, L.; Sheta, S. Evaluation of the effect of integrating building envelopes with parametric patterns on daylighting performance in office spaces in hot-dry climate. Alex. Eng. J. 2019, 58, 551–557. [Google Scholar] [CrossRef]
  21. Liu, Q.; Han, X.; Yan, Y.; Ren, J. A Parametric Design Method for the Lighting Environment of a Library Building Based on Building Performance Evaluation. Energies 2023, 16, 832. [Google Scholar] [CrossRef]
  22. Eisazadeh, N.; Allacker, K.; De Troyer, F. Integrated energy, daylighting and visual comfort analysis of window systems in patient rooms. Sci. Technol. Built Environ. 2021, 27, 1040–1055. [Google Scholar] [CrossRef]
  23. Norouziasl, S.; Jafari, A. Exploring Human-Building Energy-Related Actions Modeling and Simulation. Constr. Res. Congr. 2022, 2022, 1316–1326. [Google Scholar]
  24. Kapp, S.; Choi, J.K.; Hong, T. Predicting industrial building energy consumption with statistical and machine-learning models informed by physical system parameters. Renew. Sustain. Energy Rev. 2023, 172, 113045. [Google Scholar] [CrossRef]
  25. Lei, L.; Chen, W.; Wu, B.; Chen, C.; Liu, W. A building energy consumption prediction model based on rough set theory and deep learning algorithms. Energy Build. 2021, 240, 110886. [Google Scholar] [CrossRef]
  26. Krarti, M.; Erickson, P.M.; Hillman, T.C. A simplified method to estimate energy savings of artificial lighting use from daylighting. Build. Environ. 2005, 40, 747–754. [Google Scholar] [CrossRef]
  27. Lin, B.; Li, Z. Energy-saving optimization method for building design at the early stage. Chin. Sci. Bull. 2016, 61, 113–121. [Google Scholar] [CrossRef]
  28. Reinhart, C.F.; Mardaljevic, J.; Rogers, Z. Dynamic daylight performance metrics for sustainable building design. Leukos 2006, 3, 7–31. [Google Scholar] [CrossRef]
  29. Brembilla, E.; Mardaljevic, J. Climate-Based Daylight Modelling for compliance verification: Benchmarking multiple state-of-the-art methods. Build. Environ. 2019, 158, 151–164. [Google Scholar] [CrossRef]
  30. Besbas, S.; Nocera, F.; Zemmouri, N.; Khadraoui, M.A.; Besbas, A. Parametric-Based Multi-Objective Optimization Workflow: Daylight and Energy Performance Study of Hospital Building in Algeria. Sustainability 2022, 14, 12652. [Google Scholar] [CrossRef]
  31. Amasyali, K.; El-Gohary, N. Building lighting energy consumption prediction for supporting energy data analytics. Procedia Eng. 2016, 145, 511–517. [Google Scholar] [CrossRef]
  32. Li, X.; Wen, J. Review of building energy modeling for control and operation. Renew. Sustain. Energy Rev. 2014, 37, 517–537. [Google Scholar] [CrossRef]
  33. Norouziasl, S.; Jafari, A. Identifying the most influential parameters in predicting lighting energy consumption in office buildings using data-driven method. J. Build. Eng. 2023, 72, 106590. [Google Scholar] [CrossRef]
  34. Yun, G.; Kim, K.S. An empirical validation of lighting energy consumption using the integrated simulation method. Energy Build. 2013, 57, 144–154. [Google Scholar] [CrossRef]
  35. Amasyali, K.; El-Gohary, N.M. A review of data-driven building energy consumption prediction studies. Renew. Sustain. Energy Rev. 2018, 81, 1192–1205. [Google Scholar] [CrossRef]
  36. Fan, C.; Xiao, F.; Wang, S. Development of prediction models for next-day building energy consumption and peak power demand using data mining techniques. Appl. Energy 2014, 127, 1–10. [Google Scholar] [CrossRef]
  37. FEMP. M&V Guidelines: Measurement and Verification for Federal Energy Projects Version 3.0; Energy Efficiency and Renewable Energy: Washington, DC, USA, 2008. [Google Scholar]
  38. GB50033-2013; Standard for Daylighting Design of Buildings. Ministry of Housing and Urban-Rural Development of the People’s Republic of China. China Architecture & Building Press: Beijing, China, 2013; p. 8, ISBN 1511223678.
  39. China Meteorological Data Network. Monthly Standard Values of Ground Climate in China (1981–2010); China Meteorological Administration Meteorological Data Center: Beijing, China, 2011. [Google Scholar]
  40. GB55016-2021; General Code for the Built Environment. China Architecture & Building Press: Beijing, China, 2021; pp. 6–7, ISBN 1151238205.
  41. Raynham, P. Book review: The lighting handbook 10th edition, reference and application. Light. Res. Technol. 2012, 44, 514–515. [Google Scholar] [CrossRef]
  42. Brembilla, E.; Drosou, N.; Mardaljevic, J. Real World Complexity in Reflectance Value Measurement for Climate-Based Daylight Modelling. In Proceedings of the Building Simulation and Optimization Conference (BSO16), Newcastle upon Tyne, UK, 12–14 September 2016; Newcastle University: Newcastle upon Tyne, UK, 2016; pp. 266–273. Available online: https://www.semanticscholar.org/paper/Real-world-complexity-in-reflectance-value-for-Brembilla-Drosou/62804d8960a5412b1c71a17bb29ab16a782de31e (accessed on 12 January 2024).
  43. GB/T 5699-2017; Method of Daylighting Measurements. China Standards Press: Beijing, China, 2017; p. 7, ISBN 9787560574936.
  44. Wienold, J.; Christoffersen, J. Towards a New Daylight Glare Rating; Lux Europa: Berlin, Germany, 2005; pp. 157–161. [Google Scholar]
  45. McNeil, A.; Burrell, G. Applicability of DGP and DGI for evaluating glare in a brightly daylit space. In Proceedings of the ASHRAE and IBPSA-USA SimBuild 2016, Building Performance Modeling Conference, Salt Lake City, UT, USA, 8–12 August 2016. [Google Scholar]
  46. Feng, X. A Study on Year-Round Outdoor Thermal Comfort in Guangzhou Area. Master’s Thesis, Guangzhou University, Guangzhou, China, 2018. [Google Scholar]
  47. Yang, L.; Liu, J.; Ren, J.; Zhu, X.; An, F. A Study on Outdoor Thermal Comfort in Campus during Transitional Seasons Under Special Weather Conditions. J. Shandong Jianzhu Univ. 2021, 36, 75–82+96. [Google Scholar] [CrossRef]
  48. Jing, J.; Haoqing, N.; Ziyi, Y. The Influence of Indoor Environment on Learning Efficiency in Universities during Transitional Seasons. J. Xi’an Univ. Eng. 2023, 1–7. Available online: http://kns.cnki.net/kcms/detail/61.1471.N.20231204.2206.006.html (accessed on 12 January 2024).
Figure 1. China daylight climate zones and location of study area. The first image depicts the location of the research cases in China and China’s daylight climate zones. Different colors represent different daylight climate zones, with the research cases located in Zone IV. The two image illustrates the location of the research building within the campus and its surrounding environment, with yellow blocks representing the research building. The final image shows the facade conditions of the research building.
Buildings 14 00637 g001
Figure 2. Functional zoning of junior high school section, Guangya Middle School; locations of three classrooms under analysis. Image (a) illustrates the two sections of the school (classrooms, laboratory). Image (b) indicates the three representative classrooms chosen for analysis.
Buildings 14 00637 g002
Figure 3. Geometric dimensions of three classrooms.
Buildings 14 00637 g003
Figure 4. Overview of research methodology.
Buildings 14 00637 g004
Figure 5. Instruments used in this study. Image (a) displays a TES1330A illuminance meter, (b) shows a Konica Minolta LS-110 luminance meter, and (c) shows a Pilot SPM91 electric energy meter.
Buildings 14 00637 g005
Figure 6. Illuminance measurement point arrangements. The measuring points are spaced at a horizontal distance of 1 m, with a total of 85 measuring points in each of the three classrooms.
Buildings 14 00637 g006
Figure 7. Classroom lighting arrangement. The three classroom lighting systems are all arranged in the same manner, with three strip lights evenly spaced in the classroom and blackboard lights in parallel at the front.
Buildings 14 00637 g007
Figure 8. DF simulation results. Different colors represent different DF values, with darker colors indicating lower illuminance levels and brighter colors indicating higher illuminance levels.
Buildings 14 00637 g008
Figure 9. PIT simulation results.
Buildings 14 00637 g009
Figure 10. DGP simulation results. DGP simulations were conducted for the center and window positions of the three classrooms. The positions of observation points were simulated for DGP values of 0.35 and 0.4.
Buildings 14 00637 g010
Figure 11. Simulation results for energy consumption of lighting. Lighting energy consumption was simulated for three classrooms during the transitional season of May, with various colors indicating different levels of energy consumption. When no one was present, energy consumption was nil.
Buildings 14 00637 g011
Figure 12. Visualization of indoor illumination distribution. Under identical conditions, the reliability of the simulation was validated through field measurements with the same expression as the illuminance simulation results.
Buildings 14 00637 g012
Figure 13. Luminance field measurement. Classroom luminance was measured under conditions identical to the simulation. The luminance value was utilized to calculate DGP, which was then compared with the simulated DGP.
Buildings 14 00637 g013
Figure 14. Pareto front distribution. The Pareto curve identifies the optimal set of building schemes with superior optical performance. The different colored blocks in the figure represent various schemes for variations in control parameters, with blue area indicating the Pareto front set.
Buildings 14 00637 g014
Figure 15. Effect of changing control parameters on target parameters.
Buildings 14 00637 g015
Table 1. Monthly daylight climate averages, Guangzhou.
MonthJanuaryFebruaryMarchAprilMayJuneJulyAugustSeptemberOctoberNovemberDecember
Sunshine duration (h)11971.662.465.1104140202174170181173166
Solar radiation (kWh/m2)8567.574.483.610811614113612312210593.1
Table 2. Comparison of geometric parameters and optical properties of three classrooms.
OrientationHeight (m)Room Size (m)Windows No.Wall between Windows (m)Shade Overhang Width (m)Windows Transmittance
Classroom AS13.6 (45 ft)12.3 × 8.25 × 4 (40 × 27 × 13 ft)40.5Eave2.00.7
Classroom BN9.6 (31.5 ft)11.6 × 8.55 × 4 (38 × 28 × 13 ft)21.01.10.7
Classroom CS5.6 (18 ft)11.6 × 8.55 × 4 (38 × 28 × 13 ft)21.01.10.7
Table 3. Main parameters of three test tools.
TES1330AKonica Minolta LS-110Pilot SPM91
Measuring range0.01–20,000 LuxFast: 0.01–999,900 cd/m2, Slow: 0.01–499,900 cd/m2999,999.9 kWh
Accuracy±3%rdg ± 0.5%f.s0.01–9.99 cd/m2 ± 2% ± 2 value, >10.00 cd/m2 ± 2% ± 1 valuekWh Class 1.0
Table 4. Reflectance factors.
Surface
CeilingWall
(Whitewash)
Wall (Tile)FloorWindowDoorShade
Reflectance
factor
Standard0.7–0.80.5–0.60.5–0.60.2–0.40.2
Measured0.790.750.680.40.20.490.71
Roughness0.050.050.050.051.50.050.1
Table 5. Guangya middle school schedule.
MorningNoonAfternoonDuskNight
Time8:00–12:2012:20–14:2514:25–17:4017:40–19:0019:00–22:10
Table 6. Illuminance luminance measurements and DGP for three classrooms.
Ls1/4
(cd/m2)
Ls1/2
(cd/m2)
Ls3/4
(cd/m2)
Eυ1/4
(lux)
Eυ1/2
(lux)
Eυ3/4
(lux)
DGP1/4DGP1/2DGP3/4
Classroom A9036.935415.314737.51198913209830.3900.3180.287
Classroom B6536.133190.291427.1714029847570.3770.3010.236
Classroom C2036.541309.27892.894213112500.3160.2740.239
Ls1/4, Ls1/2, and Ls3/4 represent luminance measurement values at 1/4, 1/2, and 3/4 positions vertically along the depth of the classroom from the exterior window, respectively. Eυ1/4, Eυ1/2, and Eυ3/4 represent illuminance measurement values at 1/4, 1/2, and 3/4 positions vertically along the depth of the classroom from the exterior window, respectively. DGP1/4, DGP1/2, and DGP3/4 represent calculated DGP values at 1/4, 1/2, and 3/4 positions vertically along the depth of the classroom from the exterior window, respectively.
Table 7. Lighting energy consumption for three classrooms.
MayClassroom A (kWh)Classroom B (kWh)Classroom C (kWh)
Lighting energy
consumption
83.9697.33118.86
Table 8. Comparison of optical performance between optimized solution and three classrooms.
DGP1/4DGP1/2DGP3/4PITavg (lux)DFavg (%)Lighting Energy (kWh)
Optimized solution0.3610.3220.2941077.015.5768.37
Classroom A0.40.3320.306761.373.9476.71
Classroom B0.390.3190.289676.73.6685.44
Classroom C0.320.2860.273549.082.7586.75
DGP1/4, DGP1/2, and DGP3/4 represent the measured and simulated values of DGP at positions 1/4, 1/2, and 3/4 vertically along the depth of the classroom from the exterior window. PITavg denotes the average real-time illuminance, while DFavg represents the average daylight factor in the classroom.
Disclaimer/Publisher’s Note: The statements, opinions and data contained in all publications are solely those of the individual author(s) and contributor(s) and not of MDPI and/or the editor(s). MDPI and/or the editor(s) disclaim responsibility for any injury to people or property resulting from any ideas, methods, instructions or products referred to in the content.

