Article

Comprehensive Numerical Modeling of Prestressed Girder Bridges under Low-Velocity Impact

by
Mohamed T. Elshazli
1,
Mohanad M. Abdulazeez
2,
Mohamed ElGawady
2 and
Ahmed Ibrahim
3,*
1
Department of Civil and Environmental Enginnering, University of Missouri, Columbia, MO 65211, USA
2
Center for Infrastructure Engineering Studies (CIES), Missouri University S&T, Rm 327-BCH, 1401 N. Pine St., Rolla, MO 65409, USA
3
Department of Civil and Environmental Engineering, University of Idaho, Moscow, ID 83844, USA
*
Author to whom correspondence should be addressed.
Buildings 2024, 14(3), 640; https://doi.org/10.3390/buildings14030640
Submission received: 1 February 2024 / Revised: 20 February 2024 / Accepted: 27 February 2024 / Published: 29 February 2024
(This article belongs to the Section Building Structures)

Abstract

:
Accidental collisions involving over-height trucks that exceed vertical clearance limits and bridge superstructures frequently happen, resulting in compromised girders and potential threats to structural safety and performance. The numerical simulation of large-scale prestressed girder bridge collisions poses challenges due to the associated nonlinearities, as well as the limited availability of large-scale experimental testing data in the literature due to cost and complexity constraints. This study introduces a numerical modeling approach to efficiently capture the response of prestressed girder bridges under lateral impact loads. A finite element (FE) model was developed using LS-DYNA and meticulously validated against experimental data from the literature. The study explored four methods for applying prestressing forces and evaluated the performance of four concrete material constitutive models, including the Continuous Surface Cap Model (CSCM), Concrete Damage Plastic Model (CDPM), Karagozian & Case Concrete (KCC) model, and Winfrith concrete model, under impact loads. Furthermore, an impact study was conducted to investigate the influence of impact speed, impact mass, and prestressing force on the behavior of prestressed girder bridges. Utilizing the dynamic relaxation (DR) approach, the developed FE model precisely captured the response of prestressed girders under impact loads. The CSCM yielded the most accurate predictions of impact forces, with an error of less than 8%, and demonstrated a strong ability to predict damage patterns. Impact speed, mass, and the presence of prestressing force showed a significant influence on the resulting peak impact force experienced by the girder. Furthermore, the study underscores the composite nature of the bridge’s response and emphasizes the importance of analyzing the bridge as a whole rather than focusing solely on individual girders.

1. Introduction

Although measures such as height clearance signs have been implemented on roads, accidental collisions between over-height trucks or trucks carrying equipment that exceeds the vertical clearance limit still happen, and many overpasses continue to experience damage during their service life. Twenty-eight states out of the 50 in the United States identified over-height collisions as a significant bridge problem [1]. Over-height accidents frequently result in compromised girders, severely affecting the safety and performance of the structure [2,3]. As shown in Figure 1, collisions involving over-height trucks result in varying degrees of damage.
In addition to the damage experienced by the compromised girder, the localized failure of a primary structural component can trigger the collapse of adjacent members, thereby initiating further progressive collapse [4,5]. A recent research study introduced a novel framework for defining initial failure in progressive collapse scenarios [4]. This study revealed that initial failure does not necessarily require the complete removal of a member. Instead, damage scenarios or changes in boundary conditions and connection performance could lead to a more critical scenario, potentially beyond the sudden and complete removal of a member. Previous research has reported numerous instances of progressive collapse in bridges resulting from vessel collisions [6,7,8,9]. In such incidents, bridge piers impacted directly often fail laterally, leading to the progressive collapse of adjacent members longitudinally [10]. While vertical load-bearing elements like columns and piers have received significant attention, it is crucial to recognize that local damage to bridge girders can also trigger additional collapse. Notably, the severing of prestressing strands in prestressed girders subjected to impacts can lead to a reduction in the girder’s resistance to moments applied about its geometric horizontal axis [11], potentially altering live load distribution factors and leading to further collapse. This study contributes to existing knowledge by developing a numerical modeling approach focused on the damage incurred by bridge girders under impact loads, rather than vertical load-bearing elements such as columns and piers.
Experimental and numerical research has recently been carried out on the dynamic response of reinforced concrete (RC) structures under lateral impact loads [12,13,14,15,16,17,18,19,20]. However, most of theses studies focused on vehicle collisions with bridge piers [21,22,23,24,25,26,27,28,29] and side barriers [30,31,32,33]. In other studies, more attention has been paid to the damaged vehicle components rather than the damage to structures [34]. Comparatively, only very limited experimental investigations of collisions between over-height trucks and bridge superstructures are available [35,36,37].
The failure response of three common types of bridge superstructures, made of steel and reinforced concrete, was experimentally and numerically investigated under lateral impact load in [33,38]. Due to the physical constraints of the laboratory, the considered bridge models were limited to a length of 4 m. Therefore, a similarity ratio of 0.2 was used. Among the steel superstructures studied, the steel box girder bridge stood out as the best choice due to its remarkable resilience against collision forces. The reinforced concrete beam, on the other hand, did not perform as well. Notably, the collision not only caused localized damage in the impact zone, but also caused numerous cracks to form along the entire length of the bridge girder. These cracks compromised the safety and structural integrity of the bridge to some extent.
Another study conducted by Xu et al. (2013) [35] utilized a refined finite element (FE) model of over-height vehicle collisions with prestressed girder bridges. Notably, the prestressed girders were modeled as reinforced concrete, ignoring the prestressing effect. The results revealed that the risk of collisions involving over-height trucks is substantially influenced by two key factors: global deformation and local punching forces. The main reasons for global failure were extensive deformations, torsional damage, and cases of girder failure. However, it was shown that the predominant factor responsible for localized damage was the punching stress.
The impact of different parameters on over-height vehicle collisions with prestressed girder bridges was investigated in [2,39]. The study considered individual large-scale AASHTO girders, yet the influence of prestressing force was ignored in the analysis. An increase in impact velocity and contact area was found to increase impact force [2,39]. The increase in contact area provided more surface area for frictional forces to act upon, leading to a higher resisting force and, consequently, an elevated impact force. Berton et al. (2017) [38] assessed the factors influencing the bridge deck damage caused by over-height truck collisions. The findings indicated that the stiffness of beams, the area of contact, and the mass and velocity of the colliding vehicle were significant variables determining the extent of the resultant damage.
Compared to implicit analysis, modeling prestressed concrete with explicit analysis is complex, especially when additional phases of transient loading, such as impact force, are applied. In explicit analysis, the solution algorithm directly integrates the equations of motion to simulate dynamic behavior. The dynamic effect causes oscillations in stresses over time, which can have a substantial impact on the results of the transient analysis stage, particularly in large-scale problems. As a result, most previous research has ignored the influence of prestressing force in prestressed girders under impact loads, often modeling them as reinforced concrete. In addition, conducting the large-scale experimental testing of bridges subjected to vehicle impact poses significant challenges due to the associated cost and complexity, resulting in limited available data in the literature. Furthermore, studying individual girders ignores the bridge’s composite effects, which can significantly affect how a bridge behaves as a whole system under impact loads. The primary objective of this study was to bridge the existing gap by introducing a numerical modeling approach that can efficiently capture the response of prestressed girder bridges under lateral impact loads. To achieve this goal, an FE model was developed using LS-DYNA. The proposed FE model employs the dynamic relaxation approach to limit the dynamic effects associated with explicit analysis when modeling prestressed elements. Four methods for applying prestressing forces and four concrete material constitutive models were investigated. The developed model aims to capture both global damage, including overall deformations, and local damage, including prestressing strand damage. After the validation of the model, a parametric impact study was conducted to demonstrate the model’s efficacy and provide insights for future implementation.
This paper makes the following contributions:
  • We developed and validated an FE model of a large-scale prestressed girder bridge under impact loads.
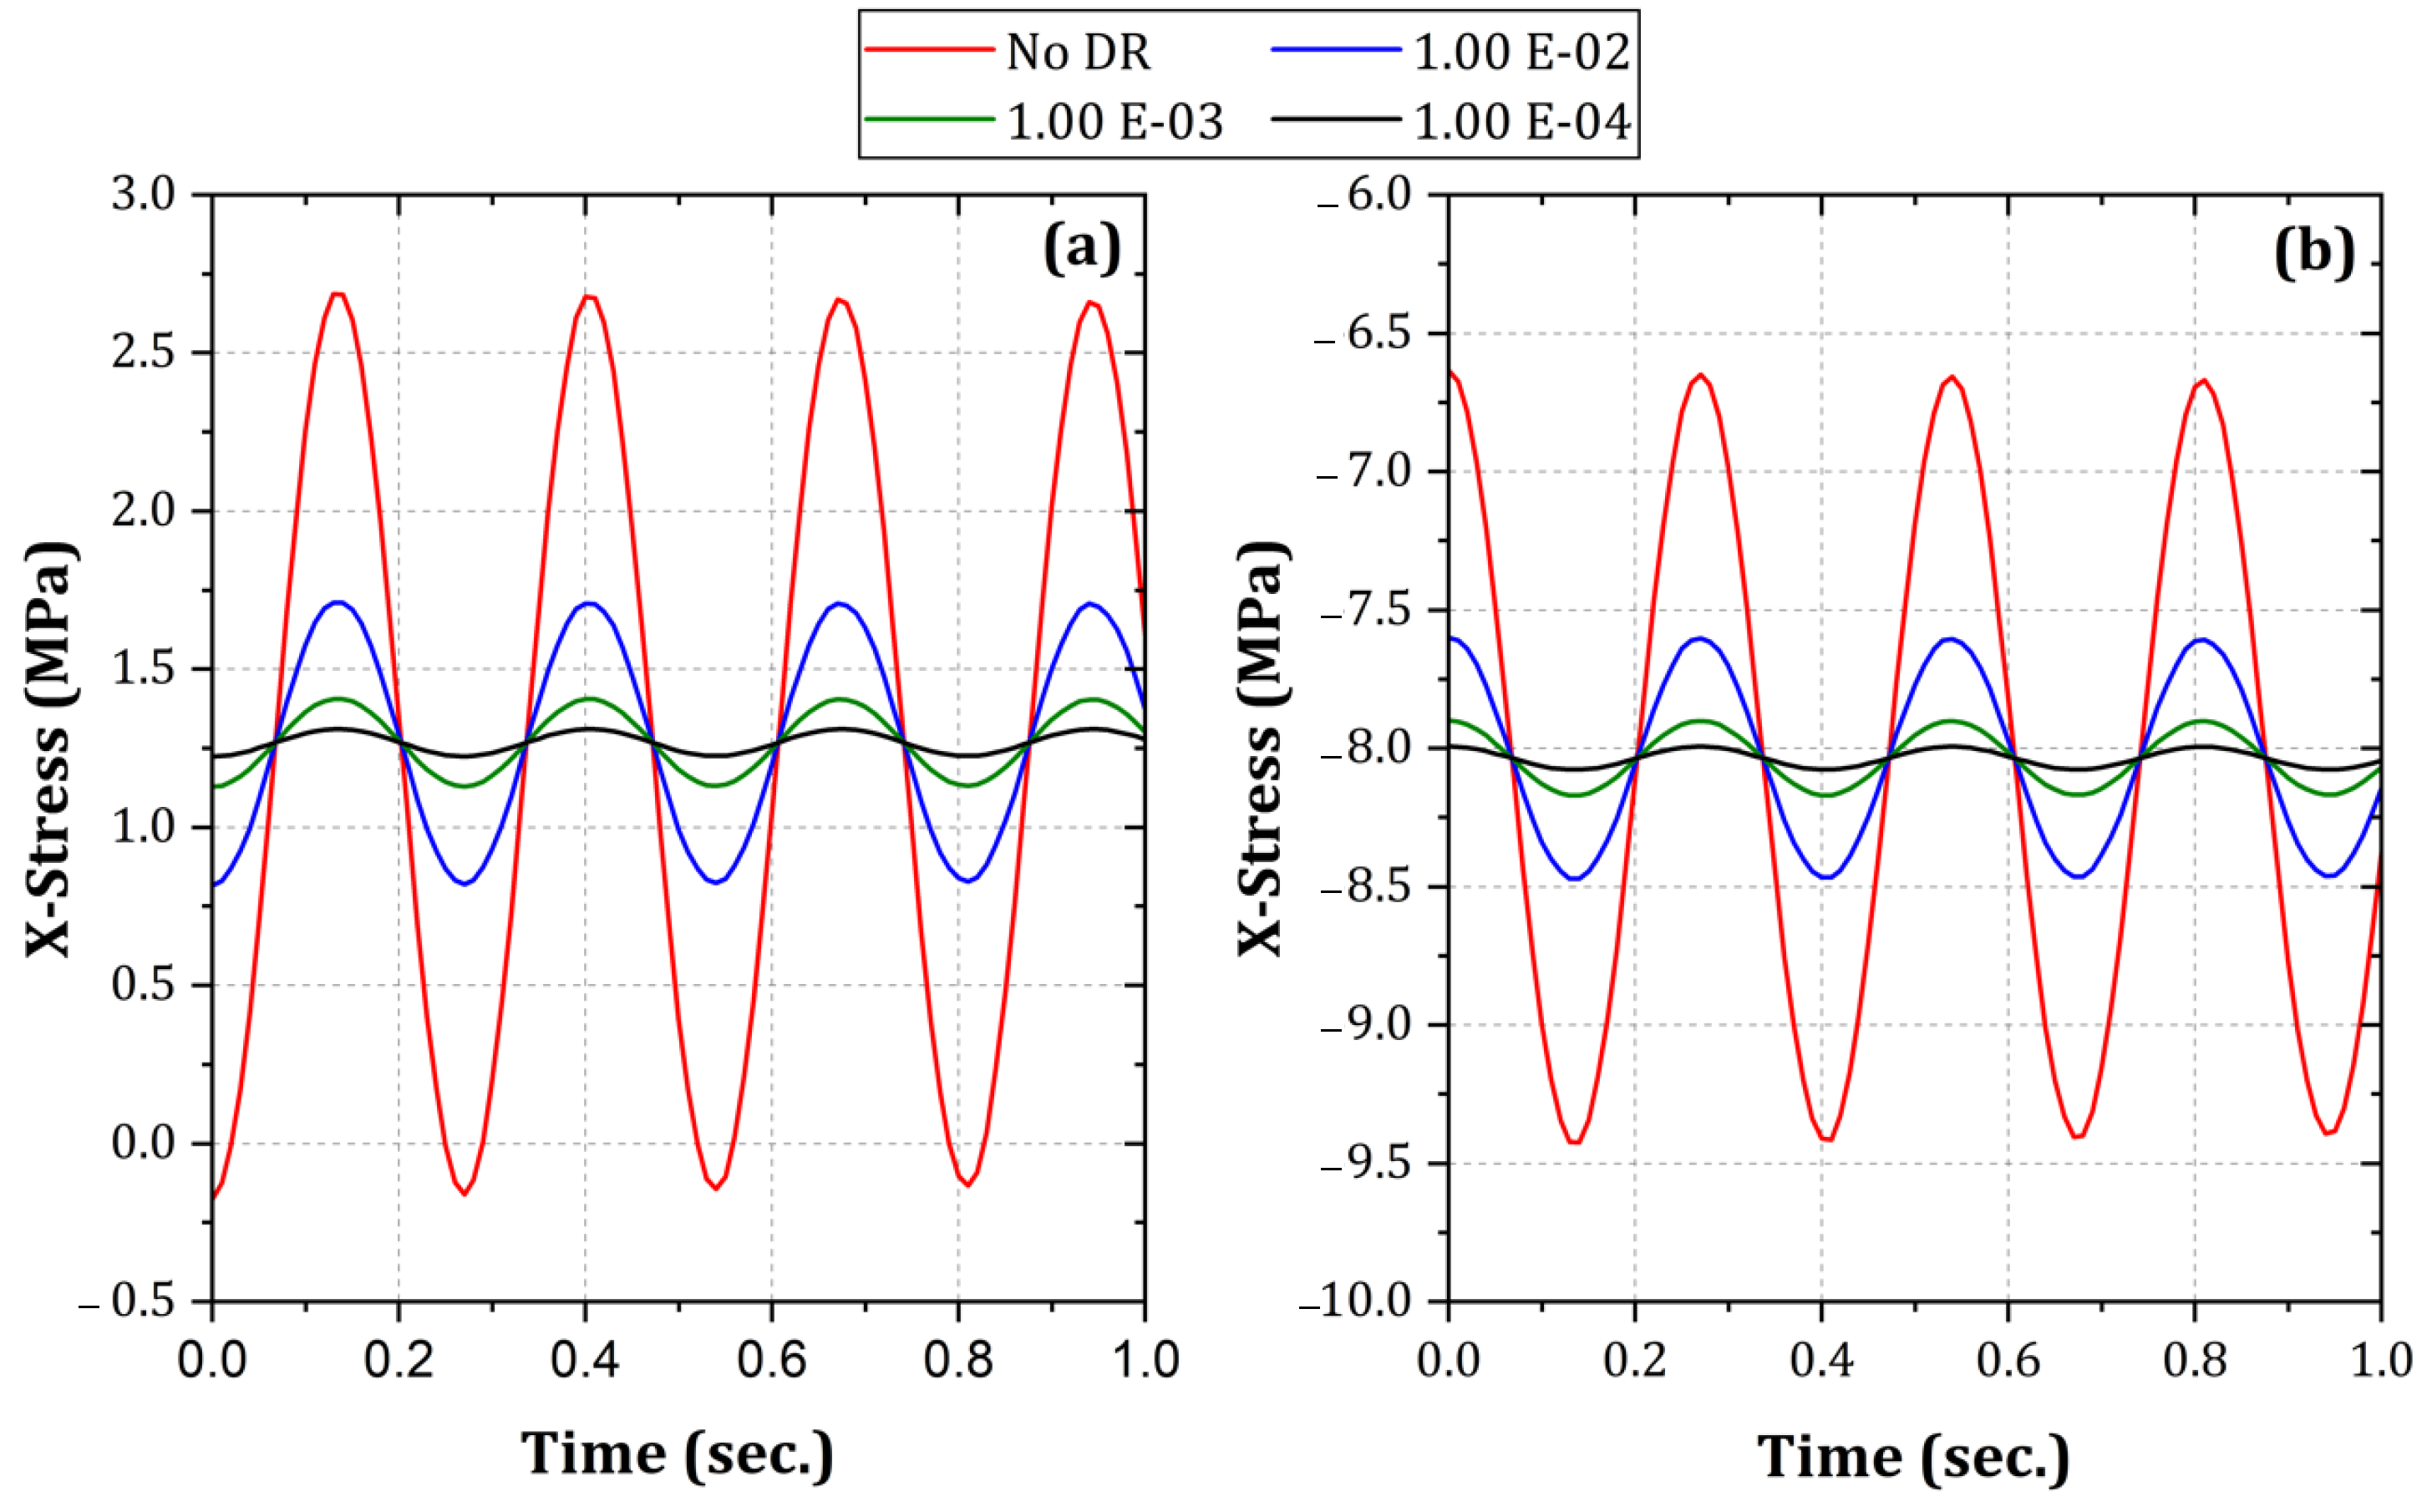
  • We utilized the dynamic relaxation approach to model large-scale prestressed concrete girders under impact loads.
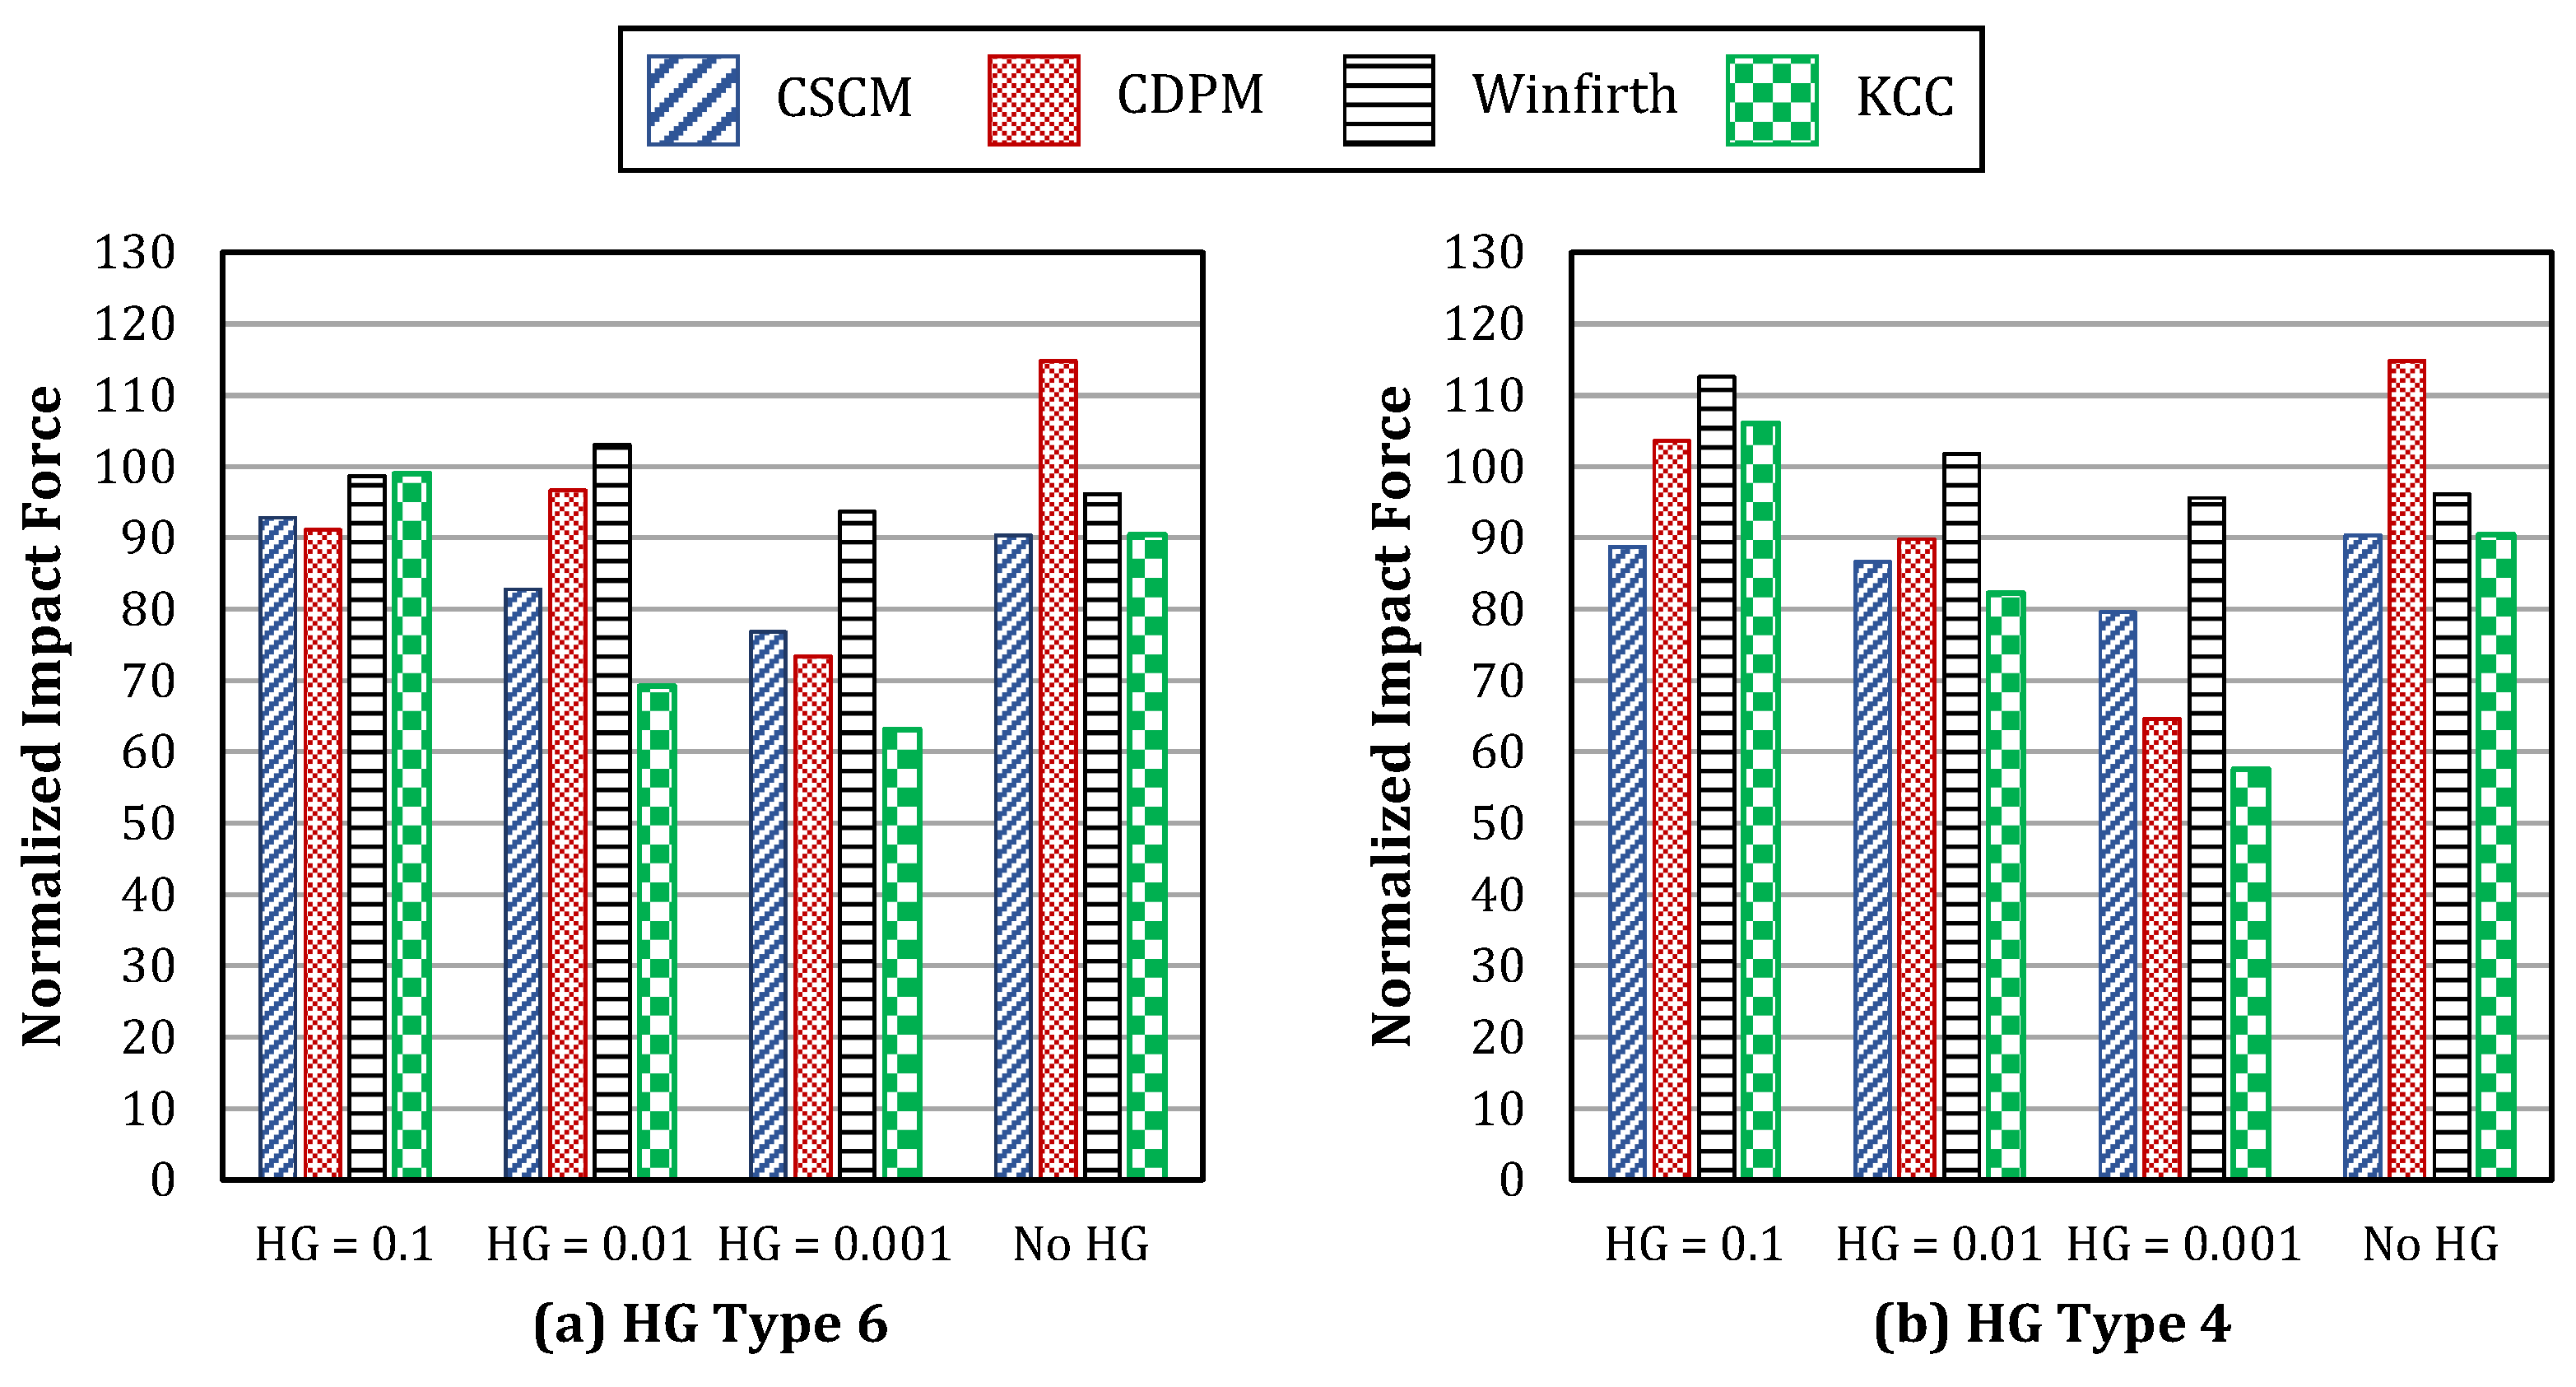
  • We compared four different material models and two stiffness-based hourglass types of concrete under impact loads.
  • We investigated the effect of different impact parameters, including impact speed, mass, and the effect of prestressing force, on the response of prestressed girder bridges.
Figure 1. Examples of over-height truck collisions with bridge superstructures [40]: (a) I-10 overpass at I-49, Lafayette; (b) RM215 over IH10, Pecos Co, TX; (c) Sgt. Bluff bridge, IA; and (d) FM479 over Kerr Road, San Antonio, TX.
Buildings 14 00640 g001

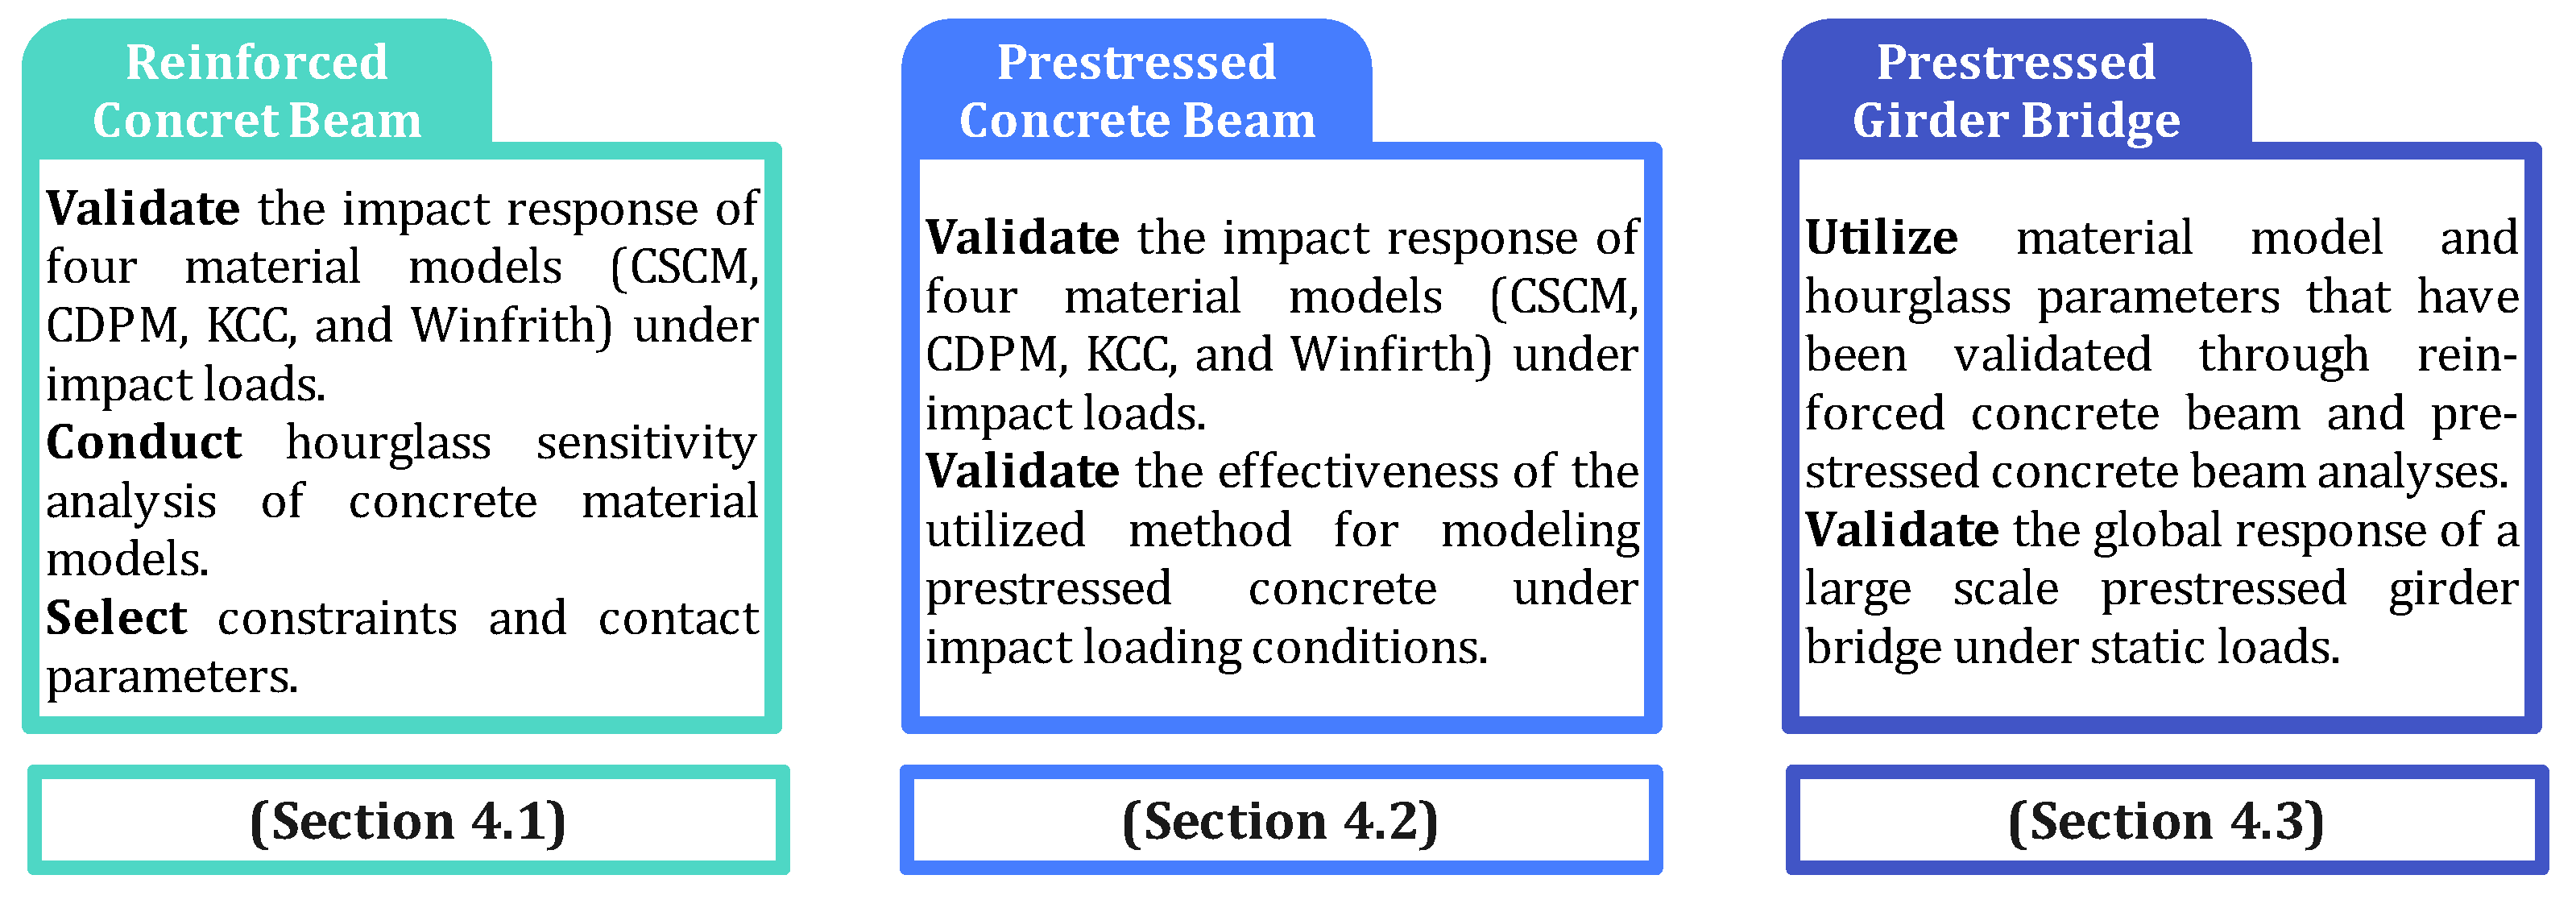
2. Research Methodology

This study followed a comprehensive verification and validation process to develop an FE model of a large-scale prestressed girder bridge under impact loads, as outlined in Figure 2. The research study was carried out in three stages. Initially, the focus was on accurately modeling prestressed concrete behavior under dynamic loading conditions, employing dynamic relaxation to control stresses during transient analysis. The second stage involved validating the FE model and material properties against experimental data from literature sources. This phase included comparing the responses of four different material models (CSCM, CDPM, KCC, and Winfrith) under impact loads, as well as assessing the impact of including strain rate effect parameters. Additionally, hourglass sensitivity analysis was conducted to ensure precise results when utilizing under-integrated elements. Subsequently, the overall response of the large-scale bridge was validated through the static testing of an Iowa laboratory bridge. Finally, in the third stage, following successful validation, a parametric investigation was conducted to demonstrate the model’s efficacy and provide insights for future implementation.

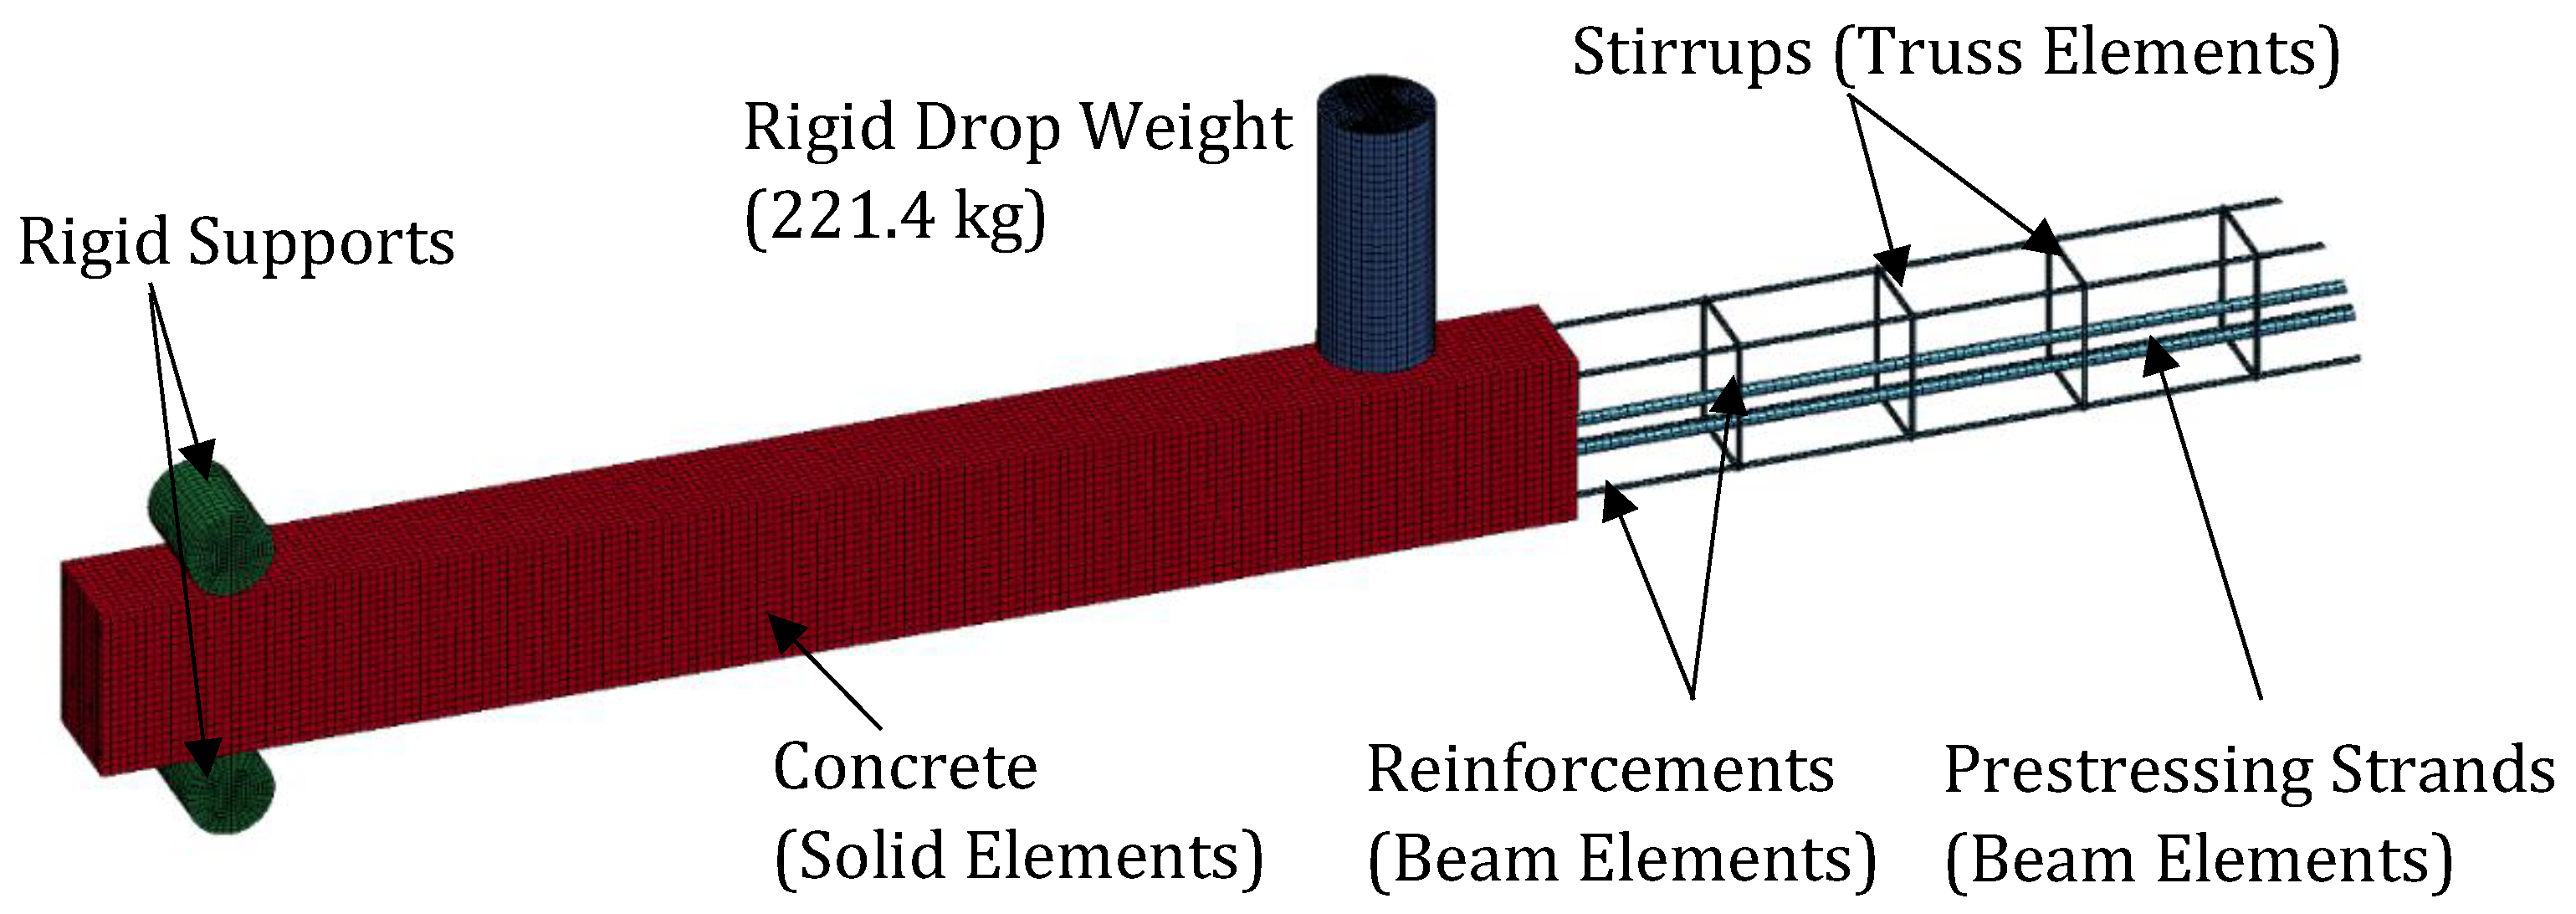
3. Finite Element Modeling

This section presents a framework for simulating prestressed girder bridges subject to impact loads using LS-DYNA.

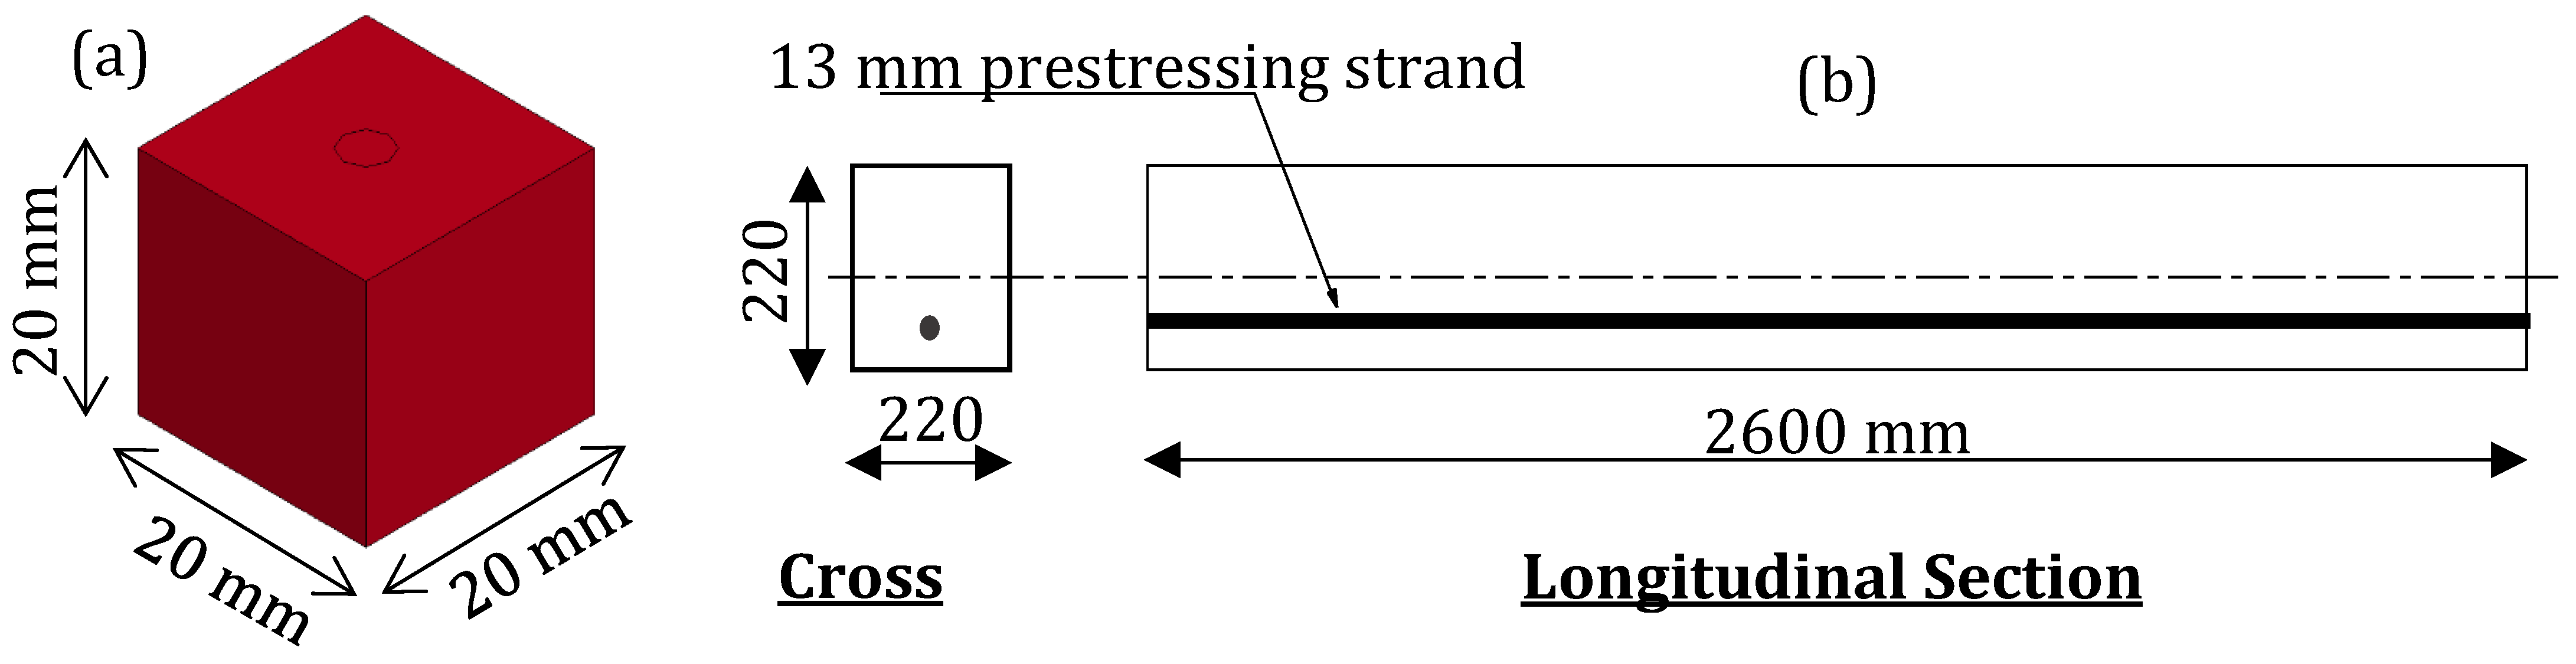
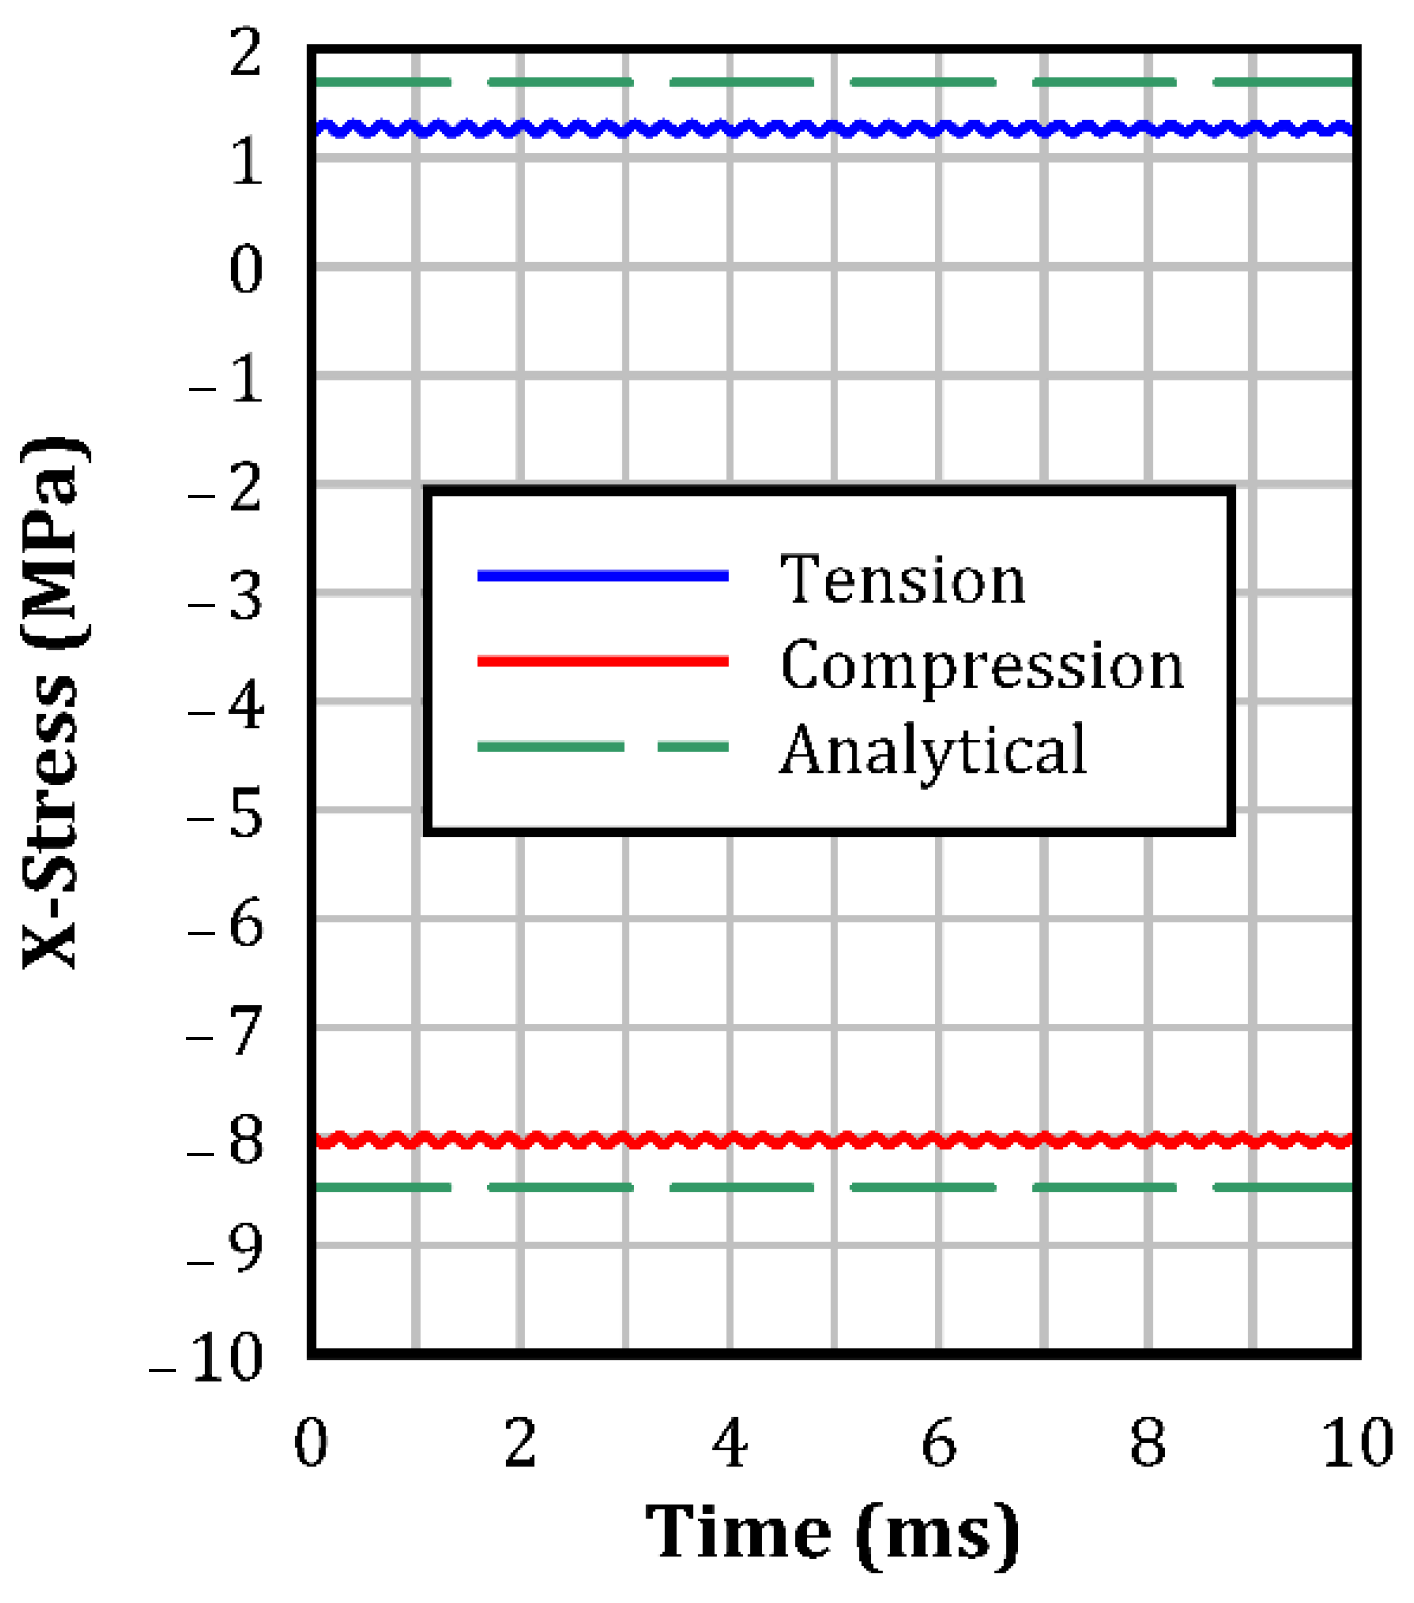
3.1. Modeling of Prestressed Concrete

Solid and beam elements were used to model the concrete members and the prestressing strands, respectively. Two essential steps were required to introduce prestressing forces in the strands. The first preloading step involved setting the design stress value in the prestressing strands. In the subsequent coupling step, the stresses were transferred from the prestressing strands to the concrete elements using a transfer function that accounted for the interaction between the prestressing strands and the concrete. Once the prestressing was applied, the transient load, i.e., the impact load in this manuscript, was included.
Two illustrative examples, shown in Figure 3, were used and compared to the American Concrete Institute (ACI) analytical equations to validate the proposed prestressing method. The first example (Figure 3a) involved a single concrete element measuring 20 mm × 20 mm × 20 mm with a 4 mm prestressing strand element. This example aimed to look into applying prestressing force at the single-element level. This preliminary approach has been utilized in other research works, including those by Jiang and Chorzepa (2015) [39] and Saini and Shafei (2019) [41]. The second example (Figure 3b) involved a prestressed concrete beam from [40], which was used to compare the results at a beam-level scale. The concrete compressive strength was 40 MPa, and the elastic modulus was 29 GPa. A prestressing strand was eccentrically positioned 55 mm below the concrete beam’s neutral axis. The strand had a diameter of 13 mm, with corresponding yield strength and elastic modulus values of 1765 MPa and 210 GPa, respectively. The strand was tensioned using a prestressing force of 164 kN, resulting in an initial prestress of 1236 MPa. Using these illustrative examples and analytical calculations provided a valuable starting point for validating the accuracy of the proposed approaches to model the prestressing forces in bridge girders.

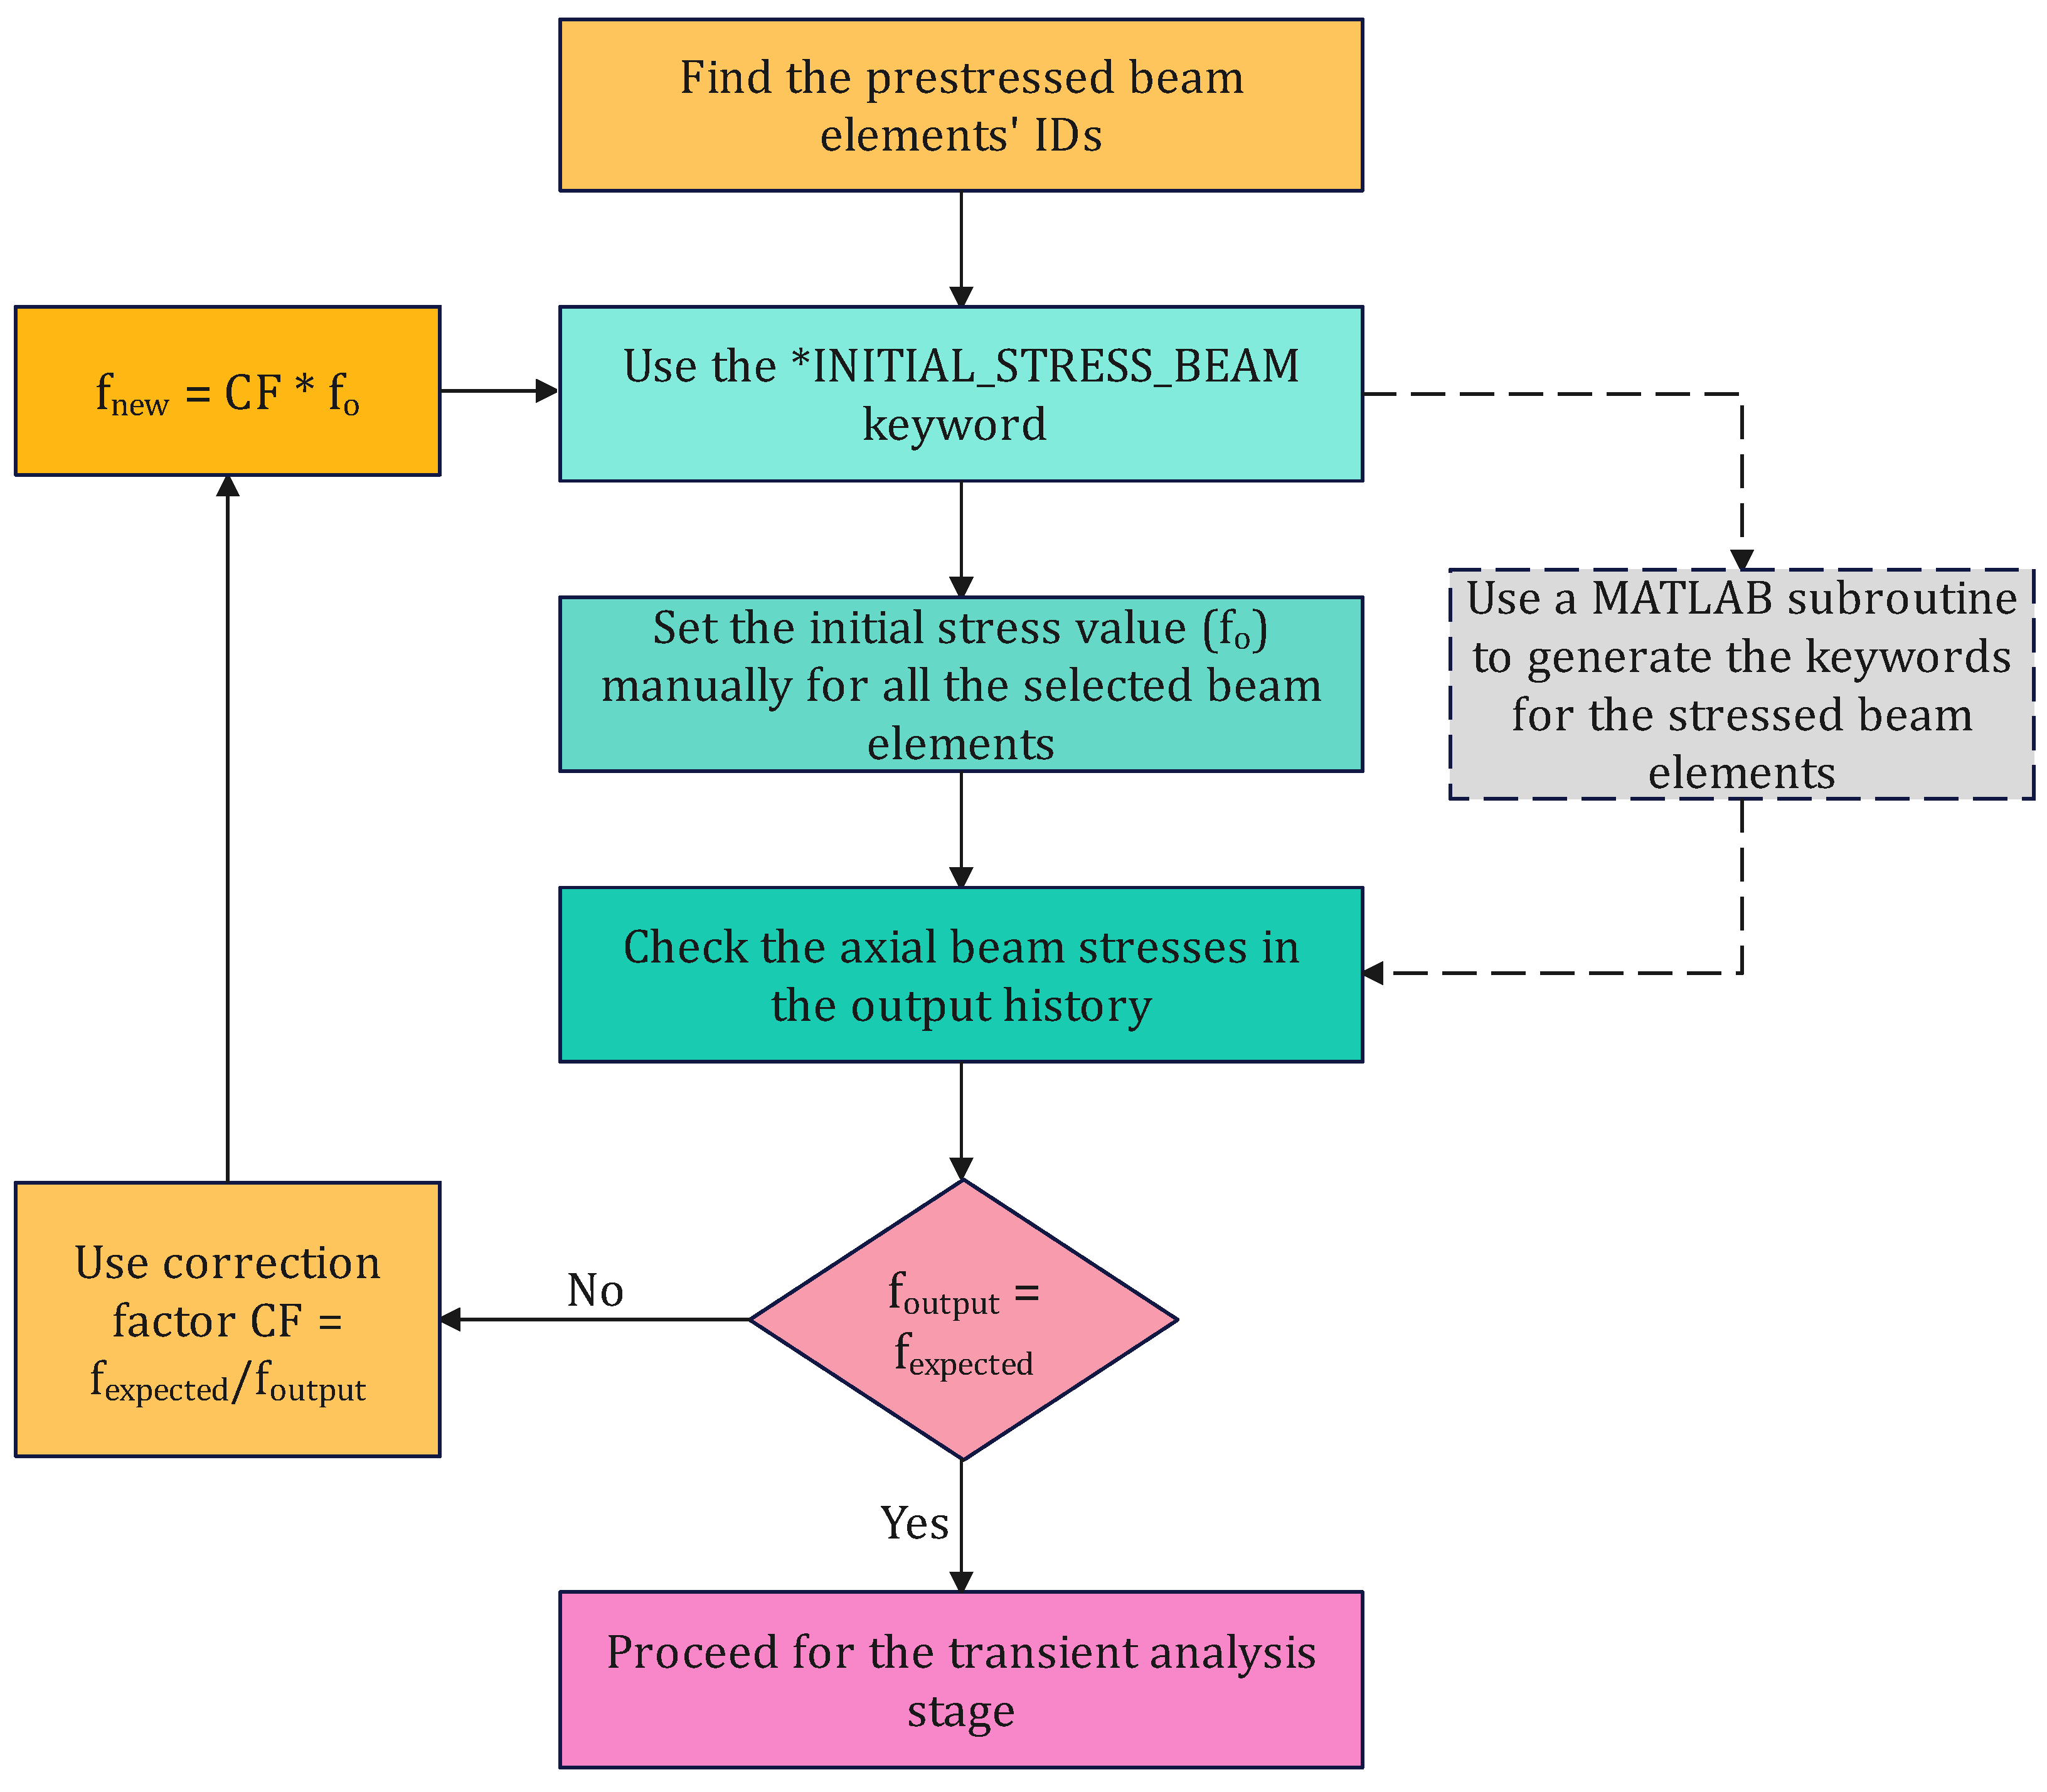
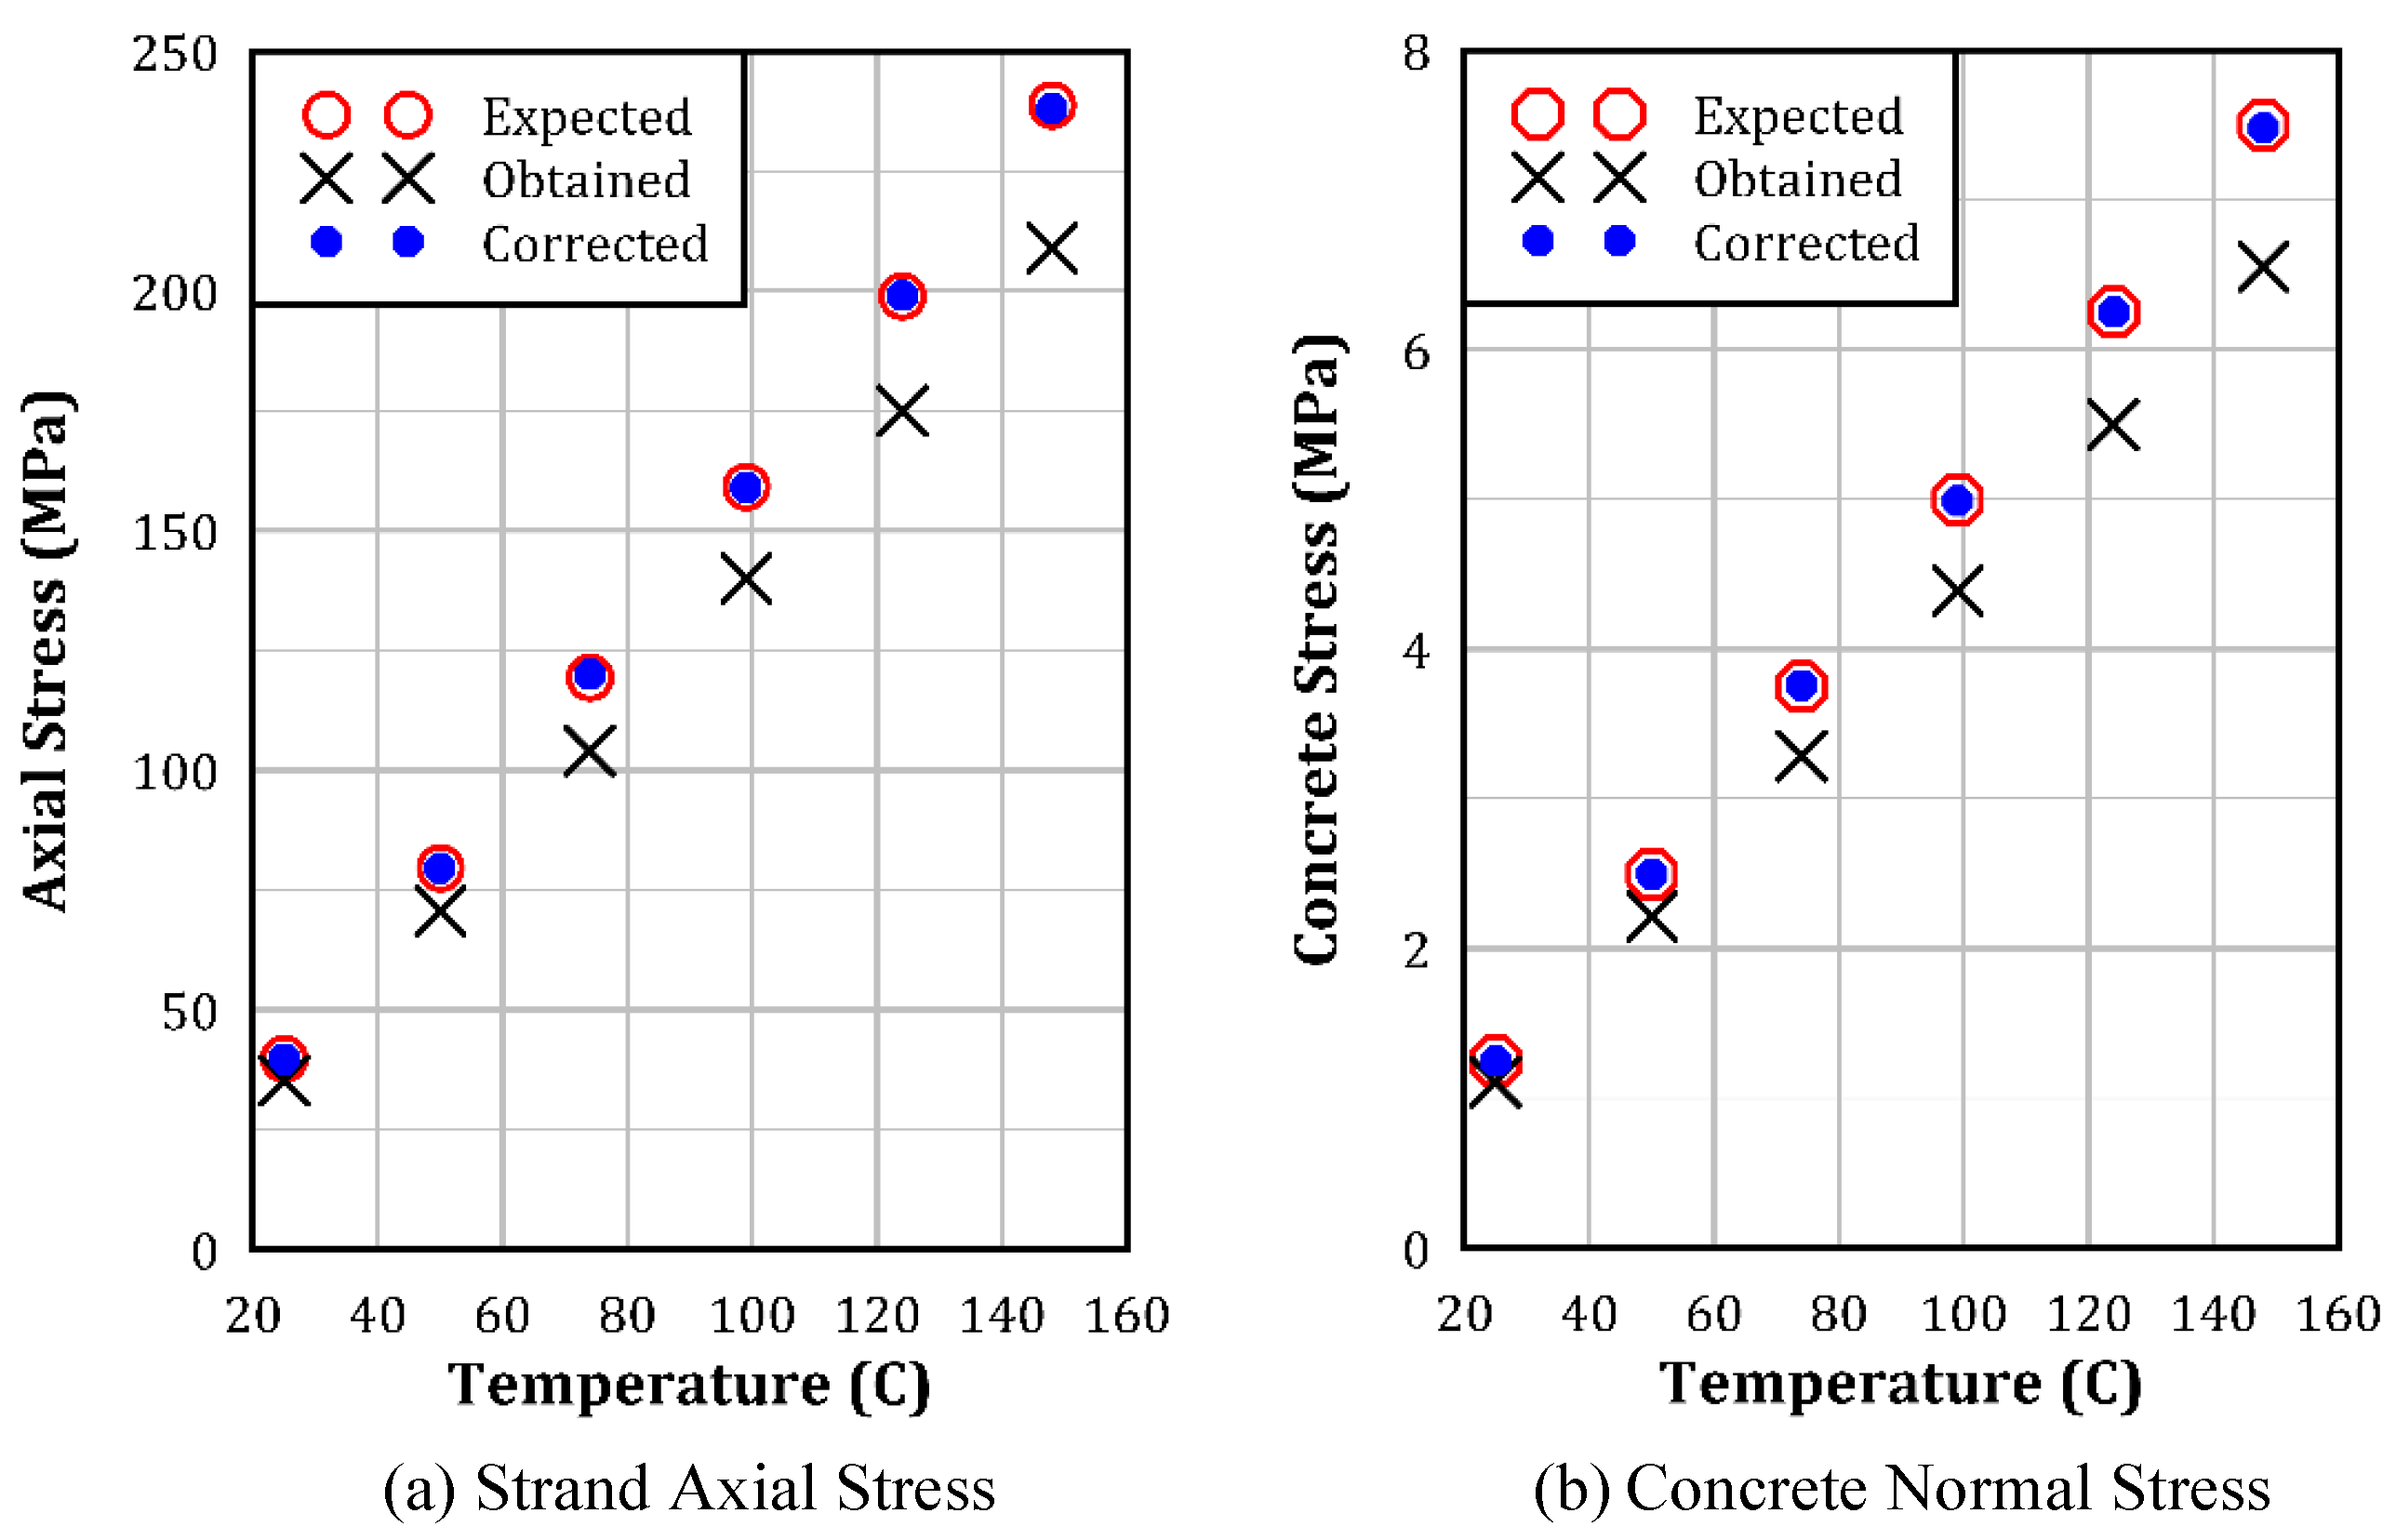
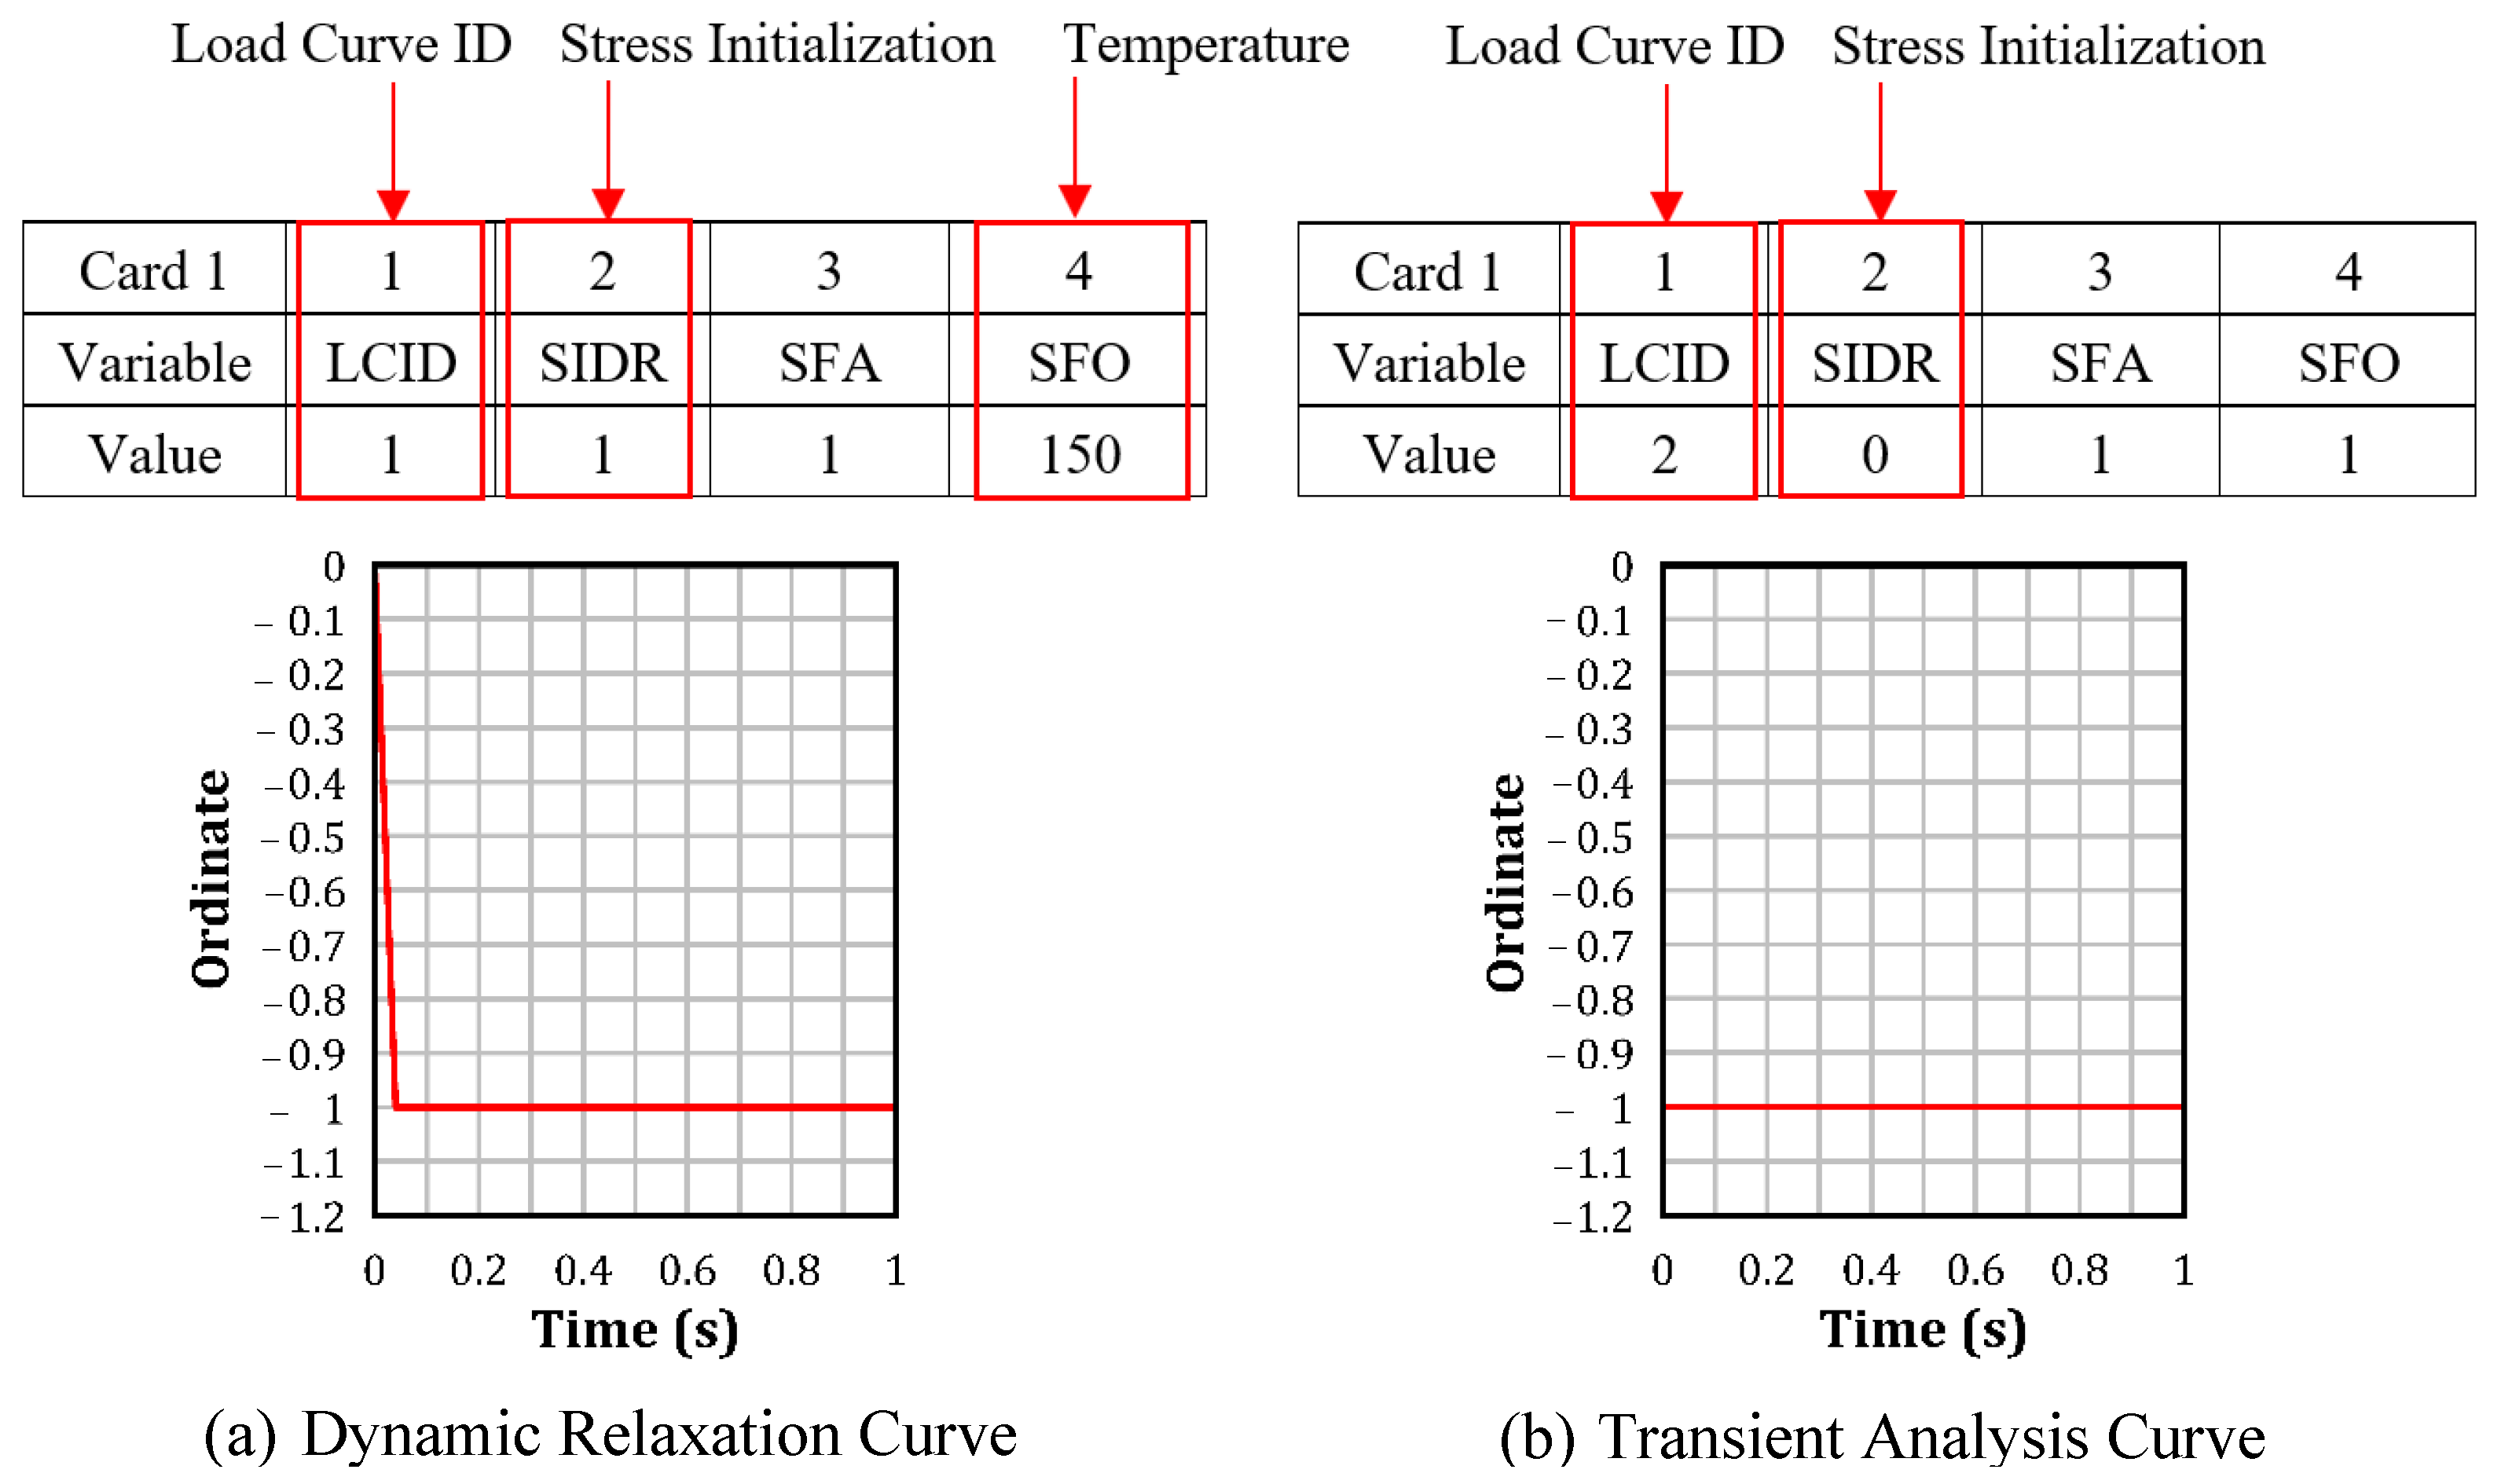
3.1.1. Preloading Step
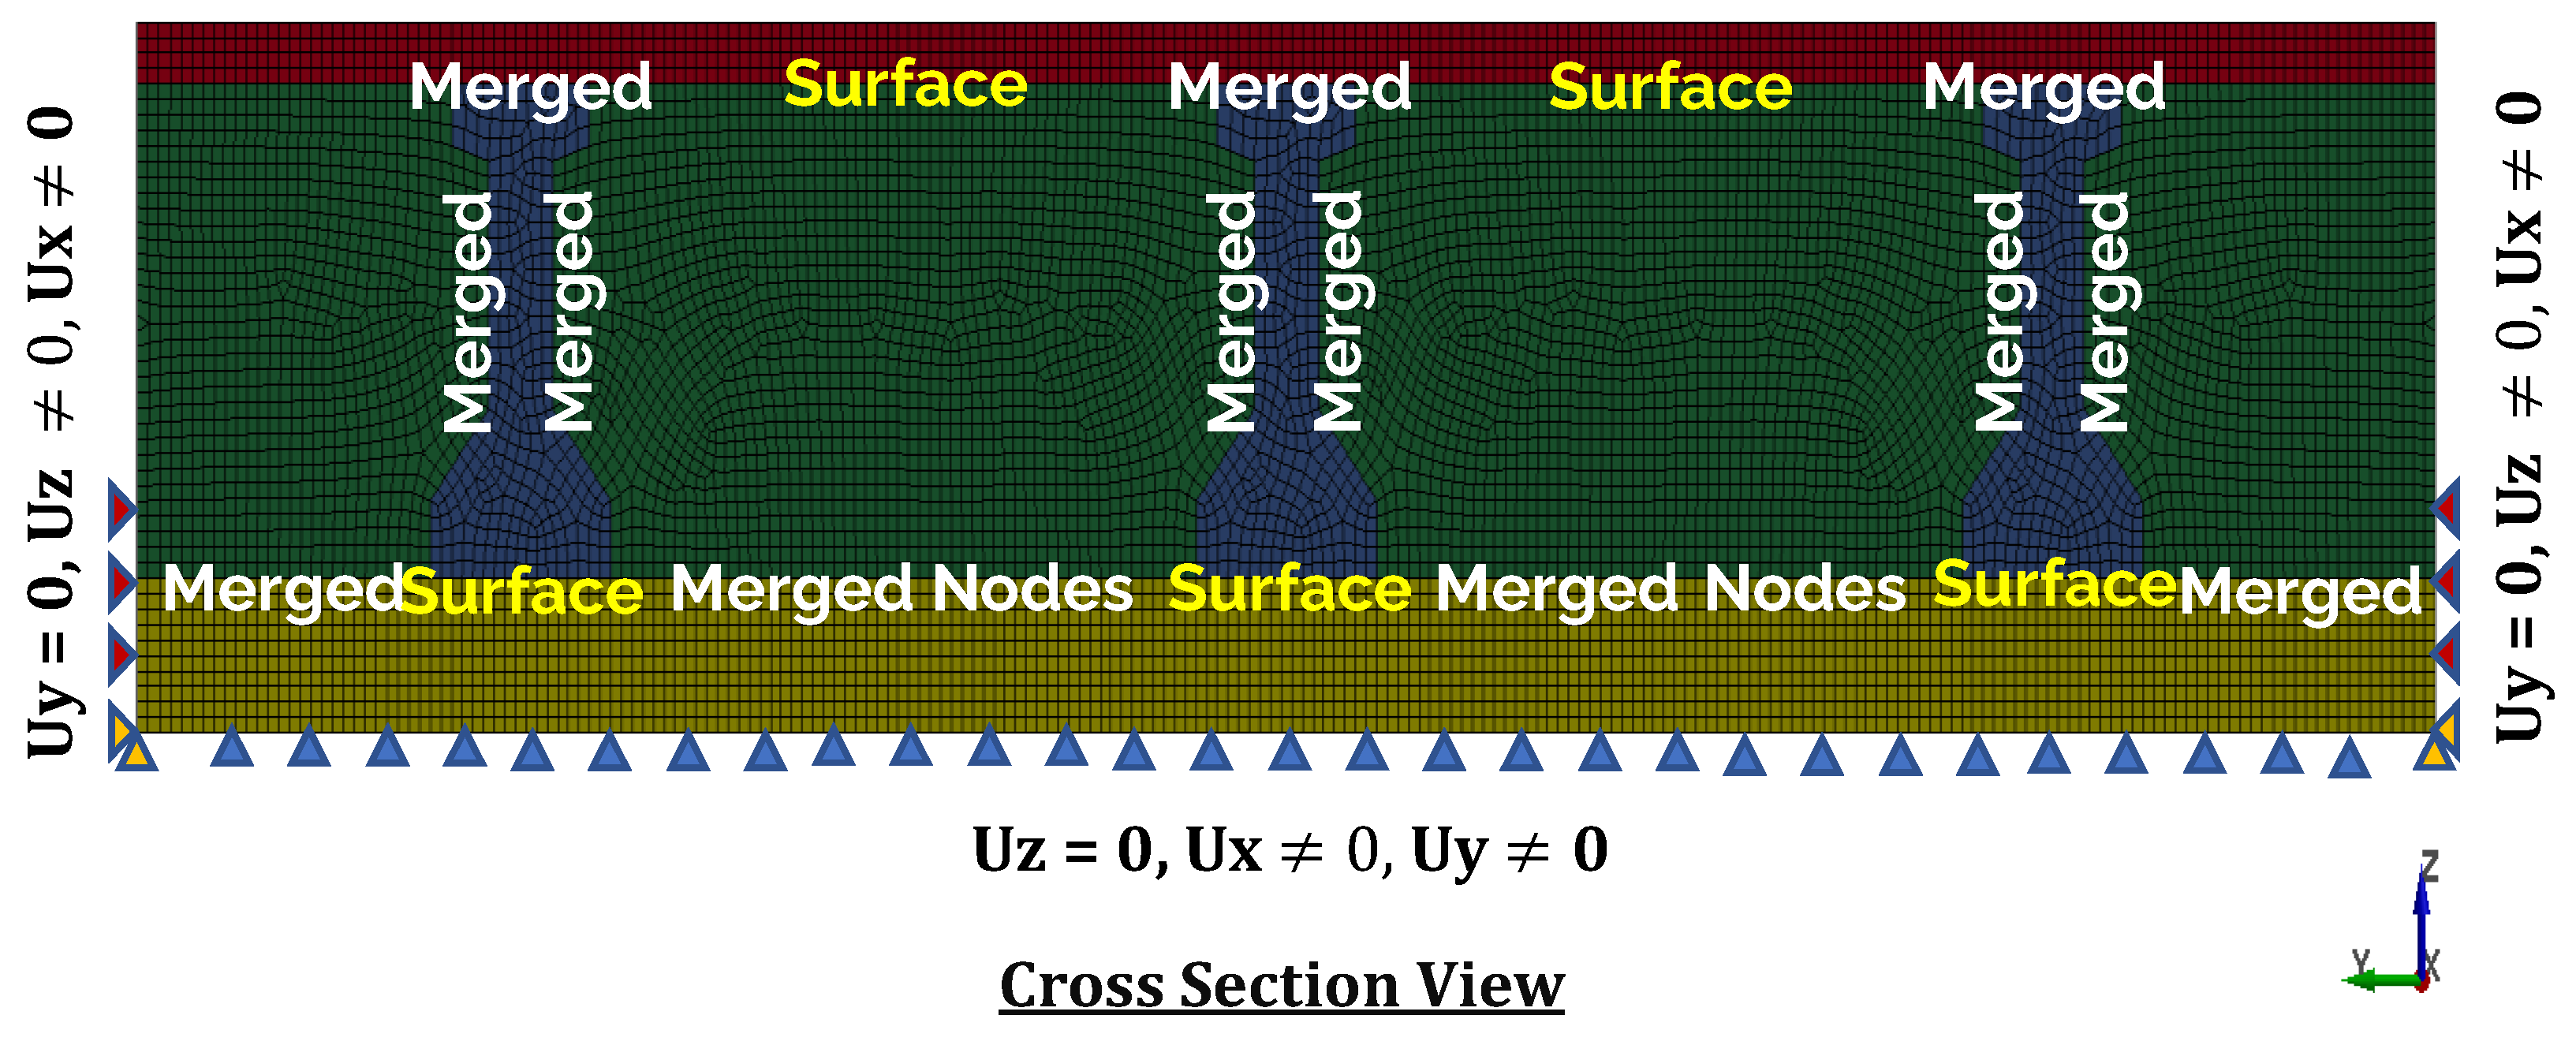
Preloading is an important technique used in many engineering applications to improve the performance of structures under load. Temperature-induced shrinkage and introduced stress or force in solid or beam elements are all preloading techniques available in LS-DYNA. The prestressing force is applied typically before conducting dynamic analysis using dynamic relaxation.
This study used three different prestressing techniques, the *INITIAL_STRESS_BEAM, *INITIAL_AXIAL_FORCE_BEAM, and *LOAD_THERMAL_CURVE keywords. The subsequent sections will delve into the details of each approach to provide a comprehensive understanding of their implementation within LS-DYNA.
Stress Initialization
The *INITIAL_STRESS_BEAM keyword can be used in conjunction with other keywords in LS-DYNA, such as *BOUNDARY_PRESCRIBED_MOTION, *BOUNDARY_-SPC, and *DAMPING, to fully define the initial stresses and boundary conditions for beam elements in an FE model. The *INITIAL_STRESS_BEAM keyword can be used for prestressed concrete to model the initial stresses induced in the prestressing strands due to pretensioning. This study used Hughes–Liu beam elements with the number of integration points (NPTS) equal to 4 to achieve accurate results.
Figure 4 shows how prestressed concrete is modeled using the *INITIAL_STRESS-_BEAM keyword. The analysis process is divided into several stages: first, defining the prestressing force, followed by applying external loads based on the problem. Explicit analysis was used, and due to the damping effect, the output stress values were lower than the required stress. An intermediate step was added to correct the stress values, as shown in Figure 4. In addition, a MATLAB subroutine was developed to automatically generate *INITIAL_STRESS_BEAM keywords for a set of beam elements. Some of the concrete cube example results are presented in Figure 5, showing that the output axial beam stresses reached 292.32 MPa. The figure demonstrates that the corrected stresses successfully achieved the desired values. Furthermore, *CONTROL_DYNAMIC_RELAXATION was implemented to minimize the dynamic effect in the transient analysis stage, thereby improving the stability of the results. These findings suggest that implementing correction factors and dynamic relaxation could improve the accuracy and stability of the prestressing calculations in concrete modeling.
Axial Beam Force
Instead of applying stresses directly to the beam elements, an initial axial force can be utilized. However, to apply axial force initialization, the spotweld material model (MAT_100) should be used in conjunction with the spotweld beam elements (beam type 9), which limits this method’s applicability [42]. Thai and Kim (2017) [42] utilized this approach to model a prestressed concrete slab subjected to impact loading. The required axial force was determined by dividing the initial prestress by the cross-sectional area specified in the beam section keyword. A curve was defined to apply the axial force, with the force ramped up and then held constant over time. The resulting axial stress in the beam element of the cube example, shown in Figure 6, confirms that the desired stress level was reached without any additional iterations. This non-iterative approach demonstrates the effectiveness and efficiency of using *INITIAL_AXIAL_FORCE for preloading, enabling accurate simulations without the need for excessive iterations.
Temperature-Induced Shrinkage
This technique uses temperature-induced shrinkage in the prestressing strands to apply a prestressing force to the concrete elements. Prestressing strands are modeled as beam elements embedded within the surrounding concrete elements. When prestressing strands are exposed to a temperature drop, they contract. However, while the strands are embedded in concrete, the surrounding concrete impedes their contraction, resulting in the development of compressive stress in concrete [39,41,43,44].
The sensitivity to temperature of the prestressing strands should be included using thermal material models, like *MAT_ELASTIC_PLASTIC_THERMAL or *MAT_ADD_-THERMAL_EXPANSION. In addition, a temperature–time curve should be defined using *LOAD_THERMAL_LOAD_CURVE. The following equations were used for determining the temperature-induced strain:
ε t = T · α
T = F E s A s α ( 1 + E s A s E c A c )
where  ε t  is the strain due to the drop in temperature;  T  is the change in temperature;  α  is the coefficient of thermal expansion of the strands ( α = 1 × 10 4 / ° C); F is the required prestressing force;  E s  and  E c  are the elastic moduli of steel and concrete, respectively; and  A s  and  A c  are the cross-sectional areas of the strands and concrete, respectively.
The temperature method, like *INITIAL_STRESS, is an iterative approach that requires correction until the required stress is reached. The correction factor for the temperature method can be obtained using the same technique as for the *INITIAL_STRESS method (see Figure 4). Figure 7 shows the resulting output for the cube example at various temperatures. The figure demonstrates that the corrected stresses achieved the desired values in the strand and concrete elements.
Dynamic Relaxation (DR)
Compared to implicit analysis, modeling prestressed concrete with explicit analysis is complex, especially when additional phases of transient loading, such as impact force, are applied. In explicit analysis, the solution algorithm directly integrates the equations of motion to simulate dynamic behavior. The dynamic effect causes oscillations in stresses over time, which can have a substantial impact on the results of the transient analysis stage, particularly in large-scale problems. In this study, we used the DR approach to limit the dynamic effects associated with explicit analysis when modeling prestressed elements. The prestressing force was applied before conducting the transient analysis.
The DR option in LS-DYNA was used as a stress initialization process. DR is a solution technique that is typically utilized for performing quasi-static simulations in “pseudo” time. DR is a method wherein nodal velocities are calculated and then reduced by a dynamic relaxation factor (DRFCTR) at each timestep. The process is monitored by measuring the amount of distortional kinetic energy, and once it reaches an acceptable level, the DR phase ends, and the solution proceeds to the transient analysis phase [45]. To activate DR, the parameter SIDR in the DR load curve is typically set to 1 or 2, and two load curves are needed, one for the dynamic relaxation phase and the other for the subsequent transient analysis phase. Two temperature–time functions were used in this study. The first function corresponded to dynamic relaxation, where the temperature is constantly increased and then maintained until the solution converges, and convergence should occur after applying 100% of the preload, Figure 8a. The second curve was used to maintain the temperature in the transient analysis phase, Figure 8b.

3.1.2. Coupling

In prestressed concrete, the selection of an appropriate coupling mechanism plays a crucial role in transferring the stresses between the strands and the surrounding concrete elements. To accurately model the prestressing strands, tubular beam elements with the Hughes–Liu element formulation (ELFORM = 1) and 2 × 2 Gauss quadrature were utilized. The Lagrange-In-Solid constraint algorithm was used to represent the interaction between prestressing strands and concrete. This algorithm allows for the efficient and accurate simulation of the interaction of a Lagrangian element and an Arbitrary Lagrangian–Eulerian (ALE) solid or fluid element. This method was chosen because it is more suitable for large-scale problems with complex reinforcement details than the shared nodes approach. This approach assumes that initial stresses are equal to effective stresses. Therefore, if prestressing losses are to be considered in the analysis, they must be determined and integrated into the calculation of the equivalent temperature needed to produce the desired prestressing force.
The prestressed concrete beam illustrative example, shown in Figure 3b, was utilized to validate the accurate transfer of stresses. The achievement of the camber, as shown in Figure 9, represents the first sign of stress transfer. To further validate the results, the maximum stresses in the top and bottom concrete fibers were calculated using ACI analytical Equations (3) and (4) and compared to the LS-DYNA results. Figure 10 shows the stress contours of the LS-DYNA model. As shown in Figure 11, an acceptable agreement was obtained, confirming the reliability of the approach for modeling prestressed concrete.
f t o p = F t o t a l A c + F s t r a n d . e S t
f b o t t o m = F t o t a l A c F s t r a n d . e S b
where,  f t o p , and  f b o t t o m  are the stresses at the top and the bottom fibers of the concrete, respectively.  F t o t a l  is the total prestressing force for the concrete cross-sectional area  A c F s t r a n d  is the applied prestressing force in the strand elements with an eccentricity of e from the neutral axis.  S t  and  S b  represent the section modulus.
Utilizing DR, we established a connection between the prestressed concrete stage and the transient analysis stage. The DR approach was able to limit the dynamic effect and maintain a constant stress over time. However, this method required carefully selecting the DR parameters, such as convergence tolerance and dynamic relaxation factors. As can be seen in Figure 12, without the application of dynamic relaxation, models undergoing explicit analysis often exhibit oscillations in the stresses around the desired values. However, when DR is used with an appropriate convergence tolerance, these dynamic effects are diminished, and the results show a constant stress value.

3.2. Constitutive Material Models

3.2.1. Concrete

In this study, four concrete material models (CSCM, CDPM, KCC, and Winfrith) were compared in terms of their response under impact loads using the experimental testing methods of Fujikake et al. (2009) [46] and Kelly (2011) [31].
The Continuous Surface Cap Model (CSCM MAT_159) is an elastic–plastic damage model that considers the strain rate effect [47,48] and kinematic hardening [49]. A three-dimensional yield surface is constructed using three stress invariants in the model. The material shows plastic behavior and possible damage when the stress exceeds the yield surface [50]. Damage is represented by strain softening and elastic modulus reduction [49]. Neglecting the damage parameters leads to an elastic–perfectly plastic material [51], because the damage parameter plays a crucial role in capturing material degradation and failure mechanisms. In the CSC model, the damage parameter represents the degree of material degradation due to loading, such as microcracking or matrix degradation. When the damage parameter is neglected, the model assumes that the material remains undamaged and behaves elastically until it reaches its yield stress, at which point it transitions abruptly to a fully plastic state. The CSC model allows for defining separate damage thresholds for brittle and ductile behaviors, eroding elements when the damage parameter exceeds certain values. Strain rate effects are included through a dynamic increase factor, which accounts for the increase in concrete strength with the increase in strain rates. To define the dynamic increase factor for concrete tensile strength, the model uses a modified Comite Euro-International du Beton (CEB) formula [47,48].
The Concrete Damage Plastic Model (CDPM MAT_273) is a constitutive model developed by Grassl and Jirásek [52,53] that integrates plasticity and damage models (plastic strain). We used LS-DYNA to implement the CDPM, with separate models for tension and compression damage.
The Winfrith concrete model (MAT_084) is a four-parameter model that includes a plasticity portion based on Ottosen’s failure surface [54]. This model also accounts for strain softening under tension. The model is well known for displaying crack patterns on distorted parts during analysis. Broadhouse used smeared cracking to allow for tensile cracking [55], and each element could have up to three orthogonal crack planes. The fracture energy (GF) is required to propagate a unit-area tensile crack, and the Winfrith concrete model takes strain rate effects into consideration [54]. The aggregate size determines shear capacity over the cracking surface and has no bearing on the model’s ability to account for strain rate effects [51].
Concrete Damage Rel3, also known as the Karagozian & Case (K&C MAT_072) concrete model, was developed by Malvar et al. (1997) as an advanced LS-DYNA concrete model [56]. The model under consideration was a plasticity damage-based structure with three invariants, designed to evaluate the impact of quasi-static and dynamic stresses on structural elements [57,58]. The model’s parameters were set for unconfined normal concrete with a compression strength of 45.6 MPa, and the failure surface characteristics were scaled using a scaling coefficient defined as the ratio of the user-specified  f c o  to the original model. To handle strain softening in tension, a crack band approach was applied. The model reduces mesh dependencies for tiny elements by internally scaling the softening branch of the damage function [58]. In addition, the model includes a dynamic increase factor that considers strain rate effects in dynamic load instances.

3.2.2. Steel Reinforcement

In this study, the behavior of steel rebar was modeled in LS-DYNA using the *MAT_-PLASTIC_KINEMATIC (MAT_003) model [59]. The MAT_003 model allows for the consideration of the strain rate effect. The Cowper–Symonds formula [60] was utilized to calculate the dynamic yield strength of the steel.

3.3. Contacts and Constraints

*AUTOMATIC_SURFACE_TO_SURFACE contact was used in this study for the impact analysis. The distinction of slave and master surfaces is arbitrary, despite the fact that it is totally symmetric. However, it is recommended that the slave surface be designated as the component with the faster speed of motion [42]. The slave node’s penetration force ( F p ) is calculated as a function of the penetration distance (Equation (5)).
F p = m s L t 2 · n
where  m s  is the mass of the slave, n is the master surface’s normal vector, and  L  is the penetration distance.
The main output parameter of interest in impact analysis is the impact force obtained during the contact process. As a result, the *DATABASE_NCFORC and DATABASE_BI-NARY_INTFOR interface force files should be integrated in order to record the relevant contact data. Another method for obtaining the impact force results is to use *FORCE_TRANS-DUCER_PENALTY contact, in which the surface of the concrete segment is designated as the slave, and no master is assigned.

4. FE Verification and Validation

A rigorous validation procedure was carried out to ensure the accuracy and reliability of the FE bridge model. Three experimental tests were selected from the existing literature to serve as validation benchmarks. The primary objectives of these tests are summarized in Figure 13.
The first experimental test involved the impact testing of reinforced concrete beams under varying drop heights, as performed by Fujikake et al. (2009) [46], which served as a crucial benchmark study for researchers in the field. This test was used to validate the impact response of four different material models—CSCM, CDPM, KCC, and Winfrith—alongside a sensitivity analysis of two different stiffness-based hourglass types. In the second stage of validation, we utilized a free-falling drop weight impact test, as conducted by Kelly (2011) [31], to validate the response of prestressed concrete beams under impact loading conditions. This phase not only provided further validation under impact but also confirmed the effectiveness of the selected method for applying prestressing force, ensuring a consistent stress distribution over time through the transient analysis stage. The third stage of validation involved the utilization of the impact parameters and material models validated in the initial stages to construct a bridge model. This bridge model was then validated against laboratory bridge tests conducted by the Iowa Department of Transportation, with a focus on validating the global response of the bridge, including the deck, diaphragms, and abutments. This comprehensive validation approach ensured the accuracy and reliability of the developed FE model, increasing confidence in its utility for future analysis and further investigations.

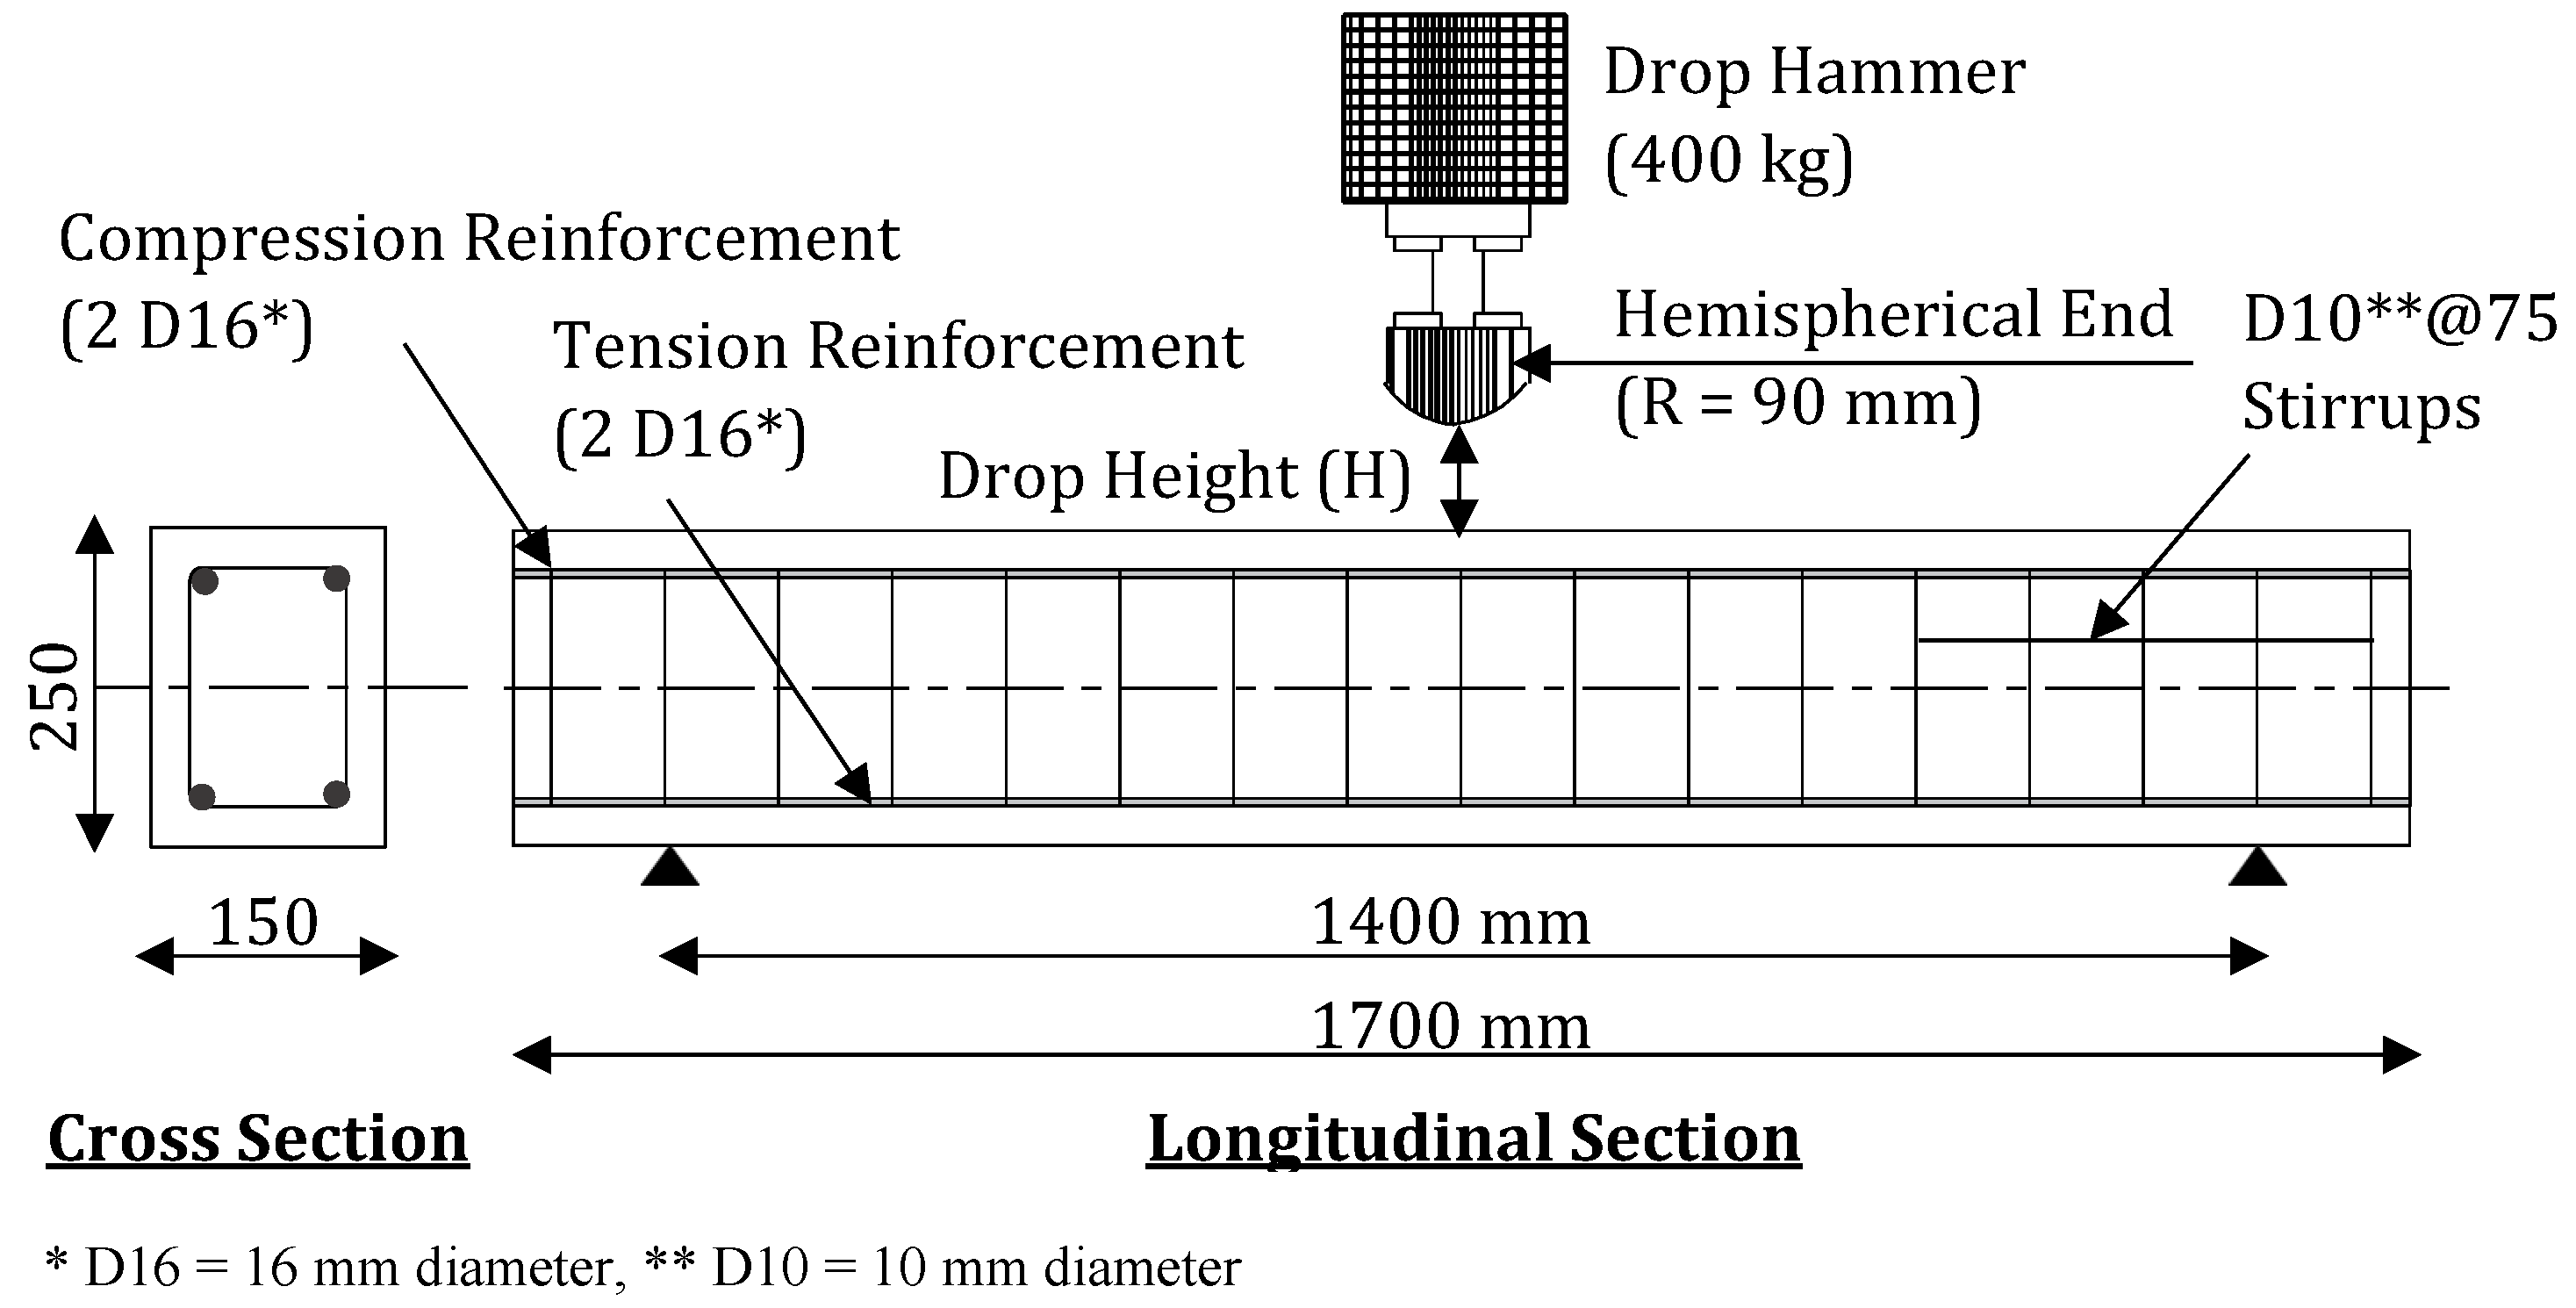
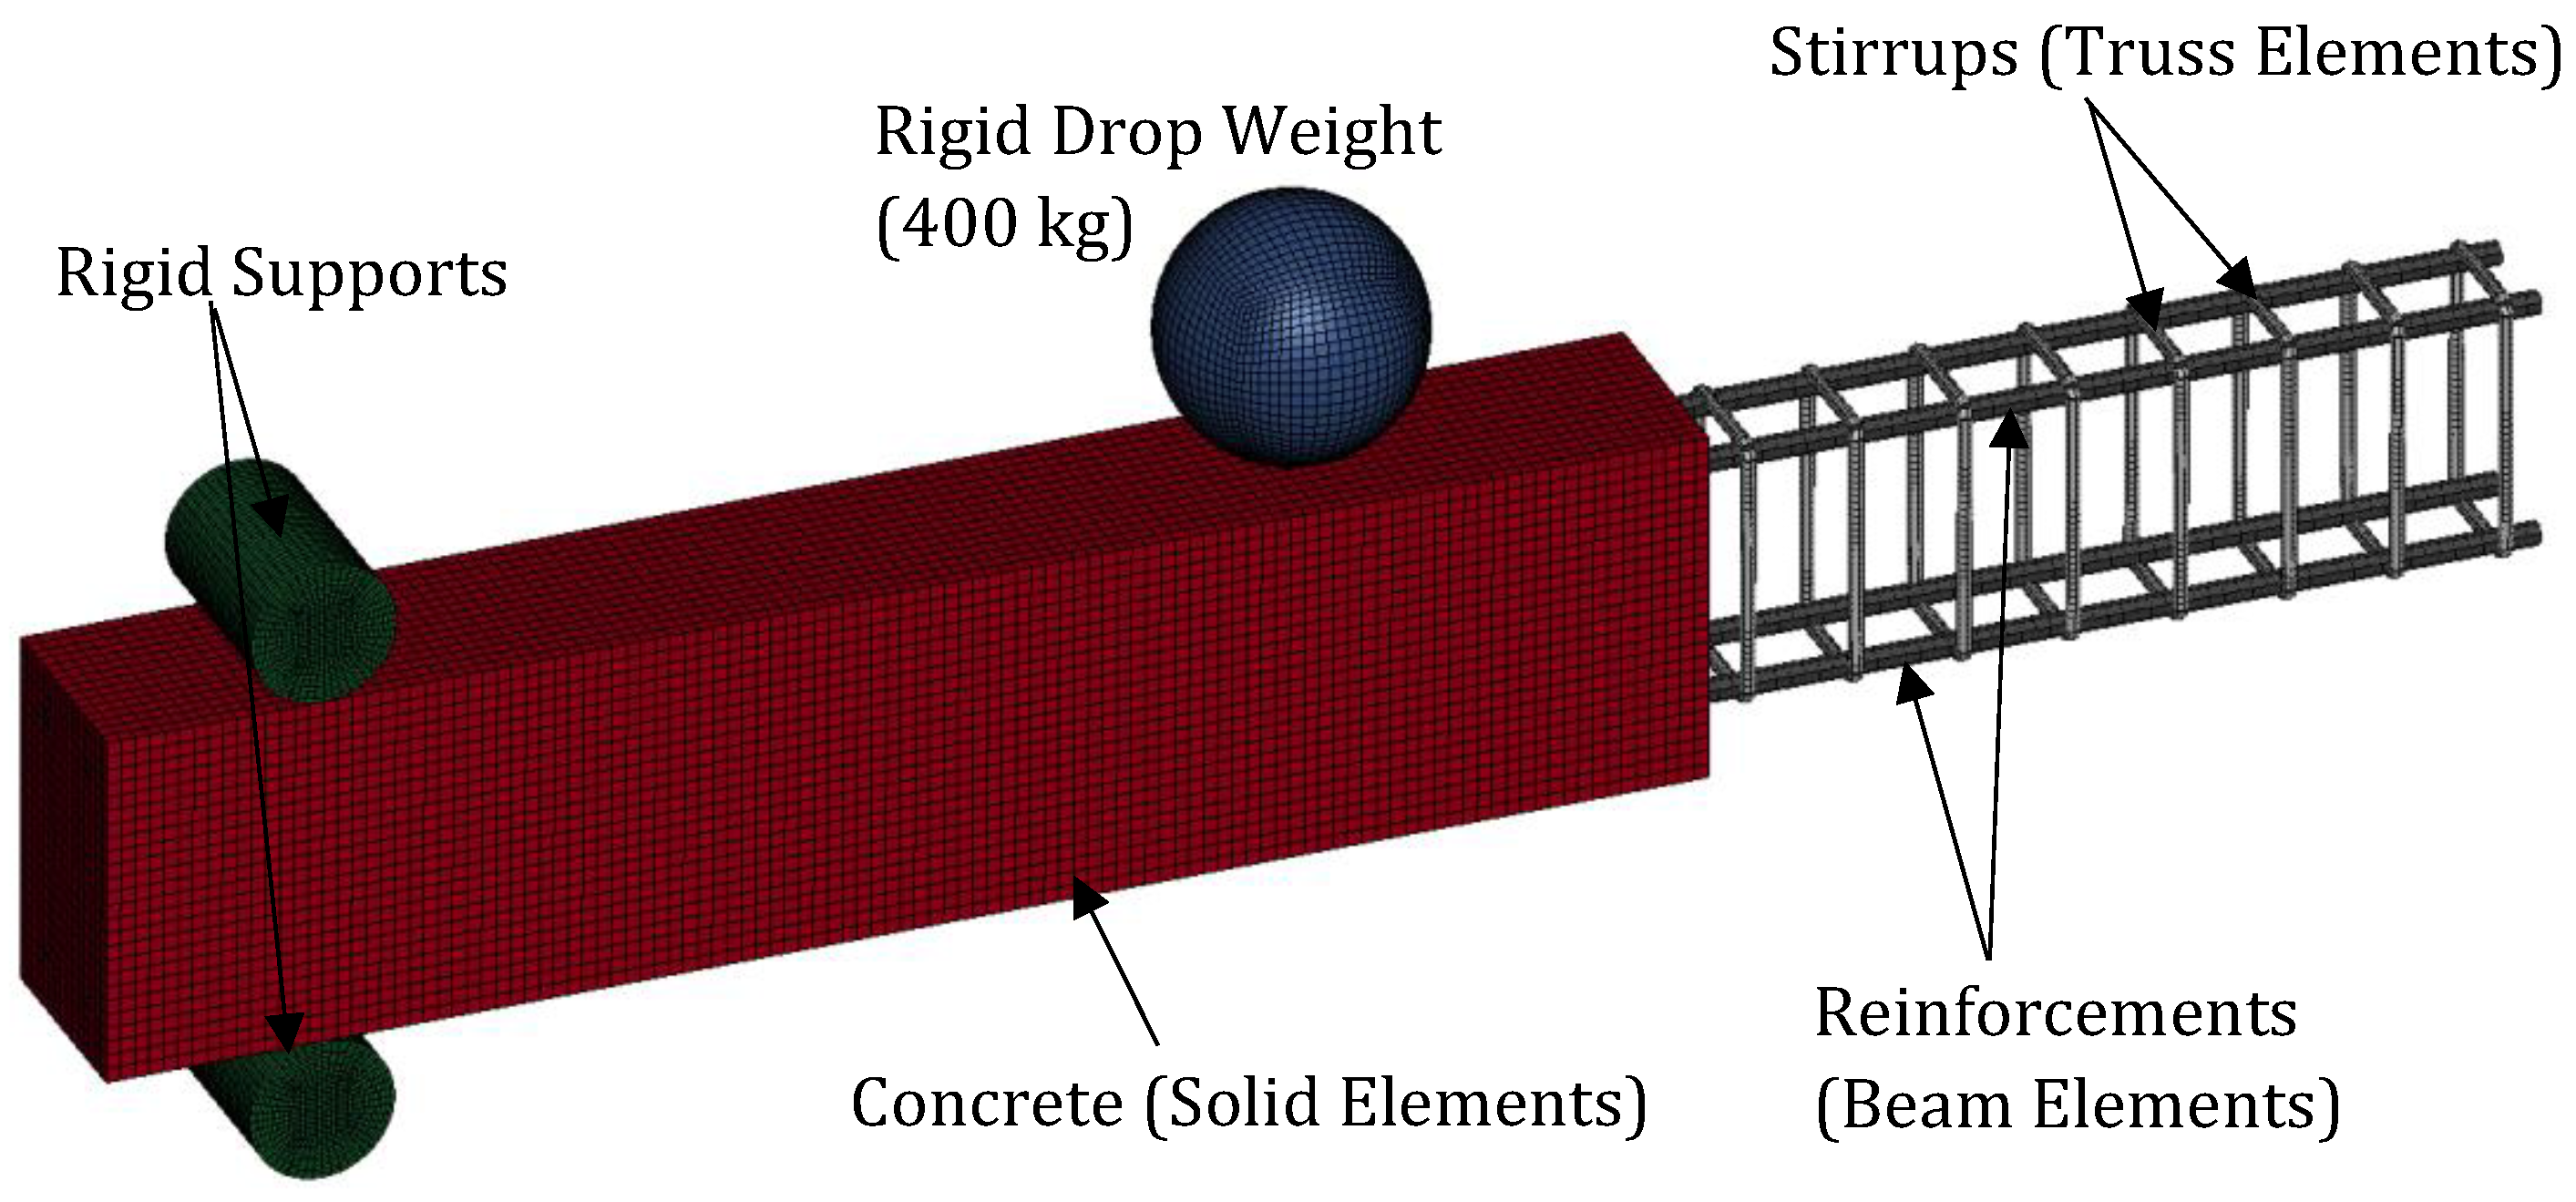
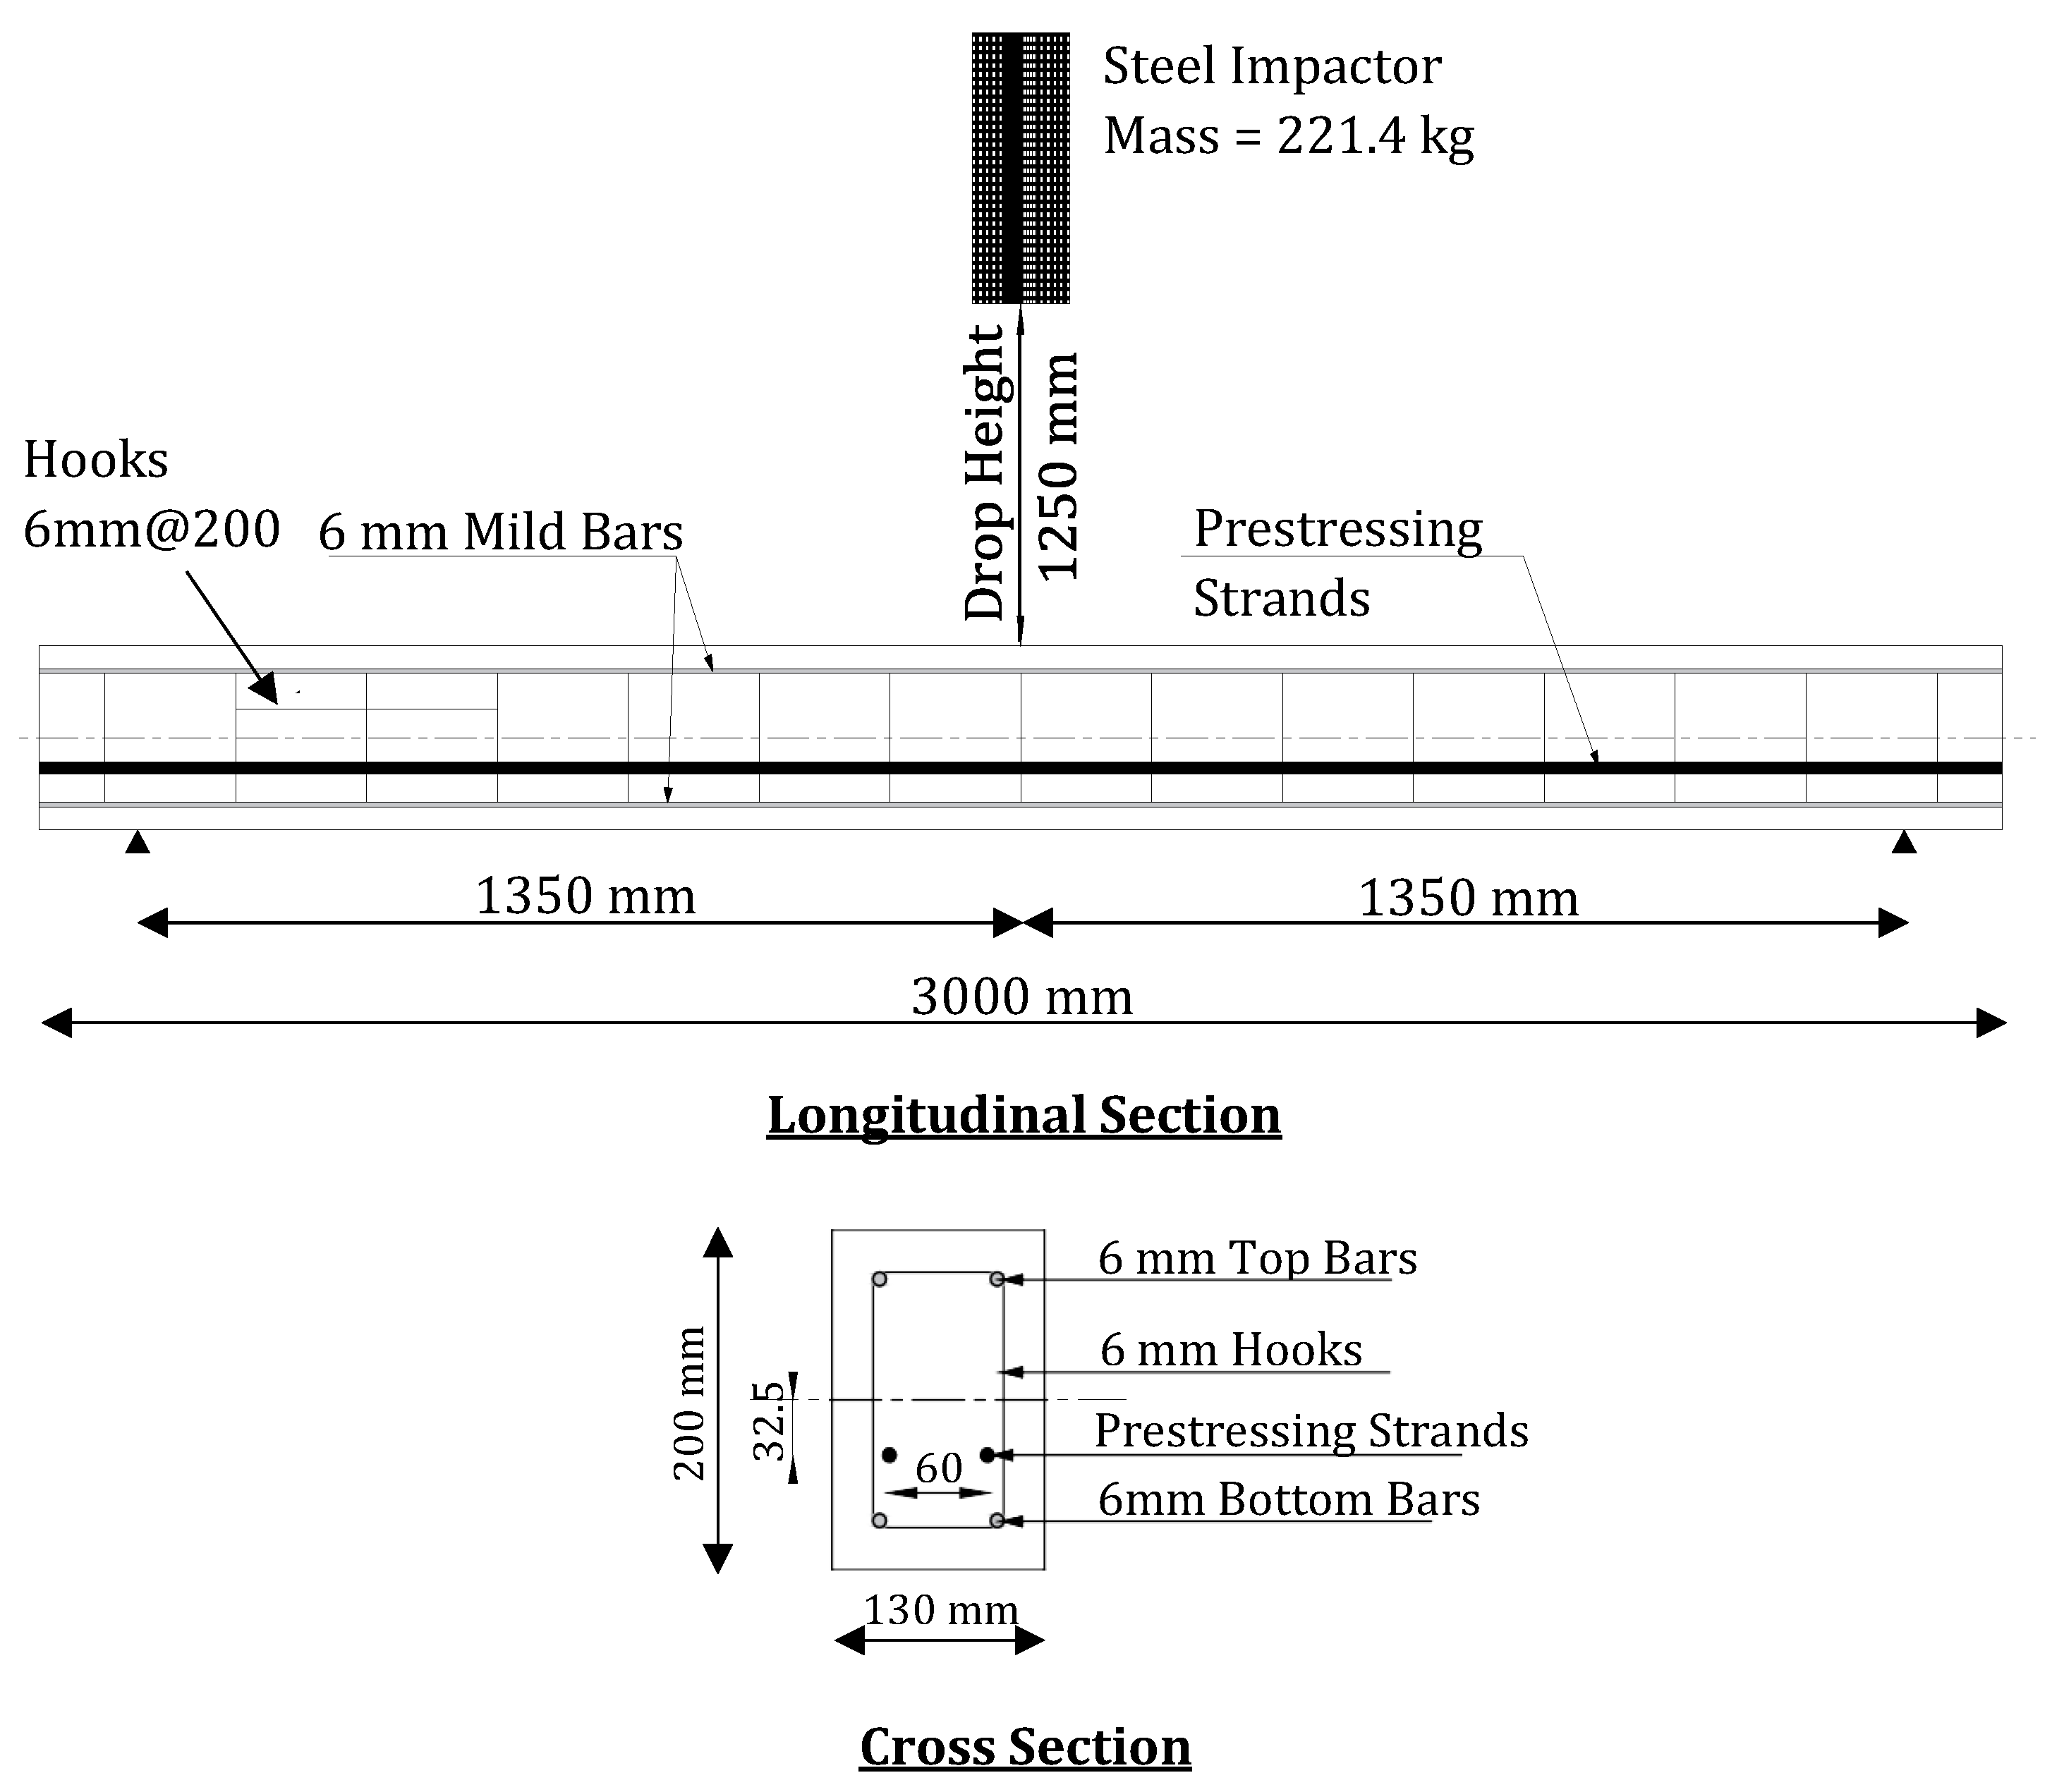
4.1. Impact Testing of a Reinforced Concrete Beam

4.1.1. Experimental Data

In Fujikake et al.’s 2009 study [46], the experimental work involved performing a drop hammer impact test on reinforced concrete (RC) beams to investigate the impact response under varying drop heights. As shown in Figure 14, the RC beams had cross-sectional dimensions of 250 mm × 150 mm. All beams had a span of 1700 mm, with longitudinal deformed bar reinforcements 16 mm in diameter and a yield strength of 426 MPa. The stirrups were 10 mm in size with 75 mm spacing and a yield strength of 295 MPa. All specimens achieved a concrete compressive strength of 42 MPa. A 400 kg drop hammer was released from two heights, 0.3 m and 1.2 m, and the results were recorded for analysis.
In this paper, we developed two different FE beam models using two drop heights: 0.3 m and 1.2 m. The impact force, deflection, and damage patterns obtained from the FE models were compared to the experimental results to evaluate the response of different material models under impact load. A 3D non-linear FE model of the RC beams was developed using LS-DYNA, as shown in Figure 15. The concrete beams and the impactor were modeled using hexahedral elements with one integration point, a maximum mesh size of 10 mm, and an aspect ratio of 1. The impacting hammer was replaced with a rigid sphere of the same weight (400 kg) and radius (90 mm) as the original hammer to simplify the modeling process and improve computational efficiency. *SURFACE_TO_SURFACE contact was used with a friction coefficient of 0.3. A preliminary step to determine the impact velocity of the striker was carried out, taking into account the impact of the drop height and gravitational energy. The impactor speed was then included using the *BOUNDARY_PRESCRIPED_MOTION_RIGID or *INITIAL_VELOCITY_GENERATION keyword.

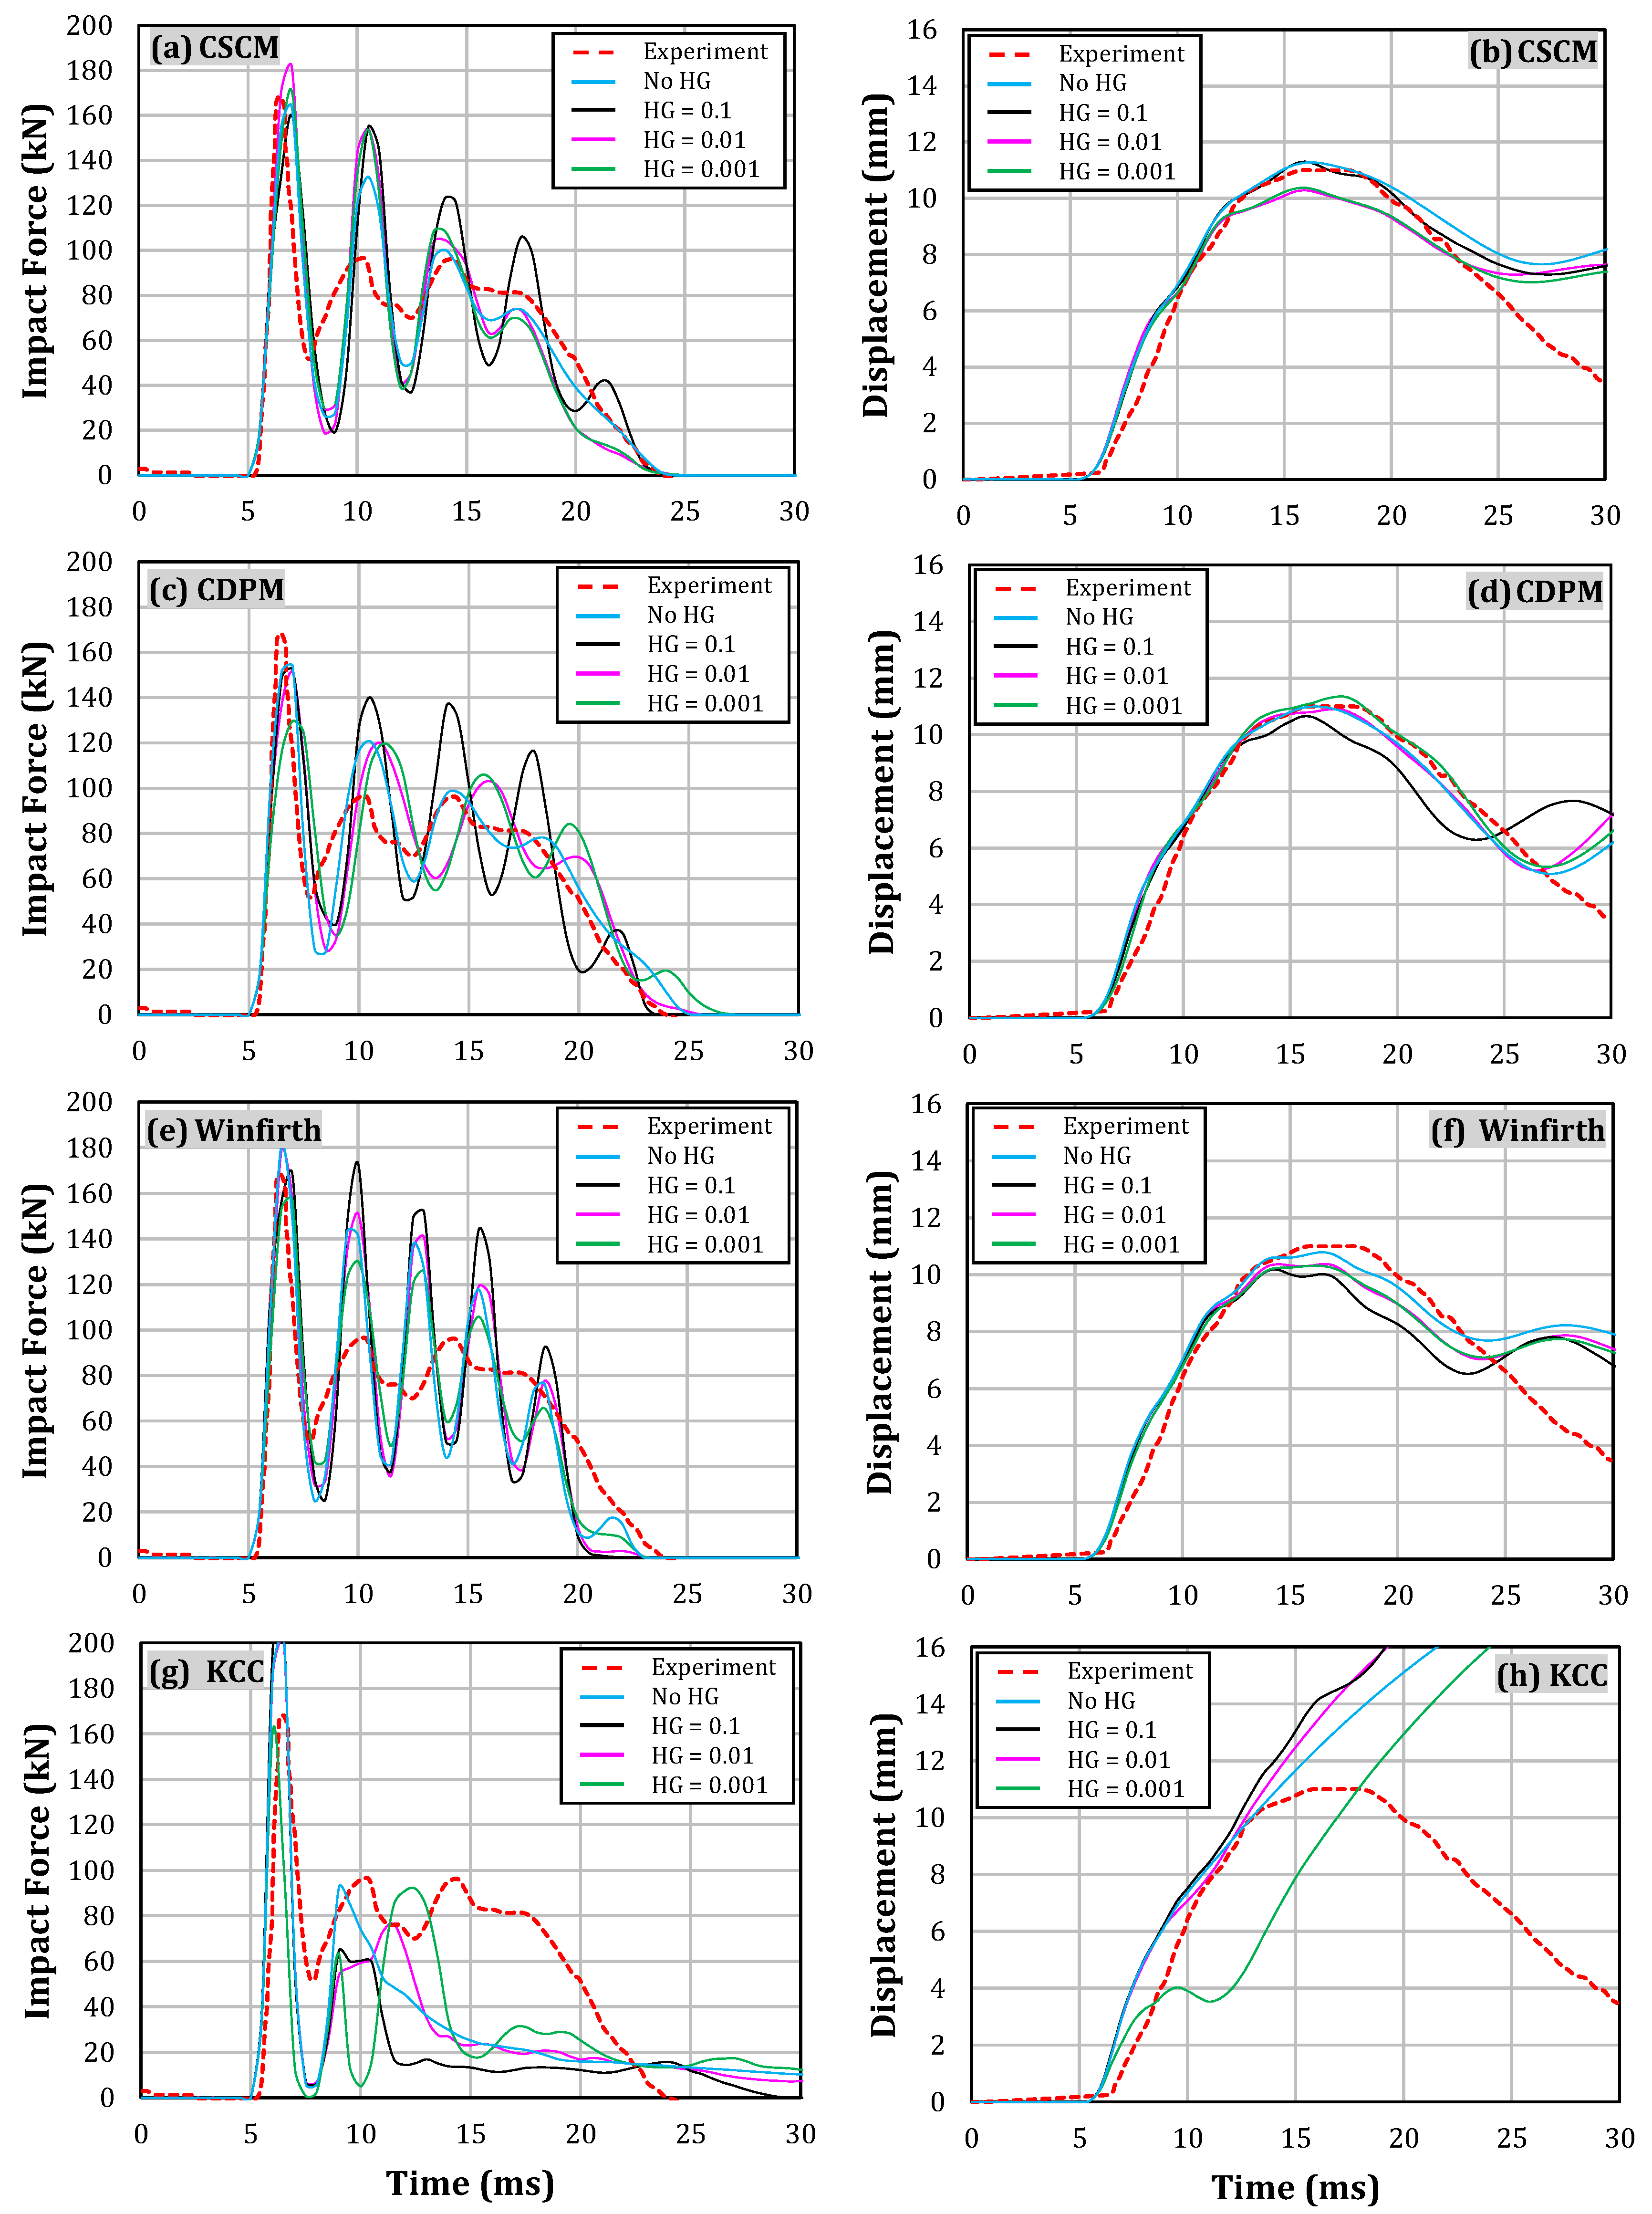
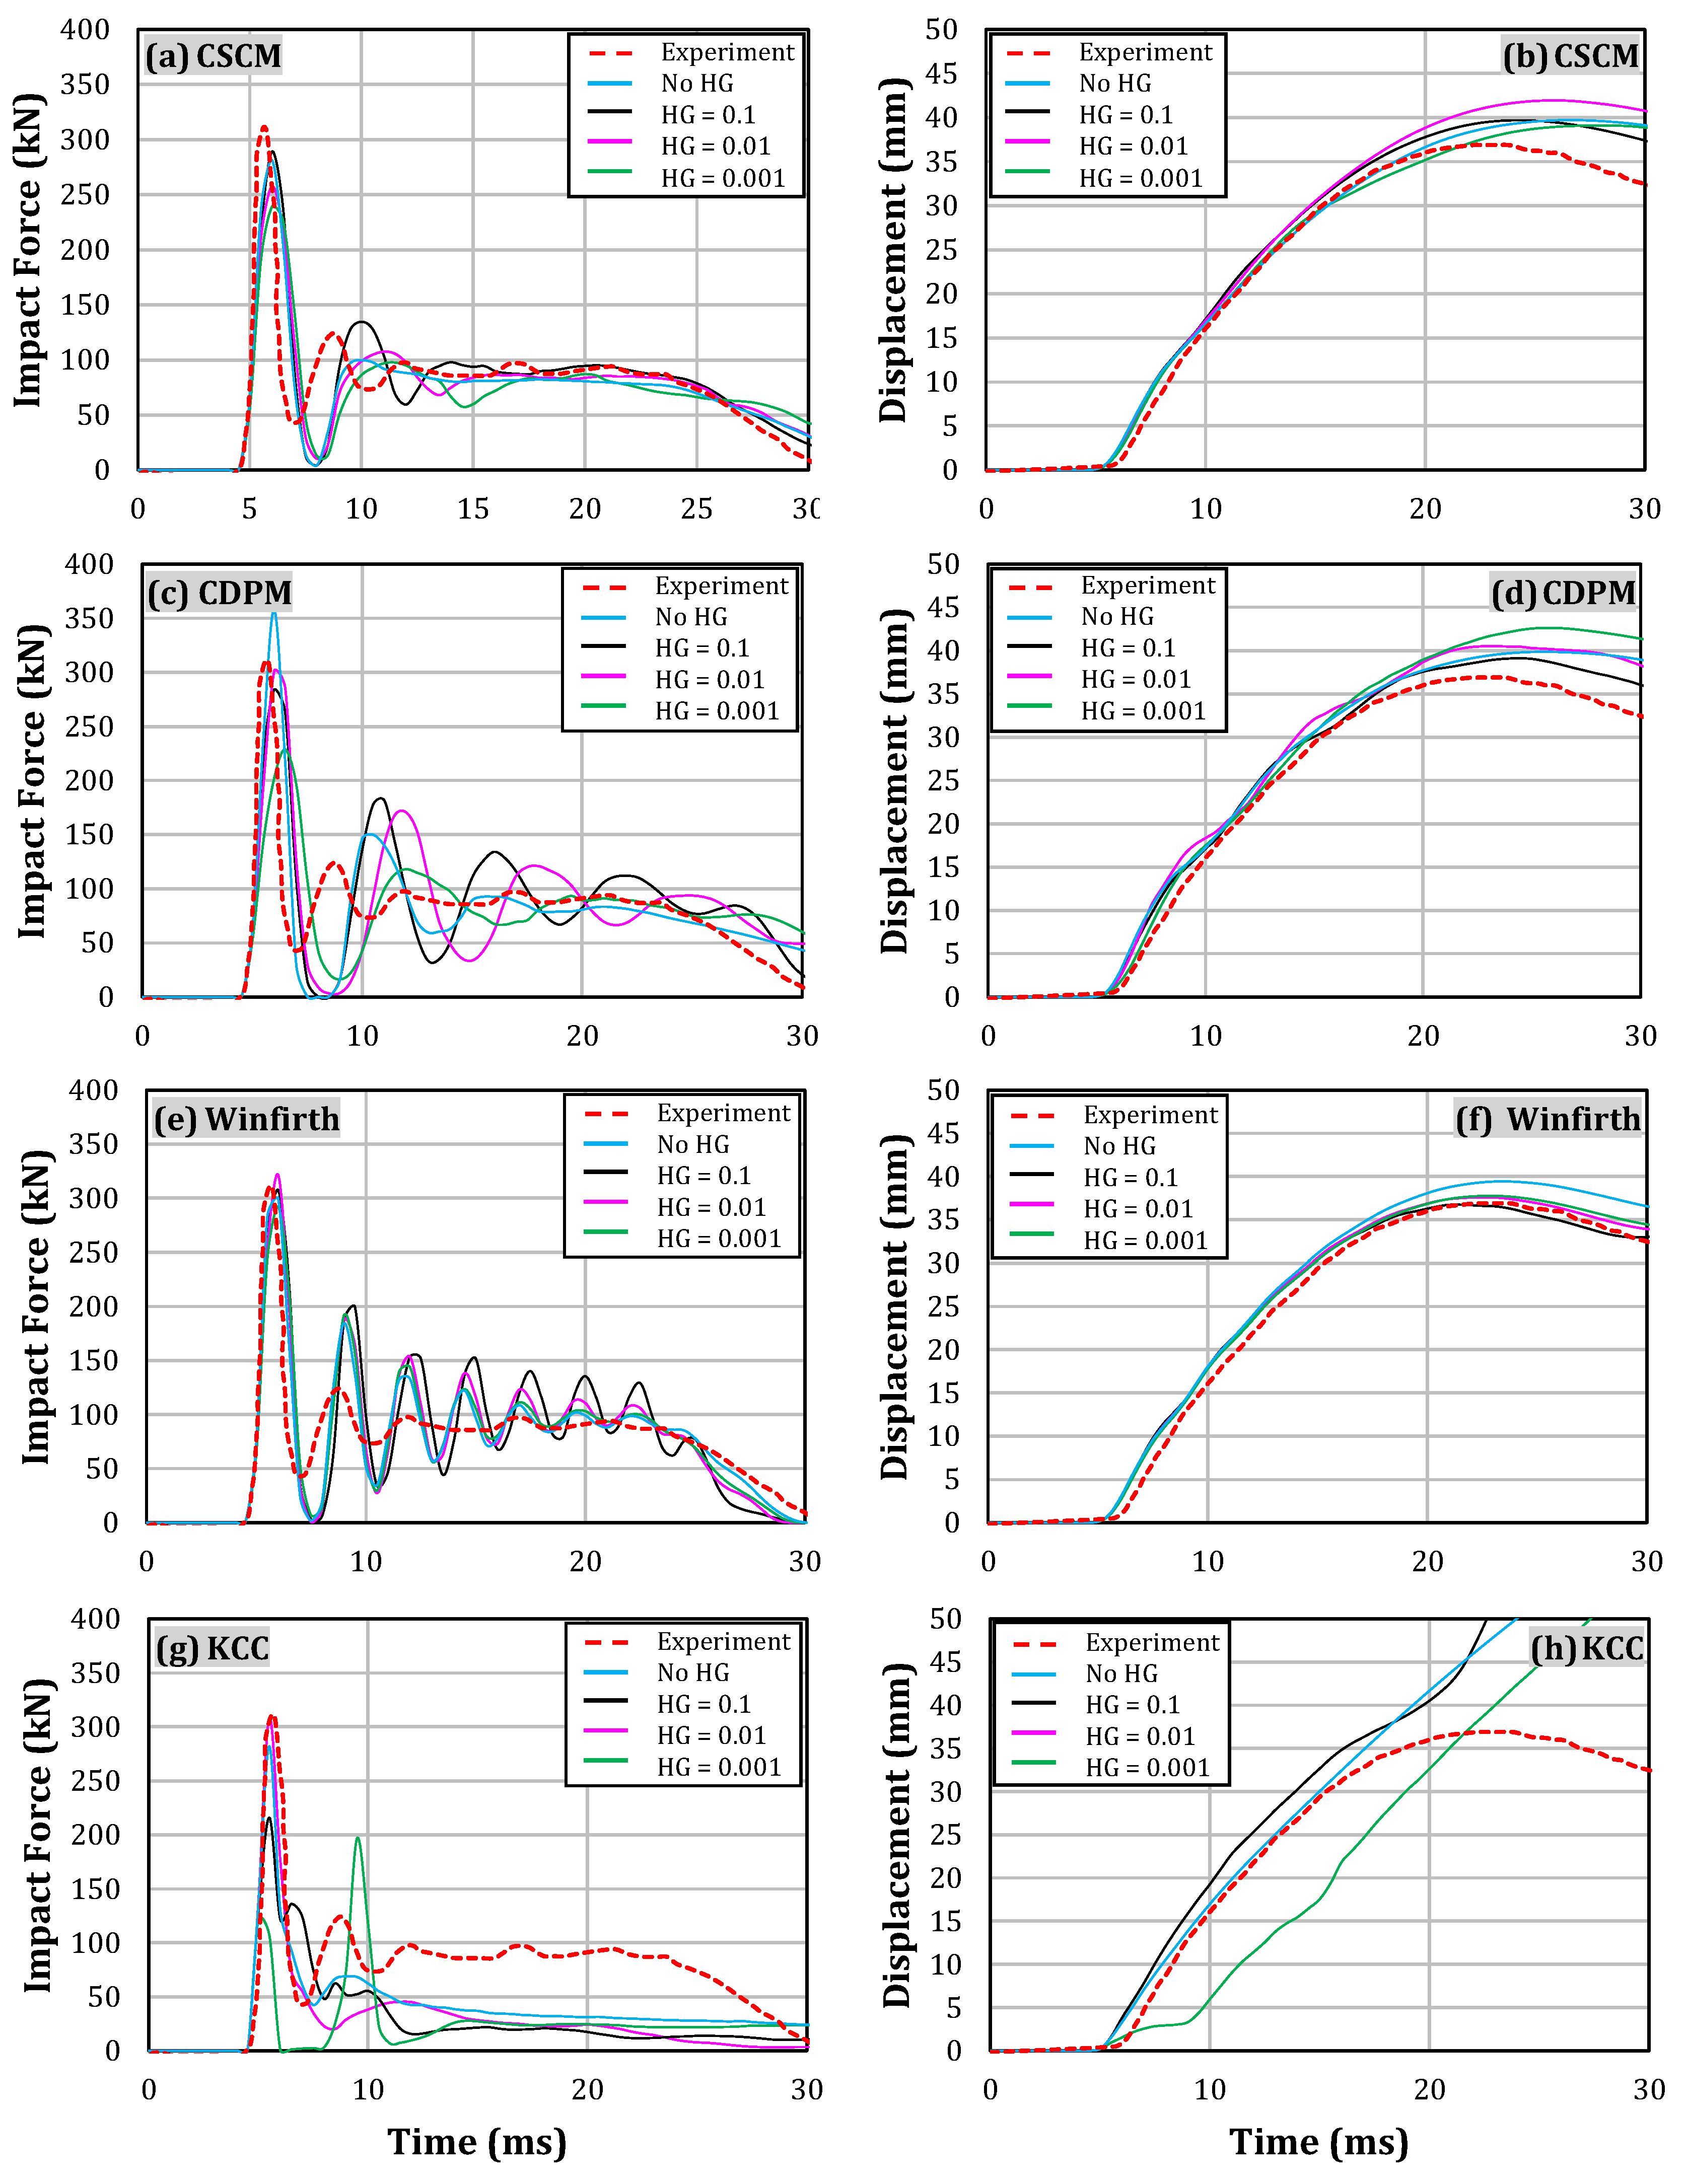
4.1.2. Impact Force and Displacement

This study investigated the impact response of four different concrete material models: the CSCM, CDPM, KCC, and Winfrith models. When using under-integrated finite elements in computational mechanics, non-physical deformation modes known as hourglass modes (HG) can arise. The use of HG will not only alleviate computational costs but also contribute to a reduction in the overall model’s energy, consequently leading to a more flexible FE model. However, it is critical to carefully select an appropriate hourglass coefficient to mitigate the potentially harmful consequences of these modes that negatively affect the accuracy of the results. This allows for the effective management of the associated hourglass energy, lowering the risk of numerical instability and other negative effects. This study investigated two different forms of hourglasses type 4, recommended for low-velocity impact [41], and HG type 6 [61]. The objective was to evaluate the sensitivity of the material models using three different hourglass coefficients: 0.10, 0.01, and 0.001.
Figure 16 and Figure 17 show the impact force and displacement time history of RC beam models with HG type 6 and drop heights of 0.3 m and 1.2 m, respectively. The present study included the sensitivity of the CSCM to HG in terms of impact force and displacement. The results at a 0.3 m drop height are presented in Figure 16a,b. With an HG coefficient of 0.001, the FE model accurately predicted the initial peak impact force with an error of less than 2%. However, the maximum displacement was underestimated by up to 9% with the same coefficient. Similarly, Figure 17a,b show the corresponding results for the 1.2 m drop height. It can be seen that an HG coefficient of 0.1 produced the closest results to the experimental data. However, it underestimated the first peak impact by 7% and overestimated the maximum displacement by 7%.
As can be seen from Figure 16 and Figure 17, the HG 0.01 hourglass coefficient produced the most accurate results for the CDPM, with errors of less than 10% when compared to experimental data. Similarly, with an HG of 0.01, the Winfrith model performed best, predicting the impact force with an error of less than 6%. These results indicate that a HG of 0.01 is a reliable solution for precisely modeling impact events using the CDPM and Winfrith model. The KCC model produced the most accurate results for the 0.3 m drop height with an HG of 0.001 and for the 1.2 m with an HG of 0.1; however, the model produced exaggerated displacement results.
The findings indicate that all material models could produce results close to those of the experiment when using the appropriate HG coefficient. However, in order to establish a reliable model, it was critical to identify that with the least sensitivity to changes in the HG coefficient. When comparing the two hourglass types used in this study, HG type 4 and HG type 6, HG type 4 showed the closest results to the experimental data (Figure 18 and Figure 19). It can also be seen from Figure 18a and Figure 19a that the CSCM and Winfrith model were the least sensitive to the hourglass, with the variation between the maximum and minimum predicted values not exceeding 15%. On the other hand, similar to the findings presented in [41], both the KCC model and CDPM were shown to be very sensitive to the HG coefficients, with deviations of up to 36% and 40%, respectively.
In conclusion, selecting the optimal hourglass coefficient is not always obvious and requires a sensitivity analysis adjusted to the specific model conditions. It is critical to consider the impact energy and potential consequences of selecting an inappropriate coefficient. Using an excessively low coefficient, for example, may result in obvious hourglass forms of deformation. Using an excessively high coefficient, on the other hand, may result in overly stiff behavior that does not truly reflect the material response. Therefore, a careful sensitivity analysis of the specific impact scenario is essential to determine the optimal hourglass coefficient and ensure accurate and reliable simulation results.

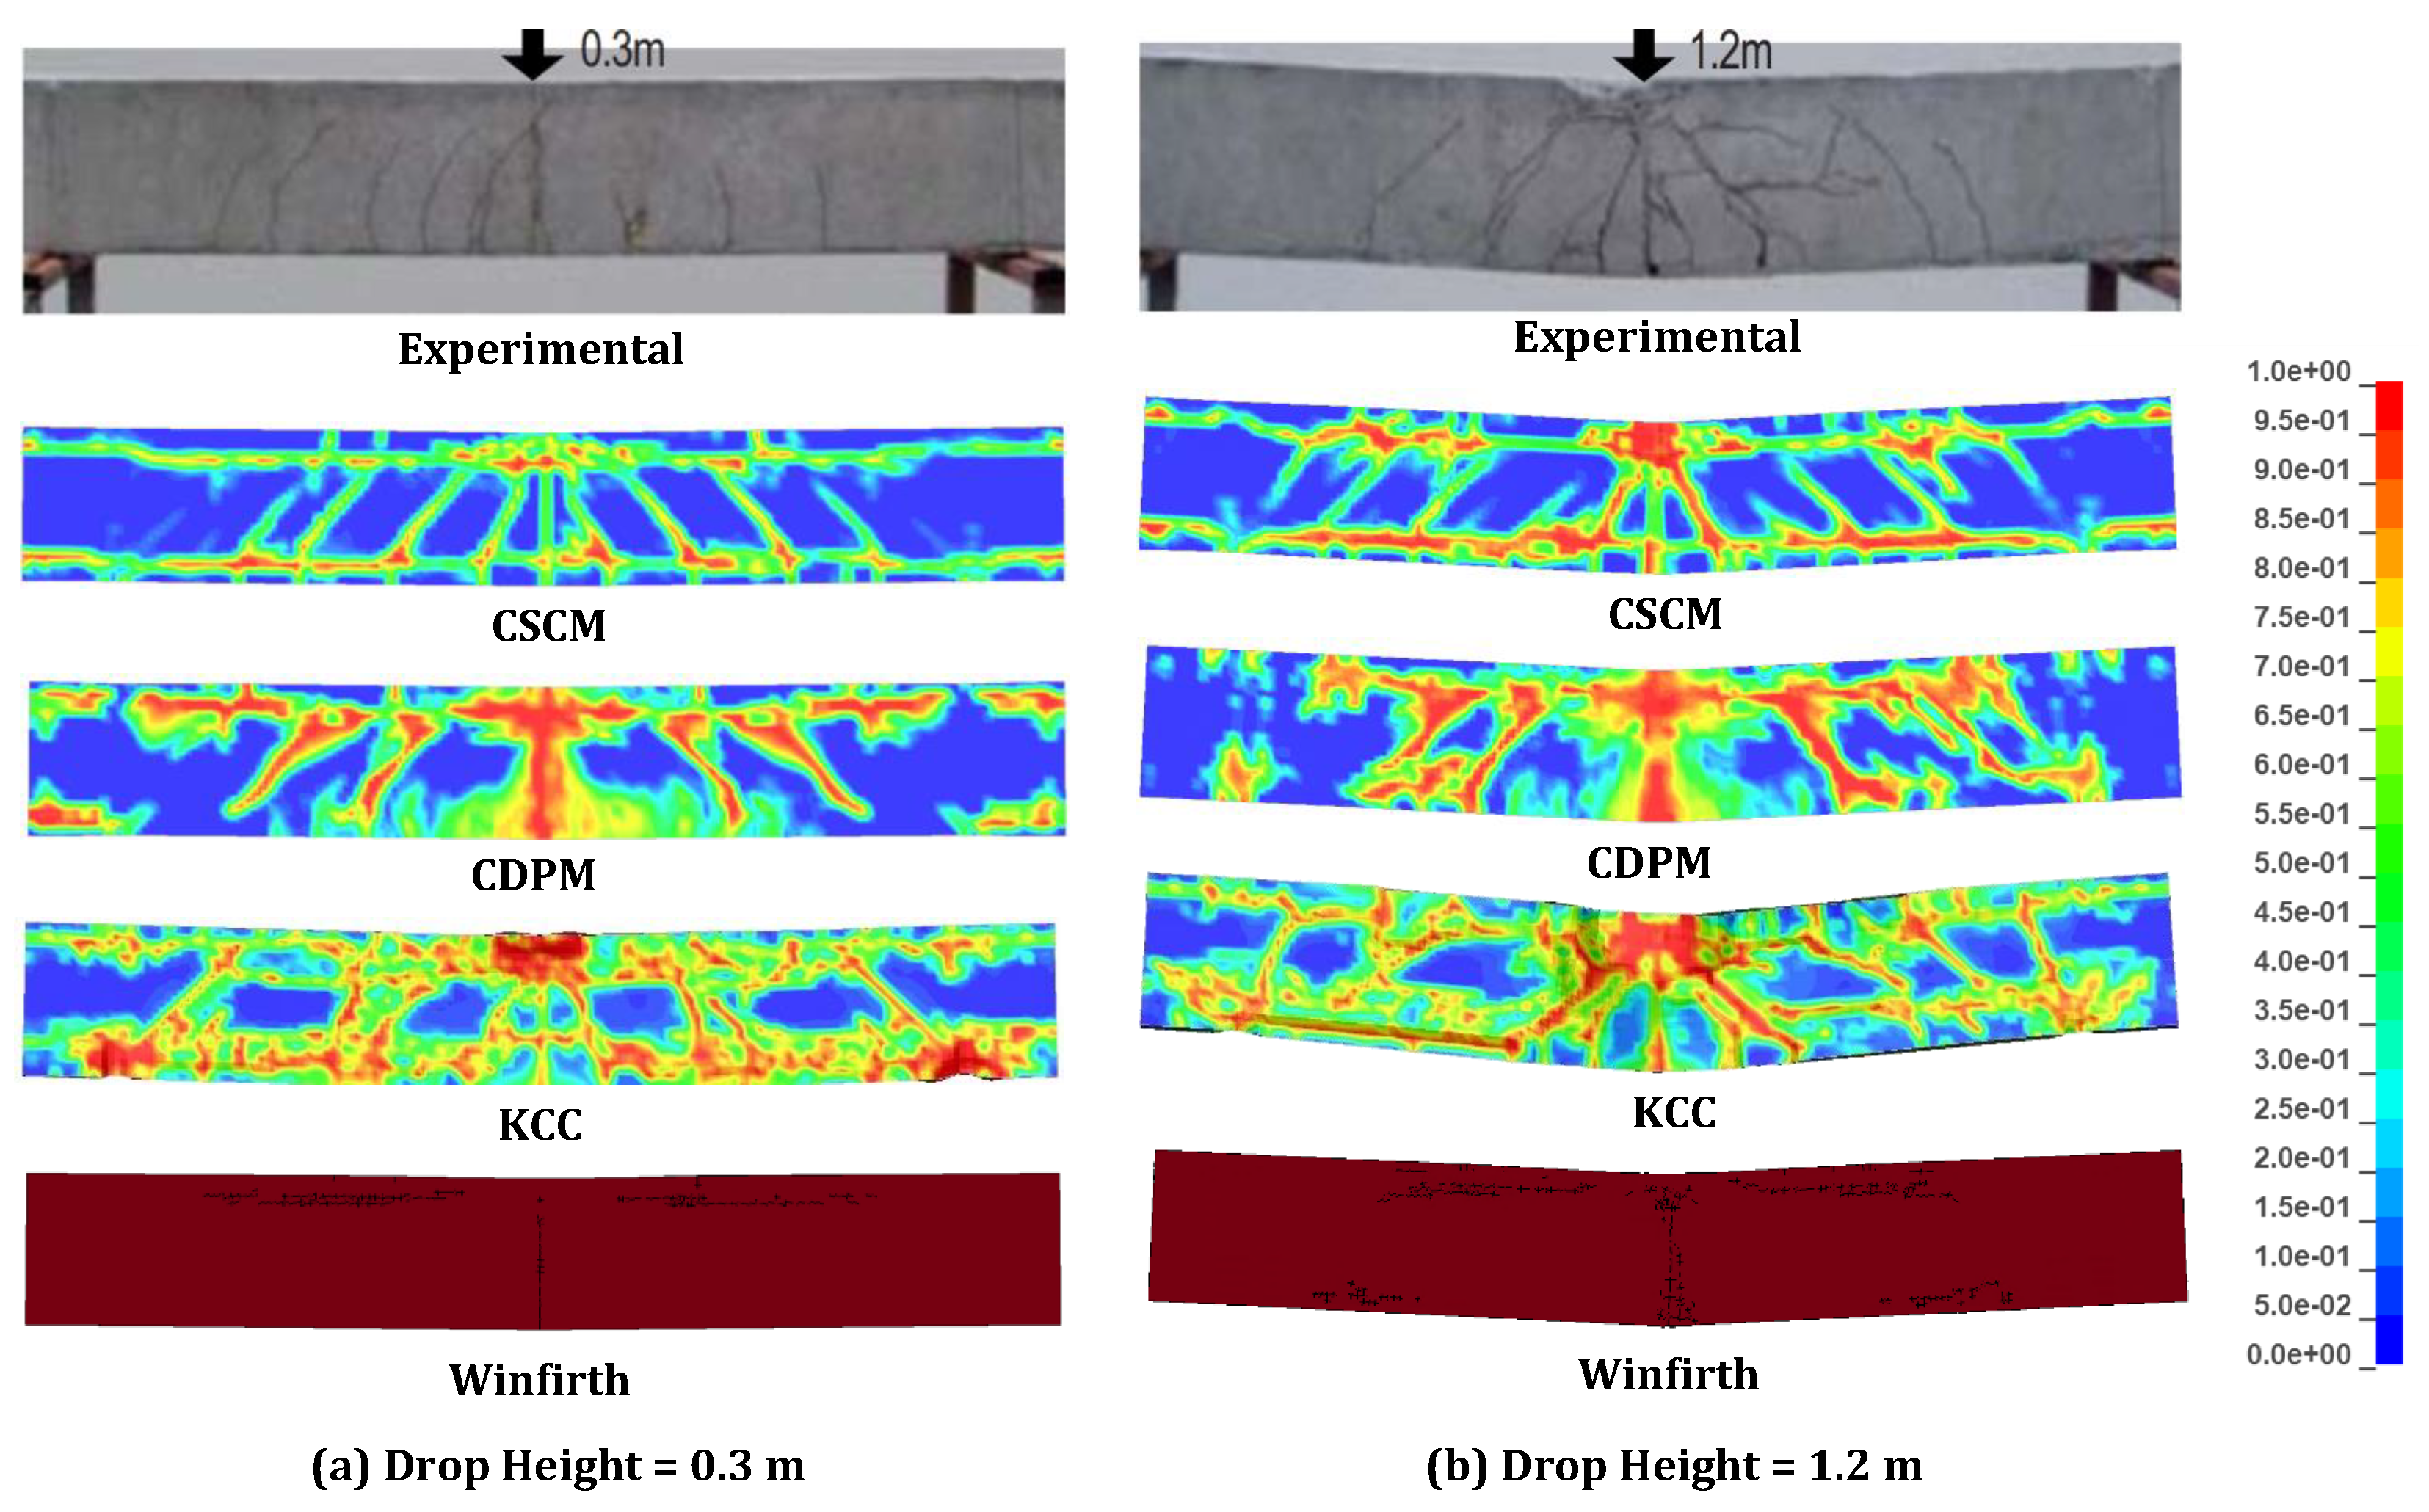
4.1.3. Damage Pattern

Predicting the level of damage caused by the impact is an essential part of impact analysis. Because of the variances that occur when formulating mathematical equations, each model has unique possibilities for providing damage patterns. Figure 20 shows the different damage patterns experienced by the different material models. It can be seen that the CSCM showed the pattern most closely correlated with the experimental work, followed by the CDPM and KCC model. The CSCM predicted both vertical and diagonal shear cracks in the beam. The CDPM overestimated the extent of the damage but still provided a reasonably close prediction of the observed damage. The KCC model predicted close damage, especially for the drop height of 1.2 m. The Winfrith model has the unique ability to map cracks in solid elements, but it underestimated the extent of the cracks. In general, of the four models evaluated, the CSCM yielded the most accurate prediction of the crack pattern in the RC beam models under study.

4.2. Impact Testing of a Prestressed Concrete Beam

4.2.1. Experimental Data

In Kelly’s 2011 study [31], the experimental work involved performing a drop weight impact test on prestressed concrete (PC) beams. The experimental setup is shown in Figure 21, with the test beam measuring 3000 mm in length, 130 mm in width, and 200 mm in depth and featuring a concrete compressive strength of 40 MPa. Two steel prestressing strands with a cross-sectional area of 150  mm 2  and a grade of 1860 MPa were utilized, with a 32.5 mm eccentricity, resulting in a prestressing force of 390 kN. There were two primary reinforcements with a 6 mm diameter, as shown in Figure 21. The stirrup size was 6 mm, with 200 mm spacing. The mid-span of the beam was immediately impacted by a 221.4 kg solid steel impactor dropped from a height of 1.25 m.
The FEA of the prestressed concrete beam, similar to the beam model discussed in Section 4.1, also utilized constant-stress eight-node solid elements with a maximum mesh size of 10 mm and an aspect ratio of 1. The temperature-induced shrinkage method described in Section 3.1.1 was employed to model the prestressing strands. A prestressing force of 390 kN was applied with a temperature drop of 65  ° C and a value of  α = 1 × 10 4 / °C. Figure 22 shows the FE model of the prestressed beam.

4.2.2. Impact Force and Strain Rate Effect

The impact response of the prestressed concrete beam under impact load is addressed in this section. The study involved comparing the four different material models with the experimental results and investigating the effect of activating the strain flag on the material models (Figure 23). The CSCM_CONCRETE model was found to have the highest accuracy, with an error of less than 8% in predicting the peak impact force. On the other hand, the CDPM underestimated the peak impact force by 32%, while the Winfrith model underestimated it by 19%. The KCC model, on the other hand, overestimated the peak impact force by 16%. Overall, the findings highlight the importance of choosing an appropriate material model and accounting for the strain rate effect when analyzing the impact response of prestressed concrete beams. After analyzing both RC beam and prestressed concrete beam models, it was found that the CSCM demonstrated substantial accuracy in predicting the peak impact force and the deflection, low sensitivity to hourglass effects, and accurate predictions of damage patterns. Therefore, the CSCM was selected for the large-scale bridge model.

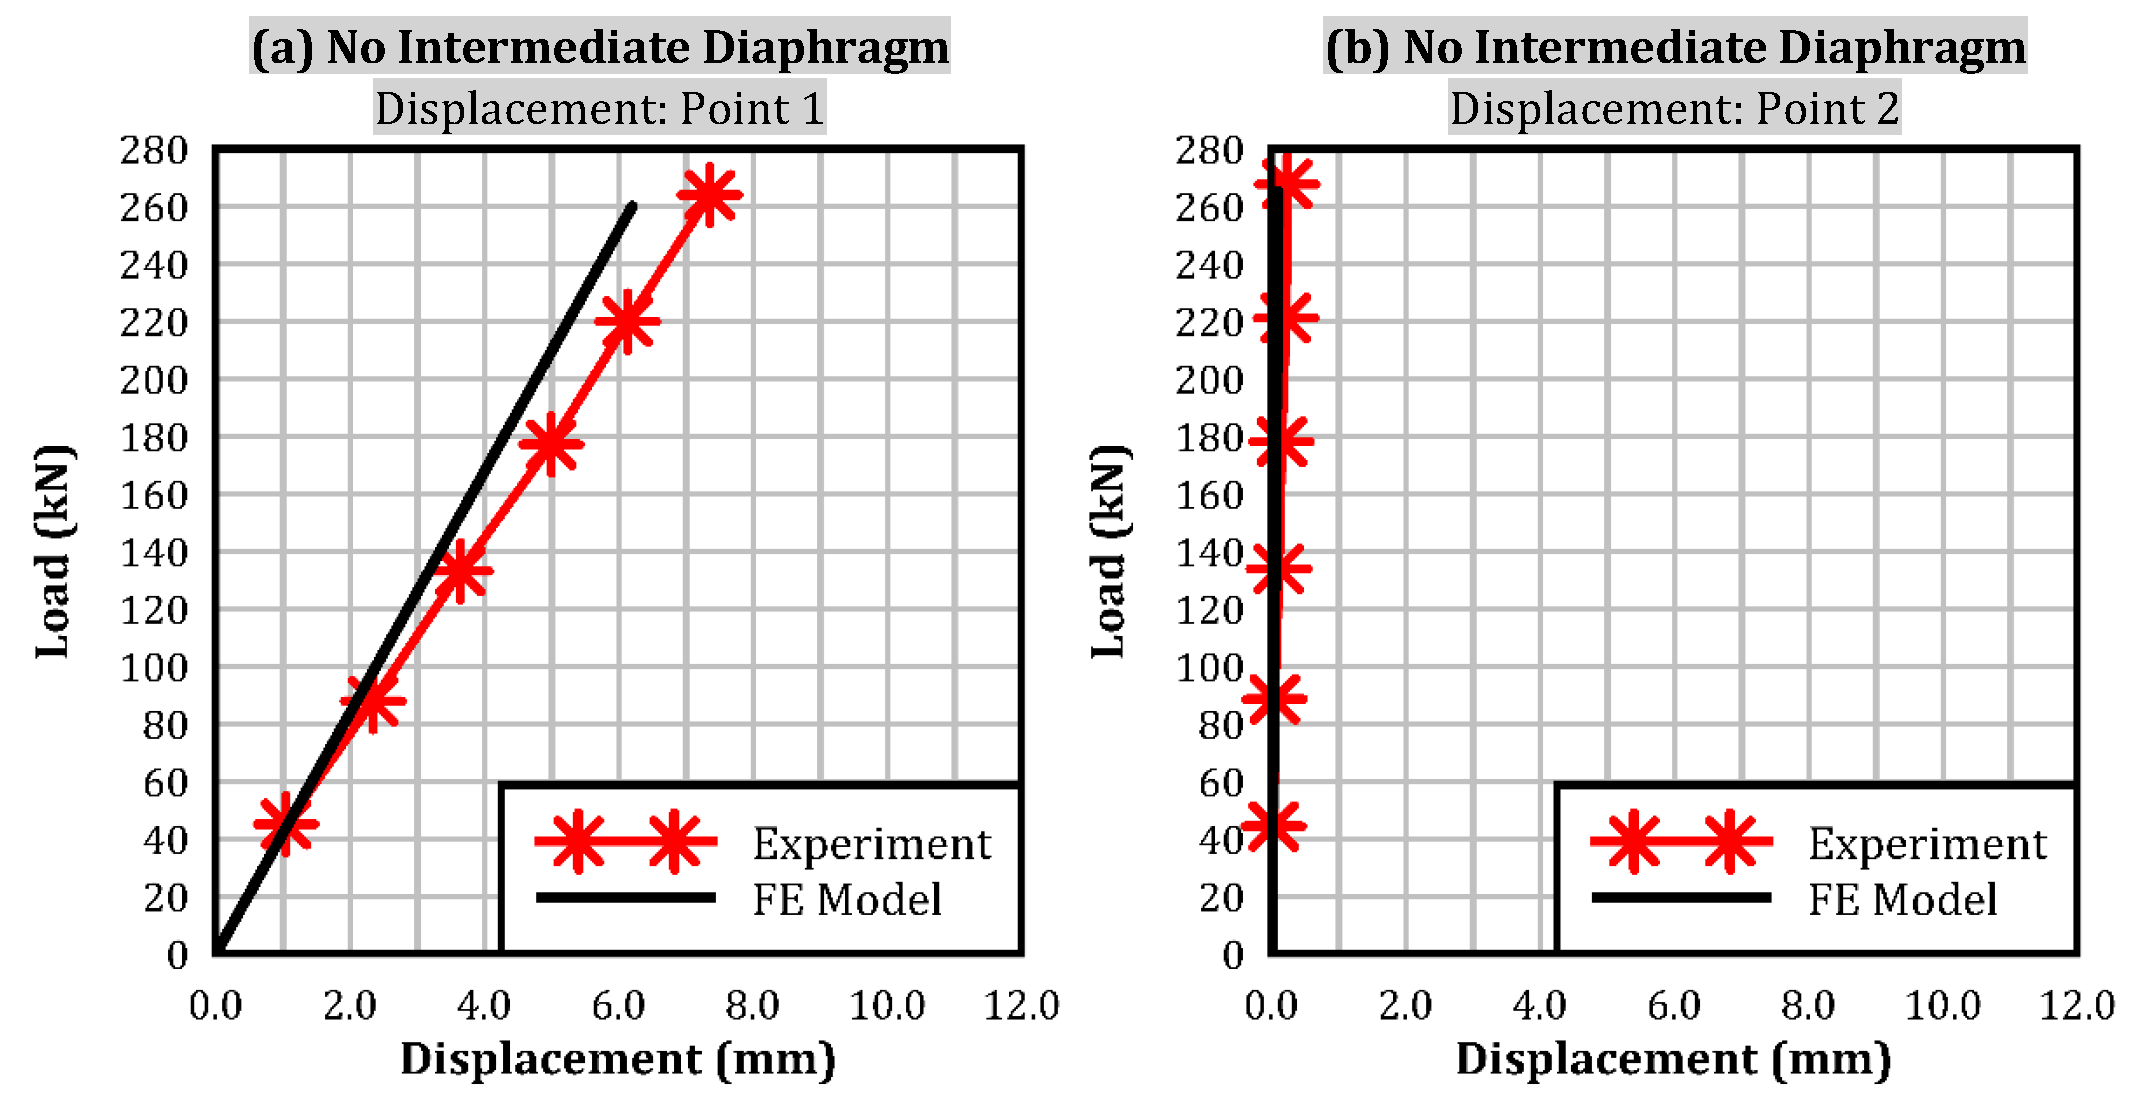
4.3. Static Testing of a Prestressed Girder Bridge

4.3.1. Experimental Data

The present study utilized the same parameters that were validated through the reinforced concrete beam and prestressed concrete beam analyses illustrated in Section 4.1 and Section 4.2 to model a large-scale prestressed girder bridge model. The laboratory bridge test conducted by the Iowa Department of Transportation [62,63,64,65] was used to validate the global response of the FE bridge model.
The Iowa experimental bridge was made up of three prestressed concrete (PC) girders, which were spaced at 1.8 m intervals on the center. The girders utilized in this study were Iowa DOT LXA38 girders; see Figure 24. The three girders supported a 102 mm thick reinforced concrete deck that was 12.3 m long and 5.5 m wide, with a 0.9 m wide overhang measured from the center of each exterior girder; see Figure 25. A reinforced concrete abutment measuring 1 m in depth and 0.5 m in breadth supported the ends of the PC girders at each end of the bridge model, with the abutments resting on the laboratory floor. The distance between the bridge abutments was 11.6 m.
At each end of the PC girders, a 200 mm thick reinforced concrete end diaphragm was cast to provide further support and stability to the bridge. The Iowa A38 girder reinforcement details are shown in Figure 24. Three intermediate diaphragm cases were studied in [65]: reinforced concrete, steel, and steel X-braced diaphragms. This experimental bridge model provided a realistic representation of a typical bridge structure and allowed for the accurate analysis of the overall bridge response under impact loads.
The FE model of the bridge without intermediate diaphragms is shown in Figure 26. The deck, girders, end diaphragms, and abutments were all modeled using hexahedral SOLID elements with a maximum mesh size of 25.4 mm and an aspect ratio of 1. BEAM elements were used to model the strands and rebar reinforcement, while TRUSS elements were used to represent the girder hooks. Two intermediate diaphragm cases were selected in our model validation, the RC diaphragm and steel channel diaphragms, which were modeled using SHELL elements.
The concrete was modeled using the CSCM with a compressive strength similar to that of the experimental study in [62]. The girder was made of concrete with a compressive strength of 40 MPa, while the concrete deck used concrete with a compressive strength of 32 MPa. The end diaphragms were made of concrete with a compressive strength of 35 MPa. The *MAT_PLASTIC_KINEMATIC model was used to model the prestressing strands and reinforcement rebars. The girder and deck were reinforced using ASTM A615 grade 40 No.5 bars with a yield strength of 276 MPa. The low-relaxation prestressing strands, grade 270, measuring 15.2 mm, had a yield strength of 1860 MPa and a modulus of elasticity of 196 GPa. When intermediate diaphragms were used, reinforced concrete diaphragms were modeled using the CSCM, while steel channel intermediate diaphragms were modeled using PLASTIC KINEMATIC. The temperature-induced shrinkage method, described in Section 3.1.1, was used to produce an equivalent axial force of 1823.77 kN in each girder.
The FE model assumed shared nodes between the abutment and end diaphragm to allow monolithic behavior, given the presence of reinforcing bars. The connections between all the concrete elements were similarly idealized using shared nodes. Regarding boundary conditions, the two 0.5 m thick abutments rested on the laboratory floor. As a result, the abutment was constrained regarding vertical movement. Only one end of the finite element model was given lateral supports, while the other was modeled as a roller. An illustration of the boundary conditions and constraints is shown in Figure 27.
In the static experimental testing in [62], vertical and horizontal loads were applied at several points on the bridge, and the corresponding deflection was recorded. In this study, to validate the overall response of the bridge, the same vertical and horizontal loads were used at the mid-span of the outside girder (referred to as point 1), and the corresponding displacements at point 1 and the mid-span of the interior girder (referred to as point 2) were measured. A hydraulic jack was used in the experiment to apply the vertical load, which was gradually increased up to 111 kN. The horizontal load was also gradually raised to 333 kN. To avoid stress concentrations, the load was applied to the girder uniformly as a pressure on a 305 mm × 305 mm area equal to that of the neoprene bearing pad used in the experiment.

4.3.2. Load Displacement

To validate the global response of the bridge, vertical and horizontal loads were applied at point 1 (the mid-span of the exterior girder), and the corresponding displacements were measured at points 1 and 2 (the mid-span of the exterior girder), as described in Section 4. Three different intermediate diaphragm cases were modeled, including the absence of intermediate diaphragms, a reinforced concrete intermediate diaphragm located at the mid-span denoted as RC.1, and a steel channel intermediate diaphragm at the mid-span denoted as C.1. The validation findings, shown in Figure 28 and Figure 29, show that the FE model successfully predicted the load-vertical and load-lateral displacements in all cases investigated.

5. Impact Study

Following the validation process, an impact study was conducted to demonstrate the FE model’s efficacy and to provide significant insights for future implementation. In line with previous research findings, this study recognized impact speed and mass as critical parameters in impact analyses. Consequently, the investigation included three impact speeds ranging from 8 to 32 km/h and four impact masses: one ton, two tons, three tons, and four tons. In addition, as one of the main contributions of this study was considering the prestressing effect in the analysis under impact loads, the influence of prestressing force existence was also considered. Details of the parameters utilized in the study are provided in Table 1. The study utilized a cylindrical steel rigid impactor with a diameter of 1 m and a length of 1.2 m, with an appropriate unit weight to achieve the desired impact mass. The rigid impactor was positioned to strike the entire bottom flange of the girder, with a contact area of 45,000  mm 2 , as shown in Figure 30.

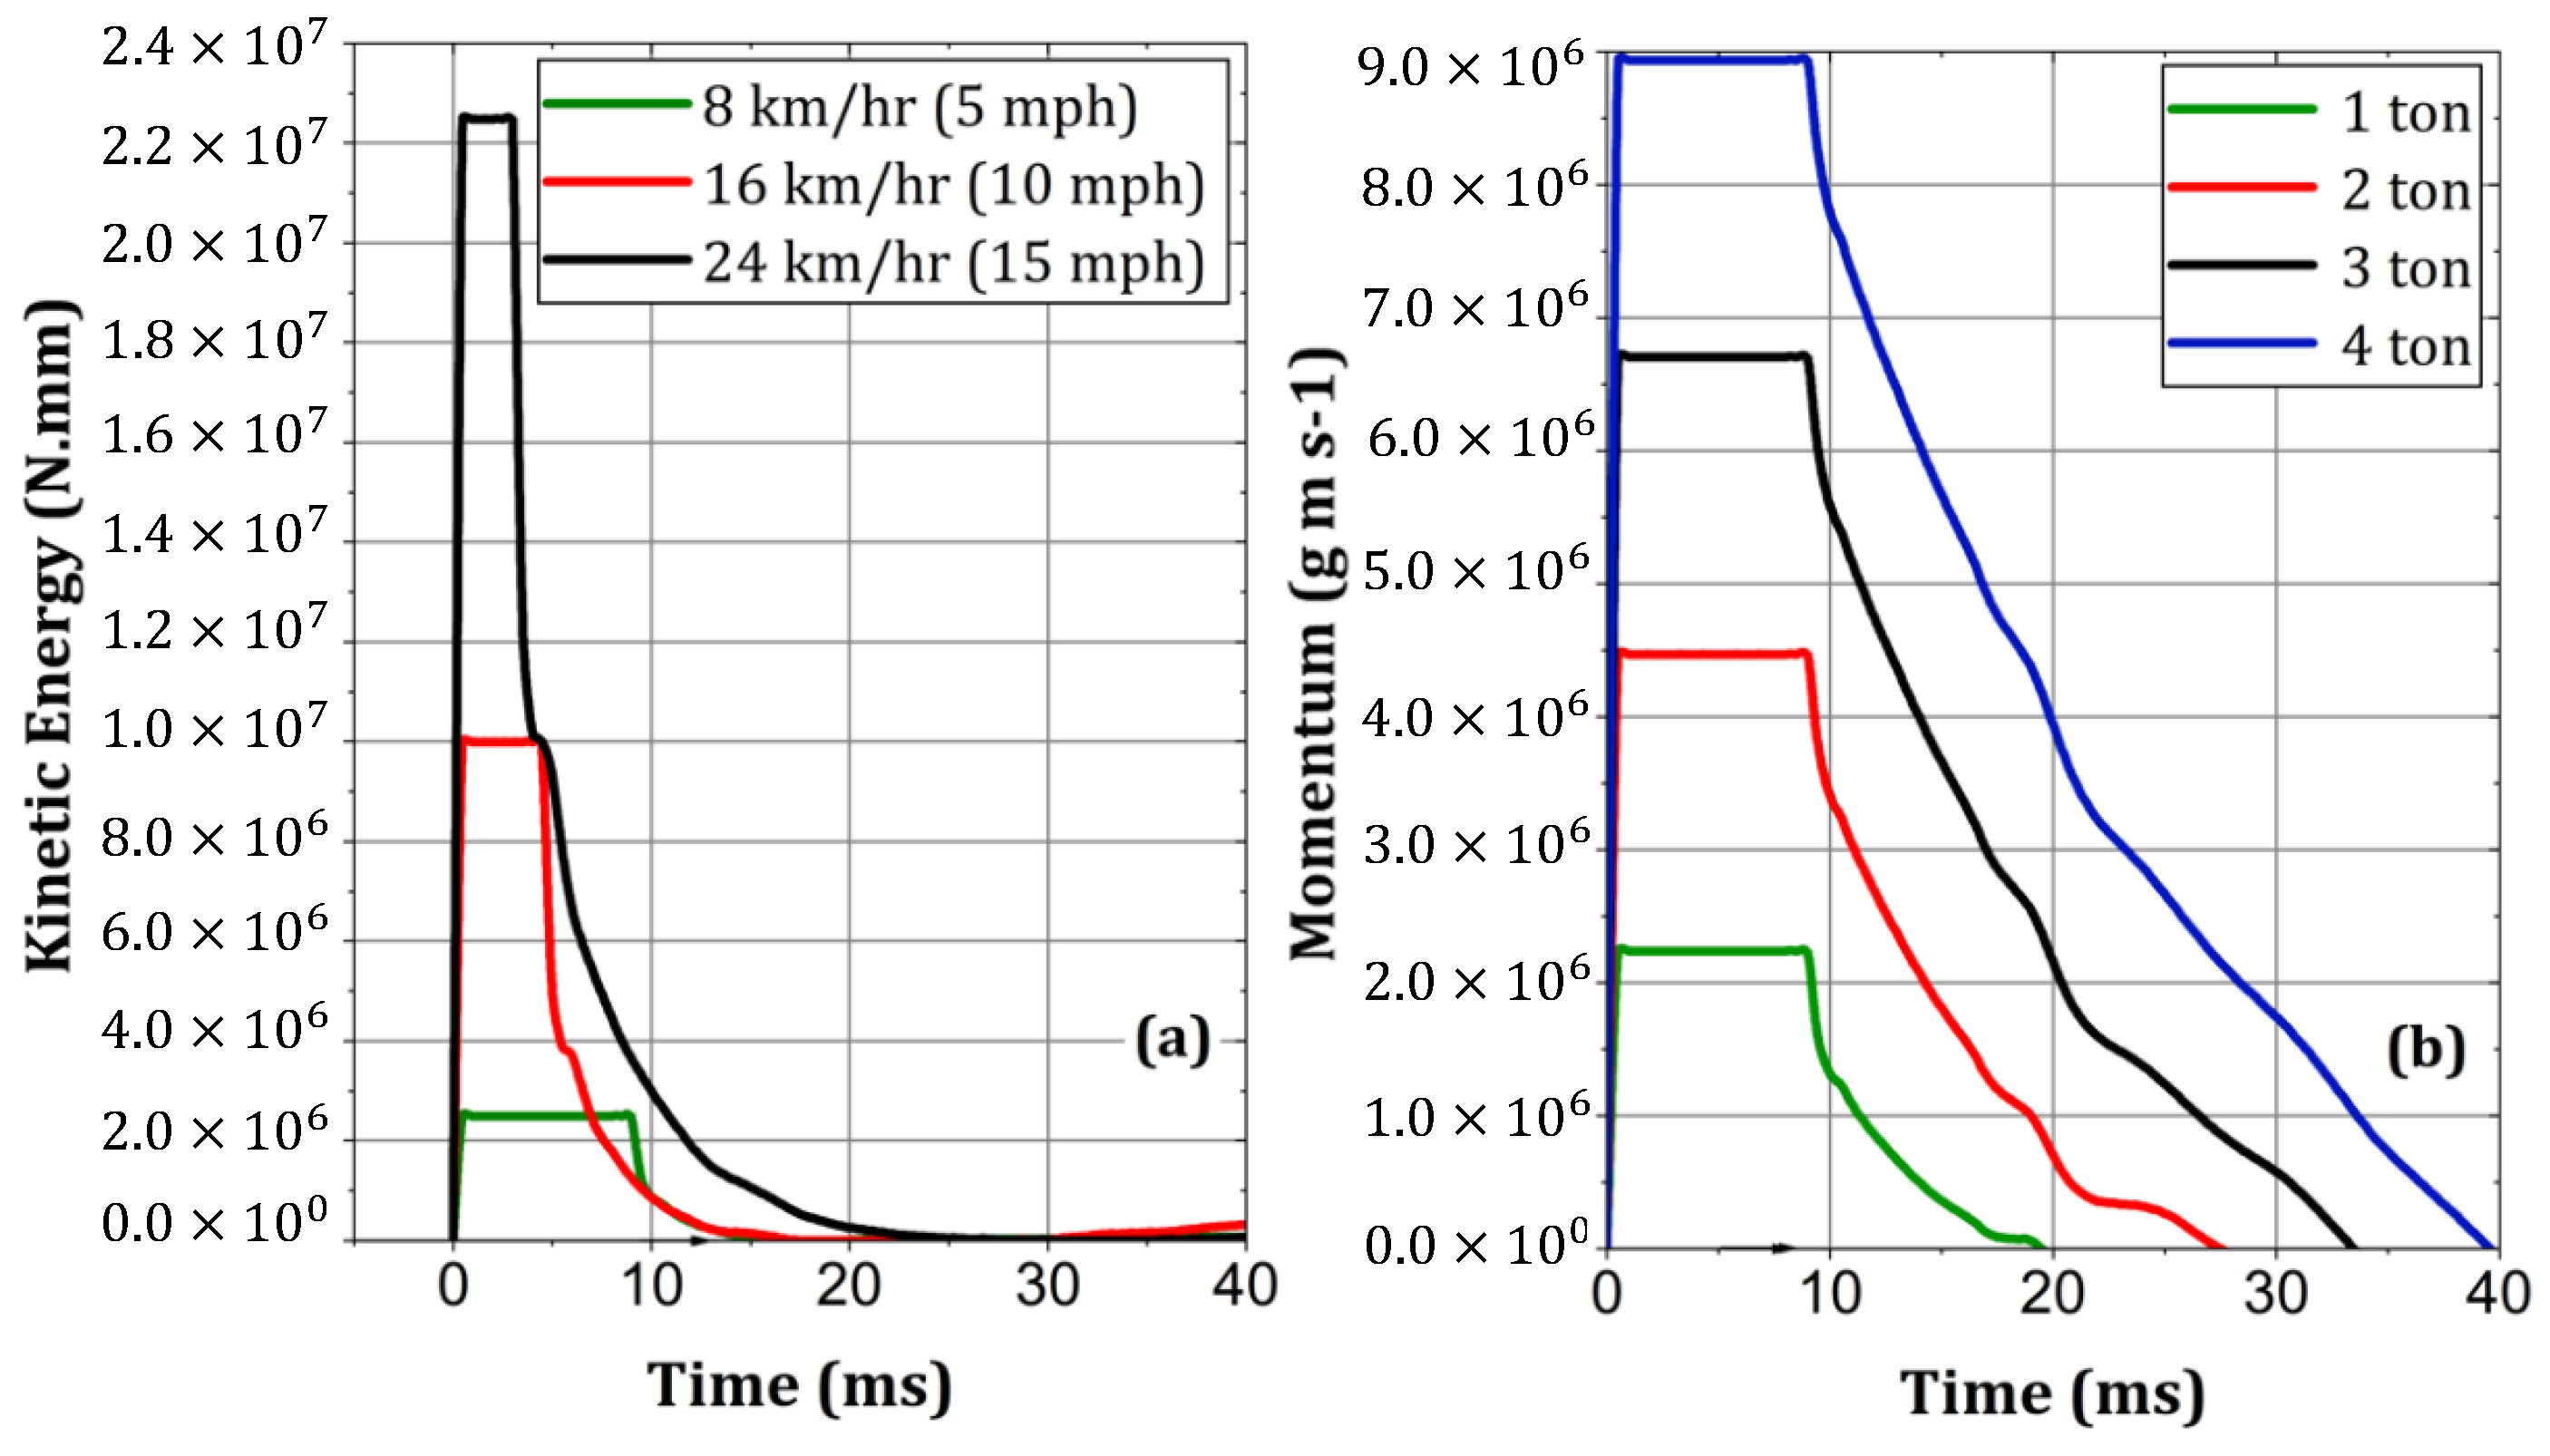
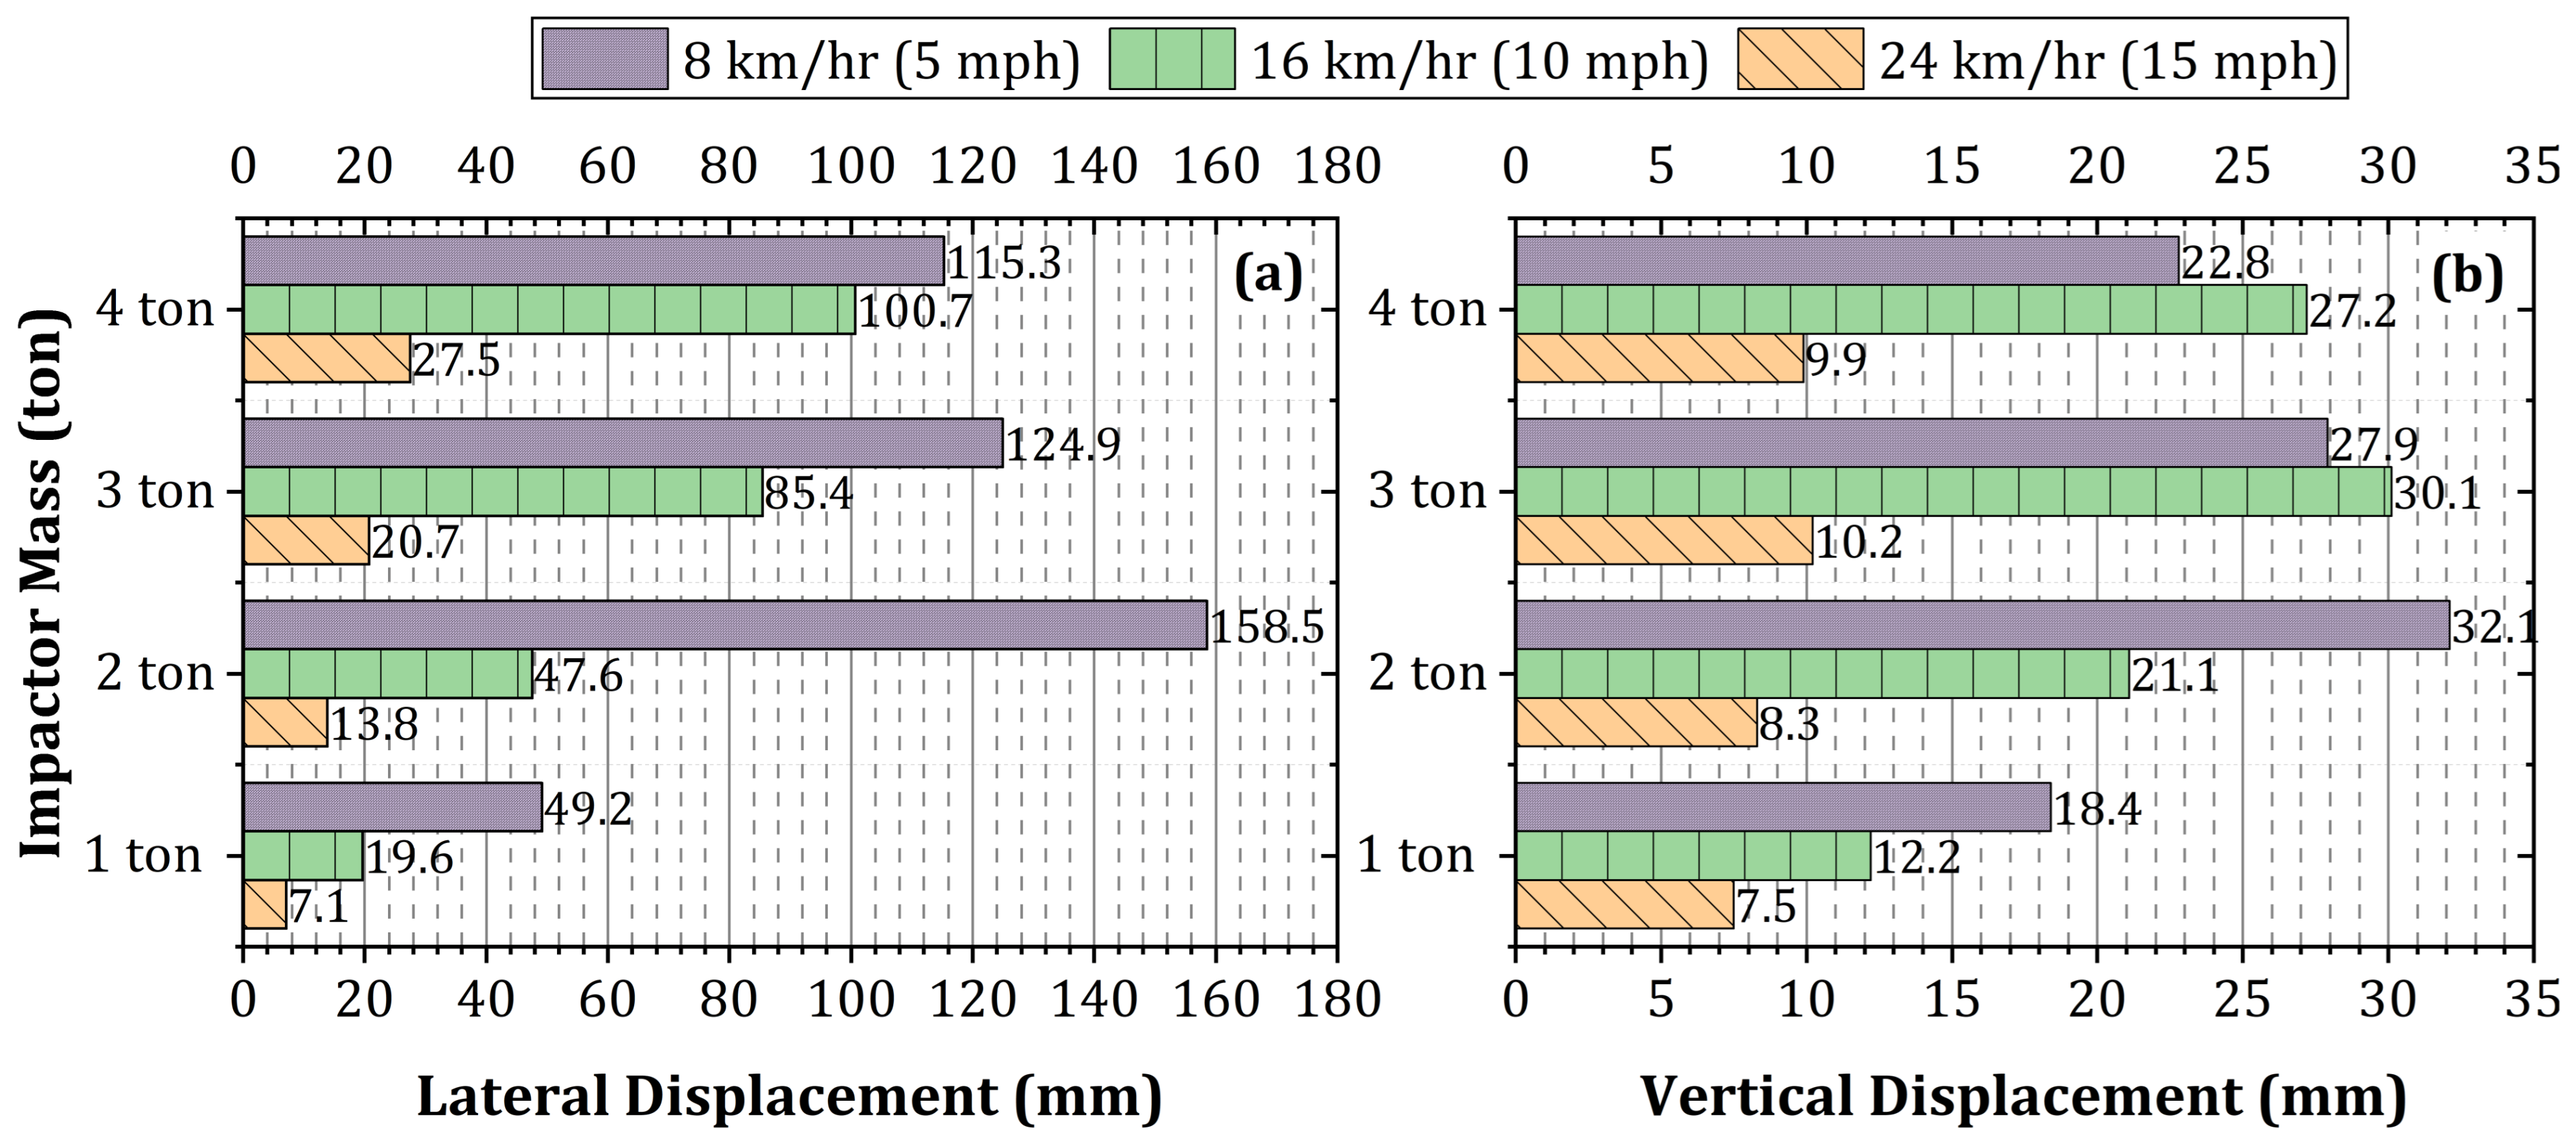
5.1. Impact Speed and Mass

Impact speed and mass showed a considerable influence on the resulting peak impact force experienced by the girder. The kinetic energy ( K . E . ) carried by the impactor increases as the impactor’s speed increases following the fundamental equation  K . E . = 1 / 2 × m × v 2 . This relationship is illustrated in Figure 31a, which shows a considerable increase in the kinetic energy, reaching a value up to nine times greater at 24 km/h compared to 8 km/h. This higher kinetic energy translates into a greater amount of energy transferred to the girder upon impact. Consequently, the peak impact force experienced by the girder tends to increase with higher impact speeds. As can be seen in Figure 32, the peak impact force increased by approximately 2.5 times as the impact speed increased from 8 km/h to 24 km/h.
Furthermore, the mass of the impactor influences the peak impact force. A heavier impactor possesses more momentum, resulting in a greater force applied to the girder upon impact. The momentum increased by up to four times as the impactor mass increased from 1 ton to 4 tons (Figure 31b). As a result, an increase in the impactor’s mass led to an increase in the peak impact force experienced by the girder. As shown in Figure 32, our FE models showed a slight increase in the peak impact force with a mass increase.
Figure 33 presents the maximum lateral and vertical displacements observed during the impact of the rigid impactor at various speeds and masses. The results show that as the impact speed and mass rose, the girder’s lateral and vertical displacements increased due to the increased kinetic energy transferred by the impactor. However, the damage became more localized at the impact location beyond a certain energy level, causing early failure before significant deformation occurred.
The composite behavior of the bridge can be addressed through energy analysis, which explains how kinetic energy from the impactor transforms into internal energy within the structure. Upon computing energy distribution across various bridge components, it was observed that at lower impact speeds, the impacted girder absorbed approximately 55–60% of the total energy, with the remaining energy being absorbed by other bridge components. This finding underscores the composite response of the bridge and emphasizes the importance of analyzing the bridge as a whole entity rather than focusing solely on individual girders. However, with an increase in impact energy resulting from higher speeds or masses, there may be a shift towards localized responses, potentially leading to a higher energy transfer to the impacted girder in such scenarios.

5.2. Prestressing Force

A prestressed girder bridge was compared to a model with no prestressing force applied to the strands, enabling them to operate purely as reinforcements. The absence of the prestressing force reduced the impact force by around 16% to 20%, as shown in Figure 34. This decrease underscores the significance of considering prestressing effects, as neglecting them may result in an underestimation of the impact capacity of prestressed concrete elements. Furthermore, the presence of compressive stress induced by prestressing forces reduced lateral displacements when compared to reinforced concrete, as shown in Figure 35.

5.3. Damage Pattern

Shear cracks appeared in the damaged external girder. At an 8 km/h impact speed, the severity of damage increased as the impactor’s mass increased (Figure 36a). For impacts at 16 km/h, relatively narrow diagonal cracks originated near the impact location and propagated along the girder’s length, with greater severity observed for impactors of greater mass (Figure 36b). The majority of observed patterns showed global damage, and the extent of diagonal cracks increased with the increase in impact energy. Finally, in all cases, significant stress concentrations were observed along the flange, particularly at the deck connection point.
Using the FE models, we were able to determine the change in the strands’ prestressing stress. Figure 37 shows the changes in the axial stress of the most severely damaged strand during the impact event. Notably, significant reductions in stresses were observed at impact speeds of 24 km/h and 16 km/h for impactor masses of 3 and 4 tons. These reductions in stress indicate instances of strand severing during impact incidents. This approach enabled us to comprehend the behavior of prestressing strands under impact loading conditions.

6. Future Works

This study presents a meticulously developed FE model of the behavior of a prestressed girder bridge under impact loads. The model underwent rigorous validation and verification procedures to ensure its accuracy and reliability. The impact study involved low-velocity impact, with rigid impact masses ranging from 1 ton to 4 tons. Future research will include a wider range of parameters, including high impact speeds, various impact situations with varying contact areas and locations, a wider range of impactor types, and an investigation into the effect of using intermediate diaphragms. In addition, the potential load redistribution dynamics, which could cause changes in bridge live load distribution and possibly trigger progressive collapse, will be investigated.

7. Conclusions

This study developed a comprehensive FE model for analyzing the response of prestressed girder bridges subjected to impact loads. Utilizing the dynamic relaxation (DR) approach, we effectively minimized the dynamic effect inherent to explicit analysis, allowing us to precisely capture the response of prestressed girders under impact loads. Our research included a thorough discussion of alternative methods for modeling prestressed concrete in LS-DYNA, including stress initialization, axial beam force, and temperature-induced shrinkage. The response of four different concrete constitutive material models, CSCM, CDPM, KCC, and Winfrith, under impact loads was also investigated. Furthermore, an impact study was carried out to investigate the effect of impact speed, impact mass, and prestressing force on the behavior of prestressed girder bridges. The following conclusions were drawn:
  • The three preloading techniques, stress initialization, axial beam force, and temperature-induced shrinkage, could effectively preload the prestressing strands with the desired stress. However, the initial axial force method requires the use of specific spotweld material model and beam elements, which limits its applicability in some instances.
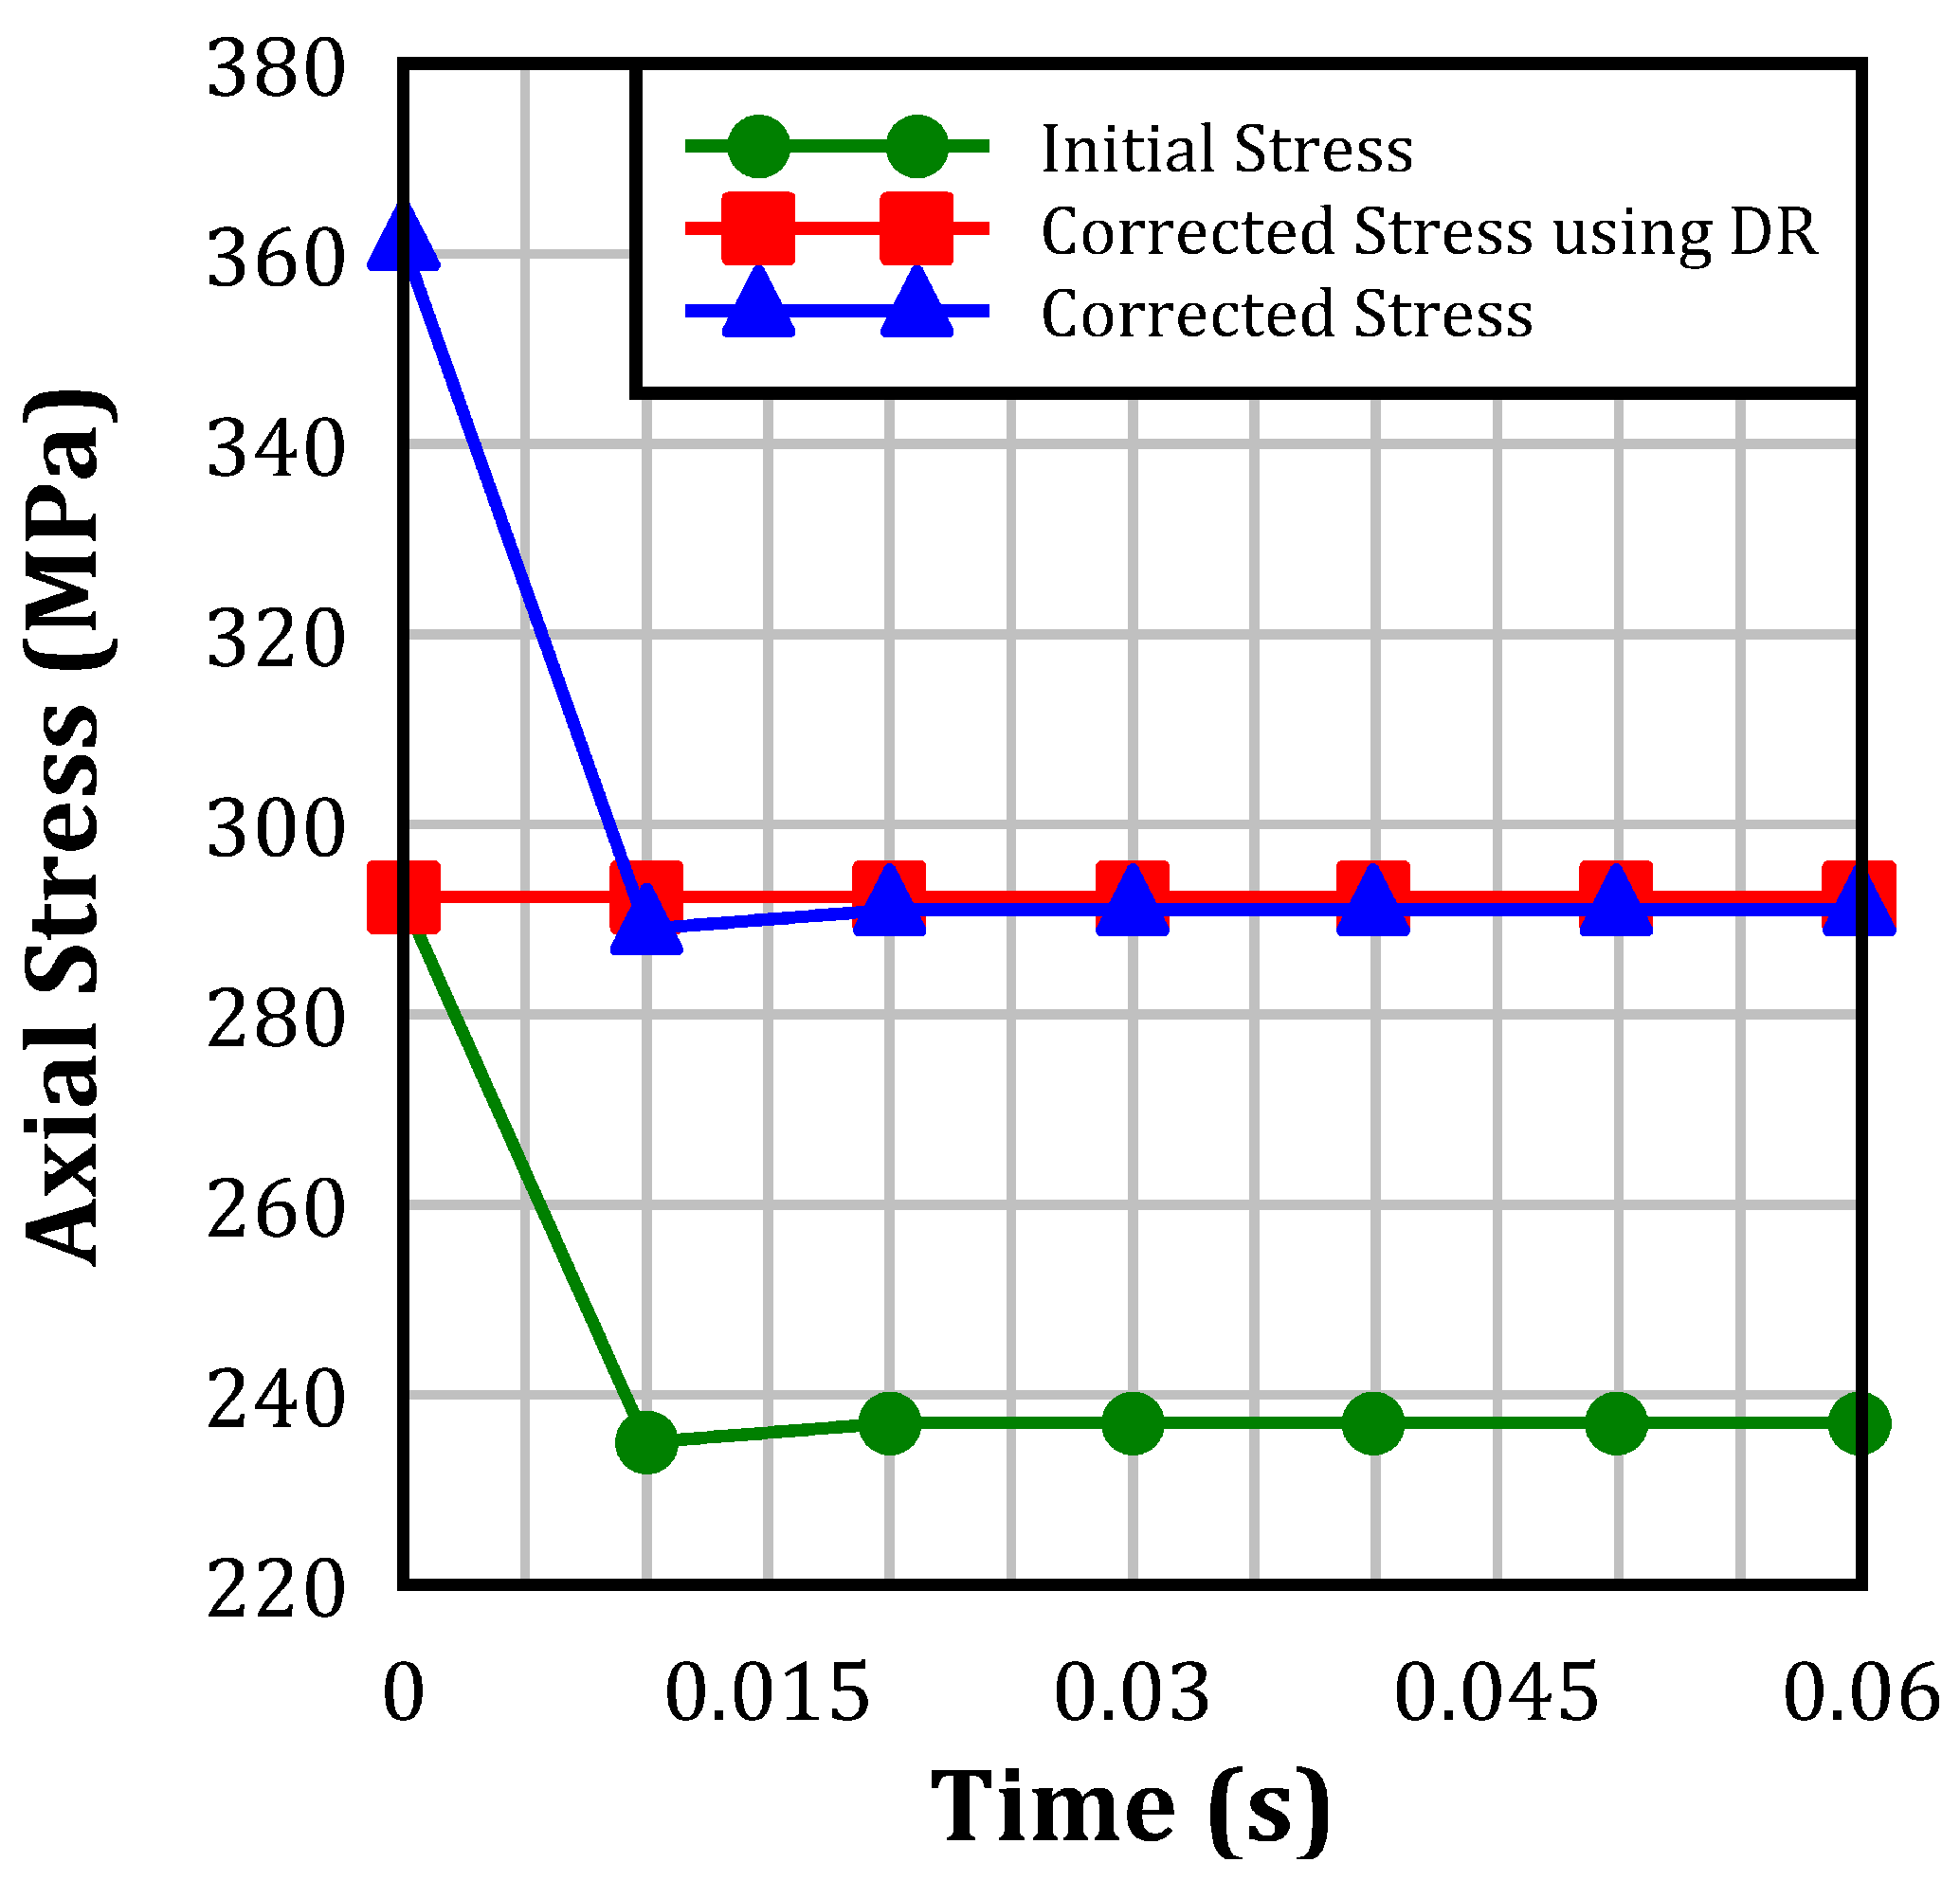
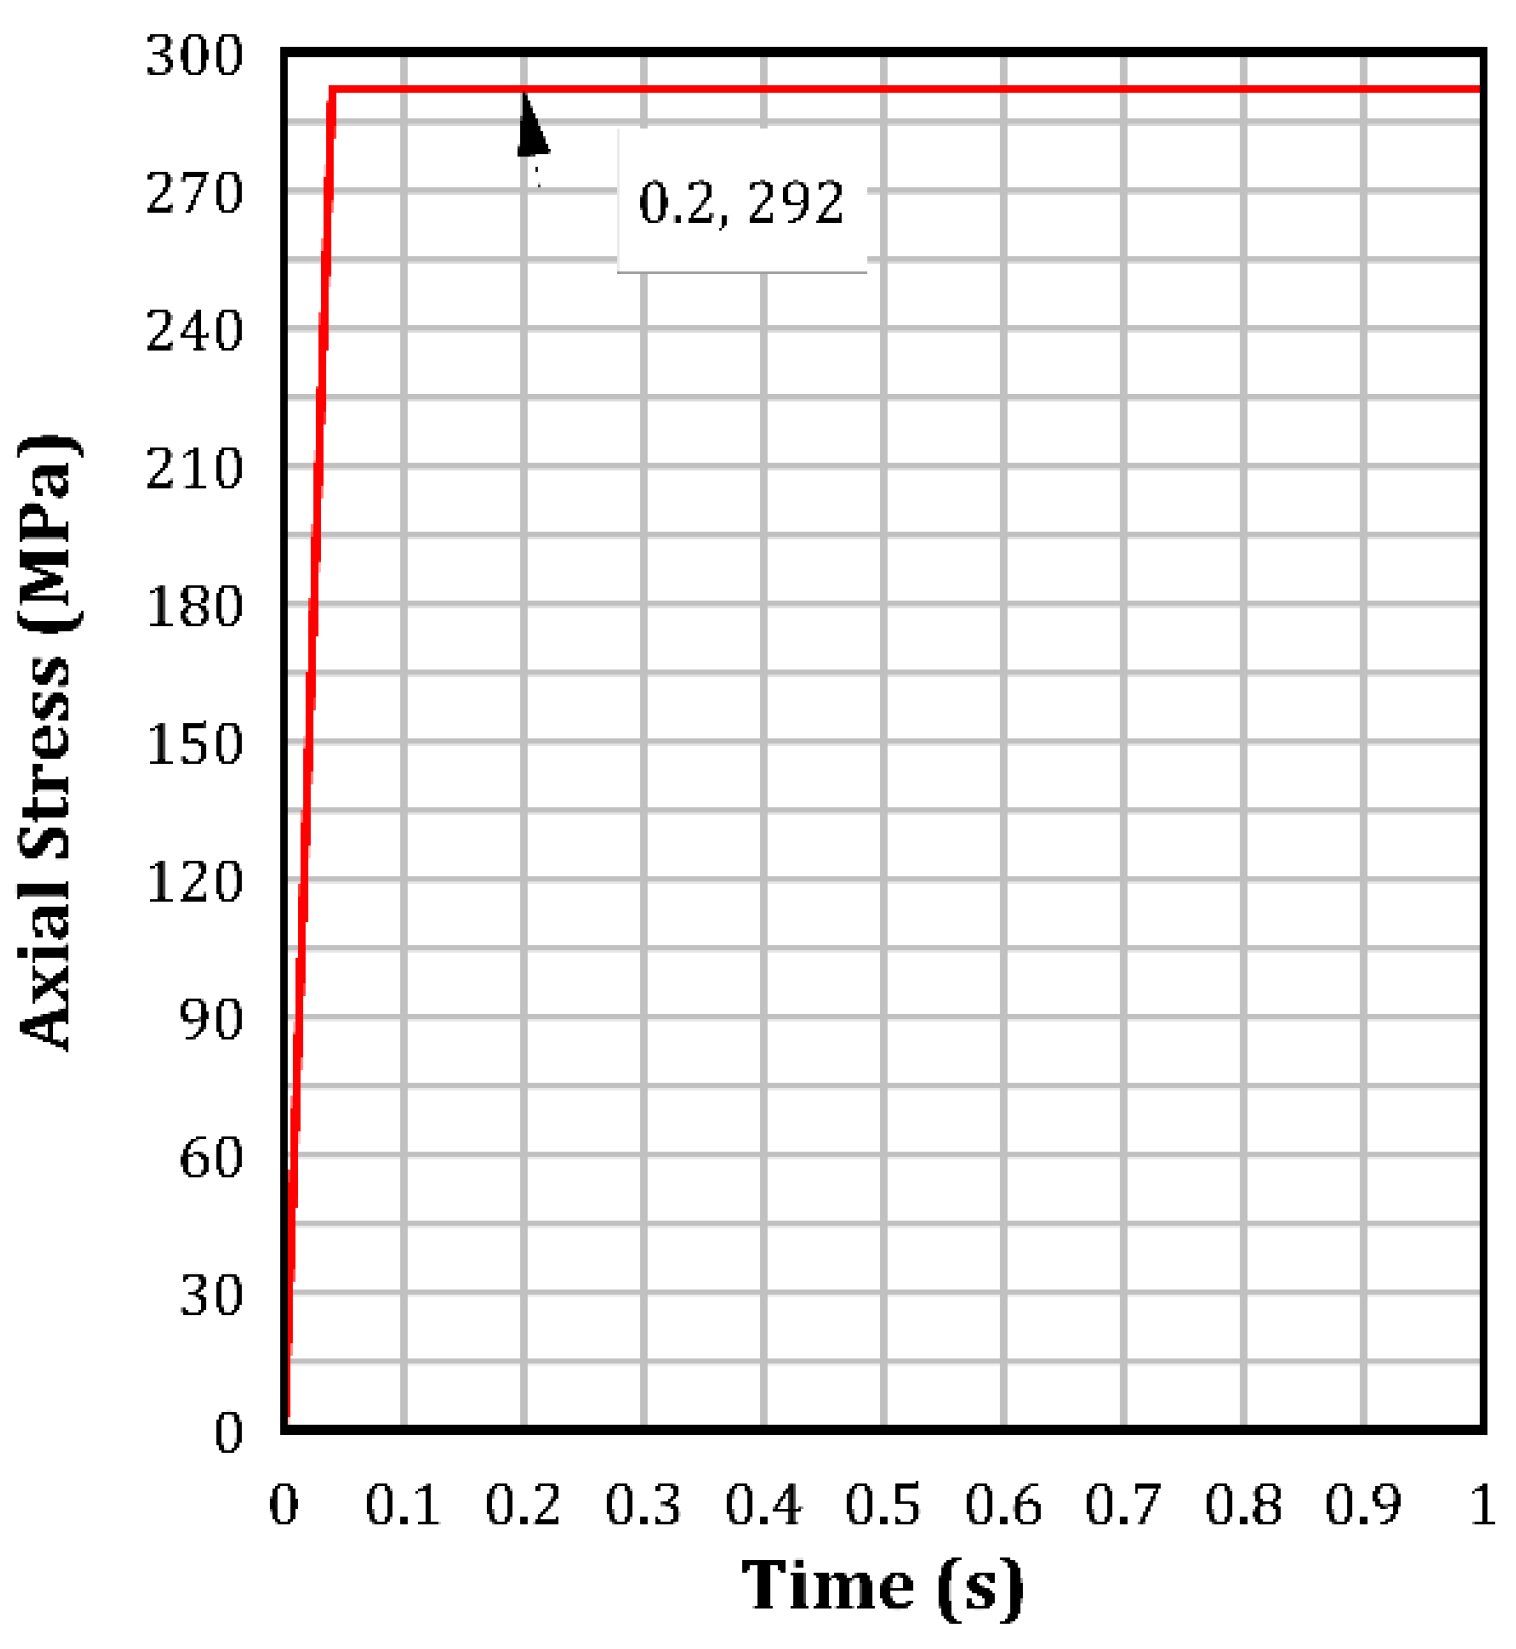
  • Utilizing dynamic relaxation within explicit analysis, alongside an appropriate convergence tolerance, is crucial for minimizing the dynamic effect and achieving greater stability, leading to steady-state conditions.
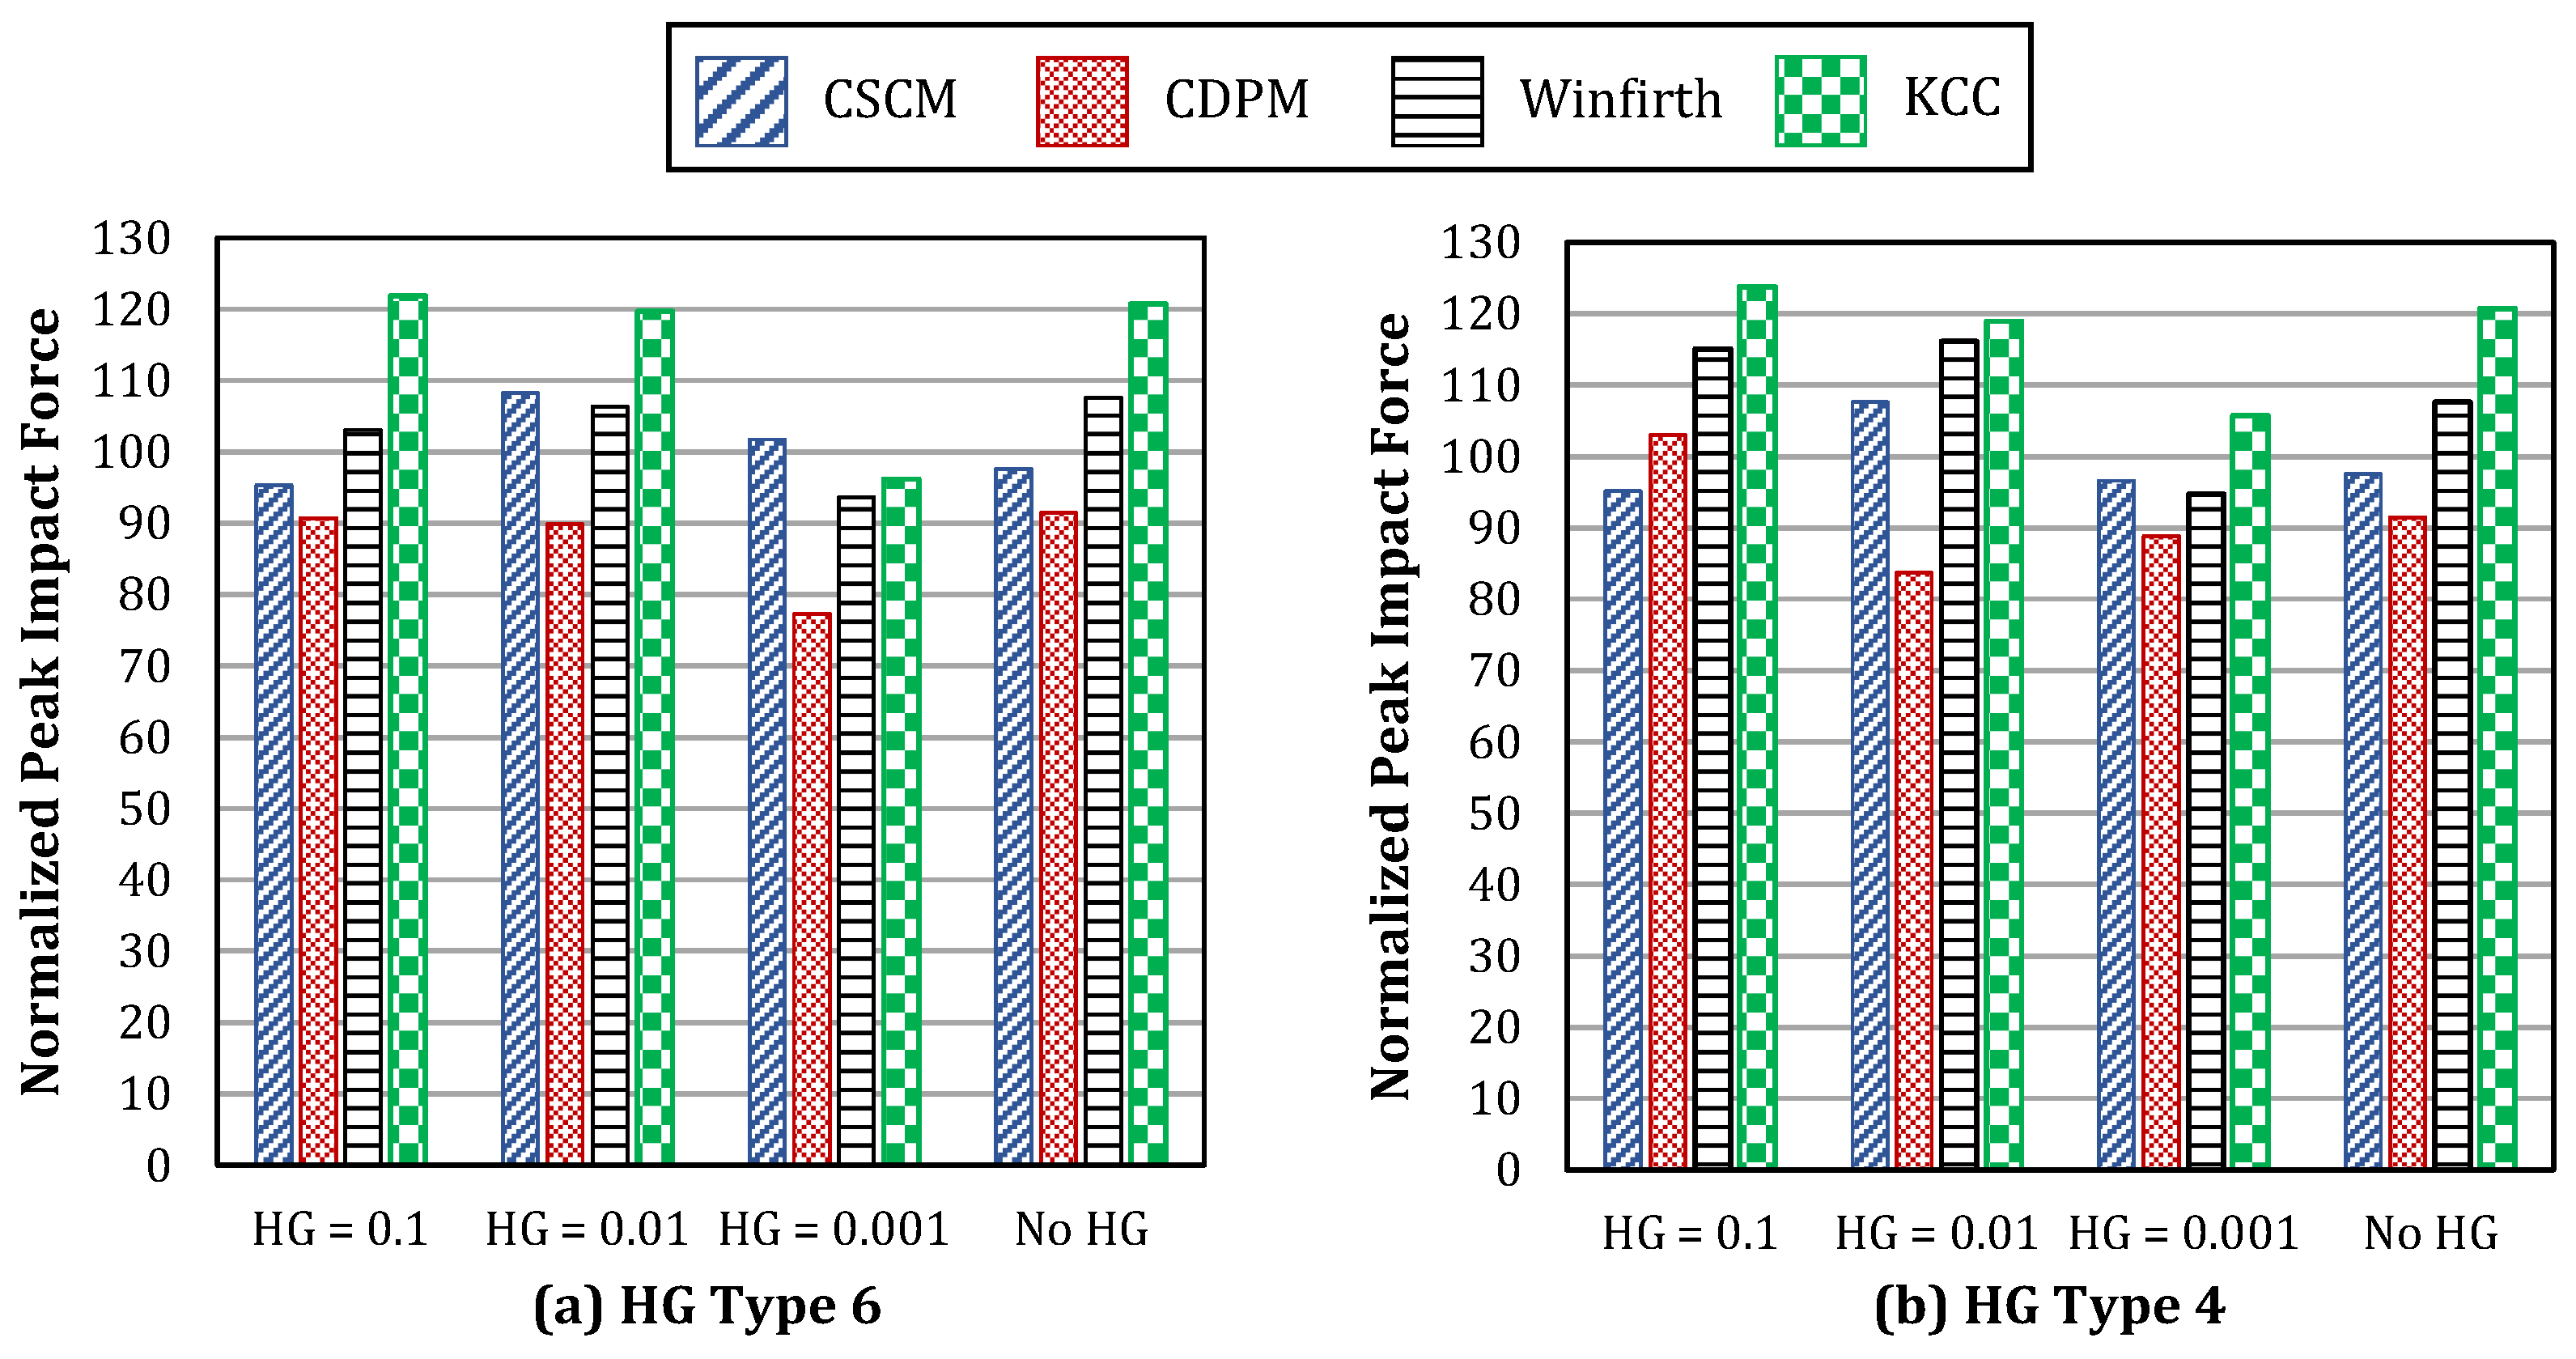
  • Among the four material models evaluated, the Continuous Cap Surface Model (CSCM) was the most accurate, with a peak impact force prediction error of less than 8%. Furthermore, the model demonstrated a strong ability to predict crack patterns effectively.
  • Impact speed and mass demonstrated a significant influence on the resulting peak impact force experienced by the girder. Higher speeds correspond to greater kinetic energy, leading to increased impact energy transferred to the girder. Similarly, a heavier impactor possesses more momentum, resulting in a greater force applied to the girder upon impact.
  • The energy analysis revealed the complex relationship between kinetic energy transmission and internal energy distribution within bridge components. In low-velocity impact scenarios, the impacted girder absorbed approximately 50–60% of the total energy, with the remainder distributed among other bridge components. This underscores the composite nature of the bridge’s response and emphasizes the importance of analyzing the bridge as a whole rather than focusing solely on individual girders.
  • The presence of prestressing force showed a significant effect under impact loads, with an increase in the girder’s impact capacity of approximately 16% to 20%.
  • The majority of observed damage patterns under impact showed global damage, and the extent of diagonal cracks increased with the increase in impact energy.
  • The developed FE model was able to determine the variation in the strands’ prestressing stress, indicating instances of strand severing and cutting.

Author Contributions

Conceptualization, A.I. and M.T.E.; methodology, A.I. and M.T.E.; formal analysis, M.T.E.; investigation, M.T.E. and A.I.; resources, A.I.; writing—original draft preparation, M.T.E.; writing—review and editing, A.I., M.E. and M.M.A.; supervision, A.I.; project administration, A.I. and M.E.; funding acquisition, A.I. All authors have read and agreed to the published version of the manuscript.

Funding

The authors would like to acknowledge the support provided by the University of Idaho, Missouri University MS&T, and the FHWA for this research study.

Data Availability Statement

All data used in this study are available upon the request.

Acknowledgments

This research paper is based on the doctoral dissertation by Mohamed T. Elshazli, a former student at the University of Idaho.

Conflicts of Interest

The authors declare no conflicts of interest.

Abbreviations

The following abbreviations are used in this manuscript:
AASHTOThe American Association of State Highway and Transportation Officials
CSCMContinuous Surface Cap Model
CDPMConcrete Damage Plastic Model
DIFDynamic Increase Factor
DOTDepartment of Transportation
DRDynamic relaxation
FEFinite element
FEAFinte Element Analysis
HGHourglass
IEInternal energy
KCCKaragozian & Case Concrete
KEKinetic energy
RCReinforced concrete

References

  1. Agrawal, A.; Xu, X.; Chen, Z. Strikes on low clearance bridges by over-height trucks in New York State. Retrieved Dec. 2013, 5, 2014. [Google Scholar]
  2. Oppong, K.; Saini, D.; Shafei, B. Characterization of impact-induced forces and damage to bridge superstructures due to over-height collision. Eng. Struct. 2021, 236, 112014. [Google Scholar] [CrossRef]
  3. Fu, C.C.; Burhouse, J.R.; Chang, G.L. Overheight vehicle collisions with highway bridges. Transp. Res. Rec. 2004, 1865, 80–88. [Google Scholar] [CrossRef]
  4. Kiakojouri, F.; De Biagi, V.; Marchelli, M.; Chiaia, B. A conceptual note on the definition of initial failure in progressive collapse scenarios. In Structures; Elsevier: Amsterdam, The Netherlands, 2024; Volume 60, p. 105921. [Google Scholar]
  5. Gsa, U. Progressive Collapse Analysis and Design Guidelines for New Federal Office Buildings and Major Modernization Projects; Guideline Report; The US General Services Administration: Washington, DC, USA, 2003.
  6. Jiang, H.; Chorzepa, M.G. Evaluation of a new FRP fender system for bridge pier protection against vessel collision. J. Bridge Eng. 2015, 20, 05014010. [Google Scholar] [CrossRef]
  7. Jiang, H.; Chorzepa, M.G. Case study: Evaluation of a floating steel fender system for bridge pier protection against vessel collision. J. Bridge Eng. 2016, 21, 05016008. [Google Scholar] [CrossRef]
  8. Tian, L.; Huang, F. Numerical simulation for progressive collapse of continuous girder bridge subjected to ship impact. Trans. Tianjin Univ. 2014, 20, 250–256. [Google Scholar] [CrossRef]
  9. AASHTO American Association of State Highway and Transportation Officials. Commentary for Vessel Collision Design of Highway Bridges; American Association of State Highway and Transportation Officials: Washington, DC, USA, 1991. [Google Scholar]
  10. Jiang, H.; Wang, J.; Chorzepa, M.G.; Zhao, J. Numerical investigation of progressive collapse of a multispan continuous bridge subjected to vessel collision. J. Bridge Eng. 2017, 22, 04017008. [Google Scholar] [CrossRef]
  11. Kasan, J.L.; Harries, K.A. Analysis of eccentrically loaded adjacent box girders. J. Bridge Eng. 2013, 18, 15–25. [Google Scholar] [CrossRef]
  12. Kishi, N.; Nakano, O.; Matsuoka, K.; Ando, T. Experimental study on ultimate strength of flexural-failure-type RC beams under impact loading. Transactions 2001, 1525. [Google Scholar]
  13. Tachibana, S.; Masuya, H.; Nakamura, S. Performance based design of reinforced concrete beams under impact. Nat. Hazards Earth Syst. Sci. 2010, 10, 1069–1078. [Google Scholar] [CrossRef]
  14. Kishi, N.; Mikami, H. Empirical Formulas for Designing Reinforced Concrete Beams under Impact Loading. ACI Struct. J. 2012, 109, 509. [Google Scholar]
  15. Nghiem, A.; Kang, T.H.K. Drop-Weight Testing on Concrete Beams and ACI Design Equations for Maximum and Residual Deflections under Low-Velocity Impact. ACI Struct. J. 2020, 117, 199. [Google Scholar]
  16. Xu, X.; Zhang, H.; Du, X.; Liu, Q. Vehicle collision with RC structures: A state-of-the-art review. In Structures; Elsevier: Amsterdam, The Netherlands, 2022; Volume 44, pp. 1617–1635. [Google Scholar]
  17. Chen, L.; El-Tawil, S.; Xiao, Y. Reduced models for simulating collisions between trucks and bridge piers. J. Bridge Eng. 2016, 21, 04016020. [Google Scholar] [CrossRef]
  18. Heng, K.; Li, R.; Li, Z.; Wu, H. Dynamic responses of highway bridge subjected to heavy truck impact. Eng. Struct. 2021, 232, 111828. [Google Scholar] [CrossRef]
  19. Song, J.; Hu, D.; Luo, S.; Liu, W.; Wang, D.; Sun, Q.; Zhang, G. Energy-absorption behavior of metallic hollow sphere structures under impact loading. Eng. Struct. 2021, 226, 111350. [Google Scholar] [CrossRef]
  20. Cengiz, A.; Gurbuz, T.; Ilki, A.; Aydogan, M. Dynamic and Residual Static Behavior of Axially Loaded RC Columns Subjected to Low-Elevation Impact Loading. Buildings 2023, 14, 92. [Google Scholar] [CrossRef]
  21. Liu, T.; Chen, L. Numerical simulation of vehicle collision with reinforced concrete piers protected by FRP-foam composites. In Structures Congress 2019; American Society of Civil Engineers: Reston, VA, USA, 2019; pp. 70–81. [Google Scholar]
  22. Abdelkarim, O.I.; ElGawady, M.A. Performance of bridge piers under vehicle collision. Eng. Struct. 2017, 140, 337–352. [Google Scholar] [CrossRef]
  23. Wu, M.; Jin, L.; Du, X. Dynamic response analysis of bridge precast segment piers under vehicle collision. Eng. Fail. Anal. 2021, 124, 105363. [Google Scholar] [CrossRef]
  24. Li, R.; Cao, D.; Wu, H.; Wang, D. Collapse analysis and damage evaluation of typical simply supported double-pier RC bridge under truck collision. In Structures; Elsevier: Amsterdam, The Netherlands, 2021; Volume 33, pp. 3222–3238. [Google Scholar]
  25. Wang, S.; Lei, Z.; Zhao, J.; Li, Y.; Lei, M.; Liu, Y. A research of similarity design of collision guardrails under the overpass. In Proceedings of the 2011 Second International Conference on Mechanic Automation and Control Engineering, Hohhot, China, 15–17 July 2011; pp. 1903–1906. [Google Scholar]
  26. Trajkovski, J.; Ambrož, M.; Kunc, R. The importance of friction coefficient between vehicle tyres and concrete safety barrier to vehicle rollover: FE analysis study. Strojniški Vestn. 2018, 64, 1–11. [Google Scholar] [CrossRef]
  27. Neves, R.R.; Fransplass, H.; Langseth, M.; Driemeier, L.; Alves, M. Performance of some basic types of road barriers subjected to the collision of a light vehicle. J. Braz. Soc. Mech. Sci. Eng. 2018, 40, 274. [Google Scholar] [CrossRef]
  28. Safari Honar, F.; Broujerdian, V.; Mohammadi Dehcheshmeh, E.; Bedon, C. Nonlinear Dynamic Assessment of a Steel Frame Structure Subjected to Truck Collision. Buildings 2023, 13, 1545. [Google Scholar] [CrossRef]
  29. Chen, A.; Liu, Y.; Ma, R.; Zhou, X. Experimental and Numerical Analysis of Reinforced Concrete Columns under Lateral Impact Loading. Buildings 2023, 13, 708. [Google Scholar] [CrossRef]
  30. Raj, A.; Nagarajan, P.; Aikot Pallikkara, S. Application of fiber-reinforced rubcrete for crash barriers. J. Mater. Civ. Eng. 2020, 32, 04020358. [Google Scholar] [CrossRef]
  31. Kelly, J. The Effects of Impact Loading on Prestressed Concrete Beams. Ph.D. Thesis, Heriot-Watt University, Edinburgh, UK, 2011. [Google Scholar]
  32. Jing, Y.; Ma, Z.J.; Clarke, D.B. Full-scale lateral impact testing of prestressed concrete girder. Struct. Concr. 2016, 17, 947–958. [Google Scholar] [CrossRef]
  33. Xu, L.; Lu, X.Z.; Smith, S.T.; He, S. Scaled model test for collision between over-height truck and bridge superstructure. Int. J. Impact Eng. 2012, 49, 31–42. [Google Scholar] [CrossRef]
  34. Atahan, A.O.; Cansiz, O.F. Impact analysis of a vertical flared back bridge rail-to-guardrail transition structure using simulation. Finite Elem. Anal. Des. 2005, 41, 371–396. [Google Scholar] [CrossRef]
  35. Xu, L.; Lu, X.; Guan, H.; Zhang, Y. Finite-element and simplified models for collision simulation between overheight trucks and bridge superstructures. J. Bridge Eng. 2013, 18, 1140–1151. [Google Scholar] [CrossRef]
  36. Oppong, K.; Saini, D.; Shafei, B. Ultrahigh-performance concrete for improving impact resistance of bridge superstructures to overheight collision. J. Bridge Eng. 2021, 26, 04021060. [Google Scholar] [CrossRef]
  37. Jing, Y.; Zhang, X.; Zhou, Y.; Zhao, Y.; Li, W. Dynamic Response and Impact Force Calculation of PC Box Girder Bridge Subjected to Over-Height Vehicle Collision. Buildings 2023, 13, 495. [Google Scholar] [CrossRef]
  38. Berton, E.; Bouaanani, N.; Lamarche, C.P.; Roy, N. Finite element modeling of the impact of heavy vehicles on highway and pedestrian bridge decks. Procedia Eng. 2017, 199, 2451–2456. [Google Scholar] [CrossRef]
  39. Jiang, H.; Chorzepa, M.G. An effective numerical simulation methodology to predict the impact response of pre-stressed concrete members. Eng. Fail. Anal. 2015, 55, 63–78. [Google Scholar] [CrossRef]
  40. Husain, M.; Yu, J.; Wu, J. Comparisons of different approaches of modelling prestress in concrete members using LS-DYNA and its applications. In Concrete—Innovations in Materials, Design and Structures; The International Federation for Structural Concrete: Krakow, Poland, 2019; pp. 812–819. [Google Scholar]
  41. Saini, D.; Shafei, B. Concrete constitutive models for low velocity impact simulations. Int. J. Impact Eng. 2019, 132, 103329. [Google Scholar] [CrossRef]
  42. Thai, D.K.; Kim, S.E. Numerical simulation of pre-stressed concrete slab subjected to moderate velocity impact loading. Eng. Fail. Anal. 2017, 79, 820–835. [Google Scholar] [CrossRef]
  43. Elbelbisi, A.H.; El-Sisi, A.A.; Hassan, H.A.; Salim, H.A.; Shabaan, H.F. Parametric study on steel–concrete composite beams strengthened with post-tensioned CFRP tendons. Sustainability 2022, 14, 15792. [Google Scholar] [CrossRef]
  44. El-Belbisi, A. Strengthening of Pre-stressed Steel–Concrete Composite Beams Using Carbon Fiber Tendons–A Parametric Study. Arch. Med. 2018, 4, 1–7. [Google Scholar]
  45. LSTC Manual; Livermore Software Technology Corporation: Livermore, CA, USA, 1998; Manual.
  46. Fujikake, K.; Li, B.; Soeun, S. Impact response of reinforced concrete beam and its analytical evaluation. J. Struct. Eng. 2009, 135, 938–950. [Google Scholar] [CrossRef]
  47. Comite Euro-International du Beton. Concrete Structures under Impact and Impulsive Loading: Synthesis Report; Comite Euro-International du Beton: Lausanne, Switzerland, 1988. [Google Scholar]
  48. Malvar, L.J.; Crawford, J.E. Dynamic increase factors for concrete. DTIC Doc. 1998, 1, 1–6. [Google Scholar]
  49. Saini, D.; Shafei, B. Investigation of concrete-filled steel tube beams strengthened with CFRP against impact loads. Compos. Struct. 2019, 208, 744–757. [Google Scholar] [CrossRef]
  50. Yin, X.; Li, Q.; Xu, X.; Chen, B.; Guo, K.; Xu, S. Investigation of continuous surface cap model (CSCM) for numerical simulation of strain-hardening fibre-reinforced cementitious composites against low-velocity impacts. Compos. Struct. 2023, 304, 116424. [Google Scholar] [CrossRef]
  51. Gharavi, A.; Asgarpoor, M.; Epackachi, S. Evaluation of plasticity-based concrete constitutive models under monotonic and cyclic loadings. Struct. Des. Tall Spec. Build. 2022, 31, e1919. [Google Scholar] [CrossRef]
  52. Grassl, P.; Jirásek, M. Damage-plastic model for concrete failure. Int. J. Solids Struct. 2006, 43, 7166–7196. [Google Scholar] [CrossRef]
  53. Elbelbisi, A.; Elsisi, A.; Saffarini, M.H.; Salim, H.; Chen, Z. Enhanced Blast Response Simulation of LG Panels Using an Elasto-Damage Model with the Finite Element Method. Buildings 2023, 13, 3025. [Google Scholar] [CrossRef]
  54. Ottosen, N.S. A failure criterion for concrete. J. Eng. Mech. Div. 1977, 103, 527–535. [Google Scholar] [CrossRef]
  55. Broadhouse, B. DRASTIC: A Computer Code for Dynamic Analysis of Stress Transients in Reinforced Concrete; UKAEA Atomic Energy Establishment: Abingdon, UK, 1986; Report.
  56. Malvar, L.J.; Crawford, J.E.; Wesevich, J.W.; Simons, D. A plasticity concrete material model for DYNA3D. Int. J. Impact Eng. 1997, 19, 847–873. [Google Scholar] [CrossRef]
  57. Schwer, L.E.; Malvar, L.J. Simplified concrete modeling with* MAT_CONCRETE_DAMAGE_REL3. In Proceedings of the JRI LS-Dyna User Week, Bamberg, Germany, 20–21 October 2005; pp. 49–60. [Google Scholar]
  58. Magallanes, J.M.; Wu, Y.; Malvar, L.J.; Crawford, J.E. Recent improvements to release III of the K&C concrete model. In Proceedings of the 11th International LS-DYNA Users Conference, Detroit, MI, USA, 6–8 June 2010; Livermore Software Technology Corporation: Livermore, CA, USA, 2010; Volume 1, pp. 37–48. [Google Scholar]
  59. LSTC Manual Version 970; LS-DYNA Manual; Livermore Software Technology Corporation: Livermore, CA, USA, 2006.
  60. Marais, S.; Tait, R.; Cloete, T.; Nurick, G. Material testing at high strain rate using the split Hopkinson pressure bar. Lat. Am. J. Solids Struct. 2004, 1, 219–339. [Google Scholar]
  61. Schwer, L.E.; Key, S.W.; Pucik, T.; Bindeman, L.P. An assessment of the LS-DYNA hourglass formulations via the 3D patch test. In Proceedings of the 5th European LS-DYNA Users Conference, Birmingham, UK, 25–26 May 2005. [Google Scholar]
  62. Klaiber, F.; Wipf, T.; Russo, F.; Paradis, R.; Mateega, R. Field/Laboratory Testing of Damaged Prestressed Concrete Girder Bridges; Iowa State University: Ames, IA, USA, 1999. [Google Scholar]
  63. Abendroth, R.E.; Klaiber, F.W.; Shafer, M.W. Lateral Load Resistance of Diaphragms in Prestressed Concrete Girder Bridges; Technical Report; Iowa State University: Ames, IA, USA, 1991. [Google Scholar]
  64. Yang, M.; Qiao, P.; McLean, D.I.; Khaleghi, B. Effects of overheight truck impacts on intermediate diaphragms in prestressed concrete bridge girders. PCI J. 2010, 55, 58–78. [Google Scholar] [CrossRef]
  65. Abendroth, R.E.; Andrawes, B.; Fanous, F. Steel Diaphragms in Prestressed Concrete Girder Bridges; Technical Report; Iowa Department of Transportation: Ames, IA, USA, 2004.
Figure 2. Research methodology.
Buildings 14 00640 g002
Figure 3. Illustrative examples used to verify the proposed prestressing methods: (a) single concrete cube element with a single prestressing strand element, (b) prestressed concrete beam.
Buildings 14 00640 g003
Figure 4. A flow chart for defining the prestressing force using the *INITIAL_STRESS_BEAM keyword.
Buildings 14 00640 g004
Figure 5. Axial stress results for the beam element in the concrete cube example using the corrected *INITIAL_STRESS_BEAM and *DYNAMIC_RELAXATION keywords.
Buildings 14 00640 g005
Figure 6. Axial stress results for the strand element in the concrete cube example using *INITIAL_AXIAL_FORCE.
Buildings 14 00640 g006
Figure 7. Stress results for strand and concrete elements in the cube example at different temperatures.
Buildings 14 00640 g007
Figure 8. An example of dynamic relaxation curves used in the temperature method.
Buildings 14 00640 g008
Figure 9. Achieved camber in the prestressed concrete beams (scaled 50 times).
Buildings 14 00640 g009
Figure 10. Stress contour of the prestressed concrete beam.
Buildings 14 00640 g010
Figure 11. Achieved stresses at the top and the bottom fibers of the prestressed concrete beam example.
Buildings 14 00640 g011
Figure 12. Stresses at the top and the bottom fibers of the prestressed concrete beam example at different DRTOL values: (a) top side, (b) bottom side.
Buildings 14 00640 g012
Figure 13. Objectives of the experimental data selected for the FE model validation.
Buildings 14 00640 g013
Figure 14. Details of reinforced concrete beam impact test performed by Fujikake et al. (2009) [46].
Buildings 14 00640 g014
Figure 15. FE model of the reinforced concrete beam.
Buildings 14 00640 g015
Figure 16. Impact response of the RC models, in the case of 0.3 m drop height.
Buildings 14 00640 g016
Figure 17. Impact response of the RC models, in the case of 1.2 m drop height.
Buildings 14 00640 g017
Figure 18. Results of the peak impact force for different HG types normalized to the experimental data, in the case of 0.3 m drop height.
Buildings 14 00640 g018
Figure 19. Results of the peak impact force for different HG types normalized to the experimental data, in the case of 1.2 m drop height.
Buildings 14 00640 g019
Figure 20. Effective plastic strain damage patterns of the RC FE beams using different concrete constitutive models: (a) drop height = 0.3 m, (b) drop height = 1.2 m. Effective plastic strain values quantify the amount of plastic deformation that a material undergoes beyond its elastic limit under loading conditions.
Buildings 14 00640 g020
Figure 21. Schematic diagram of the impact test setup performed by Kelly (2011) [31].
Buildings 14 00640 g021
Figure 22. FE model of the prestressed concrete beam.
Buildings 14 00640 g022
Figure 23. Impact response of the prestressed concrete beam with different material models and strain rate effect analysis.
Buildings 14 00640 g023
Figure 24. Iowa A38 girder details (dimensions in mm; 1 mm = 0.04 in).
Buildings 14 00640 g024
Figure 25. Iowa laboratory bridge cross-sectional view (dimensions in m; 1 m = 3.28 ft).
Buildings 14 00640 g025
Figure 26. FE model of the Iowa laboratory bridge.
Buildings 14 00640 g026
Figure 27. Boundary conditions and constraints in the FE bridge model.
Buildings 14 00640 g027
Figure 28. Validation of the bridge FE model through load-vertical displacement analysis.
Buildings 14 00640 g028
Figure 29. Validation of the bridge FE model through load-lateral displacement analysis.
Buildings 14 00640 g029
Figure 30. Rigid impact scenario of the FE bridge models.
Buildings 14 00640 g030
Figure 31. Kinetic energy and momentum of the rigid impactor at different speeds and masses: (a) kinetic energy, (b) momentum.
Buildings 14 00640 g031
Figure 32. Peak impact forces at different impact speeds and masses.
Buildings 14 00640 g032
Figure 33. Lateral and vertical displacements due to impact at different speeds and masses: (a) lateral displacement, (b) vertical displacement.
Buildings 14 00640 g033
Figure 34. Comparison of impact forces for the FE prestressed and reinforced concrete girder bridge models subjected to a one ton impactor at different speeds: (a) 8 km/h, (b) 16 km/h, and (c) 24 km/h.
Buildings 14 00640 g034
Figure 35. Comparison of lateral displacements for the FE prestressed and reinforced concrete girder bridge models subjected to a one ton impactor at different speeds: (a) 8 km/h, (b) 16 km/h, and (c) 24 km/h.
Buildings 14 00640 g035
Figure 36. Effective plastic damage patterns of the prestressed girder bridges at different impact masses and speeds: (a) 8 km/h, (b) 16 km/h, and (c) 24 km/h. Effective plastic strain values quantify the amount of plastic deformation that a material undergoes beyond its elastic limit under loading conditions.
Buildings 14 00640 g036
Figure 37. Variation in the axial stress of the most severely damaged strand during the impact event.
Buildings 14 00640 g037
Table 1. Impact study parameters.
ParameterValues
Impact speed (3 variables)8, 16, and 24 km/h (5, 10, and 15 mph)
Impactor mass (4 variables)1, 2, 3, and 4 tons
Prestressing force (2 variables)Existing, and No Prestressing Force
Disclaimer/Publisher’s Note: The statements, opinions and data contained in all publications are solely those of the individual author(s) and contributor(s) and not of MDPI and/or the editor(s). MDPI and/or the editor(s) disclaim responsibility for any injury to people or property resulting from any ideas, methods, instructions or products referred to in the content.

