Article

Emotional Landscapes in Urban Design: Analyzing Color Emotional Responses of the Elderly to Community Outdoor Spaces in Yi Jie Qu

1
College of Architecture and Urban-Rural Planning, Sichuan Agricultural University, Chengdu 611130, China
2
Faculty of Environmental Engineering, The University of Kitakyushu, Kitakyushu 808-0135, Japan
3
Second Investigation and Planning Team, Sichuan Provincial Institute of Forestry and Grassland Inventory and Planning, Chengdu 610081, China
*
Authors to whom correspondence should be addressed.
Buildings 2024, 14(3), 793; https://doi.org/10.3390/buildings14030793
Submission received: 1 February 2024 / Revised: 1 March 2024 / Accepted: 4 March 2024 / Published: 14 March 2024
(This article belongs to the Special Issue Urban Sustainability: Sustainable Housing and Communities)

Abstract

:
Addressing the emotional needs of the elderly in urban space design has increasingly become a vital concern. This study innovatively integrates emotional theories with the design of community outdoor spaces, thereby expanding the research on emotional categorization in urban spaces. At 8 community outdoor space sites in Yi Jie Qu, China, 330 elderly residents were randomly recruited to assess their color emotional responses (CER) to the color landscapes of these spaces. Based on the Affective Circumplex Model and Japanese Color Image Theory, a Color Emotion Circumplex was constructed to visually represent the overall emotional tendencies and significant positive emotions of the elderly. The second innovation of this research lies in exploring the driving factors behind positive emotional responses of the elderly, the primary user group of community outdoor spaces. We analyzed the significant differences in CER between autumn and winter scenes, employing variance analysis, correlation, and regression to investigate the substantial effects of individual factors and color characteristics on positive CER. The study discovered that the elderly exhibit a stronger CER towards clean and healthy emotions. Notably, CER was more pronounced in autumn scenes compared to winter. Furthermore, educational level, visit frequency, and color brightness positively influenced positive CER, whereas walking time from residence and the color area ratios of blue and gray negatively impacted CER. These findings not only provide a theoretical basis for age-friendly color design in community spaces, but also offer new perspectives and practical guidance for the international community planning and design domain. Our research underscores the importance of incorporating the emotional needs of the elderly into urban space design, offering novel theoretical and practical guidance for future urban planning and community design.

1. Introduction

As the global population aging situation intensifies, academia has shown a growing interest in expediting age-friendly development. The World Population Prospects report (2022), published by the United Nations, predicted the growth of the elderly population. The proportion of individuals aged 65 and above is expected to increase from 10 percent in 2022 to 16 percent in 2050 (World Population Ageing 2022). The aging trend is also significant in China, which has emerged as one of the countries with the largest and fastest-growing elderly populations in the world [1]. The majority of the elderly in China spend their later years mainly at home and in the community. Thus, the community not only bears the primary social responsibility for aging but also is the fundamental spatial unit for achieving aging in place [2]. As a component of community space, various outdoor spaces serve as the main spatial carriers for the elderly in China to engage in community public life and neighborhood interaction. Numerous previous studies have demonstrated that the elderly can benefit in terms of social, mental, and physical well-being by participating in community outdoor activities [3]. Enhancing the use of outdoor public spaces and creating opportunities for positive activity can contribute to the physical and social well-being of the elderly [4].
In addition, visual perception and exposure to real-life natural environments offer additional mental health benefits when participating in physical activity [5]. Among all visual elements, color stands out as the initial element of visual perception, occupying 80% of the initial visual information when the viewer observes their surrounding environment. Color is one of the potent visual symbols used by people to perceive urban characteristics and community environments [6], directly influencing the viewer’s visual comfort [7] and inner feelings in urban space. Thus, it can be seen that the color creation of age-friendly community outdoor spaces is crucial to promoting elderly people’s well-being. Consequently, it is imperative to investigate the color emotional responses (CER) of the elderly to community outdoor spaces, so as to capture public emotional needs and promote the construction of age-friendly communities.

1.1. Association between Color and Emotion

The influence of color on human emotions is widely recognized in academia. Color is a complex synthesis of the brain’s response to visual stimulation, which is associated with the inner feelings and preferences of people [8]. For instance, blue is linked to credibility, high quality, relaxation, tranquility, coolness, and cheerfulness [9], while red is associated with joy, festivity, anger, tension, exhaustion, etc. [10]. In another example, blue flowers are found to play an effective role in relaxation and stress reduction, while flowers in orange, yellow, and red evoke uplifted emotions and deliver better positive affect [11]. In general, human emotions can be categorized positive, neutral, and negative categories, and people’s emotions toward the color landscape can similarly be roughly divided into these three categories [12,13]. Positive emotions tend to be lively, aspiring, and warm, while negative emotions tend to be restless, anxious, and cold [14]. Moreover, previous studies have demonstrated correlation between color and emotion in both language images [15,16] and the visual perception of colors [17]. Therefore, it is feasible to link color and semantics to study human perception of the environment.

1.2. Color Emotion Classification

Regarding human emotion responses to the environment, the affective circumplex model [18,19] provides an effective approach to categorize and describe the intensity of emotional responses [20,21]. As illustrated in Figure 1a, this model utilizes two bipolar dimensions of emotion responses to characterize human emotions. Pleasant–unpleasant (“valence”) characterizes whether the emotional response is positive or negative, and arousing–sleepy (“arousal”) describes the degree of feeling active. The model is typically visualized as a two-dimensional chart with valence on the X-axis and arousal on the Y-axis. In recent years, the Nippon Color & Design Research Institute (NCD) in Japan has introduced a color image theory for the color application field, identifying 130 color semantic words closely related to the design application field [22]. These words associate people’s psychological and physiological feelings with color and are strongly relevant to the study of color design in community outdoor spaces. Current research linking spaces or landscapes to emotions often addresses only a few basic types of emotions. However, human emotional experiences are so complex that it is necessary to further subdivide the emotion categories based on eight basic emotions, including arousing, exciting, pleasant, relaxing, sleepy, gloomy, unpleasant, and distressing [19] to advance landscape-emotion linkage studies.

1.3. Factors Affecting Landscape Perception and Preference

Color landscape perception is an interaction process between humans and the color landscape. From the initial color stimulus to color perception, and then to the human emotional reaction, color emotion is influenced by both landscape characteristics and individual factors of the viewer. Previous studies have confirmed the influence of color physical characteristics have a significant impact on scenic beauty of forest landscape [23], and visual comfort of subway space [24]. For example, the blue and white flower colors are perceived as the most relaxing, while orange, white, yellow, and red flower colors are deemed the most exciting [11]. Generally, people have different emotional responses to colors under different conditions of color saturation [25]. As urban color research progresses, a large number of existing studies on blue-green spaces emphasized the effects among landscape color, perception, emotion, and psychological processes. Pleasant blue-green spaces have a good healing effect on people [26]. Moreover, the elderly prefer brighter colors that combine darker and lighter colors, compared to younger people [27].
In addition, demographic factors also affect landscape perception, which mainly include age [28,29], gender [30,31], cultural background [32], education level [33,34], place of residence [35], frequency of perception [36], and environmental familiarity [37], etc. In addition, seasonal change is probably cause differences in people’s perception of the landscape environment. For example, a study of seasonal rice terrace landscapes in Japan showed that tourists had a higher overall positive experience in summer than in autumn, which was related to the barrenness of farmland in autumn [38]. Another study of landscape features affecting visitor density in integrated parks showed that zones with a higher shading degree attracted more visitors in summer and deterred visitors in winter [39]. Therefore, color emotion assessment can borrow three dimensions of visual landscape perception, including the subjective psychology of space users, objective landscape characteristics and seasonal change describing time (Figure 1b).

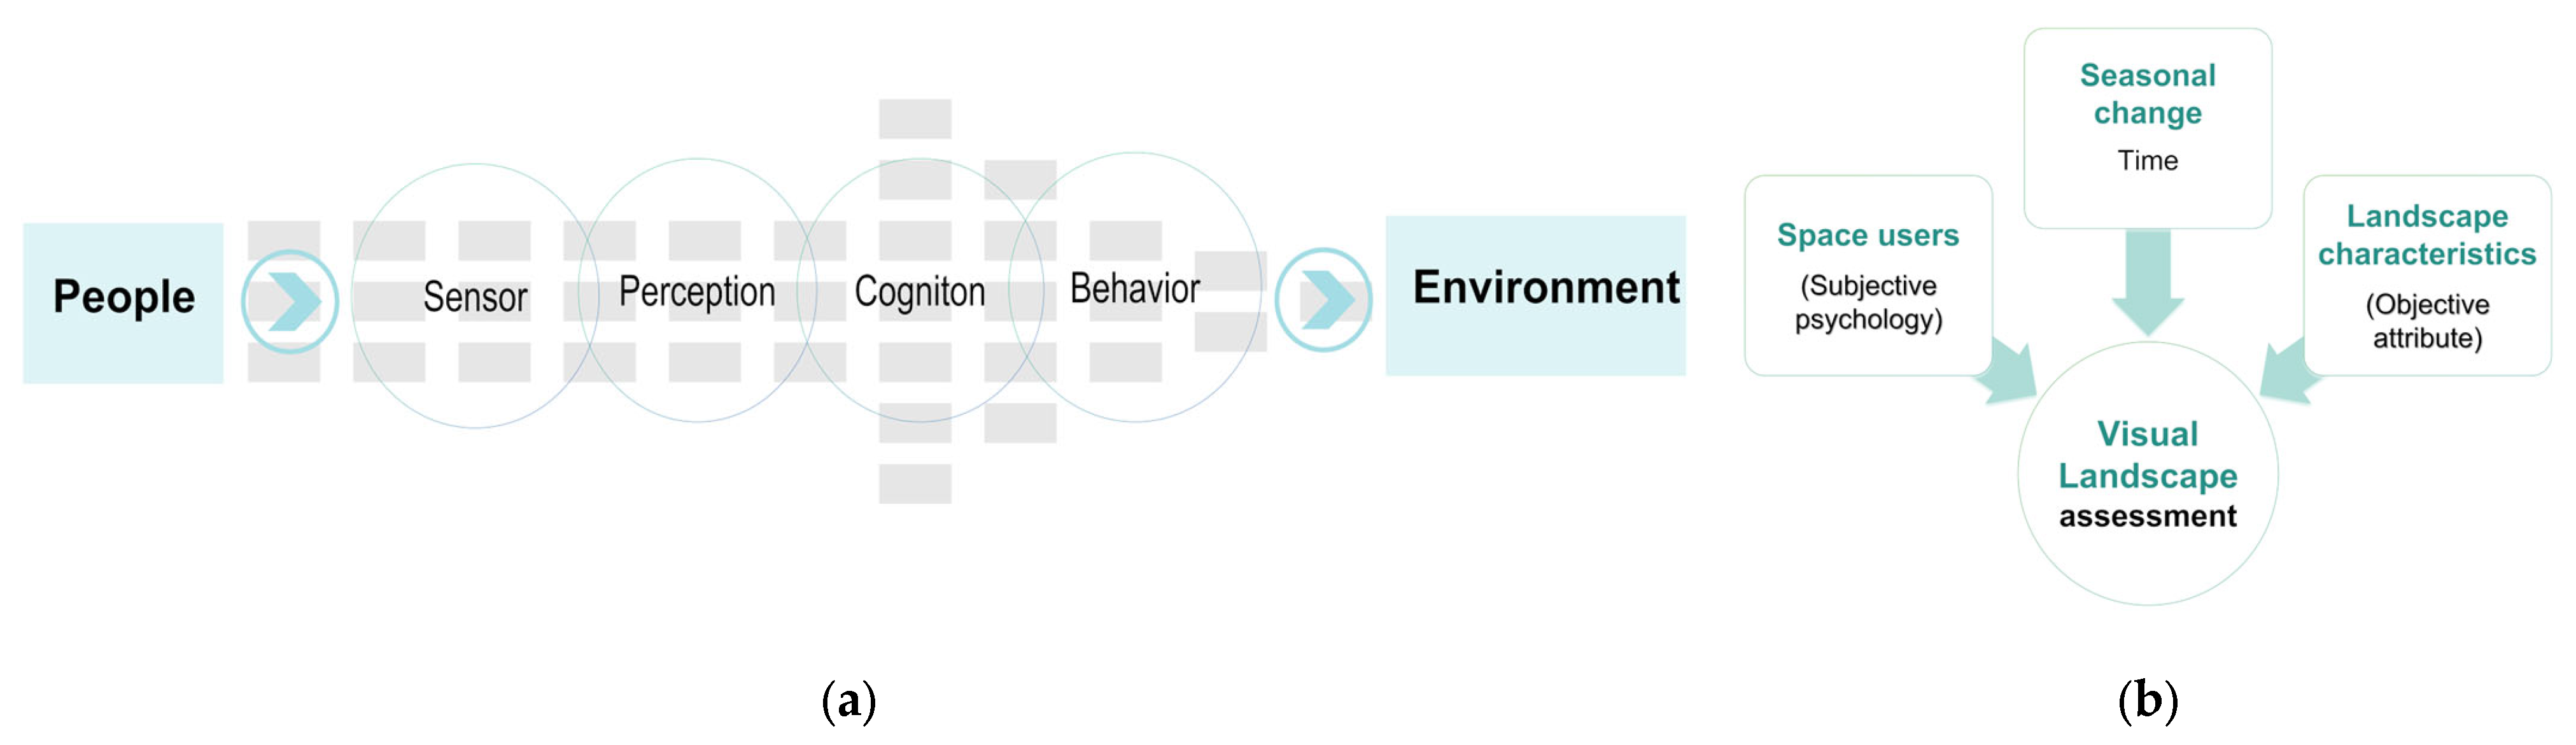
1.4. Psychological Process of Space and Environment Perception

Environmental psychology explores human–environment interactions, and has found extensive applications in urban design and landscape creation. Environmental psychology examines the transactions between individuals and their built and natural environments [40]. The theory of environmental psychology generally divides the perception process into four steps: sensation, perception, cognition, and behavior [41,42,43] (Figure 1b). Among them, cognition is the result of the observer’s emotional processing and logical reasoning, taking into account his or her cultural background, real-life situation, and thinking ability. Behavior is an individual’s processing of perceived environmental information, which includes both inner tendency, preference, and emotions, as well as external behaviors [42]. CER in the study is one aspect of the environmental perception process. Consequently, the environmental psychology offered a strong theoretical guide to color perception and emotional response. CER can be comprehended as an inner component during people’s perceived color landscape.

1.5. Research Gaps Identification and Study Aims

Previous studies on urban color landscape have mainly focused on discussing the visual quality and visual impacts of specific spatial elements. Examples include vegetation color in a community and park [32,44,45], forest color [23,29], architectural color [7,17,46], and road color safety [47], as well as the network correlation of macro urban facade color [21,36]. However, there is a lack of color landscape discussions at a scale of community daily public space. Existing studies on color landscapes and color perception among the elderly have primarily centered on the color of senior care buildings [48,49], with limited exploration of outdoor spaces. The elderly are the main users of community outdoor spaces, and CER assessment surveys targeting them are essential to enhance public emotions and promote sustainable development in local communities. However, existing research on the factors influencing CER has not been deeply studied. It is necessary to integrate the demographic factors of the subjects, the color characteristic indicators of the objects, and the seasonal change factor represented by time into the discussion of the effects on CER, to further clarify the association between color landscape and emotional responses. Thus, this study recruited 330 elderly residents from Yi Jie Qu, China, to participate in an on-site semantic differential experiment assessing CER of the elderly to eight community outdoor spaces. The aim was to acquire quantitative information on CER for age-friendly color design in community outdoor spaces by answering the following questions.
  • Do the elderly exhibit overall emotional tendency toward color landscape of their community outdoor spaces?
  • Are there significant positive CER differences between autumn and winter scenes of community outdoor spaces?
  • Do color characteristics and individual factors significantly influence the positive CER of the elderly?

2. Theoretical Framework

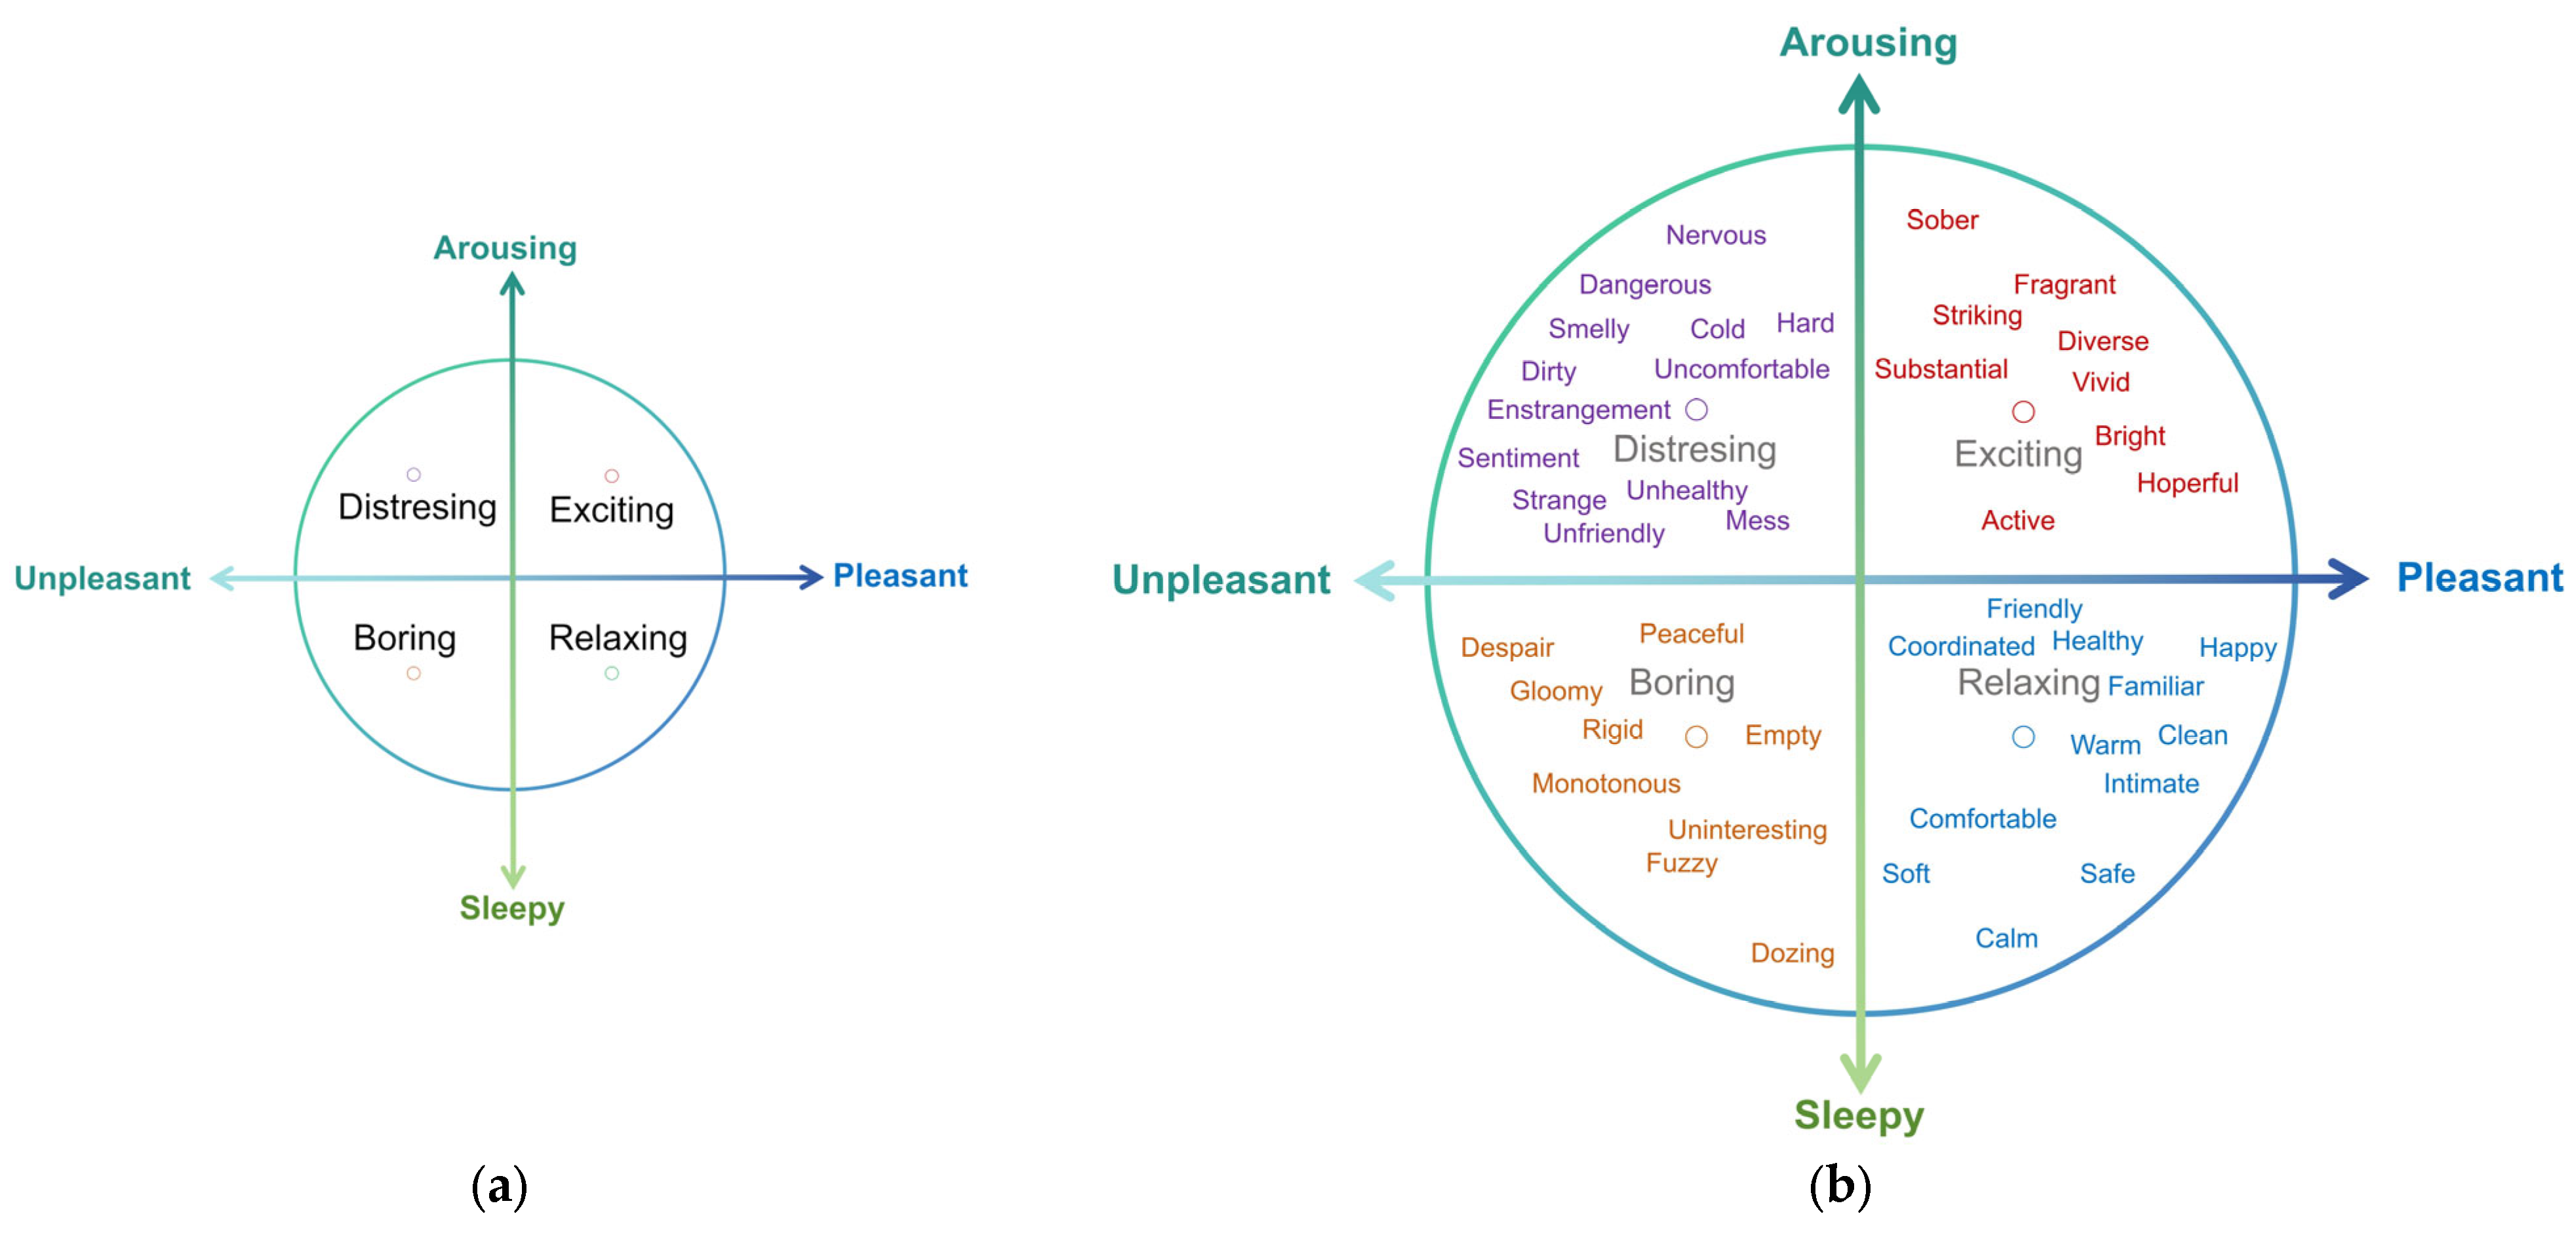
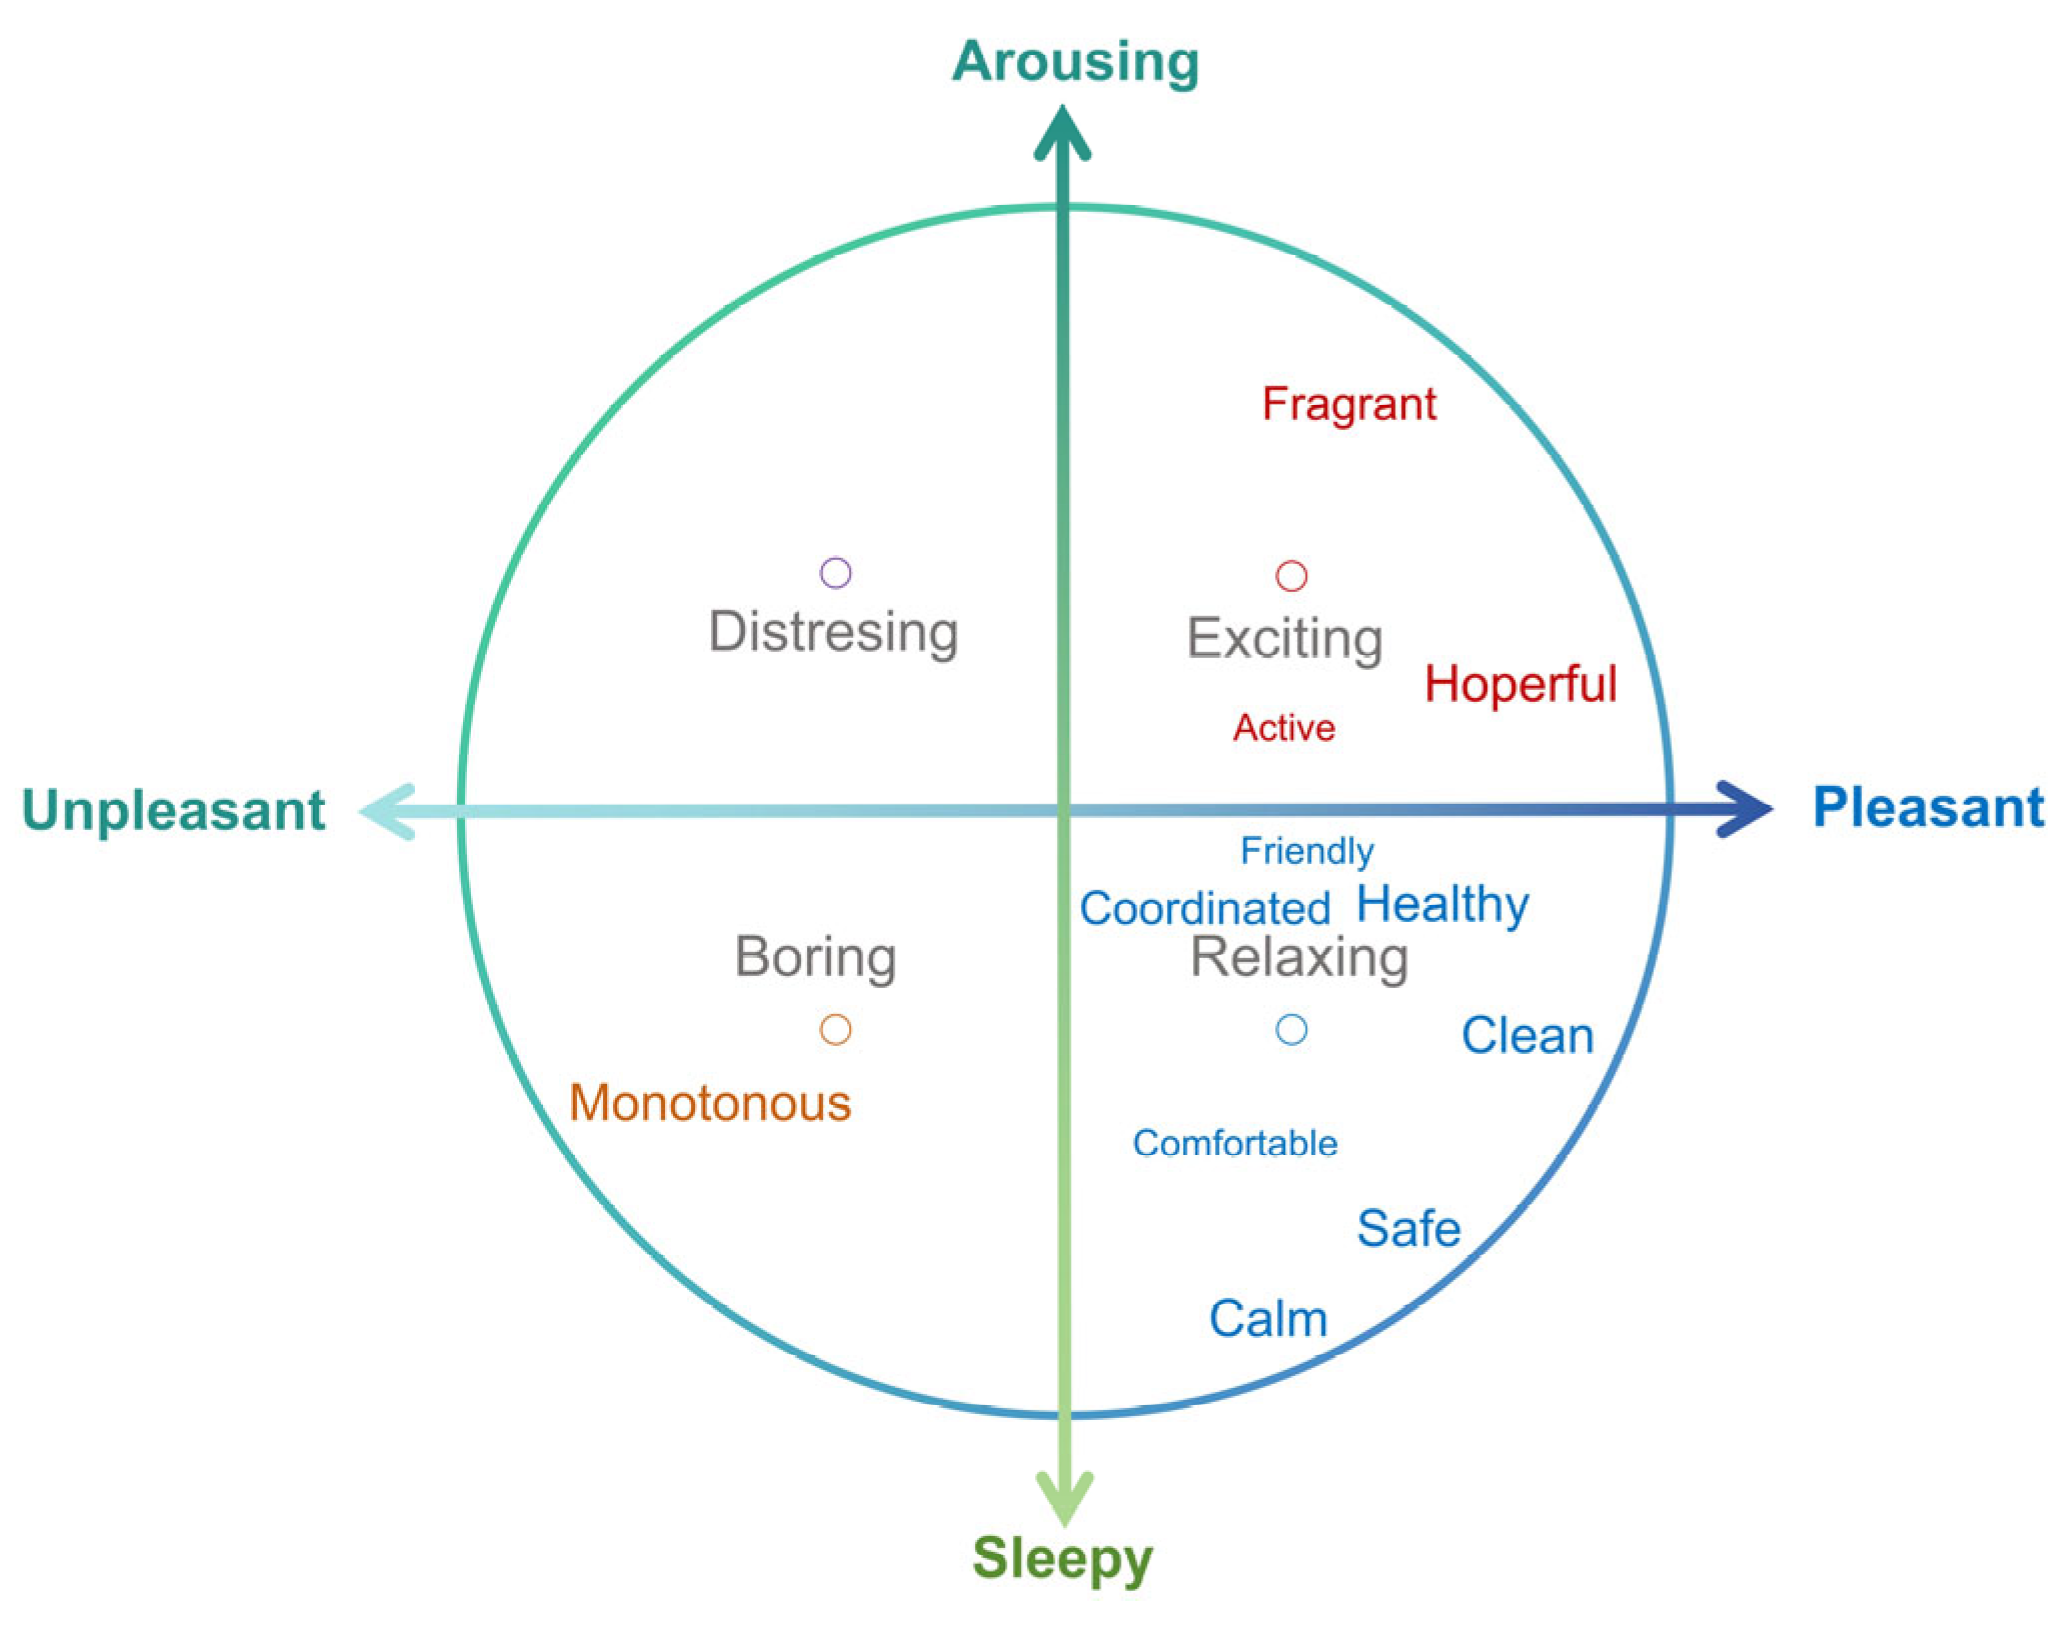
2.1. Color Emotion Circumplex Model

In accordance with the affective circumplex model (Russell) [18,19] and the color image theory in Japan [22], this study selected 19 sets of color image word pairs from 130 color images. These word pairs were closely related to the physical and mental health of the elderly. To further understand the color emotional needs of the elderly within a community, interviews were conducted with community managers and color design experts. The results indicated that most of the elderly in the community exhibit a preference for familiar environments and enjoy engaging in friendly and interesting activities. Consequently, three additional pairs of color emotions were introduced: familiar–unfamiliar, friendly–unfriendly, and interesting–boring pairs. Eventually, a color emotion circumplex model was built, comprising 22 pairs of emotions. Adapted from the affective circumplex model and Japanese NCD color images, this model includes 9 color emotions associated with boring, 9 with exciting, 14 with distressing, and 12 with relaxing (Figure 2a,b).

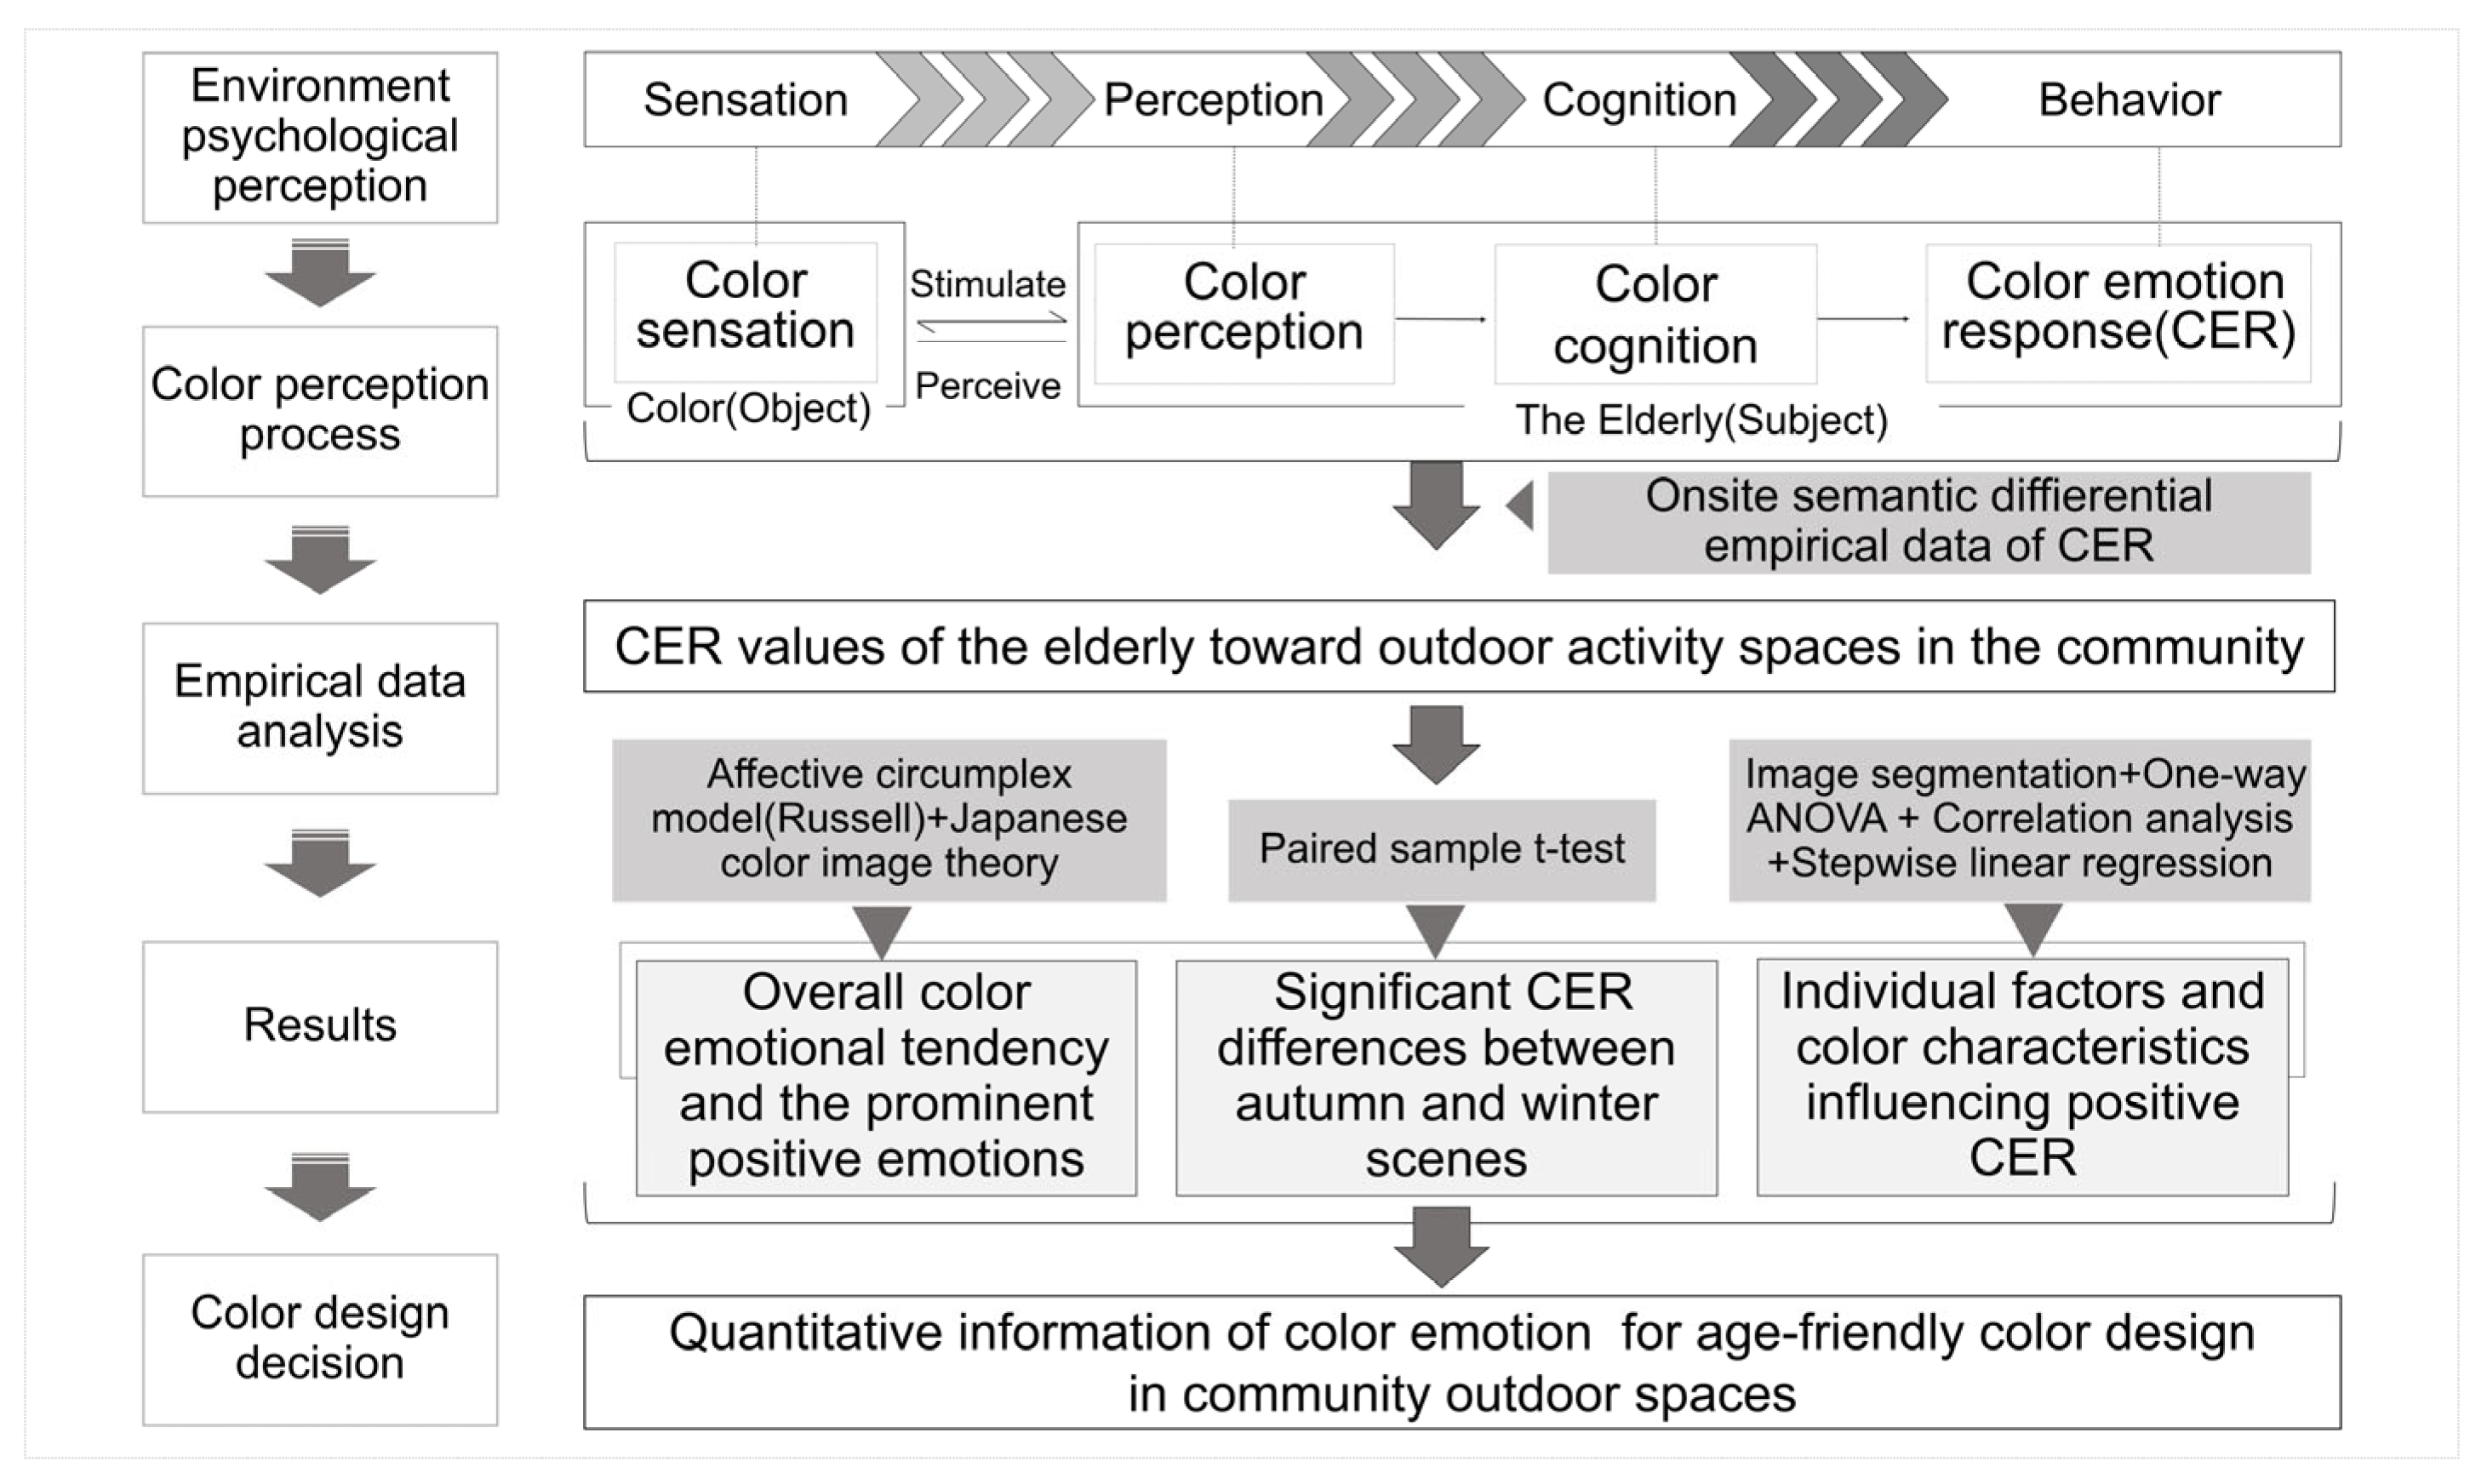
2.2. Study Framework for CER Assessment of the Elderly toward Community Outdoor Spaces

Drawing upon the psychological process of human environment perception, the CER process can be similarly divided into four stages: color sensation, color association, color image cognition, and the ultimate CER. Based on previous studies on the influencing factors of visual landscape [25,26,28,33,36], this study introduced the color landscape as an object, the elderly as a subject, and the seasonal factors representing time, to examine the effects of these elements on CER. This study is dedicated to exploring the overall CER tendencies of the elderly, testing significant differences in CER between autumn and winter scenes, as well as examining the significant effects of individual factors and color characteristics on CER. Finally, a study framework for assessing the CER of the elderly toward their community outdoor spaces has been constructed, as shown in Figure 3. This study aims to identifying the overall color emotional needs of the elderly and exploring the significant factors influencing CER in community outdoor spaces. The findings are intended to provide quantitative information and decision support for the community color creation.

3. Data and Methods

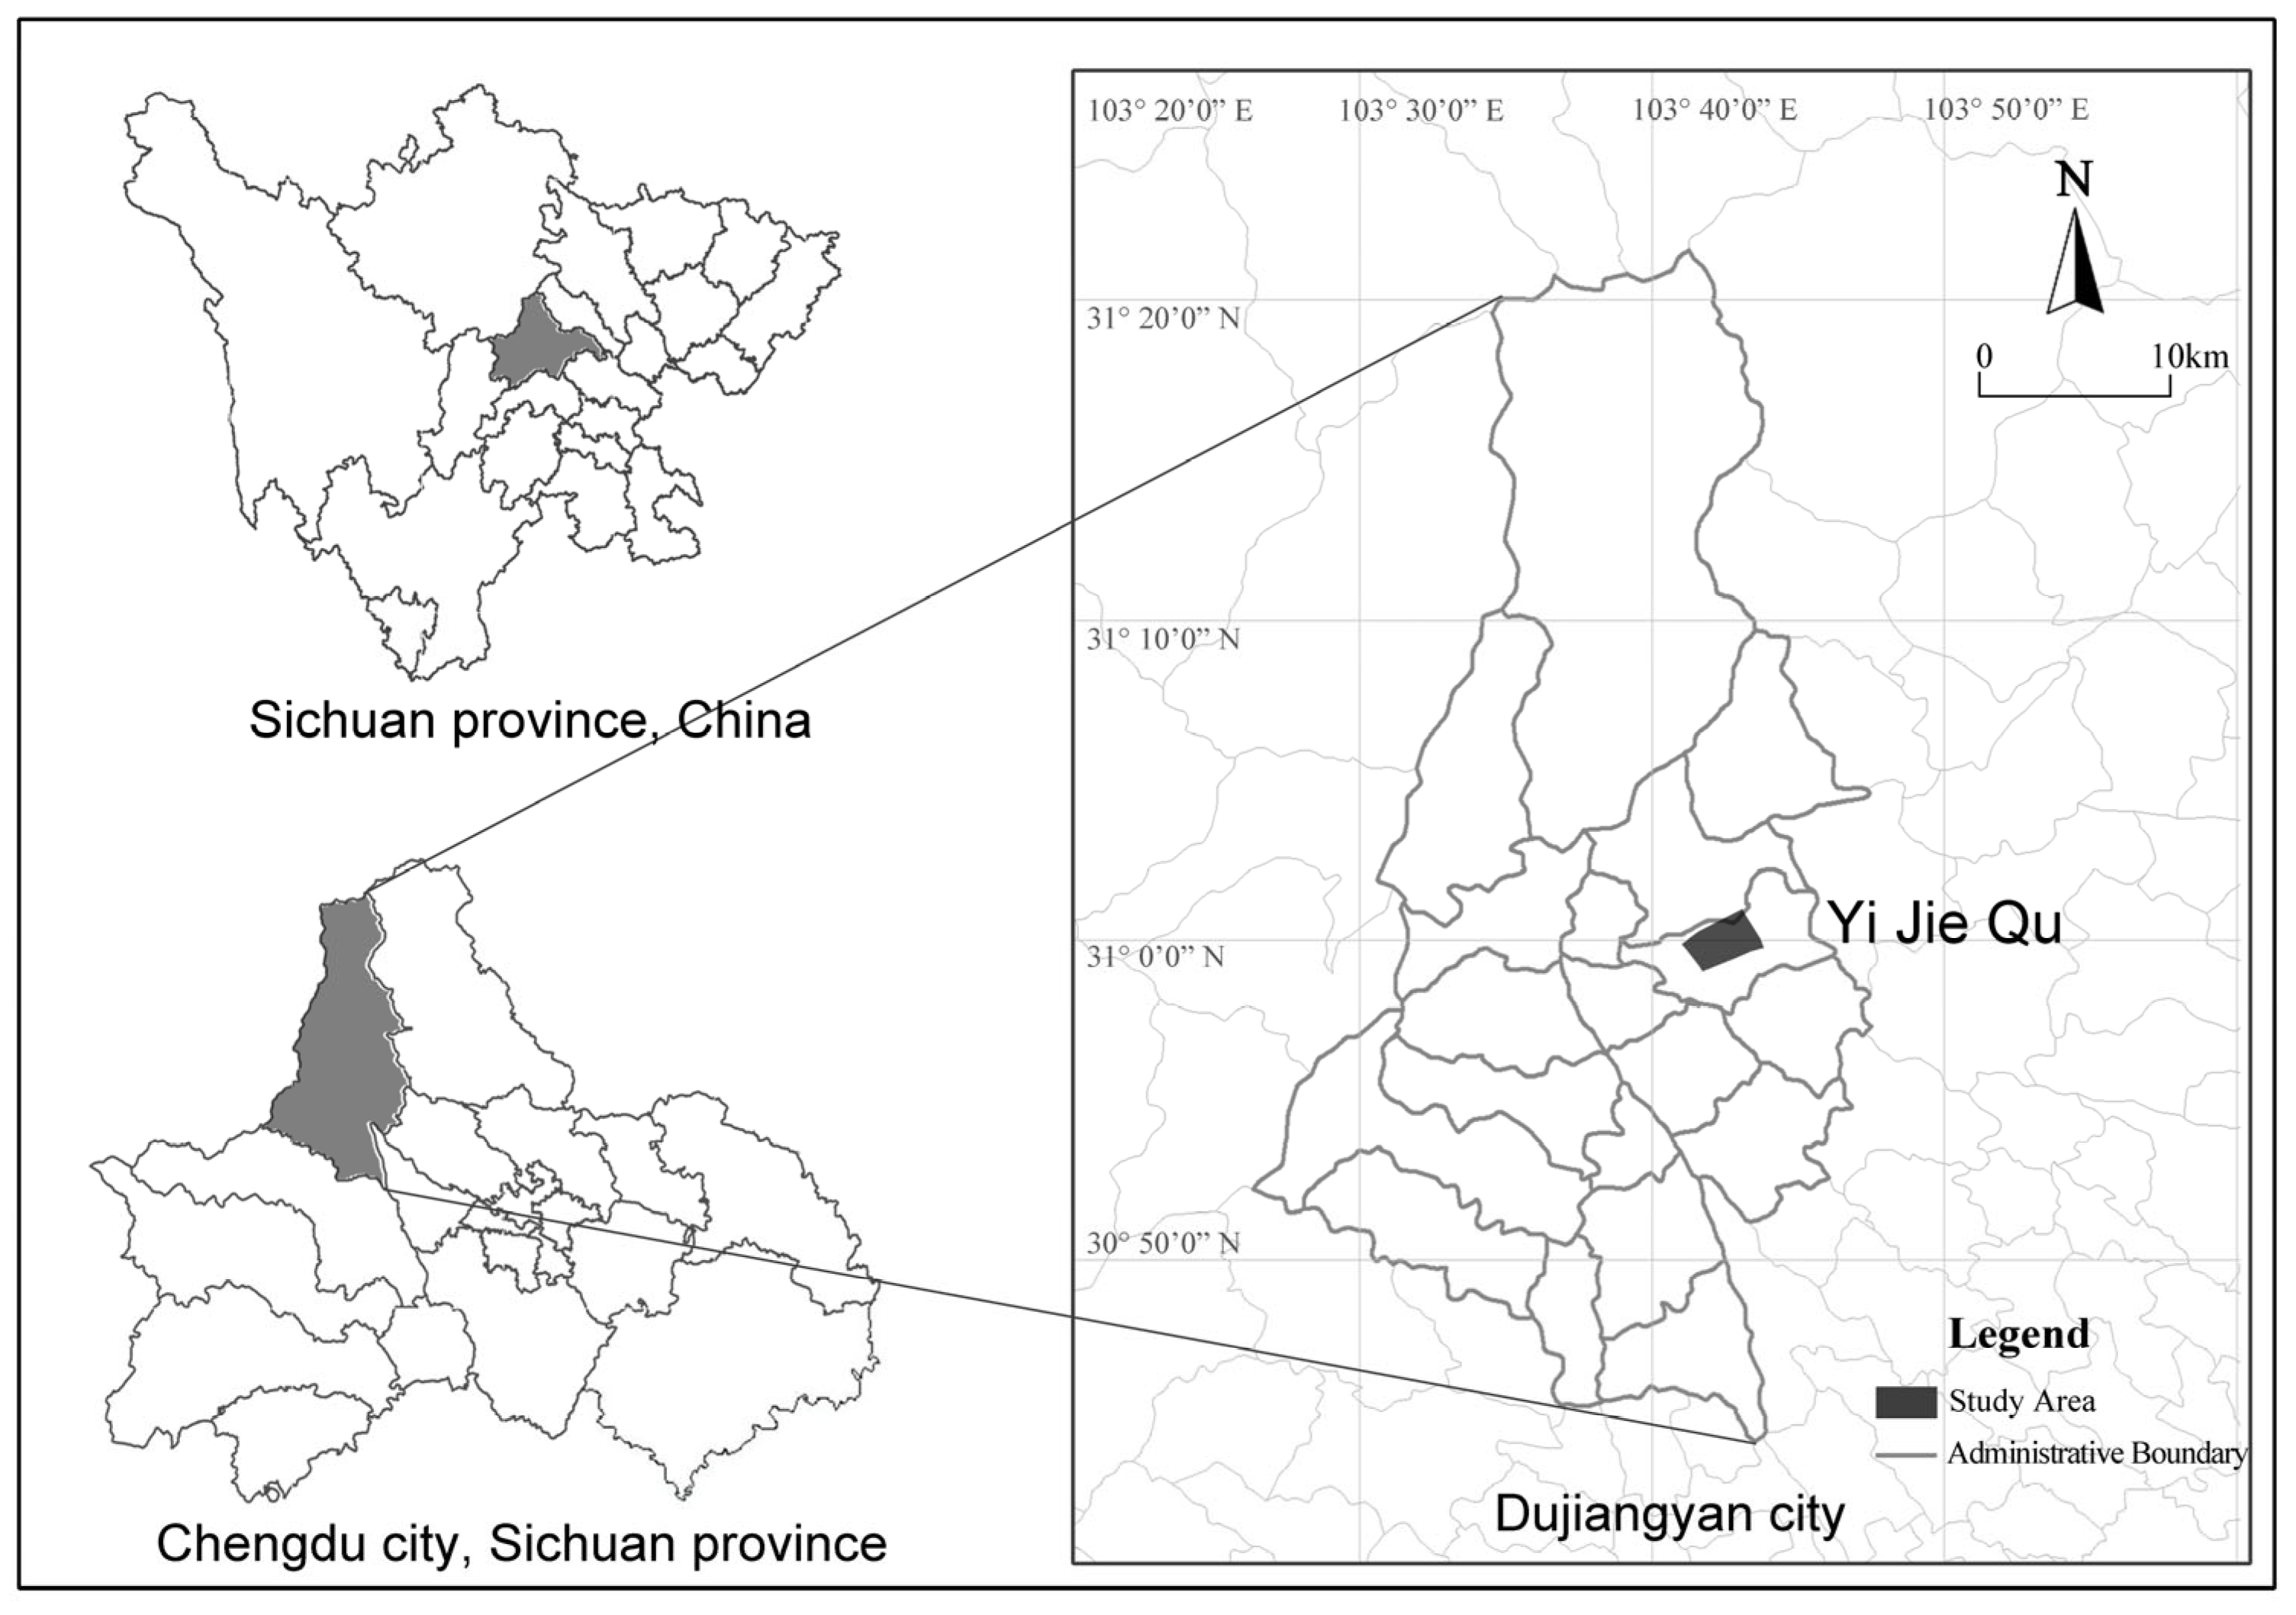
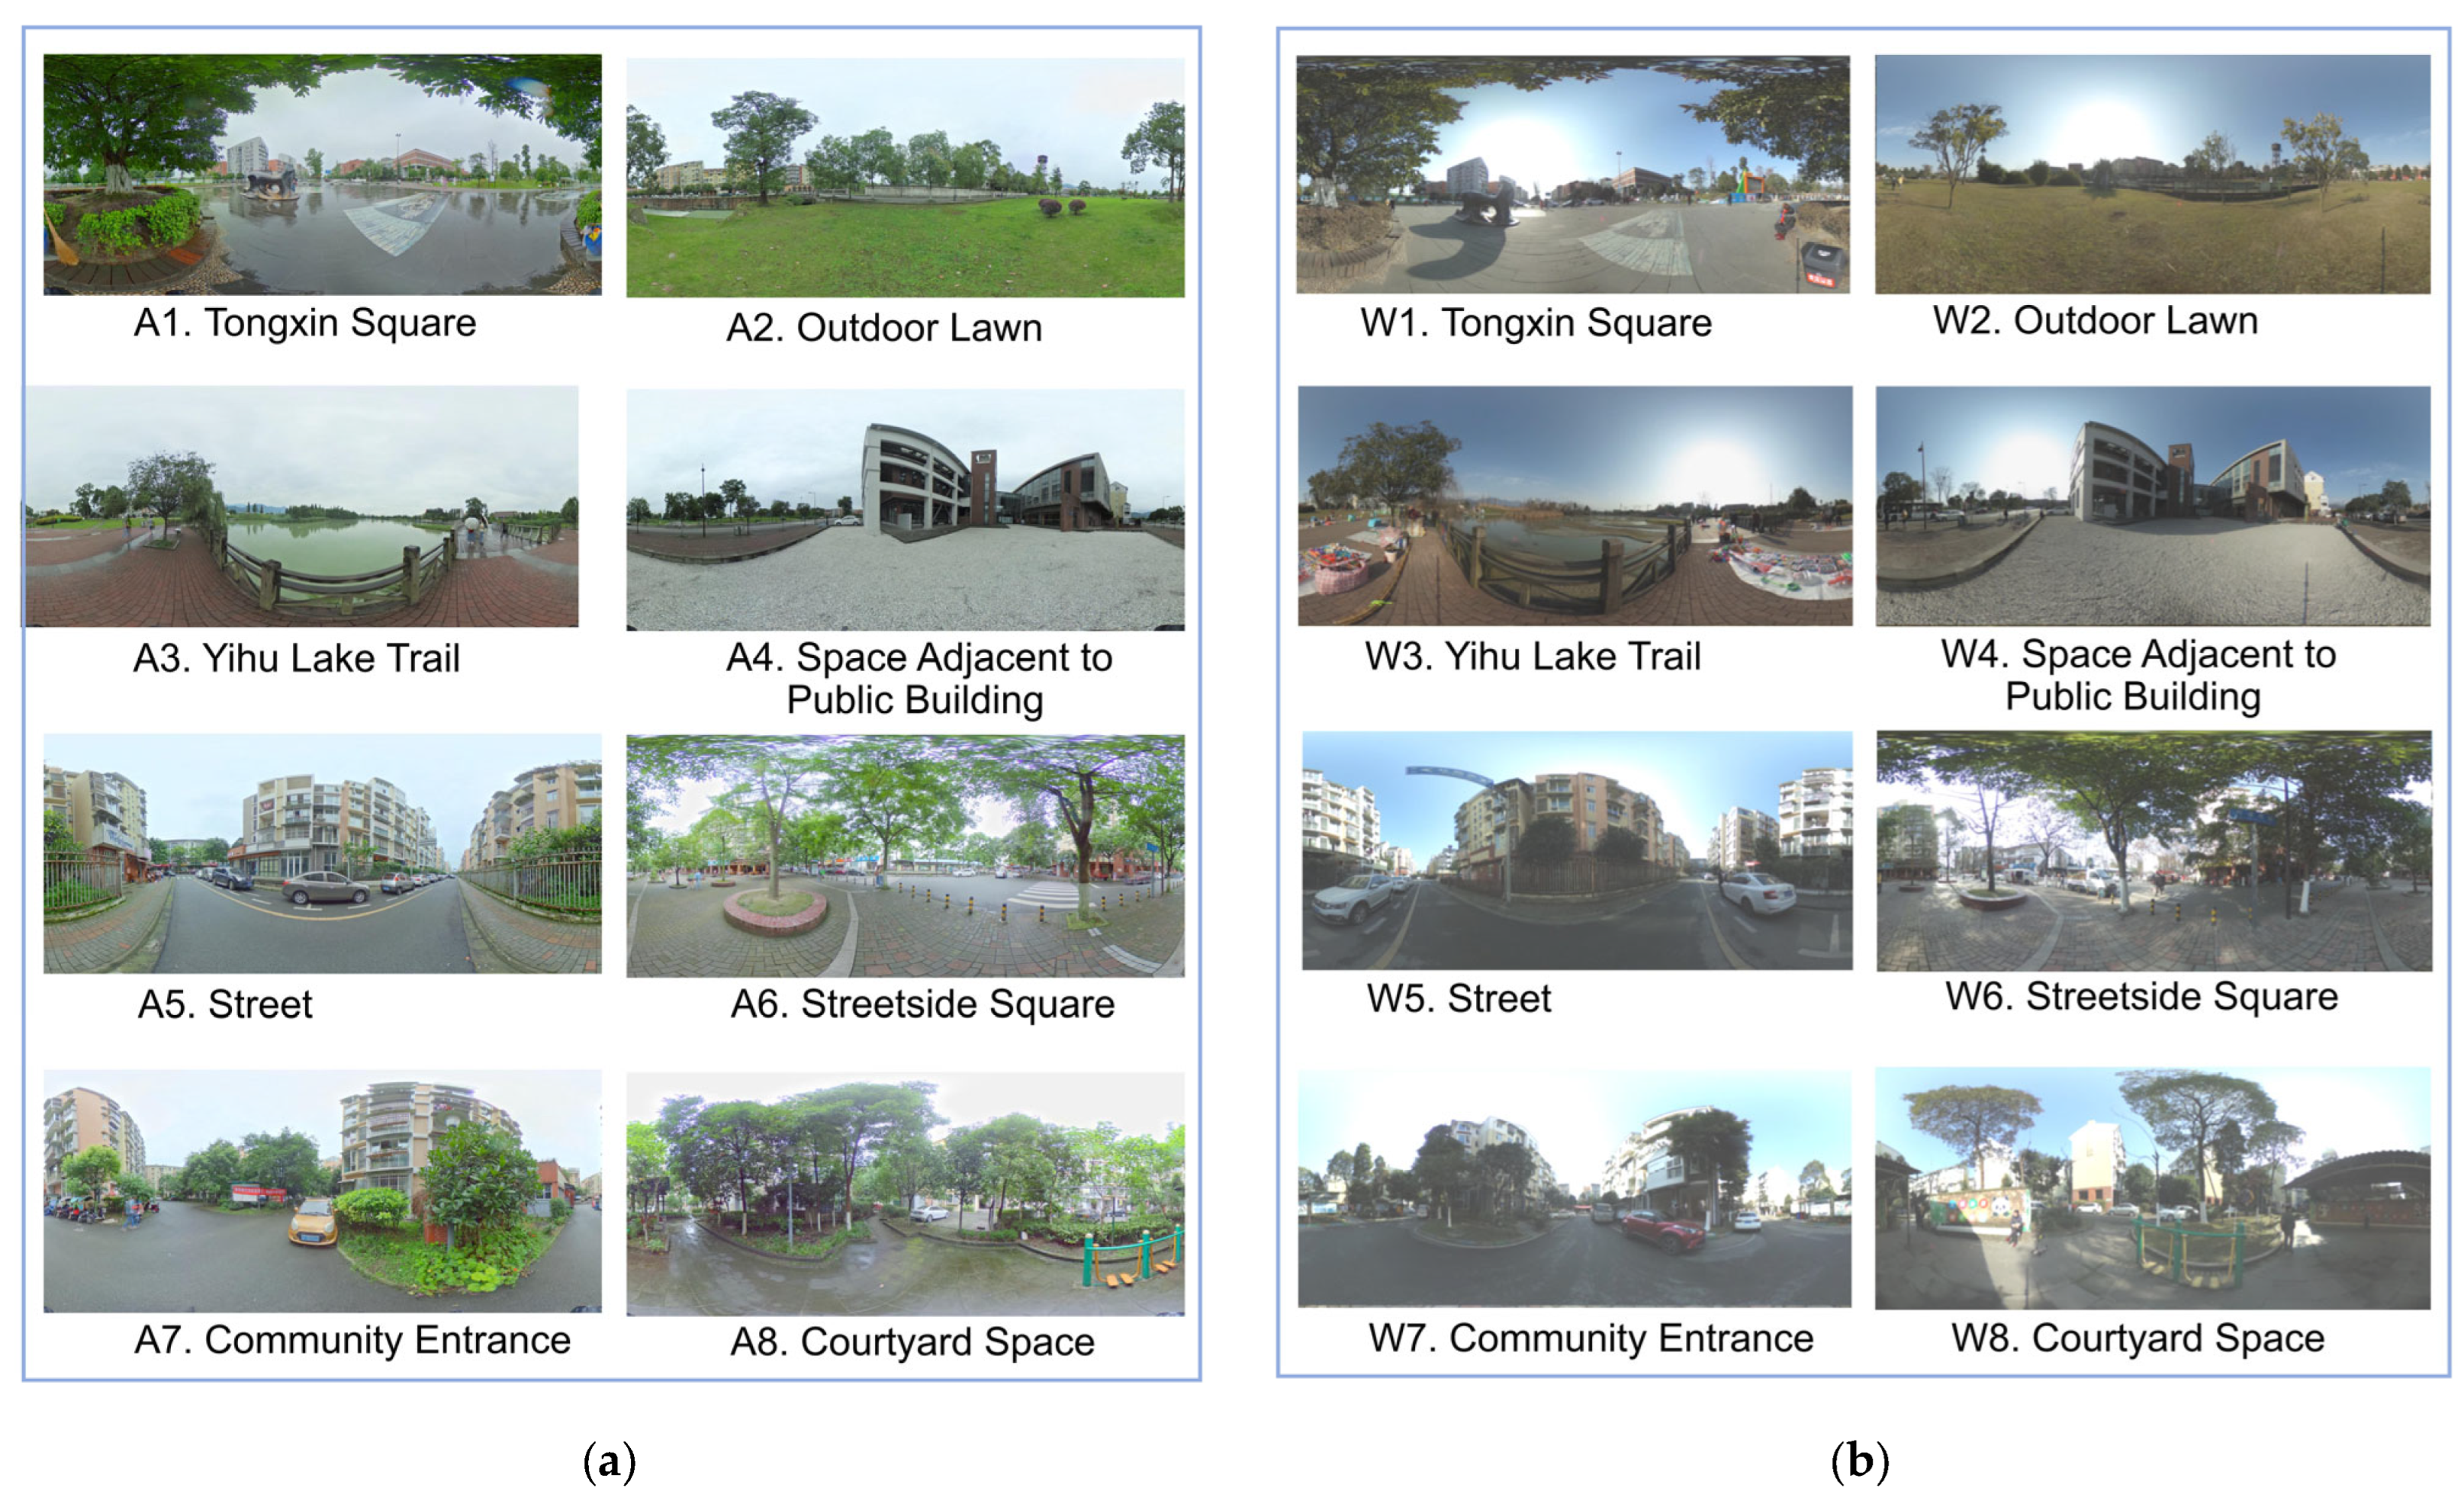
3.1. Case Study Area

Dujiangyan city is a millennia-old cultural city in China, and Yi Jie Qu is located in the northern part of Dujiangyan city (N 31°0′23″, E 103°37′30″), northwest of Chengdu city, Sichuan province, as depicted in Figure 4. It is nestled beneath the Lingyan Mountain and along the banks of the Puyang River, covering an area of approximately 1.5 square kilometers. Yi Jie Qu is a significant reconstruction project after the Wenchuan earthquake in China. Through more than a decade of hard work, the area has been transformed into a vibrant community. According to the interview with this community management organization (interview in October 2022), there are a total of 2953 elderly residents in the community, roughly accounting for one-third of the total population. Furthermore, the elderly constitute over 80% of residents participating in daily activities within community outdoor spaces. There are 24 OASs in Yi Jie Qu, including squares, streets, parks, and courtyards in this community. Among them, eight OASs had a higher frequency of daily participation and a larger in size, as shown in Figure 5. Besides, Yijie Qu’s blue-green space was deliberately planned and constructed [50], with a large proportion of blue and green colors and a beautiful ecological environment of the community.

3.2. Color Data Collection

Color data was collected during autumn and winter. In autumn, data collection occurred on cloudy days between 10 and 15 October 2022. In winter, the elderly are more inclined to engage in outdoor activities on sunny days. Therefore, winter data were collected on sunny days from 10 to 15 January 2023. Scene photographs of eight community outdoor spaces were collected by on-site panoramic shots using a DSLR camera (Nikon D780, Nikon Corporation, Tokyo, Japan). The photographer maintained a fixed position in each outdoor space, taking 4–5 consecutive photographs of that space from various angles. Subsequently, the photographs were connected into a panorama picture using Adobe Photoshop 2020 software (Adobe Systems Incorporated, San Jose, CA, USA). This work required a panoramic view of a outdoor space as complete as possible while keeping the sight distance at a medium distance level. With reference to the average eye height of Chinese adults, the camera was consistently positioned 1.6 m from the ground. This ensured that the photographs were taken as close as possible to the perspective of people.
To minimize the sampling influence caused by variations in direct sunlight intensity, the scene photographs were taken between 3 h after sunrise and 3 h before sunset (9:00 a.m.–3:00 p.m.), a period when the color temperature of daylight remains relatively stable. Ultimately, two sets of scene photographs were collected from eight sample sites during autumn and winter, as shown in Figure 6. These photographs were used for CER assessment and as a data source for color objective characteristics.

3.3. Questionnaire Investigation

A total of 330 elderly people were recruited through random sampling with informed consent to participate in an on-site SD experiment conducted in community outdoor spaces. The questionnaire investigation procedure comprised three parts: a color screening test, a survey of individual information, and an on-site SD experiment.

3.3.1. Color Screening Test

The initial stage involved a color screening test, consisting of two steps. Based on the colorblindness and color weakness tests (two questions), there was an additional color association test for the three primary colors and the three secondary colors (six questions). If elderly respondents could give some associations and verbal descriptions for all six colors, it indicated that they had a certain level of color semantic association. Those who successfully passed this screening were subsequently invited to participate in the next CER survey. In total, 341 elderly respondents in the outdoor spaces were recruited for the color screening test. Among them, 11 elderly respondents did not pass the color screening test, leaving 330 elderly respondents could continue to participate in the next step of on-site SD experiment.

3.3.2. Survey of Individual and Visiting Factors

For the above 330 elderly respondents, individual information was surveyed and recorded. This included individual factors such as age, gender, and education level, as well as visit factors such as walking time from residence, visit frequency, and the time period of visit (Table 1). These details were used in the correlation analysis to test whether individual variables significantly influenced the positive CER of the elderly toward community outdoor spaces.

3.3.3. On-Site SD Experiment for CER Assessment

In this study, the Semantic Differential (SD) method was used to measure the CER values of the elderly toward community outdoor spaces and to collect a semantic data set of CER. The semantic differential, introduced in 1957 by C.E. Osgood, is a psychological measurement method that uses semantics as a scale for conducting psychological experiments [51,52]. It is commonly used to assess landscape preferences and visual quality. For the quantitative assessment of CER, a five-part Likert scale was used to differentiate semantic differences and the CER intensity of the elderly toward community outdoor spaces. The scale included 22 pairs of adjectives with opposite meanings, categorizing emotions into positive, neutral and negative, and the specific categories were designated as follows: “very negative” (−2), “slightly negative” (−1), “neutral” (0), “slightly positive”(1), and “very positive” (2), as shown in Figure 7. During the on-site SD experiment, positive and negative semantic words in the scale were randomly positioned on either side of the scale assessment, to prevent choice stereotyping among the elderly participants.

3.3.4. Acquisition Process of CER Values

Through the CER assessment of the elderly toward 16 scenes of autumn and winter using the above five scales (−2, −1, 0, 1, 2), CER scores for each pair of emotions were obtained from 330 elderly respondents. The scores were used to draw the SD curve describing the general CER of the elderly toward all scenes. Moreover, the average values of the CER scores were calculated and named as CER-R values. CER-R values represented the CER intensity of 330 elderly respondents to all community outdoor spaces, using to examine the effects of individual variables on CER. In addition, the average CER scores were obtained for each outdoor space or scene were calculated and named as CER-S values. CER-S values represented the CER intensity obtained for each space or scene, using to examine the effect of color characteristics on CER. Both the CER-R values and CER-S are consistent with the following rules, the higher the CER value, the more positively of elders’ emotional intensity, while the lower the CER values, the more negatively. In total, each elderly respondent contributed 352 CER assessments, resulting in the collection of 116,160 CER assessments from 330 respondents.

3.4. Data Analysis and Variable Design

The description and correlation analysis were conducted through SPSS 27.0 software (IBM Corporation, New York, NY, USA), while the Graphpad Prism 8.0 software (GraphPad Software Company, Bonston, MA, USA) was used for drawing the SD curve of the general CER of the elderly.

3.4.1. Overall CER Tendency of the Elderly toward Community Outdoor Spaces

Through calculating the mean values of each pair of color emotions, the prominent color emotions with CER values greater than the mean were identified as the color emotion category that best describes all scenes. These prominent emotions were linked to the color emotion circumplex model, visually aggregating and reflecting the overall color emotion tendency of the elderly toward community outdoor spaces. By observing the quadrant distribution of prominent color emotions in the color emotion circumplex, the overall CER tendency of the elderly and positive emotions were determined. In the model, the display size of words represented the CER intensity, with larger words indicating stronger CER intensity.

3.4.2. Color Characteristics Analysis of Community Outdoor Spaces

The color characteristics of 16 scenes were analyzed using the Color Summarizer Web Service (https://mk.bcgsc.ca/color-summarizer/, 18 January 2023). This analysis included the color indicators of HSV (The Hexcone Model built by A. R. Smith), the color area ratios of green, blue, and gray, as well as the color spatial pattern of colors (Table 2). In the color clustering analysis process, the K value was uniformly set to 5, categorizing the color of each scene into 5 clusters. The precision was set to 200 px and the output format was configured to html style. All the color indicators were used in the subsequent analysis to examine the effect of color characteristics on CER-S.

3.4.3. Significant Difference in CER between Autumn and Winter

To find out whether there are significant differences in the CER of the elderly toward community outdoor spaces during autumn and winter, this study applied the paired sample t-test method to analyze the significant differences in CER-R values between autumn and winter scenes. This method is a statistical method used to test whether there is a significant difference between paired quantitative data. To further analyze the specific differences in CER between autumn and winter scenes, a descriptive statistical analysis was conducted to compare the CER-S values across 16 scenes. Both the outdoor spaces and the scenes with higher and lower CER-S values were identified. This can provide quantitative evidence for color design for different seasons and different types of community outdoor spaces.

3.4.4. Effects of Individual and Color Characteristic Variables on Positive CER

To explore the subjective and objective external influences on the positive CER of the elderly toward community outdoor spaces, this study attempted to build two regression models. The first model aimed to examine the effect of individual factors on positive CER, while the second model aimed to examine the effect of color characteristics on positive CER.
In the first model, individual factors were used as the independent variable, and the positive CER-R values were used as the dependent variable. Firstly, one-way analysis of variance (ANOVA) was applied to explore the significant CER-R differences in different population groups. Then, correlation analysis (Kendall Tau) was used to explore the correlations between individual factors and positive CER-R values. Ultimately, the relationship and intensity of the effects of individual variables on CER were further explained by constructing a stepwise regression model. In the second model, color characteristics variables were used as the independent variable, and the positive CER-S values were used as the dependent variable. Firstly, correlation analysis (Person) was used to initially explore the correlations between color characteristics and positive CER-S. Then, the relationship and intensity of the effects of color characteristics on positive CER were further explained by constructing another stepwise regression model.
Ultimately, the external elements on subjects and objects that significantly influenced positive CER of the elderly were determined. This can contribute to providing quantitative information on the target users’ needs and on the color control indicators for age-friendly color design in the community spaces.

3.5. Reliability and Validity Test

To ensure the robustness of the data collected, the reliability test and validity test of the CER scale were conducted in this study. The results showed that the Cronbach’s Alpha coefficient for internal reliability of CER values was 0.853, indicating that the questionnaire had a high reliability. Moreover, the reliability value of the questionnaire did not increase when any of the items were deleted, so no items were removed from the questionnaire. Meanwhile, the validity test results are shown in Table 2, KMO = 0.857 > 0.7, Sig. = 0.000 < 0.01, which indicates that the validity of the questionnaire is also high.

4. Results

4.1. Description Statistics

4.1.1. Demographic Statistics of the Elderly Respondents

The individual information of the elderly interviewed are presented in Table 3. The majority of respondents belonged to the 60–80 years age group, accounting for 98.2% of the total. In China, elders in this age group are usually retired and more likely to engage in daily outdoor activities in a community. Besides, a large proportion of the elderly respondents (80.6%) reported an educational level below high school or secondary school. The majority of them reside within 10–30 min walking time (83.7%), and almost all respondents participate in a neighborhood at least once a month or several times a month (99.8%). Additionally, the most common time periods for visits were between 6:00 a.m.–10:00 a.m. and 15:00 p.m.–17:00 p.m., accounting for a combined total of 77.8%. In summary, the individual information provided by the elderly respondents aligns well with the current situation in China, effectively representing the basic demographic characteristics of the elderly users engaged in community outdoor activities.

4.1.2. Color Characteristics Statistics of the Community Outdoor Spaces

To obtain the color characteristics of 16 scenes, this study analyzed the HSV color indicators, color area ratios of blue, green and gray, and color spatial patterns using Color Summarizer Web Service. As shown in Table 4, the results showed that the mean values of hue indicator in 16 scenes ranges 80°~194°. By comparison with the Hexcone Model, it was found that the colors corresponding to this hue interval mainly include yellow, green, cyan, blue, and purple. The mean value of saturation indicator ranges 0.09~0.4, indicating that the colors are generally low saturation in 16 scenes, while the mean of brightness indicator ranges 0.35~0.69, indicating that colors are generally medium-high brightness. Additionally, the color area ratios results revealed that blue is 10.67~48.17%, green is 2.2~37.79% and gray is 9.92~81.13%. Among all the scenes, three scenes exhibit the color spatial pattern combining three forms of dot, line, and surface. Only A3 scene exhibited one form of surface, and most of the rest scenes combining two forms of dot, line, and surface.

4.1.3. CER Assessment and Color Emotion Circumplex

(1)
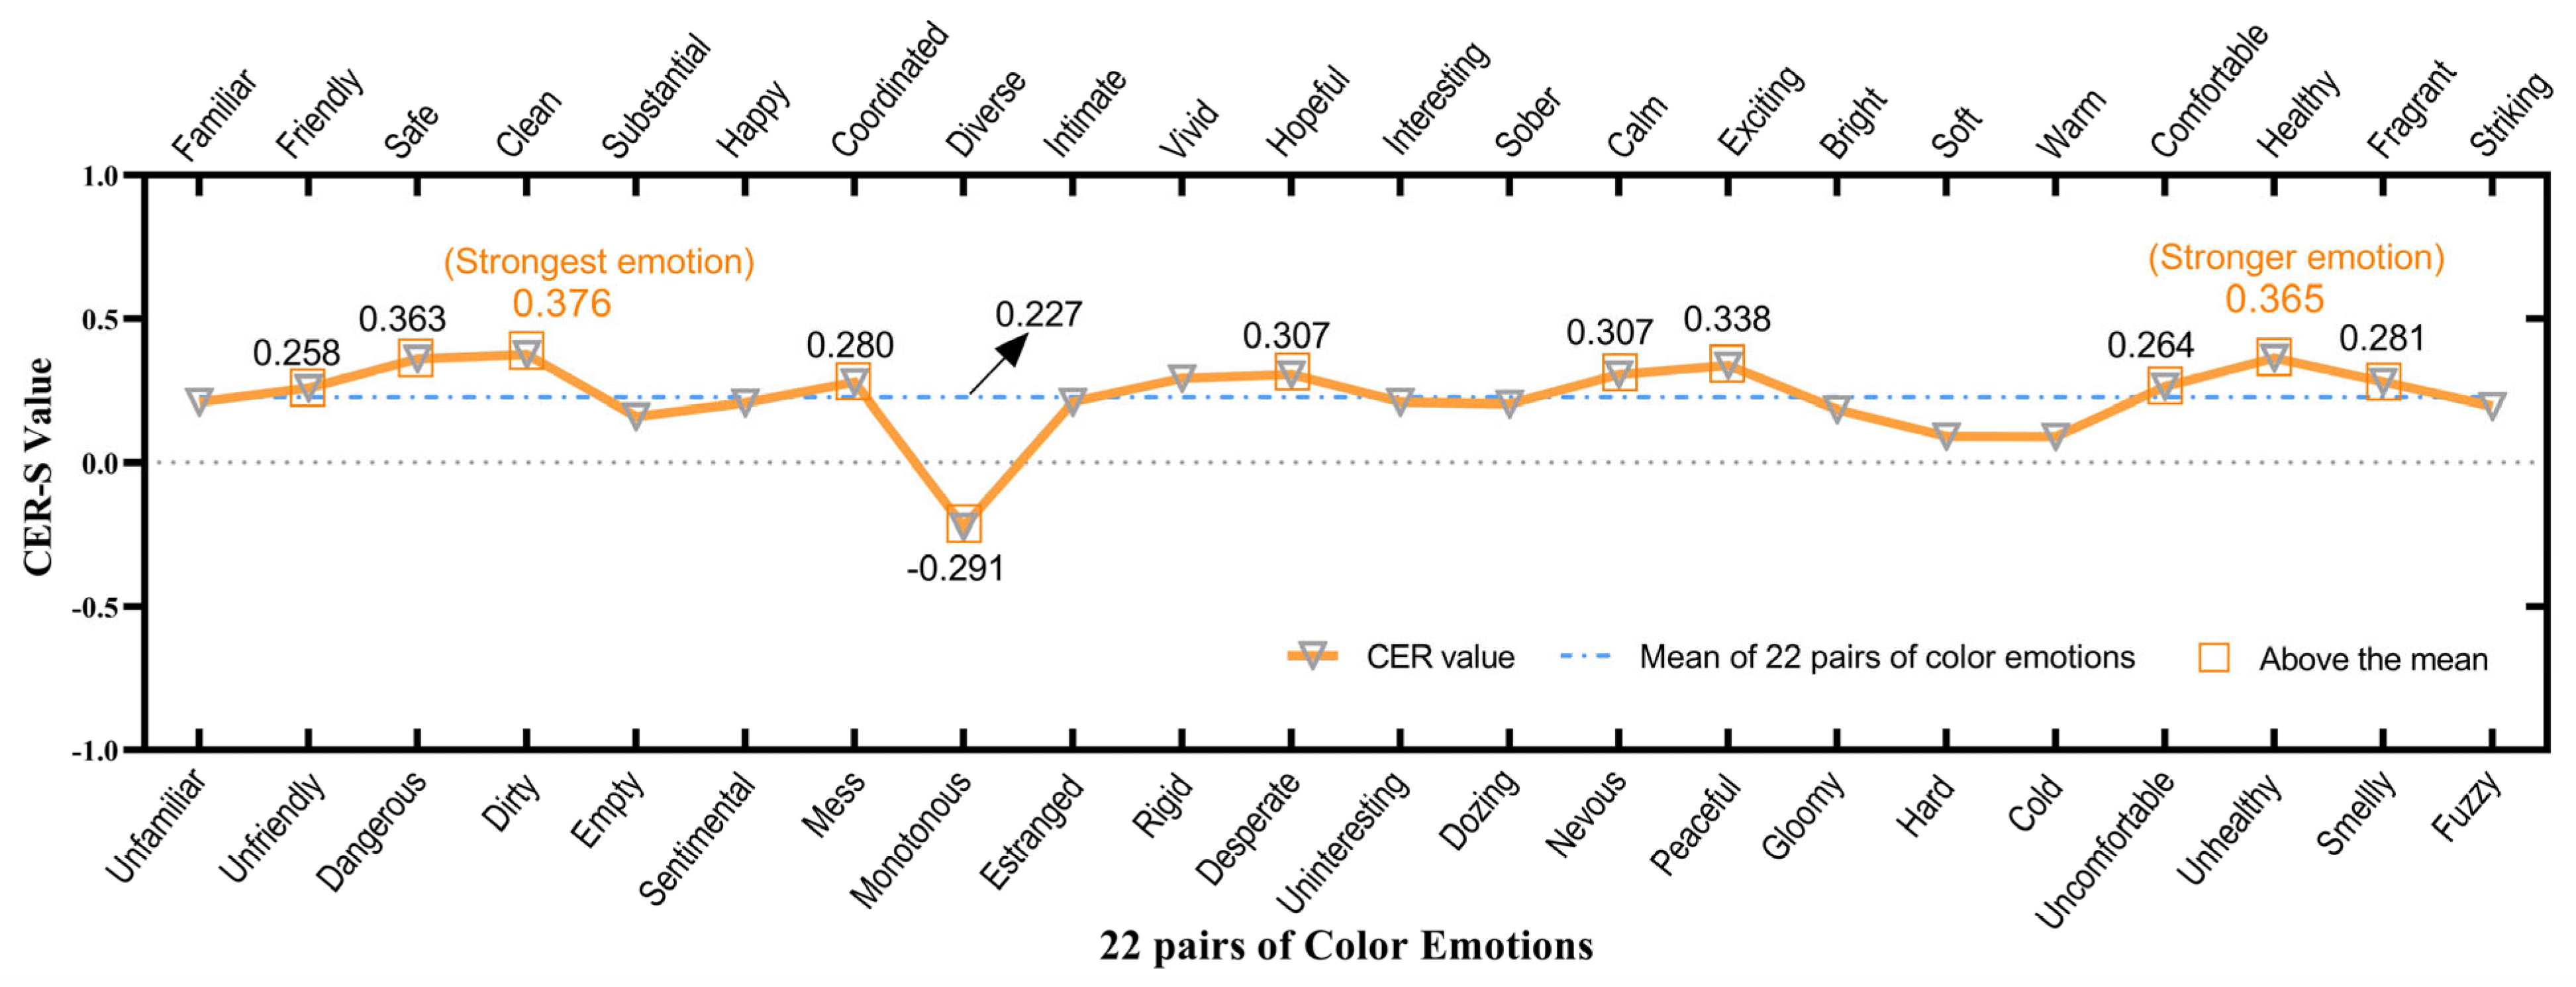
CER-R value statistics
As shown in Figure 8, the CER-R values of 22 pairs of emotions were obtained, with almost all of the CER-R values of the elderly toward outdoor spaces in Yi Jie Qu exceeding 0. Exceptionally, the emotions of diverse–monotonous elicited a negative emotional response, the elderly responded positively to all of the remaining 21 pairs of emotions. This indicated an almost positive CER for outdoor spaces by the elderly. The highest CER-R value occurred in healthy emotion (0.586) and the lowest CER-R value occurred in monotonous emotion (−0.438). The mean value of 22 pairs of color emotions was 0.227, as shown in Figure 9. There were 11 color emotions with CER-R values greater than the mean, including clean (0.376, strongest emotion), healthy (0.365, stronger emotion), safe (0.363), active (0.338), hopeful (0.307), calm (0.307), monotonous (0.298), fragrant (0.281), coordinated (0.280), friendly (0.259), and comfortable (0.264).
(2)
Color emotion circumplex of the elderly toward outdoor spaces in Yi Jie Qu
Upon clustering the 11 color emotions in the color emotion circumplex model, the overall emotion tendency of the elderly toward community outdoor spaces in Yi Jie Qu was visually presented visually, as shown in Figure 10. This color emotion circumplex revealed that the elderly had seven color emotions clustered in the relaxation emotion quadrant, three in the excitement quadrant, and one in the boring quadrant. As a result, the overall CER tendency of the elderly tends to be more relaxed, moderately aroused, and slightly bored. The emotions of clean and healthy stands out as the strongest emotional responses of the elderly.
(3)
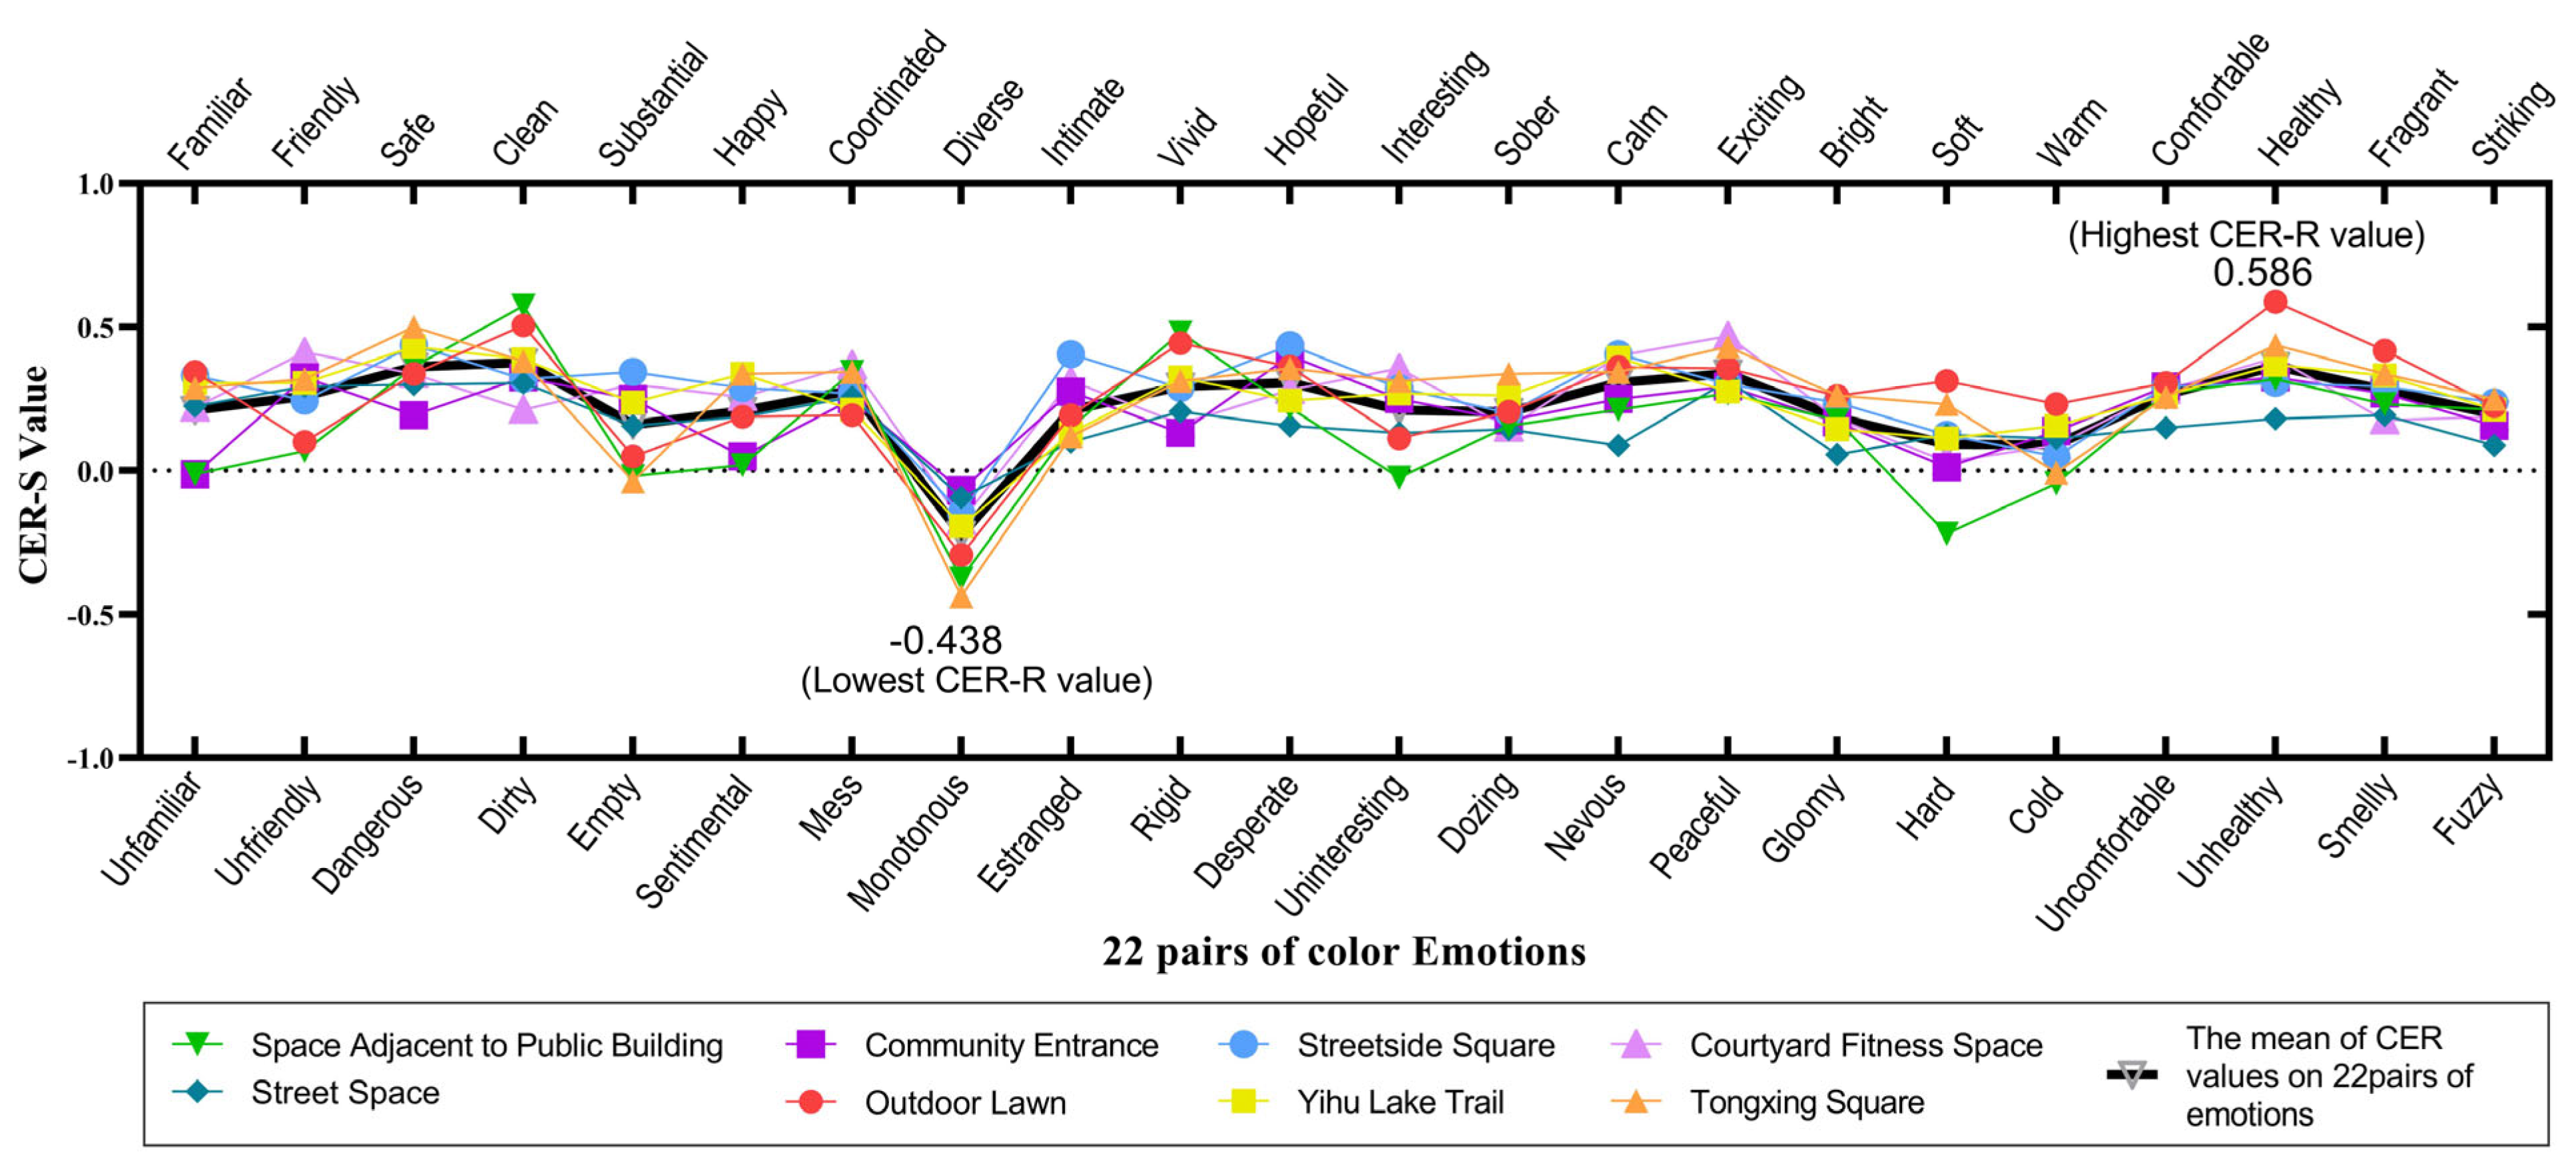
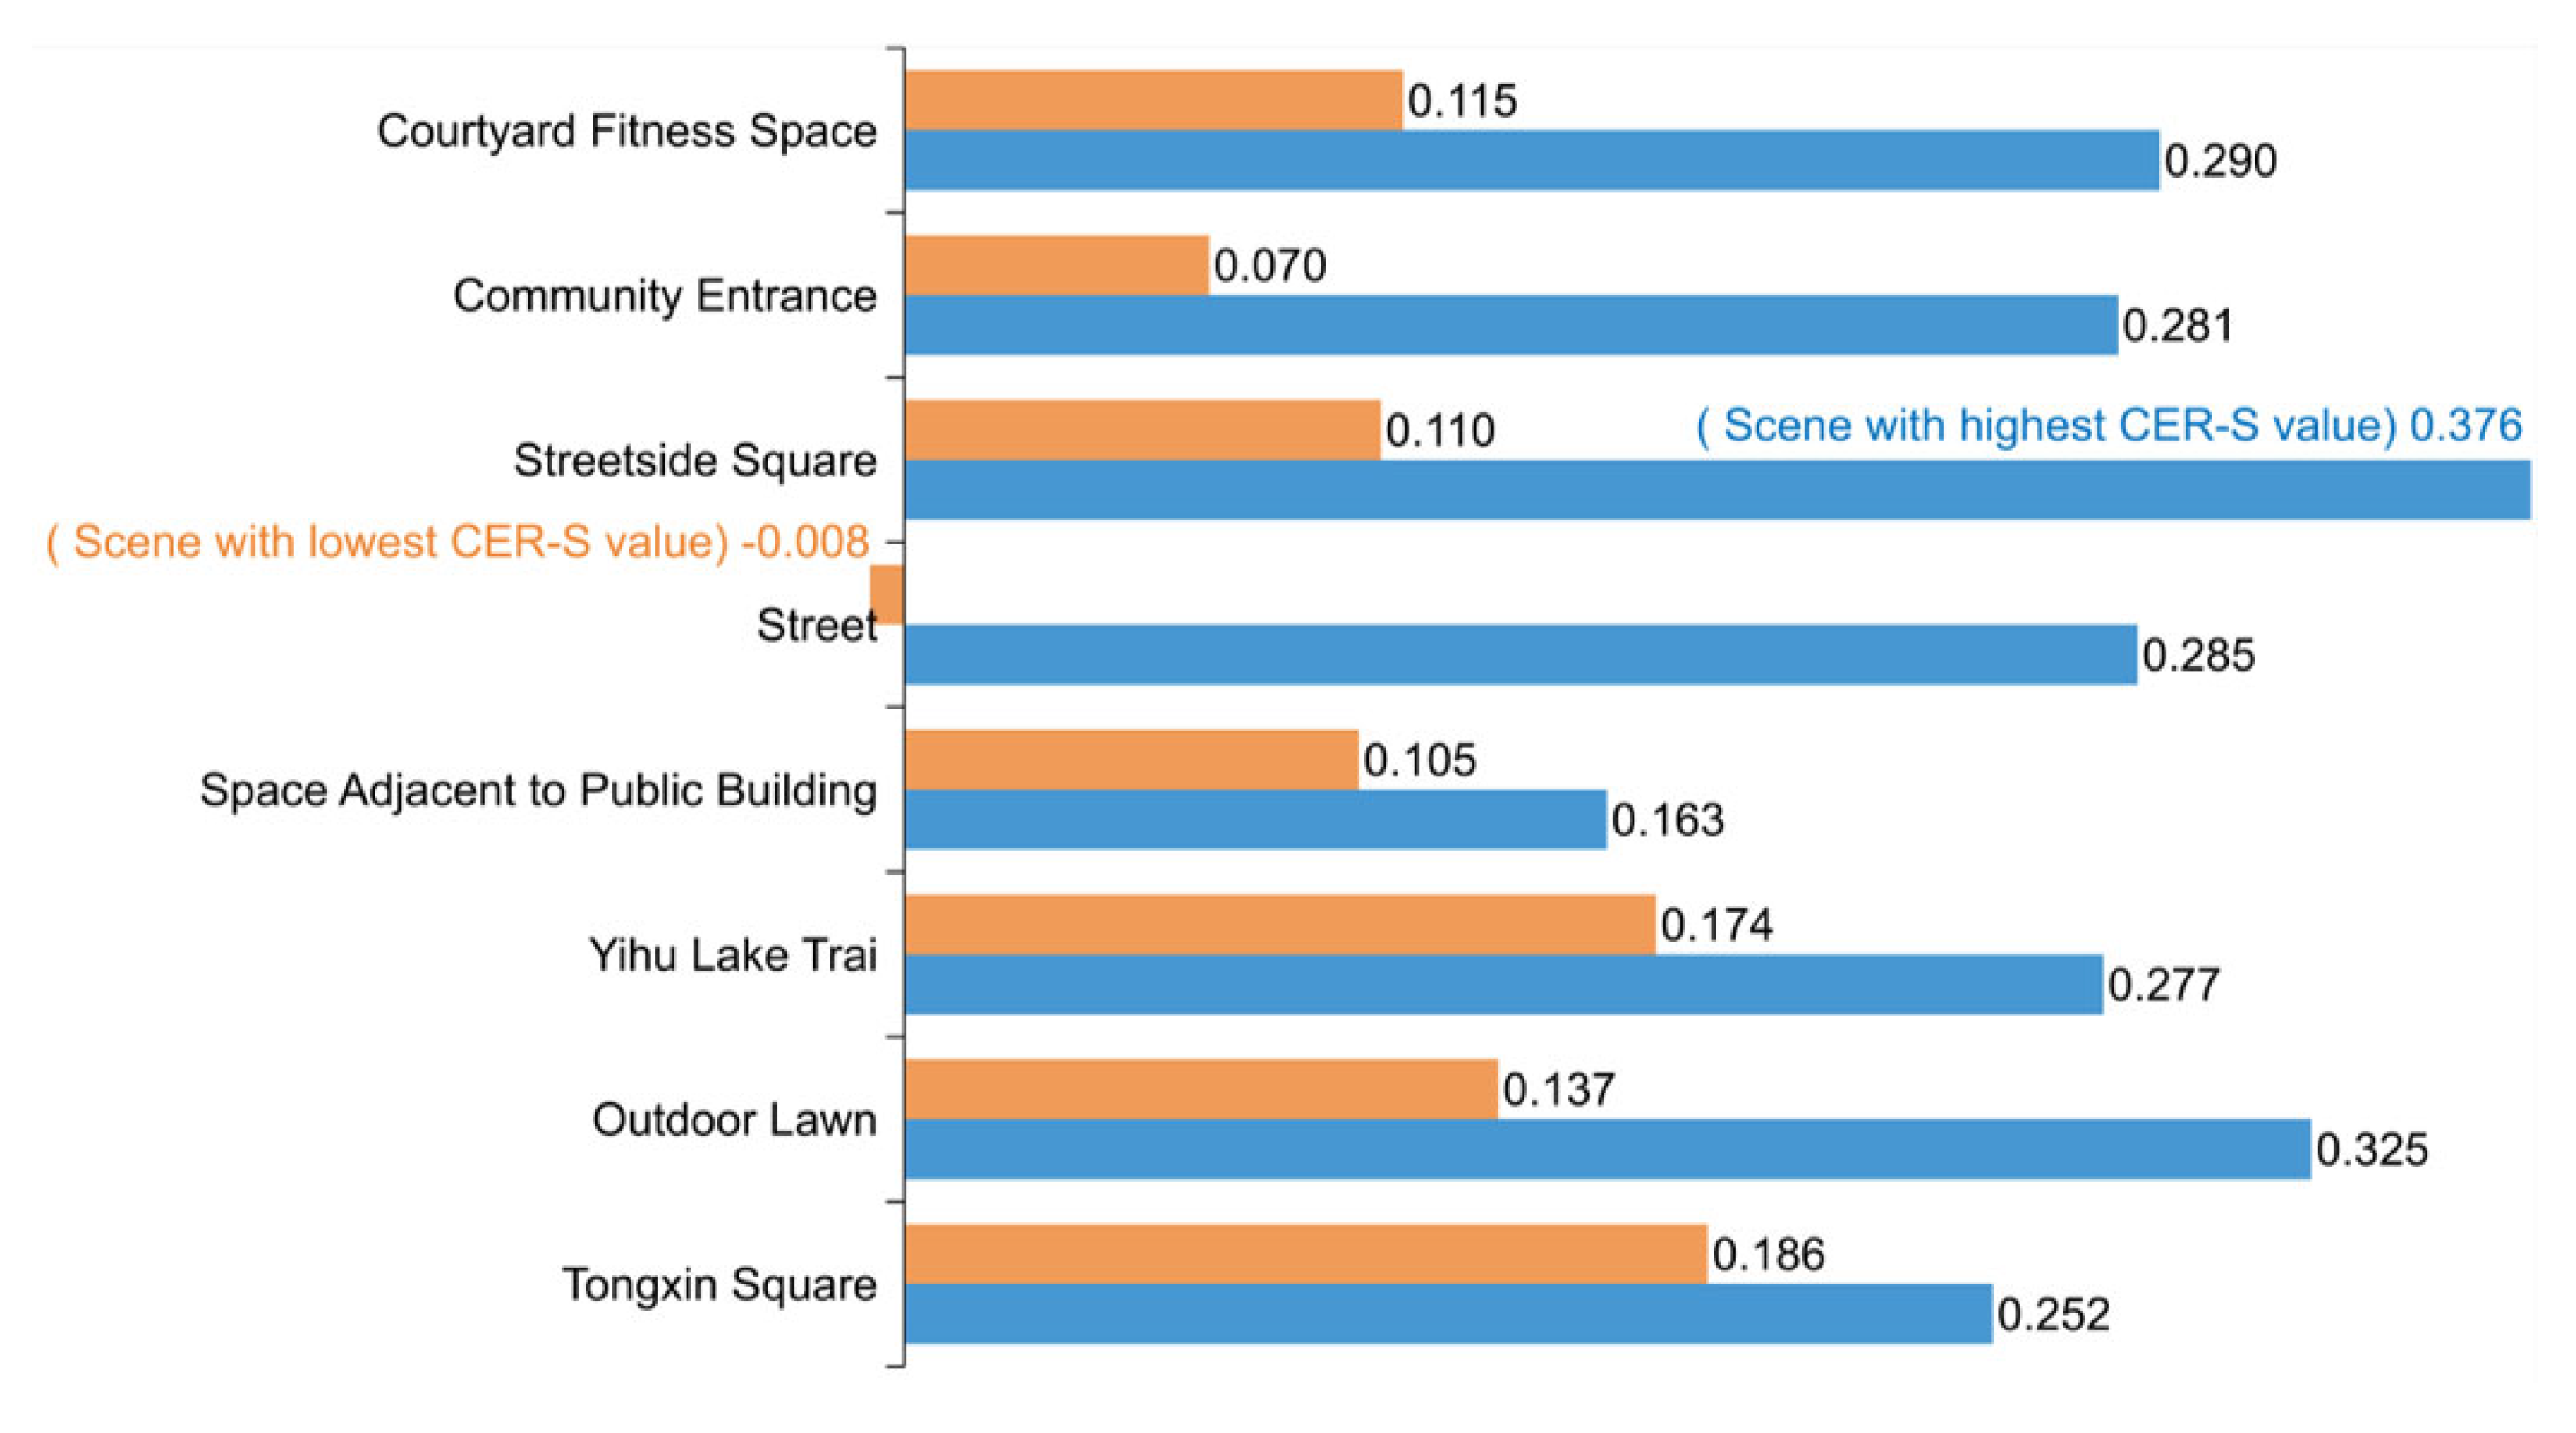
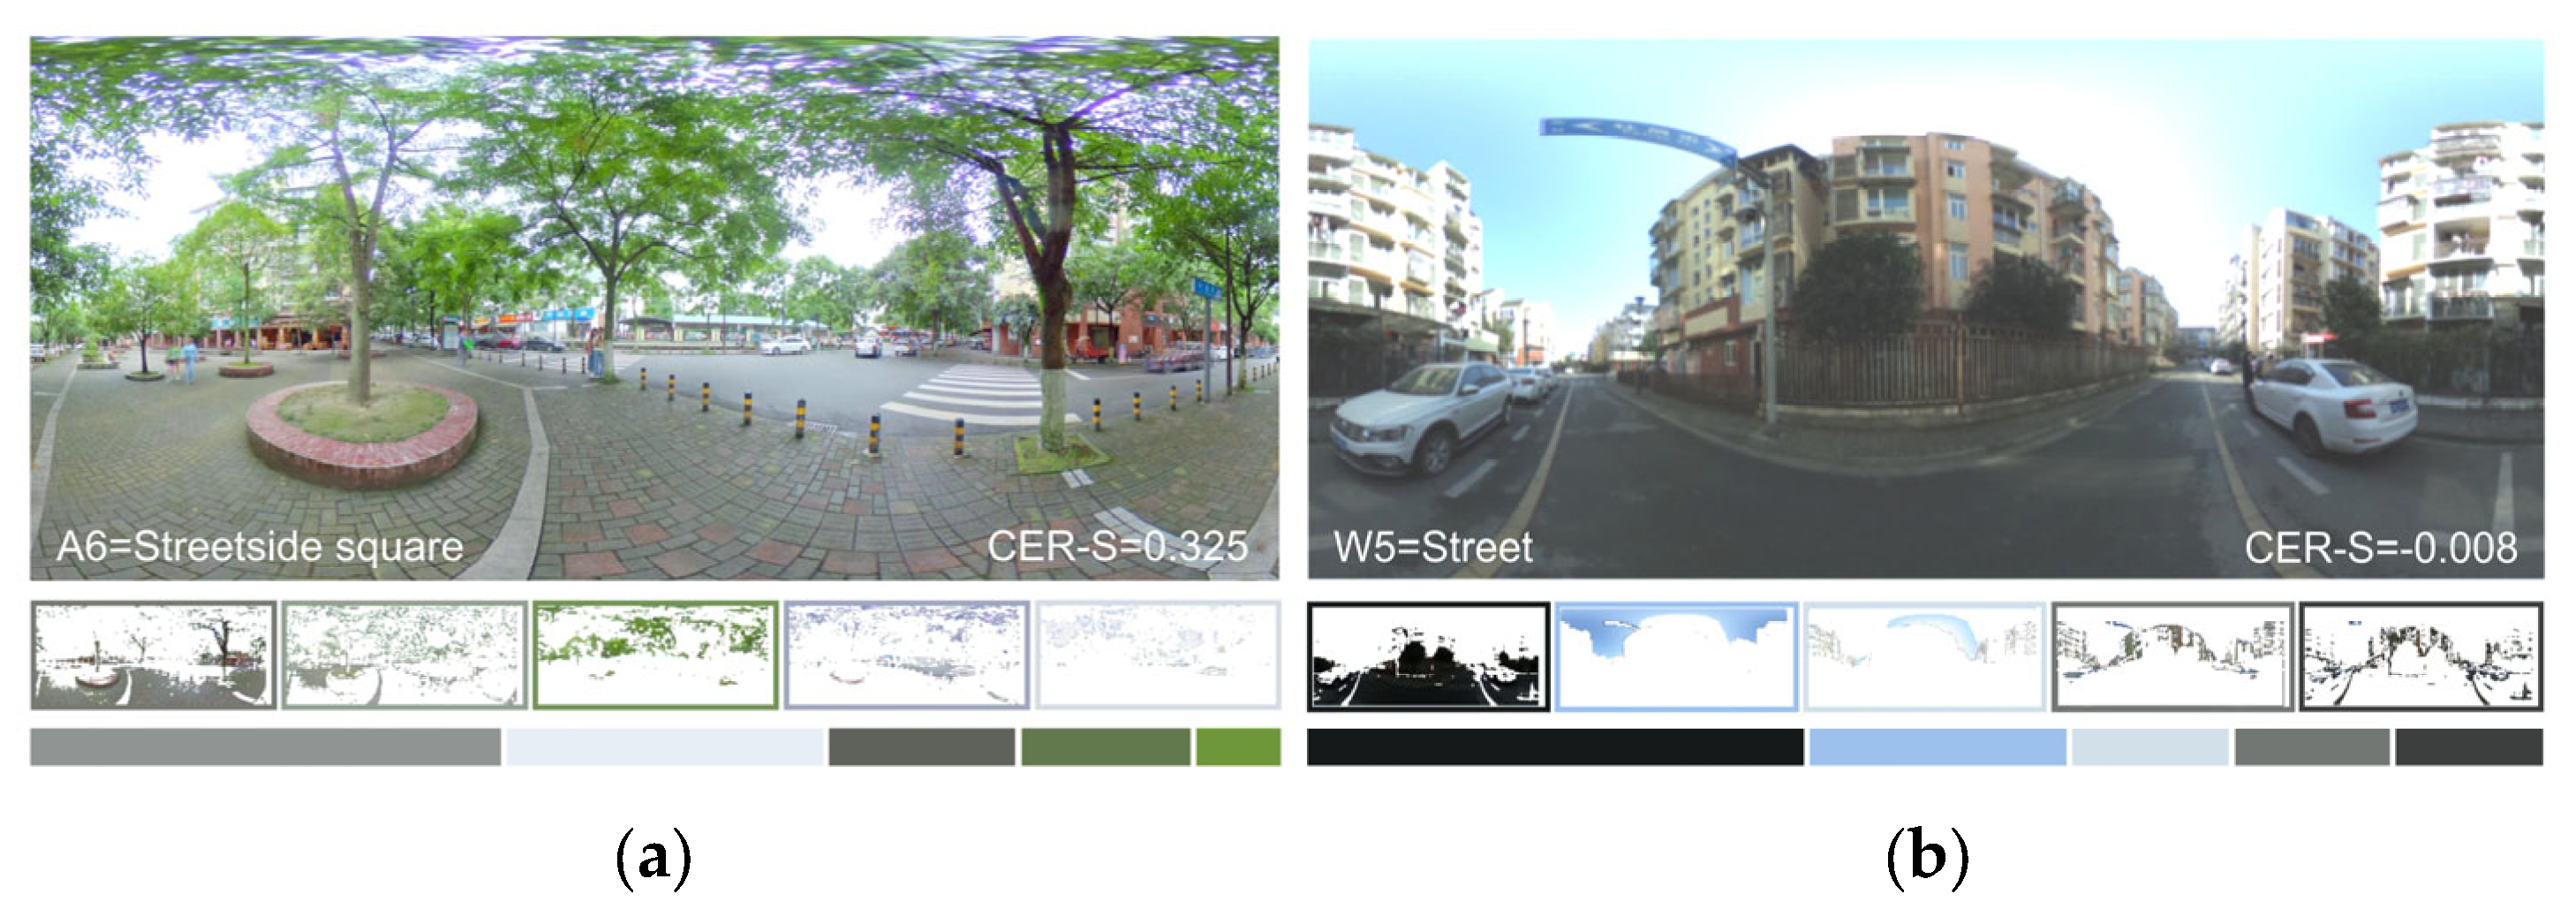
CER-S value statistics of eight community outdoor spaces
The CER-S values for eight community outdoor spaces were counted, as shown in Figure 11. Three outdoor spaces exhibited relatively higher CER-S values, including streetside square (0.243, space with the highest CER-S value), followed by outdoor lawn (0.231) and Yi Lake Trail (0.226). In contrast, the elderly showed the lower CER-S values in the space adjacent to public building (0.134, space with the lowest CER-S value), followed by the street (0.139) and the community entrance (0.176). In general, the elderly had the strongest CER for streetside square and the weakest CER for space adjacent to public building.

4.2. CER Differences between Autumn and Winter Scene

4.2.1. Paired-Sample t-Tests

Paired-sample t-tests were used to analyze the significant differences in CER-R values for the scenes of autumn and winter. The normality distribution for the data of CER-S values of autumn and winter scenes were tested using the Shapiro–Wilk test, yielding a result that the data passed the normality test. Then, the paired-sample t-test result were showed in Table 5, with p = 0.038 and t = −2.115. This indicated a significant difference in the CER of the elderly between autumn and winter scenes, which revealed the significant role played by seasonal changes in CER variation among the elderly.

4.2.2. CER-S Values Comparison between Autumn and Winter Scenes

By further analyzing the CER-S values for 16 scenes, it was found that the CER-S values in autumn scenes ranged from “0.163” to “0.376”, while CER-S values ranged from “−0.008” to “0.186” in winter scenes. Notably, the CER-S values were generally higher in autumn scenes than winter. The peaks of CER-S values among 16 scenes described in Figure 12. The highest value occurred in streetside square of autumn scene (0.376), while the lowest value occurred in street of winter scene (−0.008). Figure 13a,b showed the scenes with the highest and lowest CER-S values, as well as their color spatial patterns and color area ratios. Additionally, compared to scenes with lower CER-S values, scenes with higher CER-S values showed relatively brighter colors, more green, less gray, and more diverse color spatial patterns.

4.3. The Effect of Individual Factors and Color Characteristics on CER

4.3.1. The Effect of Individual Factors on Positive CER

Following the result of normal distribution test, both the data of individual variable and positive CER-R values from 330 respondents can be basically accepted as normally distributed (absolute kurtosis < 10 and absolute skewness < 3). The variance chi-square test results showed a significance (p > 0.05), which indicated that a one-way ANOVA can be conducted. The ANOVA results showed significant positive CER differences among internal subgroups of age (F = 2.763, p = 0.042 < 0.05), educational level (F = 11.098, p = 0.000 < 0.05), and walking time from residence (F = 5.469, p = 0000 < 0.05). However, there were no significant positive CER differences between internal subgroups of gender, visit frequency, and time period of visit. Furthermore, the results of Kendall Tau correlation analysis were shown in Table 6, indicating that positive CER-R values were significantly correlated with education level (positive), walking time from residence (negative), and visit frequency (positive) among the elderly respondents. However, gender, age, and time period of visit did not show a significant effect on their positive CER.
Based on the results of one-way ANOVA and correlation analyzes described above, this study chose age, education level, walking time from residence, visit frequency, and time period of visit as the independent variable and the positive CER-R values from 330 respondents as the dependent variable to construct a stepwise linear regression model. This model was used to further analyze the significant effects and their intensity of the individual variables on the CER. The correlation result indicated that education level, walking time from residence and visit frequency showed significant effects on positive CER of the elderly, while gender, age, and time period of visit showed such a weak effect that they were excluded from the model (Table 7). The regression result indicated that the residuals followed a normal distribution. Variance analysis revealed a linear correlation between individual variables and positive CER, which demonstrated that the regression model passed the overall significance test (F = 16.694, p = 0.000). Moreover, the model passed the multi-collinearity test (Variance Inflation Factor = 1.005~1.018 < 10) [53], indicating that the absence of multicollinearity problems in the model.
The successful construction of the regression model further illustrated that education level (t = 3.965, p = 0.000), walking time from residence (t = −3.056, p = 0.002), and visit frequency (t = 4.217, p = 0.000) were the key individual factors with a significant effect on positive CER. Among the three key individual factors, education level, and visit frequency had a positive effect on positive CER, while the walking time from residence had a negative effect. Moreover, the strongest intensity of effect was found in education level (B = 2.989), followed by visit frequency (B = 2.771), and finally walking time from residence (B = −2.173).

4.3.2. The Effect of Color Characteristic on Positive CER

Through normal distribution test, both the data of color characteristics variable and positive CER-S values of 16 scenes can be basically accepted as normally distributed (absolute kurtosis < 10 and absolute skewness < 3). This indicated that the Pearson correlation analysis can be carried out. As shown in Table 8, the correlation result revealed that the positive CER-S values of 16 scenes were significantly correlated with the color indicators of saturation (negative), brightness (positive), and the color area ratios of green (positive), blue (negative), gray (negative), as well as the color spatial pattern (positive). In addition, the indicator of hue showed no significant effect on positive CER-S values and was excluded from the subsequent model.
To further analyze the effect of color characteristics on positive CER, another stepwise linear regression model was conducted. The independent variable included the color indicators of saturation and brightness, the color area ratios of blue and green, as well as color spatial pattern as the independent variable, while the dependent variable was the positive CER-S values of 16 scenes. The regression results showed that the residuals followed a normal distribution. Variance analysis revealed a linear correlation between color characteristics and positive CER, indicating that the regression model passed the overall significance test (F = 15.422, p < 0.001). Moreover, the model passed the multicollinearity test (Variance Inflation Factor = 1.520~6.822 < 10) [53], indicating that there was no problem with multicollinearity in the model.
As shown in Table 9, the construction of the regression model further demonstrated that the color indicators of brightness (t = 3.931, p = 0.000), the color area ratio of blue (t = −4.757, p = 0.000) and gray (t = −3.598, p = 0.000) had a significant effect on elderly people’s positive CER. However, the color indicators of S, the color area ratio of green and the color spatial pattern showed no significant effects on positive CER, then they were excluded. Meanwhile, the brightness had a positive effect on positive CER, while the color area ratio of blue and gray had a negative effect. Additionally, the strongest intensity of effect was found in the color area ratio of blue (B = −1.024), while the color indicator of brightness (B = 0.008) and the color area ratio of gray (B = −0.004) showed comparatively weaker effects.

5. Discussion

5.1. The Elderly Showed the Strongest CER toward Clean and Healthy Emotions

The result of SD experiment indicate that the elderly had the strongest CER regarding clean and healthy emotions toward the community outdoor spaces in Yi Jie Qu. This may be related to the clean lakes, rivers and large area of public green spaces in the community. Firstly, the elderly showed a highest CER toward clean emotion. This finding is aligns with a study of social needs and values of urban water features, which confirmed that a positive correlation between perceptions of cleanliness and higher positive emotion of happiness, serenity, surprise, and relaxation, and significantly influenced the six basic human emotions of joy, serenity, fear, disgust, sadness, and surprise [54]. Also, a study on the perceived visual landscape quality of green spaces has demonstrated that the healthy and tidy trees with appropriate color contrasts are more conducive to the restoration of human perception [55]. Furthermore, the study on age-friendly public space has indicated that environmental cleanliness is more responsive to the needs of the elderly for using outdoor spaces in their community [56]. Additionally, the elderly showed a higher CER for healthy emotion, which is probably related to the large area of outdoor lawn and waterfront space in Yi Jie Qu. Extensive evidence supports the health benefits of blue and green spaces, and people tend to show more positive emotions in accessible outdoor spaces and landscapes with blue-green elements [57]. Therefore, the clean water environment, tidy trees, and more green areas can contribute to fostering clean and healthy color emotions, ultimately creates an overall relaxing landscape atmosphere.

5.2. CER Differences Are Related to Seasonal Change

This study confirmed a significant seasonal difference in CER among the elderly, and the CER were higher overall in autumn than in winter. The difference may be attributed to the vegetation withering and the monotonous color landscape during winter, reflecting that the CER of the elderly varies with different seasons. A color perception experiment in York (UK) has confirmed that human perception of color changes with seasons [39]. In general, color landscapes are more vibrant in autumn than in winter, and vibrant colors are more likely to elicit a positive emotional response [58]. When people walks in an autumn landscape, it can contribute to reducing people’s negative emotions, significantly increasing in vitality and reaching higher levels of excitement and relaxation [59]. Besides, a study on residents’ facial expression recognition in community spaces has confirmed that happy emotion was higher in autumn and winter than in spring and summer [60]. Consequently, the color design for community outdoor spaces can be conducted for different seasons. The monotonous winter color landscapes can considered as a potential focal point for improve the quality of community color in the future.

5.3. Effect of Individual Factors on Positive CER

Through the regression model analyzing the significant effects of individual factors on positive CER, it was found that education level and visit frequency positively influenced the positive CER of the elderly, whereas the walking time from residence negatively influenced the positive CER. The observed positive effect of education level on CER aligns with previous research on urban green spaces and vegetation landscapes. Generally, people with low education levels tend to prioritize basic emotions like safety [61]. The elderly with higher educational level have relatively higher level of physical activity, which provides them with more opportunities to engage in outdoor activities and gain positive perceptions [62]. Additionally, the areas with higher perception frequency and stronger accessibility showed a stronger safety perception of environment color, indicating that such areas are more likely to bring positive emotions [36]. In general, residents usually rated the value of the community landscape higher for more frequently visited and more familiar scenes than for less frequently visited and unfamiliar scenes [63]. Furthermore, the shorter the walk, the more likely the elderly are to experience positive emotions. A study on forest trails in the Akasawa National Recreational Fores in Japan found a similar result, indicating that people with shorter walking time had higher overall satisfaction [64]. Moreover, related studies have also demonstrated a gender difference in travel distances, with elderly males having a greater concentration of activities near their homes while elderly females have a wider range of activities in different sites [65].
Consequently, focusing on education level, visit frequency, and walking time can be used to understand people’s color emotional needs in the community outdoor spaces. This also reflected the internal differences within the elderly groups on CER. Both the study on the use of remaining outdoor space by elders in Tehran [66], and the study on the use of outdoor recreational space by elders in India [67] confirmed the internal comparability in the perception of outdoor space among the elderly people. In the future, comparative studies on CER of the elderly from different regions or countries could be considered. These information can support community color precise-design targeted to the needs of the elderly users.

5.4. Effect of Color Characteristics on Positive CER

The effect of color characteristics on CER revealed that a positive correlation between brightness and positive CER of the elderly. In other words, the brighter colors in the outdoor spaces, the stronger the positive CER of the elderly. This aligns with a study on colors used in the historic landscape district, which showed that architectural colors with high brightness are more likely to bring comfort and a pleasant visual experience [47]. Compared to the classroom color environments in the low brightness group, college students perceived the high brightness group to be more therapeutic and more likely to promote pleasure, relaxation, and concentration [68]. Besides, there is no consensus on the association between blue and emotion. Some studies on metaphorical associations have showed blue is association with sadness in daily Japanese and English [13,69], which is similiar with our finding about the negative effect of blue area ratio in community outdoor space. However, a lot of studies on urban blue spaces have also indicated that a higher proportion of blue color is typically more effective in relieving stress and promoting positive emotions, particularly happiness [70,71]. Additionally, gray spaces are more likely to trigger negative emotions of disgust, sadness [13], while gray usually tends to be boring [72]. The negative effect of the color ratios of blue and gray on positive CER in this study, may be attributed to the over-opened gray-blue skies and large areas of gray floor paving in the outdoor spaces of Yi Jie Qu. While wide-open spaces may initially provide people with a bright visual experience and a brief sense of surprise, after a period of time, this short-lived emotion tends to be gradually replaced by negative emotions such as boredom [73]. This indicates that a potential link between spatial openness and CER may exist, which needs to be further clarified in the future.

5.5. Limitation

This study had two important potential limitations. Because the on-site experiments were conducted during the Chinese regular epidemic prevention and control, we had to access to a limited sample size, which may affect the generalizability of this work. Moreover, due to the impact of prevention and control management, we were unable to freely access the community’s outdoor spaces to further collect images of specific color landscape elements. This made it difficult to further clarify the emotional responses caused by the different color landscape elements in the scenes. In future work, it is necessary to collect a larger sample size to compare the CER among the elderly in different region or country. In addition, equipment for eye-tracking and virtual reality is needed to further study emotional responses to specific color landscape elements, such as waterscape, plantscape, rainforest landscape, hardscape and integrated landscape [40,74] as well as distinctive spatial elements, such as street corridors, Ma Tau Walls, and various landmarks. Thus, the data on CER can be captured more objectively. This would further enhance the generalizability of CER methodology and deepen the study of landscape–emotion correlations in urban design.

6. Conclusions

In response to the absence of age-friendly color planning in community outdoor spaces in China, this study conducted an on-site CER assessment experiment, considering the perspective of the elderly residents in Yi Jie Qu. The main findings and countermeasures are summarized as Table 10. In summary, this study introduced a new approach of color emotion circumplex to describe the overall emotion tendency of color landscapes by visually clustering the result of CER assessment. The information of emotion categorization and quantitative color emotional in the urban design were enriched. Additionally, this study expands the research perspective on the effects of people, colors and seasons on visual landscape perception.

Author Contributions

Conceptualization, C.Z., B.J.D. and J.W.; Methodology, C.Z., B.J.D. and J.W.; Software, C.Z., Y.C., C.S., X.Z. and J.L.; Validation, C.Z., Y.C. and C.S.; Formal analysis, C.Z., Y.C. and C.S.; Investigation, C.Z., Y.C., C.S., H.T., Y.L., X.Z. and J.L.; Resources, C.Z., B.J.D., H.T., Y.L. and J.W.; Data curation, Y.C., C.S., Y.L., X.Z. and J.L.; Writing—original draft, C.Z., Y.C. and C.S.; Writing—review and editing, C.Z., H.T., Y.L. and J.W.; Visualization, Y.C., C.S., X.Z. and J.L.; Supervision, C.Z., B.J.D. and J.W.; Project administration, C.Z. and J.W.; Funding acquisition, C.Z. and J.W. All authors have read and agreed to the published version of the manuscript.

Funding

This research was funded by the National Natural Science Foundation of China [Wan, J., Grant No. 42301280], the Peking University Lincoln Center West Project [Wan, J., NO. FS07-20221001-WJJ], Sichuan Multicultural Center [Zhang, C., DYWH1911], Sichuan Provincial Social Science Key Research Base Research Center for Aging and Industrial Development [Wan, J., XJLL2022013].

Data Availability Statement

The data supporting the findings of the study are available from the first author upon request.

Acknowledgments

We would like to thank anonymous reviewers for their valuable comments on the manuscript. In addition, this study was supported by the teachers and students of the Urban and Rural Planning department, for which we would like to express our deepest appreciation.

Conflicts of Interest

The authors declare no conflicts of interest.

References

  1. He, D.; Miao, J.; Lu, Y.; Song, Y.; Chen, L.; Liu, Y. Urban Greenery Mitigates the Negative Effect of Urban Density on Older Adults’ Life Satisfaction: Evidence from Shanghai, China. Cities 2022, 124, 103607. [Google Scholar] [CrossRef]
  2. Jayantha, W.M.; Qian, Q.K.; Yi, C.O. Applicability of ‘Aging in Place’ in Redeveloped Public Rental Housing Estates in Hong Kong. Cities 2018, 83, 140–151. [Google Scholar] [CrossRef]
  3. Bustamante, G.; Guzman, V.; Kobayashi, L.C.; Finlay, J. Mental Health and Well-Being in Times of COVID-19: A Mixed-Methods Study of the Role of Neighborhood Parks, Outdoor Spaces, and Nature among US Older Adults. Health Place 2022, 76, 102813. [Google Scholar] [CrossRef]
  4. Sugiyama, T.; Ward Thompson, C. Older People’s Health, Outdoor Activity and Supportiveness of Neighbourhood Environments. Landsc. Urban Plan. 2007, 83, 168–175. [Google Scholar] [CrossRef]
  5. Zhang, D.; Jin, X.; Wang, L.; Jin, Y. Form and Color Visual Perception in Green Exercise: Positive Effects on Attention, Mood, and Self-Esteem. J. Environ. Psychol. 2023, 88, 102028. [Google Scholar] [CrossRef]
  6. He, F.; He, Y.; Sun, L. Gender Differences in Color Perceptions and Preferences of Urban Façades Based on a Virtual Comparison. Build. Environ. 2023, 245, 110907. [Google Scholar] [CrossRef]
  7. Wang, Z.; Sun, H.; Li, J. Research on Architectural Color and Visual Comfort in Historic Landscape Areas. Buildings 2023, 13, 1004. [Google Scholar] [CrossRef]
  8. Adams, F.M.; Osgood, C.E. A cross-cultural study of the affective meanings of color. J. Cross-Cult. Psychol. 1973, 4, 135–157. [Google Scholar] [CrossRef]
  9. Yu, C.-E.; Xie, S.Y.; Wen, J. Coloring the Destination: The Role of Color Psychology on Instagram. Tour. Manag. 2020, 80, 104110. [Google Scholar] [CrossRef]
  10. Wei, Y.; Zhang, Y.; Wang, Y.; Liu, C. A Study of the Emotional Impact of Interior Lighting Color in Rural Bed and Breakfast Space Design. Buildings 2023, 13, 2537. [Google Scholar] [CrossRef]
  11. Zhang, L.; Dempsey, N.; Cameron, R. Flowers—Sunshine for the Soul! How Does Floral Colour Influence Preference, Feelings of Relaxation and Positive Up-Lift? Urban For. Urban Green. 2023, 79, 127795. [Google Scholar] [CrossRef]
  12. Mammarella, N.; Di Domenico, A.; Palumbo, R.; Fairfield, B. When Green Is Positive and Red Is Negative: Aging and the Influence of Color on Emotional Memories. Psychol. Aging 2016, 31, 914–926. [Google Scholar] [CrossRef]
  13. Güneş, E.; Olguntürk, N. Color-emotion Associations in Interiors. Color Res. Appl. 2020, 45, 129–141. [Google Scholar] [CrossRef]
  14. Elliot, A.J.; Maier, M.A. Color Psychology: Effects of Perceiving Color on Psychological Functioning in Humans. Annu. Rev. Psychol. 2014, 65, 95–120. [Google Scholar] [CrossRef]
  15. Jonauskaite, D.; Camenzind, L.; Parraga, C.A.; Diouf, C.N.; Mercapide Ducommun, M.; Müller, L.; Norberg, M.; Mohr, C. Colour-Emotion Associations in Individuals with Red-Green Colour Blindness. PeerJ 2021, 9, e11180. [Google Scholar] [CrossRef]
  16. Takei, A.; Imaizumi, S. Effects of Color–Emotion Association on Facial Expression Judgments. Heliyon 2022, 8, e08804. [Google Scholar] [CrossRef]
  17. Hanada, M. Correspondence Analysis of Color–Emotion Associations. Color Res. Appl. 2018, 43, 224–237. [Google Scholar] [CrossRef]
  18. Russell, J.A.; Lanius, U.F. Adaptation Level and the Affective Appraisal of Environments. J. Environ. Psychol. 1984, 4, 119–135. [Google Scholar] [CrossRef]
  19. Russell, J.A.; Pratt, G. A Description of the Affective Quality Attributed to Environments. J. Personal. Soc. Psychol. 1980, 38, 311–322. [Google Scholar] [CrossRef]
  20. Chon, J.; Scott Shafer, C. Aesthetic Responses to Urban Greenway Trail Environments. Landsc. Res. 2009, 34, 83–104. [Google Scholar] [CrossRef]
  21. Hoyle, H.; Hitchmough, J.; Jorgensen, A. All about the ‘Wow Factor’? The Relationships between Aesthetics, Restorative Effect and Perceived Biodiversity in Designed Urban Planting. Landsc. Urban Plan. 2017, 164, 109–123. [Google Scholar] [CrossRef]
  22. Graphi-Sha Publishing. A Complete Guide to Digital Color Design; Graphi-Sha Publishing: Tokyo, Japan, 2018. [Google Scholar]
  23. Jia, H.; Luo, P.; Yang, H.; Luo, C.; Li, H.; Wu, S.; Cheng, Y.; Huang, Y.; Xie, W. Exploring the Relationship between Forest Scenic Beauty with Color Index and Ecological Integrity: Case Study of Jiuzhaigou and Giant Panda National Park in Sichuan, China. Forests 2022, 13, 1883. [Google Scholar] [CrossRef]
  24. Zhang, L.; Li, X.; Li, C.; Zhang, T. Research on Visual Comfort of Color Environment Based on the Eye-Tracking Method in Subway Space. J. Build. Eng. 2022, 59, 105138. [Google Scholar] [CrossRef]
  25. Hegde, A.L.; Bishop, N. Saturation Based Color Appearance of Objects: A Comparison between Healthy Elderly, Young Adults, and Young Adults Wearing Goggles Simulating Cataract. Build. Environ. 2018, 127, 148–156. [Google Scholar] [CrossRef]
  26. Lengen, C. The Effects of Colours, Shapes and Boundaries of Landscapes on Perception, Emotion and Mentalising Processes Promoting Health and Well-Being. Health Place 2015, 35, 166–177. [Google Scholar] [CrossRef]
  27. Zhang, Y.; Liu, P.; Han, B.; Xiang, Y.; Li, L. Hue, chroma, and lightness preference in Chinese adults: Age and gender differences. Color Res. Appl. 2019, 44, 967–998. [Google Scholar] [CrossRef]
  28. Howley, P. Landscape Aesthetics: Assessing the General Publics’ Preferences towards Rural Landscapes. Ecol. Econ. 2011, 72, 161–169. [Google Scholar] [CrossRef]
  29. Hegetschweiler, K.T.; Wartmann, F.; Dubernet, I.; Hunziker, M. Urban Forest Usage and Perception of Ecosystem Services—A Comparison between Teenagers and Adults. Urban For. Urban Green. 2022, 74, 127624. [Google Scholar] [CrossRef]
  30. Nolé Fajardo, M.L.; Higuera-Trujillo, J.L.; Llinares, C. Lighting, Colour and Geometry: Which Has the Greatest Influence on Students’ Cognitive Processes? Front. Archit. Res. 2023, 12, 575–586. [Google Scholar] [CrossRef]
  31. Gan, Y.; Zheng, Y.; Zhang, L. Audio-Visual Analysis of Visitors’ Landscape Preference for City Parks: A Case Study from Zhangzhou, China. Forests 2022, 13, 1376. [Google Scholar] [CrossRef]
  32. Chen, S.; Liu, L.; Chen, C.; Haase, D. The Interaction between Human Demand and Urban Greenspace Supply for Promoting Positive Emotions with Sentiment Analysis from Twitter. Urban For. Urban Green. 2022, 78, 127763. [Google Scholar] [CrossRef]
  33. Svobodova, K.; Sklenicka, P.; Molnarova, K.; Salek, M. Visual preferences for physical attributes of mining and post-mining landscapes with respect to the sociodem-ographic characteristics of respondents. Ecol. Eng. 2012, 43, 34–44. [Google Scholar] [CrossRef]
  34. Müderrisoğlu, H.; Gültekin, P.G. Understanding the Children’s Perception and Preferences on Nature-Based Outdoor Landscape. Indoor Built Environ. 2015, 24, 340–354. [Google Scholar] [CrossRef]
  35. Van Den Berg, A.E.; Koole, S.L. New Wilderness in the Netherlands: An Investigation of Visual Preferences for Nature Development Landscapes. Landsc. Urban Plan. 2006, 78, 362–372. [Google Scholar] [CrossRef]
  36. Hu, K.; Xu, Z.; Wang, X.; Wang, Y.; Li, H.; Zhang, Y. Research on Street Color Environment Perception Based on CEP-KASS Framework. Buildings 2023, 13, 2649. [Google Scholar] [CrossRef]
  37. Howley, P.; Donoghue, C.O.; Hynes, S. Exploring Public Preferences for Traditional Farming Landscapes. Landsc. Urban Plan. 2012, 104, 66–74. [Google Scholar] [CrossRef]
  38. Wang, Q.; Yang, X.; Liu, X.; Furuya, K. Rice Terrace Experience in Japan: An Ode to the Beauty of Seasonality and Nostalgia. Land 2024, 13, 64. [Google Scholar] [CrossRef]
  39. Peng, Y.; Gan, D.; Cai, Z.; Xiao, M.; Shu, D.; Wu, C.; Yu, X.; Li, X. Landscape Features Impact the Spatial Heterogeneity of Visitation Density within a Comprehensive Park: What Are the Seasonal and Diurnal Variations? Forests 2023, 14, 1627. [Google Scholar] [CrossRef]
  40. Yuan, S.; Browning, M.H.E.M.; McAnirlin, O.; Sindelar, K.; Shin, S.; Drong, G.; Hoptman, D.; Heller, W. A Virtual Reality Investigation of Factors Influencing Landscape Preferences: Natural Elements, Emotions, and Media Creation. Landsc. Urban Plan. 2023, 230, 104616. [Google Scholar] [CrossRef]
  41. Russell, J.A.; Ward, L.M. Environmental psychology. Annu. Rev. Psychol. 1982, 33, 651–689. [Google Scholar] [CrossRef]
  42. Gifford, R. Environmental psychology matters. Annu. Rev. Psychol. 2014, 65, 541–579. [Google Scholar] [CrossRef]
  43. De Groot, J.I. Environmental Psychology: An Introduction, 2nd ed; John Wiley & Sons Ltd: Chichester, UK, 2019; pp. 157–217. [Google Scholar]
  44. Ma, B.; Hauer, R.J.; Xu, C. Effects of Design Proportion and Distribution of Color in Urban and Suburban Green Space Planning to Visual Aesthetics Quality. Forests 2020, 11, 278. [Google Scholar] [CrossRef]
  45. Xu, T.; Wang, S.; Liu, Q.; Kim, J.; Zhang, J.; Ren, Y.; Ta, N.; Wang, X.; Wu, J. Vegetation Color Exposure Differences at the Community and Individual Levels: An Explanatory Framework Based on the Neighborhood Effect Averaging Problem. Urban For. Urban Green. 2023, 86, 128001. [Google Scholar] [CrossRef]
  46. Šprah, N.; Potočnik, J.; Košir, M. The Influence of Façade Colour, Glazing Area and Geometric Configuration of Urban Canyon on the Spectral Characteristics of Daylight. Build. Environ. 2024, 251, 111214. [Google Scholar] [CrossRef]
  47. Vera-Villarroel, P.; Contreras, D.; Lillo, S.; Beyle, C.; Segovia, A.; Rojo, N.; Moreno, S.; Oyarzo, F. Perception of Safety and Liking Associated to the Colour Intervention of Bike Lanes: Contribution from the Behavioural Sciences to Urban Design and Wellbeing. PLoS ONE 2016, 11, e0160399. [Google Scholar] [CrossRef]
  48. Torres, A.; Serra, J.; Llopis, J.; Delcampo, A. Color preference cool versus warm in nursing homes depends on the expected activity for interior spaces. Front. Archit. Res. 2020, 9, 739–750. [Google Scholar] [CrossRef]
  49. Wang, C.; Leung, M. Effects of Subjective Perceptions of Indoor Visual Environment on Visual-Related Physical Health of Older People in Residential Care Homes. Build. Environ. 2023, 237, 110301. [Google Scholar] [CrossRef]
  50. Wan, J.; Wu, H.; Collins, R.; Deng, K.; Zhu, W.; Xiao, H.; Tang, X.; Tian, C.; Zhang, C.; Zhang, L. Integrative Analysis of Health Restoration in Urban Blue-Green Spaces: A Multiscale Approach to Community Park. J. Clean. Prod. 2024, 435, 140178. [Google Scholar] [CrossRef]
  51. Osgood, C.E. Exploration in semantic space: A personal diary 1. J. Soc. Issues 1971, 27, 5–64. [Google Scholar] [CrossRef]
  52. Li, Z.; Sun, X.; Zhao, S.; Zuo, H. Integrating Eye-Movement Analysis and the Semantic Differential Method to Analyze the Visual Effect of a Traditional Commercial Block in Hefei, China. Front. Archit. Res. 2021, 10, 317–331. [Google Scholar] [CrossRef]
  53. Arriaza, M.; Cañas-Ortega, J.F.; Cañas-Madueño, J.A.; Ruiz-Aviles, P. Assessing the Visual Quality of Rural Landscapes. Landsc. Urban Plan. 2004, 69, 115–125. [Google Scholar] [CrossRef]
  54. Wade, M.T.; Julian, J.P.; Jeffery, K.S.; Davidson, S.M. A Participatory Approach to Assess Social Demand and Value of Urban Waterscapes: A Case Study in San Marcos, Texas, USA. Land 2023, 12, 1137. [Google Scholar] [CrossRef]
  55. Ma, B.; Hauer, R.J.; Xu, C.; Li, W. Visualizing Evaluation Model of Human Perceptions and Characteristic Indicators of Landscape Visual Quality in Urban Green Spaces by Using Nomograms. Urban For. Urban Green. 2021, 65, 127314. [Google Scholar] [CrossRef]
  56. Lak, A.; Aghamolaei, R.; Baradaran, H.R.; Myint, P.K. A Framework for Elder-Friendly Public Open Spaces from the Iranian Older Adults’ Perspectives: A Mixed-Method Study. Urban For. Urban Green. 2020, 56, 126857. [Google Scholar] [CrossRef]
  57. Potter, J.D.; Brooks, C.; Donovan, G.; Cunningham, C.; Douwes, J. A Perspective on Green, Blue, and Grey Spaces, Biodiversity, Microbiota, and Human Health. Sci. Total Environ. 2023, 892, 164772. [Google Scholar] [CrossRef]
  58. Kuper, R. Effects of Flowering, Foliation, and Autumn Colors on Preference and Restorative Potential for Designed Digital Landscape Models. Environ. Behav. 2020, 52, 544–576. [Google Scholar] [CrossRef]
  59. Wu, L.; Luo, S.; Li, D.; Chen, Q.; Li, J.; Wen, J. Effects of Deciduous Forests on Adolescent Emotional Health in Urban Areas: An Example from the Autumn Ginkgo Forest in Chengdu. Forests 2023, 14, 1099. [Google Scholar] [CrossRef]
  60. Chen, C.; Guo, P. Can Indoor Residents Perceive Green and Blue Spaces in Communities as Posted Sentiments? A Verification in Nanchang. Forests 2022, 13, 1421. [Google Scholar] [CrossRef]
  61. Wang, R.; Zhao, J. Demographic Groups’ Differences in Visual Preference for Vegetated Landscapes in Urban Green Space. Sustain. Cities Soc. 2017, 28, 350–357. [Google Scholar] [CrossRef]
  62. Miljanovic Damjanovic, V.; Obradovic Salcin, L.; Ostojic, D.; Ostojic, L.; Gilic, B.; Geets Kesic, M.; Uzicanin, E.; Sekulic, D. Exploring Factors Associated with Physical Activity in the Elderly: A Cross-Sectional Study during the COVID-19 Pandemic. Behav. Sci. 2024, 14, 62. [Google Scholar] [CrossRef]
  63. Inoue, T.; Manabe, R.; Murayama, A.; Koizumi, H. Landscape Value in Urban Neighborhoods: A Pilot Analysis Using Street-Level Images. Landsc. Urban Plan. 2022, 221, 104357. [Google Scholar] [CrossRef]
  64. Zhang, T.; Zhang, W.; Meng, H.; Zhang, Z. Analyzing Visitors’ Preferences and Evaluation of Satisfaction Based on Different Attributes, with Forest Trails in the Akasawa National Recreational Forest, Central Japan. Forests 2019, 10, 431. [Google Scholar] [CrossRef]
  65. Mao, Y.; Kubo, T. Everyday Activities of Older Adults in Tianjin, China: Coupling Constraints, Gendered Mobilities and Social Context. Behav. Sci. 2023, 13, 996. [Google Scholar] [CrossRef]
  66. Naghibi, M.; Faizi, M. Temporary Reuse in Leftover Spaces through the Preferences of the Elderly. Cities 2022, 127, 103769. [Google Scholar] [CrossRef]
  67. Subramanian, D.; Jana, A. Assessing Urban Recreational Open Spaces for the Elderly: A Case of Three Indian Cities. Urban For. Urban Green. 2018, 35, 115–128. [Google Scholar] [CrossRef]
  68. Tao, W.; Wu, Y.; Li, W.; Liu, F. Influence of Classroom Colour Environment on College Students’ Emotions during Campus Lockdown in the COVID-19 Post-Pandemic Era—A Case Study in Harbin, China. Buildings 2022, 12, 1873. [Google Scholar] [CrossRef]
  69. Jonauskaite, D.; Parraga, C.A.; Quiblier, M.; Mohr, C. Feeling Blue or Seeing Red? Similar Patterns of Emotion Associations with Colour Patches and Colour Terms. i-Perception 2020, 11, 2041669520902484. [Google Scholar] [CrossRef]
  70. Li, H.; Peng, J.; Jiao, Y.; Ai, S. Experiencing Urban Green and Blue Spaces in Urban Wetlands as a Nature-Based Solution to Promote Positive Emotions. Forests 2022, 13, 473. [Google Scholar] [CrossRef]
  71. Smith, N.; Georgiou, M.; King, A.C.; Tieges, Z.; Webb, S.; Chastin, S. Urban Blue Spaces and Human Health: A Systematic Review and Meta-Analysis of Quantitative Studies. Cities 2021, 119, 103413. [Google Scholar] [CrossRef]
  72. Demir, Ü. Investigation of Color-Emotion Associations of the University Students. Color Res. Appl. 2020, 45, 871–884. [Google Scholar] [CrossRef]
  73. Zhao, W.; Li, X.; Zhu, X.; Ye, H.; Xu, H. Restorative Properties of Green Sheltered Spaces and Their Morphological Characteristics in Urban Parks. Urban For. Urban Green. 2023, 86, 127986. [Google Scholar] [CrossRef]
  74. Zhou, X.; Cen, Q.; Qiu, H. Effects of Urban Waterfront Park Landscape Elements on Visual Behavior and Public Preference: Evidence from Eye-Tracking Experiments. Urban For. Urban Green. 2023, 82, 127889. [Google Scholar] [CrossRef]
Figure 1. (a) Psychological process of environment perception; (b) Visual landscape assessment path.
Buildings 14 00793 g001
Figure 2. (a) Affective circumplex model (Russell); (b) color emotion circumplex model.
Buildings 14 00793 g002
Figure 3. Diagram of study framework.
Buildings 14 00793 g003
Figure 4. Geographical location of Yi Jie Qu, Dujiangyan city, China.
Buildings 14 00793 g004
Figure 5. Distribution of eight typical community outdoor spaces in Yi Jie Qu.
Buildings 14 00793 g005
Figure 6. (a) Autumn scenes of eight community outdoor spaces in Yi Jie Qu; (b) winter scenes of eight community outdoor spaces in Yi Jie Qu.
Buildings 14 00793 g006
Figure 7. SD scale for CER assessment.
Buildings 14 00793 g007
Figure 8. CER-R values statistics of eight community outdoor spaces.
Buildings 14 00793 g008
Figure 9. CER-R values on 22 pairs of color emotions.
Buildings 14 00793 g009
Figure 10. Overall color emotional tendency of the elderly toward community outdoor spaces.
Buildings 14 00793 g010
Figure 11. CER-S values statistics of eight community outdoor spaces.
Buildings 14 00793 g011
Figure 12. CER-S values for community open spaces in autumn (blue) and winter (orange).
Buildings 14 00793 g012
Figure 13. (a) Scene with highest CER-S value; (b) scene with lowest CER-S value.
Buildings 14 00793 g013
Table 1. Survey of individual information.
Individual InformationItemsCategories
Background
factors
GenderMale = 1; Female = 2
Age65–70 = 1; 70–75 = 2;
75–80 = 3; over 80 = 4
Educational levelJunior Secondary or Below = 1;
High school or technical secondary school = 2;
Junior college = 3; Bachelor degree or above = 4
Visiting factorsWalking time from residenceLess than 5 min = 1;
Less than 10 min = 2;
Less than 15 min = 3;
Less than 30 min = 4;
More than 30 min
Visit frequencyOnce a day or more = 1;
Once a week or more = 2;
Once a month or more = 3;
Once a year or more = 4
Time periods
for visit
6:00–10:00 a.m. = 1; 13:00–14:00 p.m. = 2;
15:00–17:00 p.m. = 3; 19:00–21:00 p.m. = 4
Table 2. Color characteristic indicators.
Color CharacteristicsIndicator Description
HSV indicatorsH represents hue, measured by angle, with the range of 0°~360°;
S represents saturation of a color, with values ranging from 0 to 1, a larger value indicates a more saturated color;
V represents value or the brightness of a color, with values; ranging from 0 to 1, a larger value indicates a brighter color
Color area ratioPercentage of green areas in the scene;
Percentage of blue areas in the scene;
Percentage of gray areas in the scene
Color spatial patternOne of the color spatial patterns of dots, lines, and surfaces = 1;
Two of the color patterns of dots, lines and surfaces = 2;
Three of the color patterns of points, lines and surfaces = 3
Table 3. Statistics of the elderly respondents (n = 330).
Individual FactorsCategoriesNWeighted %
GenderMale12738.5
Female20361.5
Age65–7020461.8
70–7512036.4
75–8051.5
>8010.3
Education
Level
Junior Secondary or Below13942.1
High School or Technical Secondary School12738.5
Junior College5015.2
Bachelor Degree or Above144.2
Walking time from residenceLess than 5 min175.2
Less than 10 min3410.3
Less than 15 min5917.9
Less than 30 min21765.8
More than 30 min30.9
Visit frequencyOnce a Day or More6920.9
Once a Week or More8525.8
Once a Month or More15145.8
Once a Year or More257.6
Time periods
for visit
6:00–10:00 a.m.12036.4
13:00–14:00 p.m.3610.9
15:00–17:00 p.m.10732.4
19:00–21:00 p.m.6720.3
Table 4. Color characteristics statistics.
SceneMean Of HSV IndicatorsColor Area RatiosColor Spatial Pattern
HueSaturationBrightnessGreenBlueGray
A1137305026.80%20.24%34.64%3
A2135286839.65%35.90%9.92%3
A3148146617.13%47.21%10.70%1
A41689693.67%36.96%63.04%2
A5129176138.83%24.25%36.92%3
A6158176520.69%25.76%53.55%2
A7111136212.34%22.72%56.05%2
A89323432.20%23.54%76.45%2
W188424837.79%41.08%21.12%2
W28029495.60%48.17%20.88%3
W3110215028.50%36.98%34.53%2
W418224452.80%34.15%65.84%2
W513621358.20%10.67%81.13%2
W619425456.14%33.72%60.13%2
W7147224210.96%17.22%71.86%2
Table 5. Paired sample t-test.
Paired ItemsPair (Mean ± Standard Deviation)Difference Value
(Pair 1 − Pair 2)
tp
Pair 1Pair 2
CER values for autumn scenes paired
CER values for winter scenes
3.61 ± 51.53−0.06 ± 46.913.672.1150.038 *
* p < 0.05.
Table 6. Correlations between individual factors and positive CER-R values (Kendall Tau).
Positive CER-R ValueGenderAgeEducation LevelWalking Time from ResidenceVisit Frequency
GenderCoefficients0.013
Significance0.772
AgeCoefficients0.0600.048
Significance0.1830.385
Education levelCoefficients0.219 **−0.0680.110 *
Significance0.0000.1920.033
Walking time from residenceCoefficients−0.151 **0.126 *0.087−0.082
Significance0.0000.0160.0940.096
Visit frequencyCoefficients0.176 **−0.0040.0890.113 *0.018
Significance0.0000.9420.0790.0180.716
Time period of visitCoefficients0.061−0.028−0.061−0.044−0.089−0.015
Significance0.1430.5800.2270.3570.0660.747
* p < 0.05, ** p < 0.01
Table 7. Significant individual factors as in stepwise linear regression model (n = 330).
VariablesUnstandardized BetaStandardized BetatSig.Collinearity Statistics
ToleranceVIF
(constant)10.5663.316 3.1860.002
Education level2.9890.7540.2073.9650.0000.9791.022
Walking time from residence−2.1730.711−0.158−3.0560.0020.9951.005
Visit frequency2.7710.6570.2194.2170.0000.9831.018
Table 8. Correlations between color characteristic and positive CER-S values (Pearson).
Positive CER-S ValueHueSaturationBrightnessColor Area Ratio of Three Colors
GreenBlueGray
HueCoefficients−0.103
Significance0.054
SaturationCoefficients−0.153 **−0.411 **
Significance0.0040.000
BrightnessCoefficients0.358 **0.174 **−0.507 **
Significance0.0000.0010.000
Color area ratio of green Coefficients0.233 **−0.297 **0.383 **0.293 **
Significance0.0000.0000.0000.000
Color area ratio of blueCoefficients−0.124 *−0.155 **0.199 **0.146 **0.017
Significance0.0240.0050.0000.0080.762
Color area ratio of grayCoefficients−0.186 **0.358 **−0.368 **−0.418 **−0.684 **−0.623 **0.060
Significance0.0000.0000.0000.0000.0000.0000.258
Color spatial patternCoefficients−0.186 **−0.278 **0.370 **0.0020.393 **−0.183 **
Significance0.0000.0000.0000.9690.0000.001
* p < 0.05, ** p < 0.01
Table 9. Significant color characteristics in stepwise linear regression model (n = 352).
VariablesUnstandardized BetaStandardized BetatSig.Collinearity Statistics
ToleranceVIF
(constant)0.363 1.8010.073
VBrightness0.0080.3633.9310.0000.2833.535
Color area ratio of blue−1.024−0.468−4.7570.0000.2494.020
Color area ratio of gray−0.004−0.461−3.5980.0000.2476.822
Table 10. Countermeasures for creating age-friendly color in community outdoor spaces.
Main FindingsCountermeasures
The elderly had strongest emotions of cleanliness and healthMaintaining blue-green space and its use, clean water, neat trees.
The elderly described the color landscapes in the community outdoor spaces as monotonEnrich the color landscape with a combination of layers to enhance the effect of color arousal, active sense, and exciting emotion.
The positive color emotions of the elderly were stronger for autumn scenes than for winterEmphasize the creation of color diversity through increasing the colorful foliage of flowers and plants in winter.
Education level positively influenced elderly residents’ CER valueTarget most elderly with a lower education level, focus on the creating the perception of security, relaxation, and other basic emotions.
Visit frequency positively influenced elderly residents’ CER valueIncrease the number of color landscape nodes to attract more elderly residents to engage in outdoor activities.
Walking time from residence negatively influenced elderly residents’ CER valueEnhance the connectivity of daily walking paths for the elderly to improve the negative experience of walking tiredness.
Brightness positively influenced elderly residents’ CER valueControl the colors in the community outdoor spaces at an average brightness level of medium or medium-high.
Color area ratio of blue negatively influenced elderly residents’ CER valueIn spaces with excessively open sky, use plant and artificial landscapes to secondary limit and enclose the spaces.
Color area ratio of gray negatively influenced elderly residents’ CER valueReduce the proportion of gray in paving, increase colorful permeable paving to reduce the dull emotional experience.
Disclaimer/Publisher’s Note: The statements, opinions and data contained in all publications are solely those of the individual author(s) and contributor(s) and not of MDPI and/or the editor(s). MDPI and/or the editor(s) disclaim responsibility for any injury to people or property resulting from any ideas, methods, instructions or products referred to in the content.

