Abstract
This study develops empirical fragility curves for concrete and masonry buildings in Haiti, utilizing data from the 2021 earthquake. A dataset of 3527 buildings from the StEER database, encompassing a diverse range of building types, is used. These buildings types include reinforced concrete structures with masonry infills, confined masonry buildings, reinforced masonry bearing walls, and unreinforced masonry bearing walls. Shakemaps from the USGS are utilized to assess the earthquake’s intensity at each building, with the peak ground acceleration (PGA) as the intensity measure. Damage is classified into five distinct states: no damage, minor, moderate, severe, and partial or total collapse. For each of these states, the corresponding probabilities of exceedance are calculated, and log-normal cumulative distribution functions were fitted to those data to produce empirical fragility curves. The results show a notable similarity in performance among the four types, each having high probability of failure even under low-intensity earthquakes. Total fragility curves (including all four building types) are developed subsequently and they are convolved to the probabilistic seismic hazard map of Haiti to assess the seismic risk. This includes estimating the annual probability of partial/total collapse and the probability of partial/total collapse in the event of 475-year and 2475-year earthquakes. The results indicate a significant risk, with up to 64% probability of collapse in certain areas for the 2475-year earthquake and a probability of collapse of 15% for a 475-year earthquake. These findings underscore the critical vulnerability of Haiti’s buildings to seismic events and the urgent need for their retrofit.
1. Introduction
Haiti is located within a seismically active region at the boundary of the North American and Caribbean tectonic plates, as illustrated in Figure 1. There are many active faults in this region, notably the Enquillo Plaintain Garden fault, which crosses the southern part of the country and the Septentrional fault in the nothern part. These faults have historically unleashed several devastating earthquakes, including the most recent ones in 2010 and 2021, which occurred near or on the Enquillo fault. The 2010 earthquake, with a magnitude of 7.0, resulted in more than 220,000 fatalities, the collapse of over 105,000 homes, and an economic loss exceeding USD 7.8 billion [1]. However, the 2021 earthquake, with a magnitude of 7.2, occurred near cities less densely populated than Port-au-Prince, leading to over 2000 deaths and the collapse of 61,000 homes [2].
In response to these devastating earthquakes, researchers in earthquake engineering have shown keen interest in evaluating and mitigating the seismic risk, focusing efforts on understanding the hazards and building vulnerabilities that contribute to this risk. Several scholars have focused on different aspects of research related to seismic hazard. Some have dedicated their efforts to analyzing fault movements and partitioning [3,4], with the goal of obtaining insights into the geological factors driving seismic activity. Concurrently, other researchers have concentrated on developing probabilistic hazard maps for Haiti [5], which provide estimates for the Peak Ground Acceleration (PGA) and Peak Spectral Acceleration (PSA) that can be expected across Haiti for earthquakes with return periods of 2475 and 475 years. Data from these maps were extracted to visualize the hazard curves in many cities, as illustrated in Figure 2, which reveal that several regions are likely to experience a PGA between 0.25 g and 0.83 g in the case of a 2475-year recurrence interval earthquake. It is important to note that these hazard data were calculated assuming a firm rock site, implying that the PGA could be higher for soil sites due to their amplification potential, as shown by Ulysse et al. [6,7,8] and St-Fleur et al. [9].
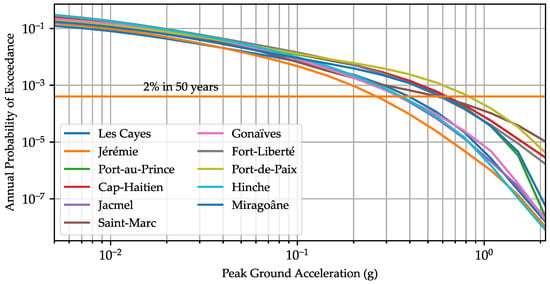
Figure 2.
Hazard curve for major cities in Haiti.
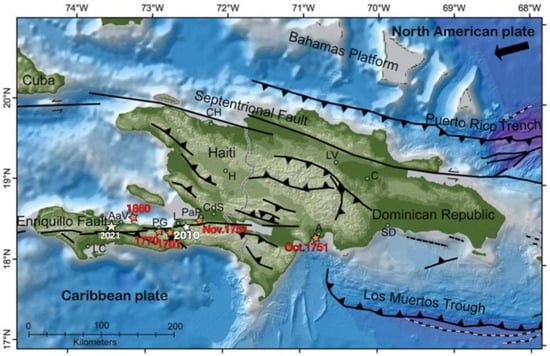
Figure 1.
Geological map showing Haiti’s fault lines and locations of significant earthquakes [10].
In addition to hazard understanding, the vulnerability of buildings is as a crucial component in seismic risk assessment, with numerous earthquake reconnaissance studies post the 2010 and 2021 earthquakes enriching the literature on this aspect [1,2,11,12,13,14,15,16,17,18]. Typically, the high vulnerability of structures is attributed to factors such as low-quality materials, insufficient reinforcement in reinforced concrete members, non-ductile design, and the fact that buildings were mostly designed for gravity loads but not for seismic and horizontal loads. For instance, Desroches et al. [12] evaluated the compressive strength of a typical Haitian concrete and found an average strength of 9 MPa, which is very low compared to the ACI minimum recommended value of 17 MPa [19]. Miyamoto et al. [13] also reported that construction deficiencies in Haiti include problems such as columns with small dimensions (), low longitudinal reinforcement ratio, the employment of smooth reinforcing bars, insufficient transversal reinforcement essential for column confinement, and inadequate lap splices and rebar development length, along with the presence of captive columns. The vulnerability of these structures was evident in the significant damage they sustained, including widespread occurrences of pancake collapses and soft-story failures. Figure 3 depicts the collapse of three buildings with soft-story failures from the earthquakes in 2010 and 2021.
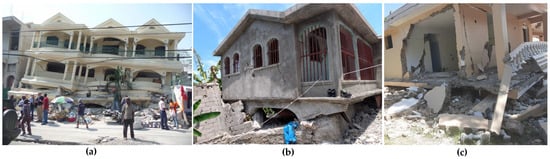
Figure 3.
Soft-story failure during the (a) 2010 and (b,c) 2021 earthquakes [1,2].
These previous studies on vulnerability have primarily focused on describing the mechanical insufficiencies of Haitian buildings. However, very few have focused into deriving fragility curves or conducting statistical or finite element analyses that link earthquake intensity to the level of damage expected. Following the 2010 earthquake, Hancilar et al. [20] conducted a comprehensive study to develop fragility curves for buildings in Haiti. This study utilized data from both remote sensing and field observations collected following the earthquake. The remote sensing data analysis included 240,672 buildings, categorized into four distinct zones: low-density built-up, medium-density built-up, high-density built-up, and shanty zones consisting of informal constructions. The field data included over 6000 buildings and were categorized by their number of stories and material types. Earthquake intensities were evaluated using U.S. Geological Survey (USGS) shakemaps, considering several intensity measures such as PGA, Peak Ground Velocity (PGV), and Modified Mercalli Intensity (MMI). Molina et al. [21] also conducted an evaluation of the vulnerability of typical structures by calibrating fragility functions. Their results were used by a following study [22], which indicated that under certain scenarios, 45% of the buildings in Port-au-Prince could sustain at least extensive damage. Although these previous studies were instrumental in understanding the vulnerability of constructions near Port-au-Prince, the 2021 earthquake has provided new data for buildings spread across less densely populated areas, such as Les Cayes and Jérémie. These new data are crucial for expanding our understanding of seismic vulnerabilities in different geographical areas of Haiti. Therefore, deriving new fragility curves using the 2021 data might offer valuable insights for buildings in these regions. New empirical fragility curves could also be significant for assessing the effectiveness of post-2010-earthquake reconstruction efforts and updated building codes, and for updating existing fragility models.
This study focuses on evaluating the vulnerability and seismic risk of concrete and masonry buildings in Haiti. It achieves this by deriving empirical fragility curves from data gathered following the 2021 earthquake and then convolving these curves with hazard data to assess the seismic risk. The empirical fragility curves are derived using two datasets: damage data collected post the 2021 earthquake by Structural Extreme Events Reconnaissance (StEER) [2] and shakemaps provided by the USGS. From the StEER dataset, 3527 damage data points were utilized, encompassing four distinct classes of buildings. Fragility curves were individually derived for each building type and subsequently aggregated into a single class, which was then convolved with hazard data to evaluate the seismic risk.
2. Empirical Fragility Methodology
Seismic fragility is a concept in earthquake engineering that measures the likelihood of a building reaching or exceeding a certain level of damage under a specific seismic intensity. There are several methods for deriving fragility curves, including expert opinion, analytical approaches, and empirical studies [23]. Expert opinion relies on the judgment of experts to establish a link between earthquake intensity and building damage. However, because this method relies on judgment, it is widely subjective and could lead to unreliable results. Analytical methods, conversely, connect damage to earthquake intensity typically through the use of numerical models. These models simulate the behavior of structures under seismic loads to predict damage outcomes. The analytical approach is extensively utilized in deriving fragility curves, encompassing several key steps [24,25,26,27]: (i) developing Finite Element (FE) models for the specific building types under investigation; (ii) selecting a comprehensive suite of ground motions to accurately simulate earthquake-induced shaking; and (iii) performing non-linear time-history analysis. This analysis aims to establish a correlation between the chosen earthquake intensity measure (IM) and the engineering demand parameter, which is typically represented by the maximum interstory drift. One drawback of the analytical approach is that its accuracy depends on the building models. Developing models presents a trade-off between computational cost and accuracy, while sophisticated models can significantly enhance result accuracy, they are often computationally expensive and time-consuming. Conversely, simpler models, although more computationally efficient, may compromise on accuracy, potentially leading to unreliable outcomes. Numerical models typically model columns and beams without modeling the masonry since they are fragile and can collapse under moderate shaking. For example, Laguerre et al. [28] delve into the seismic behavior of Haitian reinforced concrete structures, employing FE models in LS-Dyna [29] and OpenSees [30] to create fragility curves. Their study not only assesses seismic performance but also evaluates retrofit strategies for enhanced structural resilience. Notably, while their models exclude masonry walls, other research in the field incorporates masonry into the modeling process for a more comprehensive analysis [31].
Unlike analytical fragility curves, empirical fragility curves are derived from actual post-earthquake surveys, damage evaluations, and ground motion characterization, thus reflecting the true response of structures to earthquakes. The empirical approach offers valuable insights into the susceptibility of various structural stocks due to its statistical nature, accounting inherently for uncertainties involved in a building class. Despite the challenges in gathering comprehensive data, advancements in technology and data sharing have made empirical fragility assessments more feasible in recent years. Once the data is available, the process for creating empirical fragility curves involves multiple steps, ensuring a comprehensive analysis from seismic activity to structural damage [32,33,34,35] as shown in Figure 4:
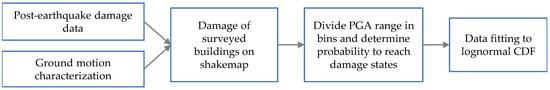
Figure 4.
Methodology for empirical fragility.
- Characterization of ground motion: Data estimating the earthquake intensity across the area studied are crucial. Shakemaps from the USGS are commonly used for that, and the PGA is a typical parameter describing earthquake intensity;
- Collection of building damage data: Gathering post-earthquake data of building damage and defining different damage states are necessary. This usually involves detailed field inspections to understand the range of damage experienced by structures, then, a damage state is assigned to each building;
- Aggregation and analysis of data: For each building surveyed, the PGA corresponding to the ground shaking at the location of this building during the earthquake is evaluated using the shakemaps. The data is binned according to several PGA ranges, and for each bin, the probability of experiencing various damage states is evaluated;
- Fitting of fragility curves: The empirical fragility curve is derived by fitting a log-normal cumulative distribution function to the probability data points, establishing a probabilistic connection between PGA and damage states.
In this study, the implementation was carried out using Python [36], and the GeoPandas library, which facilitated the analysis of shakemaps and extraction of PGA values for each surveyed building.
3. Damage States and Collection of Building Data
In Haiti, buildings are predominantly made of concrete and masonry [17,37]. Typically, reinforced concrete is used for columns, while masonry serves as infill walls or bearing walls. These buildings can be categorized into four distinct classes: RC frames with masonry infills (RCF), confined masonry (CM), reinforced masonry bearing walls (RM), and unreinforced masonry bearing walls (URM). This classification system was also utilized in the post-earthquake analysis reports by StEER and others following the 2021 earthquake [2,38]. RCF is characterized by RC beams and columns, with masonry walls that are not structurally connected to the frame. Conversely, CM structures are characterized by masonry walls that are tied to the columns. The structural differences between these two types, particularly the bond between infill walls and RC columns, are illustrated in Figure 5, highlighting the clear separation in infill masonry and the wall-to-column bonding preparation in confined masonry.
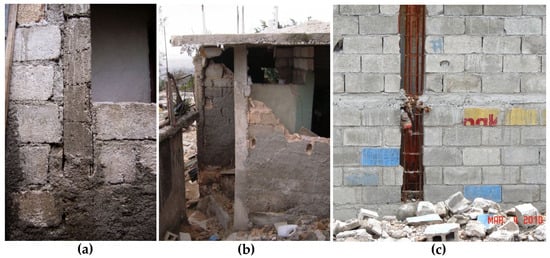
Figure 5.
(a,b) Masonry infill vs. (c) confined masonry [39] (Source: Anna Lang).
The construction sequence of these two types are also different [17]. In RCF, the columns are built before the erection of the walls. However, for CM, the walls are built prior to the construction of the columns, leaving the space to pour concrete and tie the wall to the masonry wall (see Figure 5c). If built properly, these two types are not expected to behave similarly. In RCF, masonry walls are considered as non-strutural elements, but in CM, masonry walls are expected to resist some amount of in-plane and out-of-plane forces [18]. However, the construction quality of these structures can also significantly impact their seismic performance. With a poor wall–column bond, the confined masonry may not be as resistant as intended. In some reconnaissance studies after the the 2010 earthquake, some authors stated that there are no true confined-masonry structures, and they refer to them instead as “wall-first” [18] as opposed to concrete and masonry infill, which are “column-first”.
In load-bearing masonry wall structures, the masonry wall has also the function of bearing gravity loads. The distinction between RM and URM lies in the integration of steel rebars within the walls in RM, enhancing their structural integrity. However, these types of structures typically lack adequate design considerations for withstanding seismic loads. Often, these buildings do not incorporate ring beams, and their openings are not adequately confined, which can compromise their stability during earthquakes [1,2,40]. While, in theory, the differences between these four categories are distinct, the reality often shows otherwise. Poor quality control, tight budgets, and limited skills in designing for seismic resistance often cause single-family homes to exhibit characteristics that make it hard to categorize them strictly [41].
Following the 2021 earthquake in Haiti, StEER engaged in a comprehensive data collection initiative, with the support of numerous local volunteers and engineers [2]. The gathered data were subsequently integrated into the StEER database and made available online [42]. Over 6000 structures were evaluated, covering a range of building types, namely, the four types presented above and wood light frames (WL), wood with stone frames (WS), and others classified as unknown [38]. It is essential to note the presence of numerous historical buildings in Haiti, known as ’Gingerbread houses’, constructed at the turn of the 20th century—prior to the introduction of concrete in the country in 1914 [43,44]. These historical buildings consist of timber structures and URM bearing walls. However, wooden structures are excluded for this study, and only the concrete and masonry types (RCF, CM, RM, URM) are considered. From the data regarding the URM structures, there is no clear evidence that they are all historical buildings.
It is important to recognize also that biases may influence the data collection process. Buildings that are heavily damaged or more easily accessible may be disproportionately selected for assessment, potentially leading to an overestimation of the overall vulnerability of the building stock. Additionally, the assessment of damage carries a degree of subjectivity, as it relies on visual inspections. This subjective nature can introduce variability in the evaluation of building damage, affecting the accuracy of the derived fragility curves.
Among the surveyed concrete and masonry buildings, 23.2% were RCF, 41.4% were CM, 24.2% were URM, and 11.2% were RM, as illustrated in Figure 6c. Five damage states were considered: no damage, minor, moderate, severe, and partial or total collapse. The classification criteria are presented in Table 1, and examples of visual representation of each damage states are presented in Figure 7. The observed seismic damages of these four categories vary slightly. As shown in Figure 6a, RCF buildings demonstrated a relatively better performance with the highest percentages in minor damage and the lowest in collapse. In contrast, URM buildings exhibited the highest vulnerability, with the lowest percentages in no damage and the highest in severe damage. CM and RM buildings displayed intermediate levels of damage, with CM having a notably higher rate of collapse compared to RCF. Overall, the difference in the performance among the four building types are not very significant, thus highlighting that regardless of the buildings type in Haiti, the seismic vulnerability is generally high.
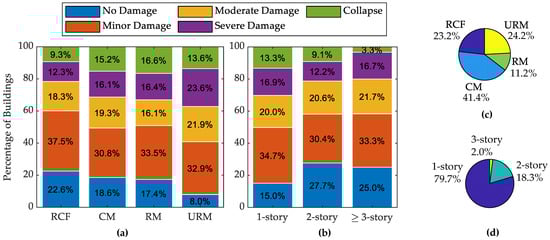
Figure 6.
Concrete and masonry buildings inventory: (a) damage states distribution by building type, (b) damage states distribution by buildings’ number of stories, (c) distribution by building type, and (d) distribution by buildings’ number of stories.

Table 1.
Description of building damage states [45].
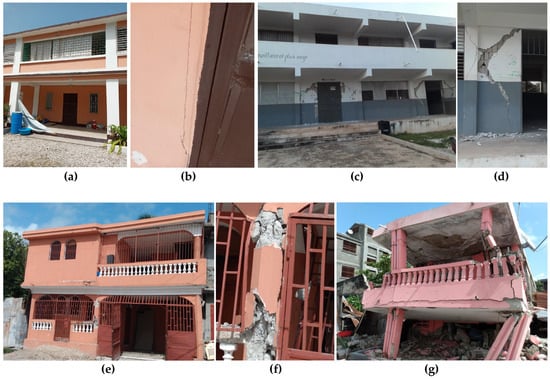
Figure 7.
Building damage states: (a,b) minor, (c,d) moderate, (e,f) severe, (g) partial or total collapse [42].
Analyzing the performance of buildings by their number of stories revealed a notable difference in their earthquake-induced damage levels. Single-story buildings, which are the most common, as depicted in Figure 6d, showed a higher incidence of damage. Specifically, 85% of these buildings sustained at least minor damage, as illustrated in Figure 6b. In comparison, two-story buildings and those with three stories or more exhibited lower incidences of damage, with 72.3% and 75%, respectively, experiencing at least minor damage. A noteworthy observation is that buildings with three stories or more had the lowest rate of collapse, suggesting that taller buildings may possess certain structural advantages or construction qualities that enhance their earthquake resistance, especially compared to single-story buildings. Nonetheless, it is crucial to acknowledge that despite these differences, all building types demonstrated significant vulnerability to earthquake.
4. Ground Motion Characterization
Ground motion characterization is a critical aspect of seismology and earthquake engineering, aimed at accurately describing and quantifying the intensity of earth movements during an earthquake. This characterization can be achieved through data collected from instrumented stations, which measure the ground’s acceleration, velocity, and displacement. In addition, subjective-assessment-based feedback about the shaking intensity can supplement these data. The process also considers the influence of site characteristics, which can amplify shaking due to a phenomenon known as the site effect, which is dependent on factors such as soil type and topography. In the context of developing empirical fragility curves, estimating ground shaking at the locations of surveyed buildings is crucial.
After the 2010 earthquake, Haiti started to develop a seismic network, a crucial step in a broader effort to improve the nation’s seismic monitoring and resilience. While there was a scarcity of instrumented stations recording the ground motion during the 2010 earthquake, stations recorded the ground motion during the 2021 earthquake. There were seven USGS station operational with an epicentral distance of between 17 and 400 km [2]. One station from Ayiti-Seisme [46], recorded a PGA of 0.34 g while its epicentral distance was approximately 25 km [2]. The instrumented stations data along with observations and reports gathered via the “Did You Feel It?” (DYFI) system were used to evaluate the earthquake intensity accross Haiti. These facilitated the generation of shakemaps by the USGS, which included intensity measures like PGA, PGV, peak spectral acceleration (PSA), and MMI. It should be acknowledged that shakemaps also have inherent limitations. The accuracy of these maps depend on the density of the seismic network. In regions with sparse instrumentation, like Haiti, the interpolation of data points can lead to uncertainties in the estimated intensities. Additionally, the reliance on subjective assessments of the DYFI system introduces a level of variability that can affect the precision of the ground motion characterization. The site effect, which significantly influences ground shaking intensity, is another complex factor that shakemaps may not fully capture in detail, especially in areas with heterogeneous soil conditions that are not well investigated.
PGA was the intensity measure utilized for developing fragility curves. Buildings in the survey range from one to four stories, thus having their fundamental period approximately between 0.1 s and 0.4 s. For that range of short period structures, PGA correlates better with the demand than other intensity measure such as the PGV or the peak ground displacement (PGD) [47]. Figure 8 shows the PGA contours and the damages throughout Haiti’s southern and eastern areas, as a result of the earthquake on 14 August 2021. The PGA values varied between 0.01 g, indicative of minor shaking, to 0.78 g, reflecting significant ground shaking.
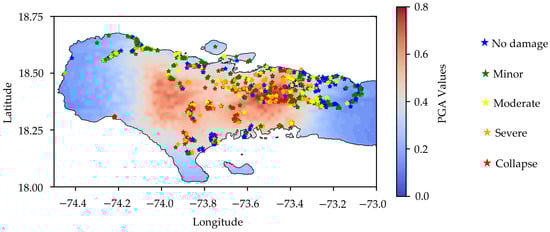
Figure 8.
Damage to surveyed buildings on a shakemap [42,48].
The building damages are primarily caused by the 7.2-magnitude mainshock, which was significantly stronger than the aftershocks, which reached a magnitude of 5.9 [2]. The geographical locations of the surveyed buildings were superimposed onto the shakemap, which enabled the identification of specific PGA values for each structure. Once PGA values were obtained for each building, they were categorized into eight distinct bins. Figure 9a,c,e,g show the histogram of the PGA values for each type of buildings. For each of these bins, the probability of reaching each damage state was calculated as also shown in Figure 9b,d,f,h.
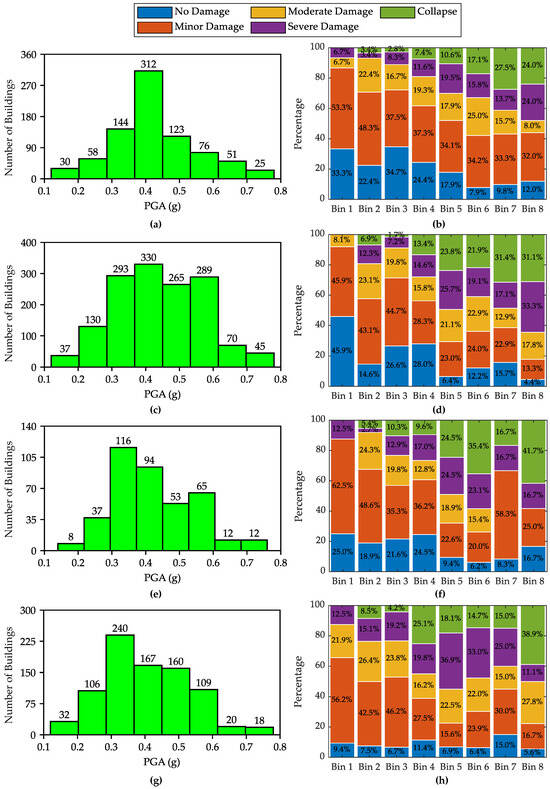
Figure 9.
Histogram of PGA for surveyed buildings and damage states for each bin: (a,b) RCF, (c,d) CM, (e,f) RM, and (g,h) URM.
The observed trend showed that with higher PGA values, the probability of buildings sustaining more severe damage increased. For instance, the RCF structures showed a higher probability of collapse (27.5% and 24%) in the highest PGA bins, while the incidence of building having minor damage was the lowest in these bins. This trend is almost similar for the other types, thus showing that PGA could be a reliable predictor of structural damage.
5. Proposed Empirical Fragility Curves
An individual analysis was conducted for each of the four building types. The dataset comprised 819 data points for RCF, 1459 for CM, 397 for RM, and 852 for URM. The fragility curves are modeled using log-normal cumulative distribution functions, as represented in Equation (1), adopting the approach of Lallemant et al. (2015) [49]. This function establishes a continuous relationship between the earthquake intensity measure and the probability of reaching each damage state . The symbol denotes the cumulative distribution function of the standard normal distribution. The parameters and are, respectively, the logarithmic mean and standard deviation of the fragility curve corresponding to the damage level . The Maximum Likelihood Estimation (MLE) method is utilized to fit the data. The likelihood function is maximized by formulating it as in Equation (2) [32], where n is the number of PGA bins, the number of building reaching the considered damage state in the ith bin, the total number of building in the ith bin, and the mean of PGA in the ith bin. The values of and that maximize this function are selected.
The resulting fragility curves are illustrated in Figure 10, and Table 2 lists the median PGA and their respective dispersion. The RCF structures generally exhibit better performance compared to the CM, RM, and URM structures. The median PGA is consistently higher for RCF structures accross all damage states, except for the collapse damage state, where the median PGA of RCF is 1.06 g while being 1.32 g for URM. Normally, URM buildings are expected to be more vulnerable than RCF buildings, so this inconsistency points to potential data anomalies as illustrated in Figure 9h, where Bins 5, 6, and 7 exhibit a lower probability of collapse compared to Bin 4, despite Bin 4 having a lower PGA. This discrepancy may come from an inaccurate assessment of the buildings’ damage state or from inaccuracies in estimating the PGA during the creation of the shakemap. However, overall, the data indicate that RCF structures are generally more resilient and that URM have greater potential to reach minor, moderate, or severe damage states.
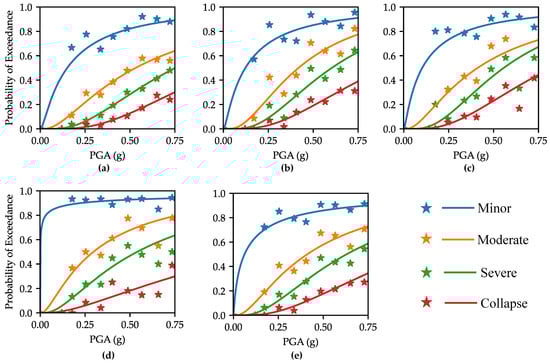
Figure 10.
Empirical fragility curves for (a) RCF, (b) CM, (c) RM, (d) URM, and (e) all. The scatter points represent observed probabilities of exceedance for different damage states. The solid lines represent the fitted log-normal distribution curves for each damage state.
Table 2.
Median PGA and dispersion for empirical fragility curves.
In practice, differentiating between the four building types often presents a challenge. This difficulty primarily arises from constraints in budget, technical capacity, and quality control, leading to poorer construction standards and thus blurring the distinctions among these classes [41]. For this reason, these four classes were merged into a single category for analysis. Merging the four building types into a single class simplifies the vulnerability assessment process, allowing for a more generalized understanding of seismic risks. It could also help in the development of uniform mitigation strategies that are broadly applicable for seismic resilience efforts. For the combined class, the same process is repeated, and the resulted fragility curves are shown in Figure 10e. These curves highlight the high vulnerability of the combined building categories, with median PGA thresholds of 0.06 g for minor damage, 0.41 g for moderate damage, 0.63 g for severe damage, and 1.02 g for collapse.
The analytical results for the collapse prevention (CP) limit state from Laguerre et al. [28] were compared to those of the severe damage state for the empirical fragility. As described by the Federal Emergency Management Agency (FEMA) [50], CP represents the limit state in which structures can still bear gravitational loads but without any safety margin against collapse. In the analytical fragility results, the average median PGA value was 0.6 g for residential one-story buildings, 0.49 g for residential two-story buildings, 0.32 g for non residential two-story buildings, and 0.35 g for non-residential three-story buildings, while for severe collapse state in the empirical fragility it was 0.63 g. These findings suggest that the class of buildings analyzed exhibits a higher level of vulnerability in contrast to the results obtained from the empirical fragility curves. The reason behind this could be that the buildings examined in Laguerre et al. have a greater number of deficiencies, as they were intentionally selected for retrofitting.
6. Integrated Hazard–Fragility Analysis for Evaluating Collapse Risk
Seismic hazard data from Frankel et al. [5] were combined with the fragility curves to evaluate the collapse risk of concrete and masonry structures. This assessment employed two distinct methods: a scenario-based approach considering two hazard levels and a more comprehensive approach utilizing the entire hazard curve to determine the annual risk of collapse. The scenario-based risk analysis, focusing on earthquakes with 475-year and 2475-year return periods, uses Equations (3) and (4) to find the risk of collapse for each scenario. For a specific hazard, its corresponding PGA is found from the hazard curves, which is expressed in Equation (3), where gives the probability to reach a certain value a of the PGA. Then, the probability to reach the collapse damage state is evaluated by using Equation (4), which is the fragility equation considering the collapse damage state. However, to evaluate the annual risk of reaching collapse state, Equation (5) is used, where is the annual probability. This approach integrates the entire hazard curve with the fragility curves, as detailed by Padgett et al. [51].
In the risk evaluation, integrating both scenario-based approaches with comprehensive approaches that assess annual risk across the whole hazard curve help understanding the risk better. Scenario-based analyses offer insights into the effects of particular earthquakes, enabling targeted preparation for specific disaster scenarios. In contrast, the comprehensive approach, by accounting for the full spectrum of possible seismic events, provides a holistic view of the annual risk, enabling more accurate estimations of expected earthquake losses.
The hazard data used were in a grid format with increments of 0.05 degrees in both longitude and latitude. At each grid point, a specific hazard curve was assigned, with which the risk is calculated. Then a cubic interpolation, performed using Matlab [52], facilitated the generation of a collapse risk contour across Haiti. As depicted in Figure 11b for a 2475-year seismic event, collapse probabilities vary between 5% and 64%. Conversely, for the more frequent 475-year event, probabilities range from 0.5% to 15% (see Figure 11a). In major cities, the likelihood of concrete building collapses differs significantly based on the earthquake recurrence interval. For a 475-year interval, the collapse probability in Port-au-Prince is approximately 15%. In smaller cities like Jacmel, Les Cayes, and Gonaïves, the risks are 2% considerably lower than the risk of 8% in Cap-Haitien. However, for a more severe 2475-year earthquake, these probabilities rise significantly: in Port-au-Prince to 55%, and in Jacmel, Les Cayes, Gonaïves, and Cap-Haïtien to 10%, 15%, 12%, and 35%, respectively. Figure 11c presents the contour of the annual risk probability of reaching collapse damage states accross Haiti. Notably, in some regions, the annual probability of building collapse can be close to 0.1%. This is especially critical in densely populated areas where structure collapse can potentially lead to casualties and huge economic losses.
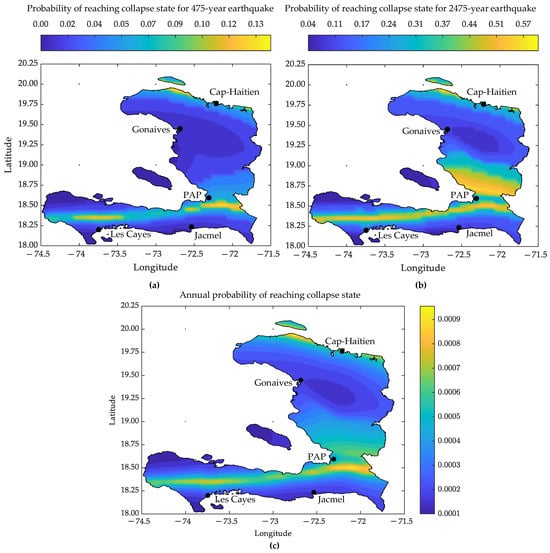
Figure 11.
Assessment of collapse risk: (a) probability of collapse during a 475-year return period earthquake, (b) probability of collapse during a 2475-year return period earthquake, and (c) annual probability of reaching a collapse state.
These risk maps in Figure 11 serve as an invaluable resource for policymakers, urban planners, and disaster-response coordinators, helping in risk mitigation, emergency preparedness, and strategic planning. These maps along with the hazard maps could help identify areas with higher risk, and also be used to estimate potential loss for future earthquakes. These data underline the urgent need to revise and enforce stricter building codes and regulations in Haiti that are specifically designed to enhance earthquake resilience. Urban planning should also consider these findings to avoid high-risk areas. It may also involve relocating vulnerable populations from the most dangerous zones. For existing structures, these data highlight also the necessity of retrofitting initiatives to improve resilience.
7. Conclusions
This study presented a detailed analysis of the seismic vulnerability of concrete and masonry buildings in Haiti, using empirical data from the 2021 earthquake. By analyzing a dataset of 3527 buildings, empirical fragility curves were developed for various building types: RCF, CM, RM, and URM. The use of shakemaps from the USGS facilitated the assessment of the earthquake’s intensity at each building’s location, with the PGA as the intensity measure. The findings reveal that the RCF structures were less vulnerable, but all building types exhibited a high probability of failure even under low-intensity seismic events. The four types of buildings were combined into a single category for a broader risk assessment, and the resulting fragility curves were convolved with Haiti’s probabilistic seismic hazard map to evaluate the annual seismic risk and two scenario-based risks. It was found that the annual risk of collapse is significant in some regions, reaching 0.1%. Furthermore, for a rare 2475-year earthquake event, the probability of building collapse in certain areas can reach as high as 64%, while for the relatively more common 475-year earthquake, the probability of collapse in some regions reaches 15%. These results underscore the critical vulnerability of Haitian building infrastructure to seismic activities and are crucial for informing policymakers, engineers, and the broader community about the imperative of implementing effective seismic risk reduction strategies in Haiti.
Although the empirical fragility curves are derived from real earthquake ground motion intensity and damage data, they present some inherent uncertainties. Shakemaps, while providing estimates of ground shaking intensity, are subject to uncertainties from many sources such as the ground motion model and uncertainty in data collection [53]. These uncertainties can lead to discrepancies between predicted and actual ground shaking levels. Similarly, post-earthquake damage data also come with their own set of uncertainties, which include biased damage assessments, variations in the structural integrity of buildings not captured in the data, and subjective interpretations of damage states by different assessors. It is important to recognize also that the hazard maps employed for the risk assessment were based on firm rock site conditions. Therefore, it may not fully represent the varied geological conditions across Haiti. This could lead to an underestimation of the actual probabilities, especially in regions where soil conditions can intensify the seismic waves. The cumulative effect of these uncertainties can significantly affect the precision and predictive power of empirical fragility models, potentially leading to inaccurate predictions of the vulnerability of the Haitian structures to future earthquakes.
To understand the seismic risk more accurately in Haiti, it is imperative to extend this research by accounting for site effects and by comparing the empirical fragility curves developed in this study with analytical curves derived from numerical models. Such comparative analysis will be crucial for validating the empirical approaches and refining seismic vulnerability assessments. This future research could use finite element modeling to analyze the existing buildings in Haiti, by prioritizing spectrum-compatible or hazard-compatible record selection and incorporating Haiti’s various soil classes to account for site effects. In the literature, multiple approaches for selecting ground motions compatible with both hazard assessments and spectral analysis as well as addressing uncertainties concerning damage states, have been discussed [54,55]. Future research adopting similar approaches is essential for accurately deriving analytical fragility curves and gaining more insights into concrete and masonry buildings in Haiti.
Author Contributions
Conceptualization, M.-A.L.; Methodology, M.-A.L.; Formal analysis, M.-A.L.; Writing—original draft, M.-A.L.; Writing—review & editing, M.S. and R.D.; Supervision, M.S. and R.D. All authors have read and agreed to the published version of the manuscript.
Funding
This research received no external funding.
Data Availability Statement
The raw data supporting the conclusions of this article will be made available by the authors on request.
Conflicts of Interest
Author Mohammad Salehi was employed by the company Simpson Gumpertz & Heger (SGH). The remaining authors declare that the research was conducted in the absence of any commercial or financial relationships that could be construed as a potential conflict of interest.
References
- Earthquake Engineering Research Institute (EERI). The Mw 7.0 Haiti Earthquake of 12 January 2010; Learning from Earthquakes; Earthquake Engineering Research Institute: Oakland, CA, USA, 2010. [Google Scholar]
- Tracy, K.C.; Khalid, M.; Ian, R.; Sergio, G.; Trung, D.; Christianos, B.; Selim, G.; César, P.M.; Sajad, J.H.; Yvonne, M.; et al. StEER—14 August 2021, M7.2 Nippes Earthquake, Haiti; Technical Report; DesignSafe-CI: Miami, FL, USA, 2021. [Google Scholar]
- Calais, E.; Symithe, S.J.; De Lépinay, B.M. Strain Partitioning within the Caribbean–North America Transform Plate Boundary in Southern Haiti, Tectonic and Hazard Implications. Bull. Seismol. Soc. Am. 2023, 113, 131–142. [Google Scholar] [CrossRef]
- Cabas, A.; Lorenzo-Velazquez, C.; Ingabire Abayo, N.; Ji, C.; Ramirez, J.; Garcia, F.E.; Pérodin, J.; Hwang, Y.; Dashti, S.; Ganapati, N.E.; et al. Intersectional Impacts of the 2021 Mw 7.2 Nippes, Haiti, Earthquake from Geotechnical and Social Perspectives. Bull. Seismol. Soc. Am. 2023, 113, 73–98. [Google Scholar] [CrossRef]
- Frankel, A.; Harmsen, S.; Mueller, C.; Calais, E.; Haase, J. Seismic Hazard Maps for Haiti. Earthq. Spectra 2011, 27, 23–41. [Google Scholar] [CrossRef]
- Ulysse, S.; Boisson, D.; Prépetit, C.; Havenith, H.B. Site Effect Assessment of the Gros-Morne Hill Area in Port-au-Prince, Haiti, Part B: Mapping and Modelling Results. Geosciences 2018, 8, 233. [Google Scholar] [CrossRef]
- Ulysse, S.; Boisson, D.; Prépetit, C.; Havenith, H.B. Site Effect Assessment of the Gros-Morne Hill Area in Port-au-Prince, Haiti, Part A: Geophysical-Seismological Survey Results. Geosciences 2018, 8, 142. [Google Scholar] [CrossRef]
- Ulysse, S.; Boisson, D.; Dorival, V.; Guerrier, K.; Préptit, C.; Cauchie, L.; Mreyen, A.S.; Havenith, H.B. Site Effect Potential in Fond Parisien, in the East of Port-au-Prince, Haiti. Geosciences 2021, 11, 175. [Google Scholar] [CrossRef]
- St Fleur, S.; Bertrand, E.; Courboulex, F.; Mercier de Lépinay, B.; Deschamps, A.; Hough, S.; Cultrera, G.; Boisson, D.; Prépetit, C. Site Effects in Port-au-Prince (Haiti) from the Analysis of Spectral Ratio and Numerical Simulations. Bull. Seismol. Soc. Am. 2016, 106, 1298–1315. [Google Scholar] [CrossRef]
- Bakun, W.H.; Flores, C.H.; ten Brink, U.S. Significant earthquakes on the Enriquillo fault system, Hispaniola, 1500–2010: Implications for seismic hazard. Bull. Seismol. Soc. Am. 2012, 102, 18–30. [Google Scholar] [CrossRef]
- Desroches, R.; Comerio, M.; Eberhard, M.; Mooney, W.; Rix, G.J. Overview of the 2010 Haiti Earthquake: Special Issue on the 2010 Haiti Earthquake. Earthq. Spectra 2011, 27, 1–21. [Google Scholar] [CrossRef]
- Desroches, R.; Kurtis, K.E.; Gresham, J.J. Breaking the reconstruction logjam. Am. Ceram. Soc. Bull. 2011, 90, 20–26. [Google Scholar]
- Kit Miyamoto, H.; Gilani, A.S.J.; Wong, K. Massive Damage Assessment Program and Repair and Reconstruction Strategy in the Aftermath of the 2010 Haiti Earthquake: Special Issue on the 2010 Haiti Earthquake. Earthq. Spectra 2011, 27, S219–S237. [Google Scholar] [CrossRef]
- Paultre, P.; Calais, E.; Proulx, J.; Prépetit, C.; Ambroise, S. Damage to engineered structures during the 12 January 2010, Haiti (Léogâne) earthquake1. Can. J. Civ. Eng. 2013, 40, 777–790. [Google Scholar] [CrossRef]
- O’Brien, P.; Eberhard, M.; Haraldsson, O.; Irfanoglu, A.; Lattanzi, D.; Lauer, S.; Pujol, S. Measures of the Seismic Vulnerability of Reinforced Concrete Buildings in Haiti: Special Issue on the 2010 Haiti Earthquake. Earthq. Spectra 2011, 27, S373–S386. [Google Scholar] [CrossRef]
- Holliday, L.; Grant, H. Haiti Building Failures and a Replicable Building Design for Improved Earthquake Safety. Earthq. Spectra 2011, 27, 277–297. [Google Scholar] [CrossRef]
- Marshall, J.D.; Lang, A.F.; Baldridge, S.M.; Popp, D.R. Recipe for Disaster: Construction Methods, Materials, and Building Performance in the January 2010 Haiti Earthquake. Earthq. Spectra 2011, 27, 323–343. [Google Scholar] [CrossRef]
- Lang, A.F.; Marshall, J.D. Devil in the Details: Success and Failure of Haiti’s Nonengineered Structures. Earthq. Spectra 2011, 27, 345–372. [Google Scholar] [CrossRef]
- ACI 318-19; Building Code Requirements for Structural Concrete (ACI 318-19): An ACI Standard; Commentary on Building Code Requirements for Structural Concrete (ACI 318R-19). American Concrete Institute: Farmington Hills, MI, USA, 2019.
- Hancilar, U.; Taucer, F.; Corbane, C. Empirical Fragility Functions based on Remote Sensing and Field Data after the 12 January 2010 Haiti Earthquake. Earthq. Spectra 2013, 29, 1275–1310. [Google Scholar] [CrossRef]
- Molina, S.; Torres, Y.; Benito, B.; Navarro, M.; Belizaire, D. Using the damage from 2010 Haiti earthquake for calibrating vulnerability models of typical structures in Port-au-Prince (Haiti). Bull. Earthq. Eng. 2014, 12, 1459–1478. [Google Scholar] [CrossRef]
- Torres, Y.; Molina, S.; Martínez-cuevas, S.; Navarro, M.; Martínez-díaz, J.J.; Benito, B.; Galiana-merino, J.J.; Belizaire, D. A first approach to earthquake damage estimation in Haiti: Advices to minimize the seismic risk. Bull. Earthq. Eng. 2016, 14, 39–58. [Google Scholar] [CrossRef]
- Porter, K. A Beginner’s Guide to Fragility, Vulnerability, and Risk. In Encyclopedia of Earthquake Engineering; Springer: Berlin/Heidelberg, Germany, 2021. [Google Scholar] [CrossRef]
- Hueste, M.B.D.; Bai, J.W. Seismic retrofit of a reinforced concrete flat-slab structure: Part II—Seismic fragility analysis. Eng. Struct. 2007, 29, 1178–1188. [Google Scholar] [CrossRef]
- Padgett, J.E.; DesRoches, R. Methodology for the development of analytical fragility curves for retrofitted bridges. Earthq. Eng. Struct. Dyn. 2008, 37, 1157–1174. [Google Scholar] [CrossRef]
- Nielson, B.G. Analytical Fragility Curves for Highway Bridges in Moderate Seismic Zones. Ph.D. Thesis, Georgia Institute of Technology, Atlanta, GA, USA, 2005. [Google Scholar]
- Angiolilli, M.; Brunelli, A.; Cattari, S. Fragility curves of masonry buildings in aggregate accounting for local mechanisms and site effects. Bull. Earthq. Eng. 2023, 21, 1–43. [Google Scholar] [CrossRef]
- Laguerre, M.A.; Salehi, M.; Desroches, R. Seismic retrofit of low-rise reinforced concrete buildings typical to Haiti. In Proceedings of the 18th World Conference of Earthquake Engineering, Milan, Italy, 30 June–5 July 2024. [Google Scholar]
- Livermore Software Technology Corporation (LSTC). Ls-Dyna Keyword User’s Manual; Livermore Software Technology Corporation (LSTC): Troy, MI, USA, 2021. [Google Scholar]
- McKenna, F.; Fenves, G.L.; Jeremic, B.; Scott, M. Open System for Earthquake Engineering Simulation; University of California: Berkeley, CA, USA, 2000. [Google Scholar]
- Mercuri, M.; Pathirage, M.; Gregori, A.; Cusatis, G. Computational modeling of the out-of-plane behavior of unreinforced irregular masonry. Eng. Struct. 2020, 223, 111181. [Google Scholar] [CrossRef]
- Giordano, N.; De Luca, F.; Sextos, A.; Ramirez Cortes, F.; Fonseca Ferreira, C.; Wu, J. Empirical seismic fragility models for Nepalese school buildings. Nat. Hazards 2021, 105, 339–362. [Google Scholar] [CrossRef]
- Rosti, A.; Del Gaudio, C.; Rota, M.; Ricci, P.; Di Ludovico, M.; Penna, A.; Verderame, G.M. Empirical fragility curves for Italian residential RC buildings. Bull. Earthq. Eng. 2021, 19, 3165–3183. [Google Scholar] [CrossRef]
- Rosti, A.; Rota, M.; Penna, A. Empirical fragility curves for Italian URM buildings. Bull. Earthq. Eng. 2021, 19, 3057–3076. [Google Scholar] [CrossRef]
- Foytong, P.; Ornthammarath, T. Empirical seismic fragility functions based on field survey data after the 5 May 2014 Mae Lao (Northern Thailand) earthquake. Int. J. Disaster Risk Reduct. 2020, 42, 101344. [Google Scholar] [CrossRef]
- Python, Version 3.11.5; Python Software Foundation: Wilmington, DE, USA, 2023.
- Davy, C.; Blaisdell, M.L.; Sinclair, K.M.; Strand, E.H. Seismic Retrofit of Confined Masonry Houses in Haiti: Lessons from Implementation. In Proceedings of the 16th World Conference on Earthquake (16WCEE 2017), Santiago, Chile, 9–13 January 2017. [Google Scholar]
- Whitworth, M.R.Z.; Giardina, G.; Penney, C.; di Sarno, L.; Adams, K.; Kijewski-Correa, T.; Black, J.; Foroughnia, F.; Macchiarulo, V.; Milillo, P.; et al. Lessons for Remote Post-earthquake Reconnaissance from the 14 August 2021 Haiti Earthquake. Front. Built Environ. 2022, 8, 16. [Google Scholar] [CrossRef]
- Earthquake Engineering Research Institute. Earthquake Photo Galleries; Earthquake Engineering Research Institute: Oakland, CA, USA, 2010. [Google Scholar]
- Mix, D.; Kijewski-Correa, T.; Taflanidis, A.A. Assessment of Residential Housing in Léogâne, Haiti, and Identification of Needs for Rebuilding after the January 2010 Earthquake. Earthq. Spectra 2011, 27, 299–322. [Google Scholar] [CrossRef]
- Burlotos, C.; Taflanidis, A.A.; Kijewski-Correa, T. Cost of Safety: Holistic Analysis of Market-Based Solutions for Housing in Haiti. Nat. Hazards Rev. 2021, 22, 04021046. [Google Scholar] [CrossRef]
- StEER Rapid Response (M7.2 Haiti EQ—Aug 2021)—Fulcrum|NSF StEER. Available online: https://web.fulcrumapp.com/apps (accessed on 18 August 2023).
- Langenbach, R.; Kelley, S.; Sparks, P.; Rowell, K.; Hammer, M.; Julien, O.J. Preserving Haiti’s Gingerbread Houses: 2010 Earthquake Mission Report, December 2010/Project Manager, Norma Barbacci; Avrami, E., Ed.; Technical Report; World Monuments Fund: New York, NY, USA, 2010. [Google Scholar]
- Atwood, T.; Chao, C.; De la Torre, M.; Fischer, C.; He, B.; Hovanic, C.; Leo, C.-N.; Maquilón, J.C.; Perles, M.; Reiter, B.; et al. The Gingerbread Houses of Port-au-Prince, Haiti; Technical Report; Columbia University: New York, NY, USA, 2016. [Google Scholar]
- Eduardo, M.; Tracy, K.C. Rapid Damage Classification for Nippes 14 August 2021, M7.2 Earthquake in Haiti; Earthquake Engineering Research Institute: Oakland, CA, USA, 2021. [Google Scholar]
- Calais, E.; Symithe, S.; Monfret, T.; Delouis, B.; Lomax, A.; Courboulex, F.; Ampuero, J.P.; Lara, P.E.; Bletery, Q.; Chèze, J.; et al. Citizen seismology helps decipher the 2021 Haiti earthquake. Science 2022, 376, 283–287. [Google Scholar] [CrossRef]
- Aquib, T.A.; Sivasubramonian, J.; Mai, P.M. Analysis of Ground Motion Intensity Measures and Selection Techniques for Estimating Building Response. Appl. Sci. 2022, 12, 12089. [Google Scholar] [CrossRef]
- United States Geological Survey. M 7.2—Nippes, Haiti. Available online: https://earthquake.usgs.gov (accessed on 25 March 2023).
- Lallemant, D.; Kiremidjian, A.; Burton, H. Statistical procedures for developing earthquake damage fragility curves. Earthq. Eng. Struct. Dyn. 2015, 44, 1373–1389. [Google Scholar] [CrossRef]
- FEMA 356. Prestandard and Commentary for the Seismic Rehabilitation of Buildings; Technical Report; FEMA: Washington, DC, USA, 2000. [Google Scholar]
- Padgett, J.E.; Dennemann, K.; Ghosh, J. Risk-based seismic life-cycle cost–benefit (LCC-B) analysis for bridge retrofit assessment. Struct. Saf. 2010, 32, 165–173. [Google Scholar] [CrossRef]
- MATLAB, Version 9.13.0 (R2022b); The MathWorks Inc.: Natick, MA, USA, 2022.
- Wald, D.J.; Worden, C.B.; Thompson, E.M.; Hearne, M. ShakeMap operations, policies, and procedures. Earthq. Spectra 2022, 38, 756–777. [Google Scholar] [CrossRef]
- Kayhan, A.; Demir, A.; Palanci, M. Multi-functional solution model for spectrum compatible ground motion record selection using stochastic harmony search algorithm. Bull. Earthq. Eng. 2022, 20, 6407–6440. [Google Scholar] [CrossRef]
- Cirak, C.; Palanci, M.; Senel, S. Fragility based evaluation of different code based assessment approaches for the performance estimation of existing buildings. Bull. Earthq. Eng. 2022, 20, 1685–1716. [Google Scholar] [CrossRef]
Disclaimer/Publisher’s Note: The statements, opinions and data contained in all publications are solely those of the individual author(s) and contributor(s) and not of MDPI and/or the editor(s). MDPI and/or the editor(s) disclaim responsibility for any injury to people or property resulting from any ideas, methods, instructions or products referred to in the content. |
© 2024 by the authors. Licensee MDPI, Basel, Switzerland. This article is an open access article distributed under the terms and conditions of the Creative Commons Attribution (CC BY) license (https://creativecommons.org/licenses/by/4.0/).