1. Introduction
Steel pipe support is a temporary support structure used to ensure that the shape and position of the formwork do not change. It is required to bear various loads such as formwork, newly poured concrete, steel bars, equipment, and workers in construction. Due to their simple structure, large bearing capacity, rapid disassembly, and strong versatility, disc buckle steel pipe supports are widely used for their safety and stability.
The disc buckle-type steel pipe bracket joint comprises octagonal plates, fastener heads, latches, and other components. The structural characteristics of disc buckle steel pipe support joints lead to different mechanical properties from those of consolidated and articulated joints. As a typical semi-rigid joint [
1,
2,
3,
4], the stiffness of the joint will affect the stability of the steel pipe bracket. Liu et al. [
5] obtained the nonlinear function fitted bearing-capacity node-stiffness curve and the optimal equivalent stiffness of the semi-rigid joints of the stent by comparing the finite element method and the experimentally measured bearing capacity of the stent nodes based on the experiments of the simple stent model. According to Zheng [
6], researchers used a combination of a quadratic function and a primary function to describe the semi-rigid curve of the support node on the base of a single-node experiment. Wang et al. [
7] used a segmented three-fold function to fit the semi-rigid joint performance of the support while considering the tightness of the plug wedge based on the experimental results. For typical support forms, Zhang [
8] analyzed the effect of the interaction behavior between support joints on rotational stiffness by considering material plasticity and different horizontal bar forces. Also, Pieńko [
9] determined the brace node load-carrying capacity with numerical analysis by considering the two conditions of the brace material nonlinearity and the interaction between the specific elements. Liu et al. [
5] and Dong [
10] developed a basic model for a disc buckle steel pipe support. They analyzed its load-bearing capacity under full load and single vertical rod conditions using a finite element model. For the monolithic support, Dong [
11] and Chen [
12] studied the ultimate bearing capacity under the influence of material nonlinearity and initial defects through simulation and experiment. Additionally, they analyzed the effect of step length and column spacing on the ultimate bearing capacity of the support.
Certain studies have revealed that the maximum load capacity of disc buckle steel pipe supports can be impacted by the semi-rigid stiffness of joints, material nonlinearity, and initial defects. Due to the intricate nature of the construction project, the factors that can influence the safety of disc buckle steel pipe supports often have distinct uncertainties. For instance, the tightness of the support joint latch is significantly influenced by manual installation, and the anchoring of different support rods is caused by production or corrosion reasons. An analysis of the impact of uncertainties on the load-bearing capacity of disc buckle steel pipe brackets has not been reported yet. Therefore, it is of utmost importance to identify the main uncertain factors [
13] and study the stability of disc buckle steel pipe brackets based on statistical analysis to ensure the safety of the tall formwork bracket.
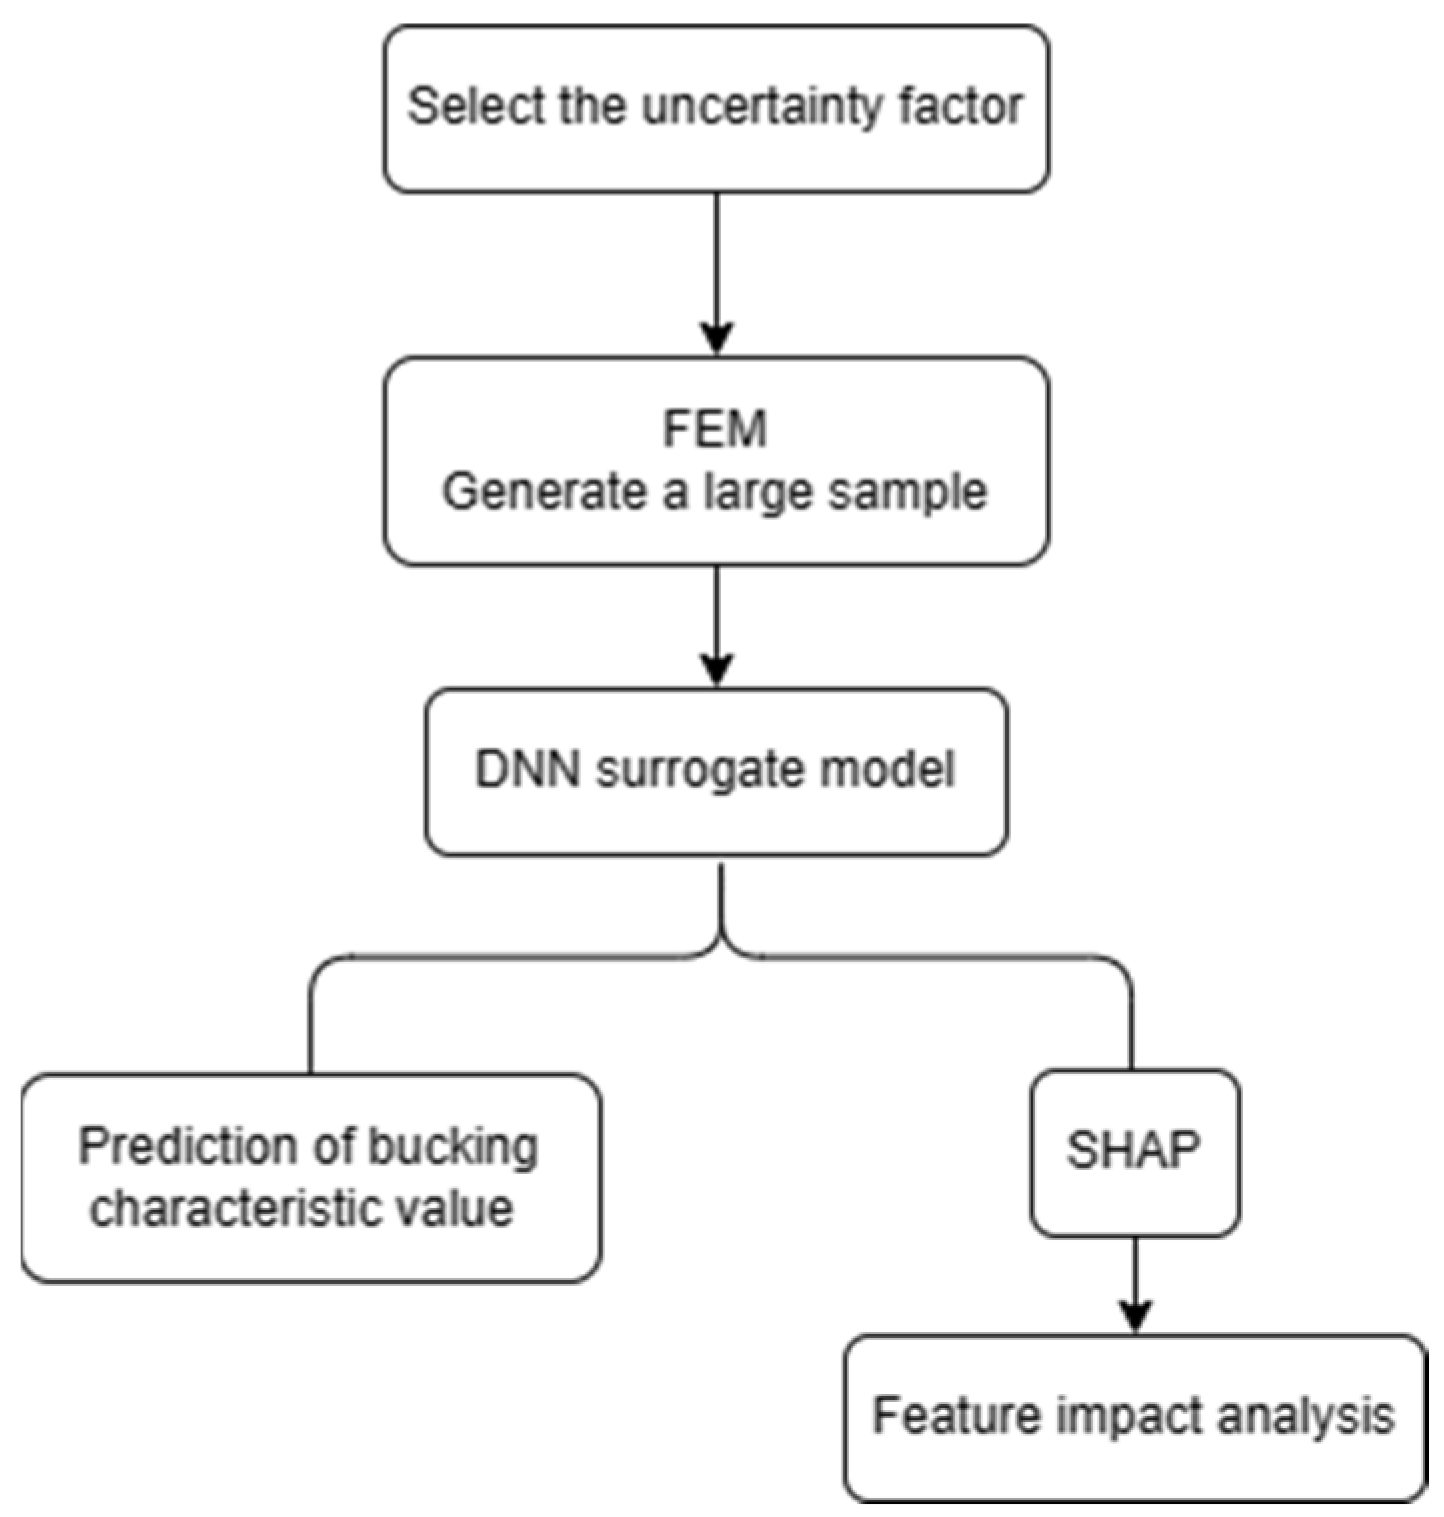
In this paper, the researchers have established a surrogate model based on the analysis of buckling characteristic values and used the Monte Carlo method combined with a deep neural network model to quickly analyze the distribution law of the buckling characteristic value of supports considering various uncertain factors. To measure the degree of influence of uncertain factors on the buckling characteristic value of the support, the researchers have used SHAP interpretability analysis. The key monitoring items to ensure the safety of the support system have been identified through this analysis. The main content of the article is shown in
Figure 1.
2. Uncertainty Factors in Disc Buckle Steel Pipe Support
During the actual construction process, there are many uncertainties in the structure, material, and installation process of the steel pipe support system. It is necessary to deeply analyze the influence of uncertainty factors on the bearing capacity of steel pipe brackets. To ensure the safety of the support system, it is crucial to deeply analyze the impact of these uncertain factors on the bearing capacity of the steel pipe support. For disc buckle steel pipe support, some common uncertain factors that need to be considered are the layout of anchoring, the wedge tightness of disc buckle joints, and the wall thickness of standard, ledger wall, diagonal brace wall hand jack, and base jack.
Disc buckle-type steel pipe brackets are formed by connecting horizontal and inclined rods to a disc buckle using rod end joints. Wedge-shaped pins and riser disc connections are used to form an invariant structural geometry system. As shown in
Figure 2, the special connection mode between the ledger and the standard of the disc buckle steel pipe bracket results in the stiffness of the connecting joints between the articulated and rigid joints. The wedging depth between the wedge pin and the standard disc determines the stiffness of the joint. In actual construction, workers’ non-standard construction will lead to obvious differences in the stiffness of semi-rigid joints. In the design and calculation of the support, the rotational stiffness of the semi-rigid joint of the disc buckle steel pipe support is taken as
, according to the technical code for temporary support structures in construction (JGJ 300-2013) [
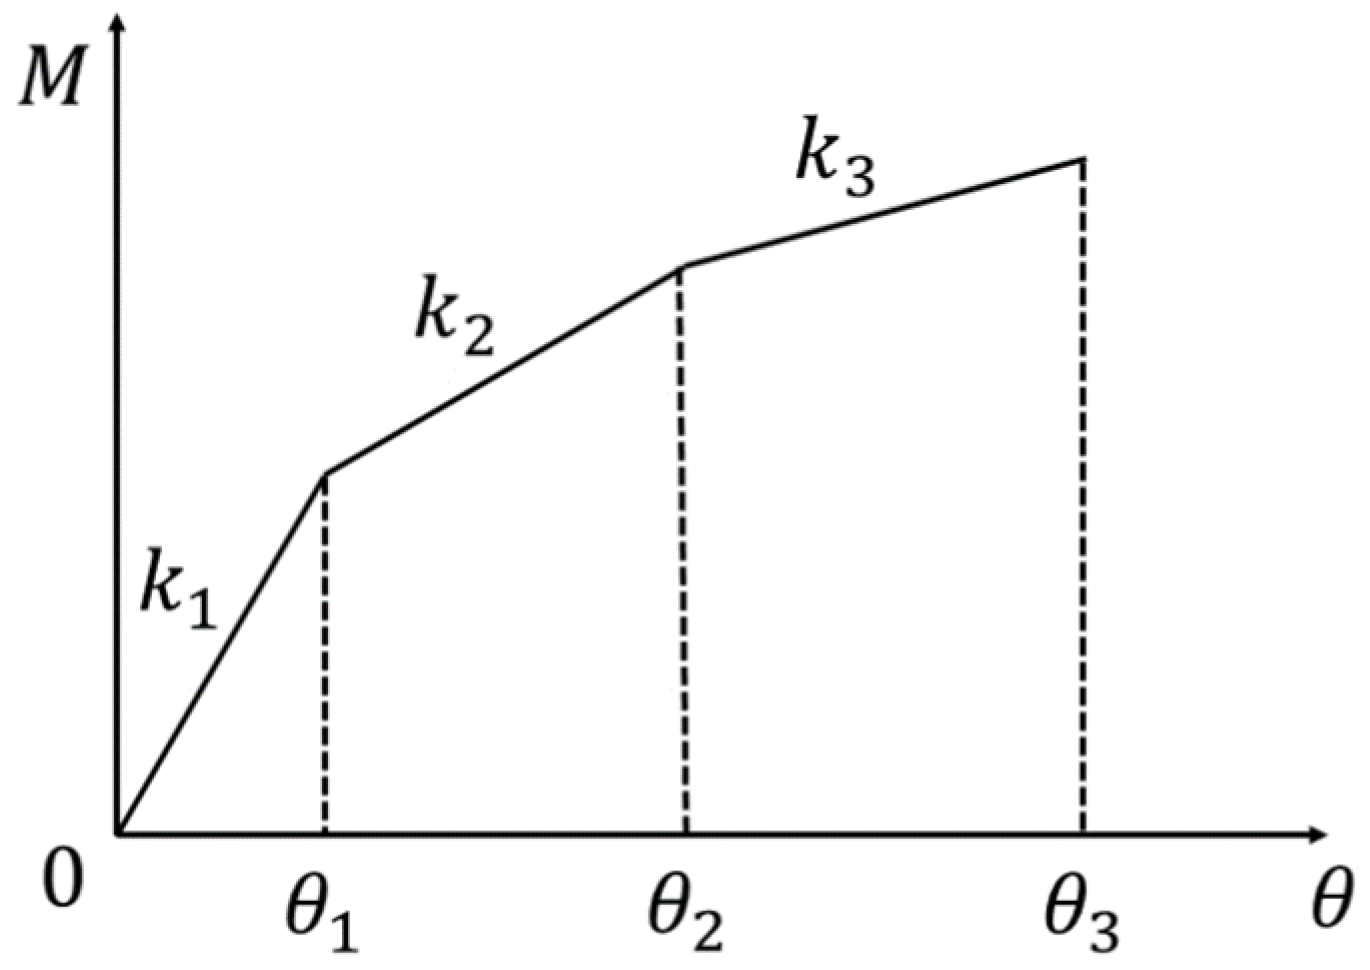
14]. In order to analyze how the tightness of latch wedges affects the rotational stiffness of disc buckle joints, a three-fold model of scaffold semi-rigid joints was proposed by literature [
7]. The model, illustrated in
Figure 3, includes different wedge-tightness scenarios and the corresponding values of each section are presented in
Table 1. Wedge tightness is calculated by Equation (1).
where,
is wedge depth,
is the initial wedge depth,
is the maximum wedge depth.
Due to production quality and loss and other reasons, the thickness of the steel pipe used in the actual project is also changed within a certain range. Based on the field investigation data of pipe usage [
15], the statistical characteristics of pipe thickness considered in this paper are shown in
Table 2.
The tall support structures of buildings are often equipped with anchoring to improve their stability against buckling. However, in practical construction, the process of installing anchoring can be laborious, which sometimes results in the construction unit deviating from the standard guidelines. As a result, certain layers of anchoring may be missing or not installed correctly, which can have an impact on the bearing capacity of the support. This research aims to quantitatively study the effects of the absence of certain anchoring layers on the support’s bearing capacity.
3. Finite Element Modeling and Bearing Capacity Analysis of Ultra-High Bracket
In this paper, the super high support system of the main body of a large commercial building is selected as the research object. As shown in
Figure 4, the support system adopts a disc buckle steel pipe support. The overall size is
, the distance on the
x-axis is
, the distance on the
y-axis is
, and the lift height is
. The red box in
Figure 4c shows the position of the top frame beam of the high support die, and the bottom of the beam is the encryption area of the support standard, with a spacing of
. The anchoring is arranged at the height of
,
,
, and
to strengthen the lateral stiffness of the support. According to the technical standard for the safety of disc lock steel tubular in construction (JGJ 231-2021) [
16], a support system with a height of more than 24 m needs to be specially designed and checked.
The materials and material parameters used for each member of the bracket are shown in
Table 3. Poisson’s ratio of materials is 0.33. Density is
. Elastic modulus is
.
ANSYS finite element software is used to model and analyze the disc buckle steel pipe support system. The standard and the ledger are beam elements (Beam188). The diagonal braces are rod elements (Link180). The connection between the standard is rigid. The connection between the diagonal brace and the standard is hinged. The connection between the standard and the ledger is semi-rigid, which is simulated by a spring element (Combin39), and only the rotating semi-rigidity of the ledger in the vertical plane is considered. All translational degrees of freedom at the bottom end of the bracket are constrained. The constraining effect of the bracket anchoring is simplified to the fixed constraint of the anchoring near the end of the standard. The top of the support adopts a beam bottom support form (Shell181) to connect with the standard and bear the top load. The beam load is assumed to act uniformly on the beam bottom support formwork. Actual engineering loads are applied to the top of the model as shown in
Figure 5. Surface loads of
,
,
are applied to frame beams at the top of the bracket, and
is applied to the remaining positions.
According to the Technical Code for Temporary Support Structures in Construction (JGJ 300-2013) [
14], the rotation stiffness of semi-rigid joints of disc buckle steel pipe support is set at
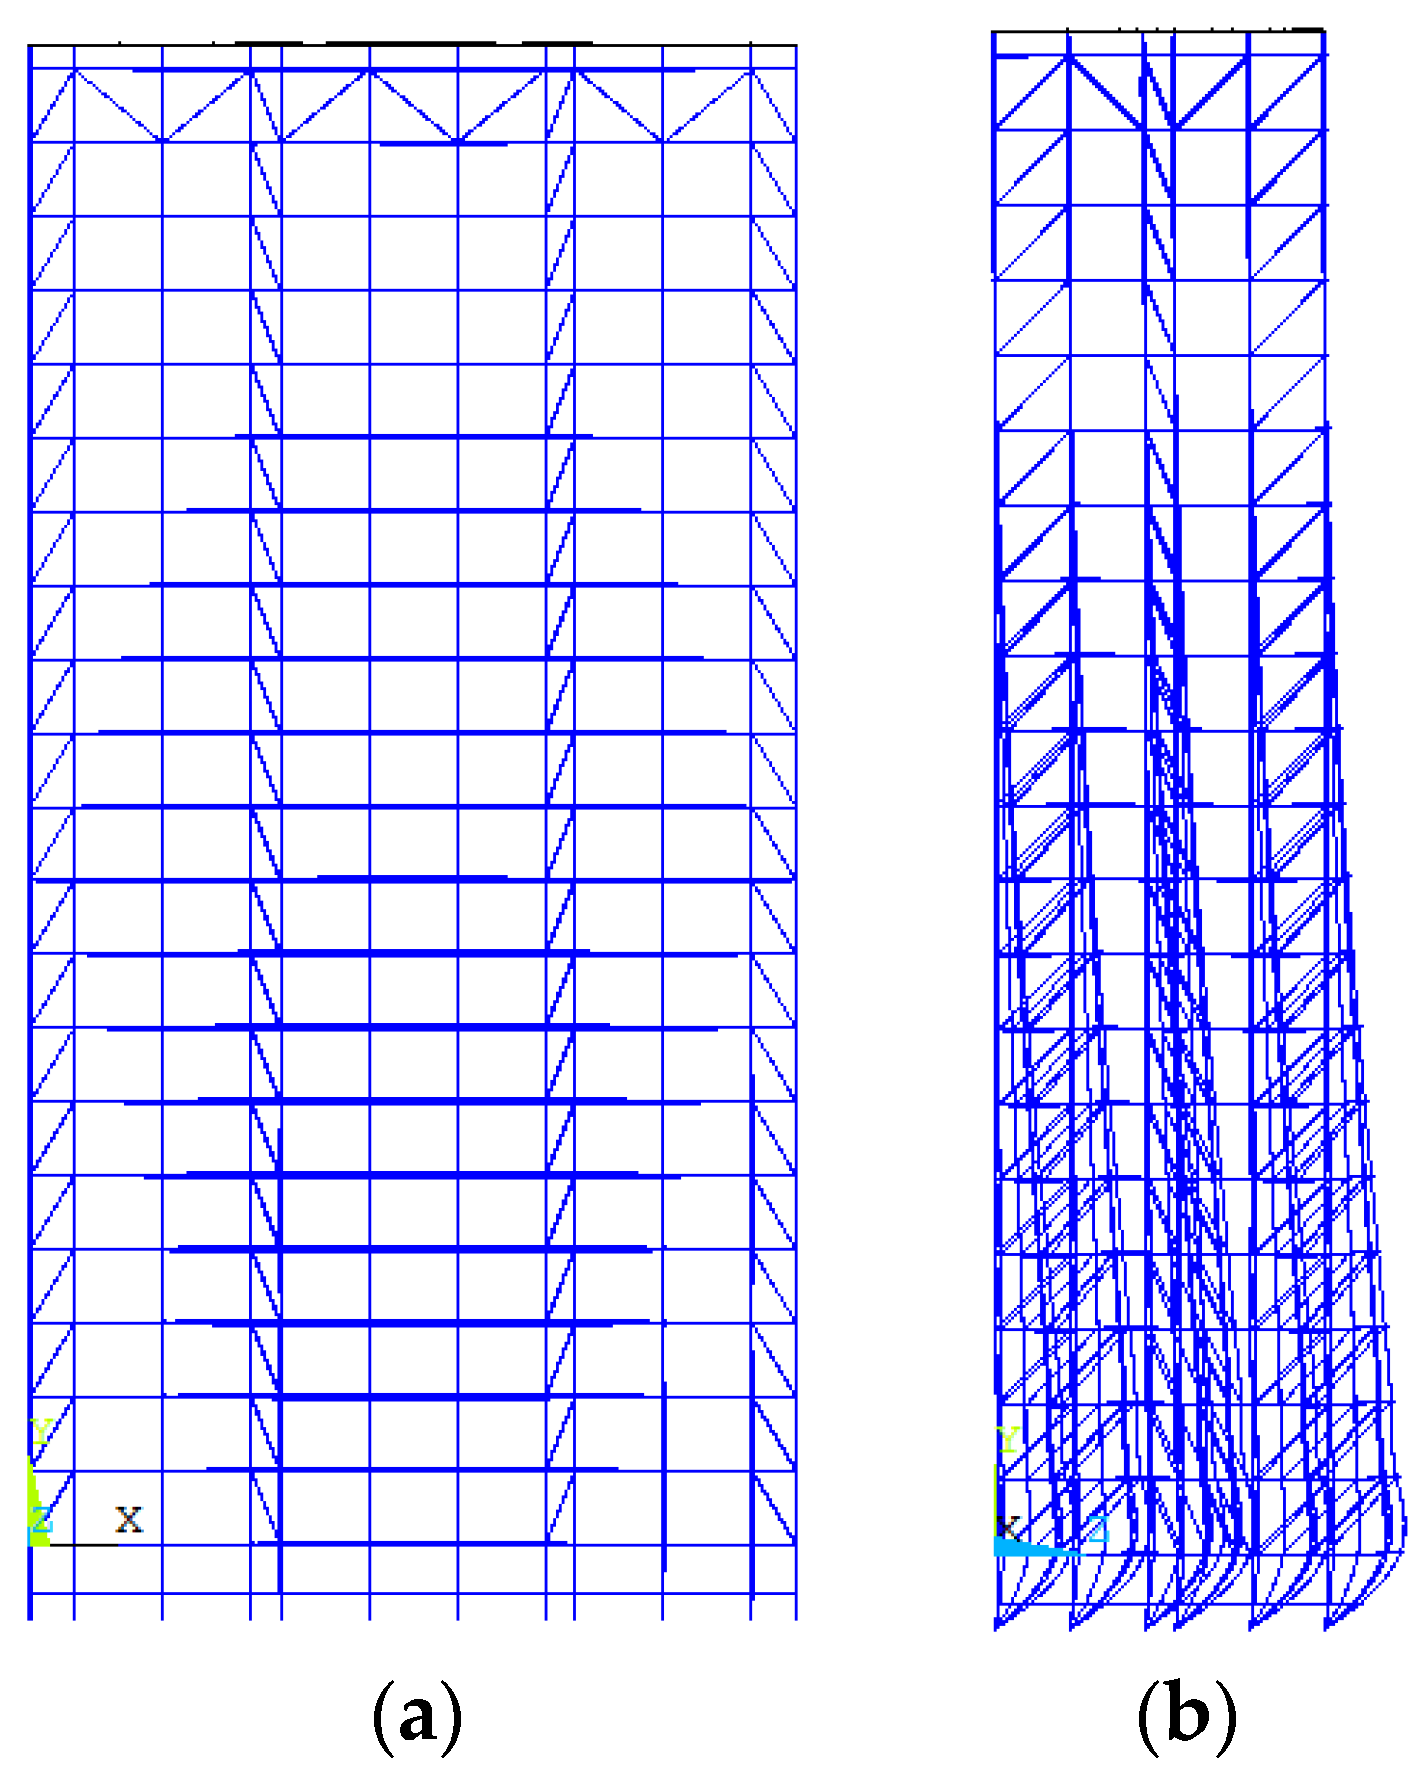
. During the eigenvalue buckling analysis of the disc buckle steel pipe support system, it was found that the first order buckling characteristic value is 23.109. The first order buckling characteristic value refers to the first unstable form under the influence of external pressure or load in the material or structure. The buckling position was observed at the bottom of the support and in the middle of its height direction. Due to the buckling position at the bottom, a certain amount of lateral displacement of the standard was observed. However, there was no significant displacement in the top bracket. According to the code, the buckling characteristic value of the temporary rod system should be greater than four [
17]. The analyzed support met the stability requirements and had a certain safety margin, as its buckling characteristic value exceeded the required limit. The corresponding buckling modes are shown in
Figure 6.
4. Surrogate Based on Deep Neural Network Model for Predicting Buckling Characteristic Value
The buckling characteristic values of the disc buckle steel pipe support system in
Section 2 are obtained under the condition of deterministic parameters. The uncertainty factors of actual engineering will change the stability of the support system. The Monte Carlo method is a common method to analyze problems with uncertainty, but its main drawback is that it requires a large number of calculation results based on the sample. When analyzing the influence of various uncertain factors on the bearing capacity of the support, using a finite element method to calculate a large number of samples will lead to heavy calculation burden. The neural network has a good nonlinear-mapping ability and can describe the implicit relationship between the uncertainty factor and the buckling characteristic value of the bracket. Therefore, a high-precision neural network model can be trained using the sample set obtained by the finite element method. As an alternative to the finite element method, the neural network can quickly predict the buckling characteristic value of the bracket according to the input parameters, which significantly improves the analysis efficiency of the Monte Carlo method.
Given the better ability to express nonlinear relationships, deep neural networks (DNN) are used as surrogate models [
18,
19,
20,
21] for the bearing capacity of brackets. A DNN consists of one or more fully connected layers, each containing multiple neurons. Each neuron multiplies the output of the previous layer with a weight matrix and adds a bias vector, which is then transformed by a nonlinear activation function [
22,
23,
24,
25]. The parameters of each layer of the DNN model are shown in
Table 4.
4.1. Sample Data
A sample data set for disc buckle steel pipe support was created by considering six variables that may affect the outcome. These variables included the layout form of the anchoring, tightness of the wedge, thickness of the standard wall, thickness of the ledger wall, thickness of the diagonal brace wall, and thickness of the hand jack and base jack walls. The steel pipe bracket was divided into five layers, and each layer was provided with anchoring parts. The samples were randomly selected according to uniform distribution considering six cases, such as intact anchoring and missing anchoring in a certain layer. Similarly, wedge tightness was divided into 10 working conditions, and the samples were randomly selected according to uniform distribution. Standard wall thickness, ledger wall thickness, diagonal brace wall thickness, hand jack, and base jack wall thickness were sampled according to normal distribution using a PC loop through the ANSYS APDL command. A total of 3000 arrays of input parameters were generated, and the corresponding eigenvalue buckling values were labeled. The randomly selected sample datasets were divided into training and test sets in the ratio of 7:3, which were used for training and testing the DNN agent model, respectively.
4.2. Model Training and Testing
The loss function of the DNN surrogate model is “mse”, and its expression is shown in Equation (2). The optimizer uses “Adam”. The learning rate was 0.001. The nonlinear function is a Relu function. We wrote DNN models in python and used the built-in functions of the “keras” library to build a DNN surrogate model. The results of the training set and test set loss function are shown in
Figure 7. In
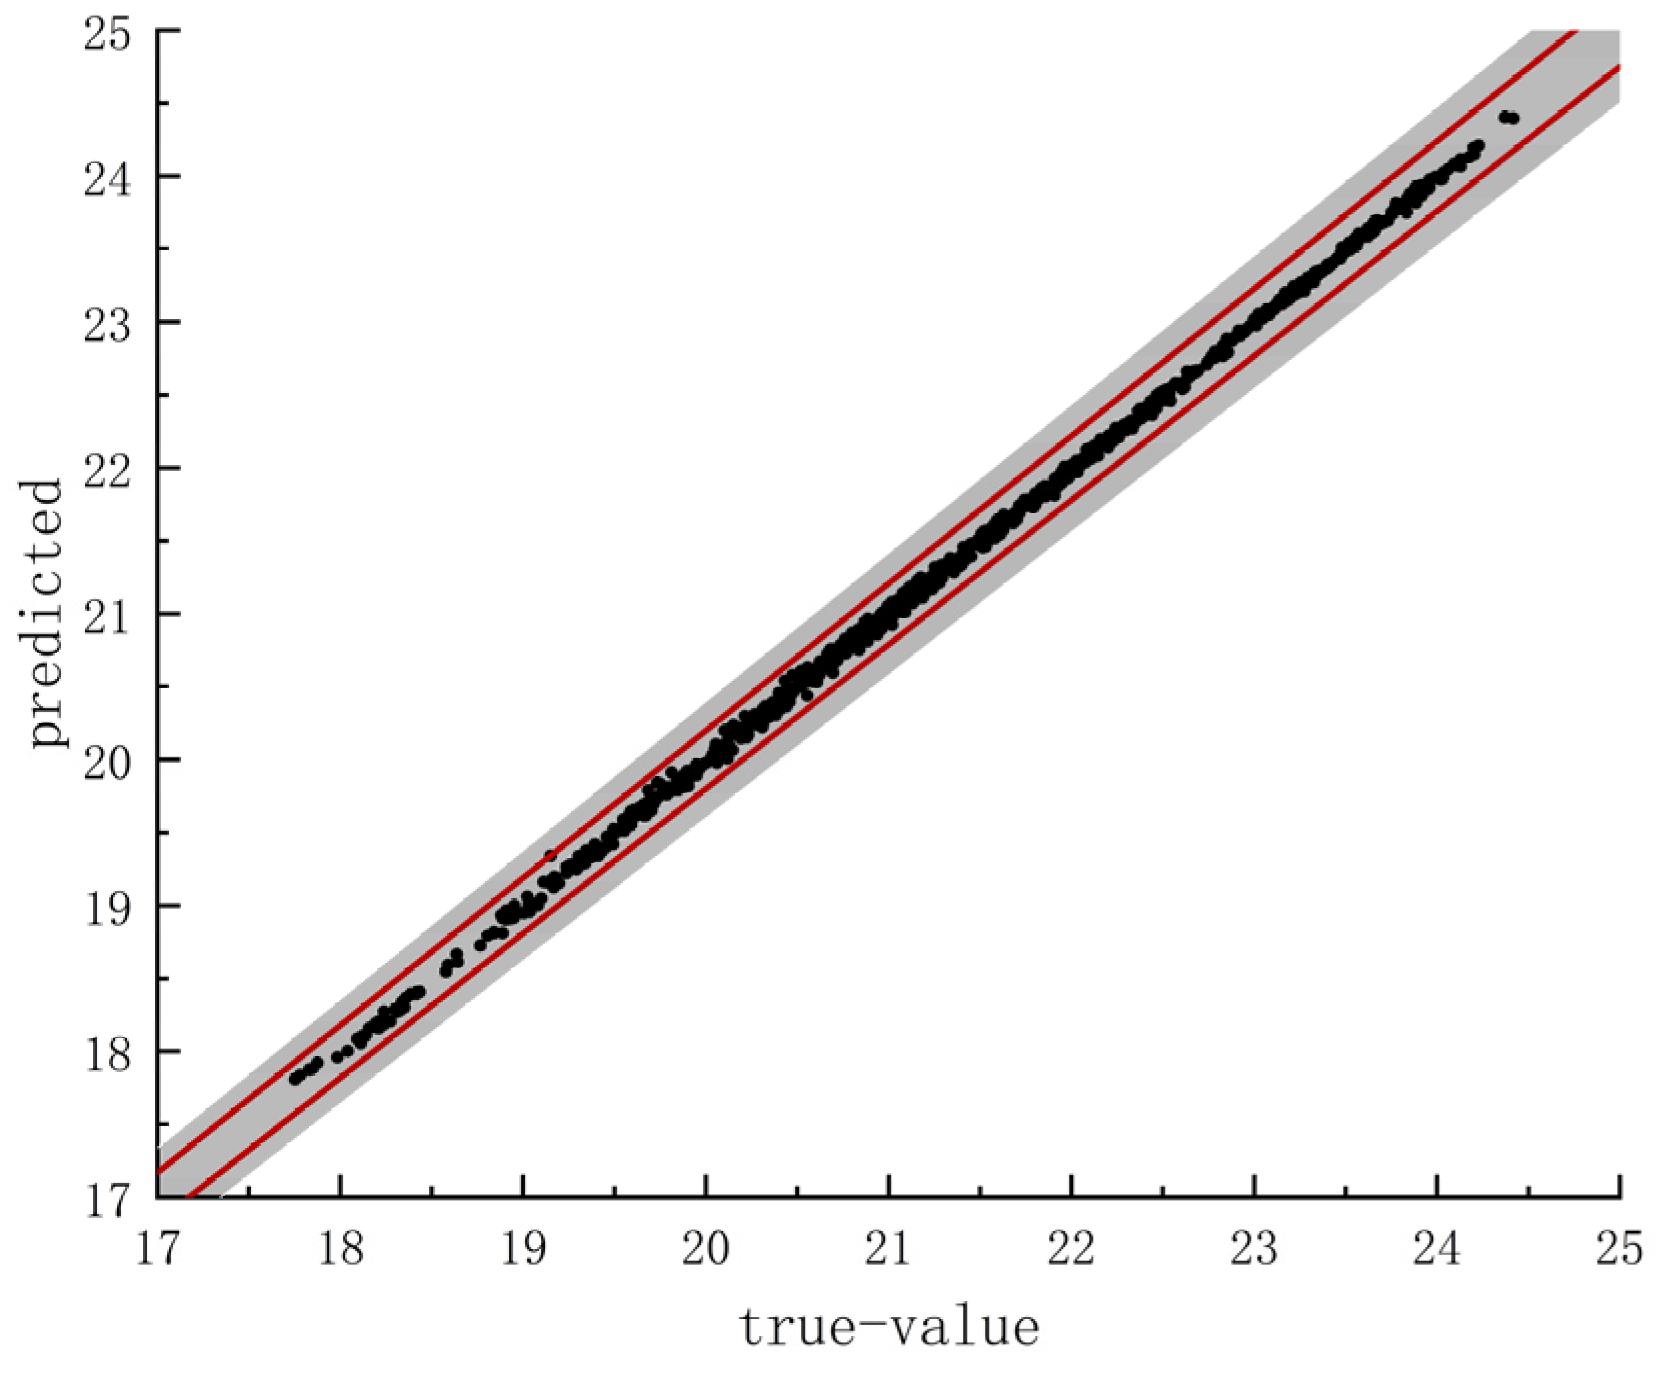
Figure 7, the blue line is the training set loss curve, and the red line is the validation set loss curve. The results of the loss function of the training set and the verification set become smaller rapidly, and the results of the loss function stabilize after 100 iterations. The model with 500 iterations is used for prediction. The comparison between the prediction results of the DNN surrogate model and the calculated values of the support buckling characteristics is shown in
Figure 8. The gray band is the 2% relative error band, and the red line is the 1% relative error line in
Figure 8. Most of the prediction results of the DNN surrogate model are within a 1% error band, and the rest of the data points are also distributed within a 2% error band.
where
is the number of training samples,
is the true value,
is the predicted value.
The DNN surrogate model not only has good prediction accuracy but also reflects obvious advantages in computational efficiency. Take the calculation time of 1000 sets of sample data as an example. The finite element calculation took about 12 h, while the DNN surrogate model using the brace buckling eigenvalue was calculated in less than 10 s. Therefore, the DNN surrogate model can balance the calculation accuracy and efficiency. Also, the DNN surrogate model and Monte Carlo method can effectively analyze the degree of uncertainty in the stability of the stent.
4.3. Model Prediction
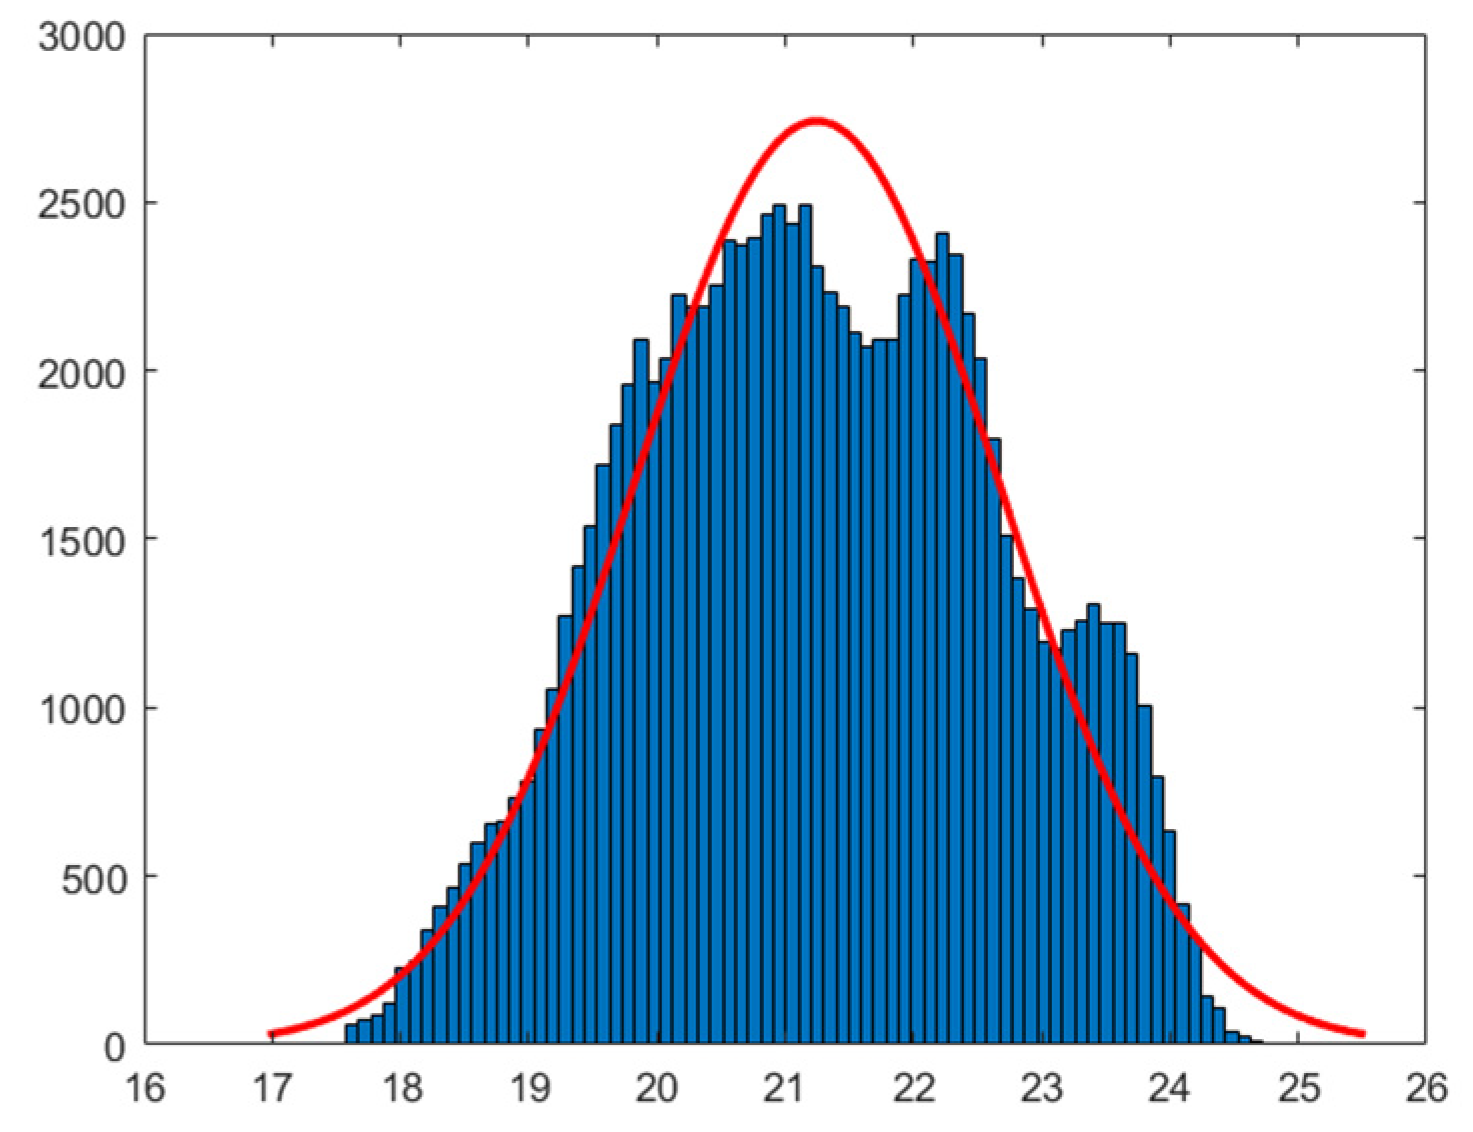
Randomly generated input samples of 100,000 sets of uncertainty factors were computed using the trained DNN buckling characteristic value surrogate model. The distribution of prediction results of scaffold buckling eigenvalues is shown in
Figure 9. Under the influence of six uncertain factors, the brace buckling characteristic value will vary between 17 and 25, with a mean of 21.245 and a standard deviation of 1.9832. When the prediction results are fitted with a normal distribution, the mean and standard deviation are 21.2453 and 1.4262 (shown by the red line in
Figure 9). The graphic results show that even under the influence of uncertain factors, the buckling characteristic value of the disc buckle steel pipe support system is still significantly greater than the stability requirements of the temporary rod support system in the project (the buckling characteristic value is greater than 4 [
17]), which meets the safety requirements.
5. Significance Analysis of Random Variables Based on SHAP Method
To further analyze the effect of different values of uncertainty factors on the buckling characteristic value of the backet, this paper calculates the SHAP contribution degree of the characteristics of the sample set based on the SHAP framework. SHAP is a method used to interpret the output of a machine learning model by assigning a SHAP value to each feature that represents the feature’s contribution to the model’s output.
The SHAP method, proposed by Lundberg and Lee in 2017 [
26], can be used to interpret the output of various network models (including classification and regression models), especially some black box network models that are difficult to understand. SHAP is a framework of additive feature interpretation methods that attributes the output of model results to the Shapley value of each feature. The output of the model result is:
where
represents the
sample as
.
is the
feature of sample
.
represents its predicted value.
is the baseline of the entire model (usually equal to the mean of the target variable of all samples).
is the Shapley value of the
feature. That is, if
is greater than 0, it means that the
feature has a positive enhancement effect on the model output result. Otherwise, it means that the feature has a negative impact on the model output result, that is, it will reduce the predicted value.
The core of the SHAP method is to calculate the Shapley value of each feature. The Shapley value of each feature is calculated as follows:
where
is a subset of features in the model.
is the number of features. |
is the weight of subset
.
is the marginal contribution of feature
. Equation (4) shows that the Shapley value of each feature is the mean of the sum of the marginal contributions of the feature.
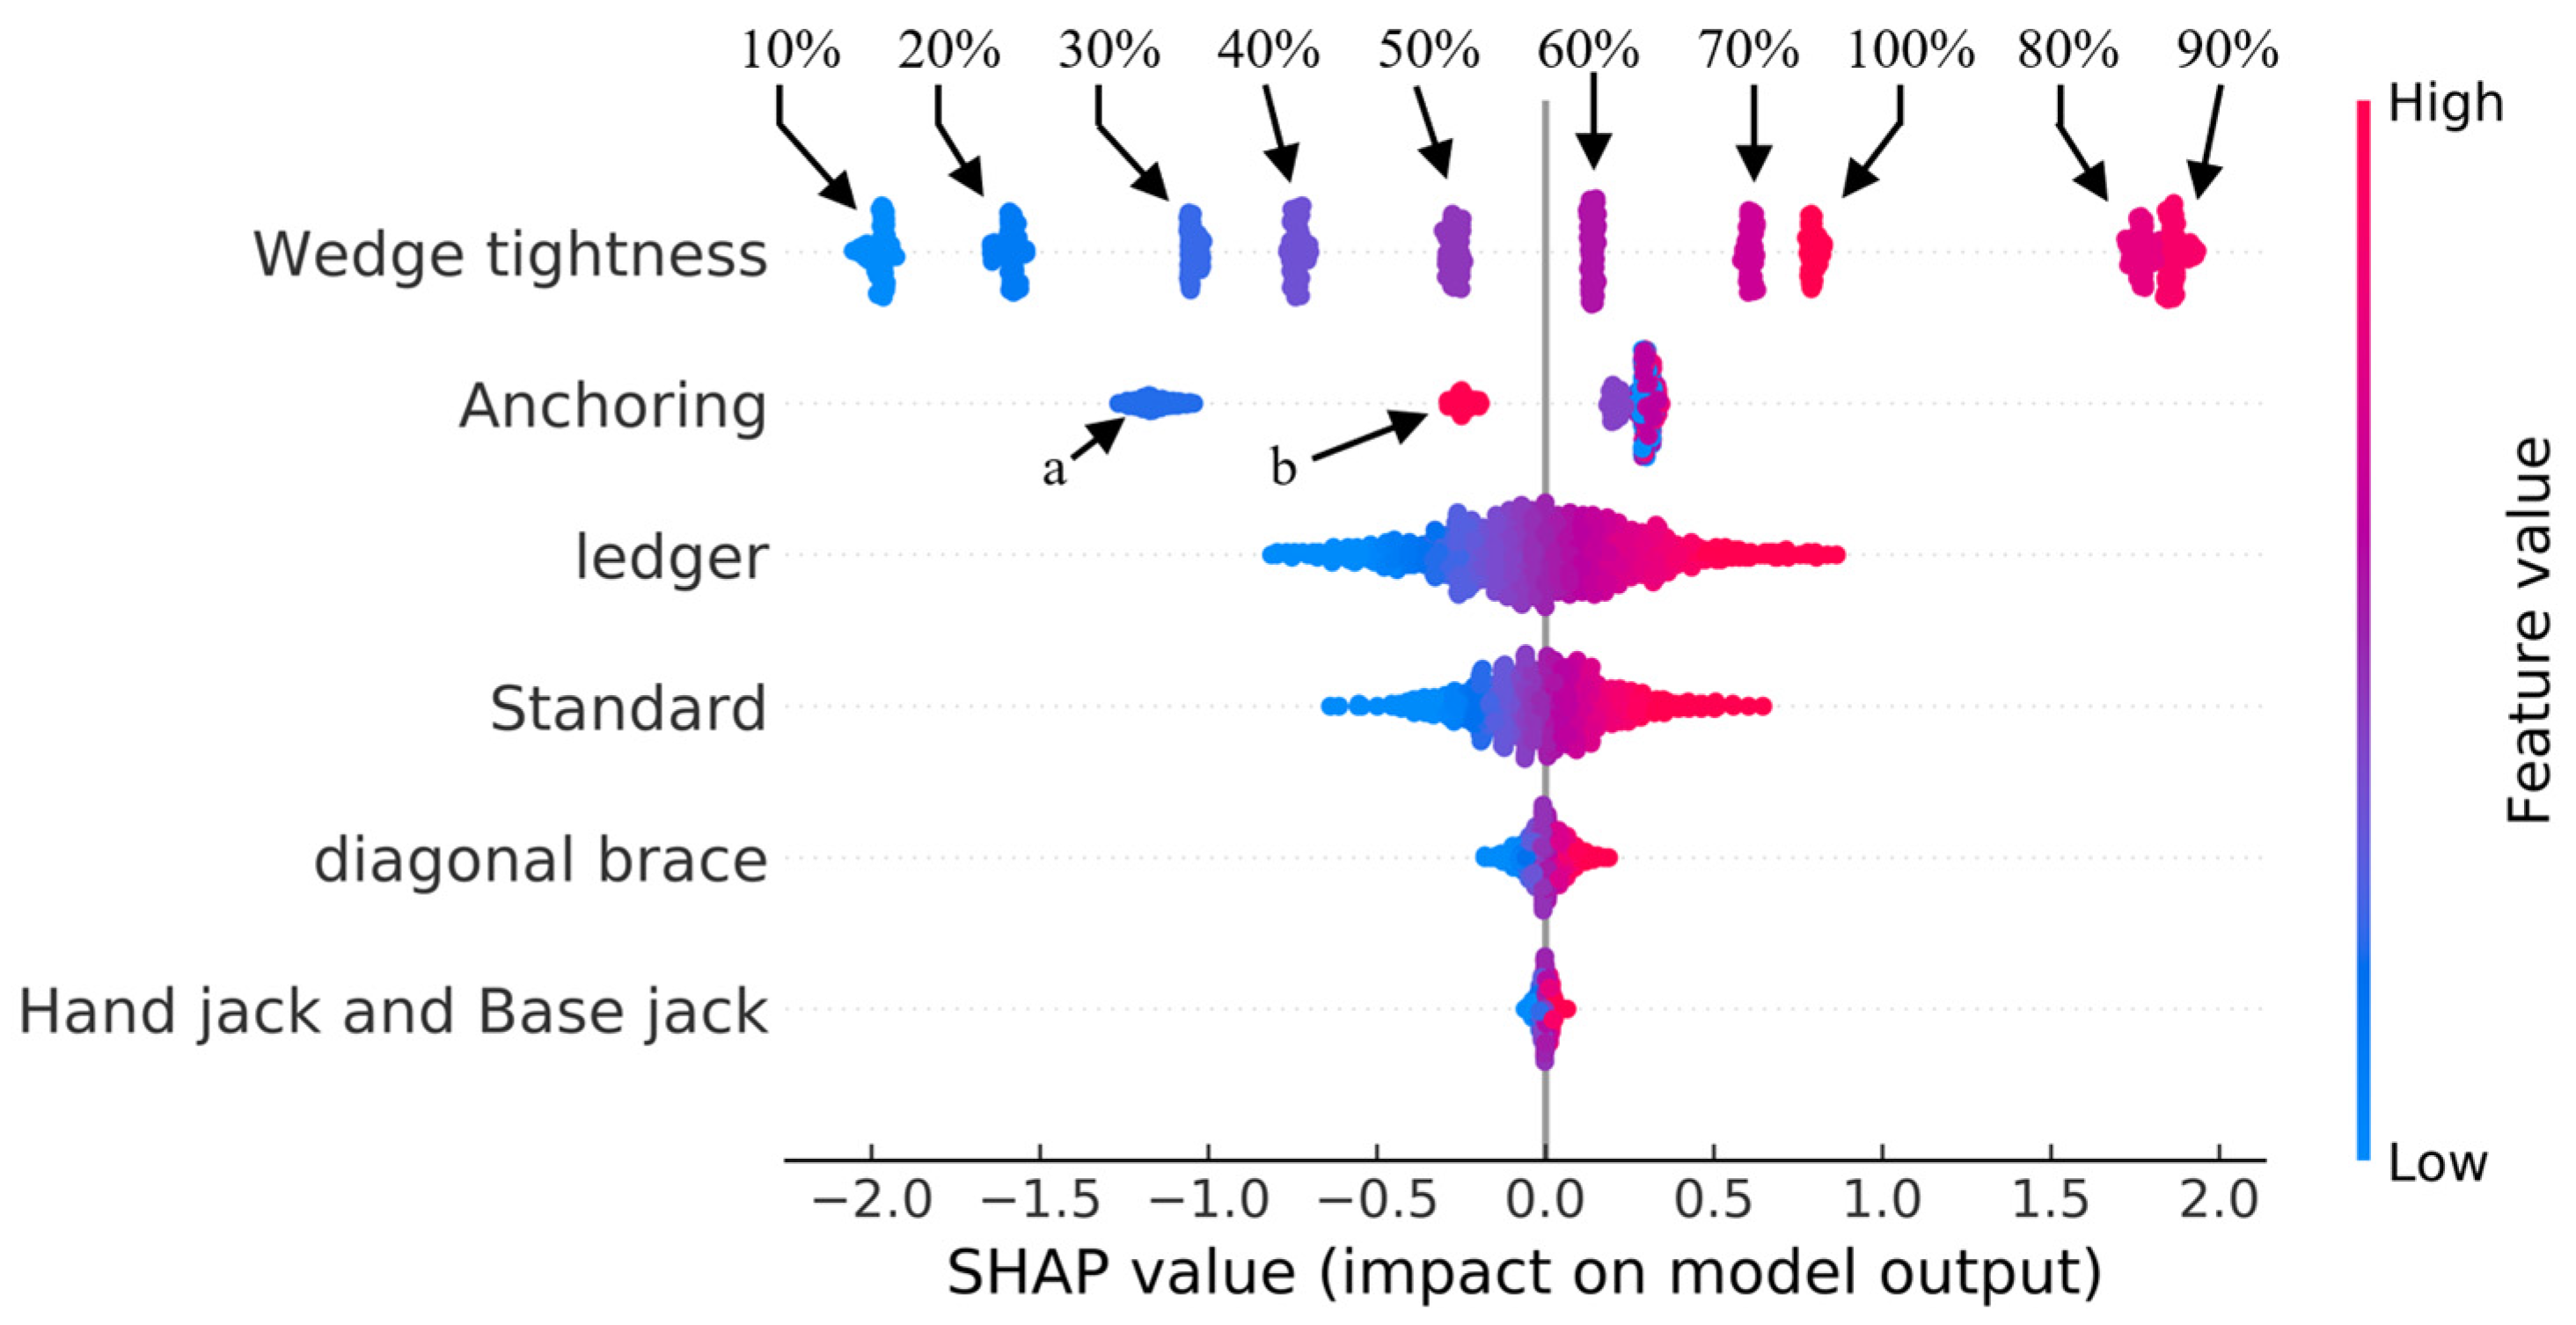
The SHAP feature importance graph shows the influence of the input data on the output data. The greater the influence, the more important the feature. Otherwise, the feature is not important. This article uses SHAP to interpret the entire dataset globally, and the results are shown in
Figure 10.
Based on the data presented in
Figure 10, it is evident that the tightness of the wedge has the greatest impact on the buckling characteristic value of the bracket. The anchoring layout and the thickness of the standard and ledger walls also have some influence on the buckling characteristic value of the bracket. However, the wall thickness of the diagonal brace, hand jack, and base jack appear to have little effect on the buckling characteristic value of the bracket.
The general summary map of SHAP describes the importance of features and the feature effects. Each point shown in the figure represents the SHAP value of the sample point corresponding to all features, and the color of the points from red to blue indicates the value of the feature from high to low. The
x-axis in the figure represents the SHAP value. When the SHAP value of the feature is greater than 0, it indicates that it has a positive impact on the output of the model; when the SHAP value of the feature is less than 0, it indicates that it harms the output of the model. The
y-axis represents features (uncertainty factors) and where the features are ranked on the
y-axis is according to their importance. Select 1000 groups of data and the relationship between their SHAP values and various features are shown in
Figure 11.
The importance ranking of the features in
Figure 11 is consistent with that of the features in
Figure 10.
Figure 11 illustrates the relationship between the SHAP value distribution form of each feature and the value distribution of each feature itself. It shows that the SHAP value of the feature ‘Wedge tightness” is concentrated at 10, and according to the color bar on the right of the figure, the value of the feature “Wedge tightness” is equal at each concentration. The distribution law of SHAP values corresponds to the 10 kinds of wedge tightness. The wedge tightness corresponding to the maximum SHAP value is not the maximum. According to
Table 1, there is a positive correlation between the angular stiffness of the “Wedge Tightness” feature and its corresponding SHAP value. A higher SHAP value corresponds to a higher joint stiffness and a greater likelihood of bracket buckling. When the wedge tightness is at 50% or below, the SHAP value is negative. This means that the bracket’s contribution to the buckling characteristic value is lower than the average of the total contribution. On the other hand, if the wedge tightness is greater than 50%, then the opposite is true.
There are six different values for anchoring, but the SHAP value of the feature “Anchoring” is not scattered in six places. Instead, it is only clustered in three places. By examining the value of the specific sample, we can see that the SHAP point set on the leftmost part of the anchoring corresponds to the missing anchoring on the first floor (5.93 m), and the second SHAP point set on the left corresponds to the missing anchoring on the fifth floor (27.93 m). The SHAP values of these two-point sets are lower than the average contribution of the total anchoring, which means that the absence of the first or fifth anchoring significantly reduces the stability of the bracket. It appears that the SHAP values for the absent anchoring at other positions are comparable, suggesting that the missing wall parts at those positions have little impact on the bracket’s buckling characteristic value. This is similar to the performance under normal working conditions without any missing wall parts. As can be seen from the buckling mode of the bracket shown in
Figure 6, the first layer wall connection is in the buckling position, and the fifth layer wall connection is at the bottom of the “free end” of the bracket. The buckling characteristic value of the support is most sensitive to the missing of these two walls connecting parts. Therefore, in the construction process, construction supervisors should focus on checking the wall connecting parts in the buckling position of the support.
Take the influence factors and support bearing capacity data of two working conditions in the data set as examples and visualize the local interpretation of the data under the SHAP method, as shown in
Figure 12.
Figure 12 describes the influence of each feature on the model’s forecasted output from the base value
to the model’s final output (
) on a single sample. The value of each feature is the “force” that increases or decreases the prediction. In the figure, the red part indicates that the contribution of features has a positive impact on the output of the model, and the blue part indicates that the contribution of features has a negative impact on the output of the model. The base value represents the mean value of all samples on the model, and
represents the predicted output value of the model for the samples to be interpreted.
The corresponding working condition in
Figure 12a is “the fifth layer (27.93 m) anchoring missing, 100% wedge tightness, standard wall thickness of 2.84 mm, ledger wall thickness of 2.42 mm, diagonal brace wall thickness of 2.53 mm”. The influence of wall thickness on the hand jack and base jack is small and not listed in the figure. According to
Figure 11, joint wedge tightness (100%), standard wall thickness (2.84 mm), and diagonal brace wall thickness (2.53 mm) all have a positive influence on the increase in the SHAP value, that is, it is conducive to improving the stability of the bracket. The fifth layer (27.93 m) is missing the anchoring, and the wall thickness of the ledger (2.42 mm) is less than the average. The corresponding change in the SHAP value also shows that the value of the ledger wall thickness harms the bearing capacity of the support. Finally, the predicted buckling characteristic value of this working condition is 21.90, which is greater than the average output value of 21.393.
The corresponding working condition in
Figure 12b is “the second layer (11.43 m) anchoring missing, 20% wedge tightness, standard wall thickness 2.90 mm, ledger wall thickness 2.51 mm, diagonal brace wall thickness 2.60 mm”. The influence of wall thickness on the hand jack and base jack is small and not listed in the figure. Combined with
Figure 11, the large negative SHAP value corresponding to wedge tightness (20%) is the main reason for the decrease in the buckling characteristic value of the bracket. Larger standard wall thickness (2.90 mm), ledger wall thickness (2.51 mm), diagonal brace wall thickness (2.51 mm), and the second layer (11.43 m) wall parts are missing, then the average value corresponds to a positive SHAP value, which is conducive to the improvement of the stability of the bracket. Finally, the predicted buckling characteristic value is 20.52, which is less than the average output value of 21.393.


