Article

Research on Temperature Field of Cement-Mixing Pile-Reinforced Soft Soil Foundation

1
Key Laboratory of Health Intelligent Perception and Ecological Restoration of River and Lake, Ministry of Education, Hubei University of Technology, Wuhan 430068, China
2
School of Civil Engineering, Architecture and Environment, Hubei University of Technology, Wuhan 430068, China
3
Geological Environmental Center of Hubei Province, Wuhan 430068, China
*
Authors to whom correspondence should be addressed.
Buildings 2024, 14(3), 845; https://doi.org/10.3390/buildings14030845
Submission received: 29 February 2024 / Revised: 15 March 2024 / Accepted: 20 March 2024 / Published: 21 March 2024
(This article belongs to the Section Building Materials, and Repair & Renovation)

Abstract

:
To investigate the mechanism of reinforcing soft soil with cement-mixing pile, based on ABAQUS secondary development, a numerical simulation study of the hydration reaction of cement-mixing piles was conducted. In this study, the influence of ground temperature variations on the distribution patterns of the temperature field in and around the pile was also considered. The temperature field of the pile–soil model can be primarily divided into two stages: the temperature rise stage (0~5 d) and the temperature decrease stage (5~90 d). The following observations were made: (1) The temperature of the pile body rapidly increased within the first 5 days, dissipating heat to the surrounding soil, leading to an elevation of the temperature in the soil around the pile and a decrease in soil moisture content. Around the 5th day, the temperature reached its maximum value, and the heat release rate of the pile body was higher than that of the surrounding soil. (2) With a 15% cement admixture, under the influence of 425# cement hydration, the temperature inside the pile increased by 5 °C, and the temperature in the soil around the pile increased by 4.2 °C. After considering the ground temperature, the temperature in the soil around the pile increased by 4.6 °C. (3) The maximum temperature generated during the hydration of 425# Portland cement is higher than that of 525#; the temperature of the soil around piles made with 425# cement is consistently higher than that made with 525#. (4) The hydration temperature of piles with a 10% cement admixture increased by 4.4 °C; for piles with a 15% cement admixture, the hydration temperature increased by 6.6 °C; and for piles with a 20% cement admixture, the hydration temperature increased by 9.1 °C. The temperature field of this structure gradually stabilizes after 7 days with increasing time and cement admixture. The results indicate that the hydration of cement-mixing piles raises the temperature of the soil around the piles. Additionally, the temperature resulting from the hydration of cement-mixing pile increases with the addition of cement.

1. Introduction

Cement-mixing piles mainly involve the mixing and forced stirring of cement or stabilizers such as lime with soft soil. This process encourages physical and chemical reactions between the soil particles and stabilizers, resulting in a uniform, dense, and appropriately hardened cement-stabilized soil mass [1,2]. Reinforcing silty soil with cement-mixing piles is a ground treatment method that has been widely studied and applied both domestically and internationally. It has proven to be effective due to its advantages such as easy construction, minimal environmental pollution, flexible arrangement, and cost-effectiveness [3].
The reinforcement mechanism of cement-mixing piles mainly involves four aspects: the hydrolysis and hydration of cement, ion exchange, hardening effect, and carbonation. These factors collectively contribute to the solidification of soft soil, thereby increasing the bearing capacity of the composite foundation [4,5,6]. Currently, researchers focusing on the application of the cement-mixing pile method for treating soft soil are primarily concentrated on aspects such as pile design and construction, reinforcement effectiveness testing, and the analysis of bearing capacity and settlement [4]. For example, Qian [5] conducted an in-depth exploration of curing mechanisms and mechanical properties. Zhao et al. [7] investigated the influence of cement admixture, pile spacing, and cushion layer on the foundation settlement. Xu et al. [8] studied the mechanism of the joint treatment of cement-mixing piles and preloading consolidation with plastic drainage boards through on-site testing. Yuan et al. [3], starting from a microscopic perspective, obtained the strength variation patterns of cement by conducting indoor unconfined compressive strength tests. Deng et al. [9] analyzed the load-settlement variations of a cement-mixed pile-reinforced loess subgrade under different durations and intensities of rainfall, as well as a varying elastic modulus of the piles. Guo et al. [10] primarily analyzed the mechanism of the composite foundation of cement-mixing piles from two aspects: the strength of the pile body itself and the interaction between piles. Li [11] and Wang et al. [12] conducted an analysis based on the inherent characteristics of cement-mixing soil and parameter optimization. Through the reinforcement mechanism, Wang et al. [13] explained that cement-mixing piles have advantages such as low cost, short construction period, and good waterproofing performance. Yuan [14] introduced the treatment effects of using cement-mixing piles from the perspectives of construction method, cost, and bearing capacity. Phutthananon et al. [15] conducted an analysis of ground settlement reinforcement through innovative improvement methods. By evaluating the possibility of using existing numerical models of mortar and concrete machinery on wood-based cementitious composites, Ndong Engone et al. [16] identified the parameters that have to be adjusted in the models. In foreign countries, some new technologies have emerged, such as adding modifiers to enhance solidification effects and utilizing detection systems for construction monitoring [17,18,19,20].
The above studies seldom take into account the influence of temperature. In the realm of temperature field studies, scholars currently delve into the analysis of the impact of temperature on the process of concrete construction by investigating concrete hydration heat [21,22]. Additionally, they explore its effects on the heat transfer characteristics of energy piles and similar topics [23,24]. Therefore, from the perspective of understanding the mechanism of cement–soil mixing piles for reinforcing soft soil, it is crucial to investigate the variations in the temperature field of pile–soil interactions. Cement, as a stabilizer, undergoes rapid hydrolysis and hydration reactions with the water in the soft soil when mixed. This process occurs on the surface of cement particles, releasing a significant amount of heat energy. The elevated temperatures of both the piles and the surrounding soil result in the generation of substantial hydration heat during the pouring period. Based on the basic theory of heat of hydration, this study establishes a finite element model with ABAQUS2020 and sets relevant conditions to analyze the effect of the heat of hydration in the process of reinforcing foundation with a hydraulic soil mixing pile as well as the effect on the surrounding soil by considering the different types of cement, ground temperature, air temperature, and different cement mixing amounts.

2. The fundamental Theory of Hydration Heat Analysis

2.1. Hydration Heat of Cement

As a stabilizer, the hydration heat of cement is mainly related to the characteristics of the cement itself [20]. Typically, many researchers use empirical formulas for the heat source function in hydration heat calculations [25]. There is less research based on hydration kinetics models. The expressions for hydration heat mainly fall into the following three types:
Q ( t ) = Q 0 ( 1 e m t )
Q ( t ) = Q 0 t n + t
Q ( t ) = Q 0 ( 1 e at b )
Q0 is the final hydration heat at time t→∞. In Equation (1), m is a constant depending on the type of cement, the temperature of the mold, etc. In Equation (2), n is a constant. In Equation (3), a, b are parameters.
In actual engineering practice, the exothermic process of hydration is usually evaluated through adiabatic temperature rise tests. When no available data are present, the adiabatic temperature rising equation for concrete can be selected as a composite index expression, which is highly consistent with the test results [26]. This expression is widely used in studying the heat of hydration, and numerous related studies indicate that using this hydration heat release curve is more consistent with the real temperature field. According to the cement variety and concrete strength grade, different coefficients are provided in the literature. The most commonly used cement in this field of study is ordinary Portland cement 425# and 525#. Here, Q0 is the final cement hydration heat release of 330 kJ/kg (425#) and 350 kJ/kg (525#), and t is the time (in days). In the given information, for the value 425#, the coefficients are (a = 0.69) and (b = 0.56), while for 525#, the coefficients are (a = 0.36) and (b = 0.74).

2.2. Heat Conduction Equation

According to the theory of heat conduction, the three-dimensional transient temperature field T(x, y, z, t) of cement–soil mixing piles needs to satisfy the following partial differential equation [27]:
T t = α ( 2 T x 2 + 2 T y 2 + 2 T z 2 ) + Q c ρ
In the equation, α is the thermal conductivity of the pile, Q represents the heat released from cement hydration, t is the time, c is the specific heat capacity of the pile, and ρ is the density of the pile.

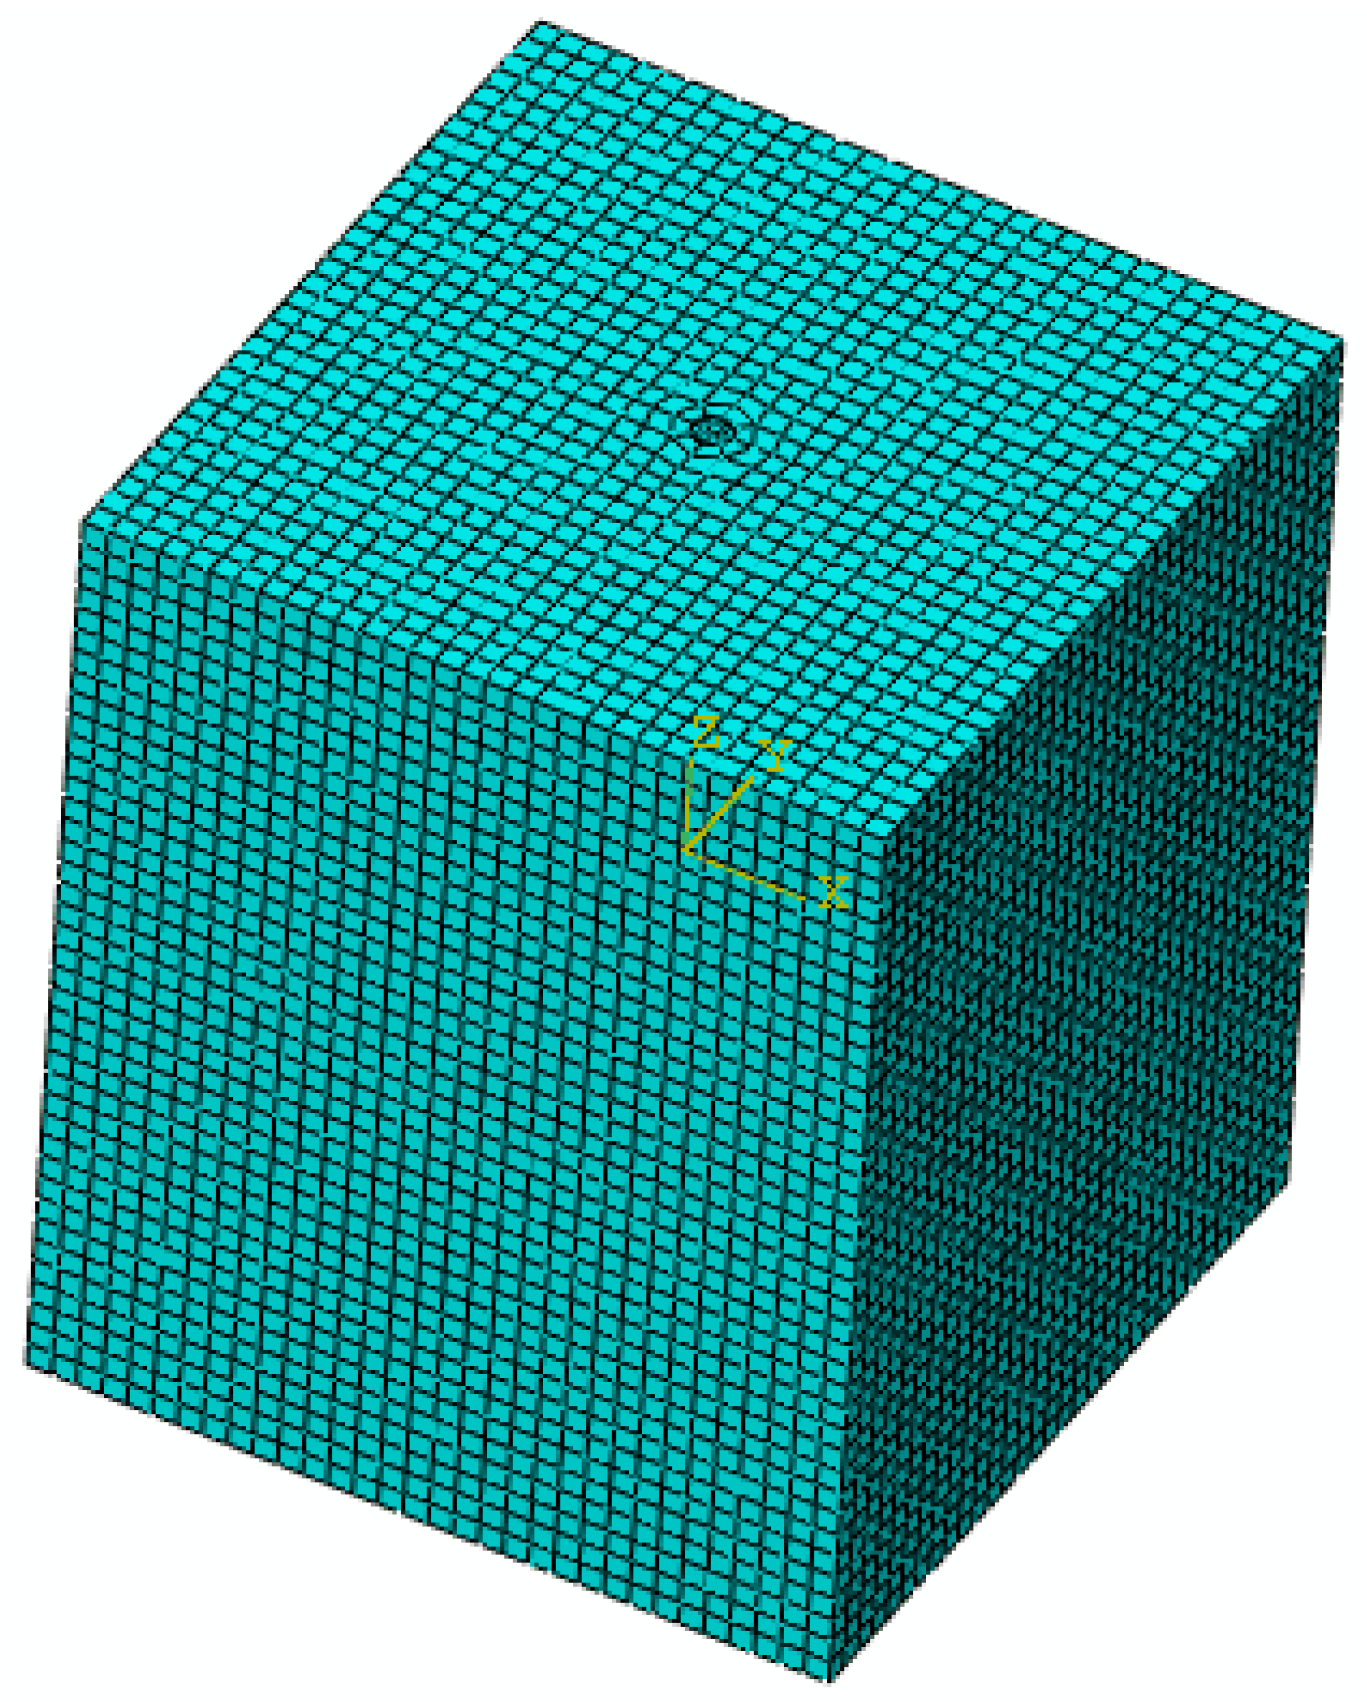
3. Model Establishment

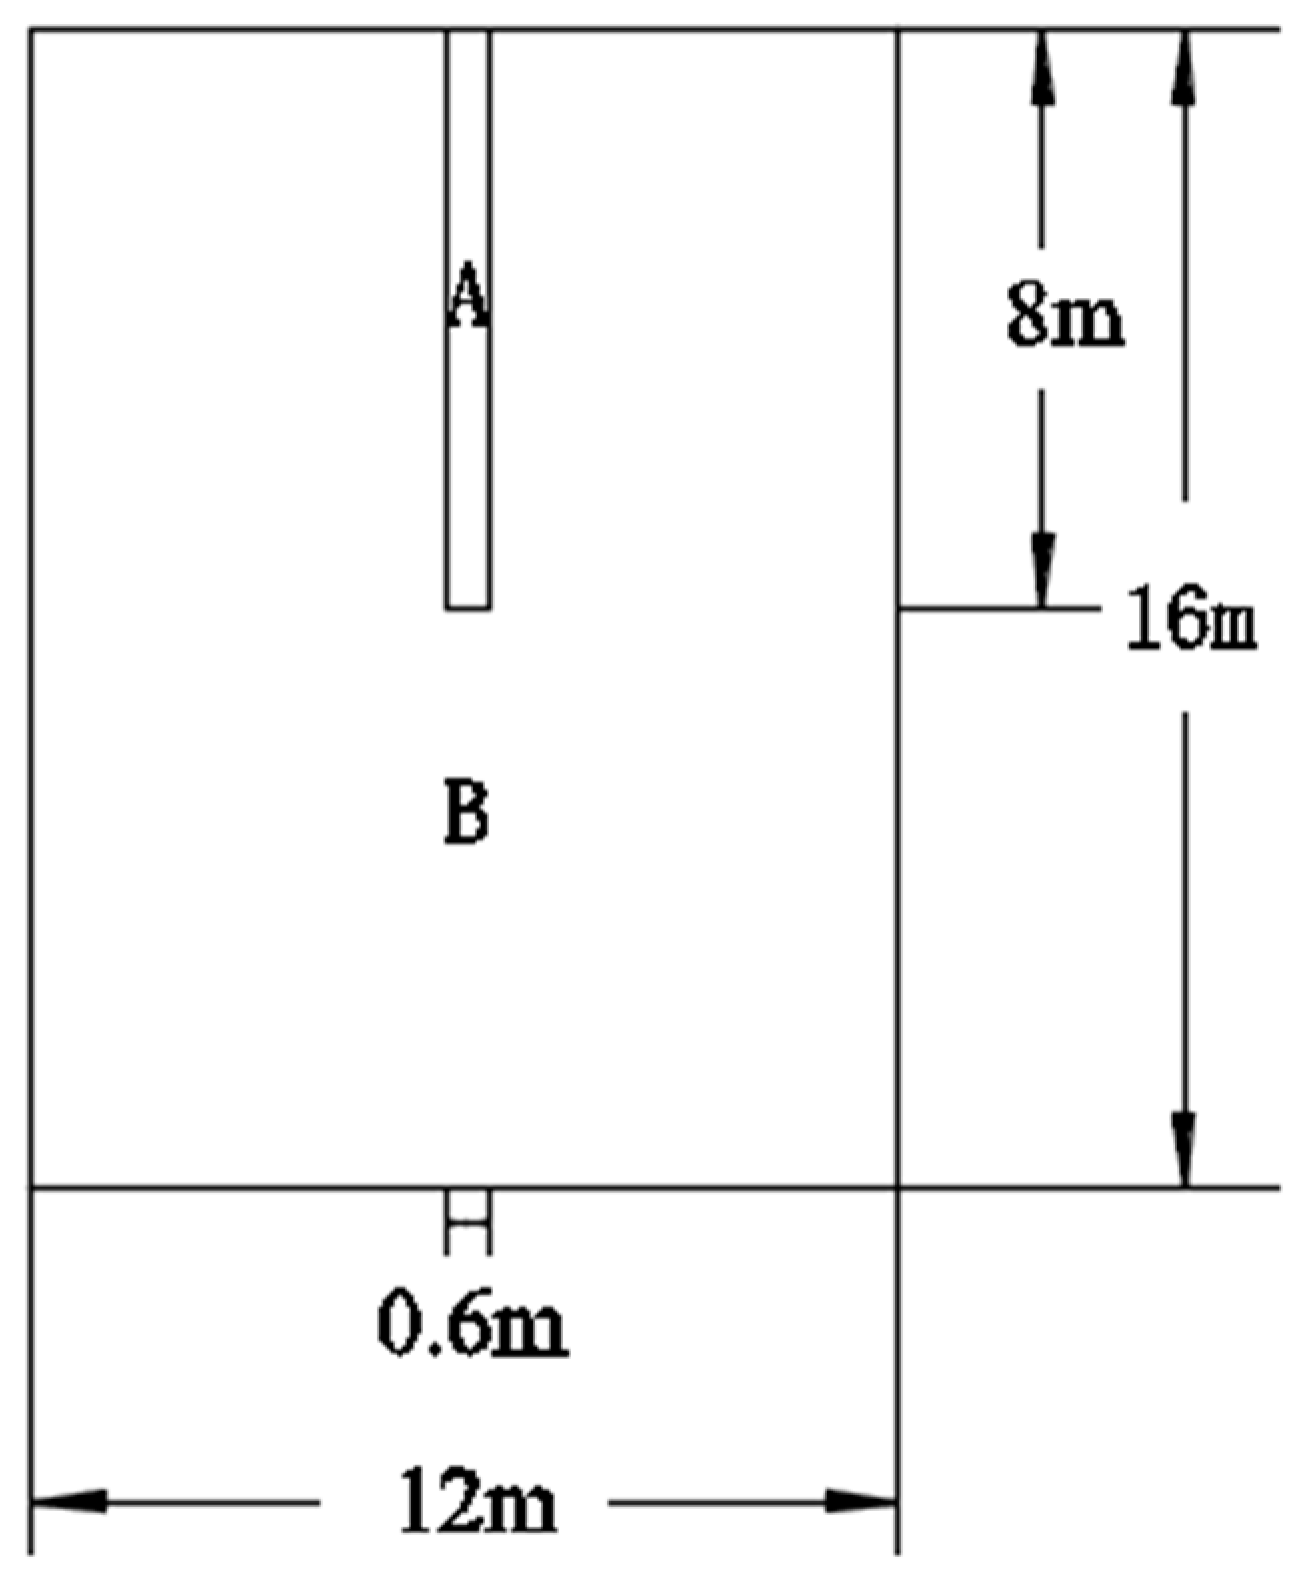
3.1. Geometric Model and Material Parameters

Using ABAQUS to establish the finite element model of a single cement–soil mixing pile and the pile foundation system, a geometric model of the pile–soil is shown in Figure 1. The soil is set as an ideal elastic–plastic material, following the Mohr–Coulomb strength criterion, and a four-node linear heat transfer tetrahedron (DC3D4) is used to mesh the model. The cement–soil mixing pile has a diameter of 0.6 m and a length of 8 m, with the height of the soil equal to twice the length of the pile. The dimensions of the soil are a side length of 12 m and a depth of 16 m. The material parameters are listed in Table 1, where the unit weight of the soil is 1900 kg/m3.
The mesh division is shown in Figure 2. The mesh control employs sweep hexahedral elements, with a grid size of 0.4 m × 0.4 m × 0.4 m for the pile body (A) and a grid size of 0.1 m × 0.1 m × 0.1 m for the soil part (B).

3.2. Initial Conditions

To begin, the initial temperature of the material is set. The initial conditions involve the temperature distribution within the pile and the foundation soil at the moment when the calculations start. Under normal circumstances, the initial temperature field can be considered uniformly distributed. During the hydration heat calculation process, it is treated as having a constant initial temperature [27]. In this study’s calculations, the initial temperature of the pile is set to the ground surface temperature when the ground temperature is not considered, and it is set to the ground temperature when the ground temperature is considered. The initial temperature of the foundation soil is determined using a first-order linear expression, considering both the ground surface temperature and the temperature of deeper layers underground.
T ( x , y , z , t ) | t = 0 = T 0 ( x , y , z )

3.3. Boundary Conditions and Interactions

Boundary conditions can be determined using the four methods mentioned in reference [28]. In this study, the boundary conditions involve the interaction between the pile–soil surface and the surrounding medium, including the thermal conduction effects of surrounding media such as air, water, or soil. The interaction with the air belongs to the third type of boundary condition. When the temperature and heat on the contact surface are in a solid state and the contact is good, it can be considered continuous. The thermal conduction between the cement–soil mixing pile and the foundation belongs to the fourth type of boundary condition [25].
In finite element software, the heat transfer between different objects varies. There can be radiative heat exchange and heat conduction between solid objects. In this study, the contact between two solids is considered, and it is assumed to be fully conformal. It is directly defined using “tie” without the need for additional definitions, and temperature is transmitted directly through nodes.

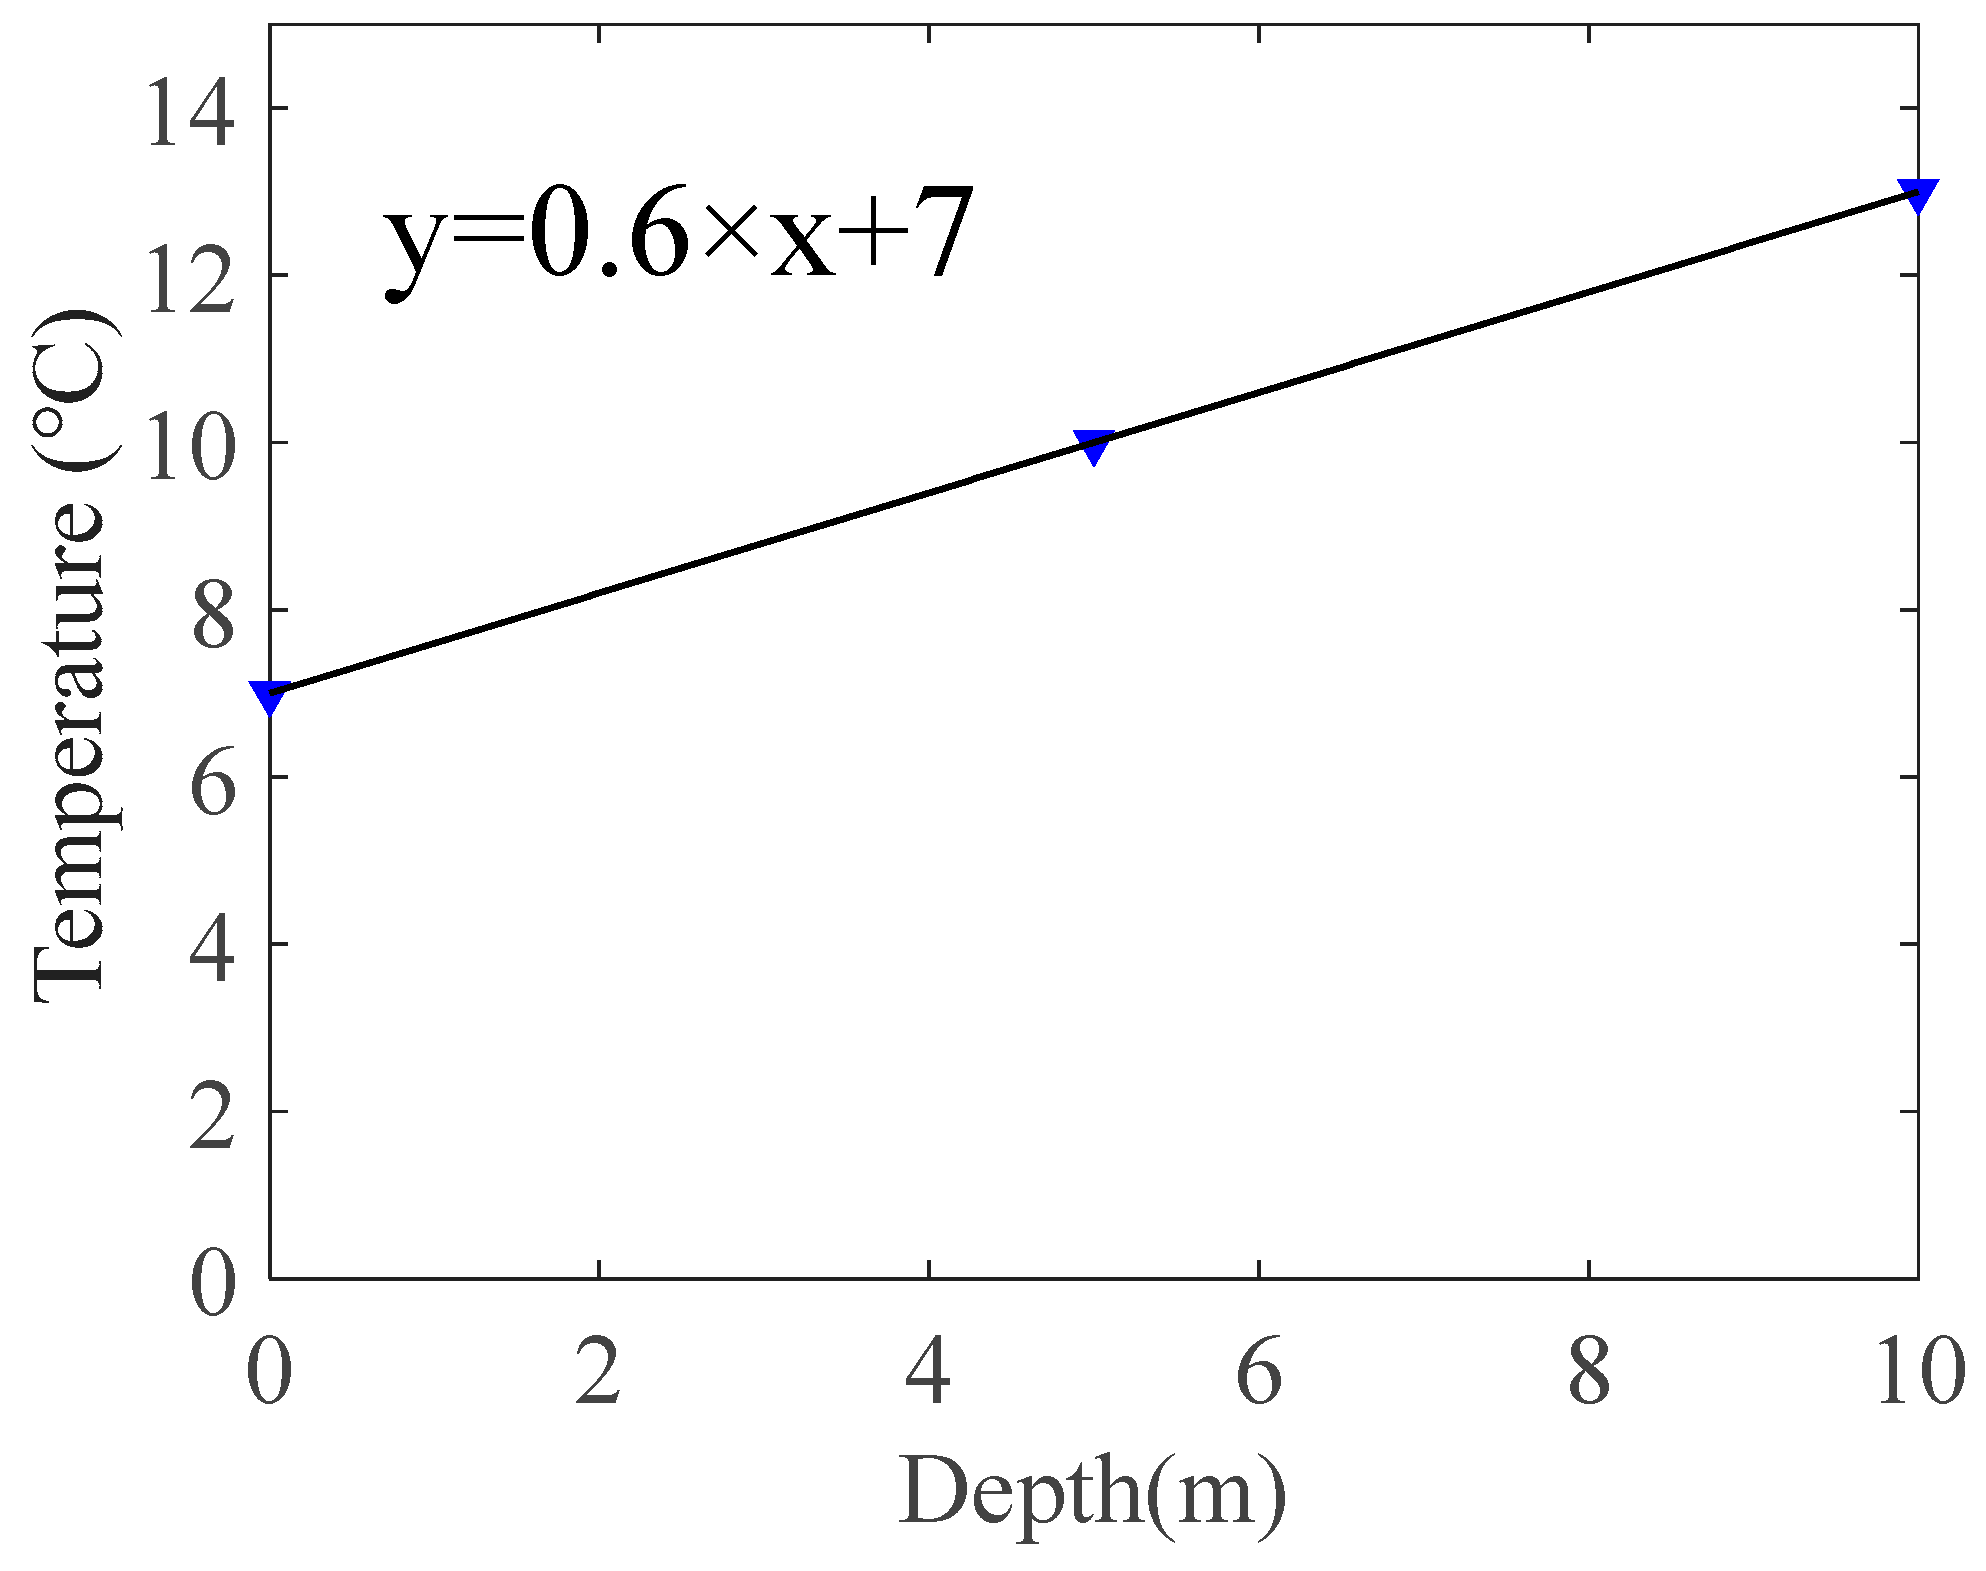
3.4. Include Ground Temperature Variations

Research has shown significant differences in ground temperature variations between shallow and deep layers. Generally, shallow ground temperature changes are more pronounced, and as depth increases, the amplitude of the temperature variation decreases. Deep ground temperatures are relatively stable, with the temperature change amplitude becoming smaller or approaching zero with increasing depth. With the increase in soil depth, the average soil temperature rises in autumn and winter, while the average temperature decreases year by year in spring and summer. The surface soil temperature undergoes large fluctuations, while the deep soil temperature experiences smaller variations. The temperature of the soil from 0 to 10 m varies dramatically, while the temperature from 10 to 25 m remains relatively stable [29].
The climate tendency rate of the soil temperature is analyzed using a simple linear equation method [30]. In winter, the average deep soil temperature increases with depth, indicating that heat is transferred from the deep layers to the shallow layers. This process represents the release of energy. The stable depth during winter is around 10 m, and the stable temperature is approximately 13.2 °C. The temperature of the soil at depths of 10 to 25 m typically fluctuates by less than 0.2 °C during spring and summer, and generally by less than 0.4 °C during autumn and winter [27]. The paper assumes that the variation in low temperatures at a depth of 0~10 m follows a linear pattern and employs a first-degree linear equation for calculation [31], while stability occurs beyond 10 m. Based on the data from winter soil temperature monitoring in a certain region, it is observed that the temperature is 7 °C at a depth of 0 m (surface) and 10 °C at a depth of 5 m. A linear relationship can be obtained, as shown in Figure 3.

3.5. Cement Blending Amount

The cement blending amount will affect the degree of hydration heat in the pile, thereby influencing the strength of the surrounding soil. With the increase in cement blending amount, a series of physical and chemical reactions between cement, water, and soil will occur with the extension of experimental time. The longer the time, the more thorough the physical and chemical reactions become [32]. This study investigates the influence of different cement blending amounts (10%, 15%, 20%) using the same type of cement (ordinary Portland cement 425#) under identical conditions. The curing periods are set at 7 days, 14 days, 28 days, and 90 days. The analysis focuses on the impact of cement blending amounts on the temperature field variations in pile–soil interactions.

4. Analysis of the Results

4.1. Calculation Results of the Hydration Heat Temperature Field

With a cement blending ratio of 15% and no thermal exchange between the surface of the pile–soil system and the surroundings, the initial temperature of both the pile and the soil surface is 7 °C. Simulating the changes in the temperature field of the structure, the results for a curing period of 90 days are shown in Figure 4. The result indicates that ordinary Portland cement 425# is in an adiabatic state throughout the entire soil mass. Heat conduction starts inside the pile–soil, and each unit of the pile starts to release heat. NT11 represents the temperature field contour map (in degrees Celsius).
Figure 5 illustrates the curves depicting the changes over time in the temperature field calculations of piles at different depths and the inter-pile soil, considering only the influence of hydration heat. The simulation results indicate that there is a varying degree of temperature increase within the structure, and the temperature rise becomes more pronounced as one gets closer to the interior of the pile. The highest temperature is located within the interior of the pile. Under the influence of hydration heat, the temperature of the pile body begins to rise, reaching its maximum value in about 3 days. The highest temperature inside the pile increased by 4.5 °C. Eventually, the structural temperature stabilizes. The heat release rate of the pile is higher than that of the surrounding soil. Through heat conduction, the temperature of the soil around the pile begins to rise. The temperature varies at different depths, with the upper soil layer being higher in temperature due to the effect of sunlight. The highest temperature reaches around 5 °C. Due to the effect of hydration heat, the temperature begins to rise and reaches its maximum value in about 5 days. Subsequently, the temperature inside the pile–soil system starts to decrease through heat conduction; the upper soil layer experiences a relatively slow decrease in temperature due to sunlight, while the temperature in the deeper layers decreases more rapidly; after around 15 days, the temperature of the upper soil layer starts to rise again, while the middle and deep layers begin to warm up after around 28 days. With the increase in curing period, the internal temperature field eventually stabilizes.
Figure 6 is a curve chart of the measured data from the hydration heat temperature field sensors [33], which remains consistent with the curves plotted in the text. Through the comparison of Figure 5 and Figure 6, the reliability of the numerical simulation method adopted in this paper is verified.

4.2. The Calculated Results of the Temperature Field during the Hydration Heat of Different Types of Cement

Figure 7 depicts a comparative curve chart of the calculated temperature field between piles at different depths over time for different types of Portland cement, namely 425# and 525#. The simulation results indicate that the internal temperature of the structure increases to varying degrees under different types of cement, ultimately reaching a stable state. During the temperature rise phase, the heat release of the 525# cement is relatively lower than that of 425#, resulting in a lower maximum internal temperature for the structure. This difference may be influenced by coefficients (a) and (b). Specifically, the temperature inside the piles with 425# cement increases to around 5 °C, while for 525# cement, it rises to approximately 3 °C. Additionally, the temperature of the surrounding soil increases to about 4.5 °C for 425# cement piles and around 3.75 °C for 525# cement piles. During the temperature reduction phase, the 525# cement reaches a similar temperature to the 425# cement at around 7 days, at which point the temperature is approximately 7 °C. Subsequently, the temperature inside the 525# cement piles decreases more slowly than that of the 425# cement piles. Consequently, at any given moment, the temperature values of the 525# cement piles remain higher than those of the 425# cement piles until around 28 days, after which they become equivalent. Following this, there is a temperature increase, and the internal temperature of the structure eventually stabilizes. The temperature of the surrounding soil for the piles with 425# cement consistently remains higher than that for the piles with 525#. Due to the influence of depth, the temperature difference between the upper portion of the piles with 525# cement and those with 425# cement is greater than that in the middle and deep sections.

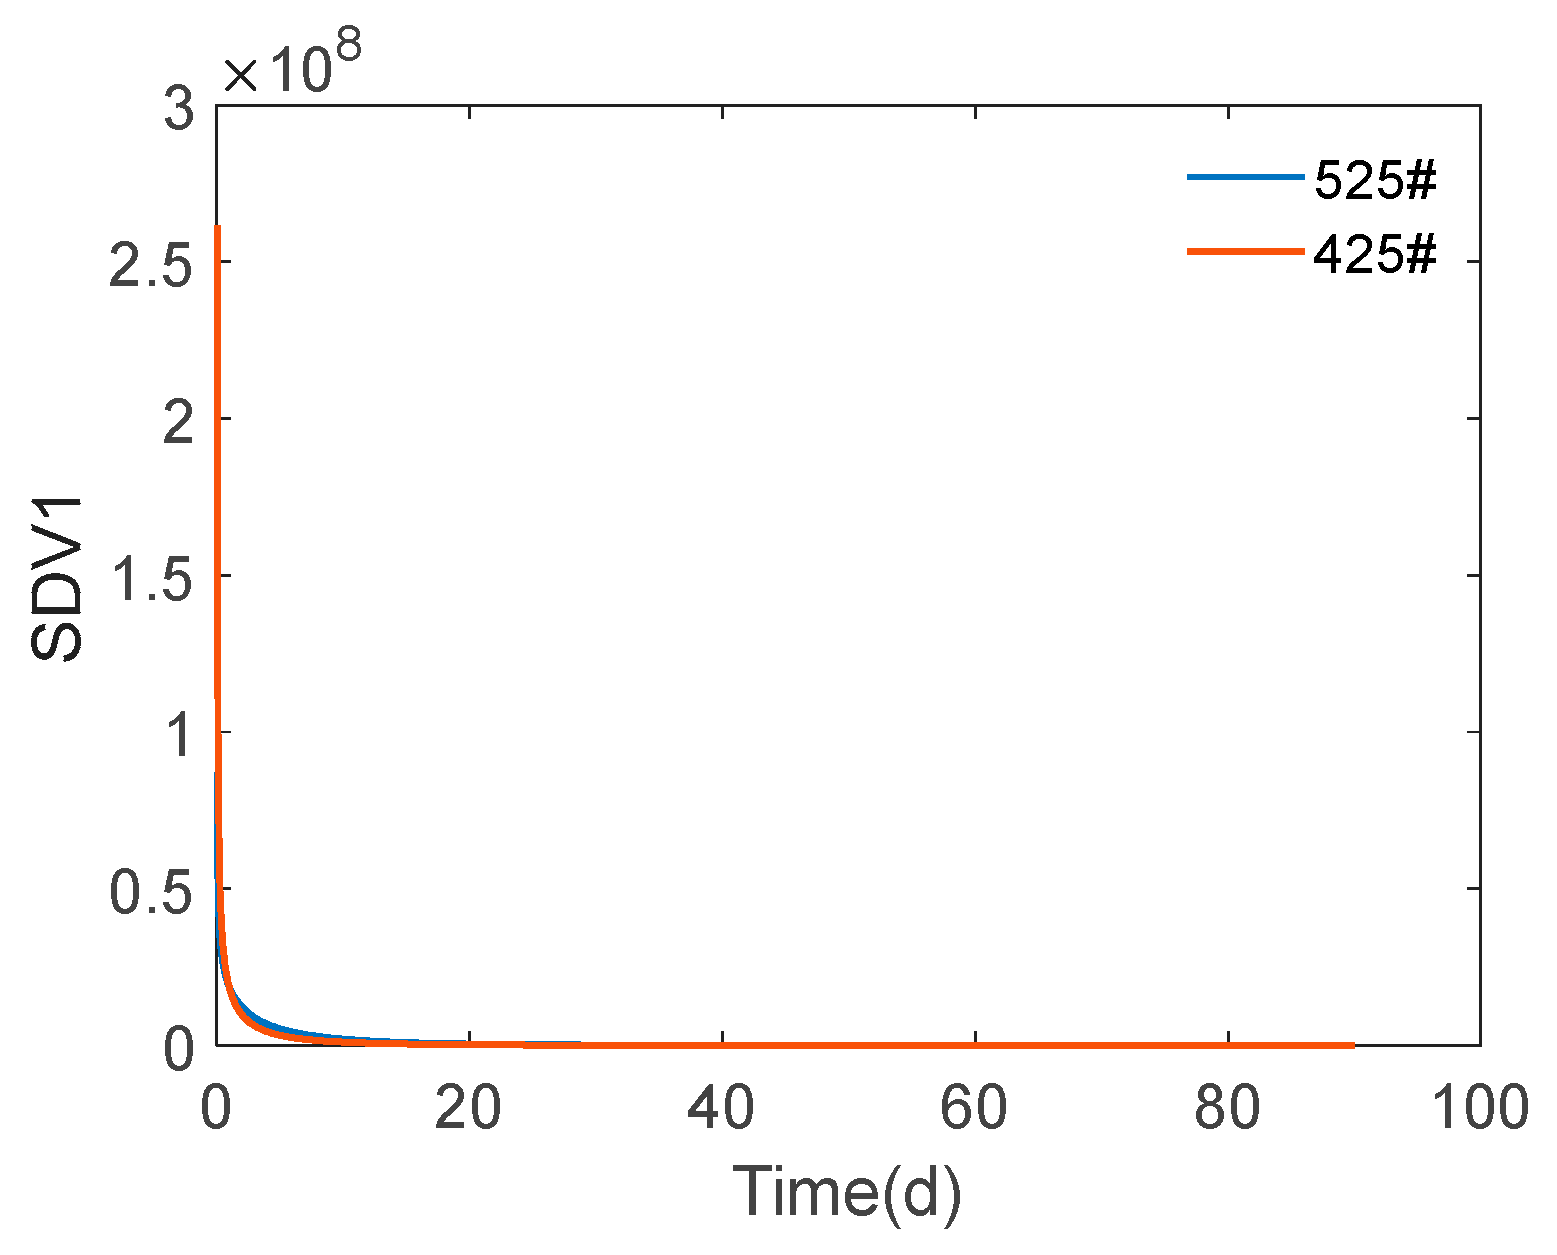
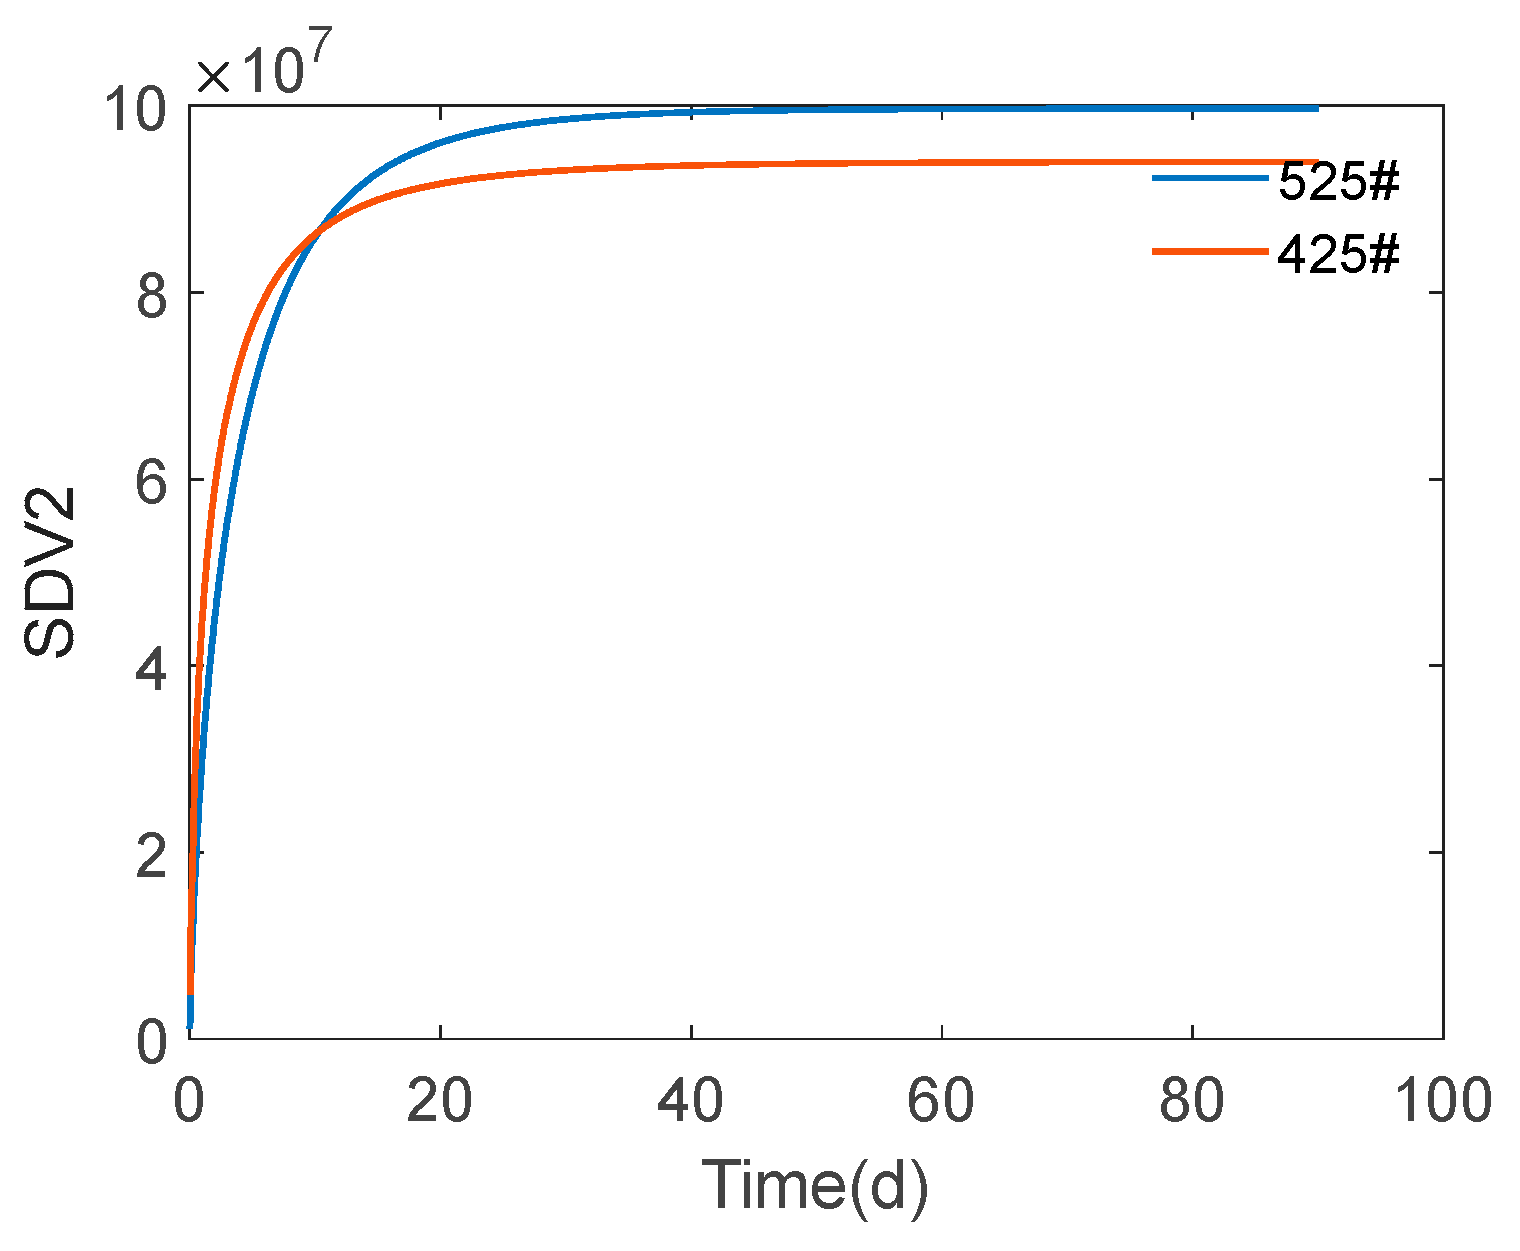
4.3. Results of Hydration Heat Release Rate and Cumulative Heat Release Calculation

The hydration heat release rate, defined as the variable SDV1, represents the heat released per unit volume over time through a subroutine. Selecting a specific unit from samples 425# and 525#, the variation pattern of SDV1 over time is shown in Figure 8. It starts off significant, gradually decreasing over time, and stabilizes around the 3rd day. This aligns with an exponential expression. Based on the center of the selected element (consistent with SDV1), the variation pattern of SDV2 (cumulative hydration heat release) over time is illustrated in Figure 9. The total heat release continues to increase, reaching stability around the 7th day. Initially, 425# is higher than 525#, but after 7 days, the trend reverses, with 525# surpassing 425#, and then ultimately stabilizing.

4.4. Results of Soil Temperature Variations

The script for applying soil temperature variations was written in the Python 3.8 language and implemented through the ABAQUS secondary development script interface [34]. The developed script is mainly used to achieve the linear variation of soil temperature as the initial temperature in the boundary conditions. Running the written Python script code directly in the ABAQUS command window automatically completes the creation process, as shown in Figure 10. After applying the soil temperature variations, there is a clear stratification observed between the pile and the surrounding soil, and the results are consistent with the expected outcomes.

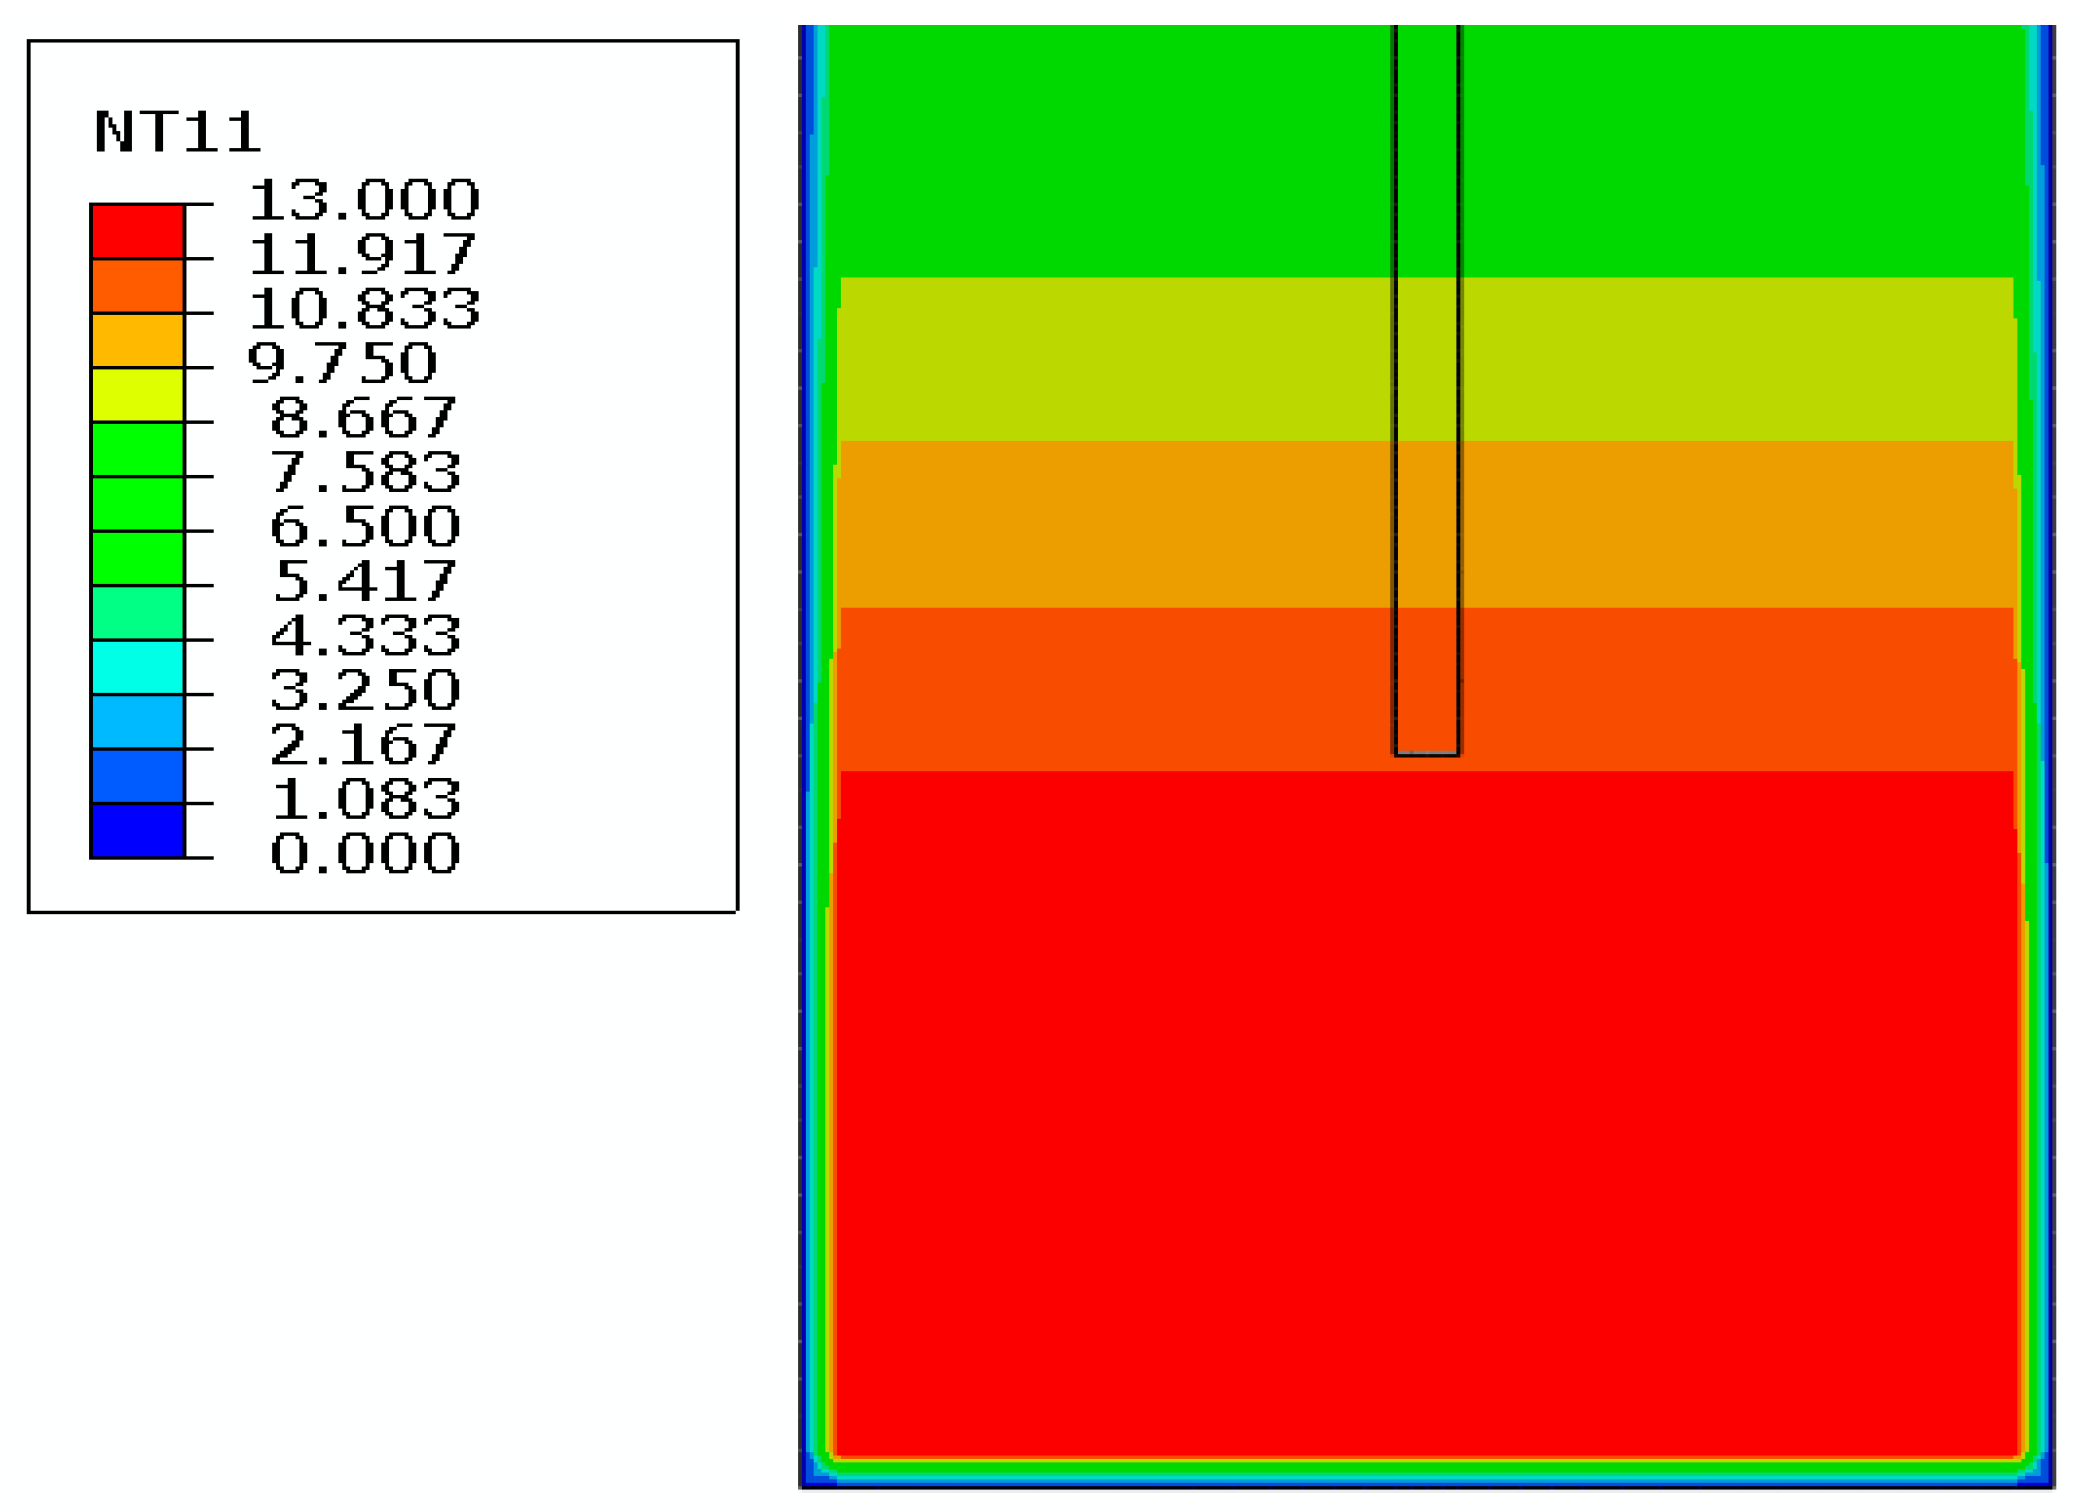
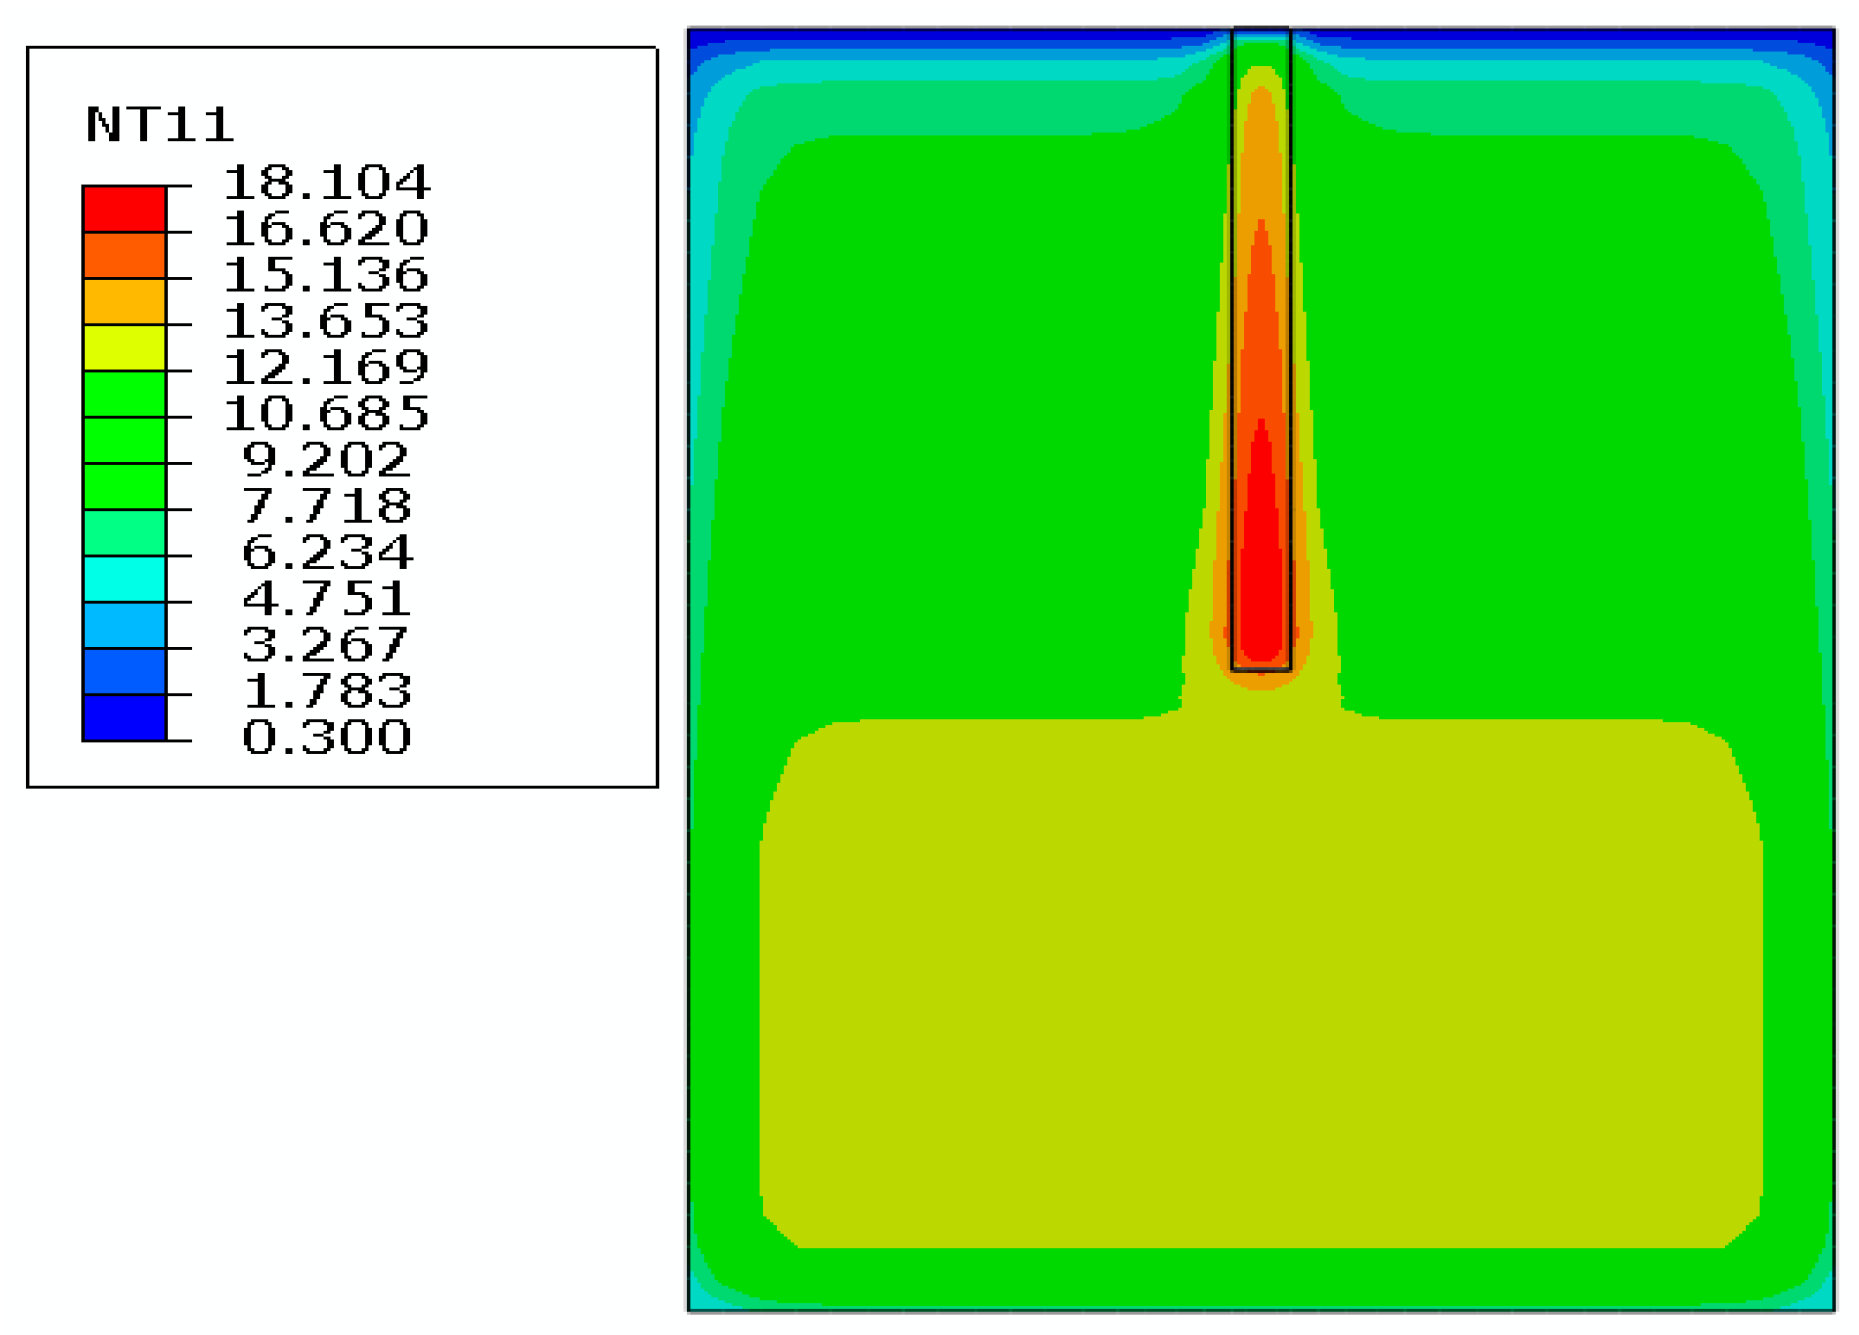
4.5. The Calculation Results at a Certain Moment after Adding the Soil Temperature

With a cement mixing ratio of 15%, the linear variation in ground temperature is added as the initial temperature within the pile, with the soil edge being thermally insulated. Using meteorological data from a certain region during the winter, which are calculated based on numerical forecasts at the central point of the area, and employing daily average temperature, the boundary conditions for the surface temperature field of the pile and soil were determined. The temperature field of the cement-mixed piles and the surrounding soil structure in a certain region during the winter were studied, with an aging period of 90 days. The results at a certain moment are shown in Figure 11.
From Figure 11, it can be seen that the internal temperature of the pile is higher due to the accumulation of heat from cement hydration reactions, causing the temperature around the pile to rise. Due to the influence of the ground temperature, the temperature begins to diffuse to the surroundings, creating a temperature gradient. The surface is in contact with the outside, where the temperature is relatively low, limiting the rate of temperature increase at the surface; hence, the surface temperature is lower.

4.6. Results of Vertical Temperature Variation

Taking nodes at different depths as an example, the temperature gradient of the soil around the pile during the 90-day hydration period is shown in the time distribution curve in Figure 12.
Analyzing Figure 12, the following conclusions can be drawn: As the rate of hydration heat release gradually decreases with time, the convective heat transfer rate increases with the temperature difference between the interior and the environment. Therefore, the core temperature of the structure shows a pattern of first rising and then falling. The temperature curve is mainly divided into two stages: temperature rise and temperature fall. The period from 0 to 5 days is the temperature rise stage, which is caused by the hydration heat of the pile and the effect of ground temperature, leading to an increase in temperature. Heat is transferred between the upper node and the external environment, with a high degree of heat dissipation, so the temperature change in the upper part is relatively gentle. The highest temperature of the upper node is 10.6 °C, the highest temperature of the middle node is 12.1 °C, and the highest temperature of the deep node is 13.6 °C. After 5 days, it enters the temperature fall stage. During this stage, the temperature gradient shows a decreasing trend. Due to the influence of solar radiation on the upper part, changes begin to occur, and the heat dissipation rate is relatively fast. Therefore, the temperature decline rate is much faster than other parts. After around 40 days, the temperature begins to rise slowly, and after around 60 days, it starts to decrease, followed by a gradual increase again. The temperature drop in the middle and deep layers is not significant due to the small influence of solar radiation. Influenced by ground temperature, the temperature in the deep part of the soil remains higher than the temperature in the upper part of the soil. The temperature around the pile rises by a maximum of 4.6 °C. With the effect of heat conduction, the temperature of the pile–soil structure basically stabilizes after 90 days. The temperature varies at different nodes.
Figure 13 represents the measured temperature data at different depths of the pile–soil system [35]. By comparing it with Figure 12, the presented pattern of pile–soil temperature variation with depth, incorporating ground temperature, aligns well with the observed data. This confirms the reliability of the numerical simulation method employed in this paper. Furthermore, through comparison with the relevant literature [36,37], the correctness of the numerical model is validated, demonstrating its ability to effectively simulate the heat transfer process between the pile and soil.

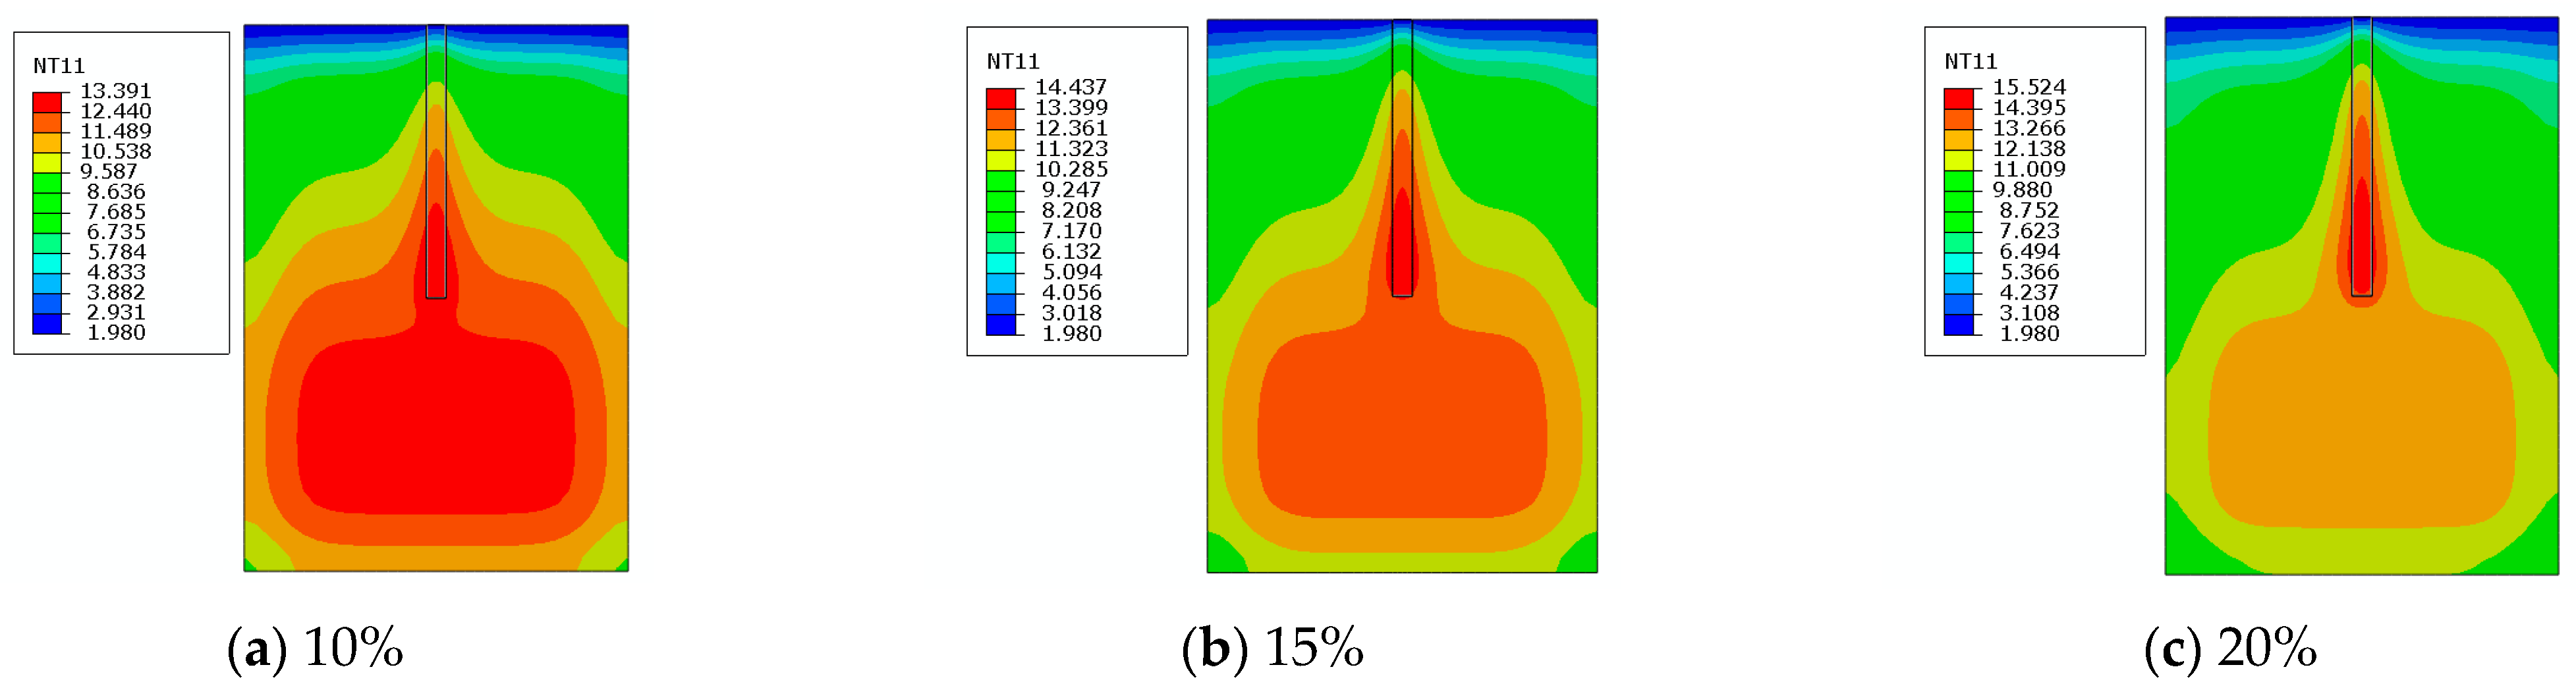
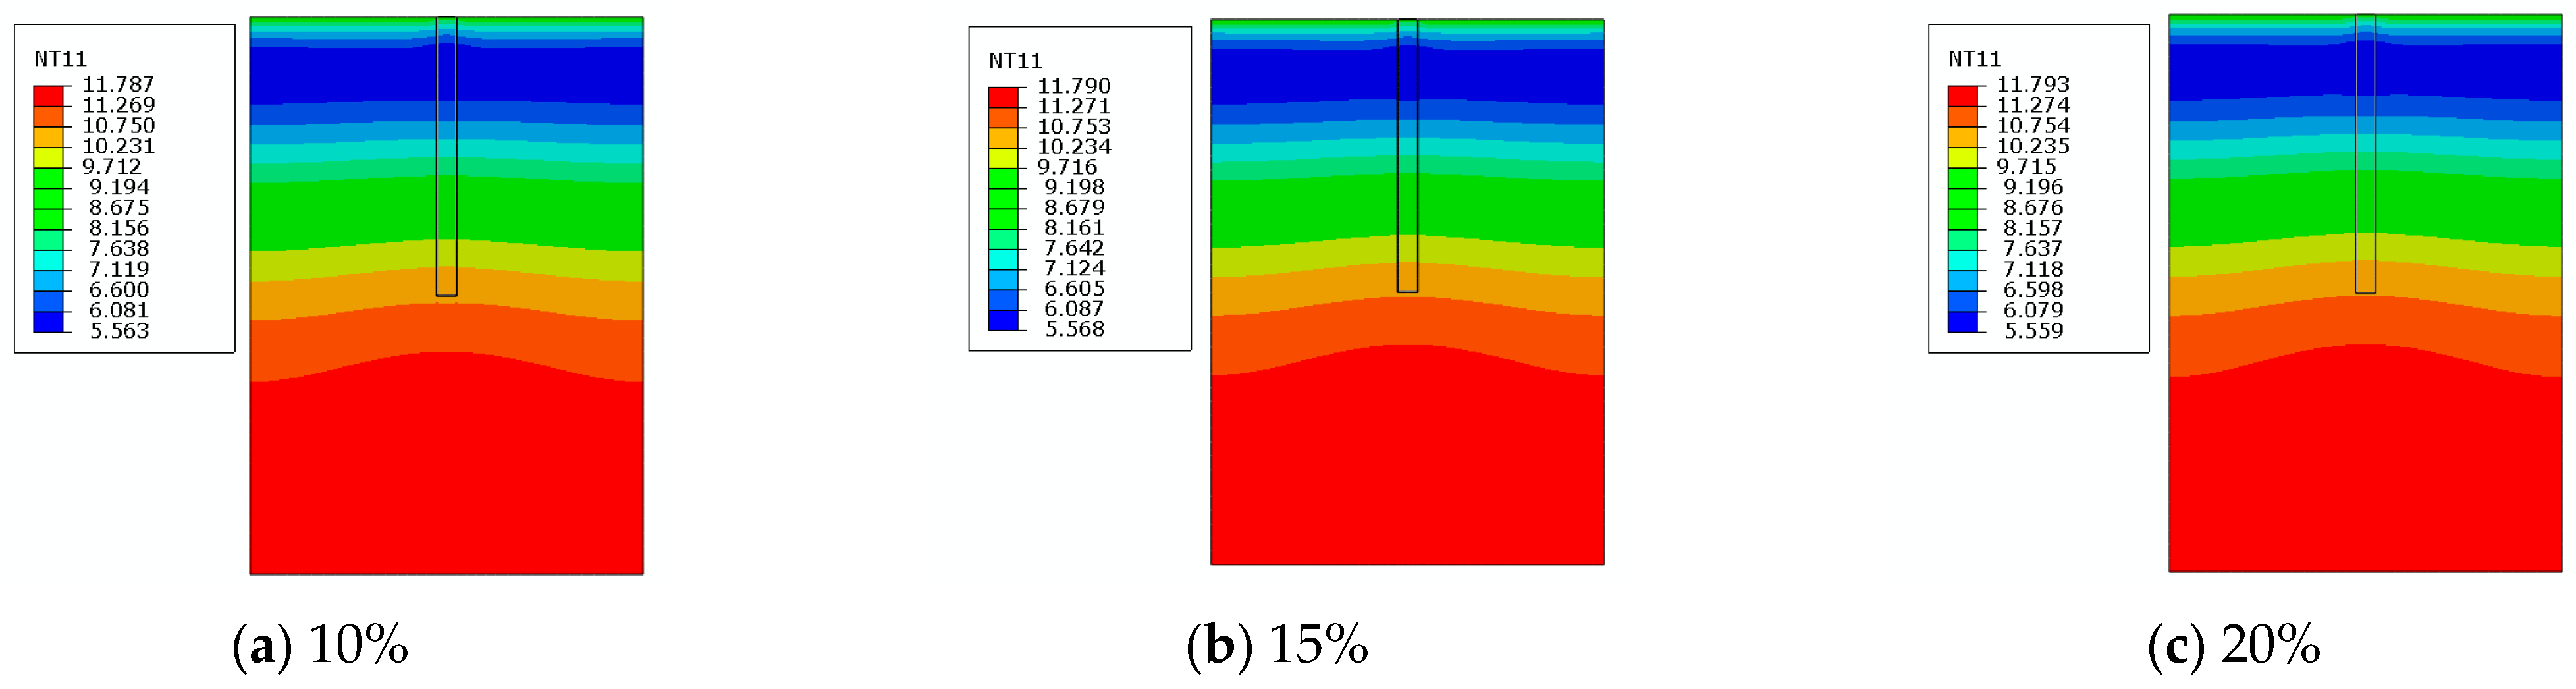
4.7. Temperature Field Changes with Different Cement Blending Amounts

The temperature curves at the same depth with different cement blending amounts are shown in Figure 14.
The results indicate that with a higher cement blending amount, the temperature increased by the hydration of the cement–soil mixing piles is higher. At the same depth, with an initial temperature of 8.4 °C, the maximum temperature increased by hydration is 12.8 °C for a 10% cement blending amount, 15 °C for a 15% cement blending amount, and 17.5 °C for a 20% cement blending amount. With the increase in cement blending amount, the maximum temperature difference is 9.1 °C. The temperature rise is significant. During the cooling process, the cement blending amount affects the cooling rate. The greater the cement blending amount, the faster the temperature decrease, reaching the same level after around 50 days.
By using cement blending amounts of 10%, 15%, and 20%, the temperature field clouds at different ages are shown in Figure 15, Figure 16, Figure 17 and Figure 18; Table 2 provides specific numerical values for the temperature field cloud changes at a certain age.
From Figure 15, Figure 16, Figure 17 and Figure 18, as well as Table 2, the following observations can be made: The temperature change region at 7 days includes the area where the cement–soil mixing pile hydration reaction occurs and the surrounding soil. With an increasing cement blending amount, the temperature field of this structure rises. The highest temperature regions vary. The highest temperature region for a 10% cement blending amount appears deep within the soil, while for 15% and 20% cement blending amounts, it appears within the pile body. When the cement blending amount increases by 5%, the maximum temperature rises by 1 °C. Under the influence of ground temperature and aging, the temperature field changes are generally small. The influence of hydration heat gradually diminishes at 14 days, leading to significant temperature gradients. The trend is most pronounced with a 20% cement blending amount, and temperature variations are also observed in the upper layers. At 28 days, the temperature gradient begins to level off. Under the influence of ground temperature and heat conduction, the temperature field changes with different cement blending amounts are generally small. At 90 days, the temperature gradient tends to stabilize, with changes primarily occurring in the upper and middle layers. With the increase in age, the internal temperature field eventually reaches a stable state. The results provide a certain reference basis for further promoting the engineering application of cement–soil mixing piles in reinforcing soft soil.
From the perspective of the temperature field, the higher the cement blending amounts, the higher the temperature of the pile and the surrounding soil. However, when considering various factors such as bearing capacity and engineering geological conditions, the final choice of cement blending amounts should be based on the specific needs of the project, cost budget, and acceptable environmental impact, in order to achieve the best balance between economy, engineering performance, and environmental sustainability.

4.8. The Practical Impact

The practical significance of this study mainly includes the following content.
Optimized Cement Composition: Selecting cement types and additives that manage hydration heat effectively could minimize the risk of excessive temperature increases, reducing potential damage to the pile and surrounding soil.
Temperature Monitoring During Construction: Implementing real-time temperature monitoring during the pouring and curing process can help identify potential issues early on. Adjustments to the construction process or materials can be made based on the monitored data to control the temperature within safe limits.
Improved Pile Design: Understanding the temperature profile and its impact on soil properties enables engineers to design pile foundations that account for changes in soil strength and behavior due to temperature variations. This could lead to more accurate predictions of bearing capacity and settlement.
Construction Timing and Techniques: Planning construction activities to avoid peak temperature periods and employing techniques that dissipate heat more efficiently can help manage the thermal impact on the soil and the structure.
Enhanced Pile–Soil Interaction Models: Incorporating temperature effects into models of pile–soil interaction allows for a more comprehensive analysis of pile performance under various environmental conditions. This can lead to designs that are both safer and more cost-effective.

5. Conclusions

This study, through the establishment of a three-dimensional finite element model, simulated the changes in the temperature field during the reinforcement of soft soil by cement–soil mixing piles for 90 days. The conclusions obtained are as follows:
(1)
Without considering the ground temperature, a 15% cement blending ratio, under the influence of 425# cement hydration, results in an internal temperature rise in the structure, reaching its peak around 5 days and eventually stabilizing with the aging process. The pile itself experiences a temperature increase of 5 °C. The temperature generated by hydration heat causes a 4.2 °C increase in the temperature of the soil around the pile. Due to the temperature at the pile–soil surface, the temperature at upper depths rises by 5 °C. The temperature of the 525# cement pile itself increased by 3 °C, while the heat generated by hydration raised the temperature of the surrounding soil by 3.75 °C.
(2)
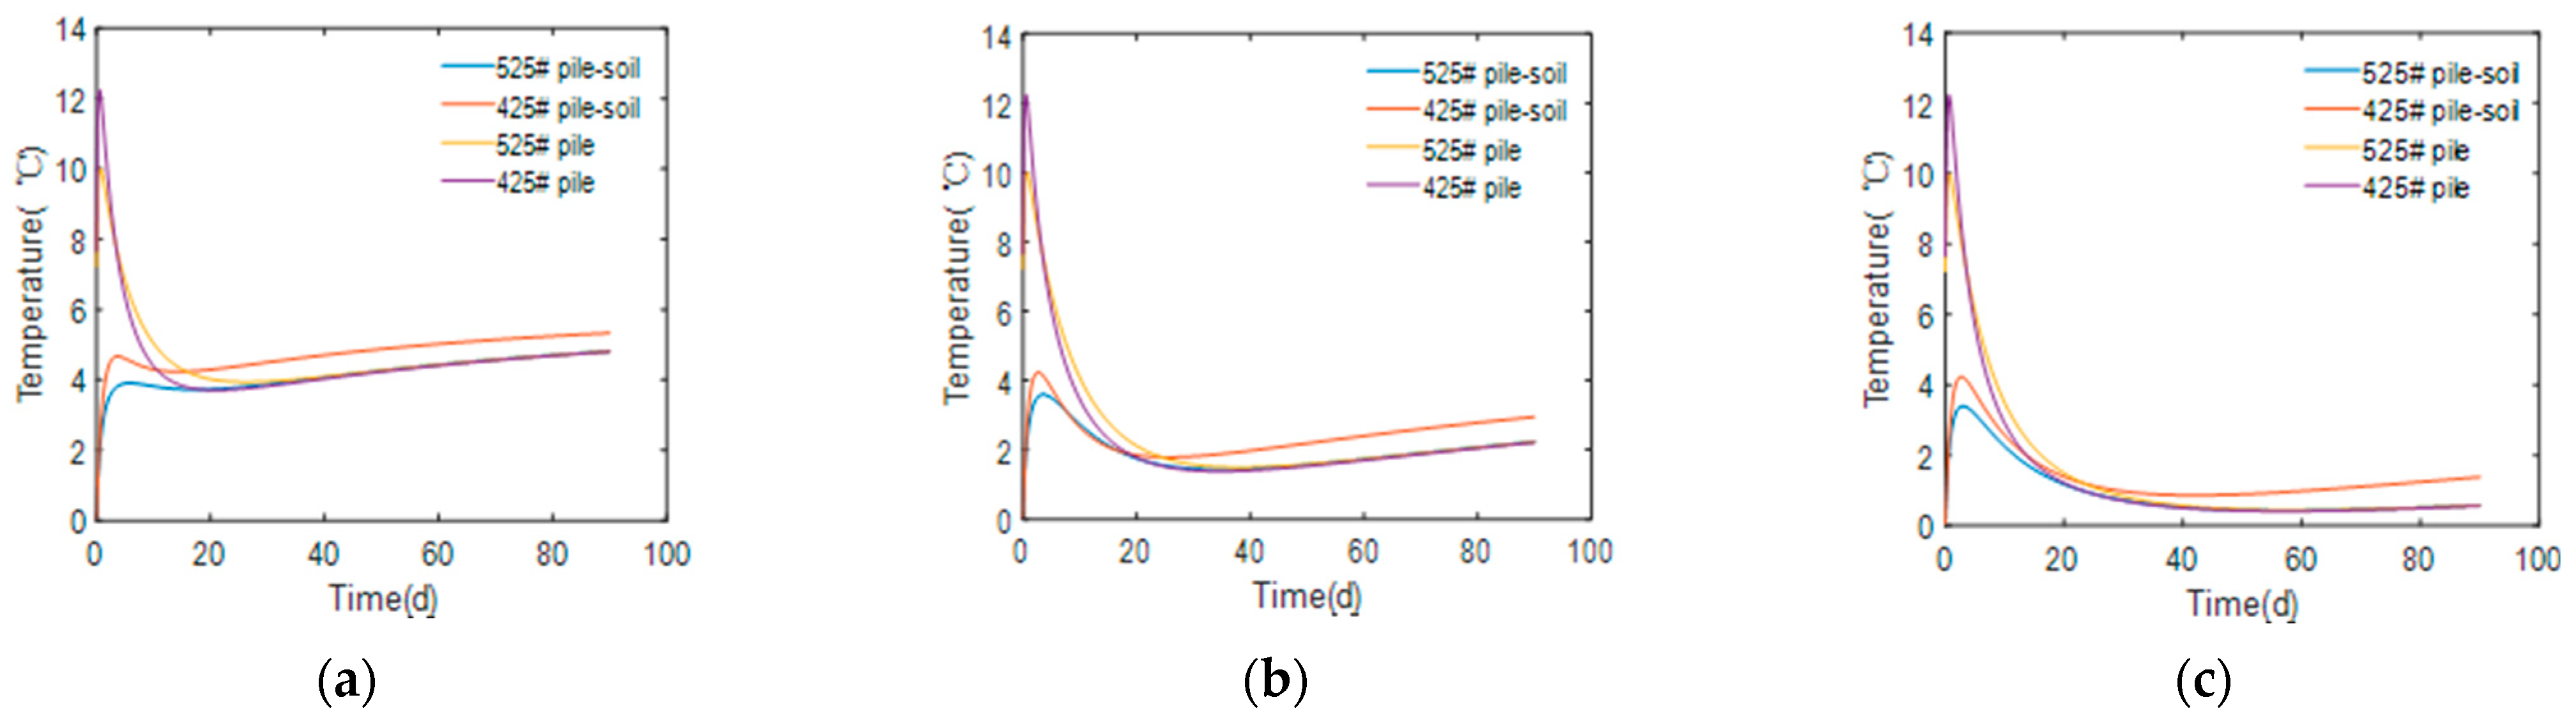
During the temperature rise phase, the temperature inside the pile generated by the hydration of the 425# cement is higher than that of the 525#. In the temperature decrease phase, the temperature inside the pile produced by the hydration of the 425# cement remains higher than that of the 525#. The temperatures become equal around the 7th day. Additionally, the soil temperature around the pile of the 425# cement is consistently higher than that of the 525#.
(3)
The simulation of the hydration heat release rate and cumulative hydration heat of the cement was achieved through an associated subroutine, conforming to the composite index expression of hydration heat. The linear change process of the ground temperature was implemented through programming language.
(4)
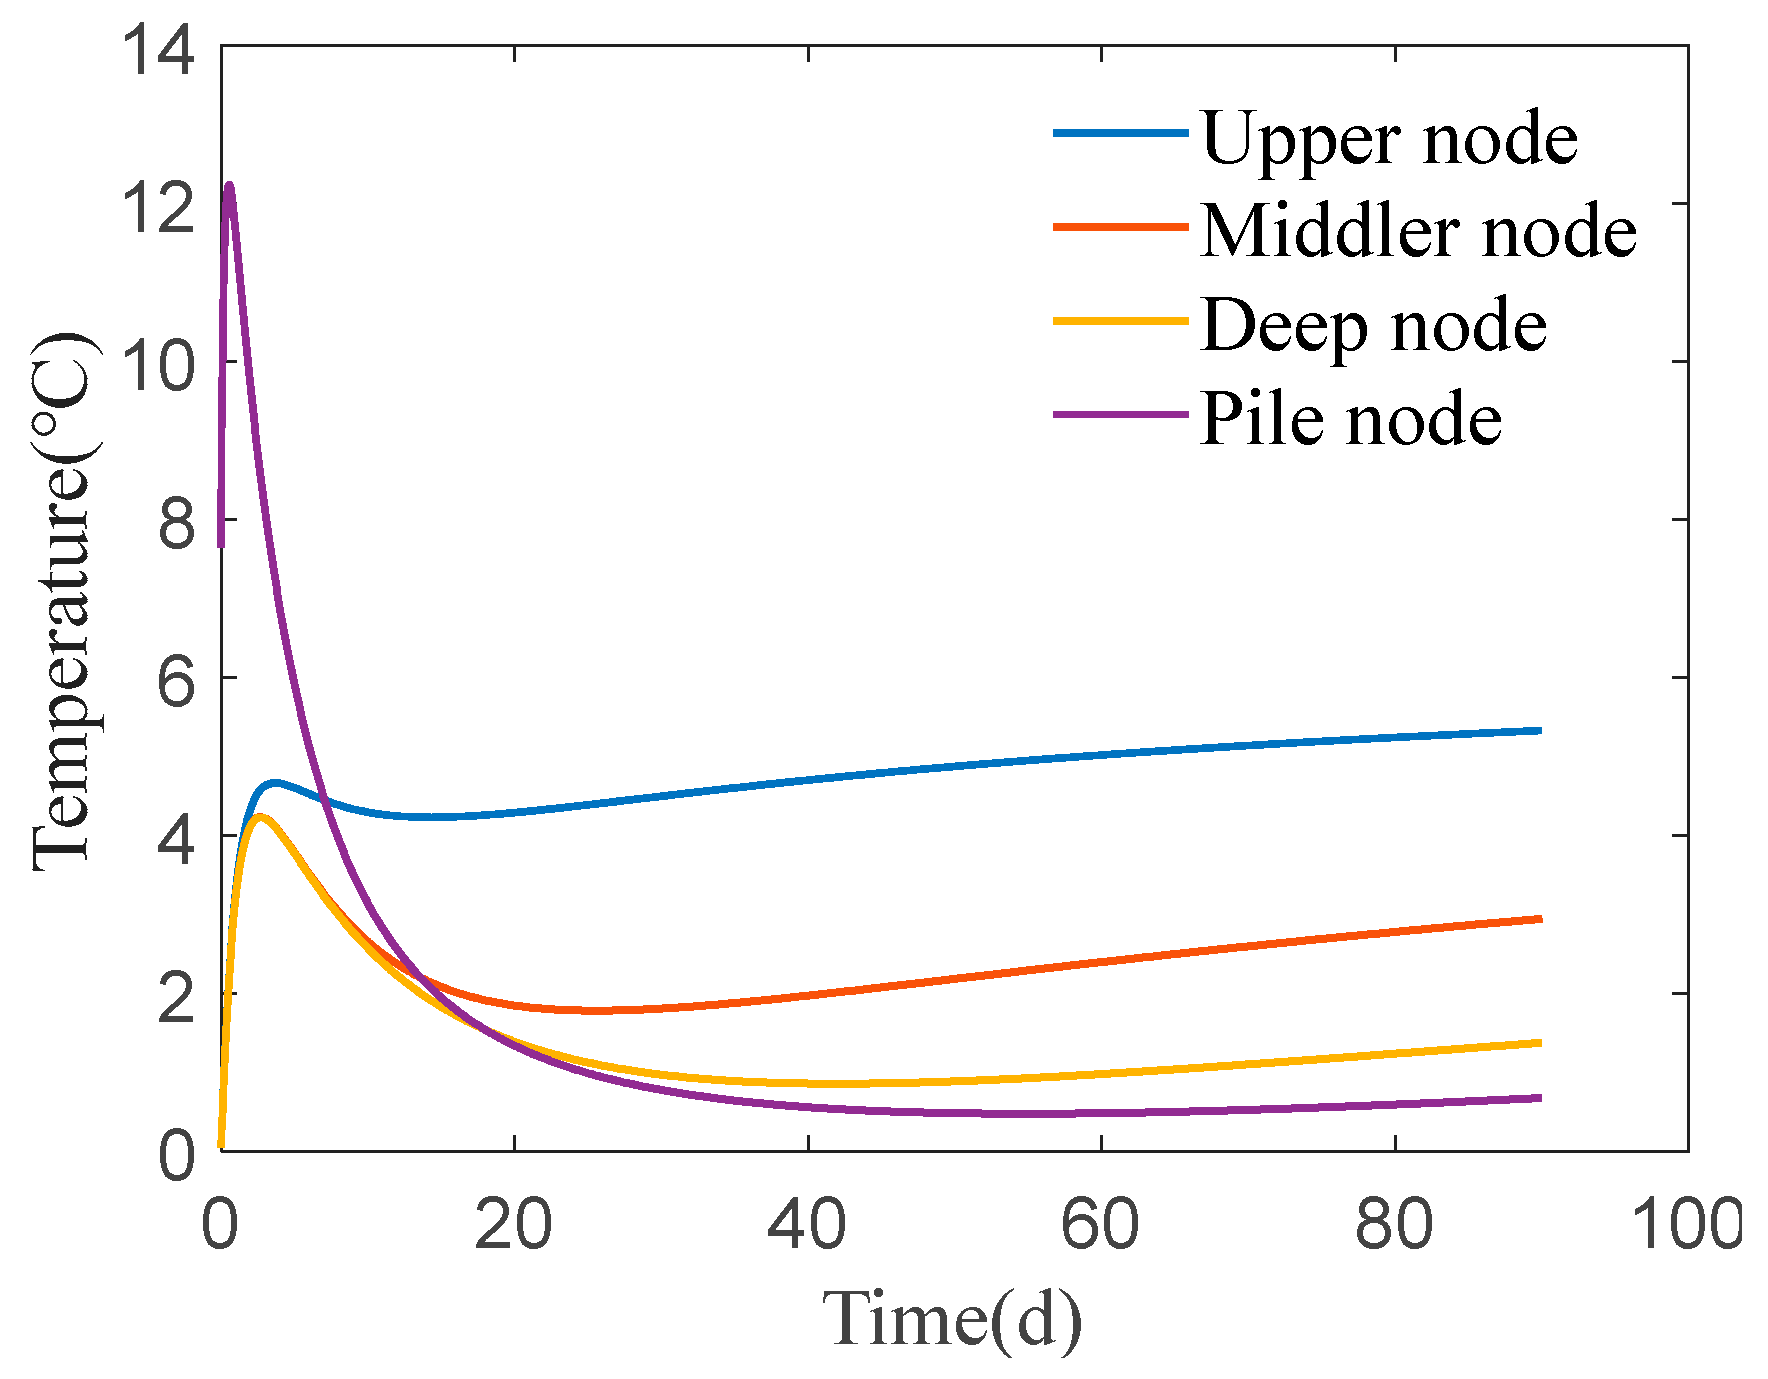
Upon adding the ground temperature, the temperature curve between the pile shows a pattern of initial rise followed by a decrease, divided into two stages: temperature rise and temperature decrease. Due to the influence of sunlight temperature, the temperature curve of the soil between the upper pile differs from that of the middle and deep layers. The internal temperature of the entire structure reaches its peak around 5 days, resulting in a 4.6 °C increase in the temperature of the soil around the pile.
(5)
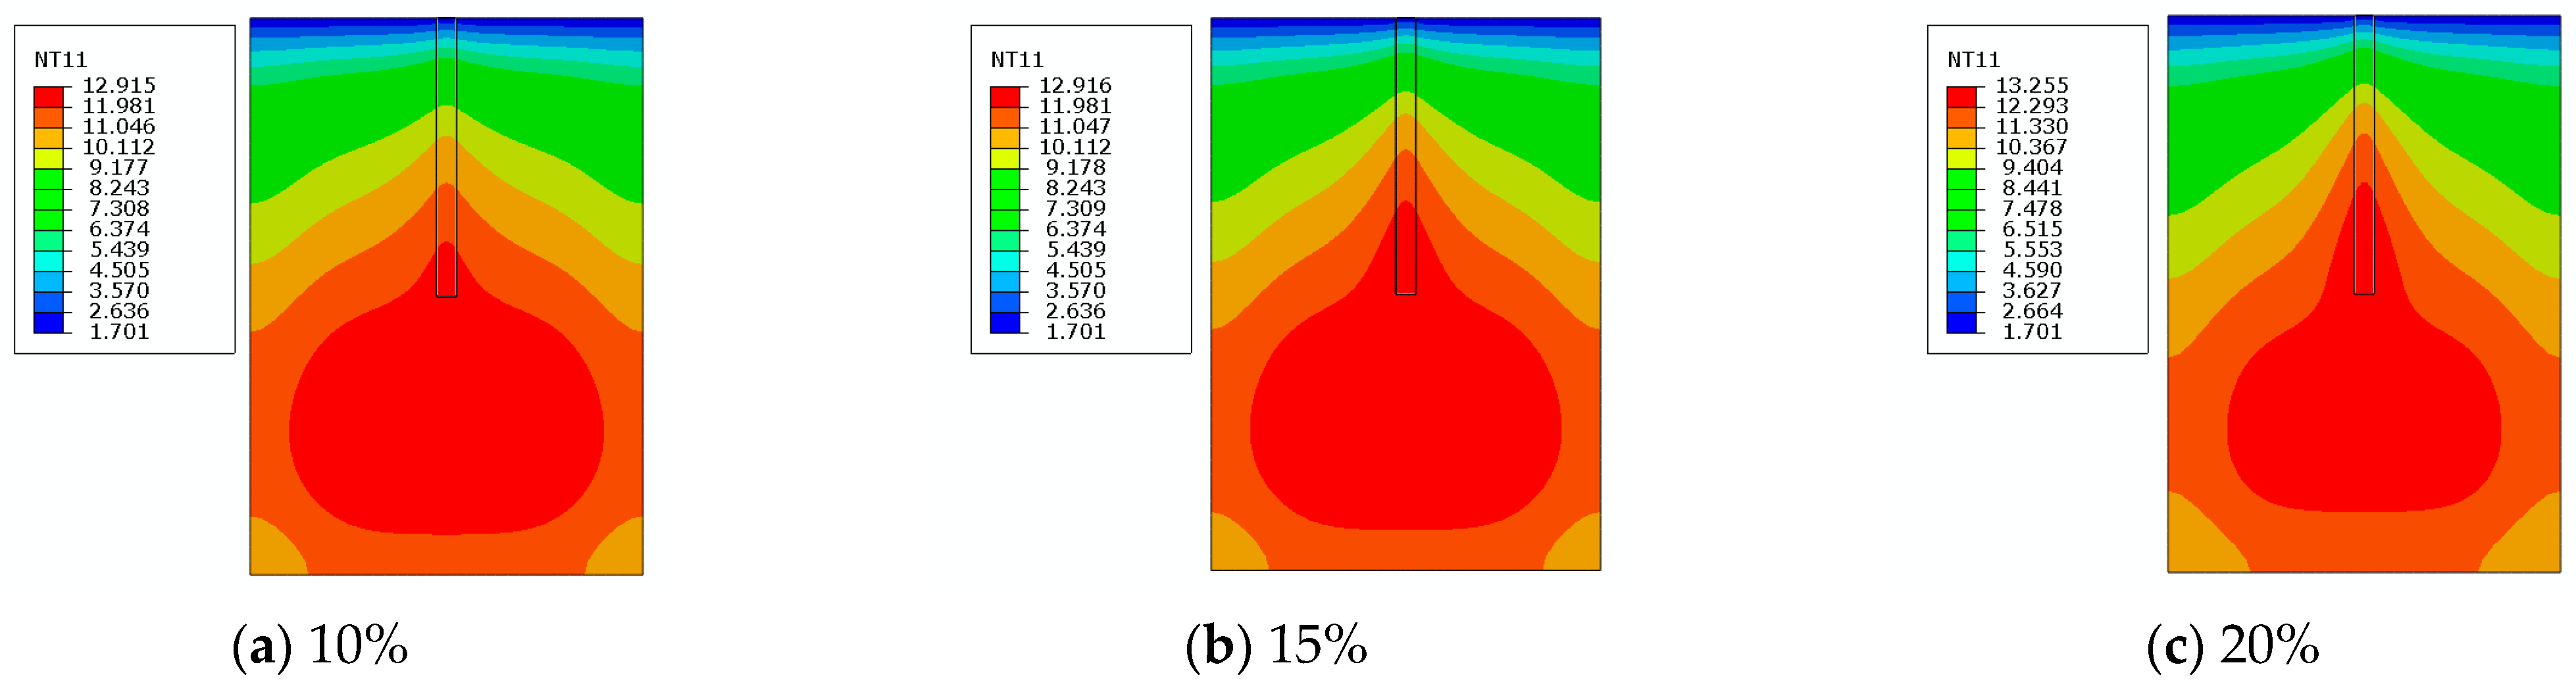
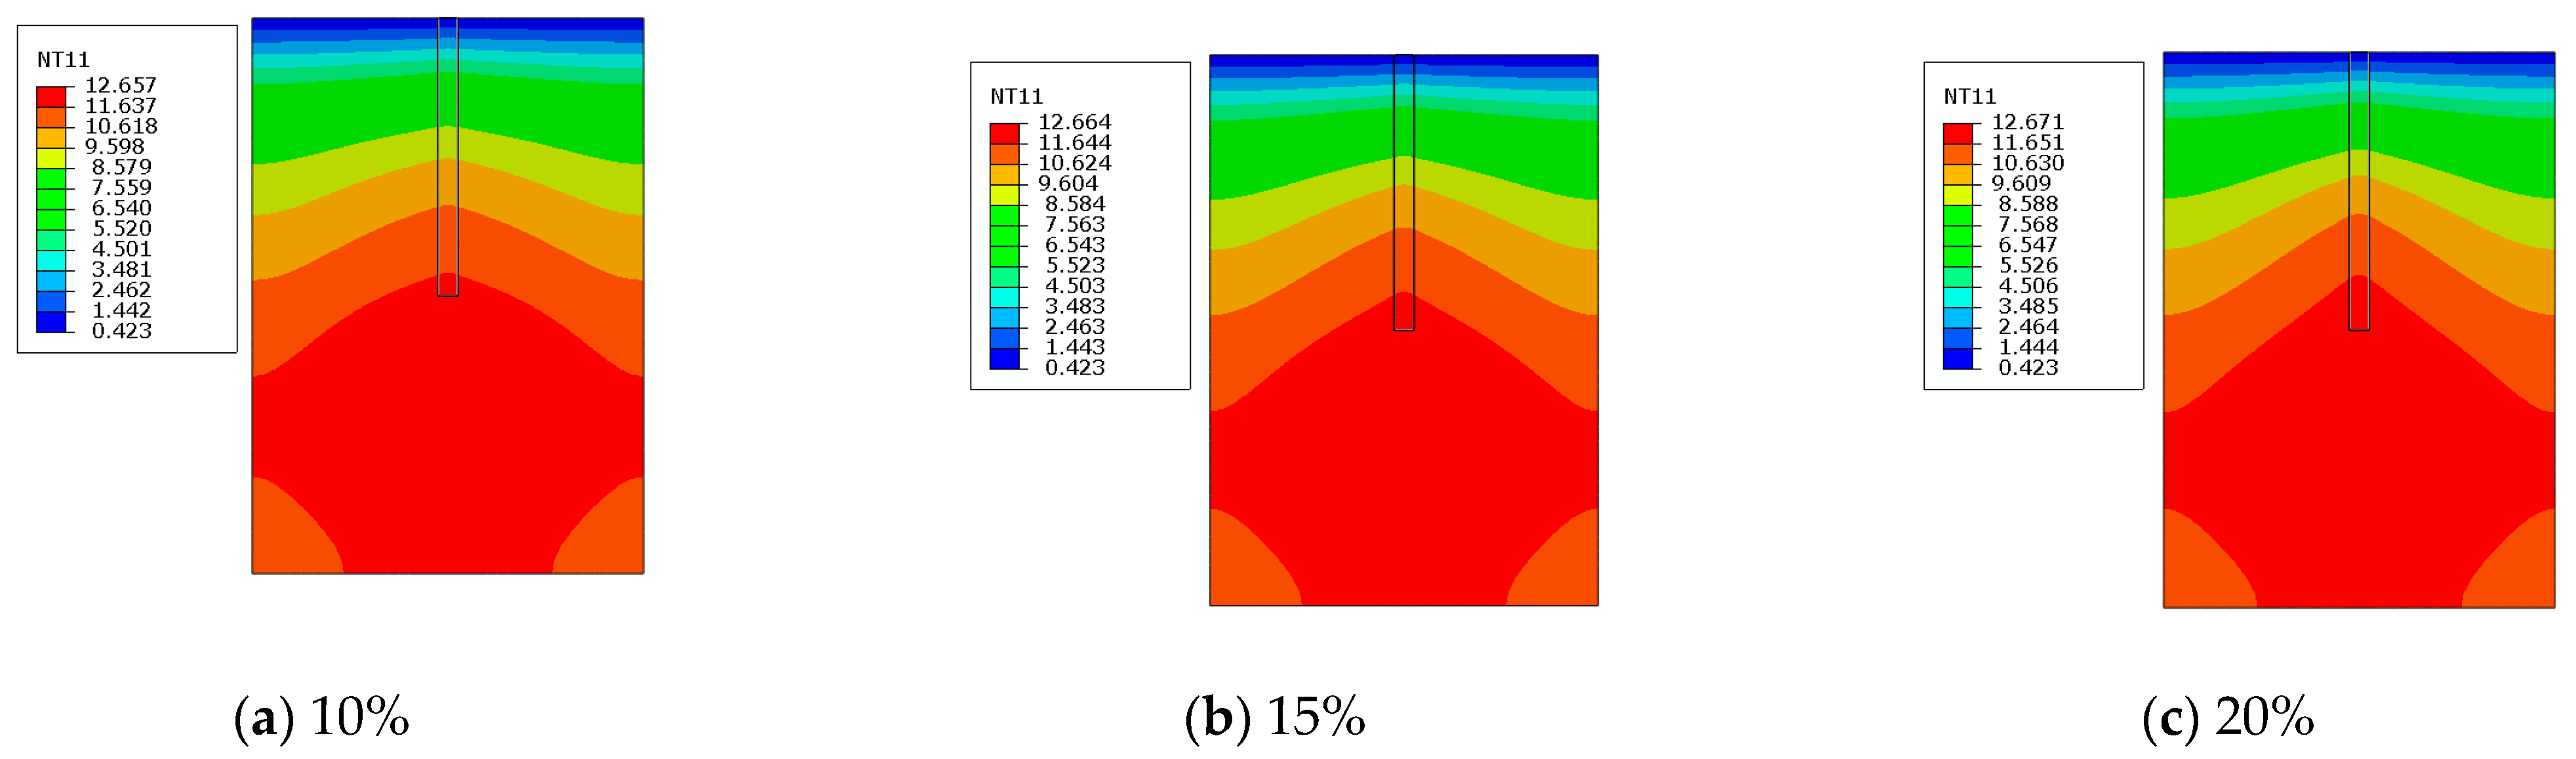
The temperature generated by the hydration of cement–soil mixing piles increases with the increase in the cement blending amount. The hydration temperature of the pile body increases by 4.4 °C with a 10% cement blending amount, 6.6 °C with a 15% cement blending amount, and 9.1 °C with a 20% cement blending amount. The temperature rise is significant. Therefore, in actual construction, the temperature of the piles should be controlled by adjusting the cement blending amount to avoid adverse effects on the structure caused by excessively high temperatures.
(6)
The temperature field of the structure shows minimal changes after 7 days with increasing time and cement blending amount. At 7 days, the temperature changes caused by different cement blending amounts occur within the range of the hydration reaction inside the piles and the surrounding soil. By 14 days, significant temperature gradients appear. At 28 days, the temperature gradient smoothens, with temperature changes beginning to occur in the upper-middle layers. Finally, by 90 days, the temperature field stabilizes.

Author Contributions

Conceptualization, W.X.; formal analysis, Q.X., Y.W. and Y.Z.; methodology, Q.X., Y.W. and Y.Z.; Software, Z.W.; writing—original draft, Z.W.; writing—review and editing, W.X. All authors have read and agreed to the published version of the manuscript.

Funding

This research received no external funding, and the APC was self-funded.

Institutional Review Board Statement

Not applicable.

Informed Consent Statement

Not applicable.

Data Availability Statement

All the data analyses in this paper are from the numerical simulation carried out with finite element software, which were performed to ensure the truth and validity of the data.

Conflicts of Interest

The authors declare no conflicts of interest.

References

  1. Ijaz, N.; Ye, W.M.; Rehman, Z.U.; Ijaz, Z. Novel application of low carbon limestone calcined clay cement (LC3) in expansive soil stabilization: An eco-efficient approach. J. Clean. Prod. 2022, 37, 133492. [Google Scholar] [CrossRef]
  2. Hamza, M.; Nie, Z.H.; Aziz, M.; Ijaz, N.; Ijaz, Z.; Rehman, Z.U. Strengthening potential of xanthan gum biopolymer in stabilizing weak subgrade soil. Clean. Technol. Environ. Policy 2022, 24, 2719–2738. [Google Scholar] [CrossRef]
  3. Zhang, X.Y.; Wang, S.K.; Liu, H.; Cui, J.; Liu, C.; Meng, X. Assessing the impact of inertial load on the buckling behavior of piles with large slenderness ratios in liquefiable deposits. Soil. Dyn. Earthq. Eng. 2023, 176, 108322. [Google Scholar] [CrossRef]
  4. Yuan, W.J.; Cai, Z.Q.; Xie, S.; Zhang, J.R.; Pan, J. Study on Construction Technology Coordination Parameters of Cement Soil Mixed Piles Based on Strength Tests. J. Hunan Univ. (Nat. Sci.) 2018, 45, 4651. [Google Scholar] [CrossRef]
  5. Qian, A.J. Finite Element Simulation Research on Soft Soil Foundation of Embankment Reinforced by Cement-soil Mixing Pile. Shaanxi Water Resour. 2022, 8, 124–126+130. [Google Scholar] [CrossRef]
  6. Yuan, B.X.; Li, Z.H.; Zhao, Z.Q.; Ni, H.; Su, Z.L.; Li, Z.J. Experimental study of displacement field of layered soils surrounding laterally loaded pile based on Transparent Soil. J. Soils Sediments 2021, 21, 3072–3083. [Google Scholar] [CrossRef]
  7. Zhao, L.P.; Long, X.P.; Hung, X.Y. Settlement analysis of composite foundation of soil-cement mixing pile. J. Chang. Univ. Sci. Technol. (Nat. Sci.) 2020, 17, 30–36+70. [Google Scholar]
  8. Xu, C.; Ye, G.B.; Jiang, Z.S.; Zhou, Q.Z. Research on mechanism of combined improvement of soft soils based on field monitoring. Chin. J. Geotech. Eng. 2006, 28, 918–921. [Google Scholar]
  9. Deng, Y.S.; Meng, L.Q.; Cai, M.Z.; Sun, Y.N.; Li, L.; Zhang, Y.F. Research on Stability of Loess Roadbed Reinforced with Cement-soil Mixing Piles. J. Zhengzhou Univ. (Eng. Sci.) 2022, 43, 59–66. [Google Scholar] [CrossRef]
  10. Guo, Y.; Li, X.; Zhao, R.; Wang, R.C. Analysis of the Reinforcement Mechanism of Cement-Soil Pile Composite Foundation. J. Henan Sci. Technol. 2013, 15, 76. [Google Scholar]
  11. Li, R.; Hou, T.S. The Cement-Soil Mixing Pile and Its Application in Soft-Soil Subgrades. Build. Sci. 2008, 12, 88–90. [Google Scholar]
  12. Wang, M. Factors Influencing the Reinforcement Effect of Surrounding Levee Cement Mixing Piles and Engineering Design Optimization. Hydraul. Technol. Superv. 2021, 26, 104–105+109+113+123. [Google Scholar]
  13. Wang, X.J.; Wang, Y.J.; Wang, H.B. Application of Cement-Soil Mixing Piles in Deep Excavation Support. Chin. Water Transp. (Acad. Ed.) 2007, 9, 110–111. [Google Scholar]
  14. Yuan, L. Research on the Application of Cement-Soil Mixing Piles in Soft Soil Foundations. Ju She 2023, 19, 163–166. [Google Scholar]
  15. Phutthananon, C.; Jongpradist, P.; Dias, D.; Guo, X.F.; Jamsawang, P.; Baroth, J. Reliability-based settlement analysis of embankments over soft soils reinforced with T-shaped deep cement mixing piles. Front. Struct. Civ. Eng. 2022, 16, 638–656. [Google Scholar] [CrossRef]
  16. Ndong Engone, J.G.; El Moumen, A.; Djelal, C.; Imad, A.; Kanit, T.; Page, J. Evaluation of Effective Elastic Properties for Wood–Cement Composites: Experimental and Computational Investigations. Sustainability 2022, 14, 8638. [Google Scholar] [CrossRef]
  17. Wan, Y.; Song, L.; Zhu, Z.D.; Peng, Y.Y. Research on Construction Quality Monitoring and Evaluating Technology of Soil-Cement Mixing Piles. Soil. Mech. Found. Eng. 2021, 58, 85–91. [Google Scholar] [CrossRef]
  18. Yuan, B.X.; Liang, J.K.; Lin, H.Z.; Wang, W.Y.; Xiao, Y. Experimental Study on Influencing Factors Associated with a New Tunnel Waterproofing for Improved Impermeability. J. Test. Eval. 2024, 52, JTE20230417. [Google Scholar] [CrossRef]
  19. Ijaz, N.; Ye, W.M.; Rehman, Z.U.; Ijaz, Z.; Junaid, M.F. Global insights into micro-macro mechanisms and environmental implications of limestone calcined clay cement (LC3) for sustainable construction applications. Sci. Total Environ. 2024, 907, 167794. [Google Scholar] [CrossRef]
  20. Sheng, X.W.; Xiao, S.M.; Zheng, W.Q.; Sun, H.Z.; Yang, Y.; Ma, K.L. Experimental and finite element investigations on hydration heat and early cracks in massive concrete piers. Case Stud. Constr. Mater. 2023, 18, e01926. [Google Scholar] [CrossRef]
  21. Liu, R.Y.W.; Fisher, A.; Taborda, D.M.G.; Bourne-Webb, P.J. A practical heat of hydration model for concrete curing for geotechnical applications. Geotech. Res. 2022, 9, 23–31. [Google Scholar] [CrossRef]
  22. Seyedehelaheh, S.; Masoud, H.B.; Hamid, R.T.; Ali, K. Experimental investigation on the efficiency of the phase change materials for enhancing the thermal performance of energy piles in sandy soils. Energy Build. 2023, 298, 113544. [Google Scholar] [CrossRef]
  23. Ding, X.M.; Chen, P.; Wang, C.L.; Kong, G.Q. Heat transfer performance of energy piles in seasonally frozen soil areas. Renew. Energy 2022, 190, 903–918. [Google Scholar] [CrossRef]
  24. Tazi, M.; Sukiman, M.S.; Erchiqui, F.; Imad, A.; Kanit, T. Effect of Wood Fillers on the Viscoelastic and Thermophysical Properties of HDPE-Wood Composite. Int. J. Polym. Sci. 2016, 2016, 9032525. [Google Scholar] [CrossRef]
  25. Wei, G.H.; Li, J. Study and Simulation Analysis of Hydration Heat in Mass Concrete. Sichuan Archit. 2019, 39, 309–314. [Google Scholar]
  26. Zhu, B.F. Thermal Stresses and Temperature Control of Mass Concrete; Butterworth-Heinemann: Oxford, UK, 2013. [Google Scholar]
  27. Xie, Y.D.; Qian, C.X. A novel numerical method for predicting the hydration heat of concrete based on thermodynamic model and finite element analysis. Mater. Des. 2023, 226, 111675. [Google Scholar] [CrossRef]
  28. Kevin, Z.T.; David, J.P. Creep, shrinkage, and thermal effects on mass concrete structure. J. Eng. Mech. Div. 1991, 16, 31–33. [Google Scholar]
  29. Wen, W.G.; Lu, Q.; Wang, H.; Liu, X.L. Research on Characteristics of Ground Temperture Variation in Tianjin. Geotech. Eng. Tech. 2021, 35, 318–322. [Google Scholar]
  30. Wei, F.Y. Modern Climate Statistics Diagnosis and Prediction Technology; Meteorological Press: Beijing, China, 1999; pp. 50–53. [Google Scholar]
  31. Sukiman, M.S.; Kanit, T.; N’Guyen, F.; Imad, A.; Erchiqui, F. On effective thermal properties of wood particles reinforced HDPE composites. Wood Sci. Technol. 2022, 56, 603–622. [Google Scholar] [CrossRef]
  32. Li, W.J. Study on Proportioning of Cement-Soil Mixing Piles in the Yellow River Delta Region. Sichuan Cem. 2019, 14, 17. [Google Scholar]
  33. Wang, P.; Huang, C.; Zhao, G.H.; Zhang, F. Experiment of the model of hydration heat temperature field and strain field pf concrete single box and three chamber girder. J. Shandong Univ. 2024, 54, 109–122+130. [Google Scholar] [CrossRef]
  34. Yang, S.; Robert, H.M.; Ankit, D. Visualizing Abaqus output database in ParaView: A universal converter in Python and C++. SoftwareX 2023, 22, 101331. [Google Scholar] [CrossRef]
  35. Chen, J.W.; Zhang, G.Z.; Guo, M.; Chen, L.; Ning, B.W.; Zhang, S.Q.; Ya, Z.; Guo, P.J. Investigation on heat transfer characteristics of PHC energy piles in multi-layer strata. Chin. J. Rock. Mech. Eng. 2020, 39, 3615–3626. [Google Scholar] [CrossRef]
  36. Fang, D.Z. Numerical Study on the Influence of Temperature on the Interactions between Energy Pile and Soil. Master’s Thesis, Zhejiang University of Technology, Hangzhou, China, 2020. [Google Scholar] [CrossRef]
  37. Sangwoo, P.; Dongseop, L.; Seokjae, L.; Alexis, C.; Hangseok, C. Experimental and numerical analysis on thermal performance of large-diameter cast-in-place energy pile constructed in soft ground. Energy 2017, 118, 297–311. [Google Scholar] [CrossRef]
Figure 1. Geometric model of the pile–soil. (unit: m). (A: Pile; B: Soil).
Buildings 14 00845 g001
Figure 2. Mesh division for the pile–soil model.
Buildings 14 00845 g002
Figure 3. Relationship between soil depth and its temperature.
Buildings 14 00845 g003
Figure 4. Temperature change diagram of hydration heat at a specific moment in the model. (a) Ordinary Portland cement 425# after 1.5 days; (b) ordinary Portland cement 425# after 90 days.
Buildings 14 00845 g004
Figure 5. Temperature variation time history graph of the pile–soil model.
Buildings 14 00845 g005
Figure 6. Roof.
Figure 6. Roof.
Buildings 14 00845 g006
Figure 7. Temperature variation over time at different depths for various types of cement. (a) Upper node; (b) middle node; (c) deep node.
Buildings 14 00845 g007
Figure 8. Curve of SDV1 with time.
Buildings 14 00845 g008
Figure 9. Curve of SDV2 with time.
Buildings 14 00845 g009
Figure 10. The simulated results of ground temperature variation.
Buildings 14 00845 g010
Figure 11. The temperature field cloud map at a certain moment.
Buildings 14 00845 g011
Figure 12. The vertical temperature gradient distribution around the pile.
Buildings 14 00845 g012
Figure 13. Monitoring hole.
Buildings 14 00845 g013
Figure 14. The temperature curve graphs under different cement blending amounts.
Buildings 14 00845 g014
Figure 15. Temperature field cloud map at different cement blending amounts on the 7th day.
Buildings 14 00845 g015
Figure 16. Temperature field cloud map at different cement blending amounts on the 14th day.
Buildings 14 00845 g016
Figure 17. Temperature field cloud map at different cement blending amounts on the 28th day.
Buildings 14 00845 g017
Figure 18. Temperature field cloud map at different cement blending amounts on the 90th day.
Buildings 14 00845 g018
Table 1. Pile–soil material parameters.
MaterialsDensity (kg/m3)Thermal Conductivity Coefficient
(J/day·m−1 °C−1)
Specific Heat
(J·kg−1·°C−1)
Elastic
Modulus (MPa)
Poisson’s Ratio
Soil1700116,640840150.3
Pile4000155,52010008000.16
Table 2. Temperature changes at different cement blending amounts on the 7th day.
10% Blending
Temperature/°C
15% Blending
Temperature/°C
20% Blending
Temperature/°C
13.39114.43715.524
12.44013.39914.395
11.48912.36113.266
10.53811.32312.138
9.58710.28511.009
8.6369.2479.880
7.6858.2088.752
6.7357.1707.623
5.7846.1326.496
4.8335.0945.336
3.8824.0564.237
2.9313.0183.108
1.9801.9801.980
Disclaimer/Publisher’s Note: The statements, opinions and data contained in all publications are solely those of the individual author(s) and contributor(s) and not of MDPI and/or the editor(s). MDPI and/or the editor(s) disclaim responsibility for any injury to people or property resulting from any ideas, methods, instructions or products referred to in the content.

