Exhibition Space Circulation in Museums from the Perspective of Pedestrian Simulation

Abstract
:1. Introduction
2. Research Method
2.1. Model Selection
2.2. Selection of Research Subjects
2.3. Selection of Research Samples
2.4. Organization of Museum Exhibition Circulation
3. Museum Pedestrian Flow Line Simulation and Analysis
3.1. Construction of the Simulation Model
3.2. Simulation Conditions Setting
3.3. Model Validation
3.4. Experimental Simulation Results and Analysis
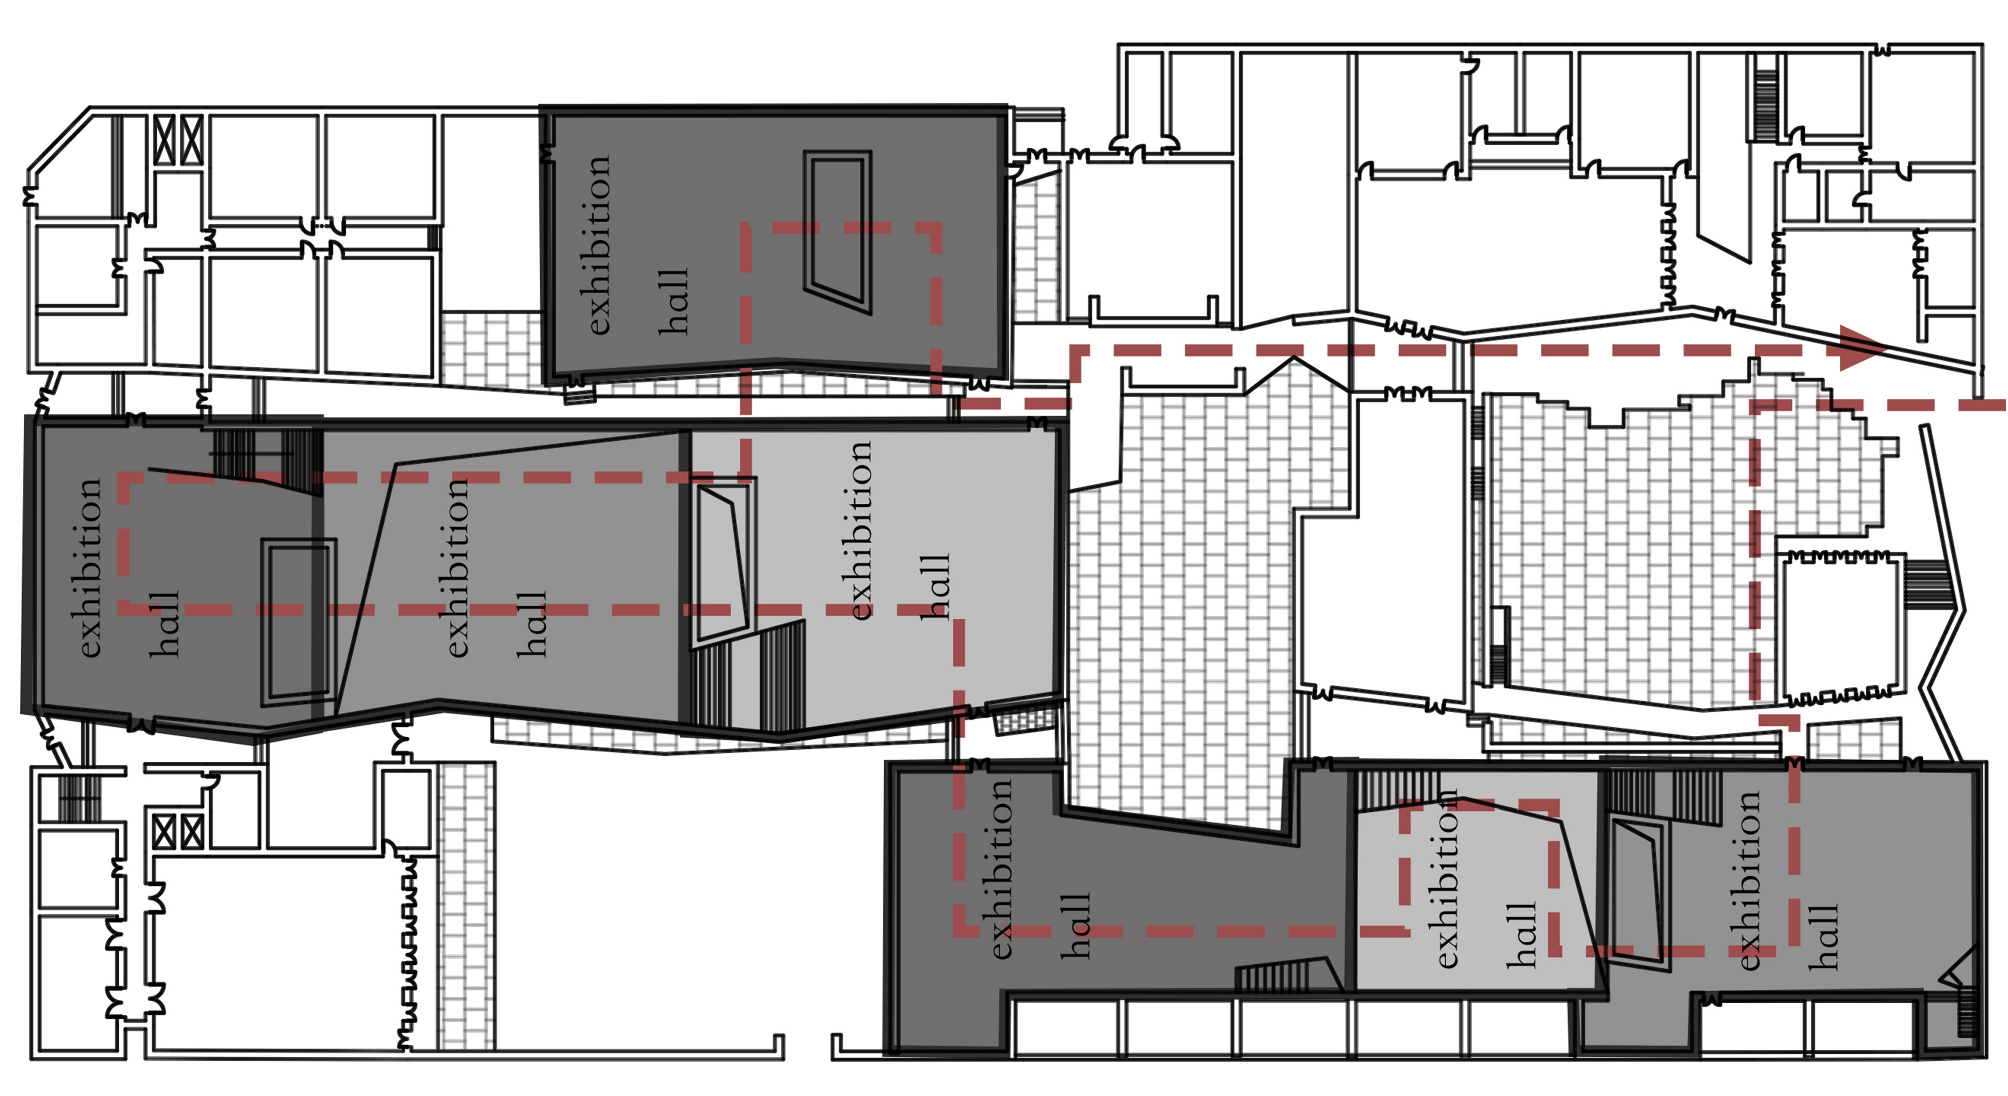
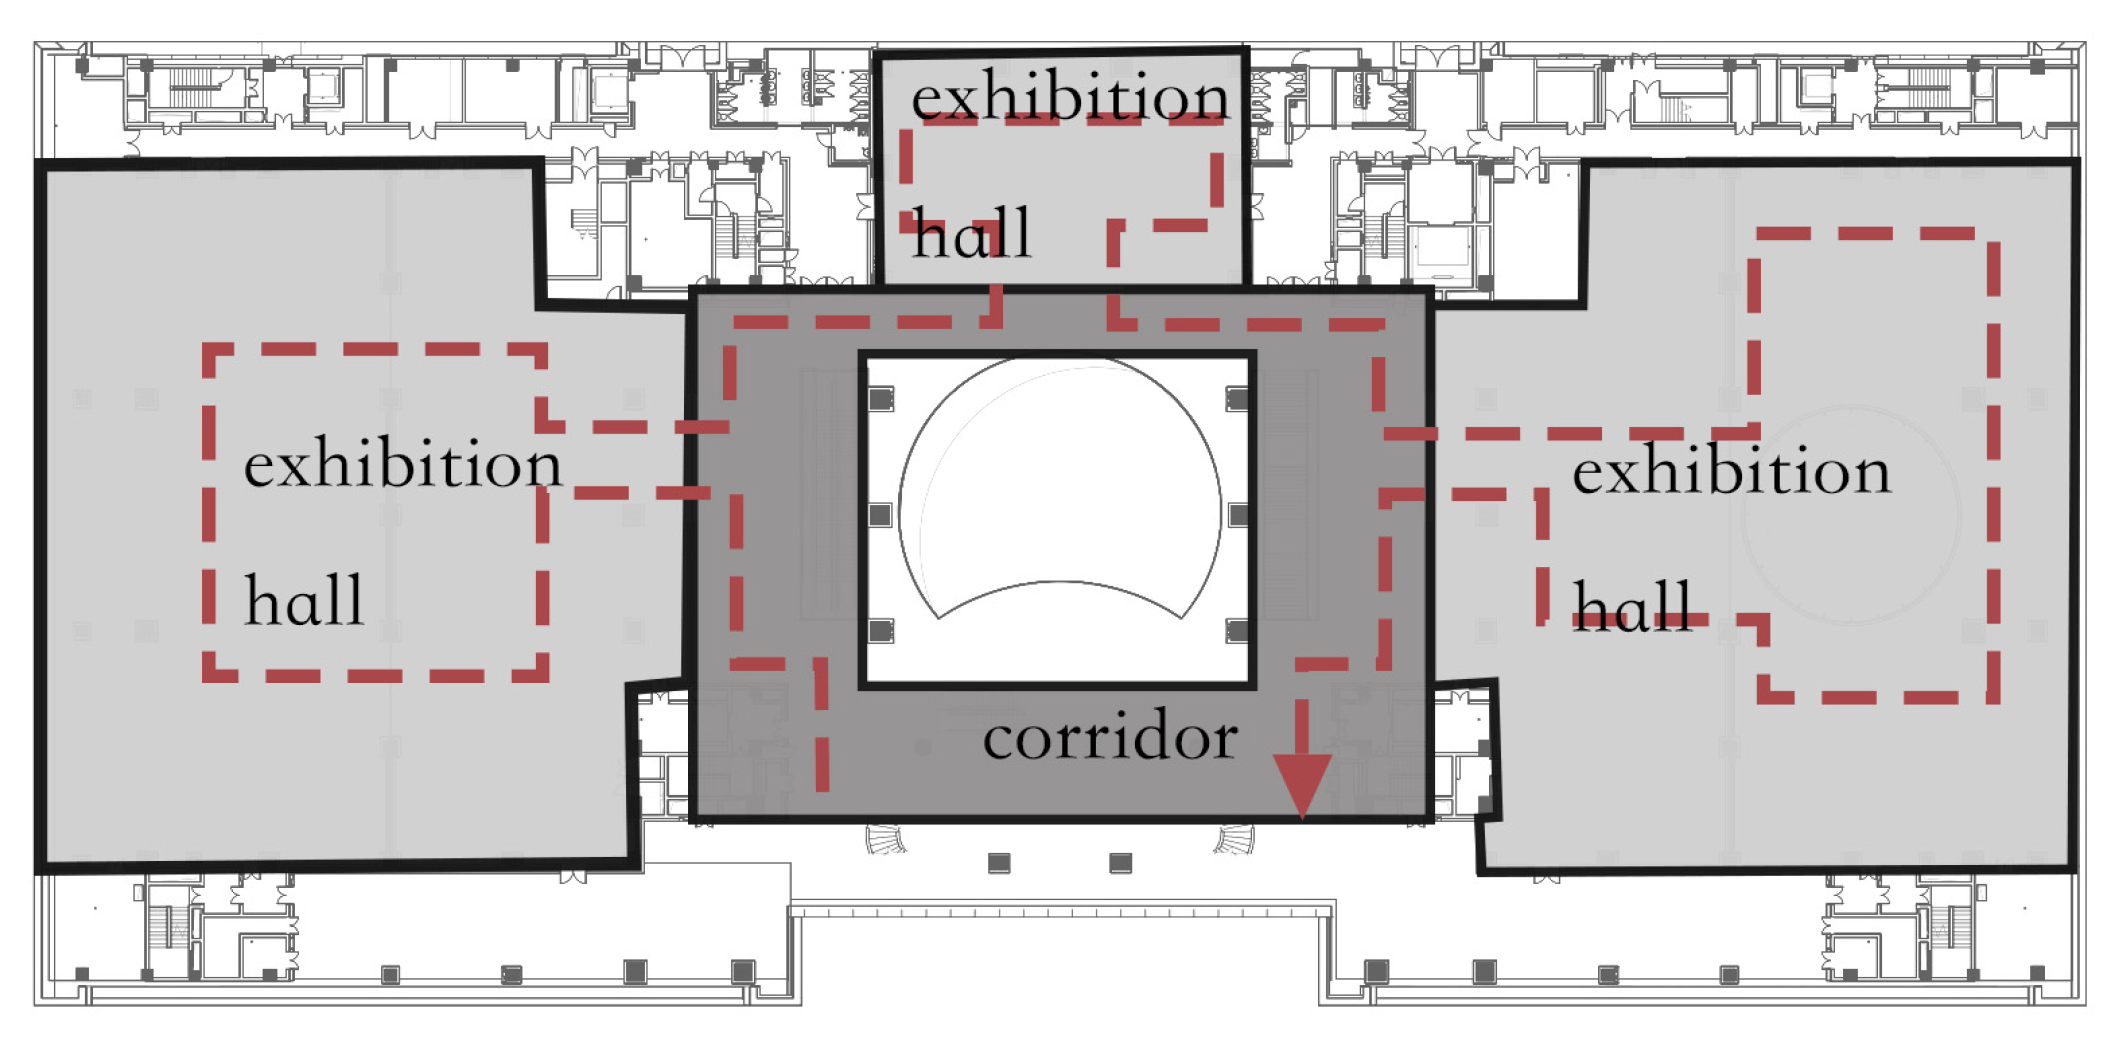
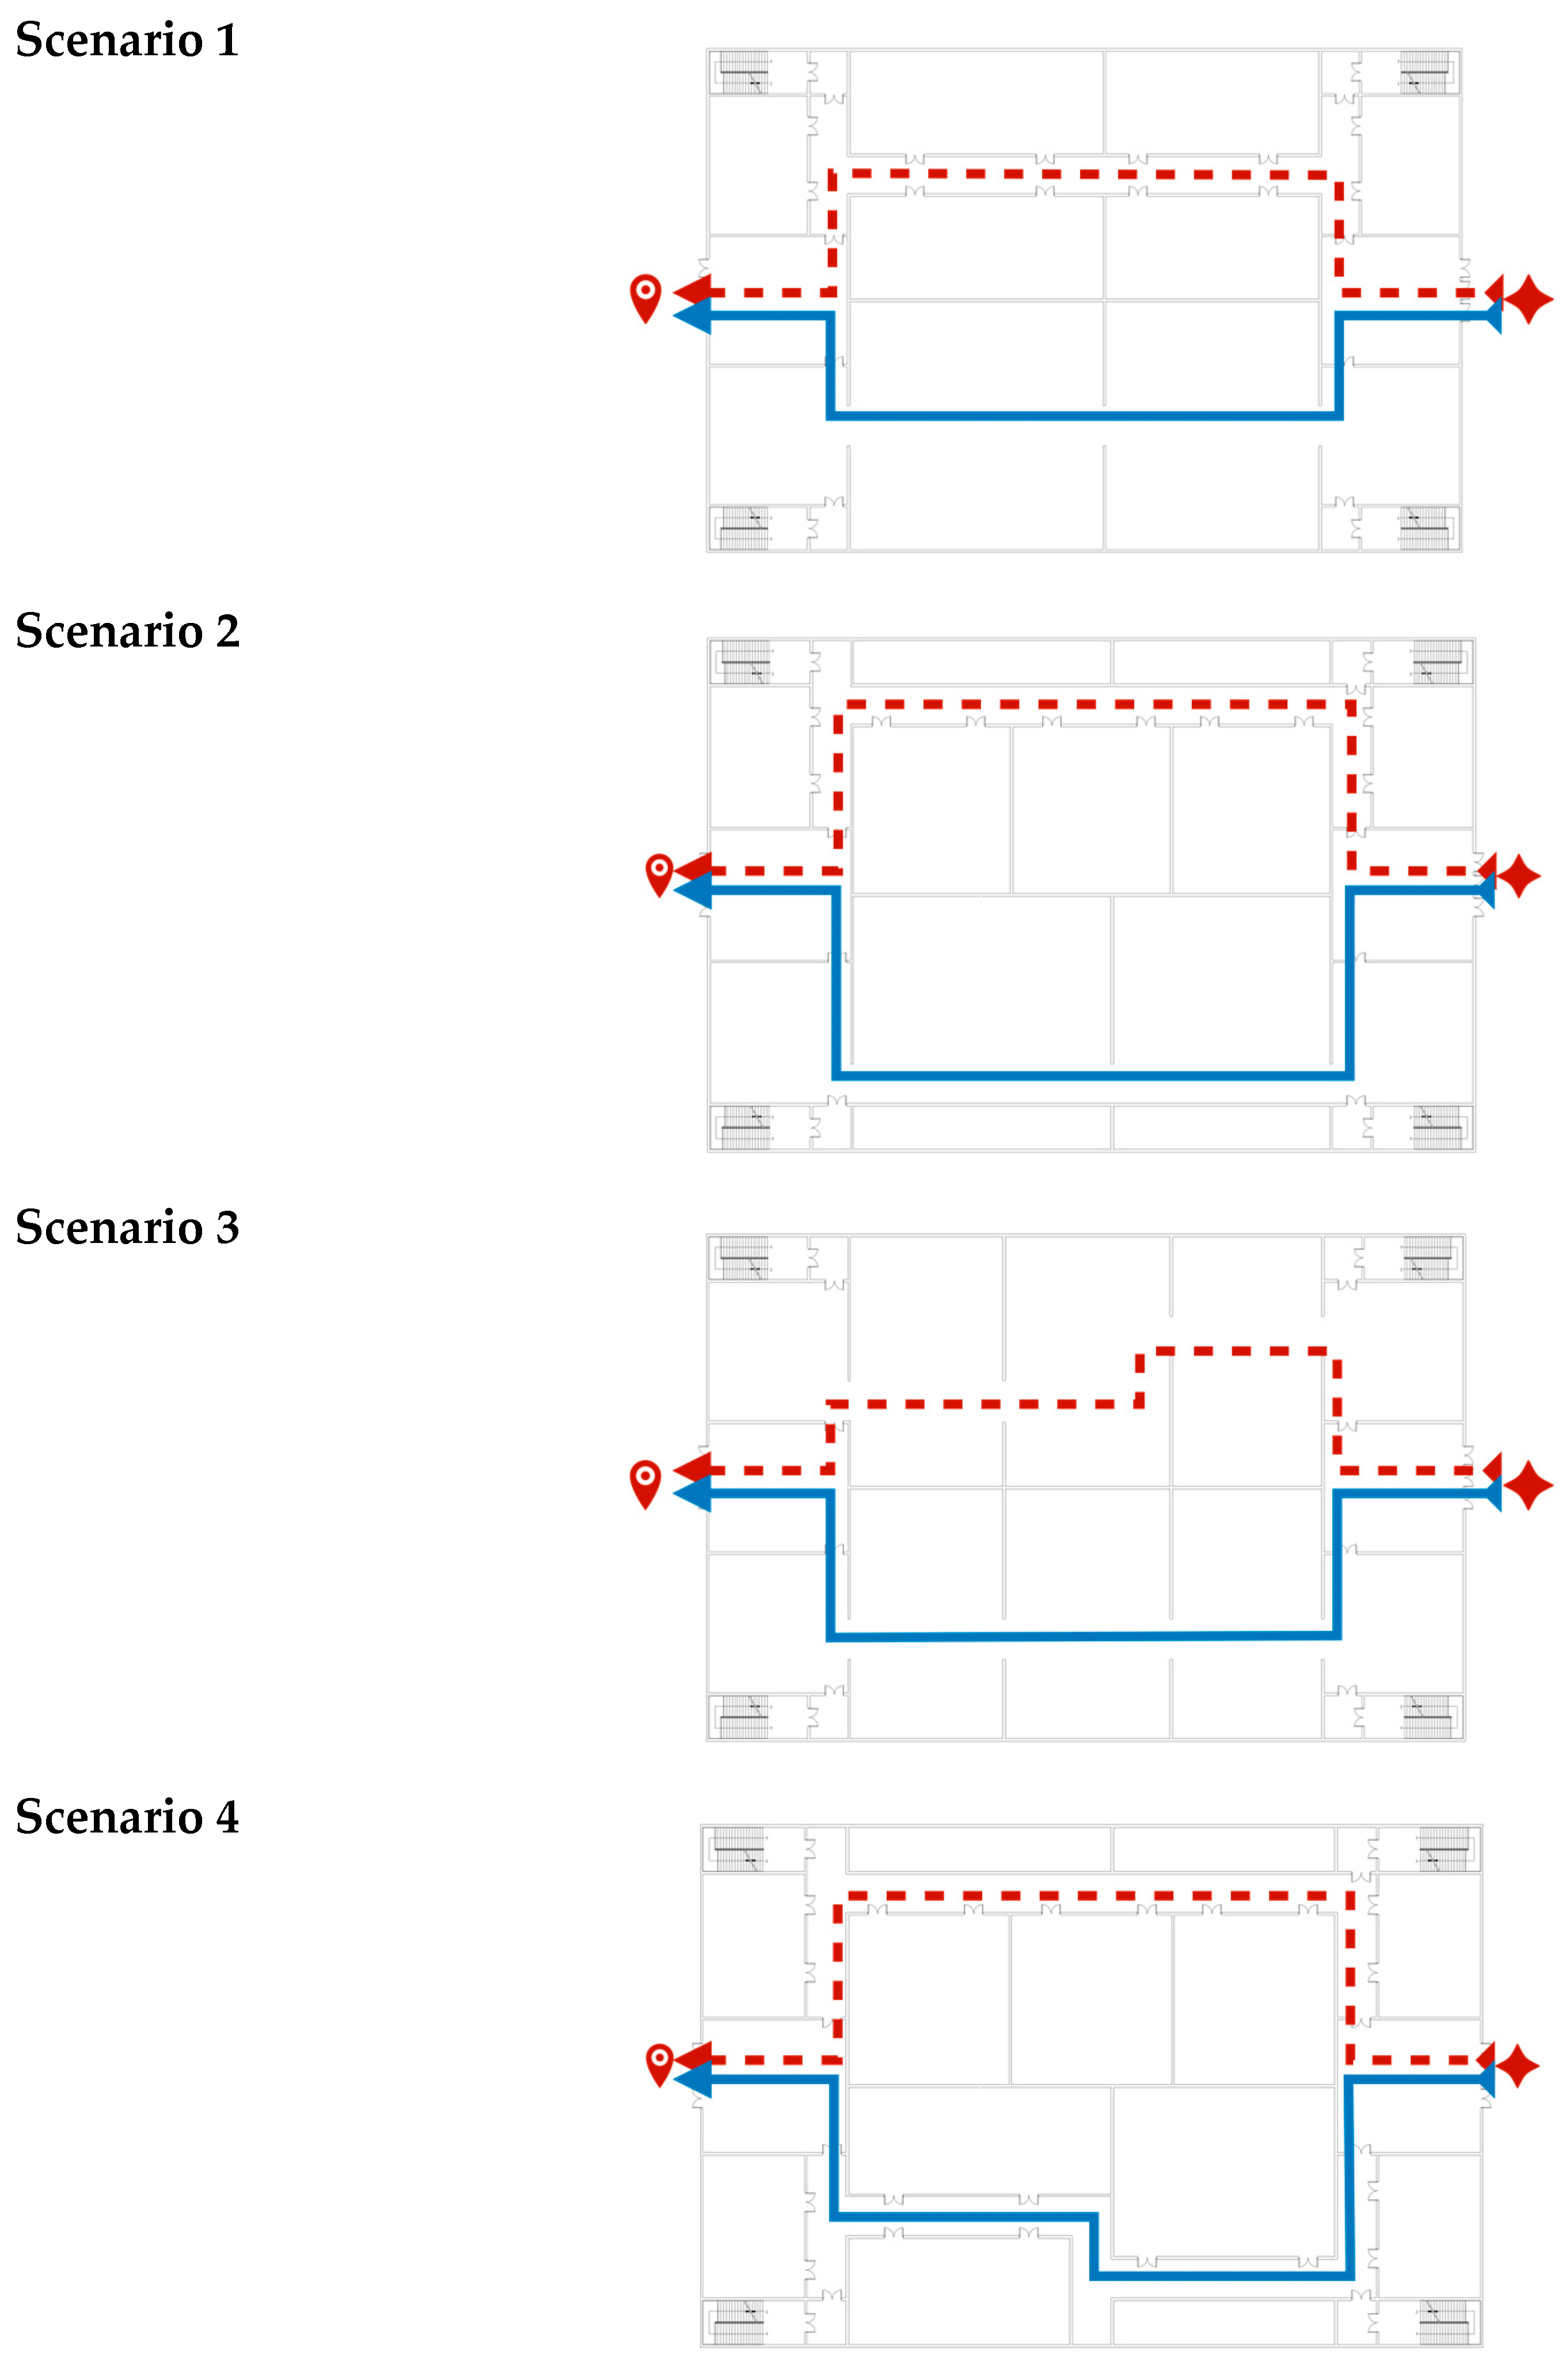
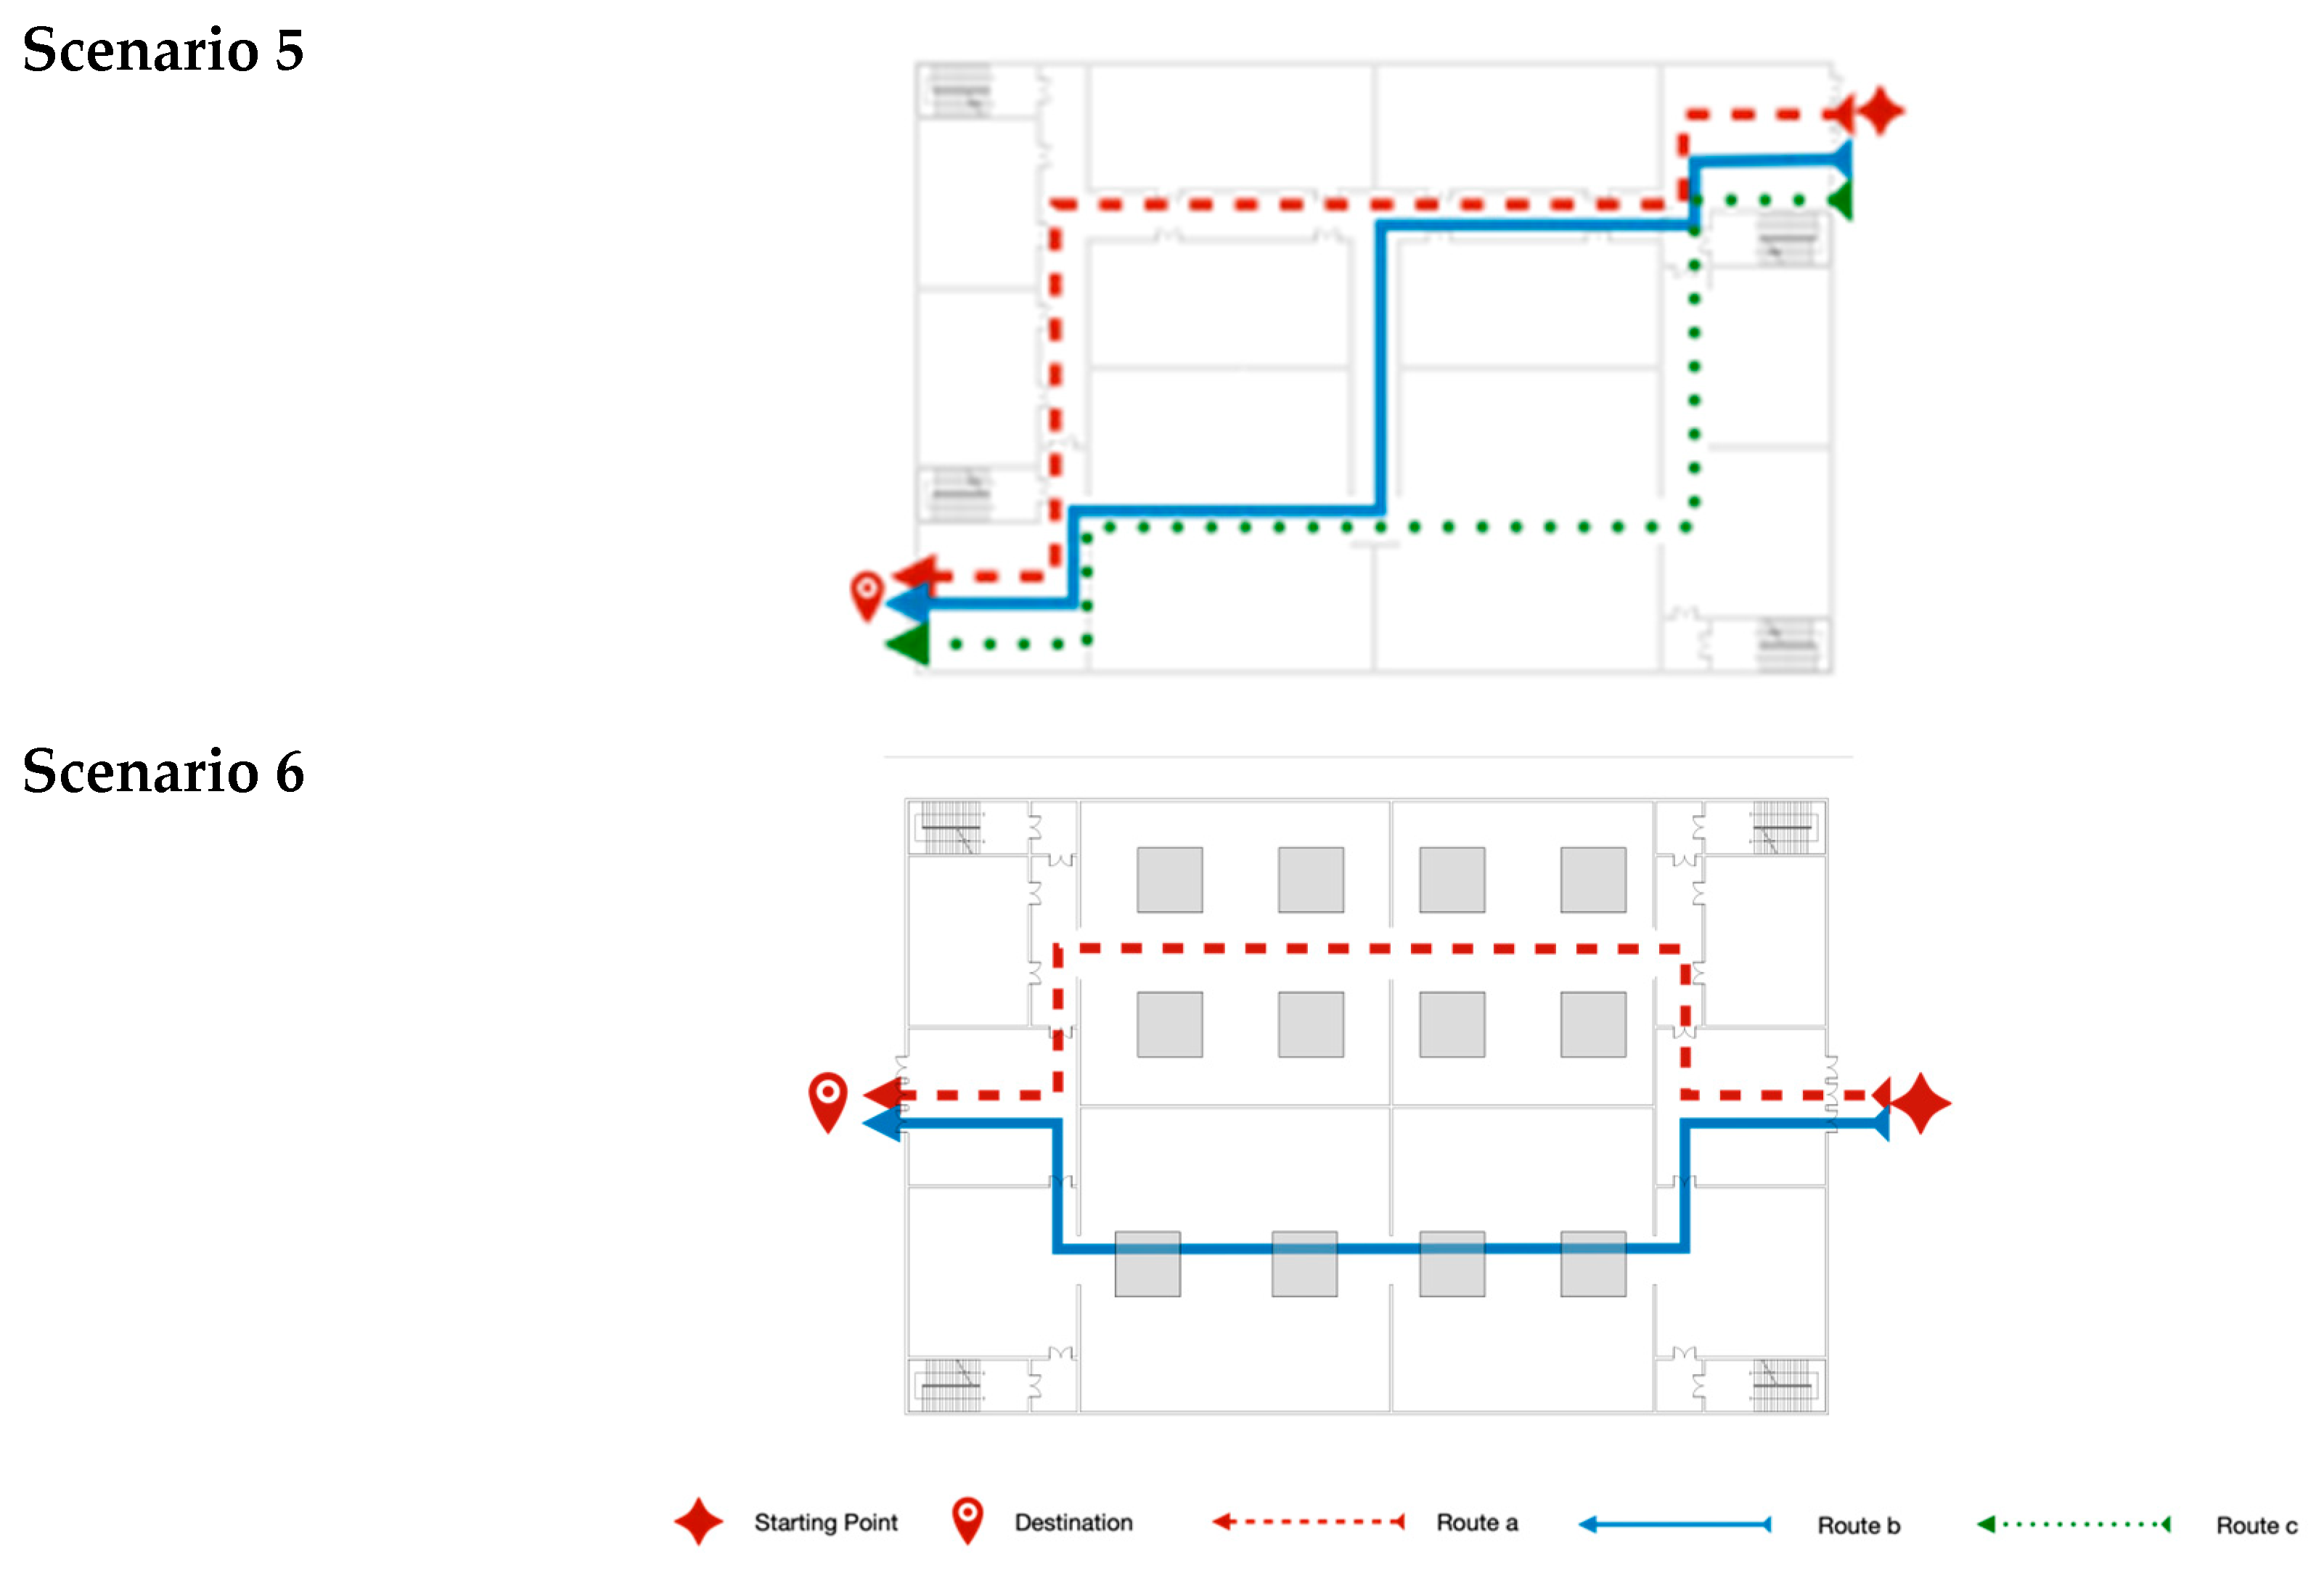
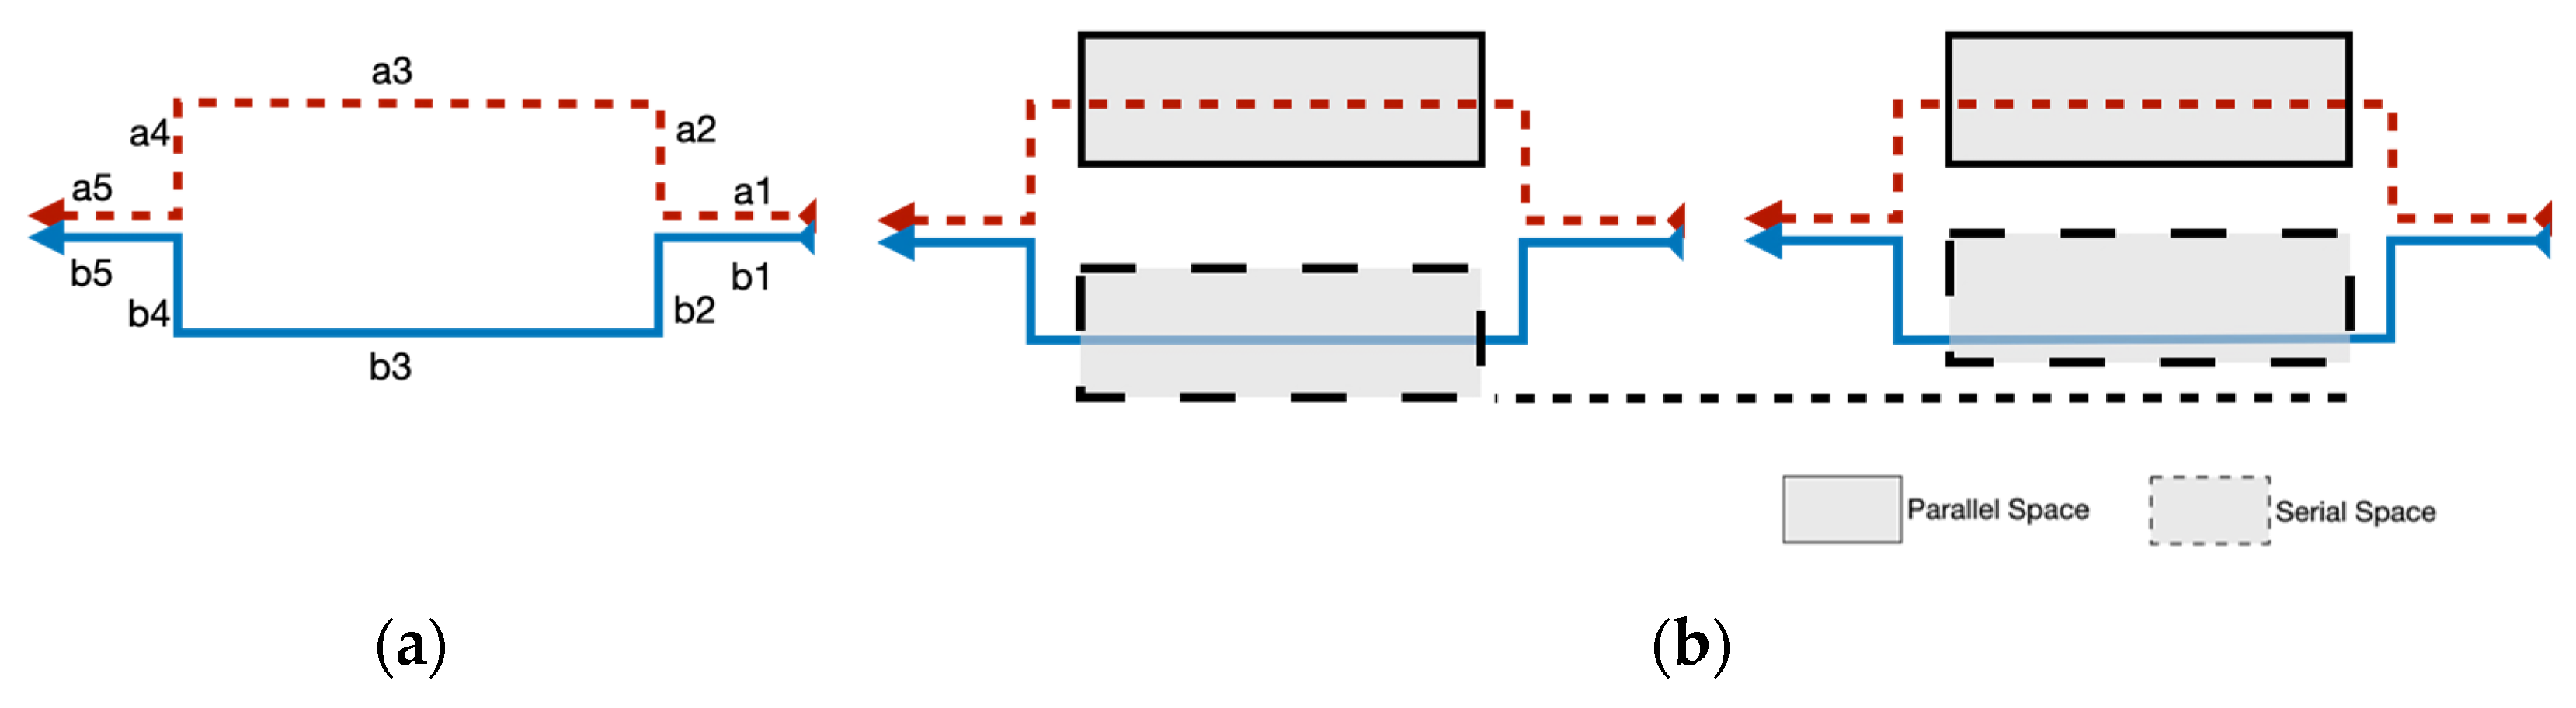
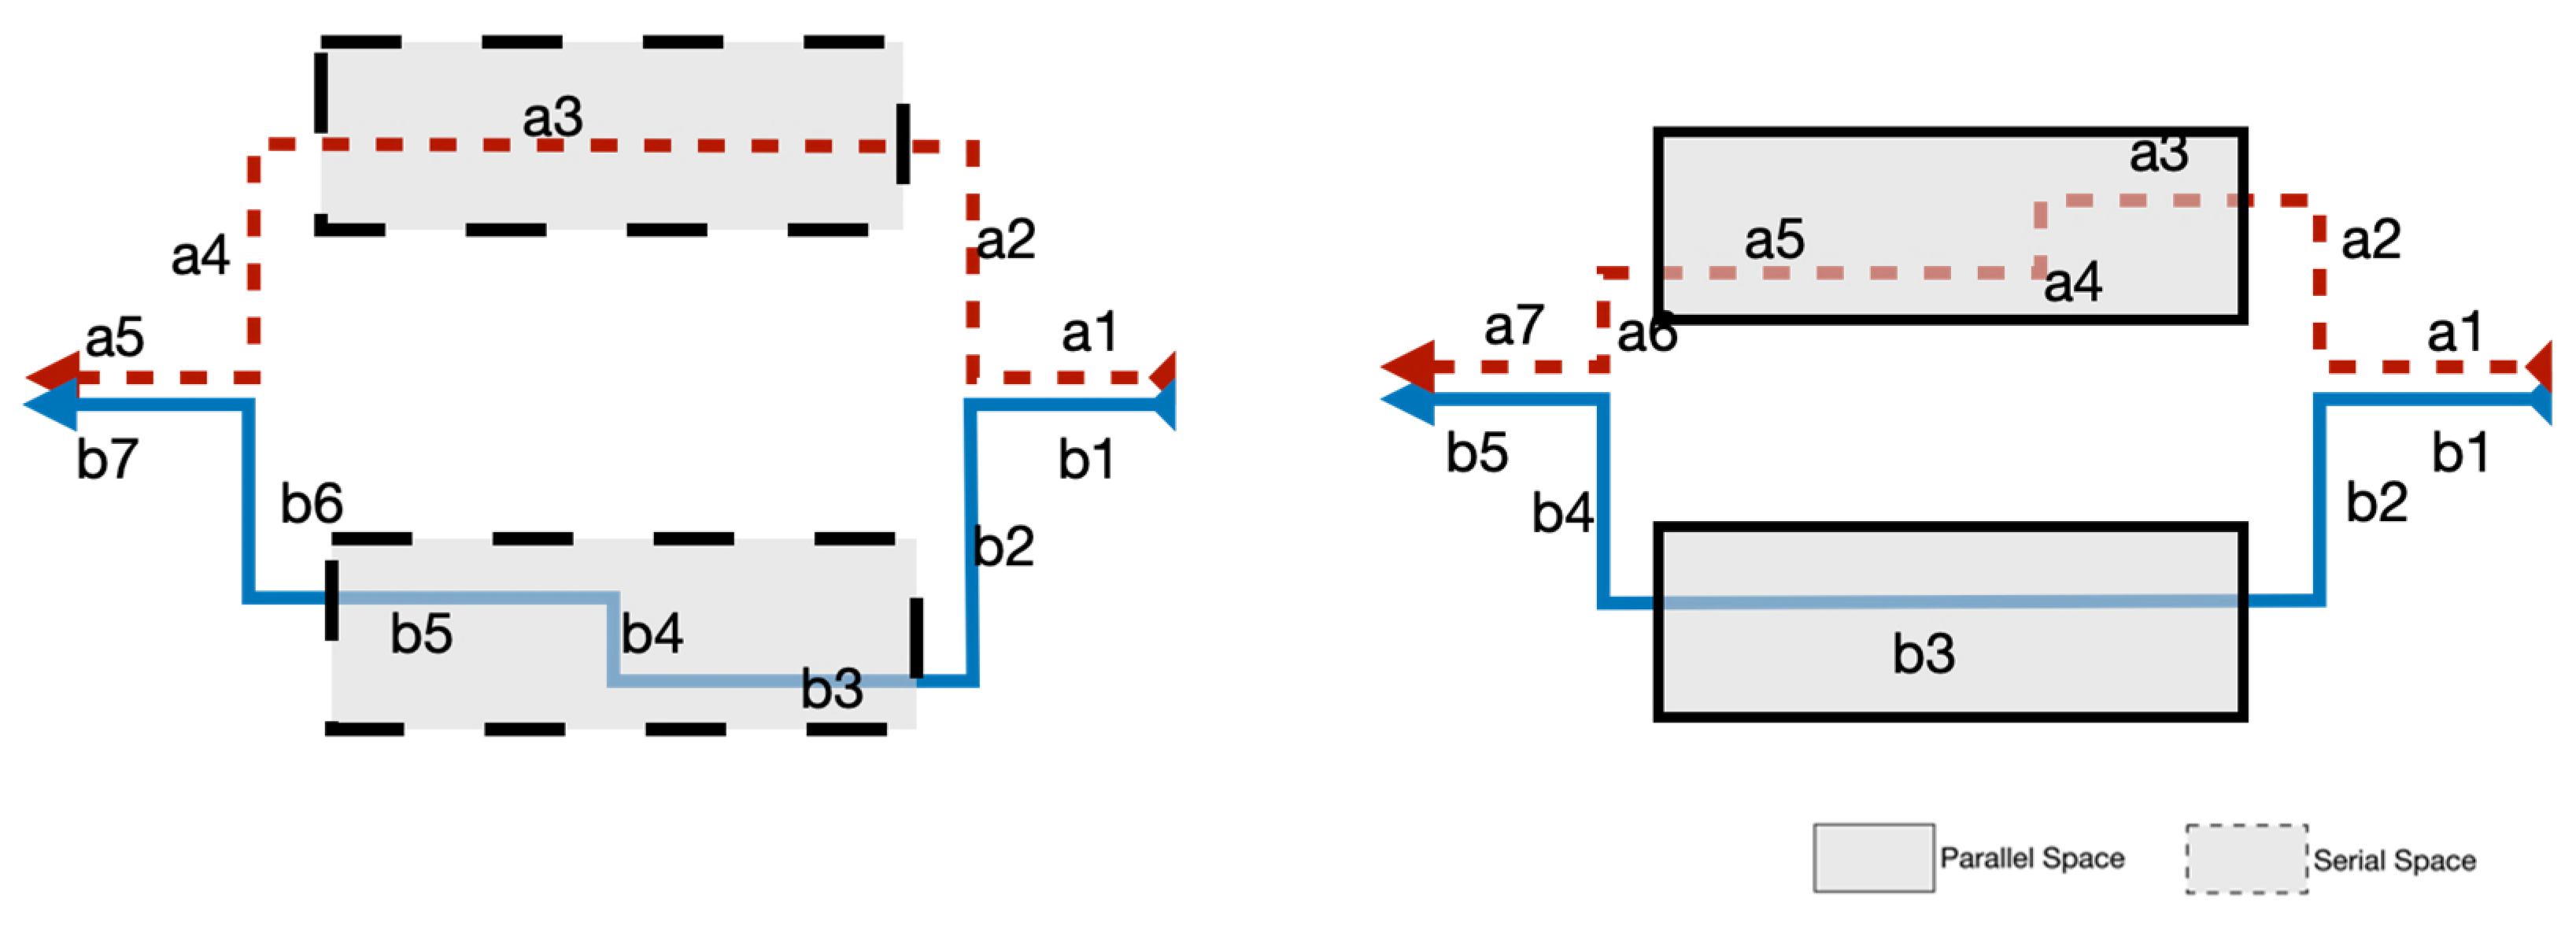
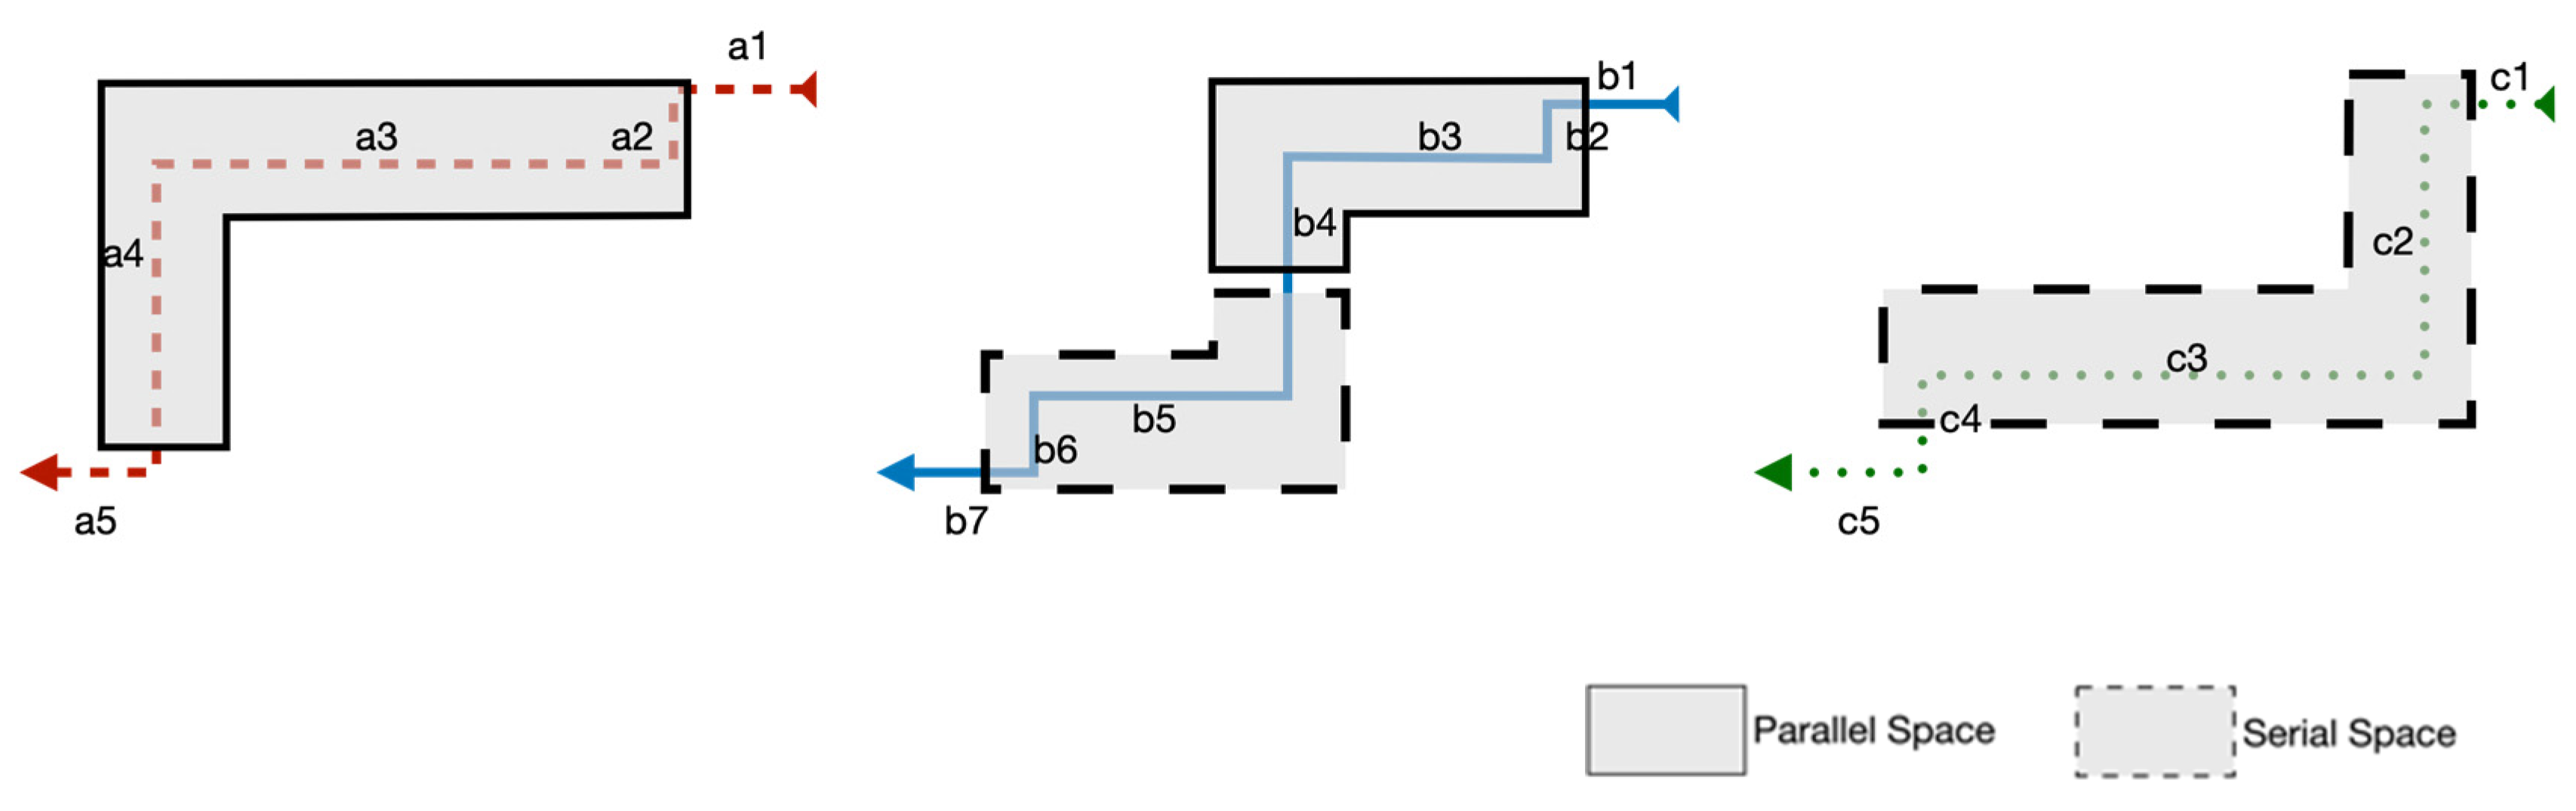
3.4.1. Serial and Parallel Space Configurations with Pedestrian Flow Lines
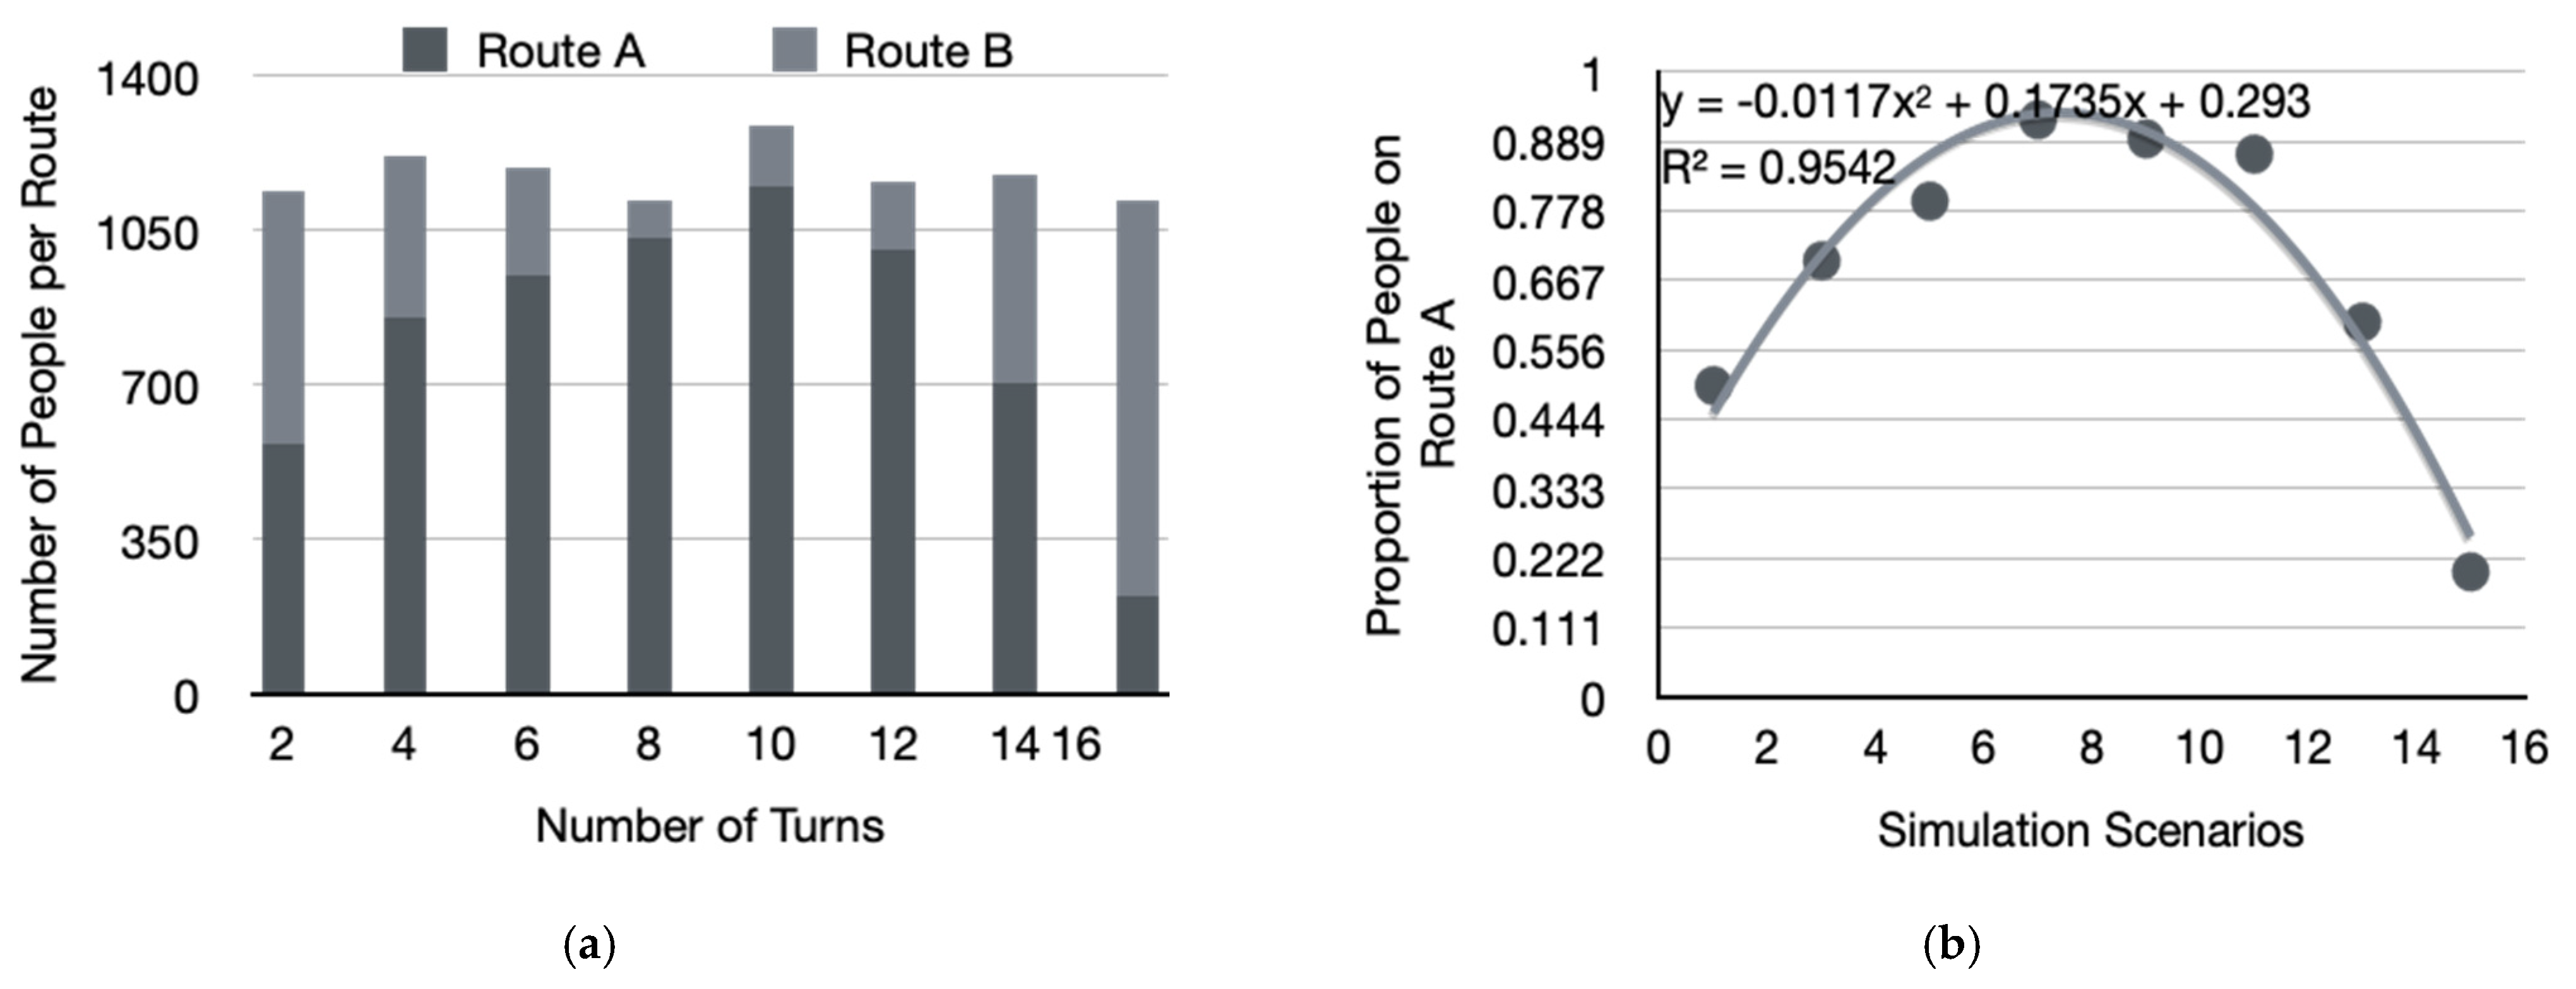
3.4.2. Spatial Turns and Pedestrian Flow Lines
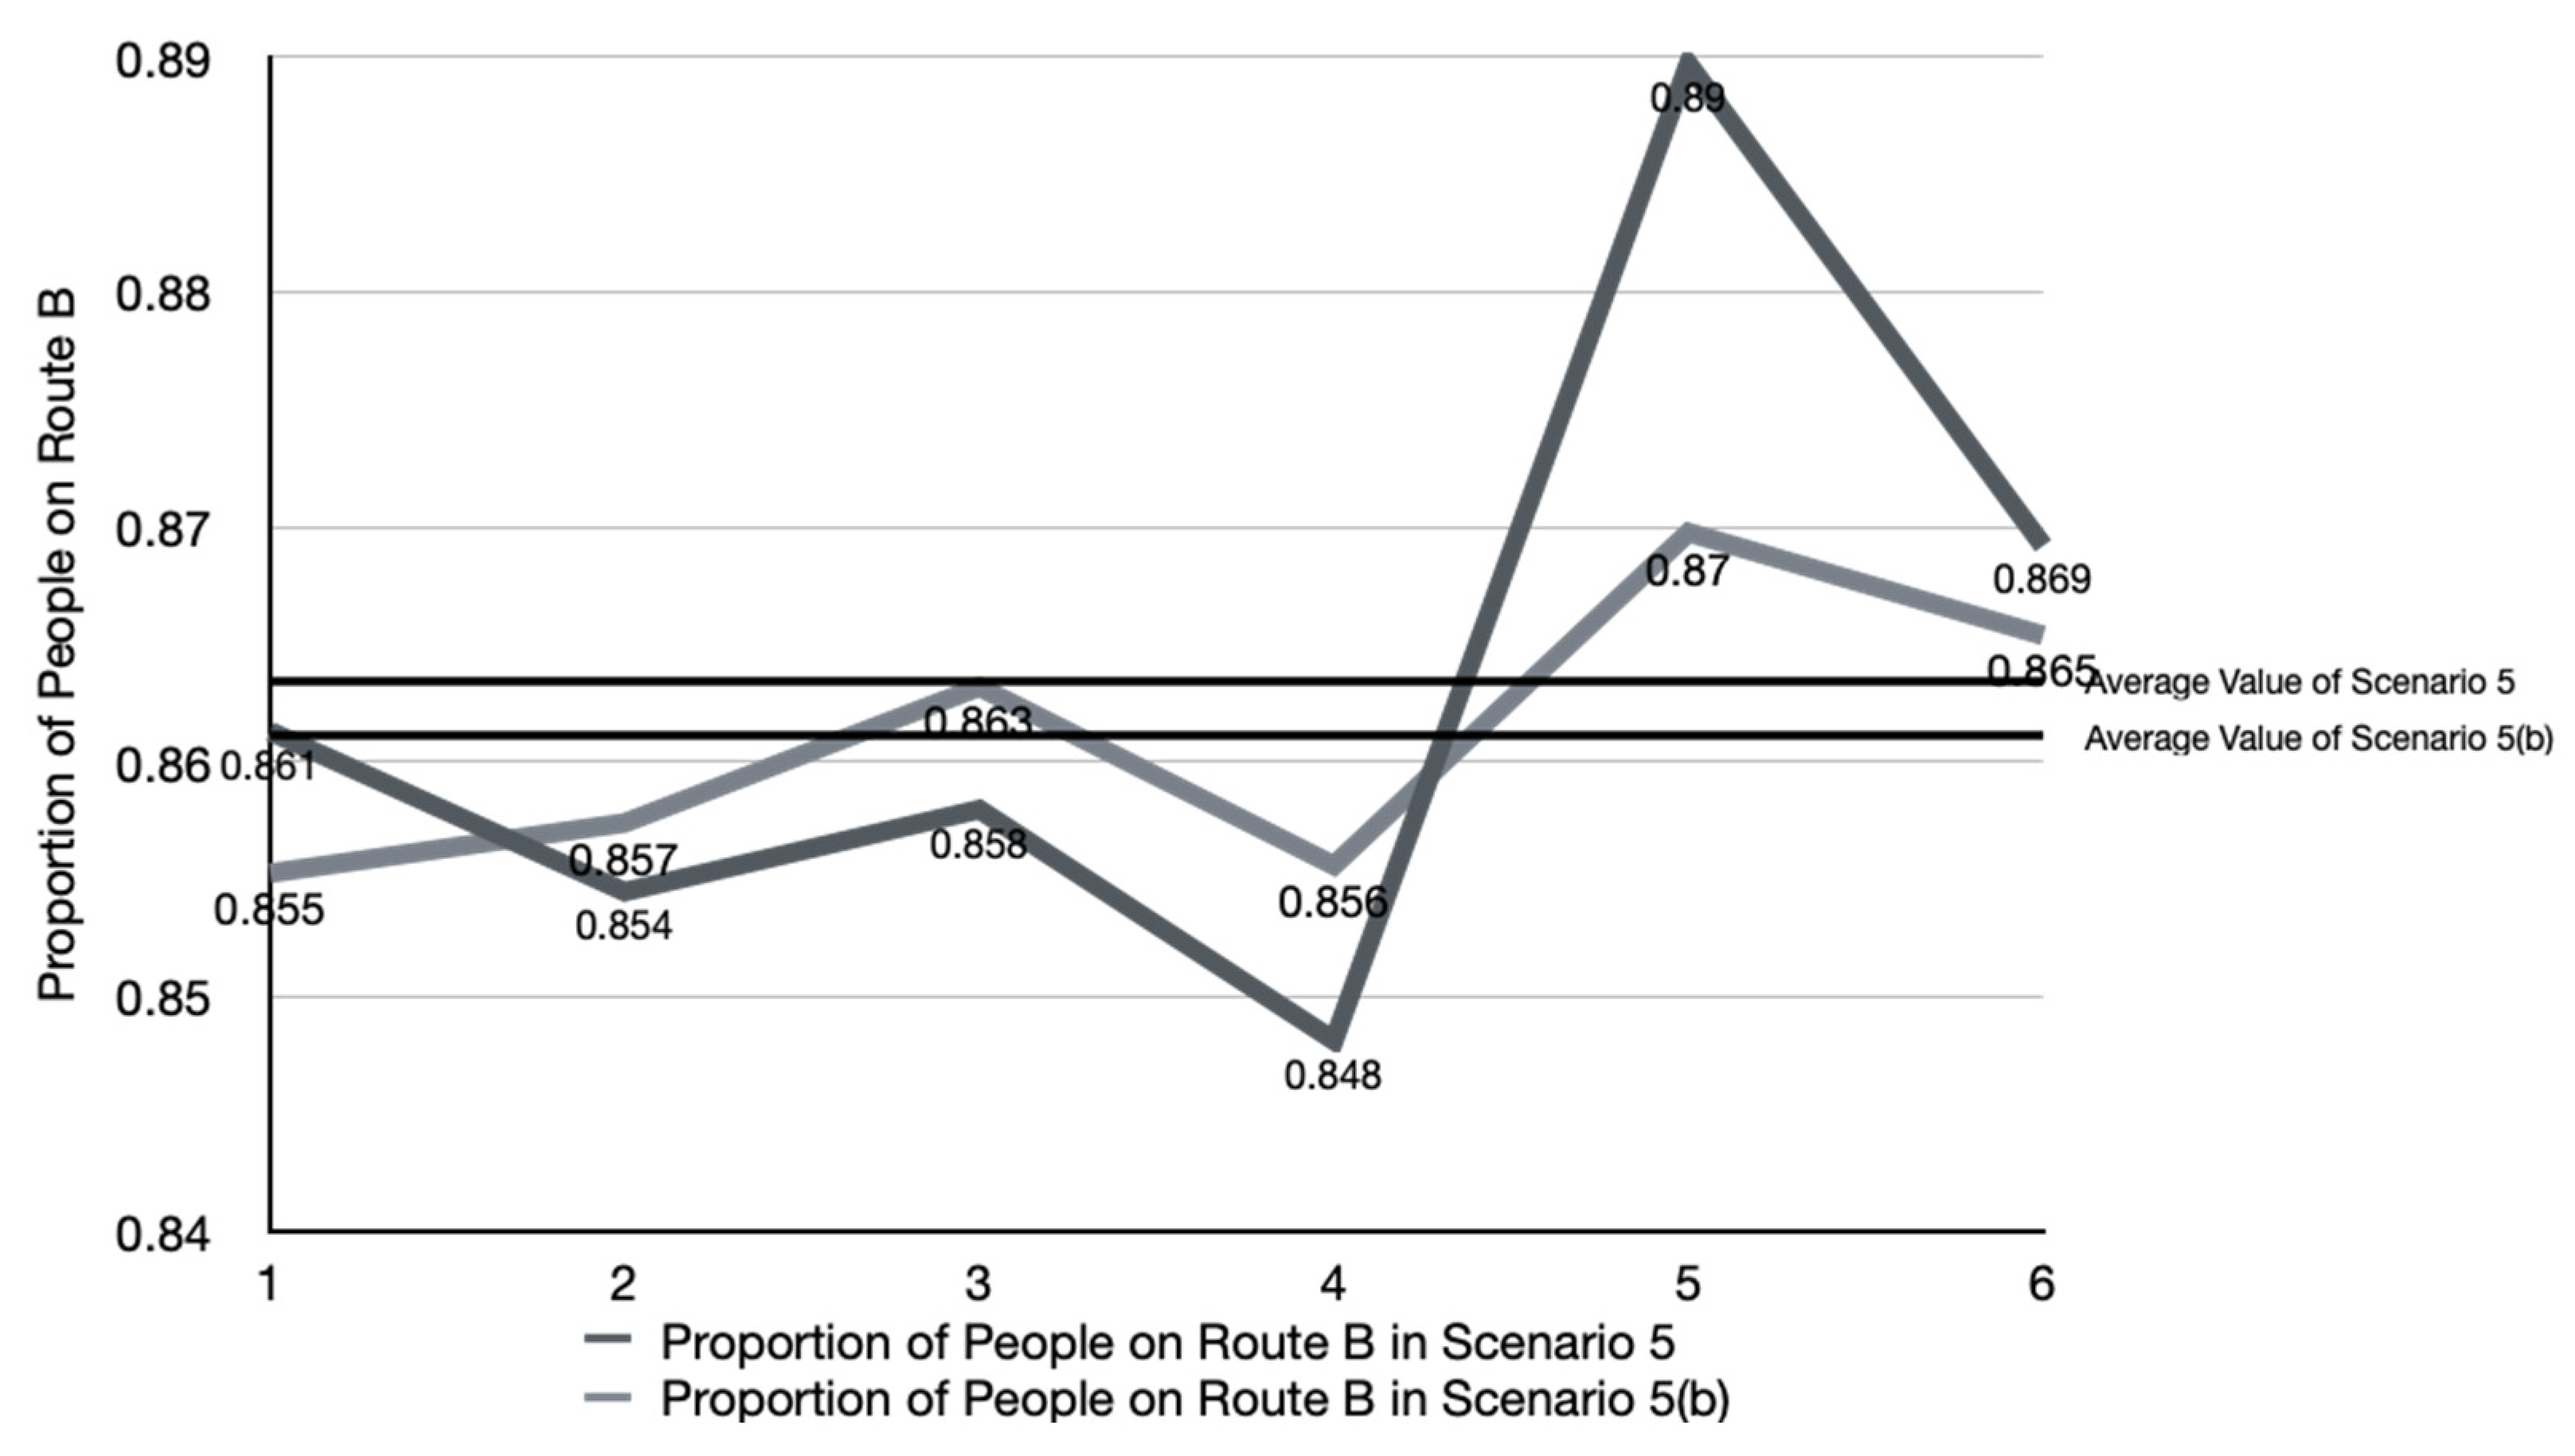
3.4.3. Spatial Variation and Pedestrian Flow Lines
4. Exhibition Design Improvement Suggestions
4.1. Setting Boundaries for Traffic Flow Lines
4.2. Adding Curves and Segments to Traffic Flow Lines
4.3. Diversifying Traffic Spaces
4.4. Node Space Setting Inflections
4.5. Tandem Space Exhibits Are Placed along the Perimeter of the Gallery
5. Conclusions
Author Contributions
Funding
Data Availability Statement
Conflicts of Interest
Appendix A

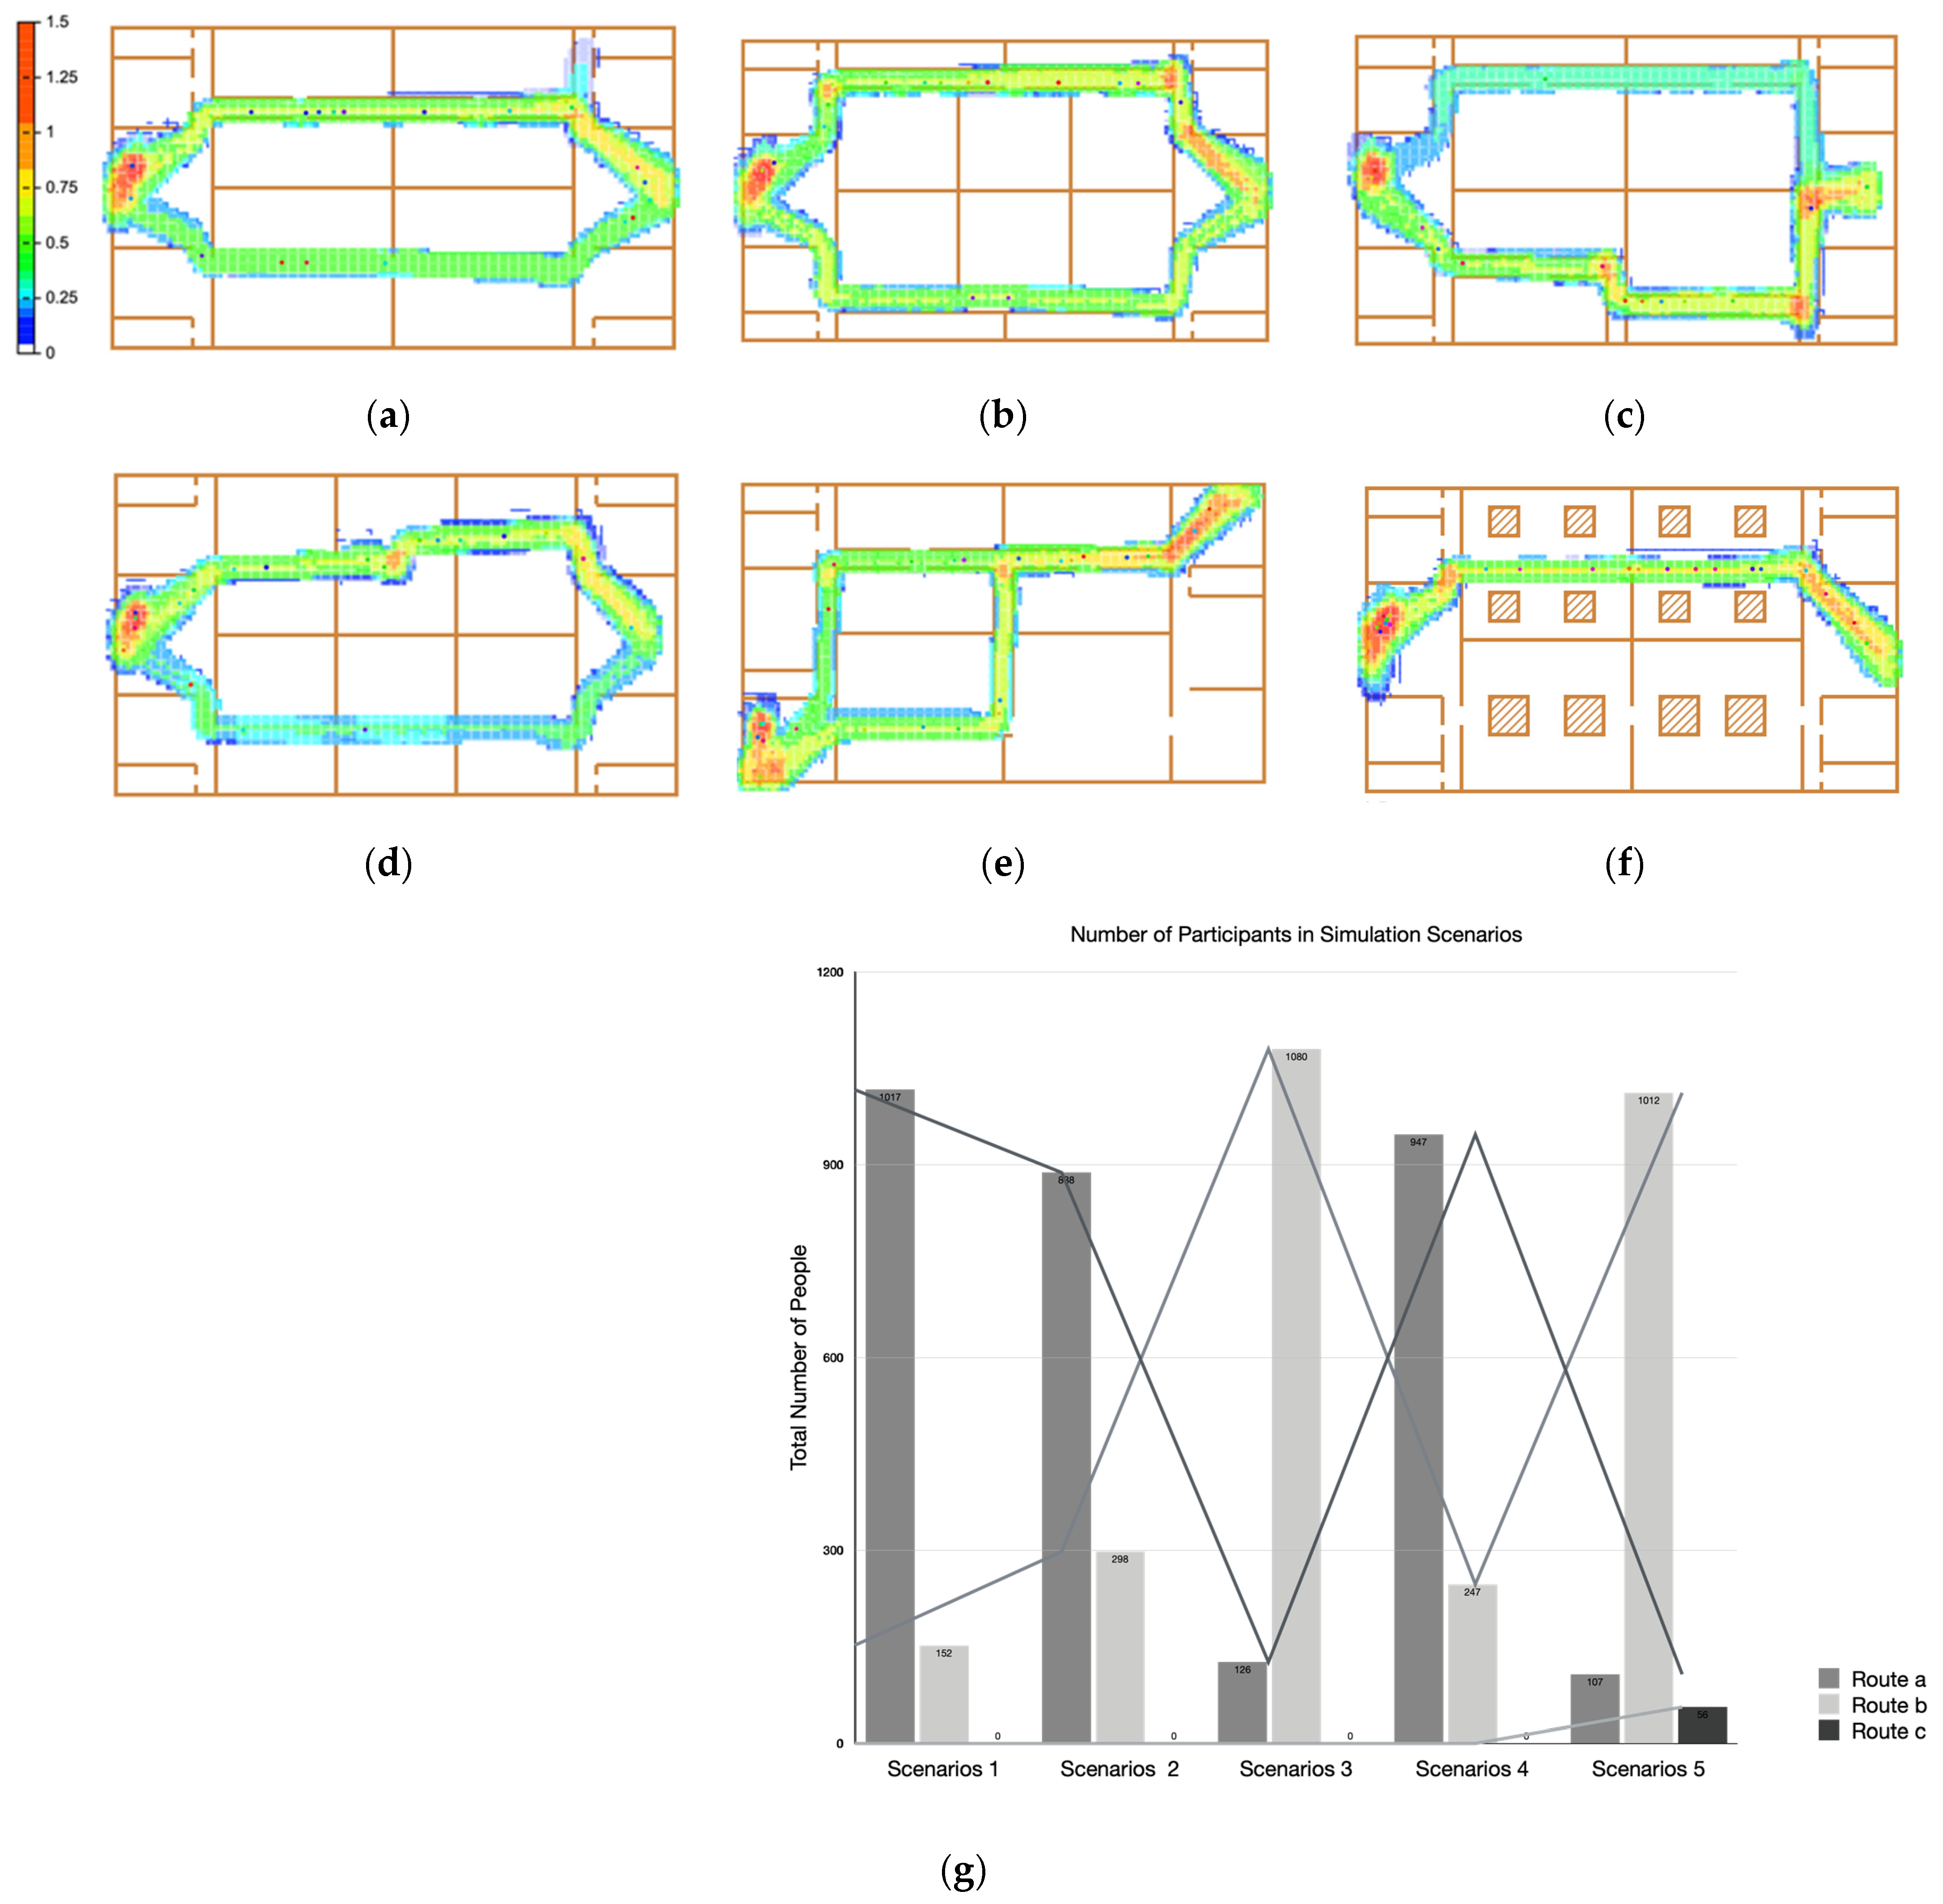
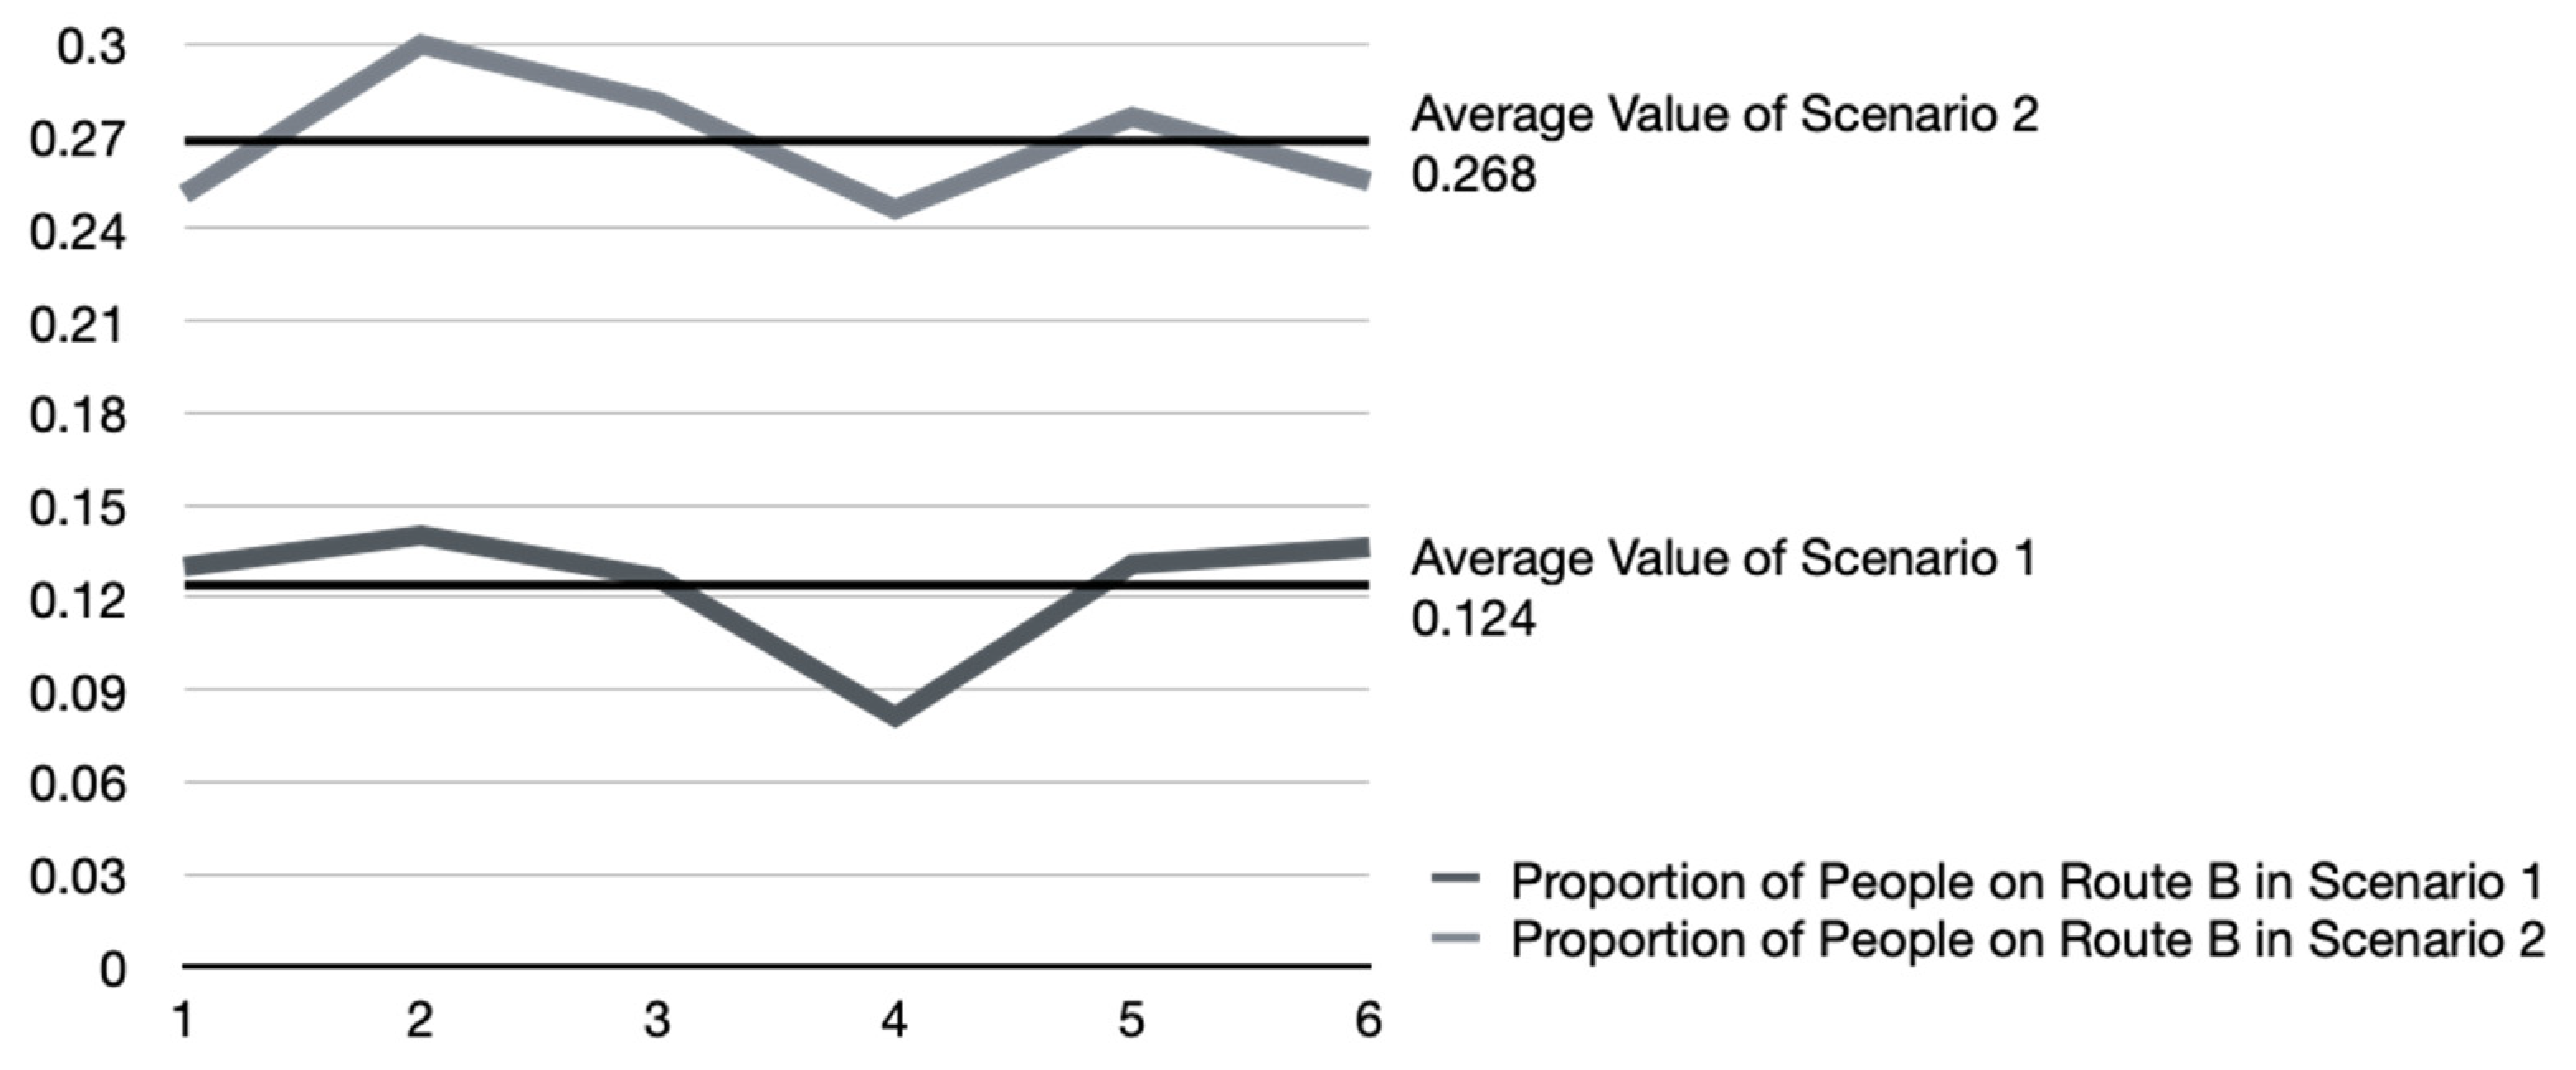
| Experimental Trials | Route A | Route B | Proportion of People on Route B in Scenario 1 |
|---|---|---|---|
| 1 | 1017 | 152 | 0.130025662959795 |
| 2 | 999 | 163 | 0.140275387263339 |
| 3 | 1065 | 154 | 0.126333059885152 |
| 4 | 1108 | 98 | 0.0812603648424544 |
| 5 | 1043 | 157 | 0.130833333333333 |
| 6 | 1083 | 171 | 0.136363636363636 |
| Experimental Trials | Route A | Route B | Proportion of People on Route B in Scenario 2 |
|---|---|---|---|
| 1 | 888 | 298 | 0.251264755480607 |
| 2 | 798 | 342 | 0.3 |
| 3 | 841 | 329 | 0.281196581196581 |
| 4 | 878 | 287 | 0.246351931330472 |
| 5 | 856 | 327 | 0.276415891800507 |
| 6 | 889 | 305 | 0.255443886097152 |
| Number of Turns | Route A | Route B | Proportion of People on Route A |
|---|---|---|---|
| 2 | 568 | 573 | 0.497808939526731 |
| 4 | 851 | 369 | 0.697540983606557 |
| 6 | 947 | 247 | 0.793132328308208 |
| 8 | 1034 | 86 | 0.923214285714286 |
| 10 | 1149 | 138 | 0.892773892773893 |
| 12 | 1009 | 153 | 0.868330464716007 |
| 14 | 705 | 471 | 0.599489795918367 |
| 16 | 224 | 896 | 0.2 |
| Experimental Trials | People on Route A in Scenario 5 | People on Route B in Scenario 5 | People on Route C in Scenario 5 | Proportion of People on Route B in Scenario 5 |
|---|---|---|---|---|
| 1 | 107 | 1012 | 56 | 0.861276595744681 |
| 2 | 128 | 998 | 42 | 0.854452054794521 |
| 3 | 104 | 1057 | 71 | 0.857954545454545 |
| 4 | 118 | 1100 | 79 | 0.848111025443331 |
| 5 | 96 | 1089 | 39 | 0.889705882352941 |
| 6 | 107 | 1103 | 59 | 0.869188337273444 |
| Experimental Trials | People on Route A in Scenario 5 | People on Route B in Scenario 5 | People on Route C in Scenario 5 | Proportion of People on Route B in Scenario 5 |
|---|---|---|---|---|
| 1 | 107 | 963 | 56 | 0.855239786856128 |
| 2 | 128 | 1022 | 42 | 0.85738255033557 |
| 3 | 104 | 1104 | 71 | 0.863174354964816 |
| 4 | 118 | 1167 | 79 | 0.855571847507331 |
| 5 | 113 | 1015 | 39 | 0.869751499571551 |
| 6 | 107 | 1067 | 59 | 0.86536901865369 |
References
- Shin, J. History as an Educational Tool: The Educational Turn of the Bakken Museum. Int. J. Adv. Cult. Technol. 2021, 9, 71–85. [Google Scholar]
- Brownlee, C. Museum Education: Exploring Its Value for Schoolchildren, Teachers and Museum Professionals: A Qualitative Study. Ph.D. Thesis, Queen’s University Belfast, Belfast, UK, 2021. [Google Scholar]
- Nassef, M.; Mohammed, N.; Ibrahim, M. Investigating the Socio-Economic Sustainability within the Egyptian Museums over the Last Decade. Sustainability 2023, 15, 16746. [Google Scholar] [CrossRef]
- Candlin, F.; Ballatore, A.; Larkin, J.; Liebenrood, M.; Poulovassilis, A.; Katerinchuk, V. The UK Museum Boom: Continuity and Change 1960–2019. Cult. Trends 2023. [Google Scholar] [CrossRef]
- Zhang, F.H.; Courty, P. The China Museum Visit Boom: Government or Demand Driven? J. Cult. Econ. 2022, 46, 135–163. [Google Scholar] [CrossRef]
- Xu, H.; Duan, P.F.; Huang, Y.L.; Zhan, X.B. Analysis of Evacuation Efficiency Based on Properties of Construction Materials with Seven Popular Space Combinations in Architecture Design. Appl. Mech. Mater. 2014, 454, 169–174. [Google Scholar] [CrossRef]
- Weng, L.F. Application of Interactive Design in Museum Exhibition. Adv. Soc. Sci. Educ. Humanit. Res. 2018, 103, 497–798. [Google Scholar]
- Pluchino, A.; Garofalo, C.; Inturri, G.; Rapisarda, A.; Ignaccolo, M. Agent-based Simulation of Pedestrian Behaviour in Closed Spaces: A Museum Case Study. J. Artif. Soc. Soc. Simul. 2014, 17, 16. [Google Scholar] [CrossRef]
- Chi, W. A Human-Friendly Intelligent Guidance Robot System in Dynamic Indoor Environments; The Chinese University of Hong Kong: Hong Kong, China, 2017. [Google Scholar]
- Guo, S.; Zheng, X.; Heath, T. Research on the Design of Community Museums Based on the Fuzzy Comprehensive Evaluation Method. Sustainability 2022, 14, 10802. [Google Scholar] [CrossRef]
- Min, X.; Zheng, L.; Chen, Y. The Floor Plan Design Method of Exhibition Halls in CGAN-Assisted Museum Architecture. Buildings 2023, 13, 756. [Google Scholar] [CrossRef]
- Fan, L.P.; Chu, T.H. Optimal Planning Method for Large-Scale Historical Exhibits in the Taiwan Railway Museum. Appl. Sci. 2021, 11, 2424. [Google Scholar] [CrossRef]
- Zhao, R.; Li, X.; Chen, Y.W. The Impact of Plan Form of Circulation Systems in Large-scale Environments on Space Cognition: Case Study in Two Shopping Malls in China. In Proceedings of the 2015 IEEE International Conference on Industrial Engineering and Engineering Management (IEEM), Singapore, 6–9 December 2015. [Google Scholar]
- Ling, W.; Jiao, Z. Predicting Occupants’ Trajectory in University Library from the Perspective of Urban Ergonomics. Archit. J. 2023, 651, 74–78. [Google Scholar]
- Li, Y.; Jia, H.; Li, J.; Gong, J.; Sun, K. Pedestrian Evacuation Behavior Analysis and Simulation in Multi-exits Case. Int. J. Mod. Phys. C 2017, 28, 1750128. [Google Scholar] [CrossRef]
- Camillen, F.; Caprì, S.; Garofalo, C.; Ignaccolo, M.; Inturri, G.; Pluchino, A.; Rapisarda, A.; Tudisco, S. Multi Agent Simulation of Pedestrian Behavior in Closed Spatial Environments. In Proceedings of the 2009 IEEE Toronto International Conference Science and Technology for Humanity (TIC-STH), Toronto, ON, Canada, 26–27 September 2009. [Google Scholar]
- Kleczek, P.; Was, J. Simulation of Pedestrians Behavior in a Shopping Mall. In International Conference on Cellular Automata; Springer International Publishing: Cham, Switzerland, 2014; Volume 8751. [Google Scholar]
- Zhao, X.; Moon, J. Analysis of Urban Spatial Accessibility of Museums within the Scope of Seoul. Buildings 2022, 12, 1749. [Google Scholar] [CrossRef]
- Todorov, V.; Dimov, I. Unveiling the Power of Stochastic Methods: Advancements in Air Pollution Sensitivity Analysis of the Digital Twin. Atmosphere 2023, 14, 1078. [Google Scholar] [CrossRef]
- Todorov, V.; Dimov, I.T.; Ostromsky, T.; Zlatev, Z.; Georgieva, R.; Poryazov, S.A. Optimized Quasi-Monte Carlo Methods Based on Van der Corput Sequence for Sensitivity Analysis in Air Pollution Modelling. In Studies in Computational Intelligence; Spring: Berlin/Heidelberg, Germany, 2021. [Google Scholar]
- Gievska, S.; Lameski, P. Knowledge-Based Approach to Modeling Urban Dynamics. In Distributed, Ambient and Pervasive Interactions, Proceedings of the 5th International Conference, DAPI 2017, Vancouver, BC, Canada, 9–14 July 2017; Lecture Notes in Computer Science; Streitz, N., Markopoulos, P., Eds.; Springer: Berlin/Heidelberg, Germany, 2017; Volume 10291. [Google Scholar]
- Hong, I.; Jung, W. Application of gravity model on the Korean urban bus network. Phys. A Stat. Mech. Its Appl. 2016, 462, 48–55. [Google Scholar] [CrossRef]
- Lopez Baeza, J.; Carpio-Pinedo, J.; Sievert, J.; Landwehr, A.; Preuner, P.; Borgmann, K.; Avakumović, M.; Weissbach, A.; Bruns-Berentelg, J.; Noennig, J.R. Modeling Pedestrian Flows: Agent-Based Simulations of Pedestrian Activity for Land Use Distributions in Urban Developments. Sustainability 2021, 13, 9268. [Google Scholar] [CrossRef]
- Sagredo-Olivenza, I.; Cárdenas-Bonett, M.; Gómez-Sanz, J.J. Using Queueing Networks to Approximate Pedestrian Simulations. In Distributed Computing and Artificial Intelligence, Special Sessions, Proceedings of the 15th International Conference, DCAI 2018, Toledo, Spain, 20–22 June 2018; Advances in Intelligent Systems and Computing; Rodríguez, S., Prieto, J., Faria, P., Kłos, S., Fernández, A., Mazuelas, S., Jiménez-López, M.D., Moreno, M.N., Navarro, E.M., Eds.; Springer: Berlin/Heidelberg, Germany, 2019; Volume 801. [Google Scholar]
- Ilachinski, A. Cellular Automata: A Discrete Universe; World Scientific Publishing Co., Inc.: Hackensack, NJ, USA, 2001. [Google Scholar]
- Maerivoet, S.; Moor, B.D. Cellular automata models of road traffic. Phys. Rep. 2005, 419, 1–64. [Google Scholar] [CrossRef]
- Dirk, H.; Peter, M. Social force model for pedestrian dynamics. Phys. Rev. E 1995, 51, 4282. [Google Scholar]
- Chen, X.; Treiber, M.; Kanagaraj, V.; Li, H. Social force models for pedestrian traffic–state of the art. Transp. Rev. 2018, 38, 625–653. [Google Scholar] [CrossRef]
- Moreno, J.C.; Puzzo, M.L.R.; Paul, W. Collective dynamics of pedestrians in a corridor: An approach combining social force and Vicsek models. Phys. Rev. E 2020, 102, 022307. [Google Scholar] [CrossRef]
- Hui, T.; Jin, C.J.; Li, D. Evaluation of the Simulation Results of Pedestrian Bottlenecks Performed by Different Software. In Proceedings of the 2021 6th International Conference on Intelligent Transportation Engineering (ICITE 2021), Beijing, China, 29–31 October 2021; Lecture Notes in Electrical Engineering; Zhang, Z., Ed.; Springer: Singapore, 2022; Volume 901. [Google Scholar]
- Shi, X.; Xue, S.; Feliciani, C.; Shiwakoti, N.; Lin, J.; Li, D.; Ye, Z. Verifying the applicability of a pedestrian simulation model to reproduce the effect of exit design on egress flow under normal and emergency conditions. Phys. A Stat. Mech. Its Appl. 2021, 562, 125347. [Google Scholar] [CrossRef]
- Uteng, T.P.; Taylor, D. An Assessment of the Available Simulation Models for the Planning and Design of Safe Urban Intersections for Pedestrians and Cyclists. Norwegian Centre for Transport Research. 2015. Available online: https://www.toi.no/publications/an-assessment-of-the-available-simulation-models-for-the-planning-and-design-of-safe-urban-intersections-for-pedestrians-and-cyclists-article33828-29.html (accessed on 13 March 2024).
- Watts, J.D.; Strogatz, H.S. Collective Dynamics of ‘small-world’ Networks. Nature 1998, 393, 440–442. [Google Scholar] [CrossRef] [PubMed]
- Kim, H.; Yeo, Y. A Study on Public Space Design Strategies in Japanese National Museums—Focusing on the National Museum of Western Art and the National Art Center in Tokyo. J. Asian Archit. Build. Eng. 2019, 18, 124–130. [Google Scholar] [CrossRef]
- Bondarenko, I.; Wang, Z.; Ieremenko, I.; Bondarenko, K. The Selected Architectural Solution of Modern Museums in China in the Aspect of Manifestation of Traditional Culture. Archit. Civ. Eng. Environ. 2020, 13, 17–26. [Google Scholar] [CrossRef]
- Xu, H.; Mamat, M.J. Showcasing Tradition, Innovative Design Regional Culture in Chinese Museum Interiors. Migr. Lett. 2023, 20, 1388–1400. [Google Scholar]
- Hennings, A. The National Museum of China: Building Memory, Shaping History, Presenting Identity. Ph.D. Thesis, Faculty of Arts, Institute of Art History of East Asia, Heidelberg University, Heidelberg, Germany, 2013. [Google Scholar]
- Bo, Z. Discussion on Display and Exhibition Design of Modern Museums; ASME: New York, NY, USA, 2020. [Google Scholar]
- Lee, J. Assessment of pedestrian comfort levels based on the microscopic features of pedestrian traffic flow. J. Korean Soc. Transp. 2016, 34, 499–509. [Google Scholar] [CrossRef]
- Asano, M.; Iryo, T.; Kuwahara, M. Microscopic Pedestrian Simulation Model Combined with a Tactical Model for Route Choice Behaviour. Transp. Res. C Emerg. Technol. 2010, 18, 842–855. [Google Scholar] [CrossRef]
- Xu, L.; Yan, S.; Chen, Z.; Chen, X. Design of the Museum Interactive Lighting System Based on the Digital Twin Technology. Sci. Program. 2021, 2021, 4824417. [Google Scholar] [CrossRef]
- Man, S.H.; Gao, Z. Digital Immersive Interactive Experience Design of Museum Cultural Heritage Based on Virtual Reality Technology. J. Electron. Imaging 2023, 32, 11208. [Google Scholar] [CrossRef]
- Liu, Q.; Zhai, H.; Liu, Q.; Zhai, H. Research on Public Culture Space from the Perspective of Environmental Behavior. In Proceedings of the 3rd International Conference on Power and Energy Systems (PES 2016), Bangkok, Thailand, 30–31 December 2016; Volume 4, pp. 157–162. [Google Scholar]


| Model | Individual Description | Motion Rules | Simulation Density | Computational Capability |
|---|---|---|---|---|
| Cellular Automaton Model | Pedestrians are treated as “cells” with fixed dimensions. | The setting of pedestrian motion rules exhibits discrete characteristics, lacking relatively reasonable explanations. | Parameter settings are restricted, with insufficient capacity for detailed description, resulting in lower simulation accuracy | Fast computational speed, high efficiency, and minimal resource consumption. |
| Social Force Model | Pedestrians are abstracted as ellipses, with adjustable dimensions. | The forces acting on pedestrians have practical significance and provide explanations for pedestrian walking characteristics. | Parameter settings are flexible, with strong capabilities for micro-level behavior description, resulting in high simulation accuracy | The model’s computational speed is significantly influenced by the number of pedestrians, requiring high hardware specifications. |
| Software Name | Modeling Method | Input Information | Output Information | Development Performance | Application Field |
|---|---|---|---|---|---|
| AnyLogic | Social Force Model | Create environment objects and set attributes. | Animation, pedestrian count, average density, spatial cross-section, pedestrian flow, etc. | Has an open structure and requires secondary development. | Pedestrian traffic, logistics industry, and construction industry |
| VisWalk | Social Force Model | Create environment and set properties, establish origin-destination table for agents, and define other parameters. | Pedestrian density, walking time, evacuation time, walking speed, space utilization rate, etc. | Has secondary development capabilities but with certain limitations. | Applications related to pedestrian traffic simulation |
| Urban Analytics Framework | Social Force Model | Building space layout, physical radius of entities, lateral sway displacement of pedestrians, composition of pedestrian flow, and walking parameters | Pedestrian walking paths, walking speed, traffic flow density, queue length, and queue delay | Can incorporate auxiliary plugins | Urban space design and transportation operation evaluation |
| Name | Floor Circulation Pattern | Spatial Combination | Example |
|---|---|---|---|
| Serial (Including Hall-Style) | 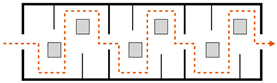 | 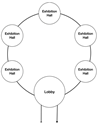 | Jixi Museum, Qingdao Museum, Jingzhou Museum, Guangdong Museum, New Pavilion of Guizhou Museum, Hong Kong Museum of History, Capital Museum, Tianjin Museum, Hainan Provincial Museum. |
| Parallel | 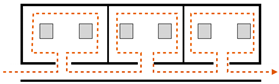 | 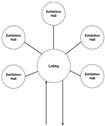 | Hubei Provincial Museum, Shanxi Museum, Inner Mongolia Museum, Jilin Provincial Museum, Changzhou Museum, Wuxi Museum, Zhejiang Museum, Fujian Museum, Jiangxi Museum, Shandong Provincial Museum, Liuzhou Museum. |
| Combined | 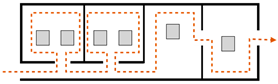 |  | Suzhou Museum, Shenzhen Museum, National Museum of China, Hebei Provincial Museum, Henan Provincial Museum, Luoyang Museum, Nanjing Museum. |
Disclaimer/Publisher’s Note: The statements, opinions and data contained in all publications are solely those of the individual author(s) and contributor(s) and not of MDPI and/or the editor(s). MDPI and/or the editor(s) disclaim responsibility for any injury to people or property resulting from any ideas, methods, instructions or products referred to in the content. |
© 2024 by the authors. Licensee MDPI, Basel, Switzerland. This article is an open access article distributed under the terms and conditions of the Creative Commons Attribution (CC BY) license (https://creativecommons.org/licenses/by/4.0/).
Share and Cite
Liu, Y.; Chen, L.; Xu, Y.; Yang, J. Exhibition Space Circulation in Museums from the Perspective of Pedestrian Simulation. Buildings 2024, 14, 847. https://doi.org/10.3390/buildings14030847
Liu Y, Chen L, Xu Y, Yang J. Exhibition Space Circulation in Museums from the Perspective of Pedestrian Simulation. Buildings. 2024; 14(3):847. https://doi.org/10.3390/buildings14030847
Chicago/Turabian StyleLiu, Yuzhe, Libo Chen, Yusu Xu, and Jingqiu Yang. 2024. "Exhibition Space Circulation in Museums from the Perspective of Pedestrian Simulation" Buildings 14, no. 3: 847. https://doi.org/10.3390/buildings14030847
APA StyleLiu, Y., Chen, L., Xu, Y., & Yang, J. (2024). Exhibition Space Circulation in Museums from the Perspective of Pedestrian Simulation. Buildings, 14(3), 847. https://doi.org/10.3390/buildings14030847