Article

Analysis of Fatal Construction Accidents in Indonesia—A Case Study

by
Theresia Avila Bria
1,2,
Wei Tong Chen
1,3,*,
Mubasher Muhammad
3 and
Melati Balla Rantelembang
3
1
Graduate School of Engineering Science and Technology, National Yunlin University of Science and Technology, Douliu 64002, Taiwan
2
Department of Civil Engineering, State Polytechnic of Kupang, Kupang City 85361, Indonesia
3
Department of Civil and Construction Engineering, National Yunlin University of Science and Technology, Douliu 64002, Taiwan
*
Author to whom correspondence should be addressed.
Buildings 2024, 14(4), 1010; https://doi.org/10.3390/buildings14041010
Submission received: 5 March 2024 / Revised: 3 April 2024 / Accepted: 3 April 2024 / Published: 5 April 2024
(This article belongs to the Special Issue Inclusion, Safety, and Resilience in the Construction Industry)

Abstract

:
Booming demand for facilities and infrastructure in Indonesia has led to an increase in construction-related accidents. Court rulings provide valuable data on accident circumstances, which can help improve safety standards. Although information on these accidents is scarce and not systematically consolidated, effective data gathering and analysis can lead to better safety outcomes. This study analyzes 150 court rulings in construction industry accident cases and their related decision frameworks to identify seven risk categories using scenario analysis. The correlative patterns and their associated significance are explored via descriptive statistical analysis, and four categories, namely project, task, accident, and medium, were found to be correlated. The results of the cross-tabulation test between two categories were used to highlight correlated categories. Toll road works accounted for 52% of accident cases, with collisions with construction machinery being the most frequent accident type (36%, 76 cases). Lifting and moving goods had respective phi and Cramer values of 0.534 and 0.001. It is obvious that future safety improvement efforts should focus on roadway projects and utilizing construction vehicles for transportation and lifting work. This can be achieved through increased regulatory compliance, proper utilization of standard operating procedures (SOPs), and ensuring vehicle suitability. The results of this study are highly relevant to workplace health and safety officers and risk management personnel.

1. Introduction

1.1. Background

Structural development is an indicator of economic growth, and as such, development is heavily reliant on the construction industry, which requires significant levels of industrial coordination. Population increases generally drive an increased need for facilities and infrastructure while increasing employment in the construction industry. As demand for facilities and infrastructure grows, so does the demand for infrastructure to support the growth process. This dual effect is accompanied by an increase in demand for skilled and unskilled labor and, regrettably, construction-related accidents. In terms of overall worker safety, the global construction industry is one of the most hazardous [1].
Many studies have already highlighted the need for increased work safety standards. Such risks, however, are not always direct. Elsebaei et al. [2] showed that occupational health and safety issues also arise as side effects of the construction industry. To overcome this, many efforts have been made to improve construction safety, such as improvements to and implementation of safety measurements [3], safety programs [4], human factors [5], and BIM methods [6]. Several studies related to work safety [7] have been conducted over the last few decades, yet worksite accidents and injuries are still frequent [8]. Reports from the International Labor Organization (ILO) [9] show that, globally, around 2.78 million construction workers die each year from work-related accidents or illnesses.
With 277 million people, Indonesia is the world’s fourth most populous country (Figure 1) [10], and its rapidly transforming economy has created huge demand for infrastructure development and improvement, thereby drawing significant amounts of labor into the construction sector, further exacerbating the risk of construction accidents. Data from Indonesia’s Employment Social Security Administering Agency (BPJS) showed 265,334 construction accidents in November 2022, representing a 13.26% increase from the previous year [11]. Based on an ILO [9] review, Indonesia accounted for nearly 4.2% of global construction industry accidents in 2019, despite accounting for less than 3.5% of the global population, and this trend has continued to exacerbate since then [11]. This indicates an urgent and persistent need for improvements to working conditions, planning, and risk anticipation and mitigation.
Several courses of action have been suggested to improve safety in the construction industry [12]. The current safety management literature is based on highly credible data, and it contributes strongly to the development of risk management best practices [13]. However, further research and improvements are needed. For the best effect, accident and safety data must be sourced as close to the cause of the problem as possible, but, to date, no studies have used workplace safety decisions from Indonesia’s Construction Accident Court Decisions (CACD) as a potential data source. Several case studies have indicated the value of court decision data. Chong and Low [14] used statistical data analysis of court decisions to survey safety and health conditions in Malaysia’s construction industry. Birganoul et al. [15] used court case data to test the reliability accuracy of a scheme to evaluate the causes of fall accidents with error rates in different scenarios. Li [16] used court decision data to highlight construction accident compensation based on interpretations using mathematical modeling. Li et al. [17] analyzed the impact of 3000 court compensatory rulings on accident prevention in Hong Kong’s construction industry. Davis and Akenhead [18] used autoactivate analysis to reveal the importance of court data as a reference in construction, engineering, and IT disputes. CACD rulings have lasting legal implications for the construction industry, safety regulations, and general worksite practices. Therefore, court decision data may offer useful insight into the causes of workplace accidents, allowing for the re-classification of accident characteristics. It is hoped that these data can be used to describe accidents from the perspective of project categories that dominate accident numbers, causes of accidents, media that cause accidents, or other important project implementation elements. Accordingly, this study used CACD data to categorize accidents and generate a series of sub-categories from which one can derive the relationships between various factors. Court data also reflect permanent legal force [19]; thus, an accident analysis based on such data will reflect the most accurate scenario characteristics. Such accuracy should improve research outcomes and validity, potentially contributing to the development of strategies that effectively reduce risk [20].
This study presents a scenario analysis to identify characteristics requiring greater detail, followed by a descriptive statistical analysis to describe categories with strong correlations and explain the relationships between the categories and sub-categories. This analytical process is applied to highly accurate and actionable court decision data based on situational characteristics to determine key characteristics of construction site accidents, as shown in Figure 2. Although court decisions are secondary data, they are expertly curated and have yet to be used in previous research to explore worksite accident characteristics to enhance accident prediction and mitigation [21].

1.2. Research Objective and Gaps

This research develops an alternate approach to construction workplace safety protocols based on court decision data and represents the first such effort to apply this data source in the field of safety management. Accurately translated court decision data, scenario analysis, and descriptive statistics are used to show the correlative relationship between accident categories and reveal valuable workplace safety information.
Various research papers have examined construction worksite accident records to identify accident characteristics and safety protocol weaknesses. However, many checks on large projects, such as bridge construction, are still conducted manually [22], as are records related to building fires [23]. There is a distinct need for standardized and structured reporting mechanisms, hence this study’s initial reliance on CACD. This kind of reporting relies on strong confirmation rather than standard types of reporting that require further validation and standardization processes to allow for effective data integration and analysis [24]. Li et al. [25] and Olcay et al. [26] demonstrated the potential value of court decisions as an alternative data source for worksite accidents in different national contexts, and Asibey et al. [27] encouraged the use of court decisions as a means of determining fair compensation for accident victims. Li [15] used mathematical modeling to highlight the utility of court data to calculate financial losses due to construction accidents, and Li et al. [16] used court decisions to identify legal loopholes for potential exploitation in minimizing accident compensation risk. Davis and Akenhead [18] used an autoreactive analysis to demonstrate the effective application of court case data in resolving worksite accident disputes. However, no prior research has applied Indonesia’s CACD data in assessing construction safety, and these decisions are potentially a valuable source of insight for the development of new safety improvements. This paper applies CACD data to clarify the key characteristics of common construction accidents, thereby providing valuable insights for workplace health and safety professionals and presenting a new, potentially useful data source for future research in occupational hazards.

2. Literature Review

To obtain the initial appropriate hazard characteristics, several studies, theories, and important terms were analyzed to clarify the research path.

2.1. Worksite Accidents

According to the International Labor Office (ILO) (1989), an accident is an unplanned and uncontrolled event caused by humans, situations, environmental factors, or a combination of these factors that disrupts the work process and may (or may not) cause injury, illness, death, property damage, or other undesirable side effects [28]. Heinrich defines an accident as an unplanned and uncontrolled event that is an action or reaction from an object, substance, human, or radiation that can cause injury [29]. Accidents can occur either in or outside work hours, and accidents can be classified into several types, as shown in Table 1.
Worksite accidents can be effectively described in terms of a mechanistic theory. Two common approaches are as follows:
  • Chain-of-Events: This theory states that accidents sometimes occur due to a chain of activities connected in a series. Each link in the chain is an important component, and thus, each link is a potential target for accident prevention [28].
  • Domino Theory: Heinrich’s Domino Theory suggests that an accident can be described as one of five factors in a sequence that results in injury or loss [30]. The Domino Model proposes that bad habits can lead to unsafe actions, thereby raising physical or mechanical risks for accidents. The Domino Model proposes that through inherited or acquired vices, people can commit an unsafe act, which leads to a physical or mechanical risk, which in turn leads to a dangerous accident.
Noor [31] attributes workplace accidents to the following two main causes:
  • Immediate Causes: These are actions or situations that have the direct potential to cause a worksite accident. The direct cause is due to unsafe acts on the part of workers, unsafe worksite conditions, or some combination of the two. Project workers frequently describe unsafe conditions as precursors to an increased accident rate.
  • Indirect Causes: These are activities or situations that can indirectly create a risk that later leads to an accident. Indirect causal factors can be work-related or personal.
McKinnon [32] ranks workplace accidents causing injuries to workers (personal injuries) into the following four categories:
  • Death: This is the worst possible result of an accident, namely the death of a project worker.
  • Permanent Total Disability (PTD): This is any injury from which the victim cannot effectively recover and causes a permanent inability to work.
  • Permanent Partial Disability (PPD): These are injuries that cannot be healed and result in workers losing partial bodily function.
  • Non-permanent Total Disability (TTD): These are injuries that do not result in death or permanent damage but leave workers effectively unable to work effectively for several days.
Using information from the ILO and the research results of Wijaya et al. [33], the combined findings are presented in Table 2.
The International Labor Office (1989) also revealed several ways to improve industrial workplace safety [33], as summarized in Table 3.

2.2. Occupational Safety and Health in Indonesia (OSH)

Occupational Safety and Health (OSH) standards in Indonesia are set by Government Regulation Number 50 (2012). This regulation specifies that all activities must guarantee protection of the safety and health of workers by preventing work-related accidents and occupational diseases [34]. OHSAS 18,001 describes how anticipation, recognition, evaluation, and control of potential dangers have a significant impact on worker health and wellbeing. It also describes how these hazards impact surrounding communities and the general environment [23].
OSH is implemented in Indonesia through an official legal framework of regulations, guidelines, and standards that are continuously developed, reevaluated, revised, and rationalized. However, this process takes significant coordination, including synergistic input from industry and government offices and collaboration with the relevant ministries and institutions. The following lists laws and regulations under OSH guidelines that outline the national OSH legal framework: (1) Steam Act of 1930 (Ordinate, 1930): (2) Law no. 1 (1970)—Concerning Work Safety; (3) Inspection in Industry and Commerce (ILO) Convention No. 81—Concerning Supervision: (4) Government Regulation no. 88 (2019)—Concerning Occupational Health: (5) Presidential Regulation Number 7 (2019)—Concerning Occupational Diseases.
Indonesia ratified ILO Convention 187 under Presidential Regulation 34 (2014), which adopts a promotional framework for OSH. This convention is an umbrella law that seeks to improve the existing OSH framework in Indonesia by strengthening the national OSH policy generally, along with specific national sub-systems and sub-programs [34]. Data for this study were drawn from Indonesian court proceedings that found for the plaintiff in the specific context of construction site accidents. A total of 150 cases from the High Courts and Supreme Court of the Republic of Indonesia (RI Supreme Court) were identified, and workplace accident data were collated for each. Indonesia’s legal system features multiple layers, as follows:
  • District Court (PN): The District Court deals with matters pertaining to local districts and is the court of first instance in Indonesia. Each district/provincial capital usually has one District Court, which decides criminal, civil, and state administrative cases, along with other cases authorized by law.
  • High Court (PT): The High Court is the court of appeals in Indonesia. Each province has one High Court, except for the DKI Jakarta Province, which has three. The High Court examines and decides on appeals filed against District Court decisions within its jurisdiction.
  • Supreme Court (MA): The Supreme Court is the court of cassation in Indonesia. Located in Jakarta, it examines and decides on cassation cases filed against High Court decisions throughout Indonesia.
A total of 150 cases related to workplace accidents were taken from the highest court decisions in Indonesia, including the Supreme Court (Mahkamah Agung Republik Indonesia) [35]. To increase the amount of supporting data and the reliability of the analysis results, data sampling ranged from 2010 to 2022 (12 years).

2.3. Previous Research

Effective analysis requires the use of appropriate data. In the context of improving occupational safety, Lu [36] studied the characteristics of 197 laboratory accidents in China over a period of 39 years, finding significant correlations between accident propensity, the number of students present in the laboratory, and the implementation of indoor activities. Another study applied Structural Equation Modeling (SEM) to questionnaire data, finding that the factors influencing the latent variables that caused tunnel accidents were construction workers, materials, design, exploration, technical management, and natural conditions [37].
Xu and Xu [38] collected data from 7275 fatal construction industry accidents and found that the highest death rates were due to falls from heights and collapses. To categorize such accidents as rare, stochastic, or dynamic, Jin et al. [39] proposed an accident prediction model based on historical data involving 6005 accident events. Choi et al. [40] developed a prediction model that identified potential fatality risk on construction sites using machine learning based on official industrial accident data in Korea from 2011 to 2016. Chan et al. [41] followed accident cases in Hong Kong from 2021 to 2022 and used detailed validity and reliability checks to create a modified causal model to analyze situational variables, sequences of events, and accident causes. Their results show that “falling” and “being hit” were the most frequent types of accident-caused injuries.
Comparative research is needed to avoid confusion due to the use of various data sources and to support suggestions based on CACD data analysis. Previous studies in Indonesia include Hidayat et al. [42], who conducted a content analysis of news media data of 205 accidents from 2005 to 2015, finding that the leading accident and project type were, respectively, electrocution and building construction. Dangga et al. [43] surveyed accident reports in Indonesia over 10 years using Ventana Simulation (Vensim) to identify the key factors, including a lack of work safety experts and not specifying the cause media and type of work based on 12 work accidents on toll roads as the project type. Martiwi et al. [44] analyzed 23 reported accident cases, finding that the leading accident types were crushing and falling from heights, particularly in building projects. Sulistyaningtyas [45] used accident case data from 14 construction accident titles in Indonesia in a literature review that found human factors to be the key cause of accidents through the performance of unsafe actions but did not specify the causal factors further. This paper uses 150 CACD findings, applying scenario and descriptive analysis to improve the accuracy of categorizing dominant accident causes and resolutions.
Yuan et al. [46] reviewed Form 154 Environmental Impact Assessment Reports, issued by the Ministry of Ecology and Environment of the People’s Republic of China, seeking to explore various risk scenarios and their attendant probabilities of environmental harm, as measured by environmental impact accident assessments (EIAAs). Chong and Low [14] applied statistical data analysis to court data to develop suggestions for safety and health improvements in the Malaysian construction industry. Birganoul et al. [15] used court case data to test the reliability accuracy of DsSafe, a research approach that seeks to minimize subjectivity in expert witness testimony to evaluate the causes of fall accidents with fault rates in different scenarios. Li [16] used court decision data to mathematically model construction accident compensation. Davis and Akenhead [18] illustrated the utility of court data as a reference in construction, engineering, and IT disputes.
Various data-driven efforts have been made to inform legislative improvements to construction industry work safety. Individual countries have developed context-specific legal frameworks for handling occupational accidents, providing a range of potential solutions from different legal perspectives [14,15,16,17,18] that could form a potentially important resource for construction industry practitioners and regulators seeking to improve work safety guidelines. This work is the first to systematically analyze court findings from Indonesia’s CACD, applying scenario and descriptive analysis to 150 CACD decisions to identify key impact factors in various types of construction accidents and explore correlative patterns and their level of significance.
Data can be interpreted qualitatively and quantitatively. Qualitative analysis uses descriptive data, commonly in the form of text or images, which provide a richer meaning than numbers or observational frequencies. Descriptive statistics are used to explain or describe various data characteristics, such as averages or variances, without further interpretation, presenting a summary of the data to make the topic understandable to the widest possible audience while avoiding the drawing of premature conclusions.

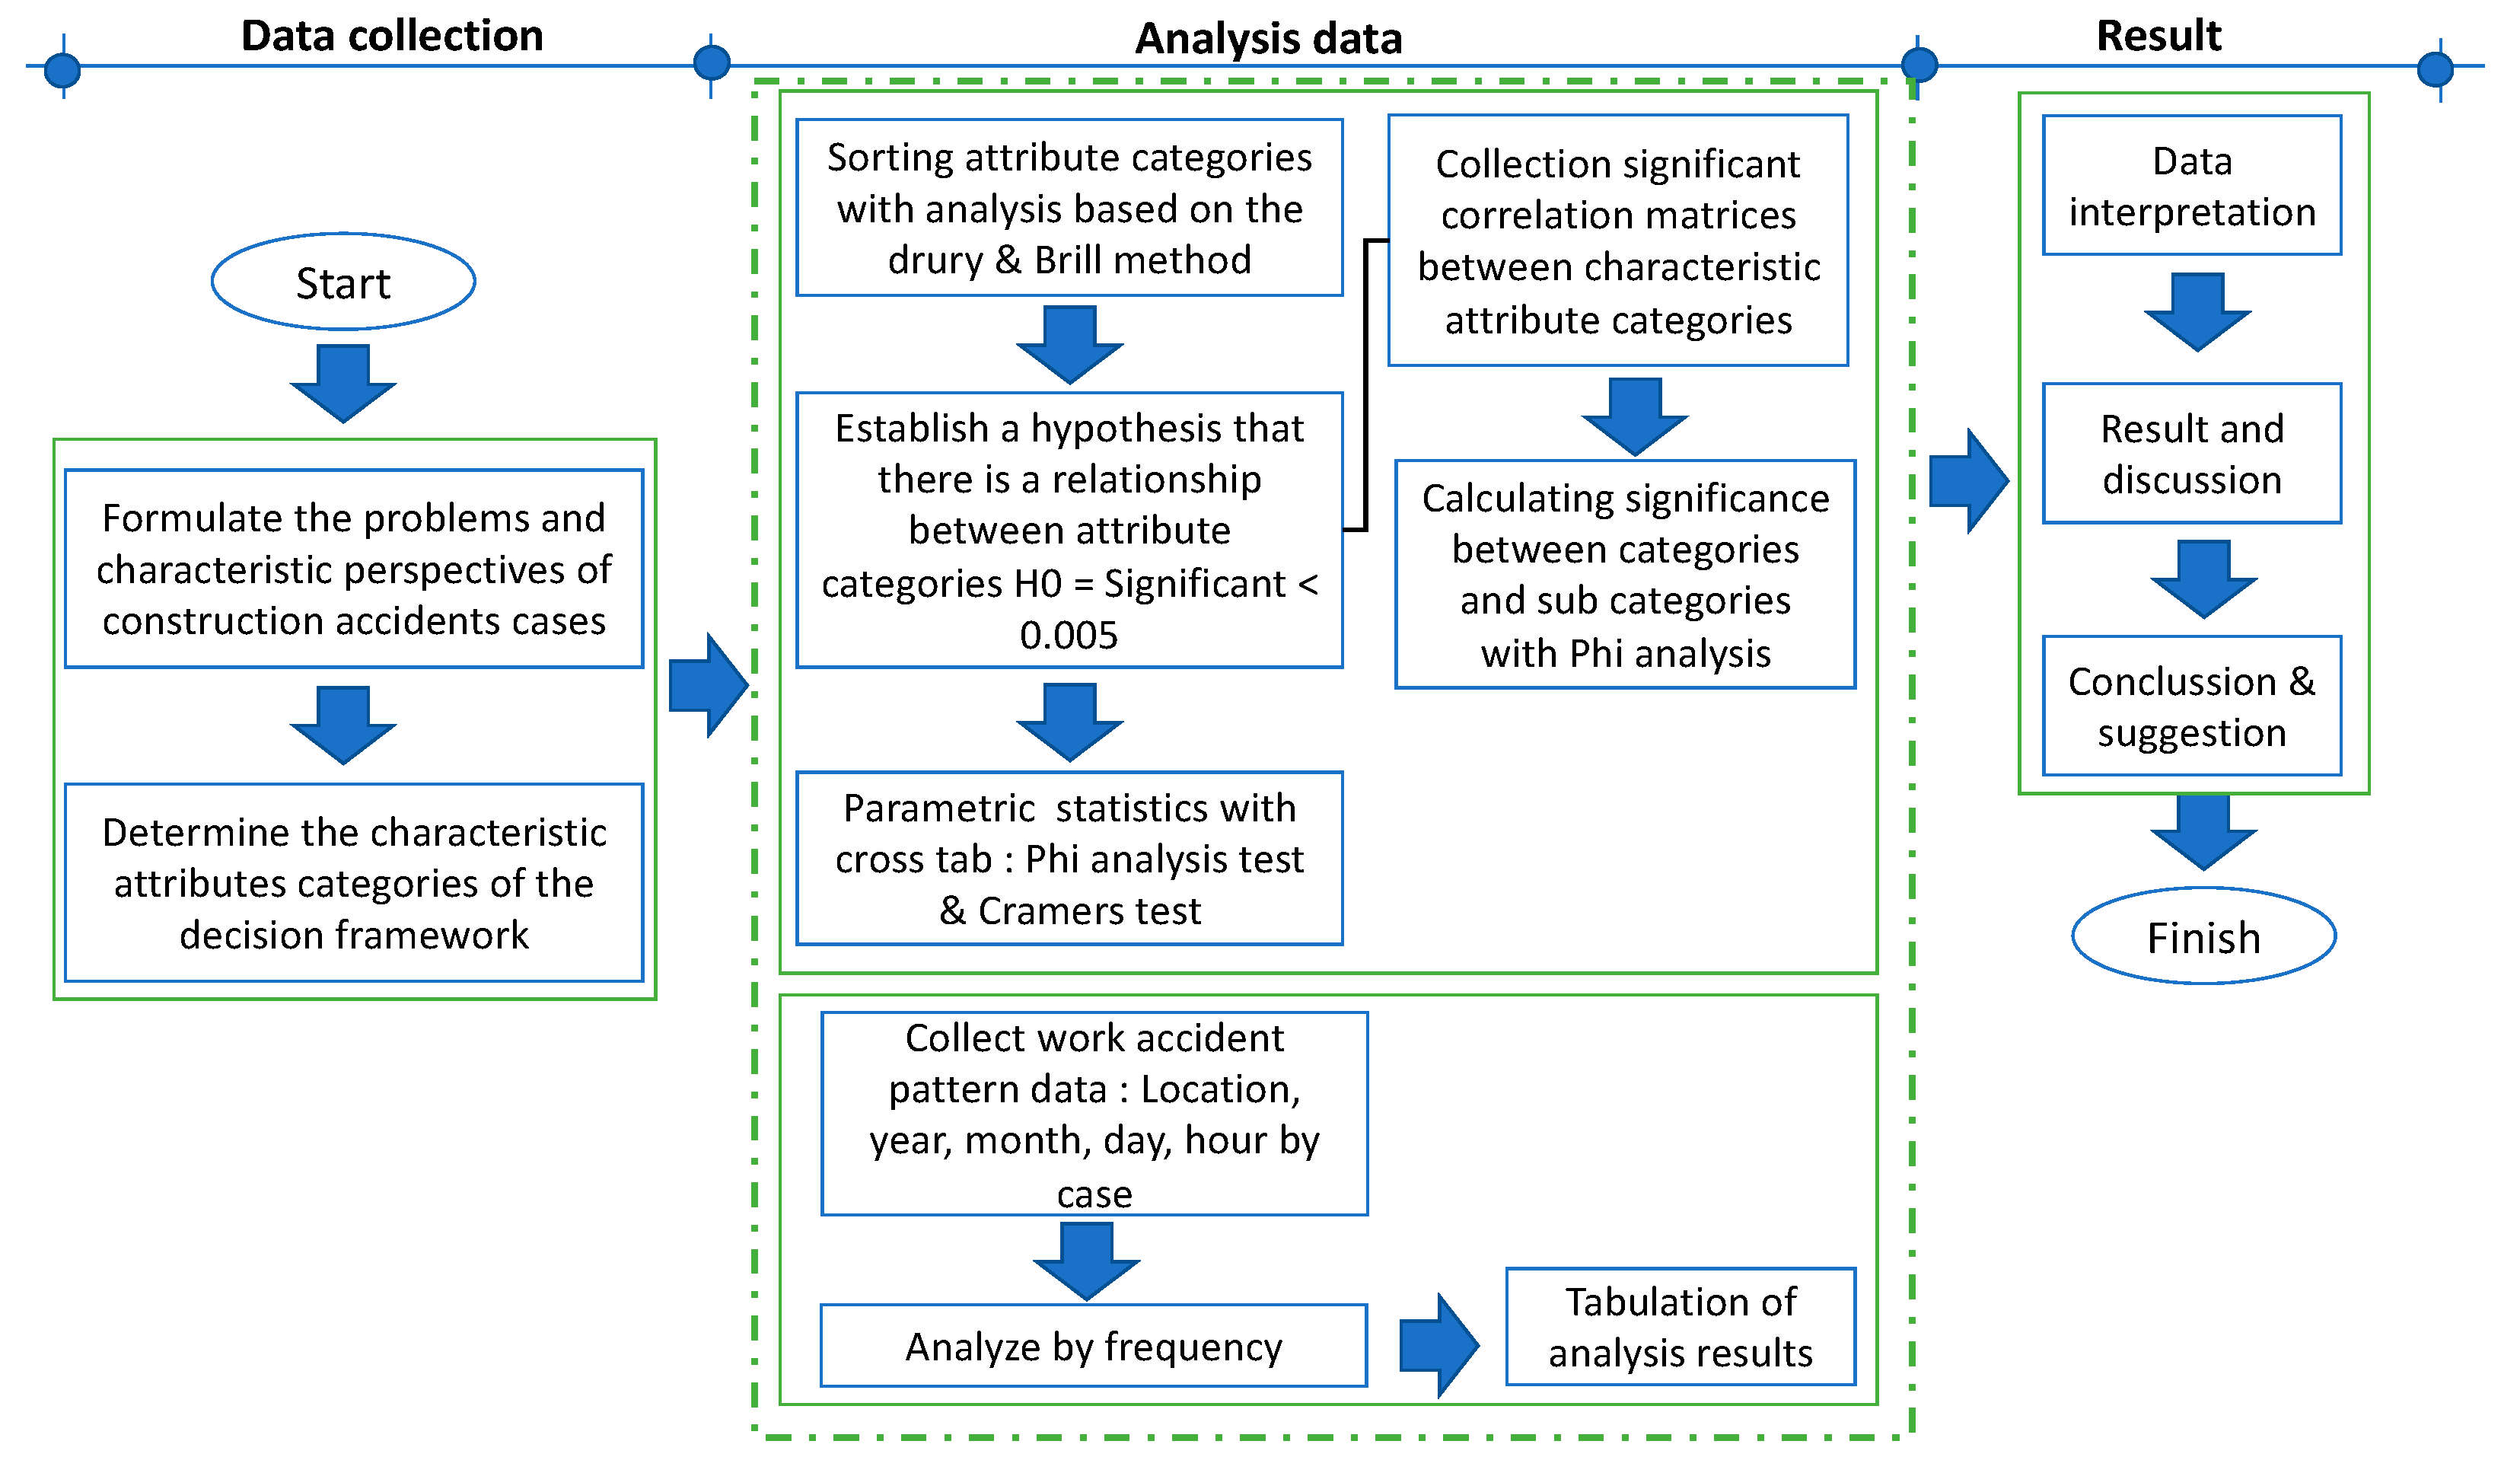
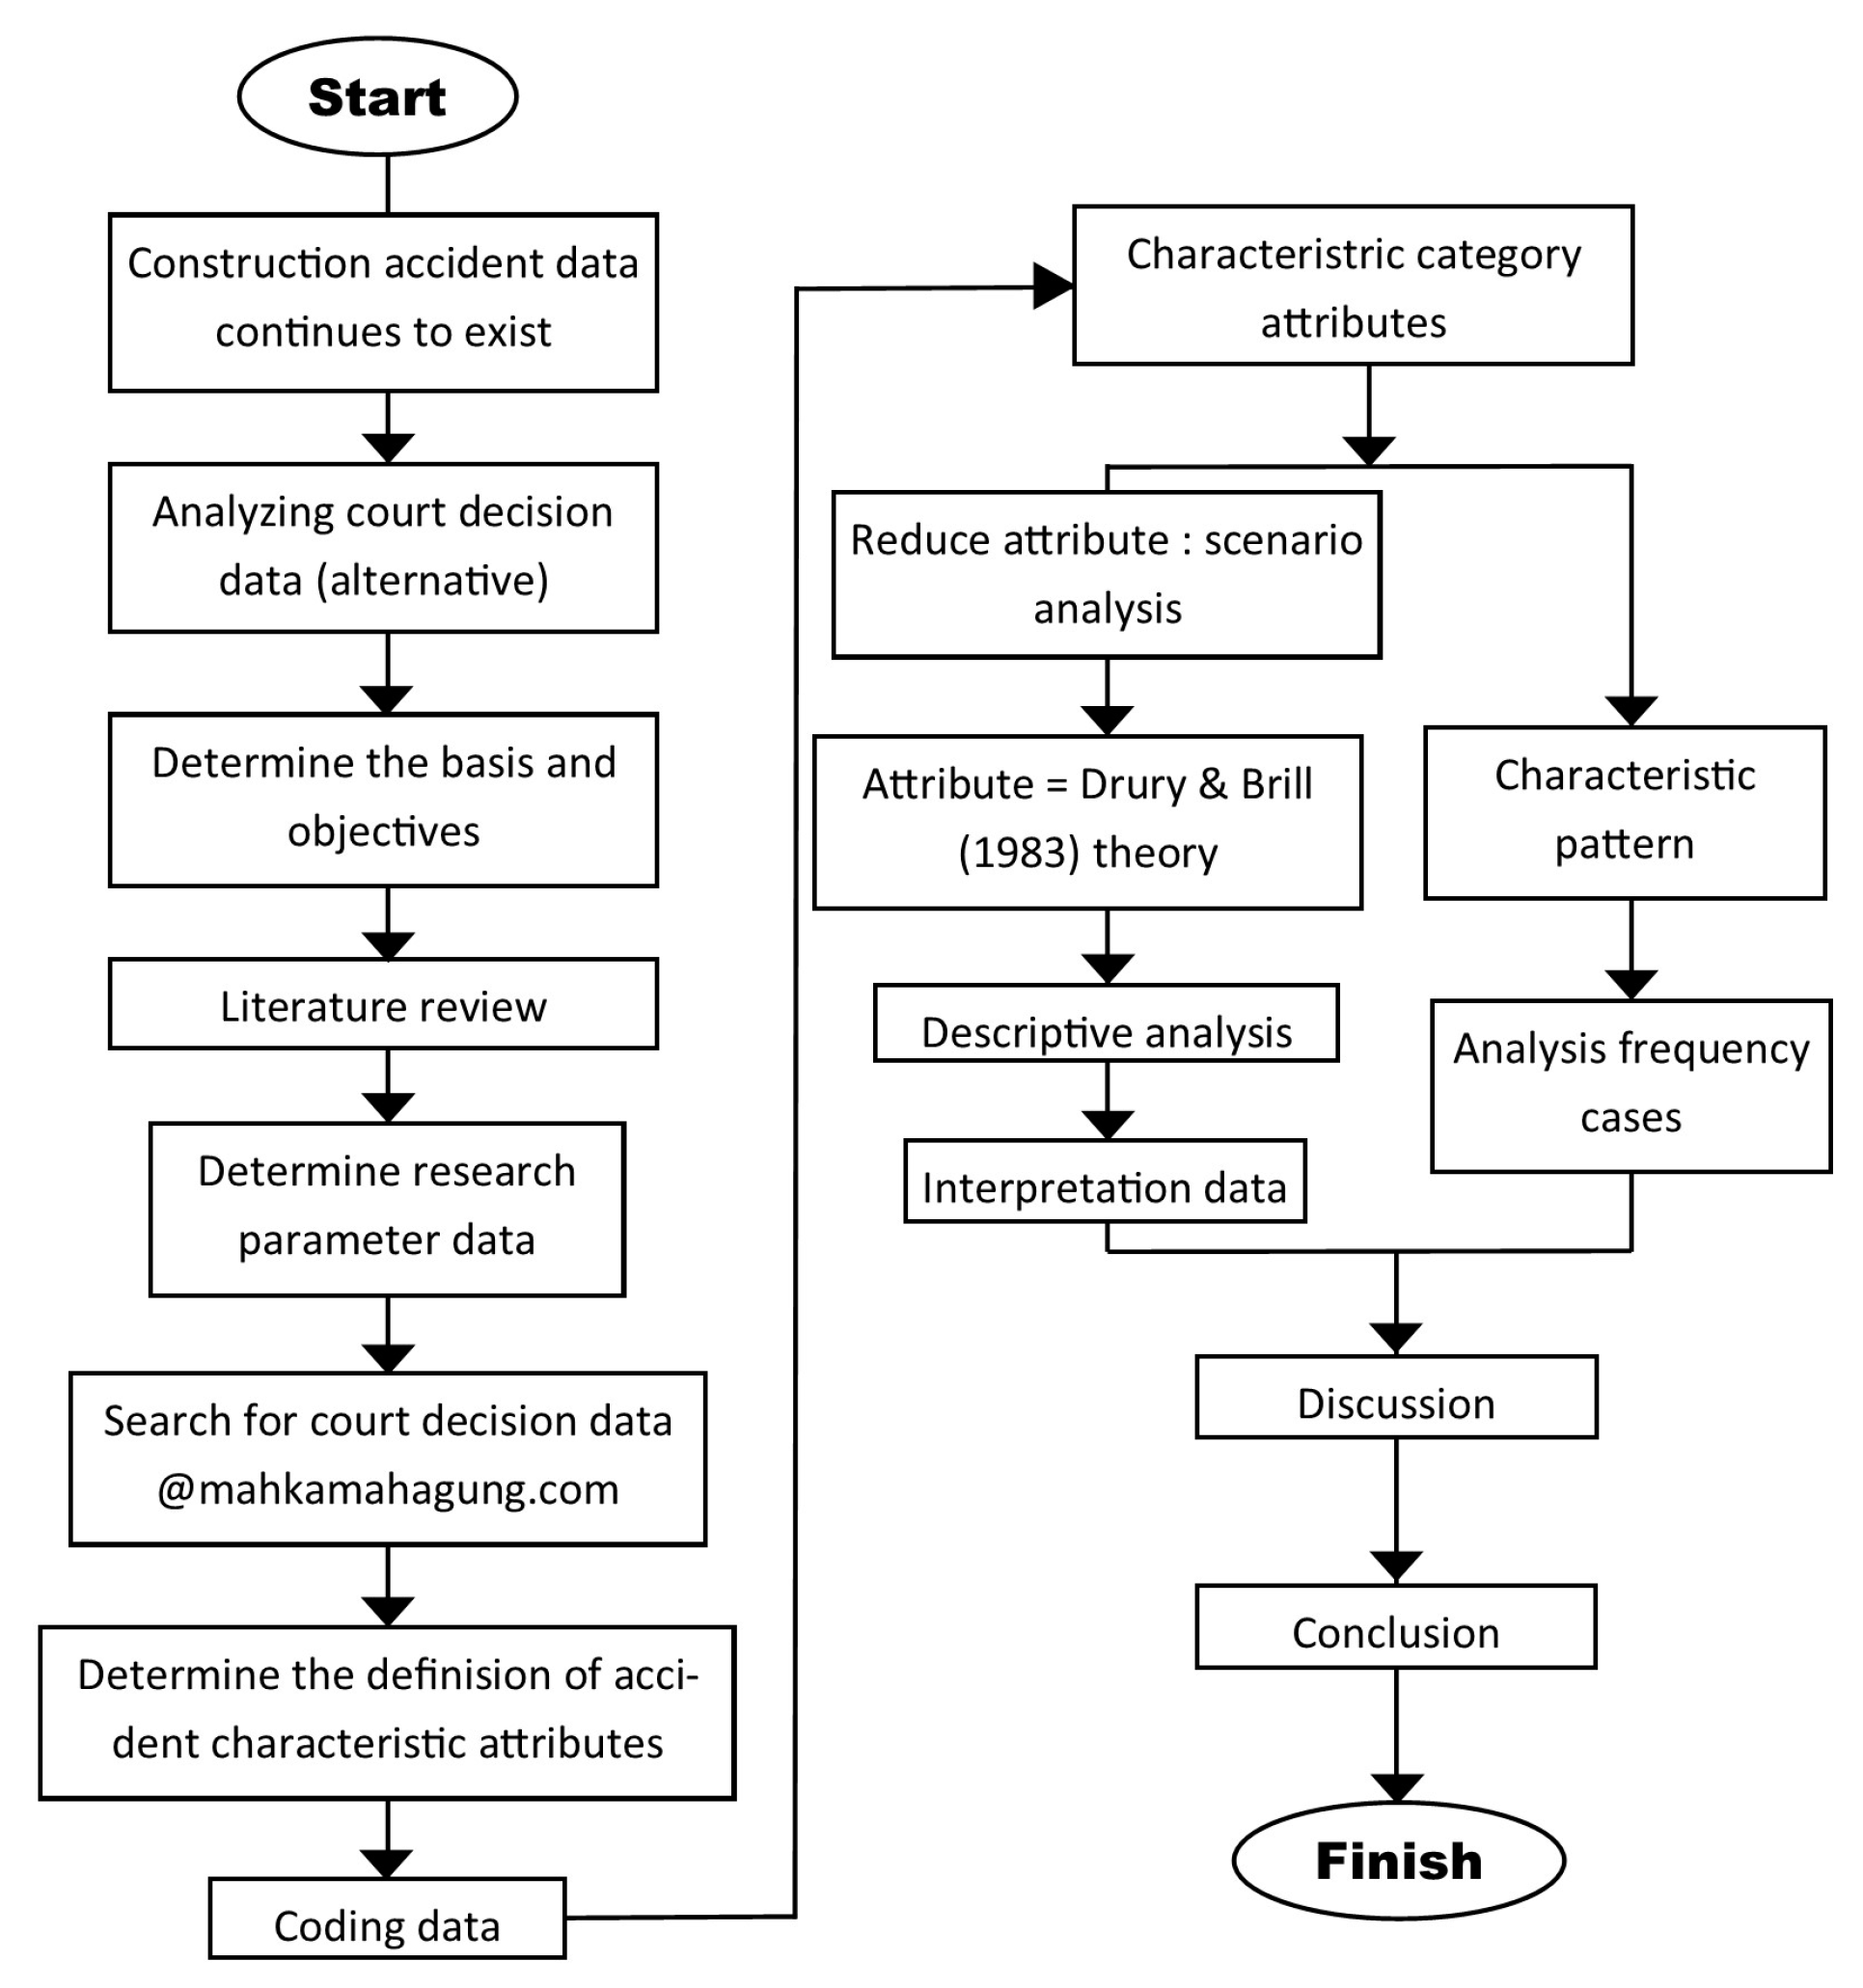
3. Research Methodology

Accident characteristics obtained from the construction accident court decisions (CACDs) were used to determine trigger events. This process included analysis of various workplace safety service studies using data about work-related accidents and deaths. Using CACDs as an alternative source of secondary data will provide a new perspective on construction workplace accidents. The present research seeks to highlight areas of risk and provide actionable risk reduction strategies. Comparing accident characteristics from credible sources with other risk analyses can enable improved anticipation of potential risk areas. This paper utilizes 150 plaintiff decisions from high-level Indonesian courts, specifically those related to construction site accidents.
Data were obtained from the official Mahkamaagung.co.id website, using a combination of keyword searches related to the Indonesian terms for workplace accident, construction accident, building accident, foreman accident, worker death, building collapse, and various combinations thereof (singular, plural, changes in tense, etc.). Restricting the search to construction accidents produced a total of 150 reports, which were then sorted based on their primary characteristics and arranged for coding. Scenario analysis was used to clarify the categories. Descriptive statistics were used to map the accident information and reveal patterns in the accident characteristics. The results of the analysis were evaluated by examining correlative structures, starting with the biggest contributors to accidents. The following sections discuss the analysis results in Figure 3.

3.1. Determine CACD Characteristic Parameters and Accident Categories

Each document was searched for measurable data points using established norms to allow for the analysis of the respective importance of various factors. There are several categories in which this is possible:
  • Worker Age: Age influences productivity at work and susceptibility to accidents [47]. There is also an identifiable relationship between age and worker stress level [48]. The age of workers involved in accidents was classified as (1) if aged up to 18 years, and (2) >18 years (i.e., legal working age in Indonesia).
  • Worker Status: Management consists of supervisors or foremen with supervisory responsibility for workers engaged in brick masonry, plastering, welding, steel framework, demolition, formwork, reinforcement, pipe installation, foundation work, and other types of labor. Workers could also be direct hires or subcontractors.
  • Accident Media: Where the accident is due to impact with a particular media or material (e.g., electrical cables, construction vehicles, roofing damage, liquids, concrete beams, steel beams, etc.), as opposed to being directly caused by another person.
  • Accident Type: (1) Falling from a height; (2) being struck by a laterally moving object; (3) being struck by a falling object; (4) being buried by material; (5) laceration; (6) explosion or heat-related injury; (7) drowning.
  • Task Type: Status of all involved in the accident including the (1) owner, (2) foreman or manager, (3) workers, and (4) outside parties (i.e., people unrelated to the project).
  • Injury Location: Injuries are classified as being located on the (1) head, (2) upper body, (3) lower body, or (4) unstated.
Based on these data categories, one can construct a nominal scale in discrete numbers, where each element has no meaning according to its size or position and the numbers are only representative symbols.

3.2. Research Hypotheses

To provide a clear description of the relationship between accident cause categories and, in accordance with the research objectives, a series of hypotheses statements are formulated to measure the relationships between the categories and sub-categories. These hypotheses will be used to describe the relationship between categories and later guide the analysis to better understand the relationship or independence of two variables between industry categories, job classification, medium accident, type of accident, body injury, and worker status. Hypothesis testing proceeded using the steps shown in Table 4.
Hypothesis 1 (H1).
Worker status and worker age have no correlation.
Hypothesis 2 (H2).
Worker status and body part have no correlation.
Hypothesis 3 (H3).
Medium type category and worker age have no correlation.
Hypothesis 4 (H4).
Medium type and accident type have no correlation.
Hypothesis 5 (H5).
Medium type and body part have no correlation.
Hypothesis 6 (H6).
Task type and worker age have no correlation.
Hypothesis 7 (H7).
Task type and body part have no correlation.
Hypothesis 8 (H8).
Project type and worker age have no correlation.
Hypothesis 9 (H9).
Project type and accident type have no correlation.
Hypothesis 10 (H10).
Project type and body part have no correlation.
Hypothesis 11 (H11).
Worker status and accident type have no correlation.
Hypothesis 12 (H12).
Task type and accident type have no correlation.

3.3. Scenario Analysis

Scenario analysis is an established method of breaking down problems into manageable sub-problems and then determining appropriate courses of action by filtering the factors that cause serious accidents [49]. Each situation is described in terms of its constituent elements and their relationships by asking and answering questions such as who is involved, with what processes and products, under what circumstances, under what conditions, and what dangers are present. Scenarios should be specific and mutually exclusive, and the obtained results should be limited to applicable scenarios. Subsequently, items can be analyzed according to their severity, nature, and extent of the problem. Aziz et al. [50] describe how Drury and Brill derived hazard scenarios in terms of actors (individuals), props (tools, instruments, and equipment), scenes (environment), and actions (tasks) from real-life accident reports. This process emphasizes that each scenario suggests at least one feasible and effective intervention. However, such interventions are appropriate only for a given scenario. The scenario analysis method has been successfully used by Dempsy [51] for mining audits by identifying and eliminating potential sources of disaster risk related to the Minuteman missile system, thereby facilitating subsequent analysis.
This study adopts a scenario analysis system and characterizes the main causes of accidents and hazard patterns based on the CACD rulings. The court documents describe root causes and patterns of harm, which are then used to specify data collection categories that can provide effective intervention strategies [50]. Thus, accident prevention measures can be developed from this analysis.

3.4. Analyzing CACD Reports

Statistical analysis of the CACD documents is conducted using correlation analysis with Pearson’s correlation coefficient. This correlation requires that the data used be measured on an interval scale, the significance of the test must meet the measurement requirements, and the observations are assumed to be from a normally distributed population. For a nominal-scale data set, the contingency coefficient C (Cramer’s coefficient) is used. The contingency coefficient does not make any assumptions regarding the shape of the data population, nor does it require continuity of the variables being analyzed; it only requires nominal measurements. Attribute category data are translated into non-parametric statistics with a nominal scale, and the relationship between the attributes can be described and applied to the hypotheses.
To correctly interpret the strength of the relationship between two variables, the following criteria are used: (1) a correlation coefficient value r = 0 implies there is no correlation between the two variables; (2) a correlation coefficient value 0 < r ≤ 0.25 implies a very weak correlation; (3) a correlation coefficient value 0.25 < r ≤ 0.5 indicates sufficient correlation; (4) a correlation coefficient value 0.5 < r ≤ 0.75 implies strong correlation; (5) a correlation coefficient 0.75 < r ≤ 0.99 implies a very strong correlation; and (6) a correlation coefficient value r = 1 implies a perfect correlation, which should be regarded as suspicious.
To determine whether the correlation between two variables is significant, we conduct the following hypothesis test: H0: ϕ= 0 (there is no correlation) and H1: ϕ ≠ 0 (a correlation exists). If the phi correlation coefficient value shows a smaller value, with a significance value below α = 0.05, H0 is rejected, and there is no correlation. To apply the χ2 test, the following steps were used [47]:
  • First, arrange the frequencies into a contingency table measuring r, x, and k, using k columns for the groups.
  • Determine the expected frequency under H0 for each cell, and then divide this product by N, where N is population of all observations, noting that a very large value for N makes this test invalid.
Calculate χ2 as follows:
Ê i j = R i C n  
where Oij is the number of observations categorized in row i in column j, and E, i, and j; are the number of cases expected under H0 to be categorized in row i and column j. For data in the 2 × 2 contingency table, the following formula is used:
x 2 = i = 1 r j = 1 c ( O i j   Ê i j ) 2 Ê i j
as shown below:
x 2 = i = 1 r j = 1 c O i j   2 Ê i j N
where “r” is the number of rows, “c” is the number of columns, “O” is the observation value, “Ê” is the estimated expected value, “N” is the total number of observations, and “L” is the minimum number of rows or columns in the table contingency.
If the probability given for an observation value χ2 for the value db is equal to or smaller than α, H0 is rejected and H1 is accepted. The phi correlation coefficient is obtainable when the data are measured on a nominal scale. In addition to the Cramer coefficient, the phi coefficient can also be used. To determine the phi correlation coefficient, a 2 × 2 contingency table is formed. Because the data are dichotomous, each variable assumes a value of either 0 or 1. Thus, there is a relationship between the phi correlation coefficient and the χ2 value:
X 2 =   2   N   C = X 2 N ( L 1 )
From Equation (3), the correlation coefficient is obtained as follows:
X 2 = 2   N   = a d b c ( a + b ) ( c + d ) ( a + c ) ( b + d )

3.5. Descriptive Analysis

The 150 CACD reports were scanned and categorized based on their accident characteristics. The data were then tabulated according to the main categories and sub-categories. Once coded, the number of cases and percentages were computed to show the sizes of the categories and sub-categories. The steps described in Table 5 were applied to the 150 final CACD decisions, with scenario analysis revealing 7 categories and 39 sub-categories. The seven categories are based on a series of events, with reference to the phi value showing a direction of correlation between the various attributes. The analytical results using Cramer’s coefficient and the phi coefficient are then linked to a series of events from the scenario analysis. Each value is calculated using descriptive statistics and attributed a reason based on the relationship between the event and the decision framework.

4. Results

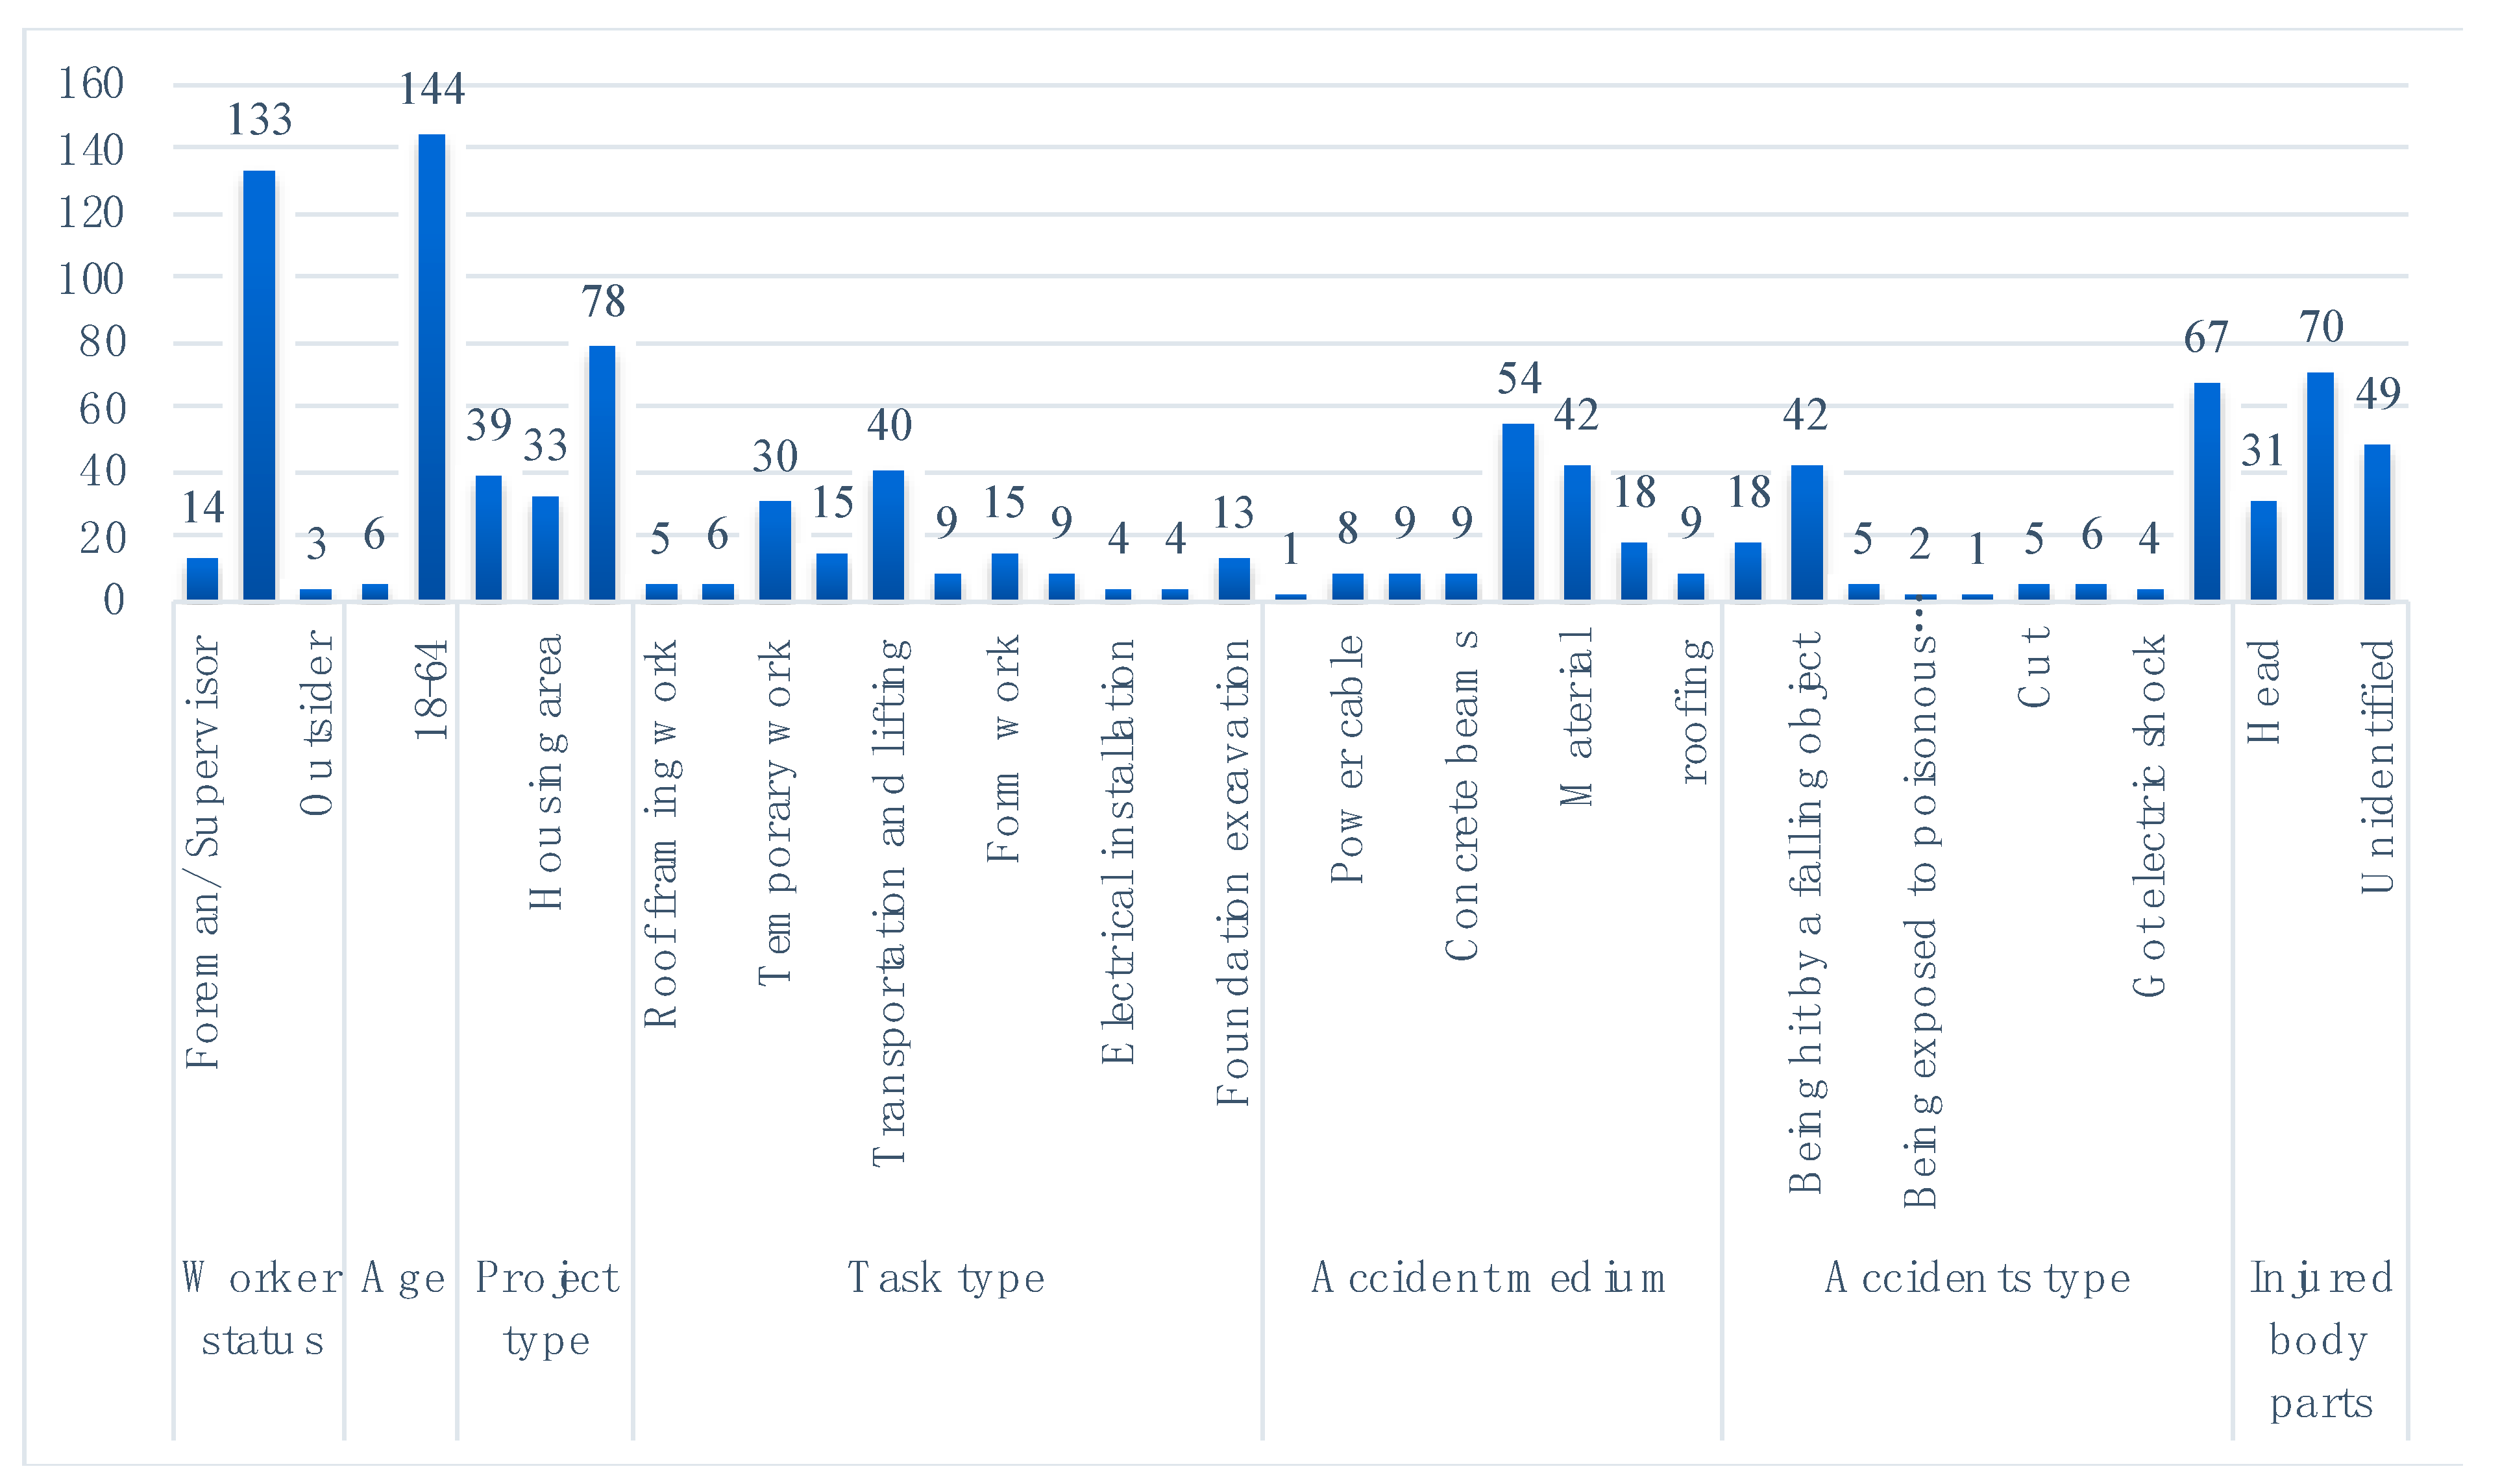
4.1. CACD Data Coding and Patterns

Accident characteristics were determined from the CACD decisions, with numbering and notation used to distinguish different categories for analysis. Figure 4 shows the coding data for the accident category characteristics. While Indonesia has 34 provinces, the 150 reports were sourced from only 26 provinces (see Figure 5), with the greatest concentrations in East Java (24 cases), West Java (20), and Riau (16). With a population of 150 million, Java accounts for over 53% of Indonesia’s total population [10] and is the center of national economic activity and infrastructure development; thus, the high concentrations of accidents in East and West Java are not surprising.
Reports were categorized as prior to 2010 and then annually from 2011 to 2022. The greatest concentration of accidents was in 2020 (19%), led by accidents due to falling objects or materials, with 25 cases involving workers and four cases involving management (foremen and supervisors). This was followed by 2019 (16%), including 30 deaths and 9 injuries. The time distribution is shown in Figure 6a. Referring to Figure 6b, the highest concentration of accidents was in October (14%), while February had the lowest (3%). About half the months in the year had accident rates below 10%, and 58% of total accidents were clustered in the continuous period from October to December. The leading type of injury was falls, followed by material impact, vehicular impact, electrocution, and laceration by construction equipment. Figure 6c shows the accident distribution by day of the week, leading with Monday (22%), followed by Tuesday (17.33%), while Friday and Sunday, respectively, only accounted for 12% and 5% of cases. Sunday is traditionally a religious holiday, and thus has the lowest number of cases. Workplace accidents appear to be evenly distributed except for weekends. This implies that the day of the week does not impact the type of accident, but the number of accidents is reduced on holidays. As a large nation, Indonesia has three different hourly time zones. To simplify the analysis process, and in keeping with Indonesian working habits, this analysis adopts an eight-block effective-working-hour system, consisting of four divisions each day, up to the beginning of the night shift. The report data shows that incidents were far more likely to occur in normal daytime shifts. Specifically, the first shift of the day accounts for 33.33% of cases, followed by the 12.01–17.00 shift (21%). The accident rate decreased throughout the day and was lowest during the 00:01–04:00 shift. Figure 6d shows the remaining distribution of incidents across a 24-h period.

4.2. Scenario Analysis Results

Hanapi et al. [52] characterized the causes of fatal falls by following Drury and Brill [53] to summarize the key factors that cause accidents. Scenario analysis is used to determine several main categories based on key factors (e.g., primary incident cause), which are then each assigned a classifier to allow for the quantification of specific aspects of the event based on factors including age, task factors, management factors and sub-causes [51,54]. Each item is coded to allow for a broader analysis. The list of possible root causes initially appears long, but many aspects can be eliminated or subsumed into a higher-level category, facilitating the formulation of effective risk management intervention strategies [50]. In this analysis, seven CACD categories were identified as follows: worker status, age, project type, task type, accident medium, accident type, and injury location. Based on the appropriate categories, this report summarizes the correlation values and related significance values.

4.3. Coefficient and Statistical Significance

SPSS (v.26) was used to compute Cramer’s v and the phi for the collected data. The Cramer calculations used seven categories as described in Section 4.2, producing four categories that demonstrate some degree of correlative significance. The results are presented in Table 6.
Of the 150 court decision cases, 96% cases involved accident victims aged > 18 years. By accident type, the greatest concentration was collision with construction machinery (46.61% of all cases). In terms of project type, the highest number of incidents was in the Transportation Engineering sector (52% of all cases). In terms of delivery media, the greatest number of injuries were caused by collisions by project vehicles (36%). Of the seven categories examined using parametric methods, four met the data requirements: accident, project, task, and medium. The total Cramer value was 0.534, indicating a strong correlation, with a phi value of 0.001. Examining the relationship between accident type (i.e., being struck by construction machinery), the media that caused the greatest number of worksite accidents were construction machinery (phi value of 0.005). Of the 150 cases, 133 cases involved workers on construction projects (age > 18 years old). There were 51 cases involving construction machines, 39 of which were related to “hit by construction machinery”). The significance of this result was relatively low (0.020 > 0.005). Cross-category tests for task, project, medium, and accident types were carried out, and the results are presented in Table 7.
The results in Table 7 show the product of calculations using three matrices, as described below:
Accident Characteristics—Court decisions based on age factors: Age is divided into two categories, under 18 years (a legal minor under current Indonesian labor laws 74 and 76, Law Number 13, 2003) and 18 years and over (legal working age). Only 4% of cases were found to involve underage laborers. The leading accident type for legal workers was collisions with transport machinery (67 cases, 44.66%), followed by collisions with a and falling objects (42 cases, 28%), and falls from heights (18 cases, 12%). The remaining accident cases, in decreasing order of frequency, were limb loss, electrocution, and burns from operational equipment, each accounting for less than 3% of occurrences.
Accident Characteristics—Court decisions based on worker status factors: According to the worker status categories, the vast majority of those injured were employees (133 cases, 88.66% of total), followed by management (14 cases, 9.33%), and then outsiders, with just 3 cases involving incidents in which a lack of adequate markings or barriers around the project site failed to isolate the worksite from passersby, resulting in fatalities due to collisions with project vehicles. In terms of body part(s) injured, the highest number of accidents occurred in transportation projects (52% of all incidents, or 78 cases), followed by public buildings (39 cases) and home communities (33 cases). In terms of injury location, the leading category was “multiple” body parts (70 cases, or 50% of the total), followed by “undefined” (25 cases, 35.71%), primarily resulting from collisions with transport vehicles. The phi (ϕ) value for project type and body part was not significant (0.0357 > 0.005 (ⲁ)) and Cramer’s v only showed a weak correlation (0.121). From this, we conclude that there is no connection between the project type and the injured body part(s).
Most bodily injuries were experienced by workers (88.66% or 133 cases), while injuries to management were significantly lower (9.33% or 14 cases), followed by outside parties (3 cases). The Phi (ϕ) value for this relationship was not significant (0.788 > 0.005) (ⲁ), and Cramer’s v was 0.076, showing only a weak correlation. We thus conclude that there is no correlation between worker status and injured body part(s).
In terms of the effect of media type on project type, transportation engineering is the leading project type (52%, or 78 cases), while construction machinery is the leading medium (28%, or 42 cases), forming a linear relationship. This was followed by public buildings (26%, or 39 cases), and accidents caused by a medium accounted for 35.89% of cases (14). The lowest accident frequency occurred in community housing projects (15 cases) involving workers being crushed by or buried under construction material. The relationship between media type and project type exhibited a significant phi value (0.001 < 0.005) with a Cramer’s v sufficient to determine a correlation (0.350). From this, we conclude that there is a correlation between these two factors.

5. Discussion

5.1. CACD Category Determination

The main causes of construction worksite accidents were related to unique construction project characteristics. Such variables include diversity of work location, worker level of knowledge, and general safety management. According to Joghataei et al. [55], the characteristics of worksite accidents can be classified according to industrial sector, cause, type, body part(s), location, time, month, and outcome. Yang et al. [56] categorized 154 chemical accidents according to special job categories, industrial distribution, company scale, provincial location, time volatility characteristics, and accident causes. By using statistical data from 2010 to 2019, Shuang and Zhang [57] examined data for 7275 accidental deaths to determine accident characteristics based on time, occurrence, location, severity, and geographical area. Noor et al. [31] investigated the construction of multi-story buildings in Surabaya, Indonesia, classifying extracted accident characteristics according to type of accident, nature of injury, location of injury, and object collisions.
As the first to use CACD for an analysis of worksite safety, this study constructs category groups for the years 2019 to 2021, with, respectively, 70, 26, and 75 cases. This demonstrates that the potential for worksite accidents remains high and requires increased attention [58]. Understanding accident characteristics provides a framework for anticipating and mitigating future accidents. The Drury and Brill scenario analysis was used to develop a descriptive analysis with cross-tabulation to determine characteristic categories as follows:

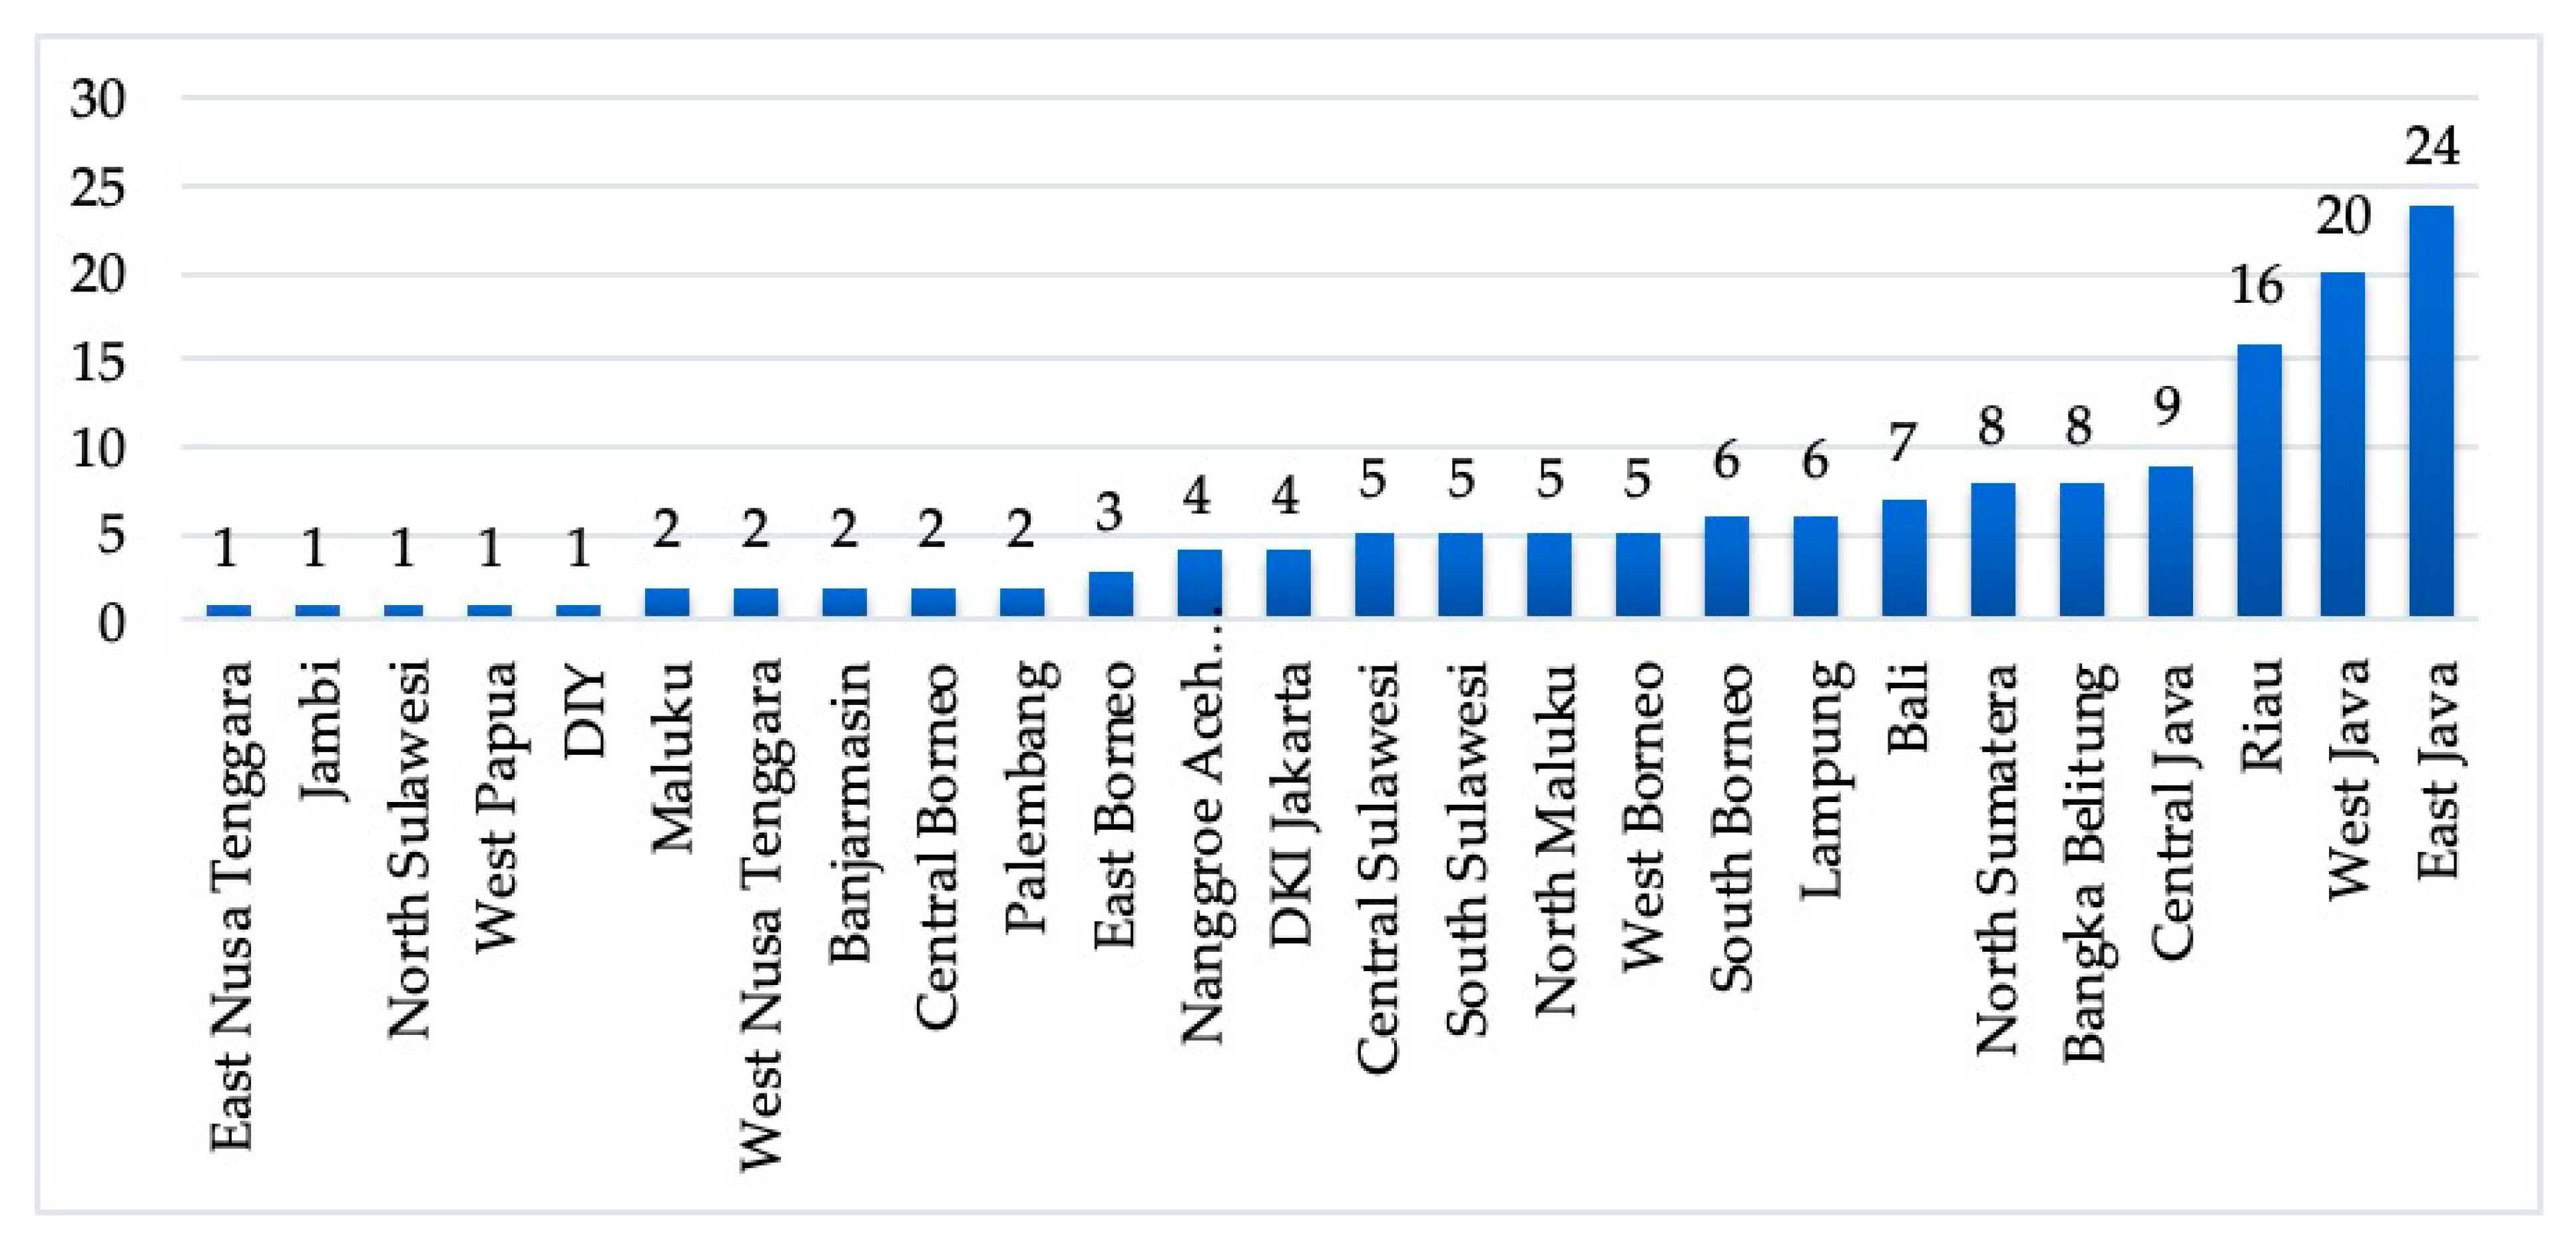
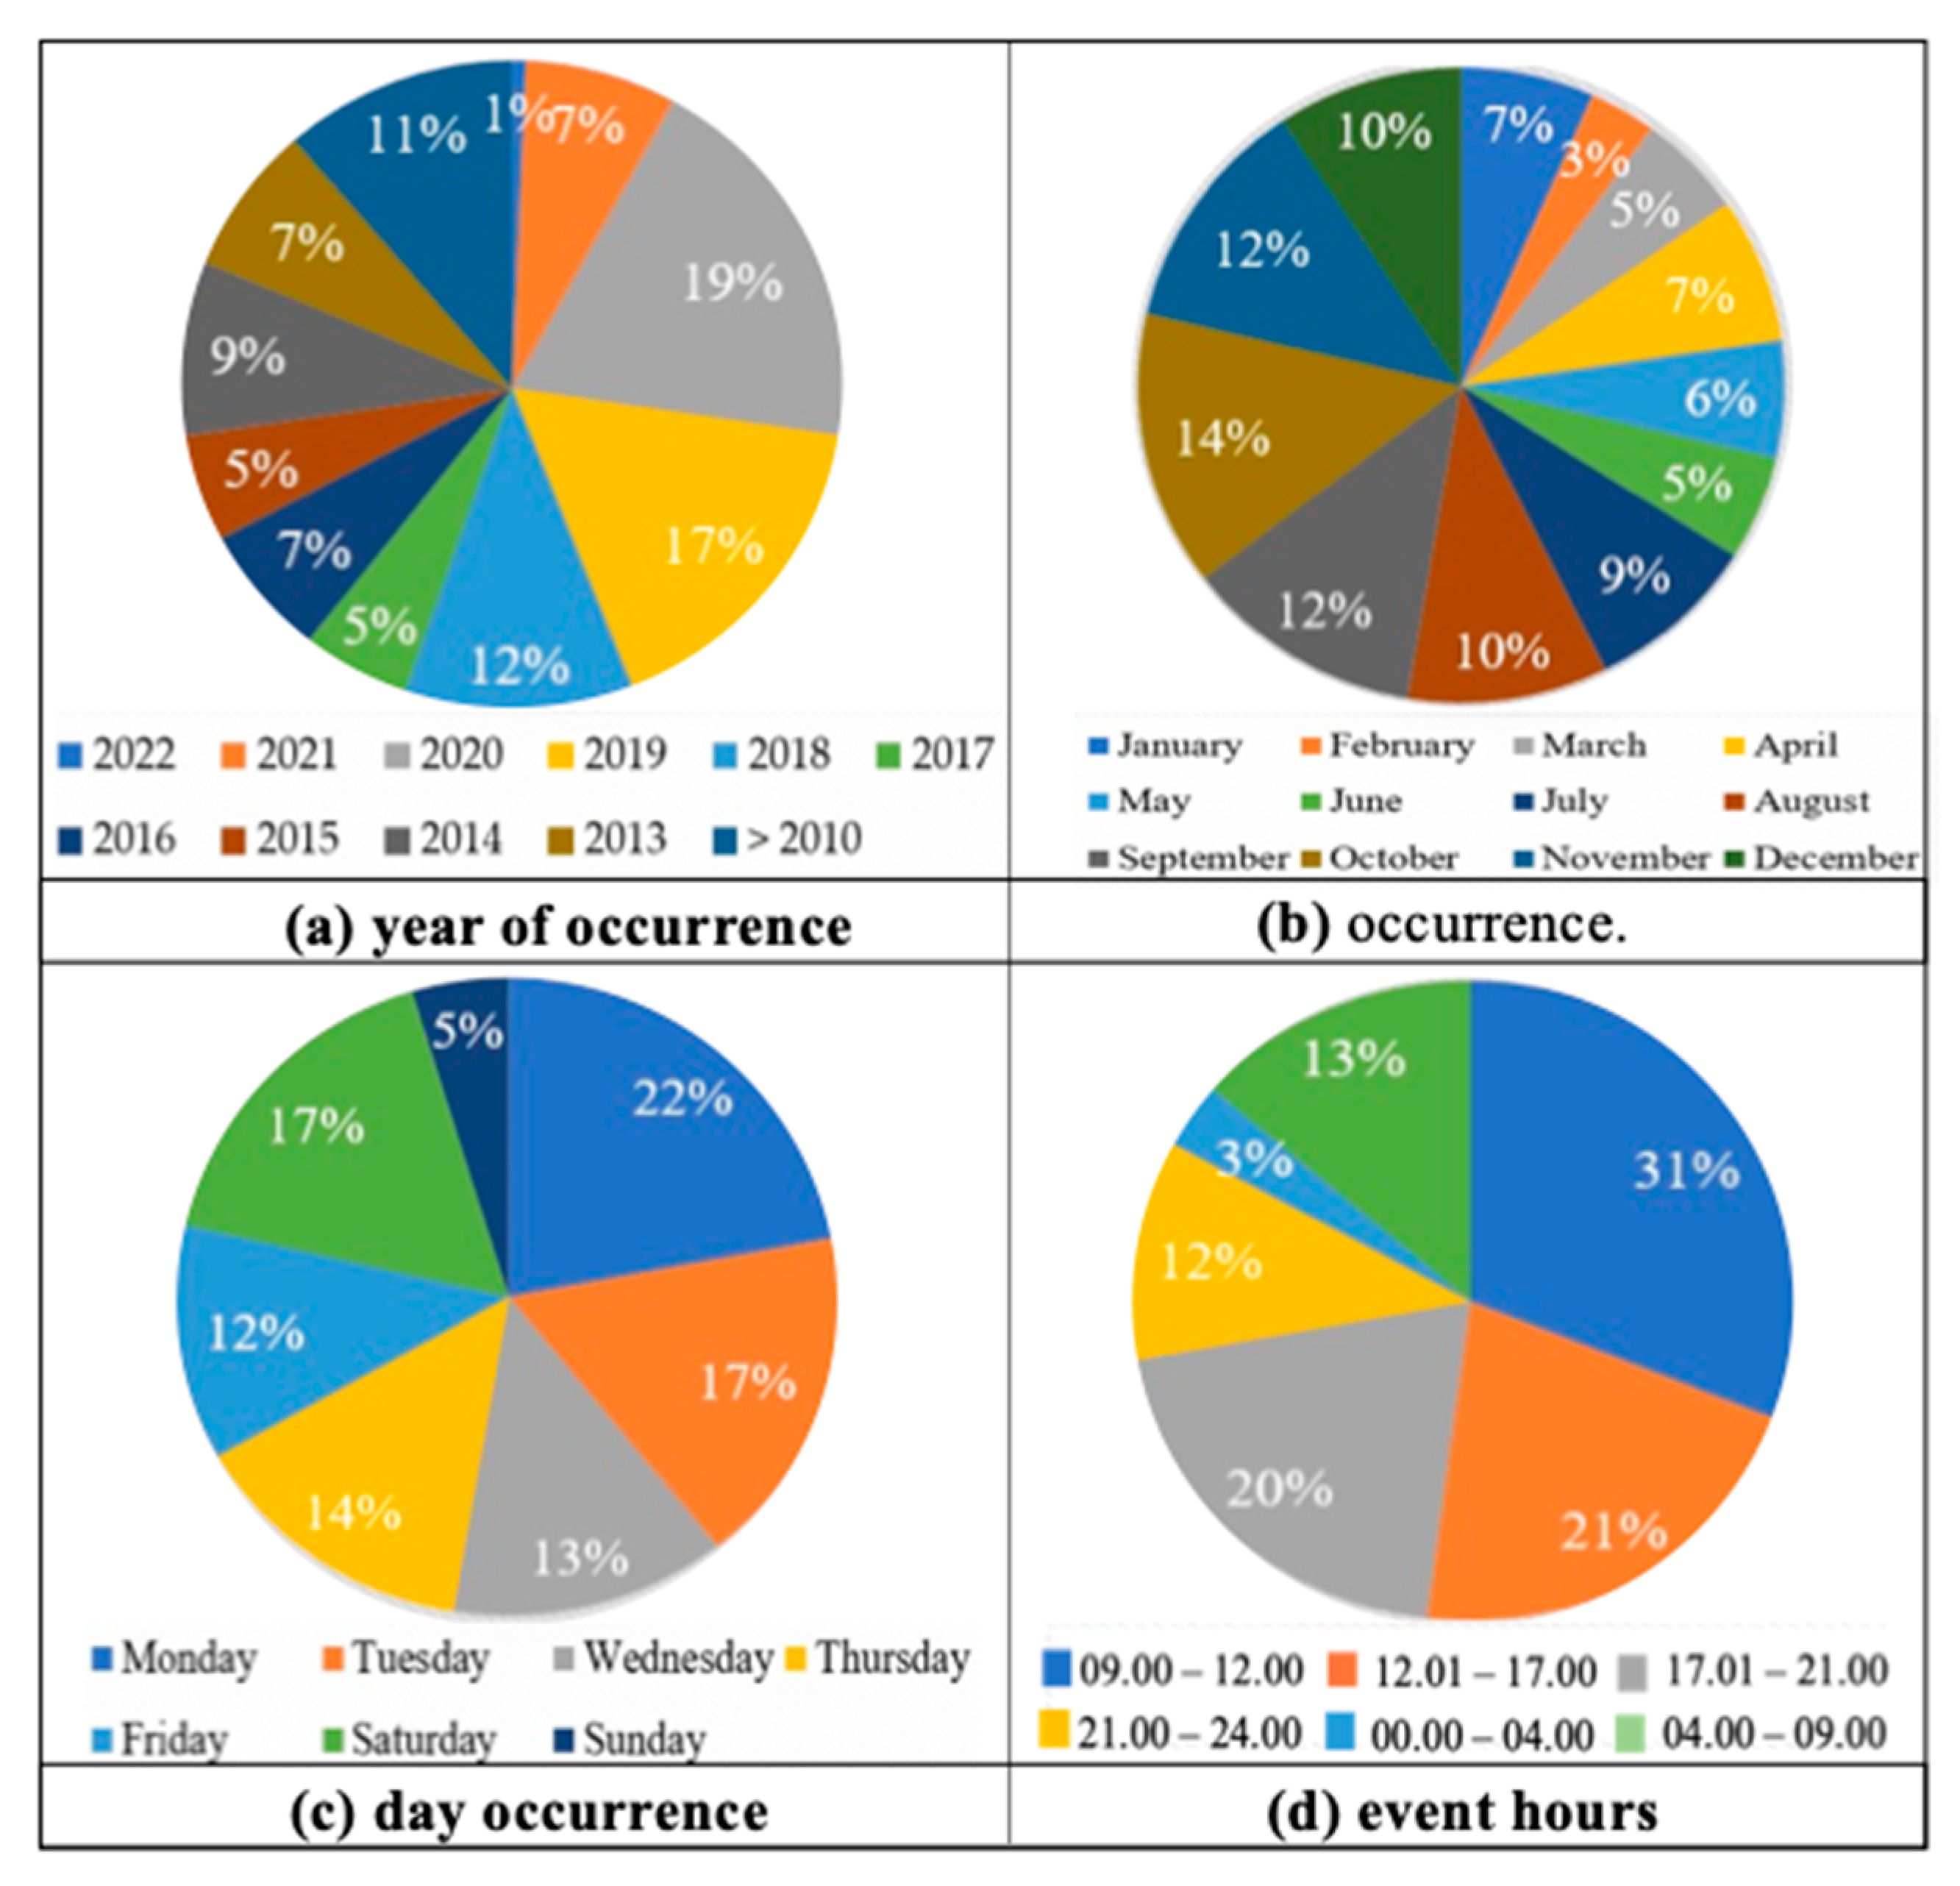
5.2. CACD Characteristics by Location and Time

The cases reviewed for this study were sourced from 26 of Indonesia’s 38 provinces (Figure 4). Accidents were most frequent in West Java (20 cases), East Java (24 cases), and Riau (20 cases), and attention to improved safety should be focused in these areas [59]. West Java is home to the capital Jakarta, and thus it attracts a disproportionate amount of capital investment and labor, resulting in disproportionately high numbers of construction accidents and deaths. Article 23 of the Indonesian Constitution (1992) requires employers to ensure workers are provided safe working conditions and protective equipment. In densely populated areas, management should seek to implement the 12 actions proposed by Wang [53] (see Table 5). In many cases, it appears that developers and contractors are prioritizing speed and cost reduction over implementing government safety policies.
Figure 6a shows consistently higher incident rates in three consecutive years, 2018–2020. Data from the Social Security Administration Agency (BPJS) (2018) reported 123,041 cases in 2017 and 173,105 in 2018. The Minister of Manpower (Menaker), Hanif Dhakiri, said, “To prevent construction accidents from occurring this year, the Minister of Manpower again invites all employers, trade unions, workers and the public to continue to increase awareness of the importance of construction safety and its supervision”. Data for 2017–2019 showed that accidents were primarily due to incidents on toll roads or other road works (e.g., Bocini toll road, Paspro toll road, Cikampek toll road, Ciputra Bridge, Pemalang toll road, girders on the Depok–Antasari toll road, and toll road concrete pier work) and some related to light rail transit (LRT). This matches the major project types being undertaken at the time.
Figure 6a shows that accident rates increase from August to December, matching the project implementation cycle in Indonesia, with projects winding down toward the end of the year, where the rainy season begins. This follows similar seasonal findings by Szer et al. [60], who showed that the risk of accidents in Poland increased during the period July–September. The proposed solution in this situation is the installation of environmental monitoring equipment, allowing for work to be delayed in adverse conditions, thereby mitigating weather-related injuries. In terms of days of the week, the highest number of accidents are concentrated on Monday, Tuesday, and Saturday, during effective working hours, with the morning shift accounting for 31% of cases, followed by the afternoon shift (21%). The International Labor Office (ILO) notes that fatigue due to insufficient rest can lead to accidents and requires management to ensure workers have adequate rest periods and that work schedules are limited to a reasonable number of hours.

5.3. Scenario Analysis and Descriptive Statistics

In terms of the seven CACD categories, the greatest concentration of accidents is related to collisions with construction machinery, accounting for 62 cases out of 133 (46%), followed by being struck by falling or flying objects. This indicates that safety ordinances need to be followed more closely and that workers must be better trained to operate work vehicles safely. Improved vehicle suitability standards are also required to prevent accidents due to improper vehicle use [29]. Negligence and non-compliance with safety standards had a direct impact in several cases, such as heavy equipment operators failing to adequately clear the work area. Other incidents resulted from failure to adequately secure lifted loads, resulting in crushing injuries. Another case resulted from poor brake maintenance of a vehicle which subsequently struck workers. Improved regulatory compliance and understanding of vehicle operational parameters are important parts of reducing such worksite accidents. Compliance is also required for safety equipment. The use of high-visibility materials is critical to preventing collisions and other objects, and personal protection equipment (PPE) such as helmets, vests, gloves, glasses, boots, and earplugs needs to be worn as standard equipment.
In terms of the accident medium, 36% of accidents were attributable to construction machinery, primarily involving workers being struck by project vehicles during on-site vehicle maneuvers, loading, unloading, and transportation of goods. In terms of accident type, being struck by a project vehicle accounted for 44.67% of cases, and a similar percentage of cases impacted multiple body parts. Nnaji et al. [61] found a rising trend in injuries and deaths on highway construction projects, mainly due to unsafe driver behavior, often described as “driving while distracted”, or attributable to nighttime highway construction work. The use of appropriate data can provide effective accident prevention strategies tailored to the relevant job and the types of accidents to which the job is prone [62,63,64]. Koulinas et al. [65] showed that the most critical project risks are related to the use of machinery and vehicles, workers falling from heights, structural failures, and ground collapse.
Analysis results show that temporary work has a significant Phi (ϕ) value, 0.000 < 0.005 (ⲁ), and a Cramer’s V value of 0.708 (strong correlation) as the cause of accidents in highway work. Preventive measures include the use of appropriate PPE and the installation of warning signs and lights when working at night. The analysis results provide insight into the type of media related to accidents, namely construction machinery, with a value of 0.000 < 0.005 for (ⲁ) and a Cramer’s V value of 0.863 (showing a strong and positive correlation for causes of accidents on roadway works).
Continuous and on-the-job professional development programs need to be implemented for machine operators that carry out loading and unloading processes, along with the establishment of standard operating procedures to ensure vehicle suitability, worker conditions, climate conditions, and worker suitability (i.e., managing health issues or alcohol consumption). These factors are very important in preventing accidents related to road construction projects. The value of research results for construction practitioners and regulators could be improved by increasing the number of CACDs and cases currently in process (during the trial period) and providing data differentiation notifications to obtain more optimal solutions in the process of characterizing causal factors and accident trends.

6. Conclusions

This study uses CACD reports in Indonesia to evaluate accident likelihood scenarios and explore effective methods for reducing potential risks to workers. It was found that most accidents between 2018 and 2021 occurred in the West Java province, followed by East Java and Central Java. Furthermore, accidents were most frequent in August and September and on Mondays, Tuesdays, and Saturdays. The morning shift (09.00–12.00) had the highest risk, followed by the afternoon shift (12.01–17.00).
Using scenario analysis, the CACD data were rearranged into accident categories. Tests were conducted on descriptive statistics (Cramer’s v and Phi). Correlation and significance values for each category were determined. From the initial categories, based on the calculations following Drury and Brill, seven categories were obtained. The following analysis uses descriptive statistics with inter-category values between project type and media (0.350), project type with task type (0.350), task type with medium (0.380), accident type with accident (0.474), accident type with project type (0.537), and accident type with type task (0.474) with a phi value range between 0.000 and 0.001. From a value that meets Cramer’s v and phi, four significant categories were obtained (project type, task type, accident type, and medium type). The results of the cross-tabulation test between two categories were used to highlight correlated categories. Analysis results showed that toll road works accounted for 52% of accident cases, with collisions with construction machinery being the most frequent accident type (36% or 76 cases). For work type, lifting and moving goods had respective phi and Cramer values of 0.534 and 0.001.
CACD rulings provide a potential data source for further improvements in construction safety, allowing for the effective establishment of improvement priorities for various types of road work projects because most previous research results were based on a variety of data sources (e.g., accident case reports, official incident reports) and focused on high-rise developments and falls from heights. Witness testimony can also be a source of useful information for the design and implementation of effective safety measures. CACD reports provide important information for practitioners and regulators to strengthen the implementation of safety protocols and thus deter behavior that can lead to accidents.
The research findings highlight the need to redouble efforts to ensure that all worksite regulations are followed. The development and implementation of SOPs can effectively improve work habits, thereby enhancing safety in loading and unloading activities, maneuvering project vehicles, and worker movement in the project area. The installation of proper signage and lighting in work areas and material storage locations would also help reduce accidents. Management should also make efforts to ensure employees have access to the correct PPE to reduce accidents on roadways. Characteristics extracted from accident cases provide another perspective for safety management practitioners to focus on roadway projects with different types of transport and material moving tasks. Further improving the analysis of CACD decisions requires expanding the sample of current and future cases.

Author Contributions

Conceptualization, T.A.B. and W.T.C.; methodology, T.A.B.; software, T.A.B. and M.B.R.; validation, T.A.B., M.M. and W.T.C.; formal analysis, T.A.B., M.B.R. and W.T.C.; investigation, M.M. and M.B.R.; resources, W.T.C.; data curation, M.M. and M.B.R.; writing—original draft preparation, T.A.B. and W.T.C.; writing—review and editing, W.T.C.; visualization, M.M. and M.B.R.; supervision, W.T.C.; project administration, T.A.B. All authors have read and agreed to the published version of the manuscript.

Funding

This research received no external funding.

Data Availability Statement

The data used to support the case study are available from the corresponding author upon request.

Conflicts of Interest

The authors declare no conflicts of interest.

References

  1. Berglund, L.; Johansson, M.; Nygren, M.; Samuelsen, B.; Stenberg, M.; Johansson, J. Occupational accidents in Swedish construction trades. Int. J. Occup. Saf. Ergon. 2019, 25, 552–561. [Google Scholar] [CrossRef] [PubMed]
  2. Elsabaei, M.A.; Elnawawy, O.; Badawy, M.; Othman, A.A.E. Causes and impacts of site accidents in the Egyptian construction industry. Int. J. Construc. Manag. 2020, 20, 2659–2670. [Google Scholar] [CrossRef]
  3. Sanni-Anibire, M.O.; Mahmoud, A.S.; Hassanain, M.A.; Salami, B.A. A risk assessment approach for enhancing construction safety performance. Saf. Sci. 2020, 121, 15–29. [Google Scholar] [CrossRef]
  4. Chen, Q.; Jin, R. A comparison of subgroup construction workers’ perceptions of a safety program. Saf. Sci. 2015, 74, 15–26. [Google Scholar] [CrossRef]
  5. Liao, P.C.; Shi, H.; Su, Y.; Luo, X. Development of data-driven influence model to relate the workplace environment to human error. J. Constr. Eng. Manag. 2018, 144, 3. [Google Scholar] [CrossRef]
  6. Cheung, W.F.; Lin, T.H.; Lin, Y.C. A real-time construction safety monitoring system for hazardous gas integrating wireless sensor network and building information modeling technologies. Sensors 2018, 18, 436. [Google Scholar] [CrossRef] [PubMed]
  7. Mohammadi, A.; Tavakolan, M.; Khosravi, Y. Factors influencing safety performance on construction projects: A review. Saf. Sci. 2018, 109, 382–397. [Google Scholar] [CrossRef]
  8. Magda, S.; Yustiarini, D.; Nurasiyah, S. Literature study: Analysis of potential work accidents in construction projects using hazard identification, risk assessment, and risk control methods. Sci. J. Eng. Voc. Educ. 2023, 16, 62–69. [Google Scholar] [CrossRef]
  9. Şimşek, A.B.; Köse, G.; Göktekin, Z. Evaluating country performance in preventing industrial accidents: A multi-criteria decision analysis approach. J. Loss Preven. Process Ind. 2024, 87, 105241. [Google Scholar] [CrossRef]
  10. Total Population by Country. 2023. Available online: https://worldpopulationreview.com/countries (accessed on 14 February 2024).
  11. Mugiati, B.B. Juridical Analysis of the Legal Role of Occupational Health and Safety Management. In MIC 2023: Proceedings of the 3rd Multidisciplinary International Conference, MIC 2023, Jakarta, Indonesia, 28 October 2023; European Alliance for Innovation: Bratislava, Slovakia, 2023; p. 450. Available online: https://books.google.co.id/books?hl=id&lr=&id=3rfuEAAAQBAJ&oi=fnd&pg=PA450&dq=Experiences+265,334+Work+Accident+Cases+as+of+November+2022&ots=x2V6OF9oDM&sig=MMtAnRFmnD3VAdaoknRkGpJfDZg&redir_esc=y#v=onepage&q&f=false (accessed on 22 January 2024).
  12. Zhang, J.; Zhang, W.; Xu, P.; Chen, N. Applicability of accident analysis methods to Chinese construction accidents. J. Saf. Res. 2019, 68, 187–196. [Google Scholar] [CrossRef]
  13. Taylan, O.; Bafail, A.O.; Abdulaal, R.M.S.; Kabli, M.R. Construction projects selection and risk assessment by fuzzy AHP and fuzzy TOPSIS methodologies. Appl. Soft Comp. 2014, 17, 105–116. [Google Scholar] [CrossRef]
  14. Chong, H.Y.; Low, T.S. Accidents in Malaysian construction industry: Statistical data and court cases. Int. J. Occup. Saf. Ergon. 2014, 20, 503–513. [Google Scholar] [CrossRef] [PubMed]
  15. Birgonul, T.M.; Dikmen, I.; Budayan, C.; Demirel, T. An expert system for the quantification of fault rates in construction fall accidents. Int. J. Occup. Saf. Ergon. 2016, 22, 20–31. [Google Scholar] [CrossRef] [PubMed]
  16. Li, R.Y.M. Modelling Construction Accident Tort Cases. In Construction Safety Informatics; Springer: Singapore, 2019; pp. 13–25. [Google Scholar] [CrossRef]
  17. Li, R.Y.M.; Li, H.C.Y.; Tang, B.; Au, W.C. Classification of construction accident court cases via natural language processing in Hong Kong. In Current State of Art in Artificial Intelligence and Ubiquitous Cities; Springer: Singapore, 2022; pp. 79–89. [Google Scholar] [CrossRef]
  18. Davis, M.; Akenhead, Q.R. Technology and Construction Court: Practice and Procedure; Oxford Academic: Oxford, UK, 2023. [Google Scholar]
  19. Sianturi, B.M.T.; Widagdo, D.S.H. The Elements of unlawful acts as the basis for claims in land disputes. J. Sover. Law 2023, 5, 366–378. [Google Scholar]
  20. Megnidio-Tchoukouegno, M.; Adedeji, J.A. Machine learning for improvement of road traffic accidents and management of environmental resources in the transportation sector. Sustainability 2023, 15, 2014. [Google Scholar] [CrossRef]
  21. Gao, P.; Zhou, L.; Zhao, X.; Shao, B. Research on the planning of ship collision avoidance paths based on modifications of the potential field ant colony algorithm. Mar. Coast. Manag. 2023, 235, 106482. [Google Scholar] [CrossRef]
  22. Jiang, S.; Wu, Y.; Zhang, J. Bridge coating inspection based on two-stage automatic method and impact-resistant unmanned aerial system. Autom. Constr. 2023, 46, 104685. [Google Scholar] [CrossRef]
  23. Karamanou, A.; Kalampokis, E.; Tarabanis, K. Integrated statistical indicators of open government data relating to Scotland. Brief Data 2023, 46, 108779. [Google Scholar] [CrossRef] [PubMed]
  24. Selleck, R.; Cattani, M.; Hassall, M. Proposal for and validation of novel risk-based process to reduce the risk of construction site fatalities (Major Accident Prevention (MAP) program). Saf. Sci. 2023, 158, 105986. [Google Scholar] [CrossRef]
  25. Li, R.Y.M.; Chau, K.W.; Ho, D.C.W. Dynamic panel analysis of construction accidents in Hong Kong. Asian J. Law Econ. 2017, 8, 20160022. [Google Scholar] [CrossRef]
  26. Olcay, Z.F.; Sakalli, A.E.; Temur, S.; Yazici, A. A study of the shift in fatal construction work-related accidents during 2012–2019 in Turkey. Int. J. Occup. Saf. Ergon. 2022, 28, 1522–1532. [Google Scholar] [CrossRef] [PubMed]
  27. Osei-Asibey, D.; Ayarkwa, J.; Acheampong, A.; Adinyira, E.; Amoah, P. Impacts of accidents and hazards on the Ghanaian construction industry. Int. J. Constr. Manag. 2023, 23, 708–717. [Google Scholar] [CrossRef]
  28. Syarifuddin, S.; Anwar, A.; Indori, P. Analysis of work health and accidents using the fault tree analysis (FTA) method in the collection station area at PT. Pertamina Ep. asset 1 rantau field. Ind. Eng. J. 2020, 9, 2. [Google Scholar] [CrossRef]
  29. Putri, D.N.; Lestari, F. Literature Review: Analysis of the causes of work accidents in workers on construction projects. J. Ners Comm. 2023, 13, 170–184. [Google Scholar]
  30. Mei, Y.; Huang, J.; Liu, J.; Jia, L. A Study of Factors Influencing Construction Workers’ Intention to Share Safety Knowledge. Buildings 2024, 14, 440. [Google Scholar] [CrossRef]
  31. Noor, R.; Harianto, F.; Susanti, E. Characteristics of work accidents in construction project implementation in Surabaya. J. ITATS 2018, 1, 1–10. Available online: https://jurnal.itats.ac.id/wp-content/uploads/2018/08/Proseding-SNTEKPAN-II-ITATS-2014-Karakteristik-Kecelakaan-Kerja-Pada-Pelaksanaan-Proyek-Konstruksi-Di-Surabaya.pdf (accessed on 21 January 2024).
  32. McKinnon, R.C. The Cause, Effect, and Control of Accidental Loss; CRC Press: Boca Raton, FL, USA, 2023. [Google Scholar] [CrossRef]
  33. Wijaya, I.G.N.P.; Jaya, N.M.; Sudarsana, I.G.K. Occupational safety and health (OSH) risk management in the implementation of the Denpasar-Singaraja shortcut development. Spektran J. 2022, 10, 52–63. [Google Scholar] [CrossRef]
  34. Surbakti, A.A.; Brilian, M.; Rizalitaher, A.S.; Signori, I.; Widodo, W. Socialization of occupational health and safety (OSH) for workers construction on bridge projects. Indones. J. Soc. Dev. 2023, 2, 23–32. [Google Scholar] [CrossRef]
  35. Muhibuddin, M.; Syahbandir, M.; Rasyid, M.N. Juridical review of limitations on cassation legal remedies in cases of lawsuits against regional official decisions. Syiah Kuala Law J. 2017, 1, 67–82. [Google Scholar] [CrossRef]
  36. Lu, Z. Analysis of China students’ laboratory accidents in the past 39 years and the laboratory management reform in the future. Educ. Chem. Eng. 2023, 42, 54–60. [Google Scholar] [CrossRef]
  37. Yang, Y.; Wang, Y.; Easa, S.M.; Yan, X. Risk factors influencing tunnel construction safety: Structural equation model approach. Heliyon 2023, 9, 1. [Google Scholar] [CrossRef] [PubMed]
  38. Xu, Q.; Xu, K. Analysis of the characteristics of fatal accidents in the construction industry in China based on statistical data. Int. J. Environ. Res. Public Health 2021, 8, 2162. [Google Scholar] [CrossRef] [PubMed]
  39. Jin, R.; Wang, F.; Liu, D. Dynamic probabilistic analysis of accidents in construction projects by combining precursor data and expert judgments. Adv. Eng. Inf. 2020, 44, 101062. [Google Scholar] [CrossRef]
  40. Choi, J.; Gu, B.; Chin, S.; Lee, J.S. Machine learning predictive model based on national data for fatal accidents of construction workers. Autom. Constr. 2020, 110, 102974. [Google Scholar] [CrossRef]
  41. Chan, A.P.; Yang, Y.; Choi, T.N.; Nwaogu, J.M. Characteristics and causes of construction accidents in a large-scale development project. Sustainability 2022, 14, 4449. [Google Scholar] [CrossRef]
  42. Hidayat, B.; Ferial, R.; Anggraini, N. Construction Project Work Accidents in Indonesia 2005–2015: Content Analysis Review of News Articles; Universitas Atma Jaya Yogyakarta: Depok, Indonesia, 2016; Volume 1, pp. 311–318. Available online: https://www.researchgate.net/publication/309547245_KECELAKAAN_KERJA_PROYEK_KONSTRUKSI_DI_INDONESIA_TAHUN_2005-2015_TINJAUAN_CONTENT_ANALYSIS_DARI_ARTIKEL_BERITA_Construction_Work_Accidents_in_Indonesia_2005-2015_Review_with_Content_Analysis_Method_on (accessed on 4 March 2024).
  43. Dangga, P.O.; Munasih; Winanda, L.A.R. Study of factors causing construction accidents. J. Sondir 2021, 5, 24–31. [Google Scholar] [CrossRef]
  44. Martiwi, R.; Koesyanto, H.; Paweh, E.T. Risk factors for work accidents in building construction. HIGEIA J. Public Health Res. Dev. 2017, 1, 61–71. Available online: https://journal.unnes.ac.id/sju/index.php/higeia/article/view/15357 (accessed on 15 January 2024).
  45. Sulistyaningtyas, N. Analysis of factors causing work-related accidents in construction workers: Literature review. J. Health Qual. Dev. 2021, 1, 51–59. [Google Scholar] [CrossRef]
  46. Yuan, T.; Shu, B.; Li, H.; Xiong, L. Mapping risk scenarios of environmental impact assessment accidents in construction projects. Environ. Imp. Assess. Rev. 2023, 102, 107190. [Google Scholar] [CrossRef]
  47. Idrees, M.D.; Hafeez, M.; Kim, J.Y. Workers age and the impact of psychological factors on the perception of safety at construction sites. Sustainability 2017, 9, 745. [Google Scholar] [CrossRef]
  48. Arifandi, F.R.; Harianto, F.; Ferdaus, M.A.N. Causes and control of work accidents in factory warehouse construction projects. J. Natl. Semin. Appl. Sci. Technol. IX ITATS 2021, 9, 161–167. Available online: http://ejurnal.itats.ac.id/sntekpan/article/view/2222 (accessed on 10 January 2024).
  49. Chen, W.T.; Wang, W.T.; Liao, P.C.; Merret, H. Scenario analysis of fatal construction accidents—A Taiwanese perspective. Int. J. Org. Innov. 2018, 10, 4. Available online: https://ijoi-online.org/attachments/article/56/FINAL%20ISSUE%20VOL%2010%20NUM%204%20APRIL%202018%20SECTION%20C.pdf#page=72 (accessed on 10 December 2023).
  50. Aziz, A.; Amir, M.A.U.; Sariff, A.R.; Rosly, A. Helicopter ditching incident analysis: Clasification of risk factor. J. Eng. Sci. Technol. ICIST 2023, 18, 113–122. Available online: https://jestec.taylors.edu.my/Special%20Issue%20ICIST%202022_1/ICIST_1_10.pdf (accessed on 13 January 2024).
  51. Dempsey, P.G. Accident and Incident Investigation. In Handbook of Human Factors and Ergonomics; John Wiley & Sons: Hoboken, NJ, USA, 2021; pp. 843–852. [Google Scholar] [CrossRef]
  52. Hanapi, N.M.; Kamal, M.M.M.; Ismail, M.I.; Putera, A.I.A. Identification of Causes and Mitigation Measures of Construction Fall Accidents of Class a and Class b Contractors in Shah Alam Area, University Teknologi MARA (Pahang). 2013. Available online: https://ir.uitm.edu.my/id/eprint/41055/1/41055.PDF (accessed on 5 January 2024).
  53. Wang, Z.; Bhamra, R.S.; Wang, M.; Xie, H.; Yang, L. Critical Hazards Identification and Prevention of Cascading Escalator Accidents at Metro Rail Transit Stations. Intl. J. Environ. Res. Public Health 2020, 17, 3400. [Google Scholar] [CrossRef] [PubMed]
  54. Hanapi, N.M.; Kamal, M.M.M.; Ismail, M.I.; Putera, A.I.A. Identifying root causes and mitigation measures of construction fall accidents. Gading J. Soc. Sci. 2013, 17, 65–79. [Google Scholar]
  55. Joghataei, A.; Gholamnia, R.; Khaloo, S.S.; Khodakarim, S.; Saeedi, R. Burden of injury due to occupational accidents and its spatiotemporal trend at the national and subnational levels in Iran, 2011–2018. Int. Arch. Occup. Environ. Health 2023, 96, 1061–1076. [Google Scholar] [CrossRef] [PubMed]
  56. Yang, J.F.; Wang, P.C.; Liu, X.Y.; Bian, M.C.; Chen, L.C.; Lv, S.-Y.; Tao, J.-F.; Suo, G.-Y.; Xuan, S.-Q.; Li, R.; et al. Analysis on causes of chemical industry accident from 2015 to 2020 in Chinese mainland: A complex network theory approach. J. Loss Prevent. Process Ind. 2023, 83, 105061. [Google Scholar] [CrossRef]
  57. Shuang, Q.; Zhang, Z. Determining critical cause combination of fatality accidents on construction sites with machine learning techniques. Buildings 2023, 13, 345. [Google Scholar] [CrossRef]
  58. Satudata. Indonesian National Occupational Safety and Health for 2022. Profile. Available online: https://satudata.kemnaker.go.id/publikasi/75 (accessed on 25 October 2023).
  59. Kondolele, Y.B. Analysis of Determining Factors of Environmental Quality on the Island of Java. Ph.D. Dissertation, Hasanuddin University, Makassar, Indonesia, 2023. Available online: https://journal.unhas.ac.id/index.php/jeds/article/view/28100 (accessed on 10 February 2024).
  60. Szer, I.; Kaszubska, M.; Miszczak, H.B. Influence of the seasons on construction site accidents. Arch. Civ. Eng. LXVII 2021, 3, 489–504. [Google Scholar] [CrossRef]
  61. Nnaji, C.; Lee, H.W.; Karakhan, A.; Gambatese, J. Developing a decision-making framework to select safety technologies for highway construction. J. Constr. Eng. Manag. 2018, 144, 4. [Google Scholar] [CrossRef]
  62. Chen, W.T.; Merrett, H.C.; Huang, Y.H.; Bria, T.A.; Lin, Y.H. Exploring the relationship between safety climate and worker safety behavior on building construction sites in Taiwan. Sustainability 2021, 13, 3326. [Google Scholar] [CrossRef]
  63. Chen, W.T.; Bria, T.A. A review of ontology-based safety management in construction. Sustainability 2023, 15, 413. [Google Scholar] [CrossRef]
  64. Kao, C.H.; Chen, W.T.; Ho, C.K. Using network analysis theory to extract critical data from a construction project. Buildings 2023, 13, 1539. [Google Scholar] [CrossRef]
  65. Koulinas, G.K.; Demesouka, O.E.; Marhavilas, P.K.; Orfanos, N.I.; Koulouriotis, D.E. Multicriteria health and safety risk assessments in highway construction projects. Sustainability 2023, 15, 9241. [Google Scholar] [CrossRef]
Figure 1. Indonesia’s population relative to other leading nations (2023). Source: https://worldpopulationreview.com/countries (accessed on 20 March 2024).
Buildings 14 01010 g001
Figure 2. CACD data processing flow.
Buildings 14 01010 g002
Figure 3. Flow chart of analysis methods in CACD.
Buildings 14 01010 g003
Figure 4. Coding data for category accident characteristics.
Buildings 14 01010 g004
Figure 5. Distribution of CACD accident cases by provincial area.
Buildings 14 01010 g005
Figure 6. CACD distribution.
Buildings 14 01010 g006
Table 1. Accident classification.
Type of Accident
Falls; being hit by an object (falling or otherwise); being caught in equipment; excessive movement; exposure to high temperatures, electric current, hazardous materials, or radiation.
According to objects
Project engine; project equipment; lifting equipment and transportation facilities; scaffolding; other.
Type of Injury
Bone fracture; dislocation, sprain; concussion; laceration; breathing difficulty.
Wound Location
Neck; body; hand; multiple locations.
Table 2. Classification of workplace losses.
Type of LossLossInformation
CostWelfare costsLosses resulting from the implementation of worker welfare benefits.
Pay full salaryContinuing full wages to injured workers after they return to work, even if their work capacity is reduced.
Company profitsLost opportunities due to reduced productivity of injured workers and idle machines.
Typical costs per injured workerStandard overhead costs (lighting, heating, and rent) continue despite declining worker productivity, highlighting the impact of hidden costs borne by organizations.
Incidental losses due to production interruptionsFailure to fulfill orders on time, loss of bonuses, payment of fines, etc.
TimeLosses due to loss timeWorker injuries result in downtime.
Losses due to loss time of other workersWorkers stop working out of curiosity, concern, or to help another employee.
Losses due to loss time for foremen, supervisors, or other leadersSupervisor attention is diverted to attending to injured workers, investigating accident causes, maintaining production processes, recruiting, training new workers, or preparing accident reports.
Physical and mentalMental lossLosses arising from tension or reduced morale after an accident (e.g., depression).
Losses resulting from use of first aid and internal medical staffCauses that are not covered by insurance.
Objects and equipmentLosses due to damage to machines, tools, or other equipmentDue to assisting injured employees, investigating the causes of accidents, organizing the continuation of the production process, selecting, and training new workers, and preparing accidents reports.
Table 3. ILO guidance on mitigation of industrial workplace accidents.
PriorityWorkplace Accident Mitigation
1Fulfill regulations related to work safety
2Determine standardization
3Enforce regulations that must be complied with in the form of supervision
4Conduct technical research
5Conduct psychological research
6Conduct medical research
7Conduct statistical research
8Conduct education and training regarding work safety
9Apply various persuasion methods
11Provide insurance coverage
12Ensure each worker takes appropriate safety measures
Table 4. Hypothesis testing.
StepAction
1Propose hypothesis
H0: ∅ = 0 (i.e., There is no correlation between the two variables.)
H1: ∅ ≠ 0 (i.e., There is a correlation between the two variables.)
2Level of significance, α
3Statistical test using Equation (1): Ê i j = R i C n  
4Rejection boundary, H0 is rejected where χ2χ2 with df = 1, referring to table Chi-square.
5Accept or reject the hypothesis using the statistical values with reference to the critical value.
Note: “Ê” is the expected value, “R” is the number of rows, C is the number of columns and “n” is the total number of observations.
Table 5. Procedural steps for generating the descriptive statistical data.
StepOverviewDescription
1Collect dataCollect the data to be analyzed. Make sure the data are complete, valid, and relevant to the purpose of the descriptive analysis.
2Organize dataOrganize data in suitable form for descriptive statistical analysis. Organize the data in a structured format.
3Calculate the central measuresCalculate data center measures such as mean (average), median (middle value), and mode (most frequently occurring value) for each variable to be analyzed. This provides an idea of the “middle value” or value that represents the data.
4Calculate the size of the data spreadCalculate the size of the data spread such as range (the difference between the maximum and minimum values), variance, and standard deviation for each variable. This will provide information about how far the data are spread around the mean value.
5Describe the data graphicallyCreate appropriate graphs or charts to visualize the data. For example, a histogram can be used to see the frequency distribution of data, a bar chart or pie chart to compare categories, or a scatter plot to see the relationship between two variables.
6Analyze the dataFurther analysis can be performed by comparing frequency distributions, identifying outliers (values that are far from other values), or looking for patterns or relationships between variables.
7Interpret resultsInterpret the results of your descriptive statistical analysis, and draw relevant conclusions based on the findings. Present results clearly and concisely, using appropriate metrics for each variable analyzed.
8Report findingsPresent a report or document containing the results of descriptive statistical analysis. Use tables, graphs, and narratives to explain your findings clearly. Make sure your report is easy to understand for readers who do not have in-depth statistical knowledge.
Table 6. CACD categories showing highly significant correlations.
CategoryMediumProjectTask
Project0.350/0.001
Task0.380/0.0000.350/0.001
Accident0.474/0.0000.537/0.0000.474/0.000
Table 7. Description of phi analysis category to sub category.
Accident TypeMediumAnalysisSig.
TotalLiquidPhi0.000
Cramer’s V0.000
Electric wirePhi0.315
Cramer’s V0.315
Steel beamPhi0.224
Cramer’s V0.224
Concrete beamPhi0.359
Cramer’s V0.359
Construction machinePhi0.000
Cramer’s V0.000
MaterialPhi0.274
Cramer’s V0.274
Transportation and lifting equipmentPhi0.041
Cramer’s V0.041
RoofingPhi0.415
Cramer’s V0.415
TotalPhi0.003
Cramer’s V0.003
Disclaimer/Publisher’s Note: The statements, opinions and data contained in all publications are solely those of the individual author(s) and contributor(s) and not of MDPI and/or the editor(s). MDPI and/or the editor(s) disclaim responsibility for any injury to people or property resulting from any ideas, methods, instructions or products referred to in the content.

