Article

Seismic Performance Evaluation of a Chilean RC Building Damaged during the Mw8.8 Chile Earthquake

Department of Civil Engineering, University of Chile, Av. Blanco Encalada 2002, Santiago 8370449, Chile
*
Author to whom correspondence should be addressed.
Buildings 2024, 14(4), 1028; https://doi.org/10.3390/buildings14041028
Submission received: 22 February 2024 / Revised: 26 March 2024 / Accepted: 4 April 2024 / Published: 7 April 2024
(This article belongs to the Section Building Structures)

Abstract

:
Chile, recognized as one of the world’s most earthquake-prone nations, has gained valuable insights from significant earthquakes, such as those in 1985 and 2010, which have influenced updates to the nation’s design codes. Although Chile’s seismic design approach has been largely effective in recent earthquakes and demonstrated an “operational” performance level in most structures, performance-based design (PBD) methods have not yet been officially incorporated as valid approaches in the Chilean seismic design codes for buildings. However, in 2017, the Chilean Association on Seismology and Earthquake Engineering (ACHISINA) introduced a PBD approach, primarily for verification purposes, based on the Los Angeles Tall Buildings Structural Design Council (LATBSDC) framework. In this work, firstly, we provide an overview of Chile’s PBD methodology, focusing on the thresholds for various performance levels. These levels are established through experimental and numerical analysis, correlating performance with permissible damage levels. The second part of the paper examines the seismic performance of a residential building, designed before the 2010 Maule earthquake and subsequently damaged, using Chile’s PBD guidelines. This case study highlights the implementation and effectiveness of PBD for assessing seismic resilience in Chilean structures.

1. Introduction

The fundamental objective of seismic engineering is to ensure that structures exhibit appropriate behavior during seismic events occurring over their operational lifespan. Although construction regulations have been in place since 1923, it was only in the aftermath of the devasting Kanto earthquake, which severely impacted Tokyo, that the first seismic construction code was established in Japan, incorporating specific seismic parameters [1].
The standard code seismic provisions aim to provide a minimum level of safety for designed buildings. However, these provisions contain many requirements that are not specifically applicable to tall buildings, which can result in designs that are suboptimal from both a cost and safety perspective.
The seismic codes have evolved since then, and although several seismic-resistant design methodologies exist, for a significant period, the prevailing approach has been force-based design. With time, diverse seismic design methodologies have evolved, prompted by the recognition that strength-based or force-based design inadequately characterizes structural behavior during seismic events to meet specific performance criteria. Conversely, the inherent human quest for optimal performance has led to the necessity of performance-oriented design in varying forms. However, assessing and quantifying performance has frequently been difficult and inadequately defined [2].
In addition, today, major seismic events still highlight significant between stakeholder expectations and the actual results of traditional design approaches. About two decades ago, increased public awareness, along with the simultaneous advancement of sophisticated engineering tools and methodologies, reached a level that encouraged the adoption of performance-based design approach. This approach was primarily focused on evaluating and retrofitting existing buildings. Consequently, the Structural Engineers Association of California (SEAOC) instituted the Vision 2000 Committee [3] to advance the philosophy of performance-driven design. Notable contributions encompass the Seismic Assessment Proposals (ATC-40) [4], which have progressively expanded over time with the publication of the Guide for Seismic Rehabilitation of Buildings (FEMA356/ASCE) [5], the Guide for Performance-Based Seismic Design of Tall Buildings (PEER-TBI) [6], the Standard for Seismic Evaluation and Rehabilitation of Existing Buildings (ASCE/SEI 41-17) [7], and the Los Angeles Tall Building Structural Design Document (LATBSDC) [8].
These guidelines specify different global and local seismic performance acceptability criteria for each performance level, tailored to the common structural configurations found in the United States tall buildings. Therefore, Table 1 shows a comparison of global acceptability criteria and Table 2 shows a comparison of the design earthquake levels adopted for the international guidelines analyzed. As can be seen from the tables, most of the international guidelines have as a common factor the analysis of Immediate Occupancy and collapse prevention performance levels.
While the Chilean seismic design philosophy also prioritizes human safety and structural integrity during intense seismic events, it is distinct in its structural configuration of reinforced concrete residential buildings, notably characterized by a high density of walls. Consequently, custom thresholds must be defined to align with the desired performance objectives, following the guidelines introduced in Chile [9].
This study will present an exhaustive review of the Chilean Performance Design Guide and its intricate interplay between the damage and deformation of structural components. The goal is to undertake a comprehensive comparative analysis of the outcomes against diverse international guidelines. Furthermore, owing to recent amendments to the design regulations about reinforced concrete walls in Chile (DS60 [10]; DS61 [11]), there is an inherent interest in evaluating performance benchmarks within tall buildings. However, considering that many structures were built prior to these regulations, this study covers an evaluation of a structure with reinforced concrete walls that sustained damage during the 2010 Maule earthquake. The novelty of this study lies in the application of performance principles defined by Chilean seismic engineering and evaluation of the methodology’s effectiveness in accurately representing the behavior of a building that sustained damage during the 2010 Maule Earthquake. This evaluation utilized the ETABS v.16.0.3 software, which is widely used by engineers in Chile, thereby demonstrating the software’s capability to implement the approach proposed for Chilean practice. Additionally, the assessment of the performance of a reinforced concrete building provides a novel perspective for understanding and addressing the challenges posed by large-magnitude seismic events.

2. Analysis of the Chilean Performance-Based Design Proposal

The seismic activity in Chile is primarily attributed to the subduction zone created by the seismogenic interaction between the Nazca and South American plates. These plates are tightly coupled and, due to their high convergence speed, produce some of the most significant seismicity globally [12]. This frequent occurrence of earthquakes results in considerable economic losses, arising from both direct damage and operational downtime. Consequently, many investors and users now demand that both maximum downtime and recovery costs be effectively managed. These controls should align with the objectives defined by the property owners and the anticipated performance level of the system.
As a result, the document published by the Chilean Association on Seismology and Earthquake Engineering (ACHISINA) [9] aims to offer a performance-based method. This method is intended to complement the Chilean Standard for Seismic Design of Buildings (NCh433) [13]. It focuses on the seismic analysis and design of buildings to ensure predictable and safe behavior when subjected to seismic demands.
This document draws upon the specifications of LATBSDC [14], integrating them with the criteria and structural configurations typical of Chilean buildings. It combines the principles of capacity design with the utilization of structural responses from nonlinear analysis and the behavior of materials.
The Chilean proposal outlines global and local criteria that differ from those in the LATBSDC [14], primarily due to the typical lateral structural resisting system in Chilean buildings, which consists of reinforced concrete walls.
Similarly, it considers two performance evaluation levels and the same global performance measurement parameter as the inter-story drift (ID). However, the global acceptance criterion (refer to Table 3) primarily focus on controlling local performance. In contrast, LATBSDC includes three control parameters: transient drift, which occurs during the earthquake motion; the permanent drift of the residual displacement remaining in the structure post-seismic event; and the stiffness loss of the structure, all of which manifest during the building’s inelastic response [7,15]. In addition, the Chilean approach named the two levels as Immediate Occupancy and Additional Deformation Capacity, respectively.
The primary distinction between the Chilean proposal and the base document lies in the criteria for local acceptability. The Chilean approach uses strain as a measure of local performance, unlike the plastic rotation measurement employed in the LATBSDC guide and many other international guides. This difference arises from Chile’s structural configuration, which predominantly includes interconnected reinforced concrete structural walls serving as the main resistance system in residential and office buildings [16].
The adoption of strain as a measure of local performance Is supported by both numerical and experimental results on structural walls. These studies have demonstrated that the unit strain of concrete and steel are a reliable indication of the behavior of components, making this performance measure a more accurate representation of element damage [17,18,19] (See Figure 1).

2.1. Earthquake Design Level

Chile’s historical seismic records reveal seismogenic sources with a return period ranging from 20 to 200 years, primarily caused by subduction, exposing buildings to both minor and major earthquakes. Based on experiences from these seismic events, it has been determined that two different seismic movement intensities are essential for the adequate design and effective behavior of structures (See Table 4).
The first level of seismic intensity is based on the design earthquake, characterized as an intermediate magnitude event expected to occur at least once during a structure’s lifetime. For example, in Chile’s central region, where the two major cities, Santiago and Valparaiso-Viña del Mar, are located, there have been two earthquakes in the last 25 years with similar intensities to a design earthquake. These include the earthquake on 03/03/1985 (Mw = 8.0) and the Maule Earthquake on 27/02/2010 (Mw = 8.8). A similar event occurred in Chile’s north region, which experienced the Iquique Earthquake on 01/04/2014 (Mw = 8.2).
The second level of seismic intensity considers the maximum earthquake required for a collapse prevention performance level. This is usually determined from seismic risk studies or historical records. In the Chilean approach, however, a displacement spectrum 30% greater than that of the design displacement earthquake spectra is utilized. Alternatively, a roof displacement 40% greater than the displacement calculated for the design earthquake may be used.

2.2. Acceptance Criteria

According to FEMA 306 [20], the global performance of the structural system is a sum of the performance of its components and, therefore, the properties of the materials that comprise them. In addition, the different standards establish global criteria and local criteria for each structural element for performance measurement. Next, the global and local criteria for the Chilean PBD approach are presented.

2.2.1. Global Acceptance Criteria

The global performance measurement variable is the inter-story drift, so the limits are as defined in Table 5.

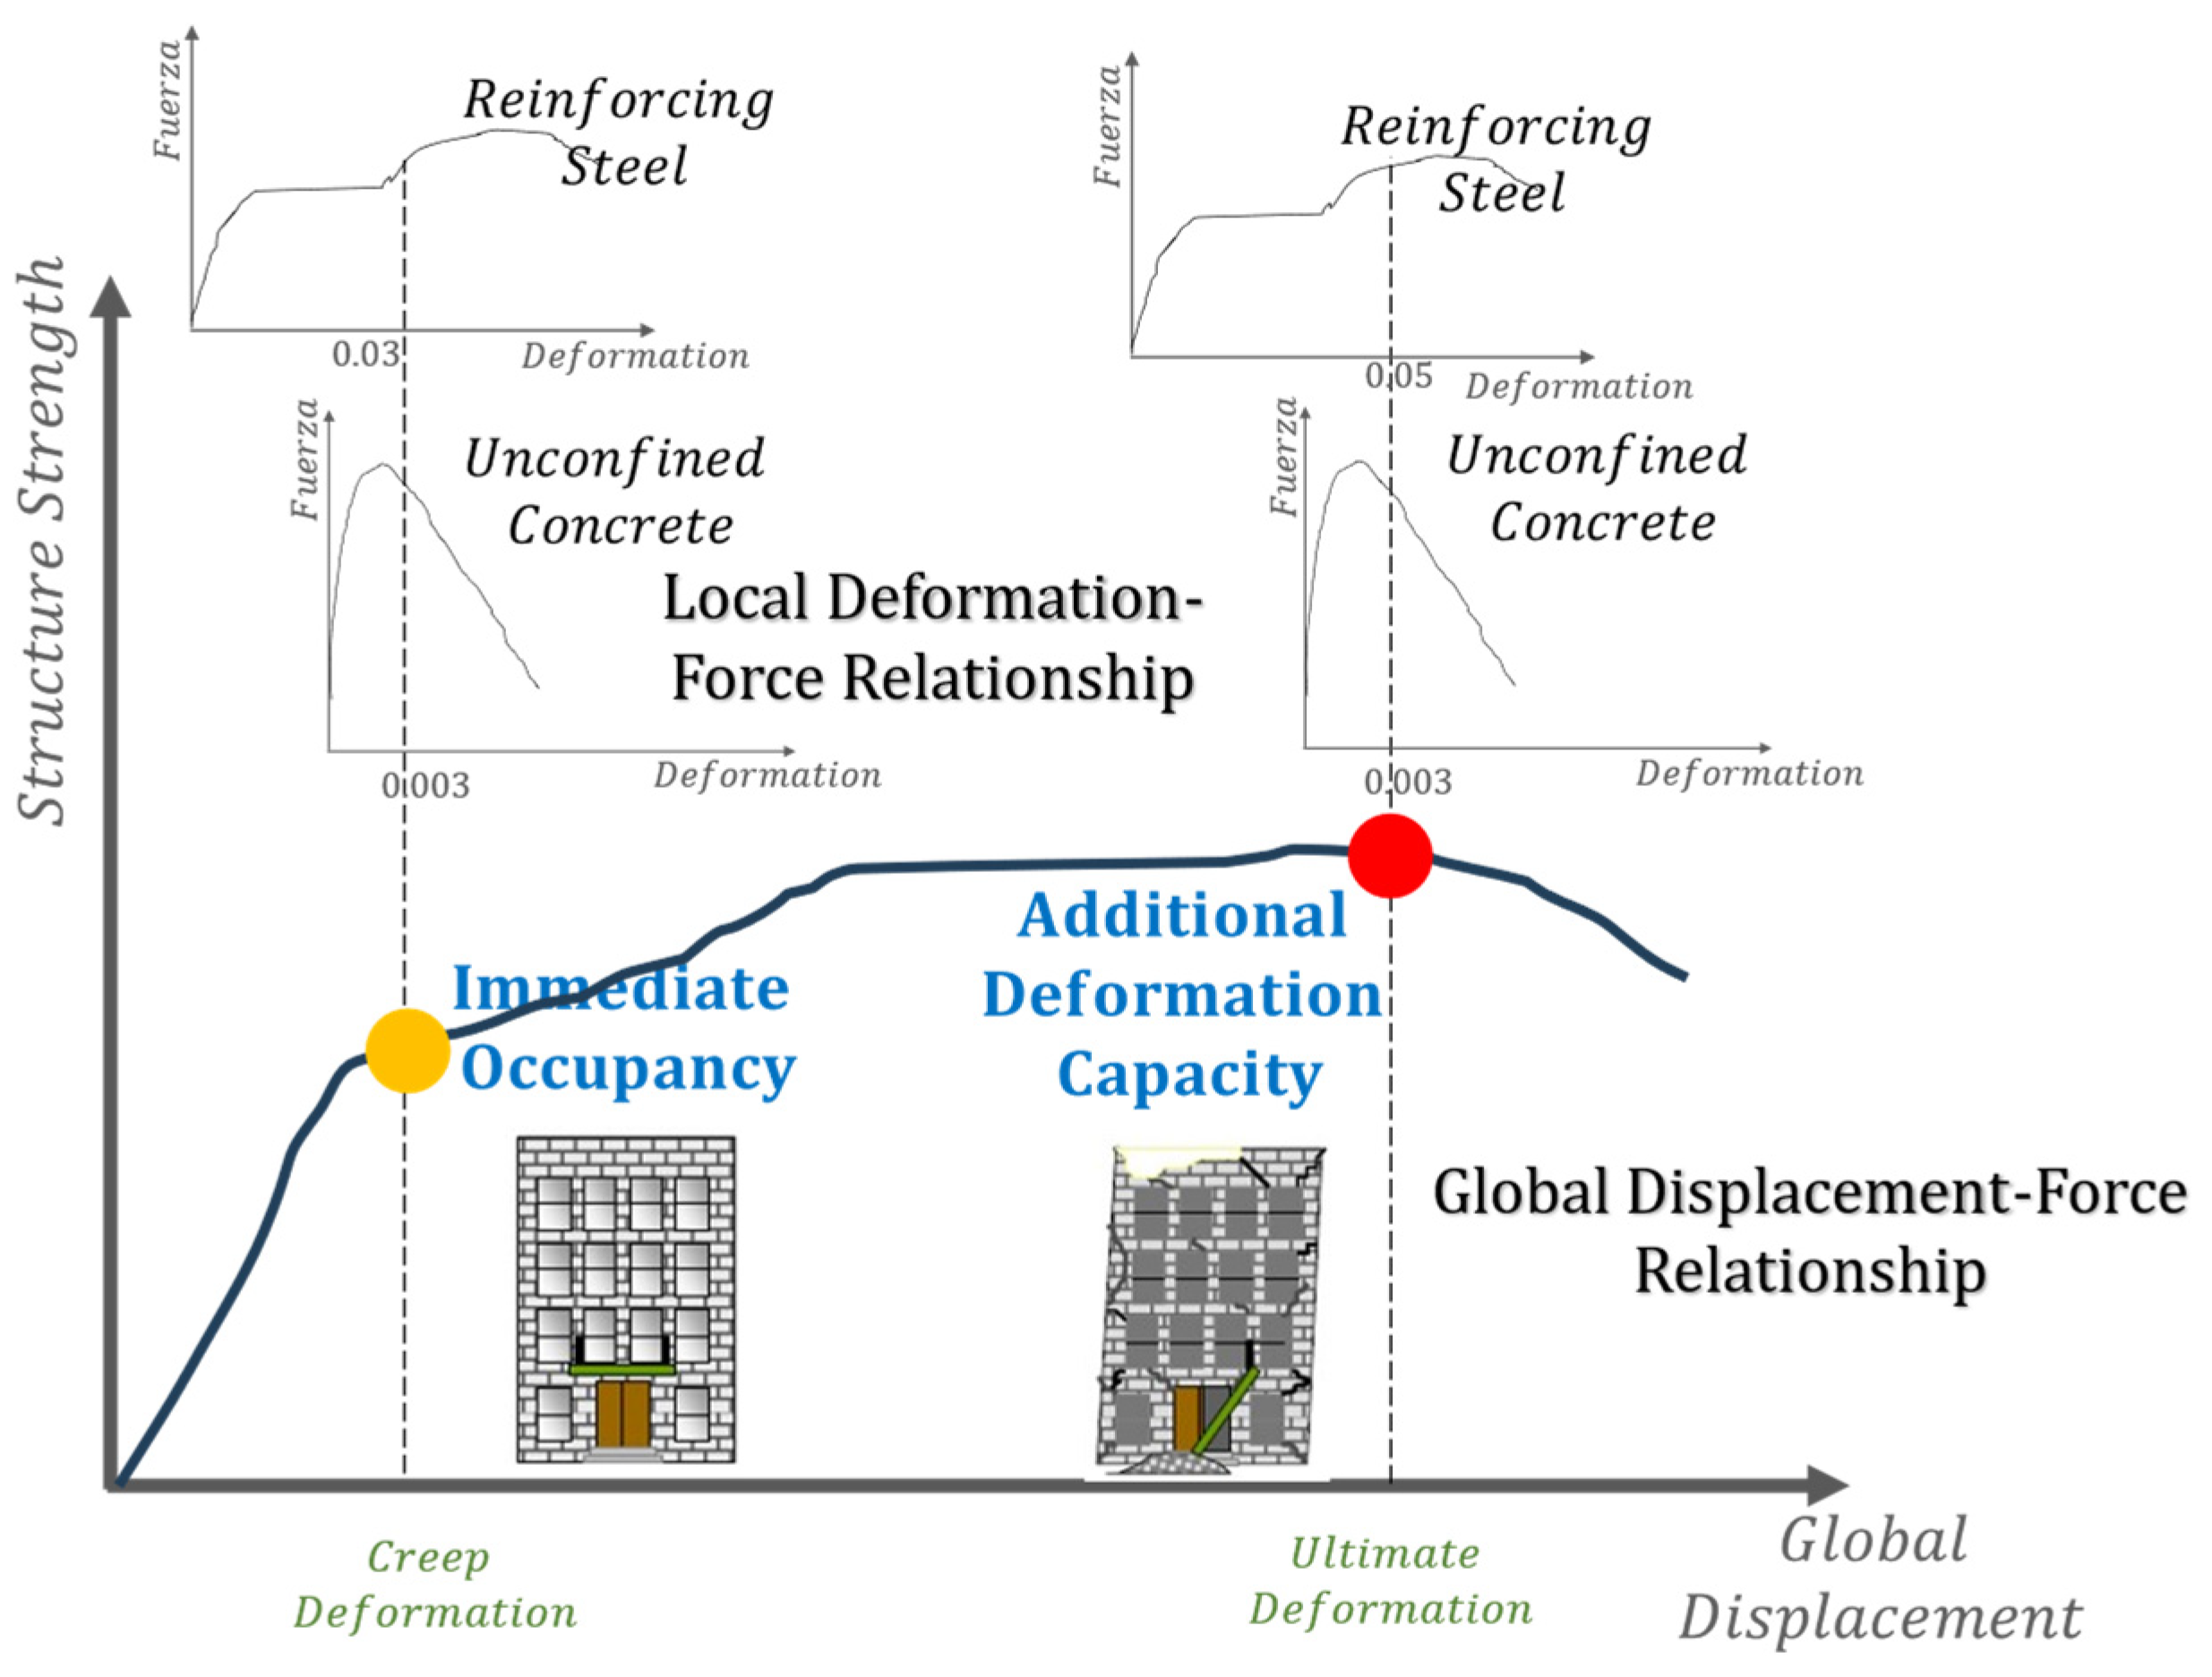
2.2.2. Local Acceptance Criteria

The local level criterion aims to limit damage to structural elements. Table 6 presents the local acceptance criterion, which focuses on restricting the response by controlling material behavior. This included limiting the maximum tensile deformations of the reinforcement in the critical zone to 3%. Such a measure prevents large elongations and subsequent significant compressions that lead to buckling problems in the reinforcement. (See Figure 1).

3. Seismic Performance of a Typical Chilean Building

A decade ago, the event known 27F occurred in Chile: it was one of the largest earthquakes in history, registering a seismic moment magnitude of 8.8. Lasting nearly three minutes, its epicenter was in the Biobío region. This event caused damage to many building across various cities, turning it into a natural laboratory that allows for the study building performance and modern design codes.
In this section, an evaluation of the seismic behavior of a typical residential building is carried out, following the performance guidelines established by Chile against the seismic loads of the Maule 2010 earthquake; however, the methodology can also be applicable to other types of dynamic loads such as explosive-induced air-blast loads [21]. The objective is to determine the current state of the structure, including its structural capacity and the damage levels reached for different performance levels. Various methodologies exist to evaluate a structure’s capacity at different performance levels, including a novel approach proposed by Li G. et al. (2018) that evaluates the collapse prevention capacity by examining the relationship between dissipated energy and the elastic potential energy stored in the structure [22]. However, for this study, we opted for a simpler approach that can be easily applied. A nonlinear static analysis approach has been chosen, which allows us to accurately represent the seismic demands experienced during the Maule earthquake in 2010.
One of the most important challenges in the area of civil engineering is the numerical representation of the behavior of the structure [23]—for this, there are many academic and commercial programs; however, to perform this evaluation, commercial software widely used in the Chilean engineering field, such as ETABS (2016), is employed to estimate damages efficiently, minimizing the consumption of computational resources and optimizing the analysis time.

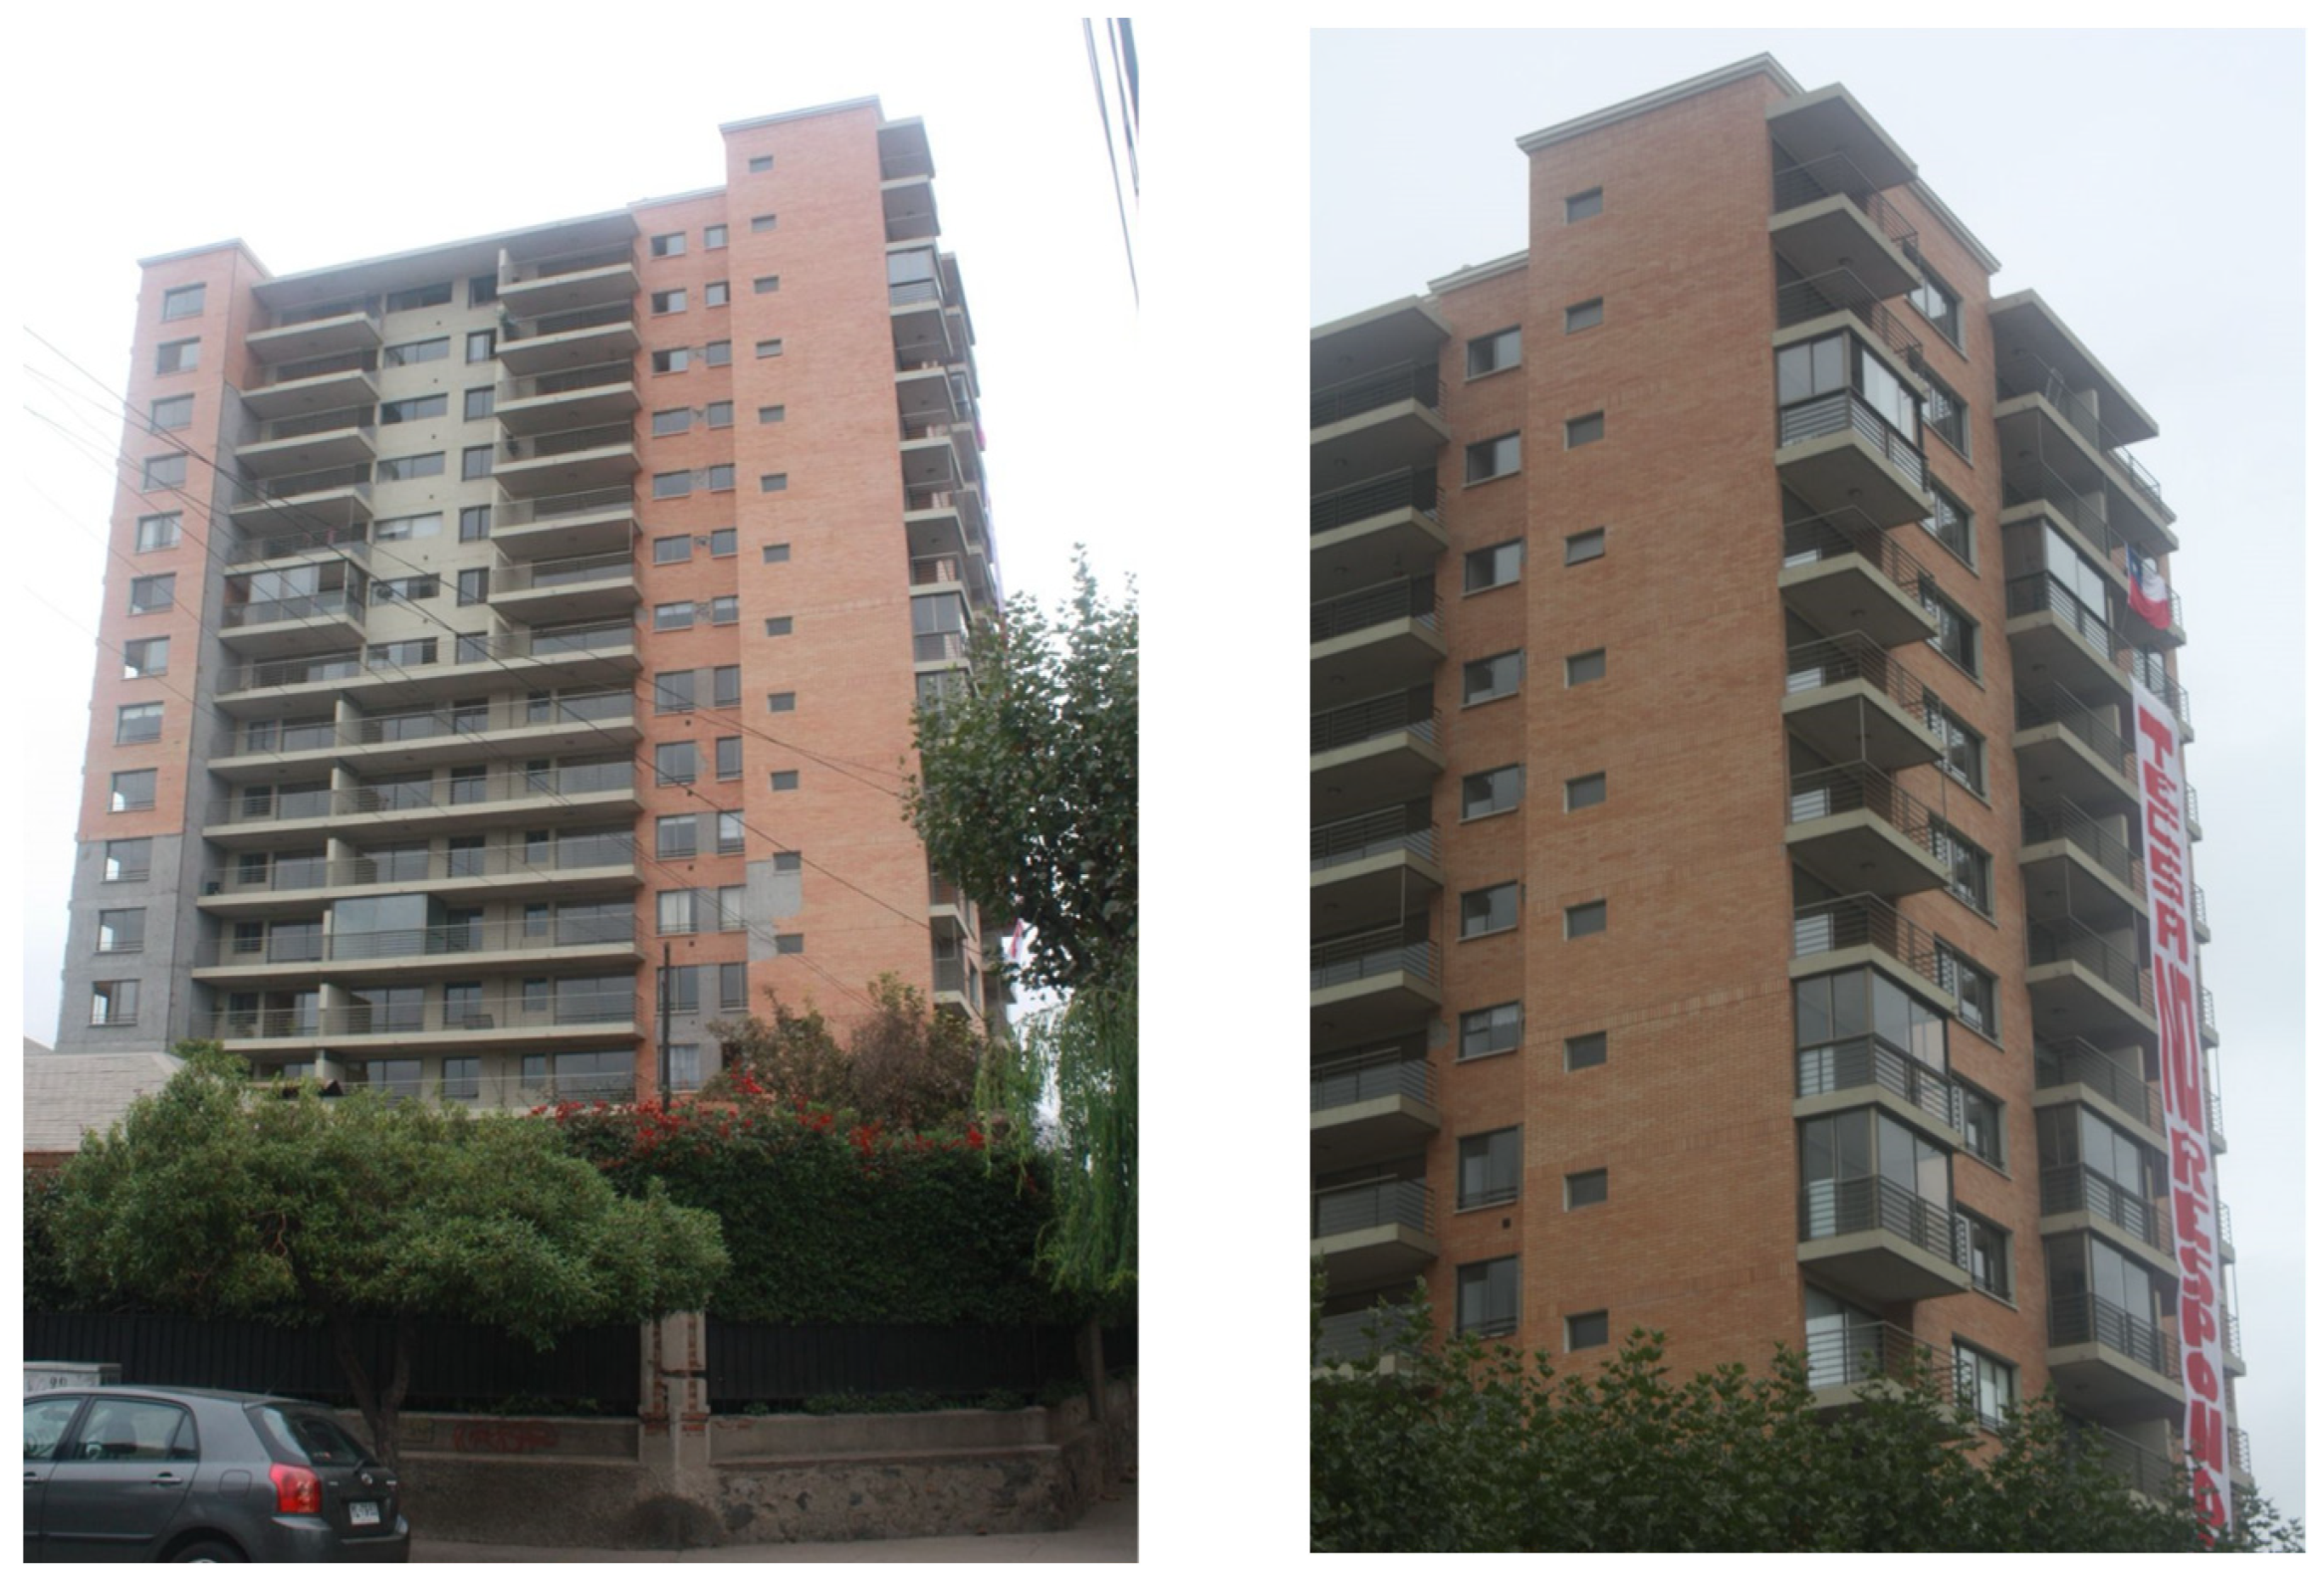
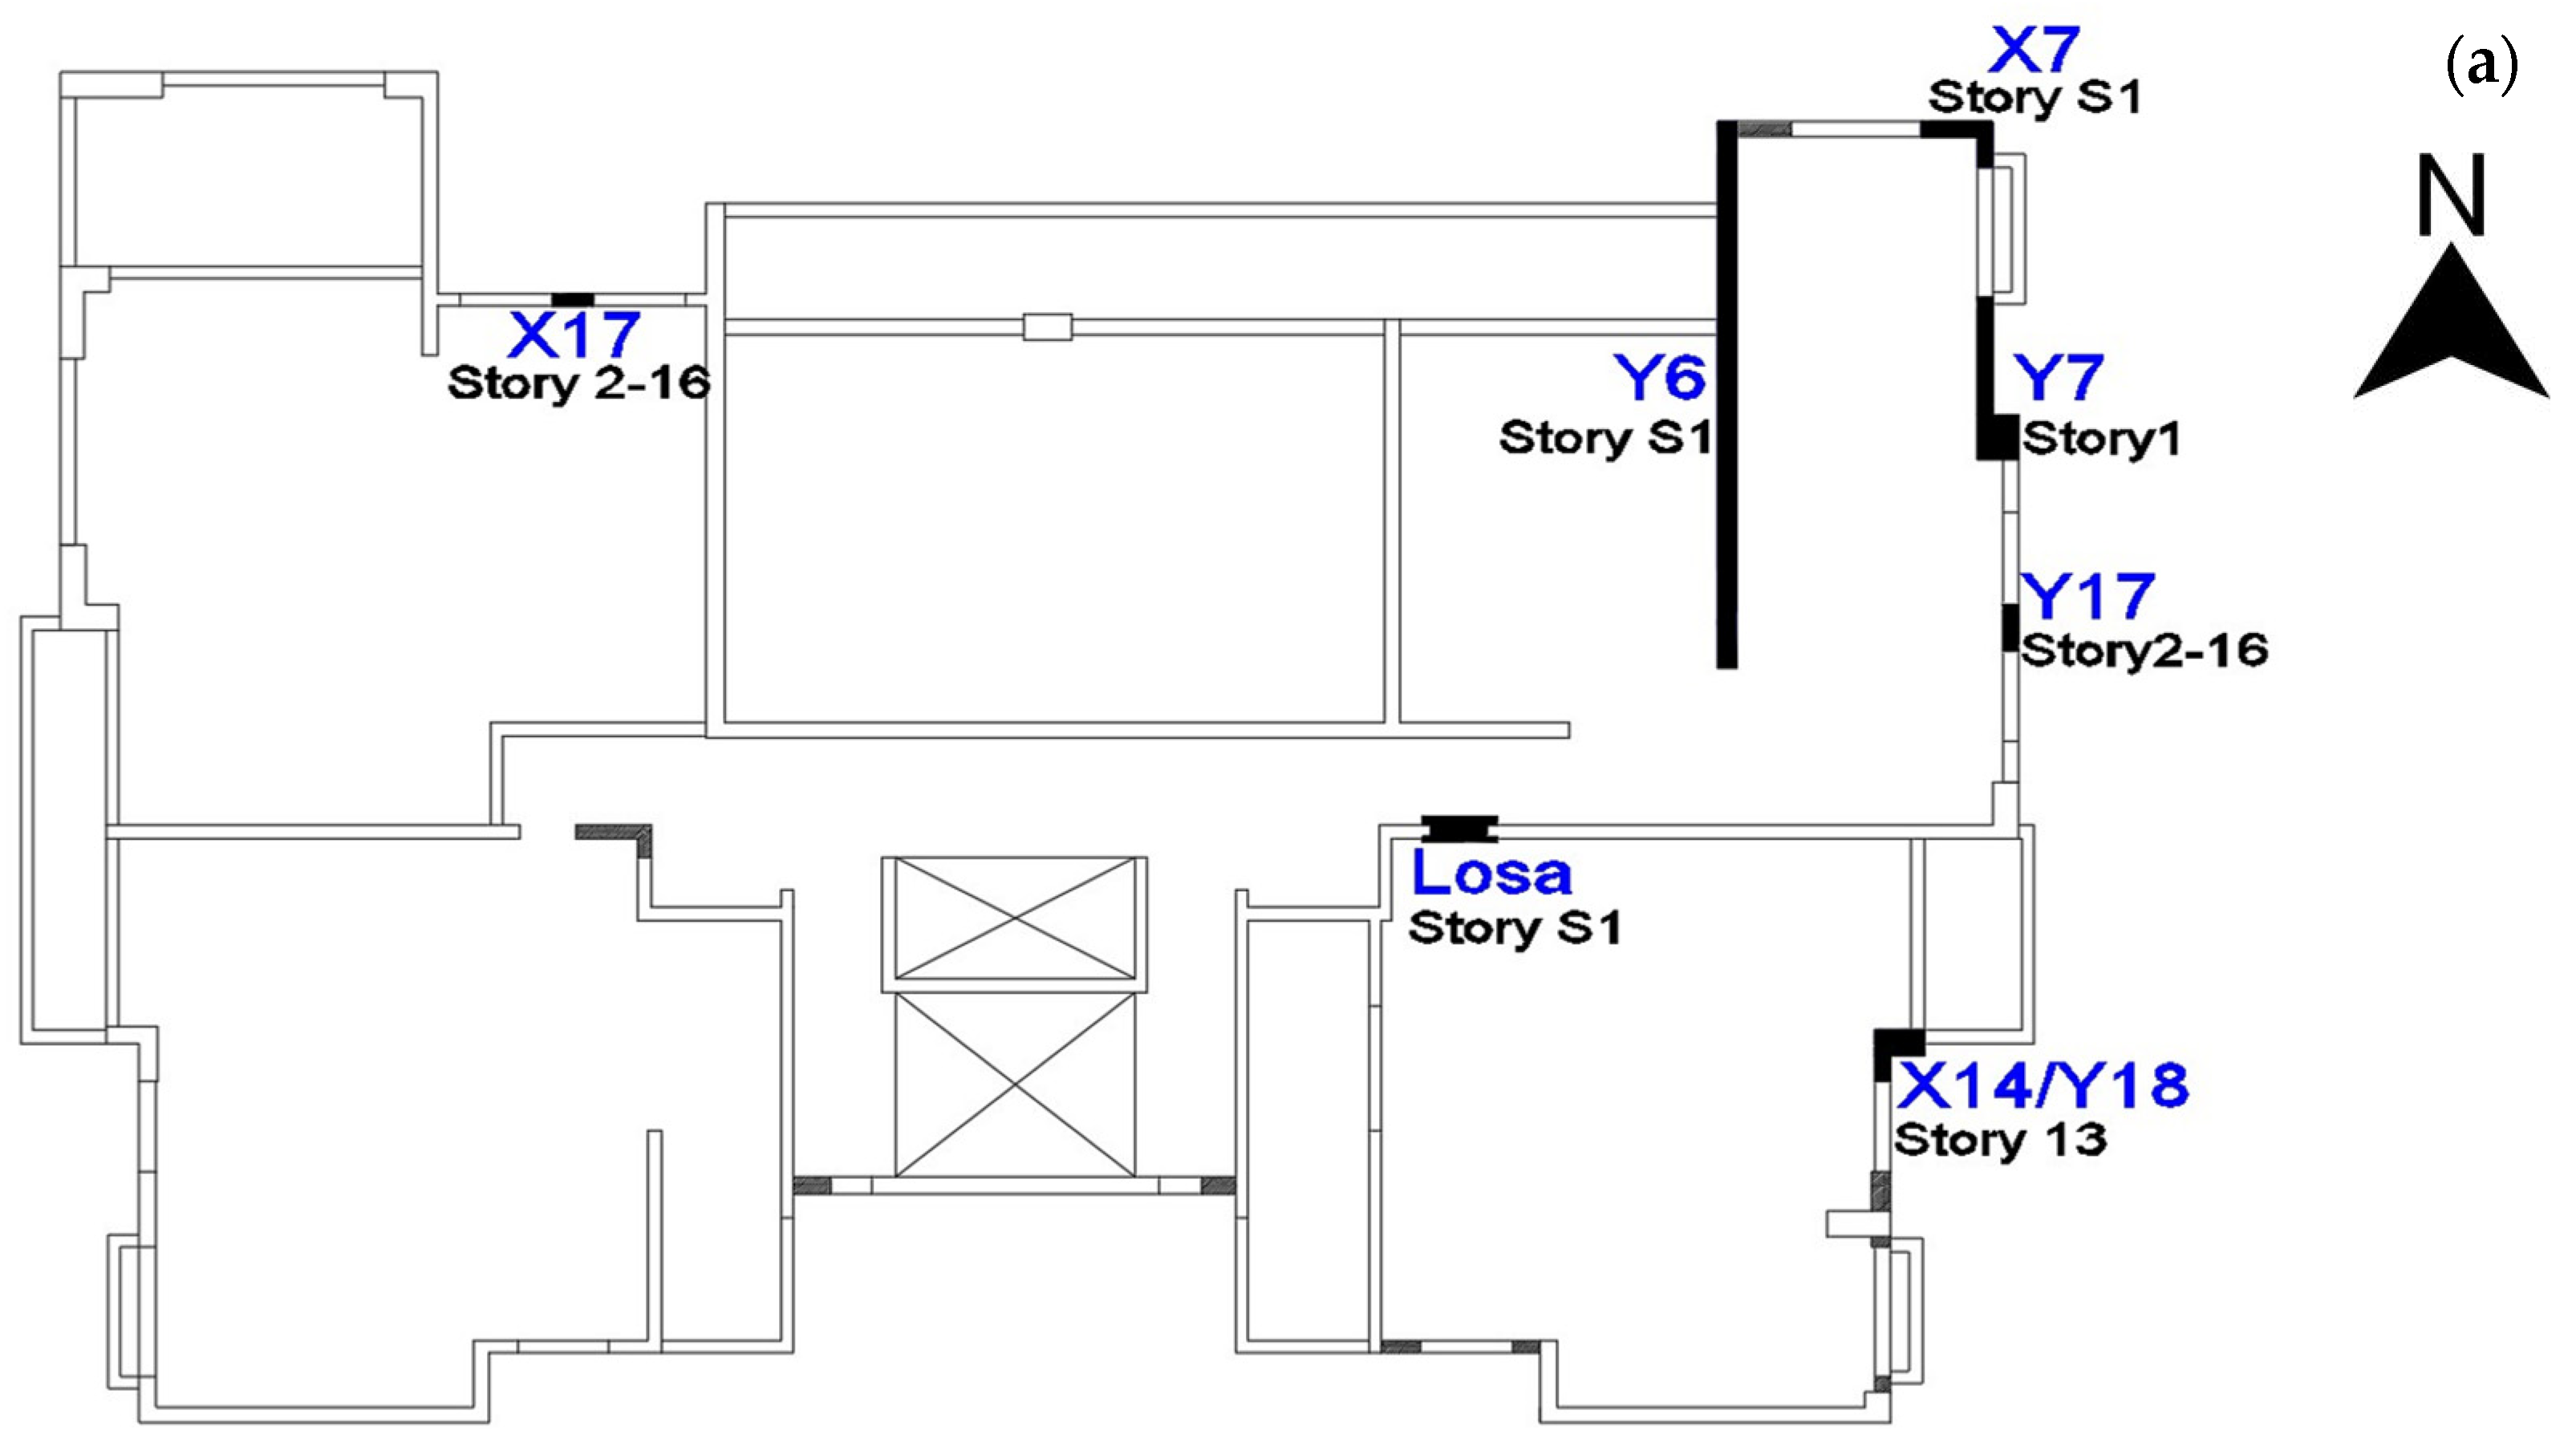
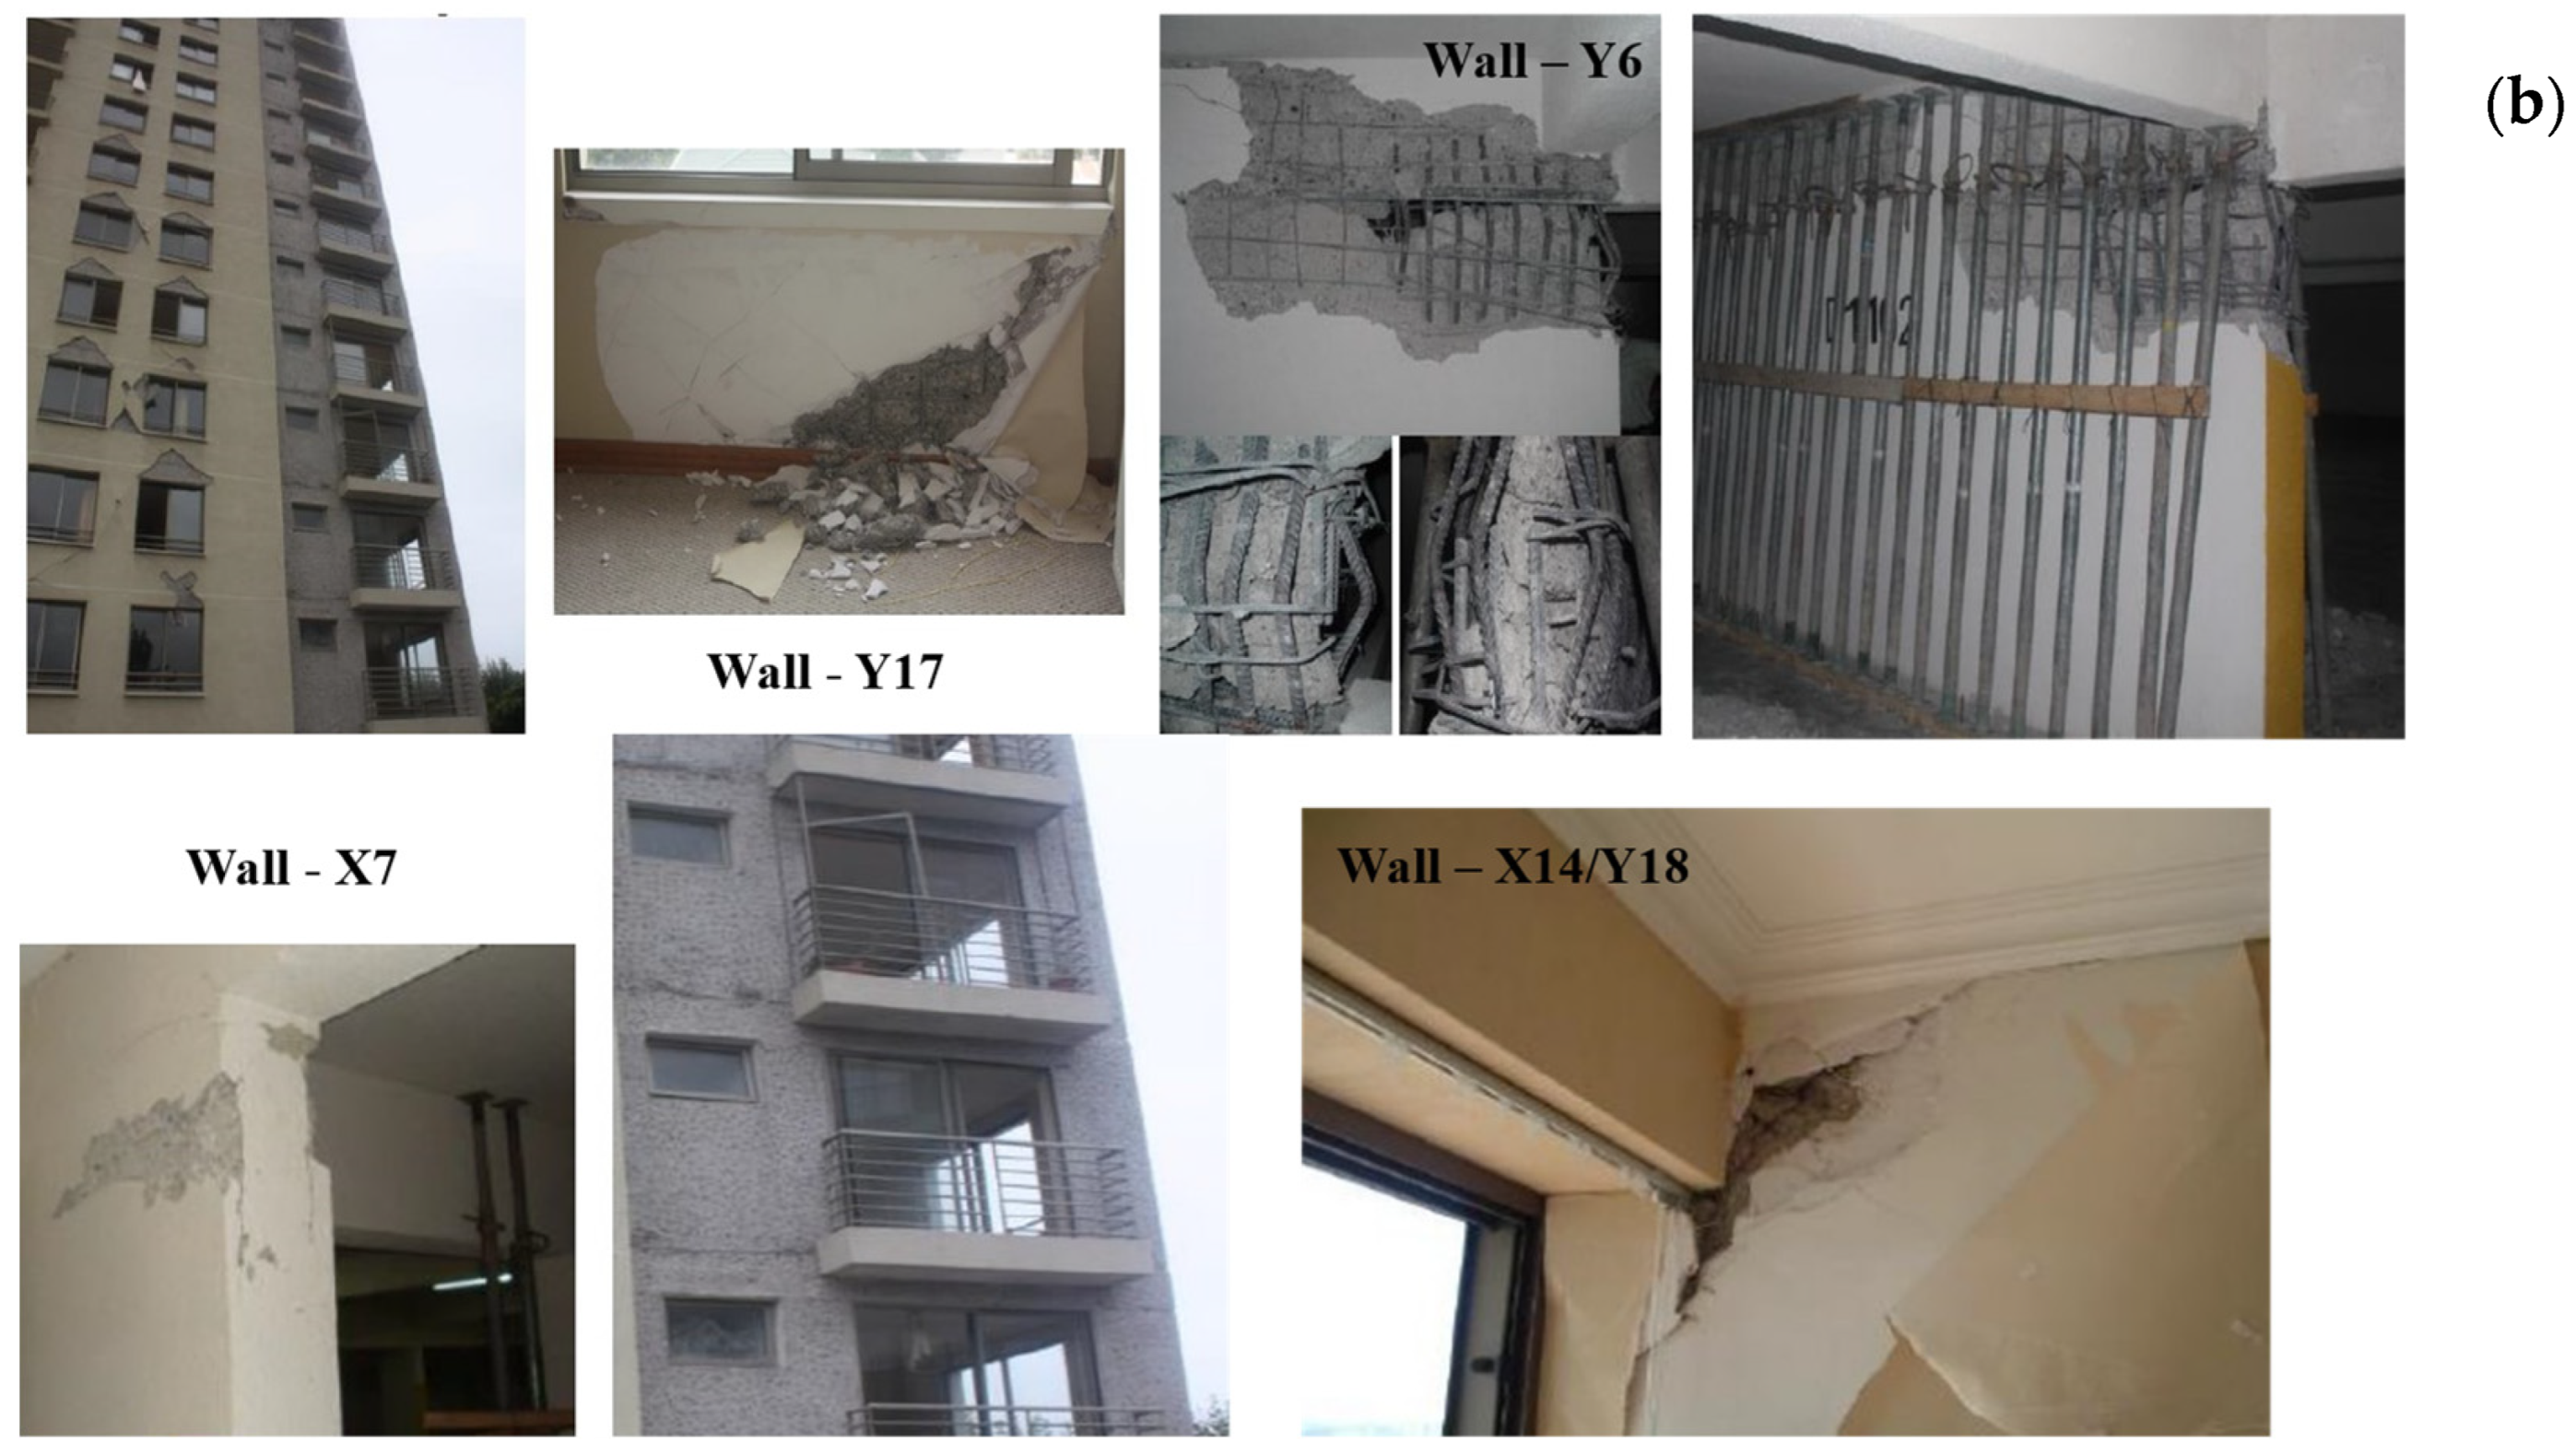
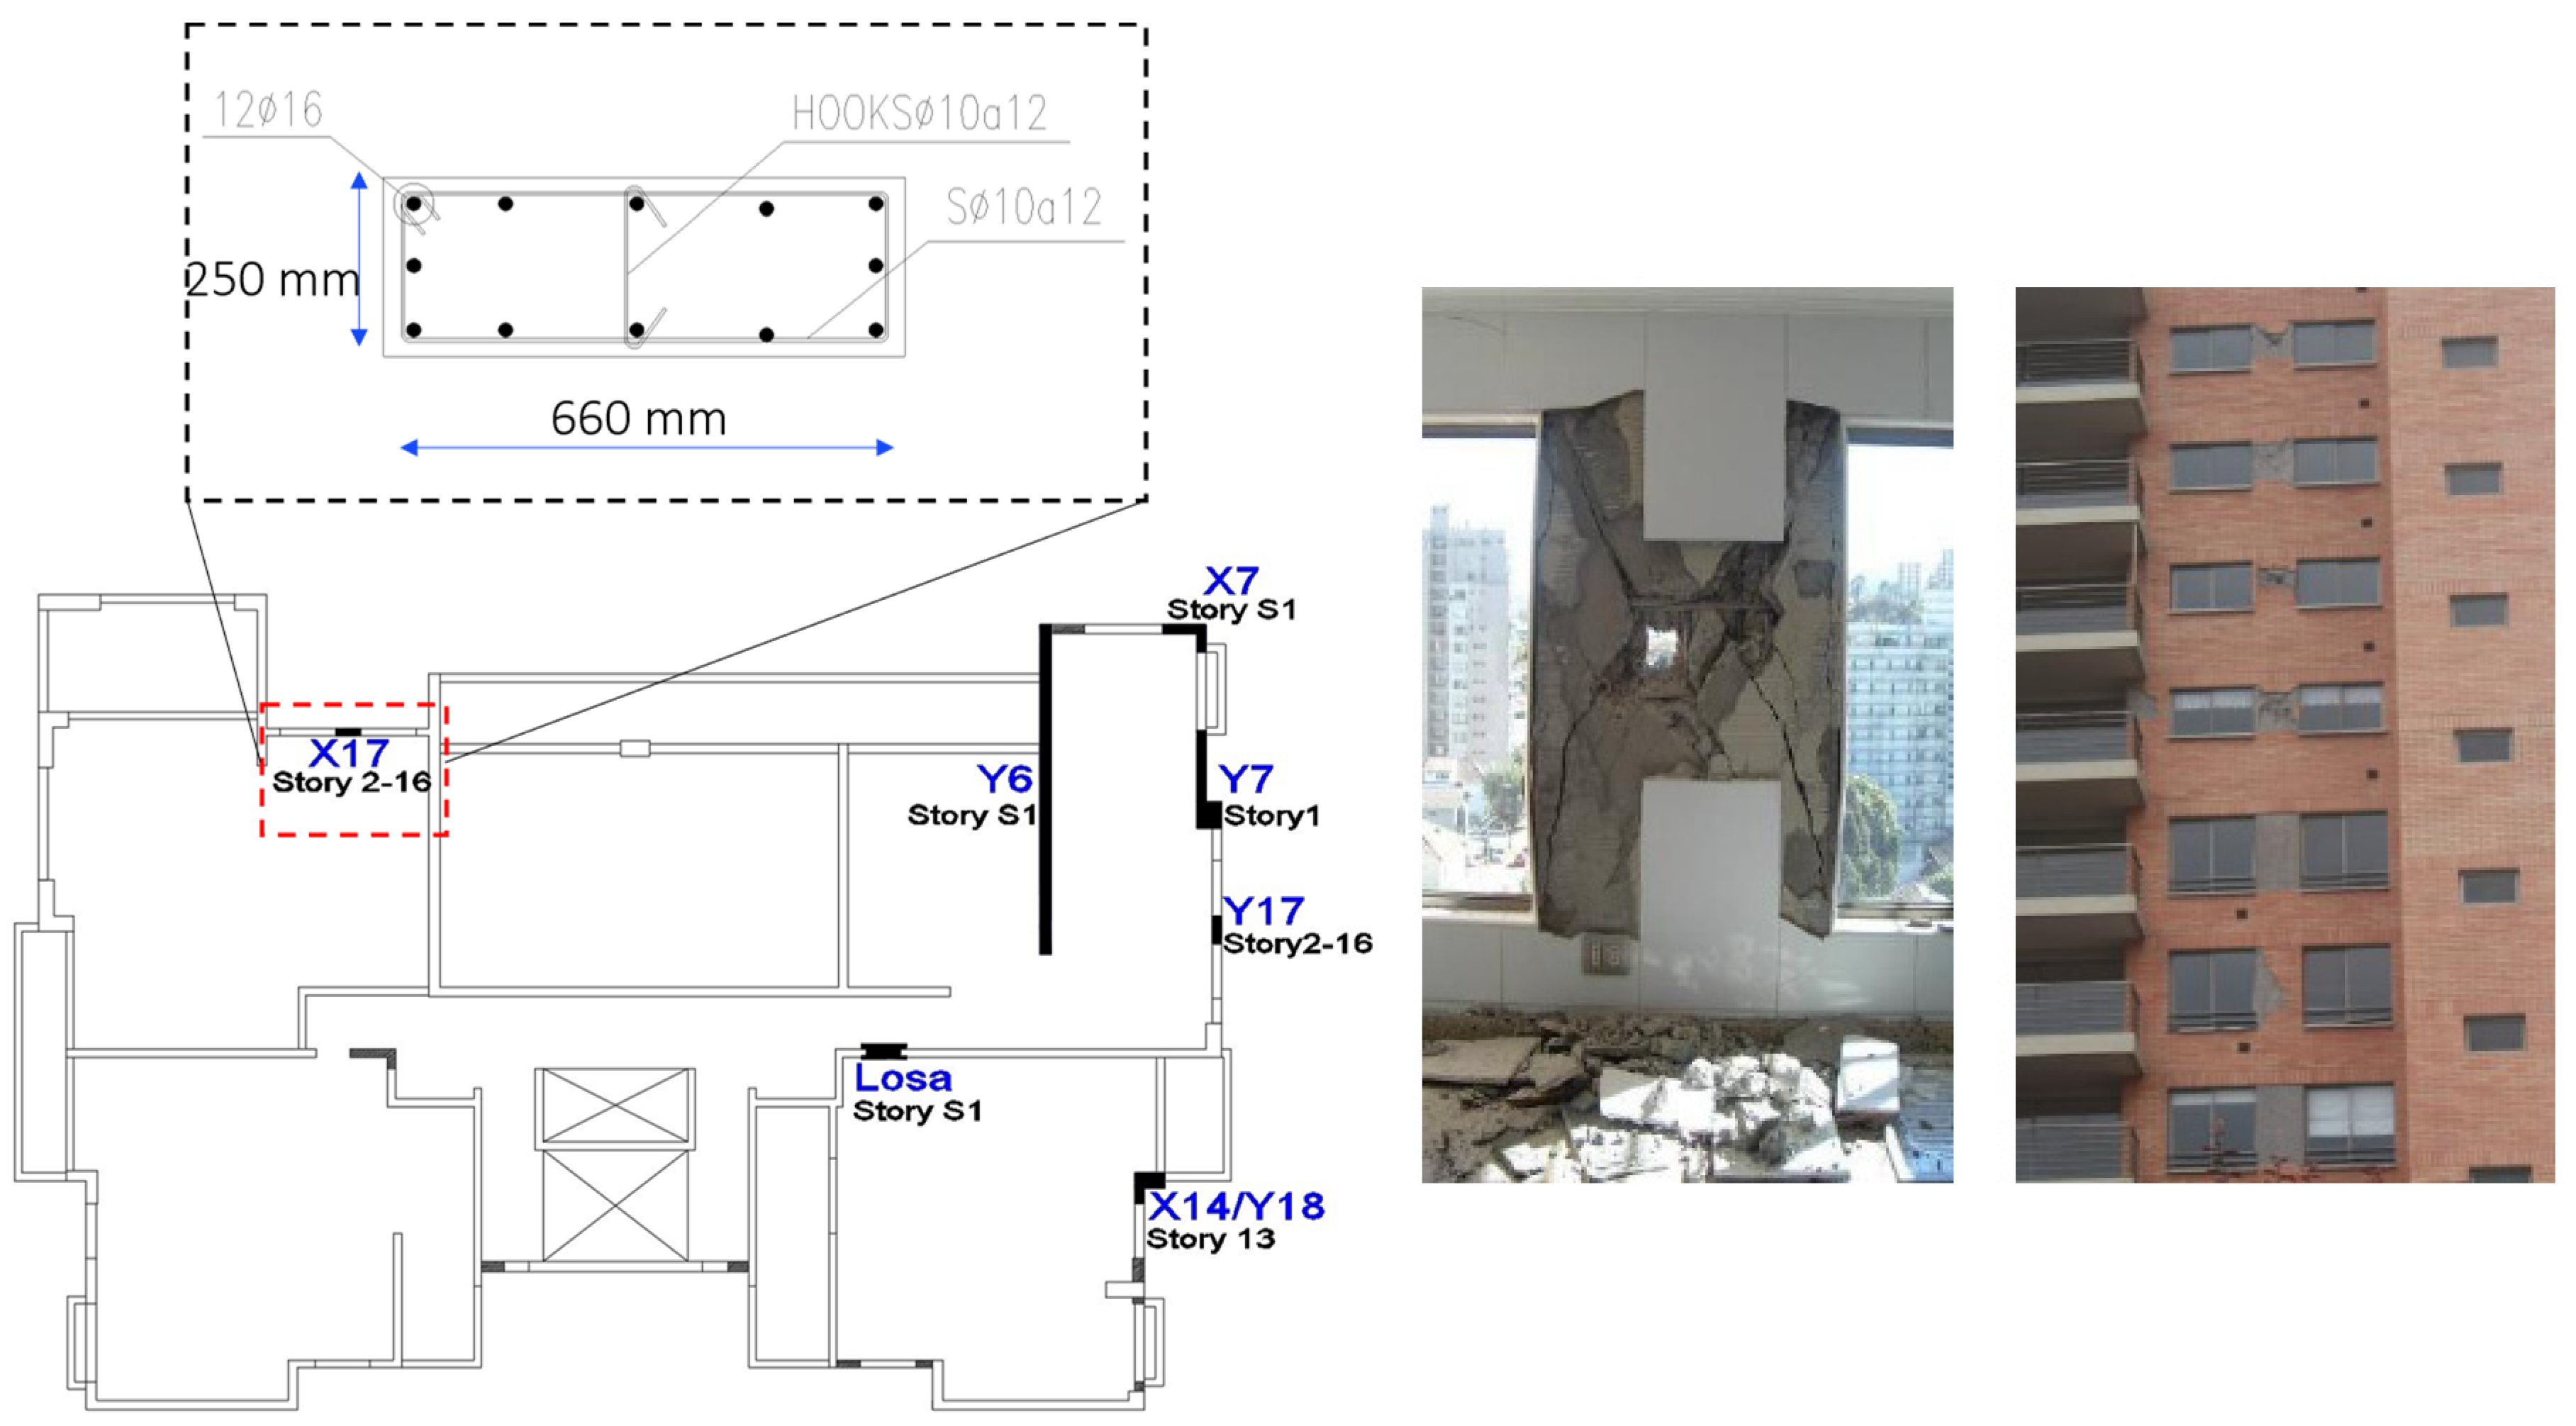
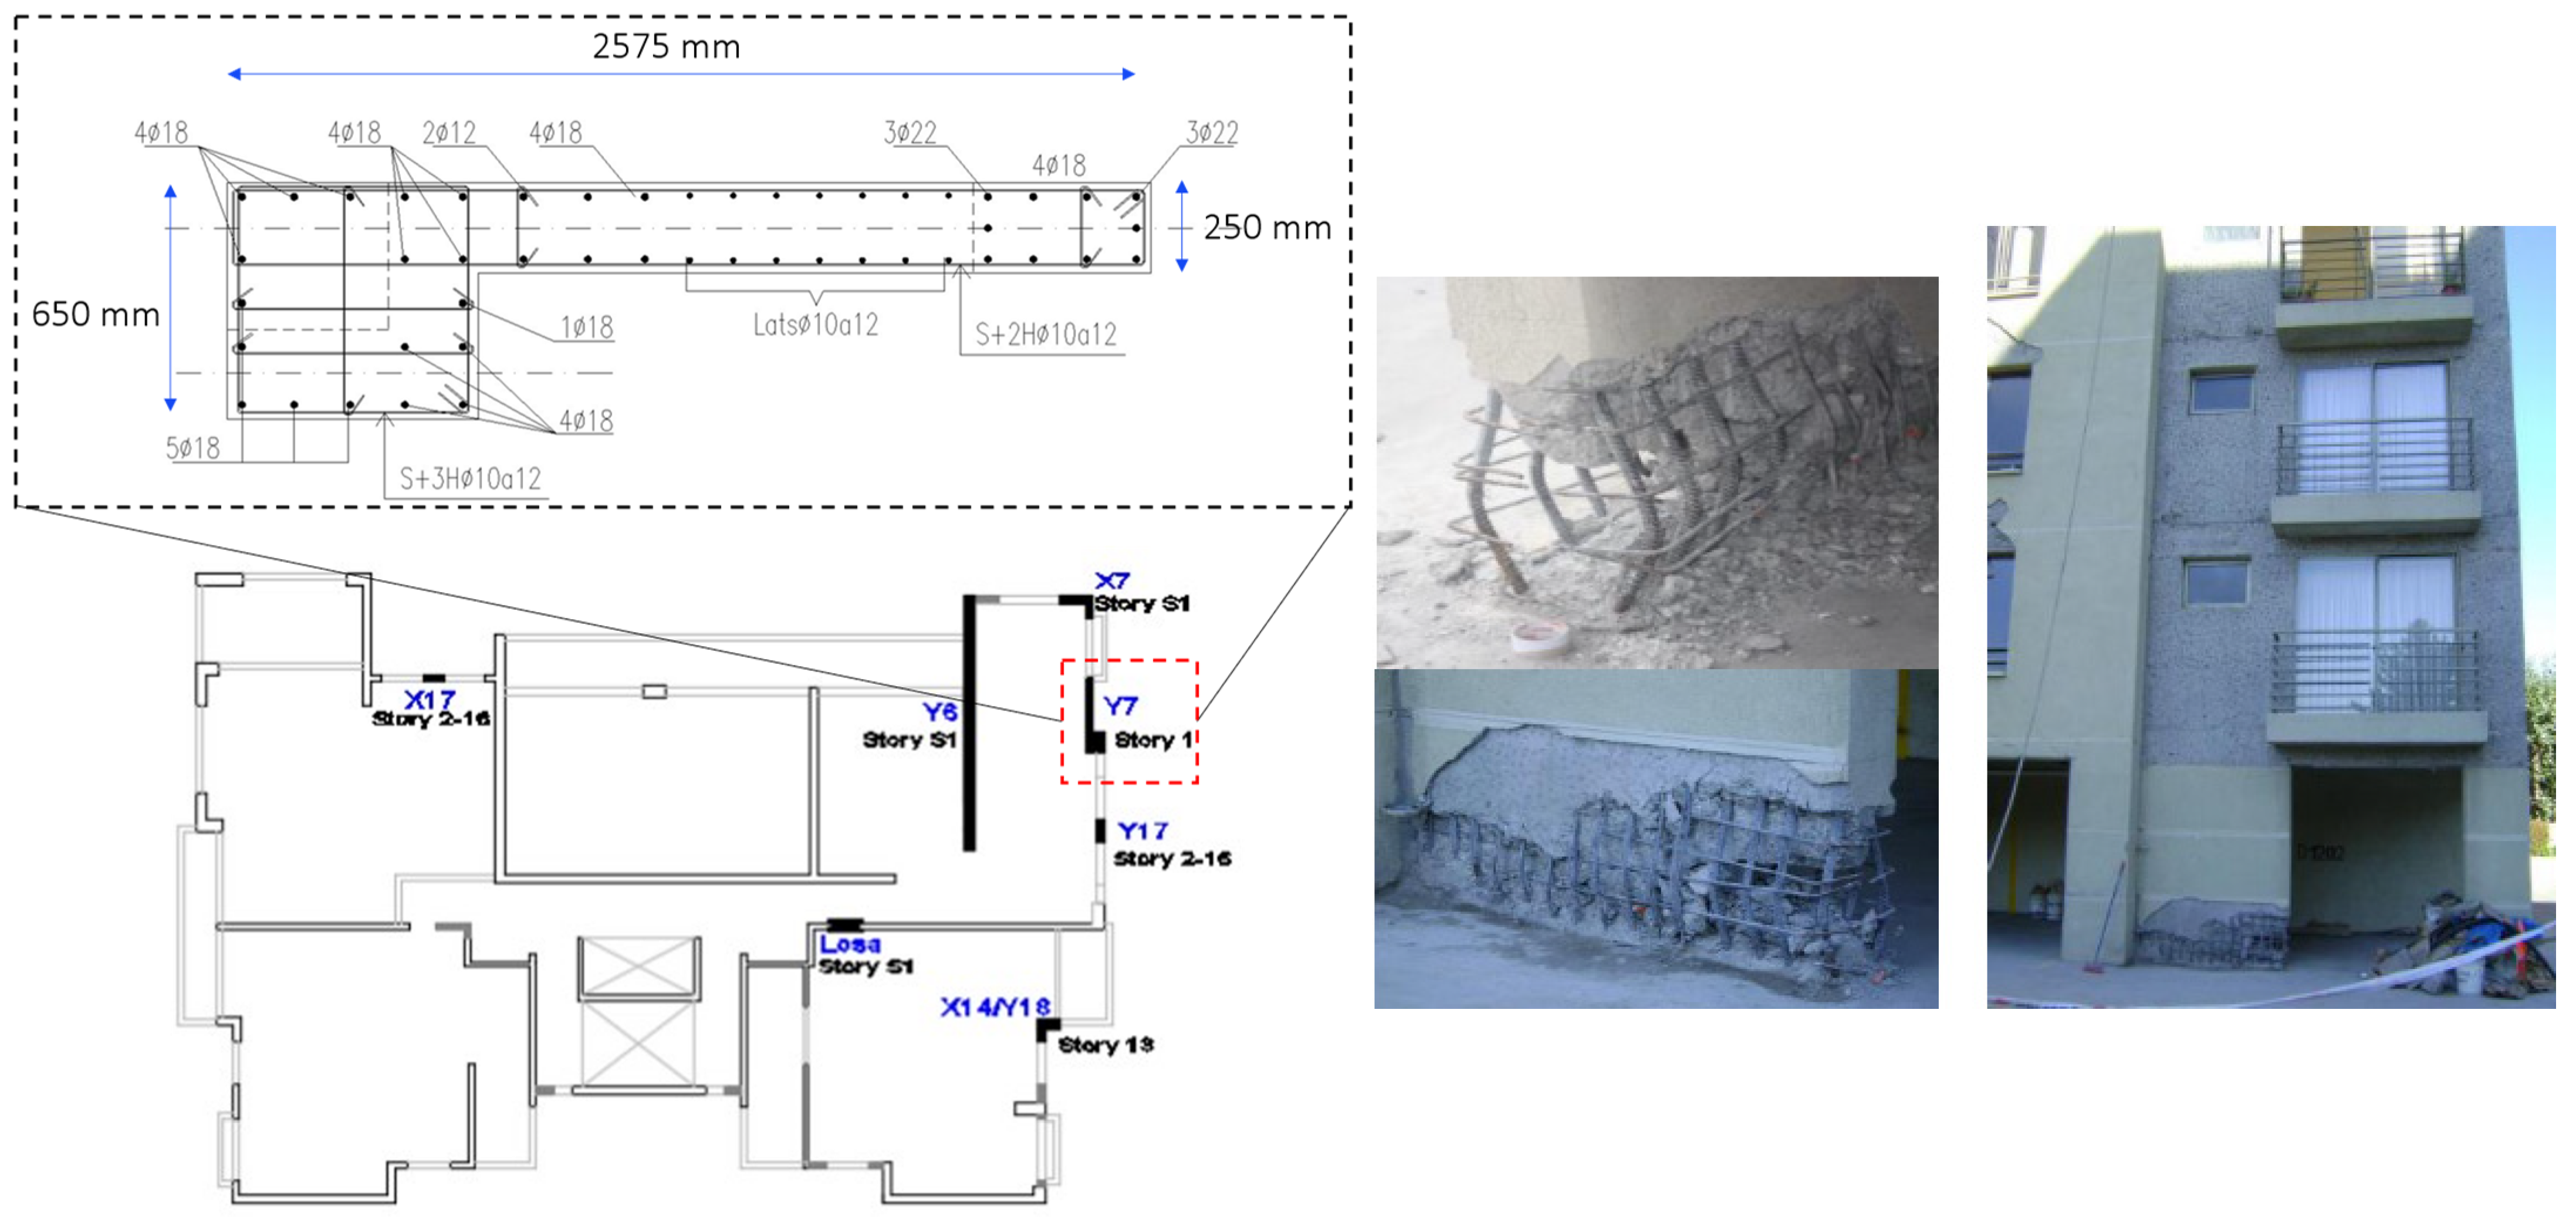
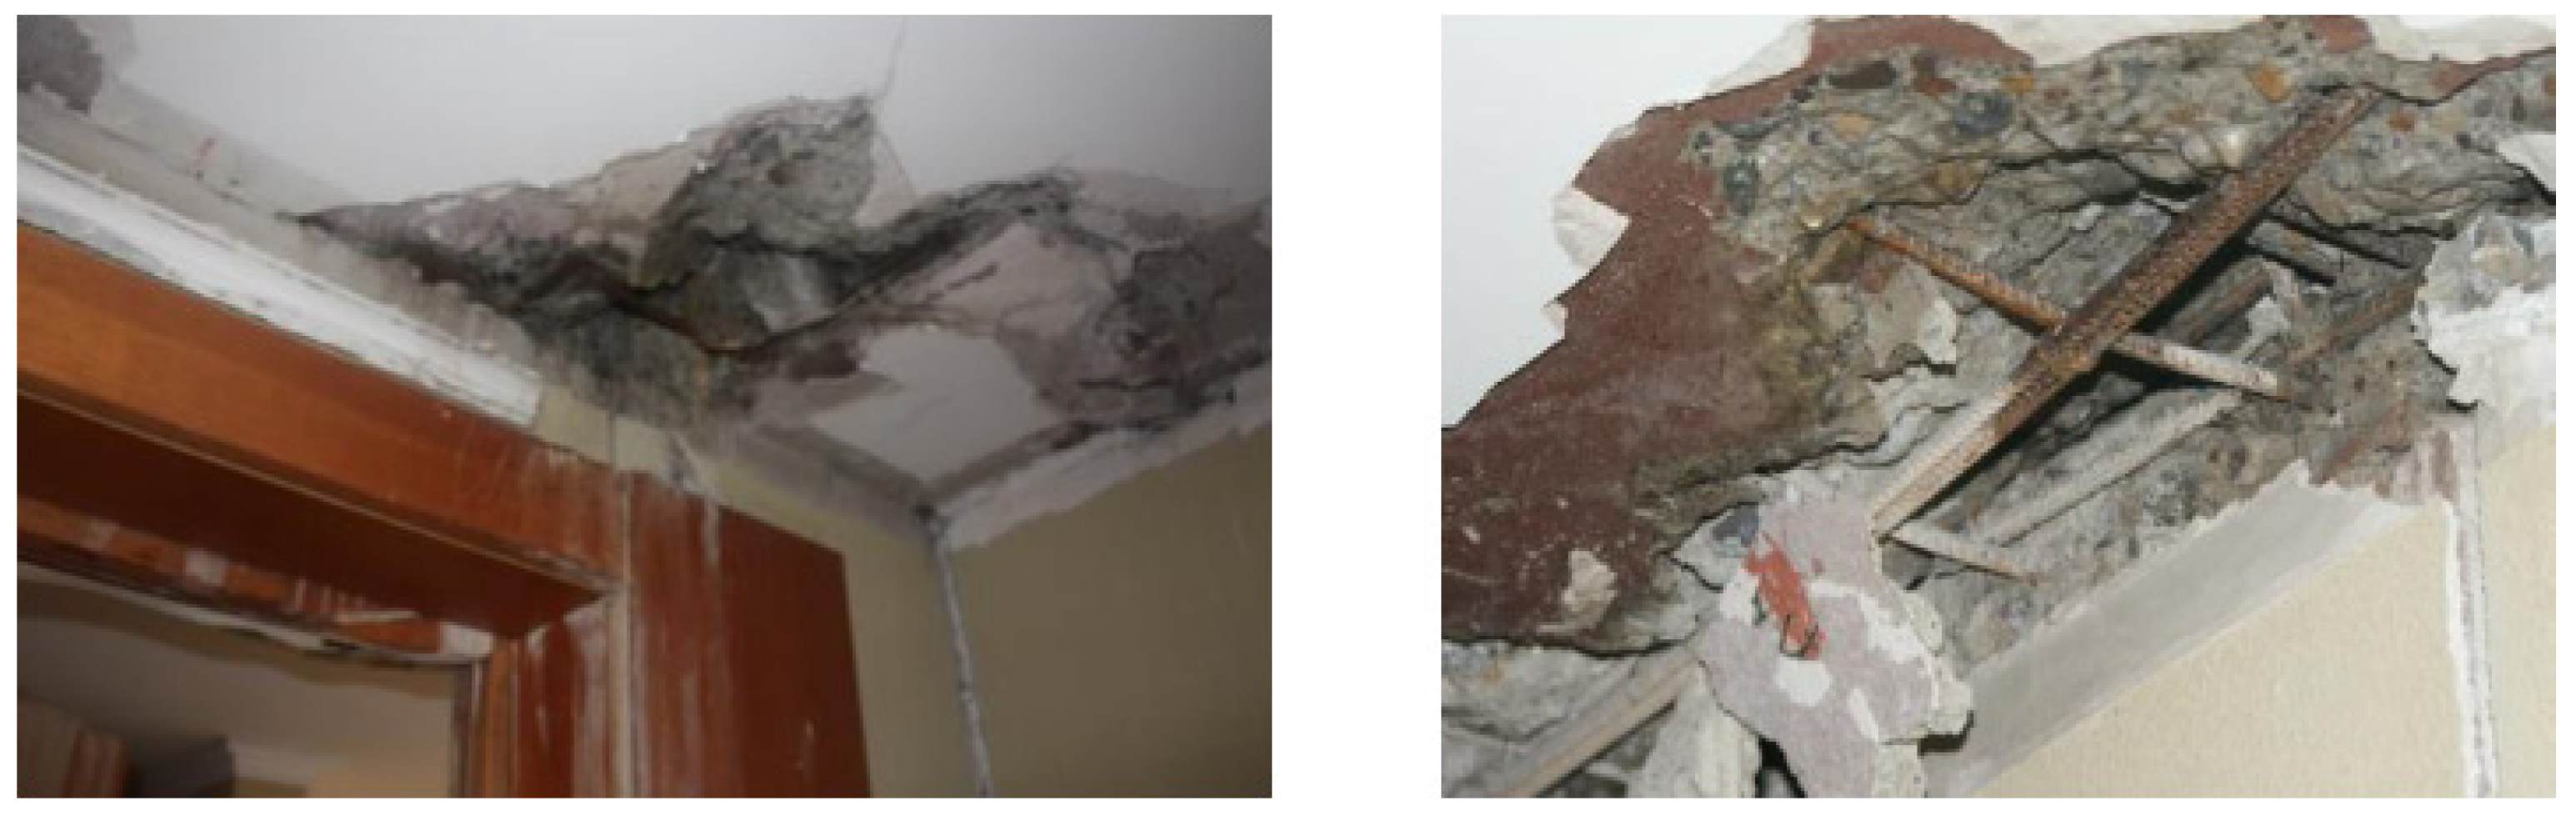
3.1. Description of Building and Observed Damages

The building under study is a 16-story residential building with two basement levels for parking and storage, constructed in 2004 in Viña del Mar, with a total height of 46.4 m. It is situated on soil classified as type II in seismic zone 3 (See Figure 2) according to the Chilean Seismic Design Code. The building’s primary seismic force-resisting system is a reinforced concrete wall system. The tower and the second basement (the deepest level) have a rectangular shape, measuring approximately 30.4 m (m) in the north–south (NS) direction by 21 m in the east–west (EW) direction. The first basement extends roughly 11.9 m longitudinally towards the east and about 10.7 m transversely towards the north, with an additional 5.2 m towards the south.
As a result of the seismic event on 27 February 2010, this building suffered varying levels of damages across different stories (See Figure 3). The most substantial damages were primarily due to flexo-compression and the crushing of the concrete, evidenced by cracking of the concrete, buckling of the reinforcing bars at the boundary elements of the walls, and spalling of the concrete cover at the wall base or near the first basement. The majority of this damage was localized in the North-East sector of the first basement’s slab.

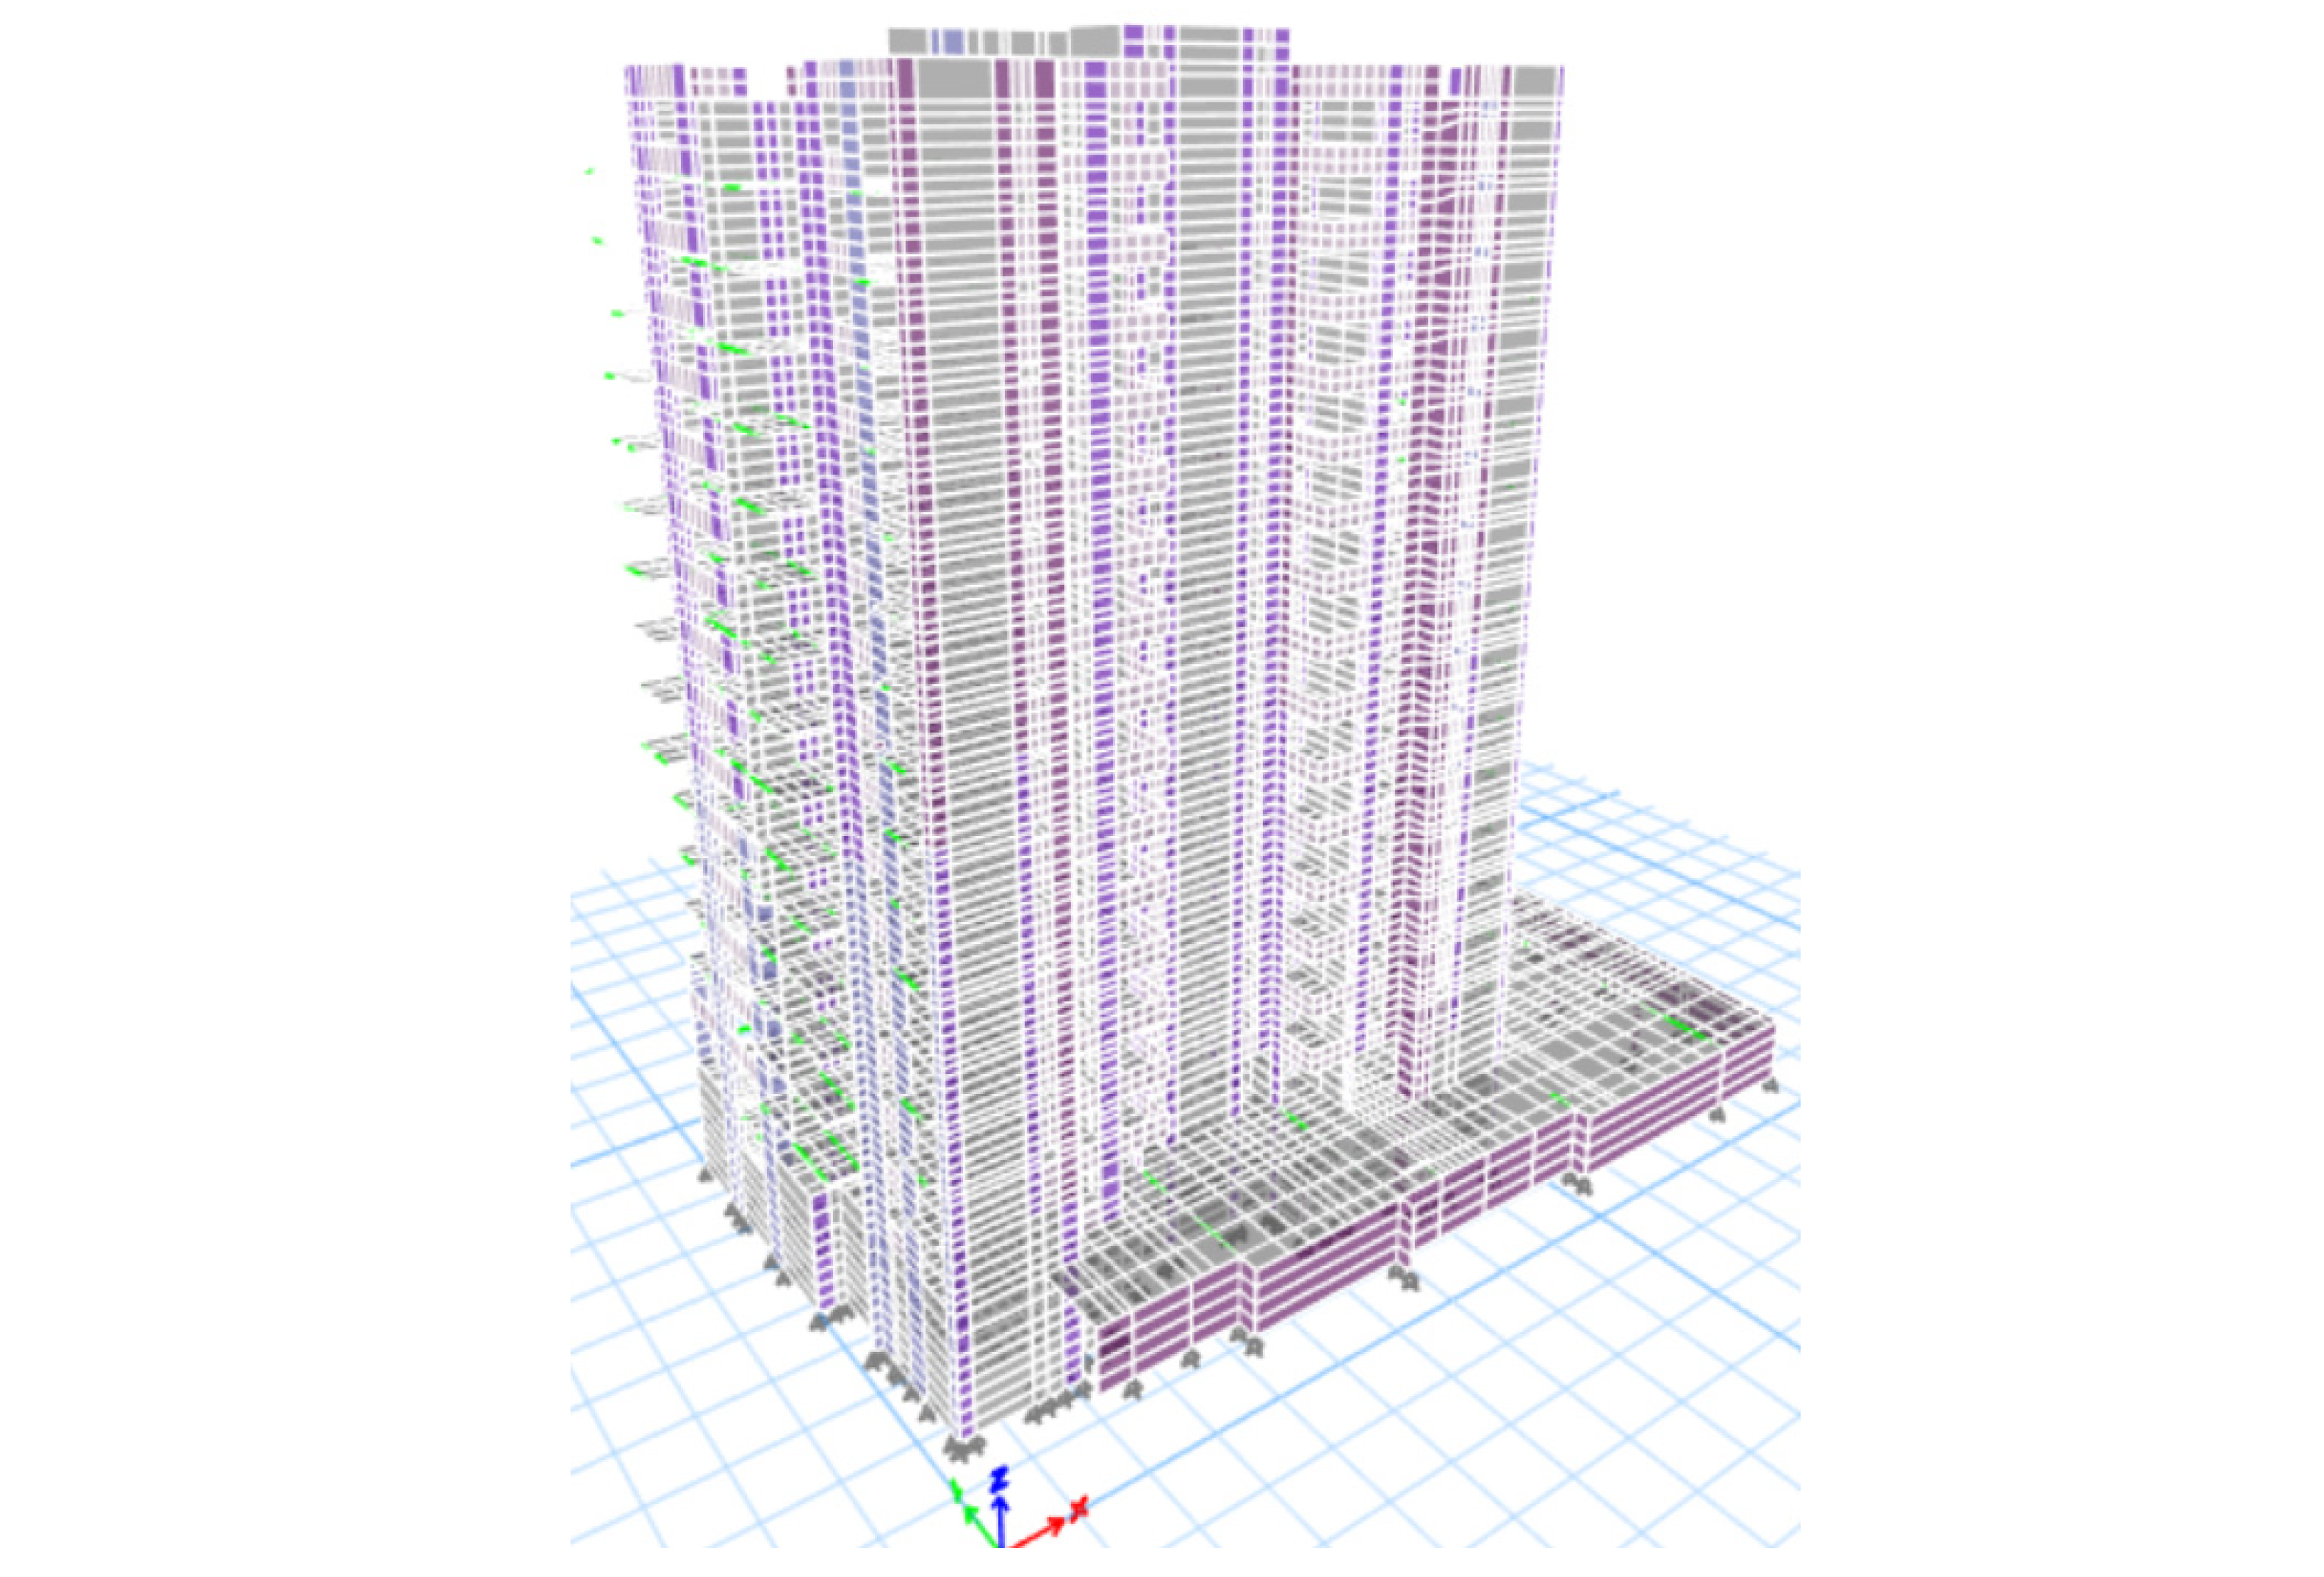
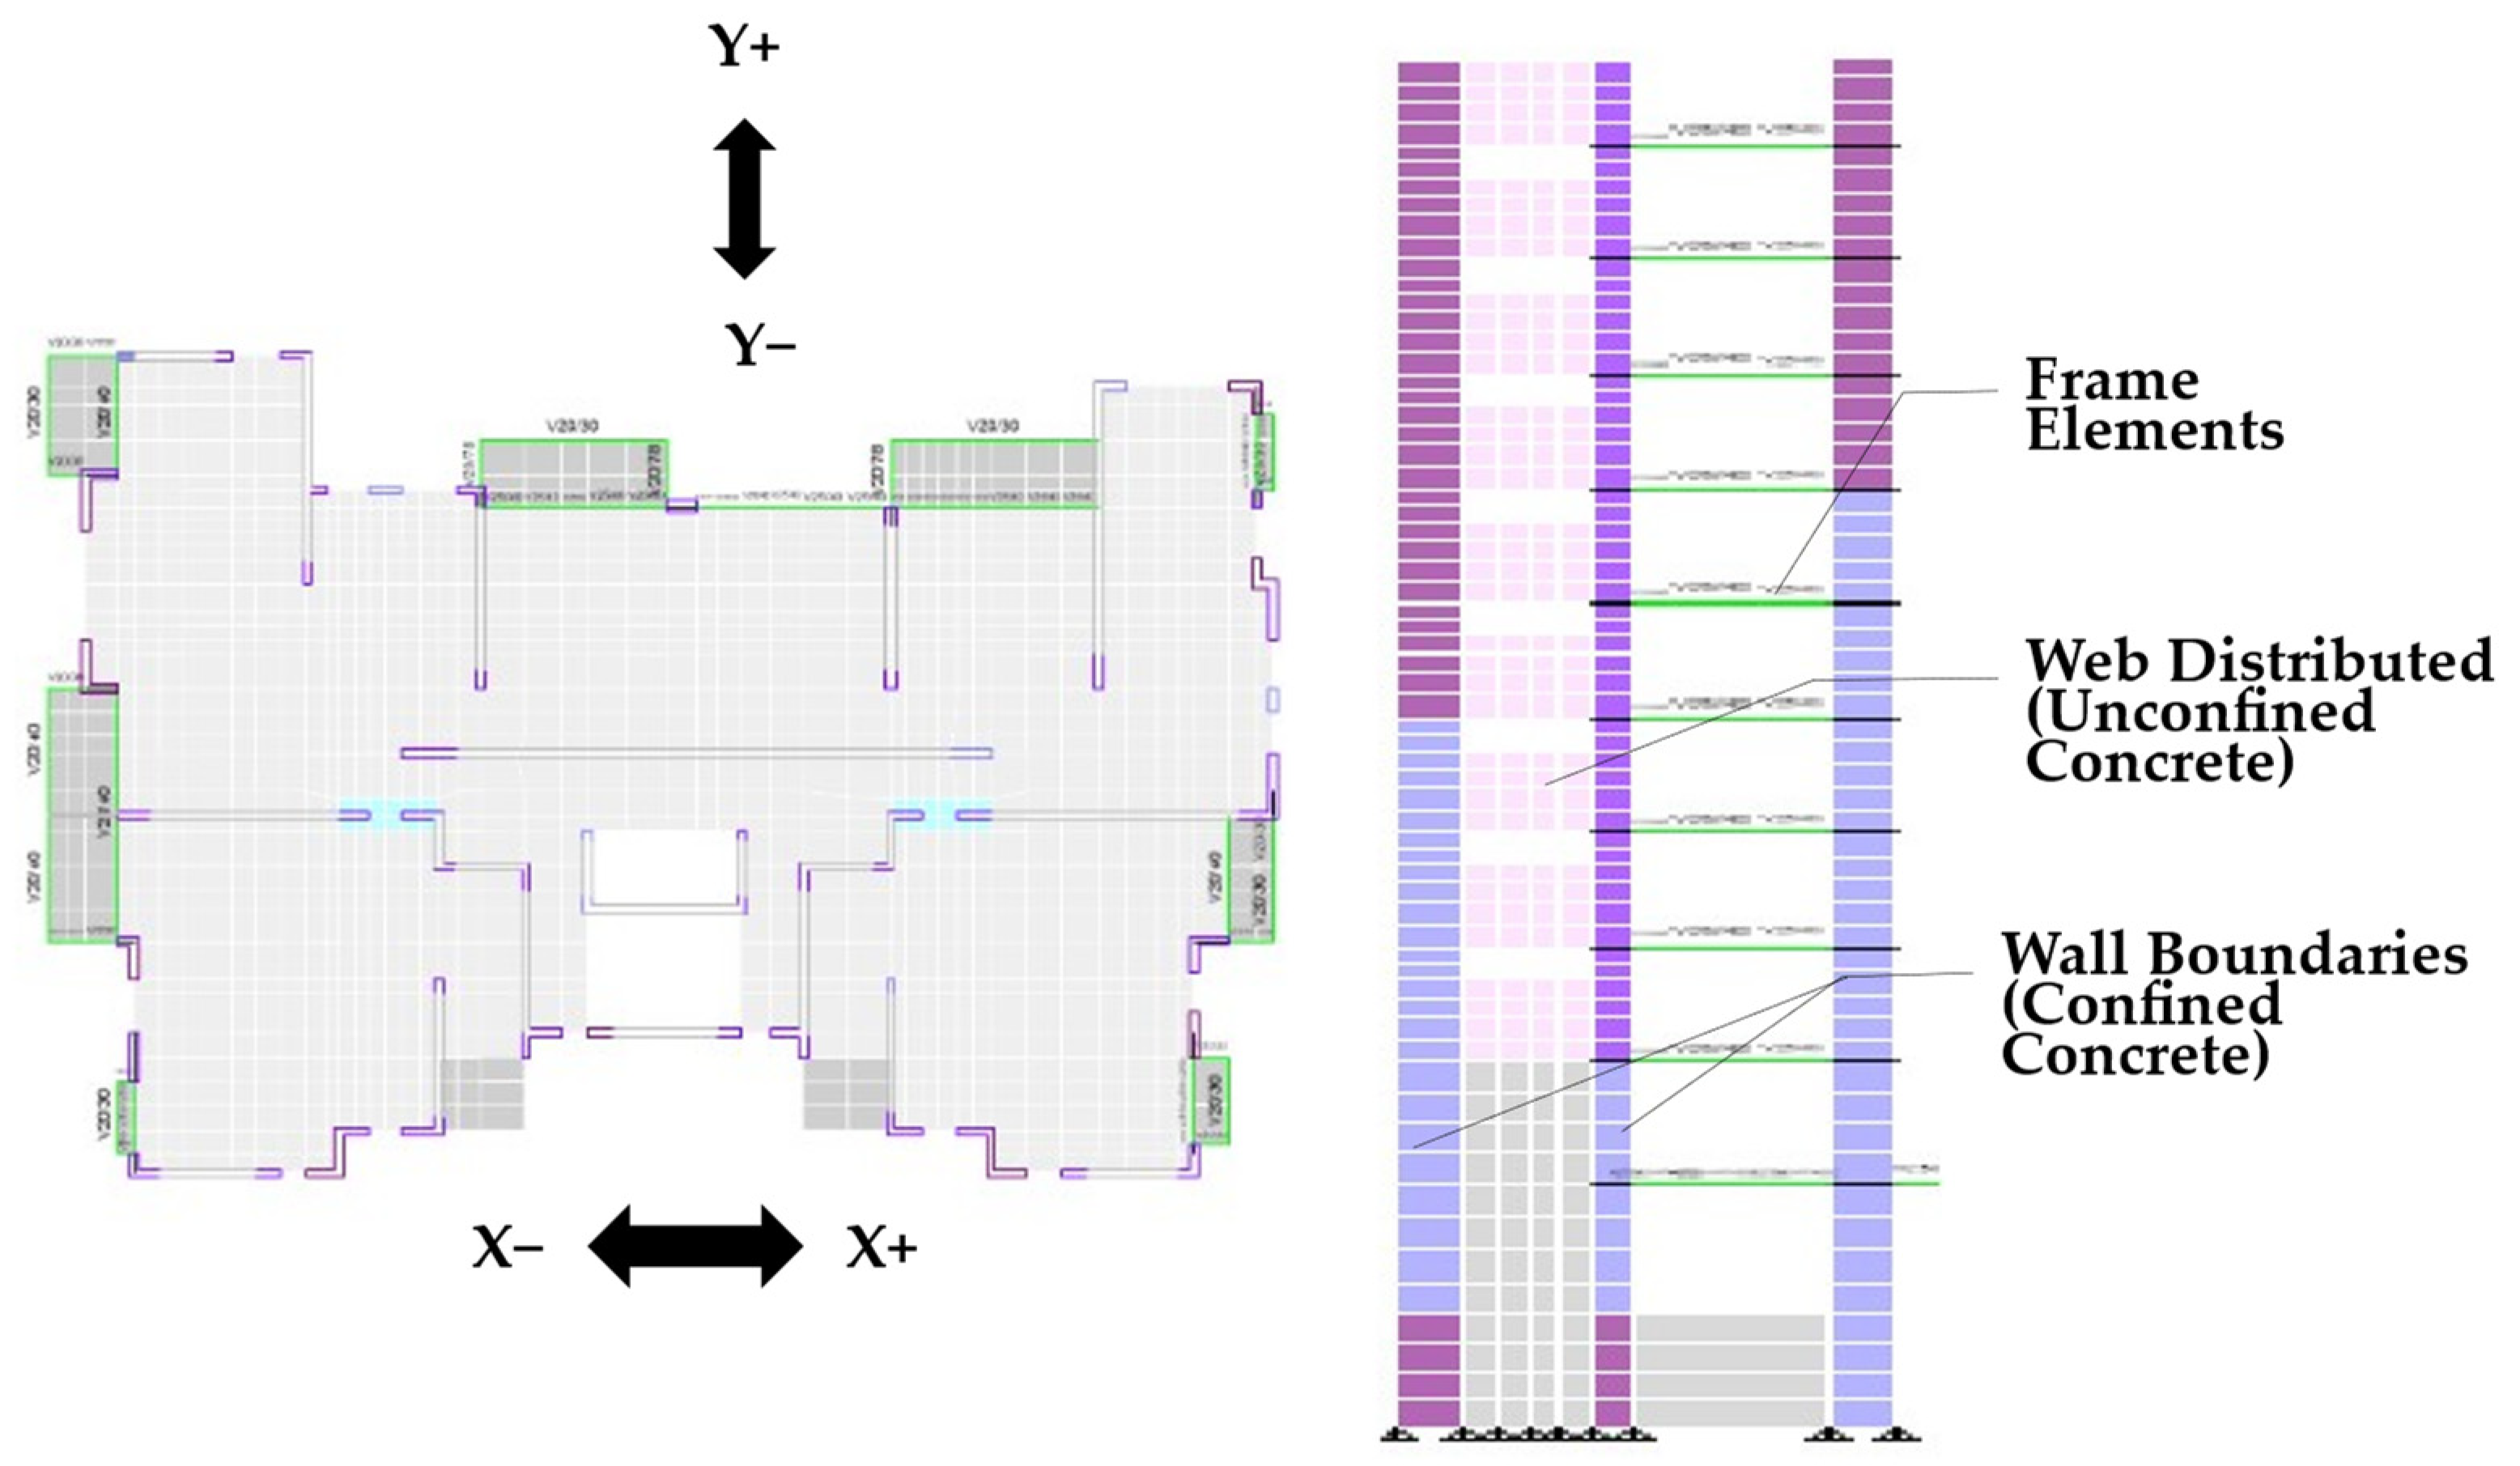
3.2. Analytical Models

The structural components are modeled using different mathematical elements based on their function and behavior. Beams and columns are represented using two-node linear “frame” elements, while slabs, walls, piers, and coupling beams are modeled using four-node shell-type area elements. Additionally, the models are fixed at their base. For the analysis, five different three-dimensional mathematical models are developed in ETABS (2016) (See Table 7): two elastic and three nonlinear models are developed and analyzed, reflecting the structure’s characteristics before the earthquake. These models aim to adequately represent the inelastic behavior and damages the structure suffered.
The first elastic model was developed with all structural elements at their full inertia, without any reductions applied. In contrast, the second elastic model adopted a cracked methodology, reducing the inertia for out-of-plane bending in the slabs by 25% to obtain a more accurate representation of the behavior of these elements under applied loads, which impacts stiffness and strength. The nonlinear models also utilized shell-type elements but considered a layered transversal section to accurately simulate the transverse section of the wall, where each layer represented a segment of the transverse section of the RC wall (such as concrete cover, longitudinal and transversal reinforcing steel bars, confined concrete), utilizing the Darwin–Pecknold material model for the various concrete layers and the model proposed by Park et al. (1982) [24] for representing the nonlinear behavior of reinforcing steel. This approach enabled the modeling of the simultaneous interaction between axial, flexural and shear action across the wall elements under monotonic or cyclic loads. While maintaining slabs’ elasticity with a 50% reduction in their flexural inertia, these nonlinear models also include discretized inelastic segments to capture damage in slab portions acting as coupled elements. The first nonlinear model used unconfined concrete for the elements, representing the building’s state before 2010 Mw8.8 Earthquake. The analyzed structure is representative of buildings designed according to the criteria of the Chilean Seismic Design Standard of 2009 [25], which did not require confinement for wall boundary elements for this reason; the second nonlinear model incorporates confined concrete properties for the wall boundary elements in accordance with the requirements from the DS60 and 61 code requirements introduced after the Mw8.8 Earthquake, facilitating a comparative analysis of walls with and without confinements. In the third nonlinear model, the elastic elements that make up the slabs are further reduced by 40% for the stiffness of the membrane portion and 10% for the bending portion to confirm the slab’s strut-like behavior. This adjustment is reflected in the results of a reduction in the generated zigzag pattern in the stress and deformation analysis.
The discretization of the analytical models (see Figure 4) maintains an aspect ratio between 1.0 and 1.5, ensuring the accurate representation of the wall cross-section and reinforcement configurations.
The connectivity between all the structural elements and the finite element mesh is manually ensured by dividing the elements both horizontally and vertically, which allows for a more even distribution of curvature. In the nonlinear shell elements, the transversal section is discretized into nine layers: four for the reinforcing steel (comprising two layers each for positive and negative steel, both longitudinal and transversal), two for the concrete cover, and three for the concrete core.

3.3. Material Constitutive Models

The concrete layers are modeled as orthotropic plane material, utilizing uniaxial constitutive models to represent average stress and deformations in the principal directions. The biaxial behavior of concrete is modeled according to the Darwin–Pecknold model [26,27], which assumes that biaxial stress in concrete can be depicted using an equivalent uniaxial stress–strain curve along the principal orthotropy axis. This approach assumes that the directions of deformation align with the main stress directions.
For the modeling ([27]) of unconfined concrete under compression, the uniaxial constitutive model developed by Mander et al. (1984) [28] is utilized (See Table 8). To incorporate the effects of confinement, the constitutive model by Saatcioglu and Razvi [29] is applied. The tension envelope is divided into pre-cracking and post-cracking phases, as proposed by Belarbi and Hsu [30] and applied by Massone et al. [31]. This methodology allows for the accommodation of stress degradation in concrete, including tension stiffening, through a descending branch.
The uniaxial constitutive law of steel follows the curve proposed by Park et al. [24], which incorporates hardening through an empirical function.
Furthermore, the constitutive model by Belarbi and Hsu [30] was employed to consider the influence of reinforcing steel bars embedded in concrete. A key feature of this model proposed by Belarbi and Hsu [30] is its consideration of the reduced yield stress, indicating that the yield strength of a reinforced concrete element happens when the stress in the steel within the cracked section reaches the yield strength of the unembedded bar [31].

3.4. Load Application

The models incorporate both gravity and seismic loads. Within the gravity loads, dead (D) and live (L) loads are considered for an initial load state prior to the application of the seismic lateral load considered for the nonlinear static analysis. Infill walls are excluded from the numerical modeling due to their stiffness contribution being considered almost negligible in comparison to that of structural walls. However, the mass of infill walls is included within the gravitational loads (structural and non-structural elements), on each floor and distributed across all nodes comprising the slabs, as detailed in Table 9. The load pattern for the push-over analysis was derived from the shear force at each story, as determined via modal–structural analysis.
The building’s first vibration period is torsional (0.94 s). The second mode, oriented in the Y direction, has a period of 0.72 s, and the third mode, in the X direction, is 0.49 s. These values assumed a model where all the slabs are cracked, which is modeled using a 25% reduction in the slabs’ bending to simulate the condition of the already-loaded slabs.
Considering that the slender nature of buildings can either amplify or diminish the forces transmitted to the structure, depending on the earthquake’s frequency content [32], the desired displacement for achieving Immediate Occupancy performance levels is determined from the elastic displacement spectrum with 5% damping. This determination is based on seismic data recorded in Viña del Mar during the 27 February 2010 earthquake, as shown in Figure 5 (a y b). This is correlated with the structure’s period, yielding a target displacement of 155 mm. This aligns with the provisions of FEMA 356, which establishes a target displacement 1.5 times greater than the maximum expected displacement, as calculated according to the provisions of NCh433. For the second performance level, a displacement of 254 mm was used to comply with the requirement of evaluating roof displacement up to a level 40% greater than the maximum design earthquake displacement.
The outcomes presented in the subsequent subsection are assessed under the load condition denoted as 1.0 D + 0.25 L + 1.0 P , where D represents the dead load state, L represents the live load state and P represents the push-over load state.

3.5. Analysis of Results

In order to check the reliability of the models prior to photographic comparison with the damage suffered by the structure, a comparison of the vibration periods between the data obtained via seismic instrumentation and those obtained using the models (elastic, cracked and nonlinear) was carried out, which between them, as shown in the figure, have a similar trend, with a maximum error of 20% compared to the instrumented method (see Figure 6).
Considering the reliability of the models, the results of the analysis are compared with a photographic report of the damage after the earthquake to assess whether a simple model produced in a commercial program is able to accurately represent the damage observed in the structural walls during the Mw8.8 Chile earthquake. It should be noted that most of the buildings did not suffer severe structural damage.
In local analyses, the focus is on walls and slabs, as they are the structural elements most affected by the earthquake.

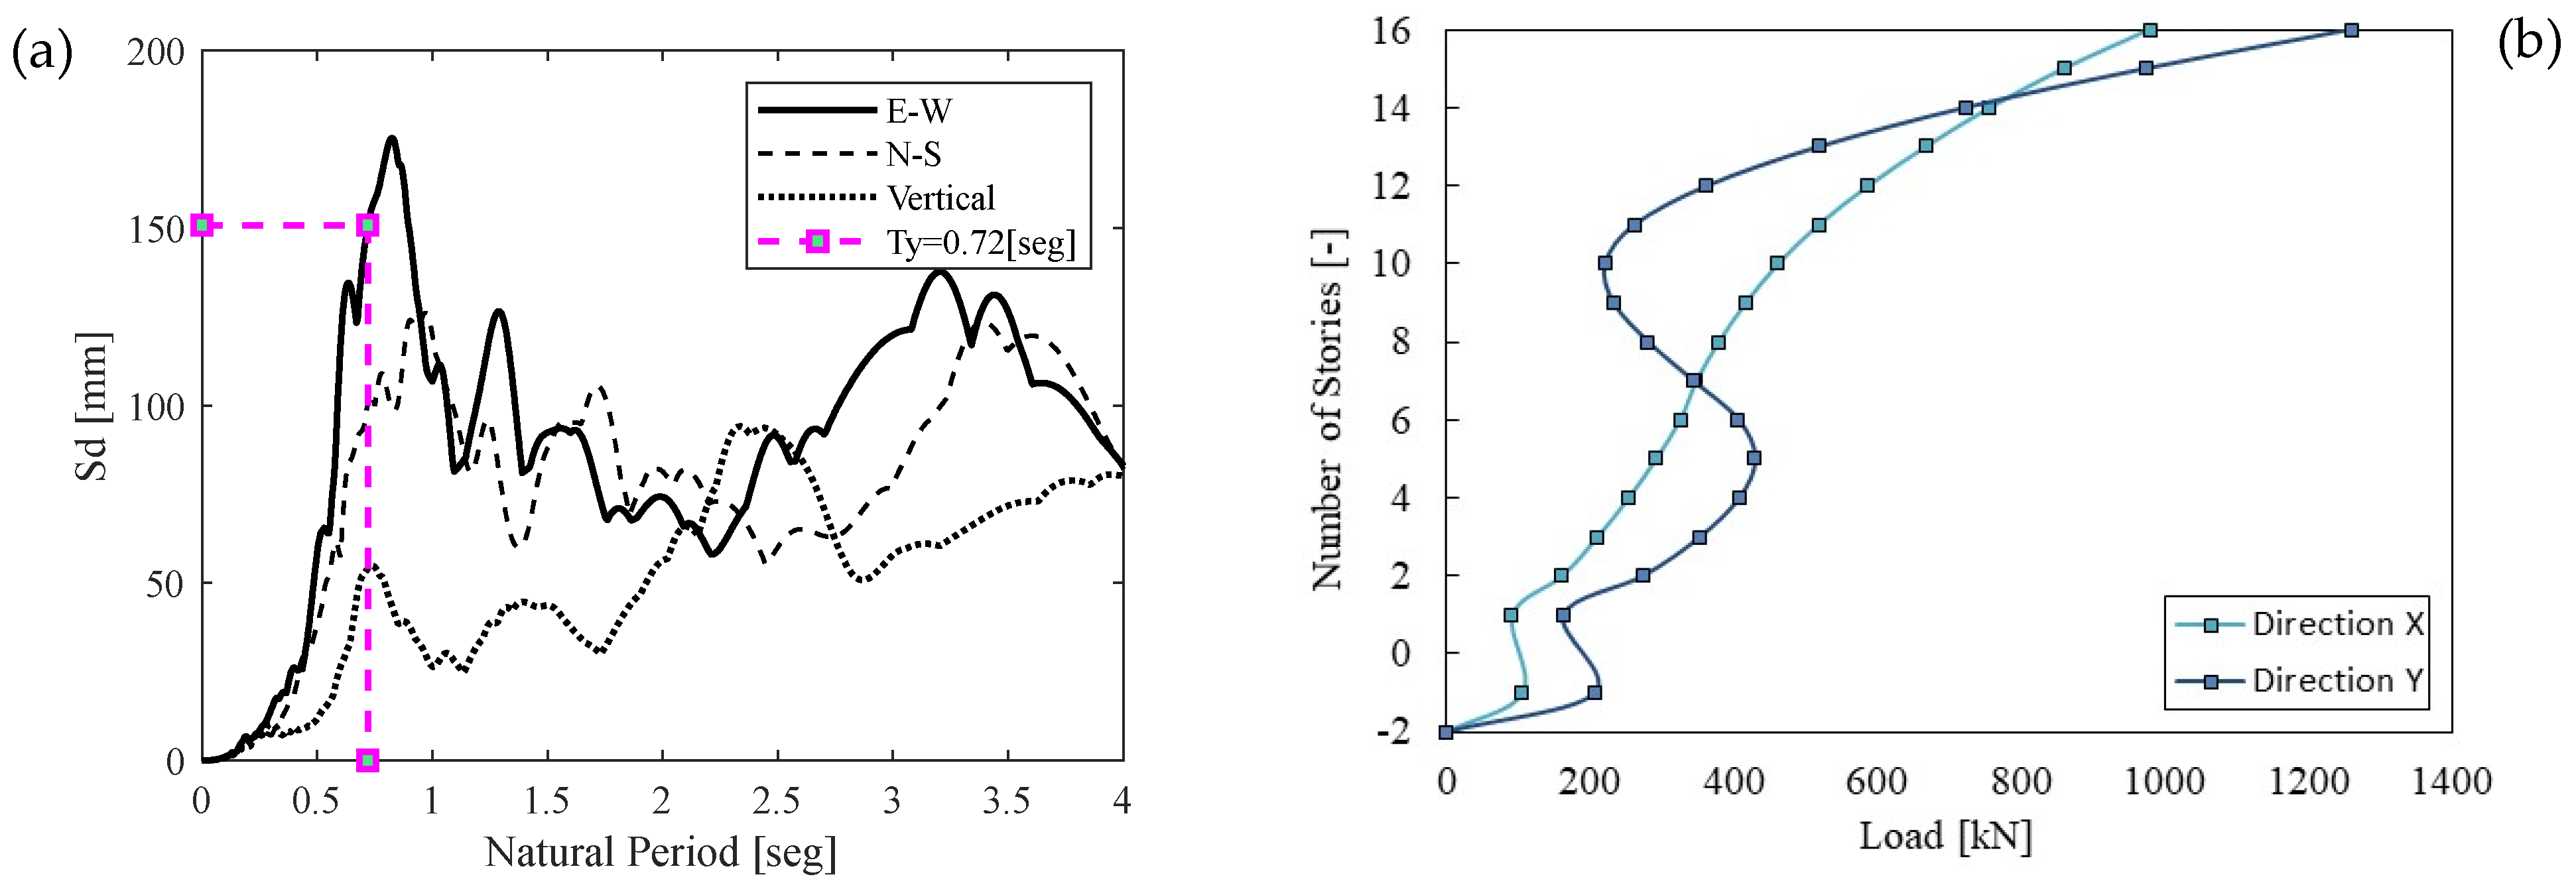
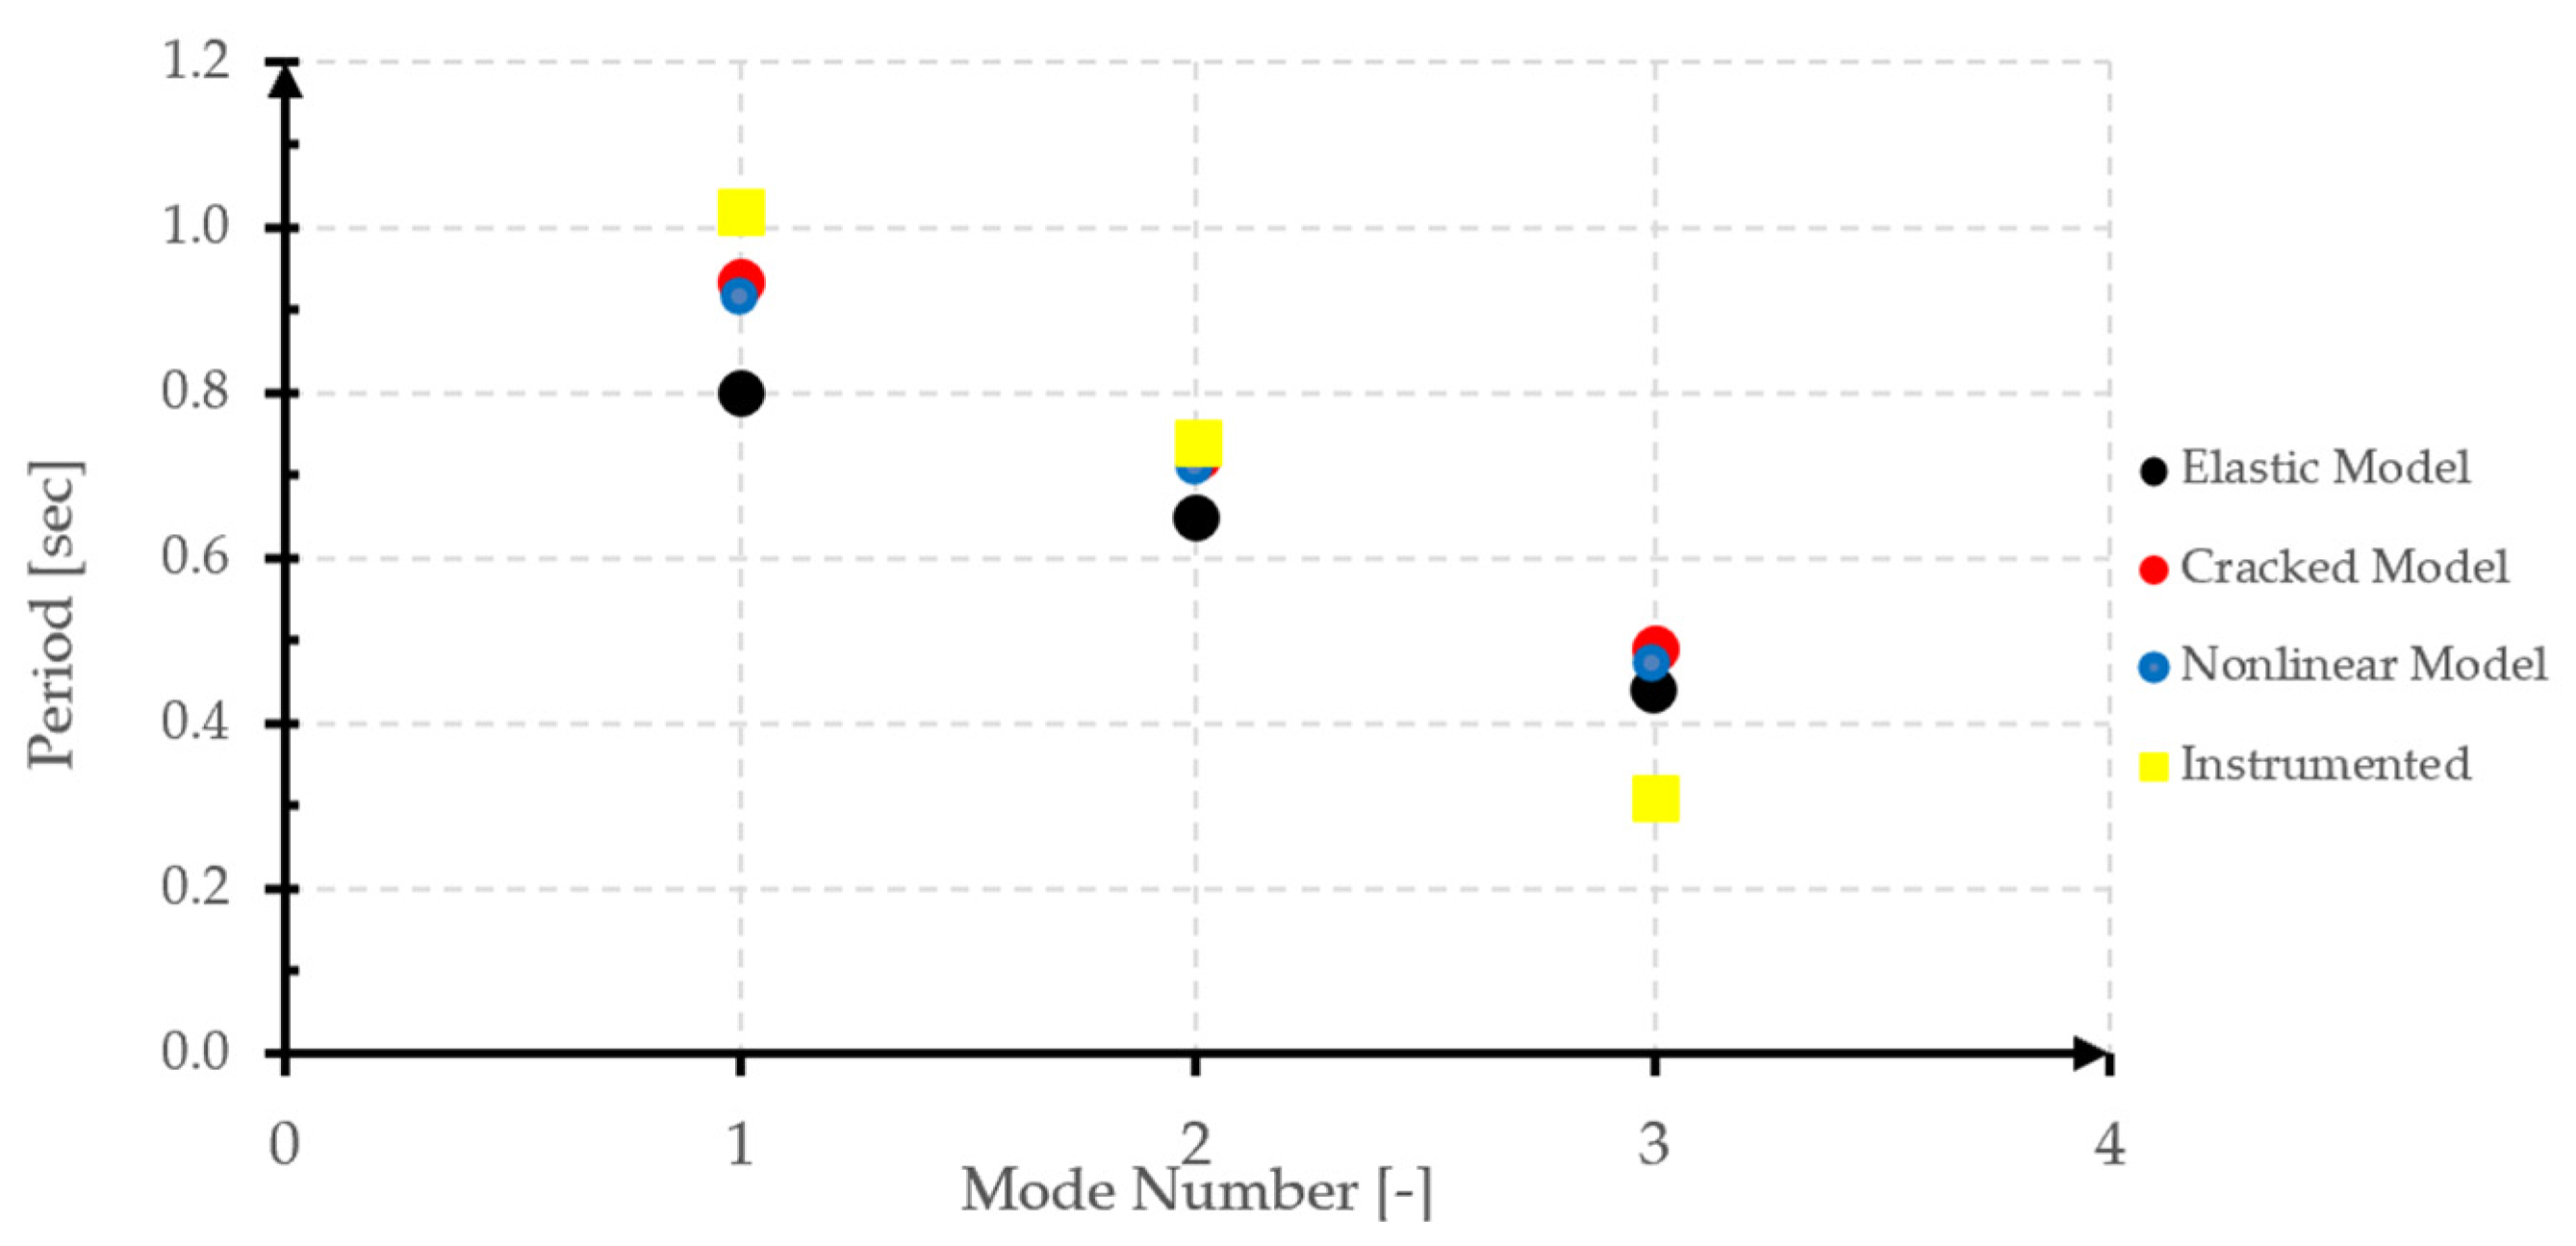
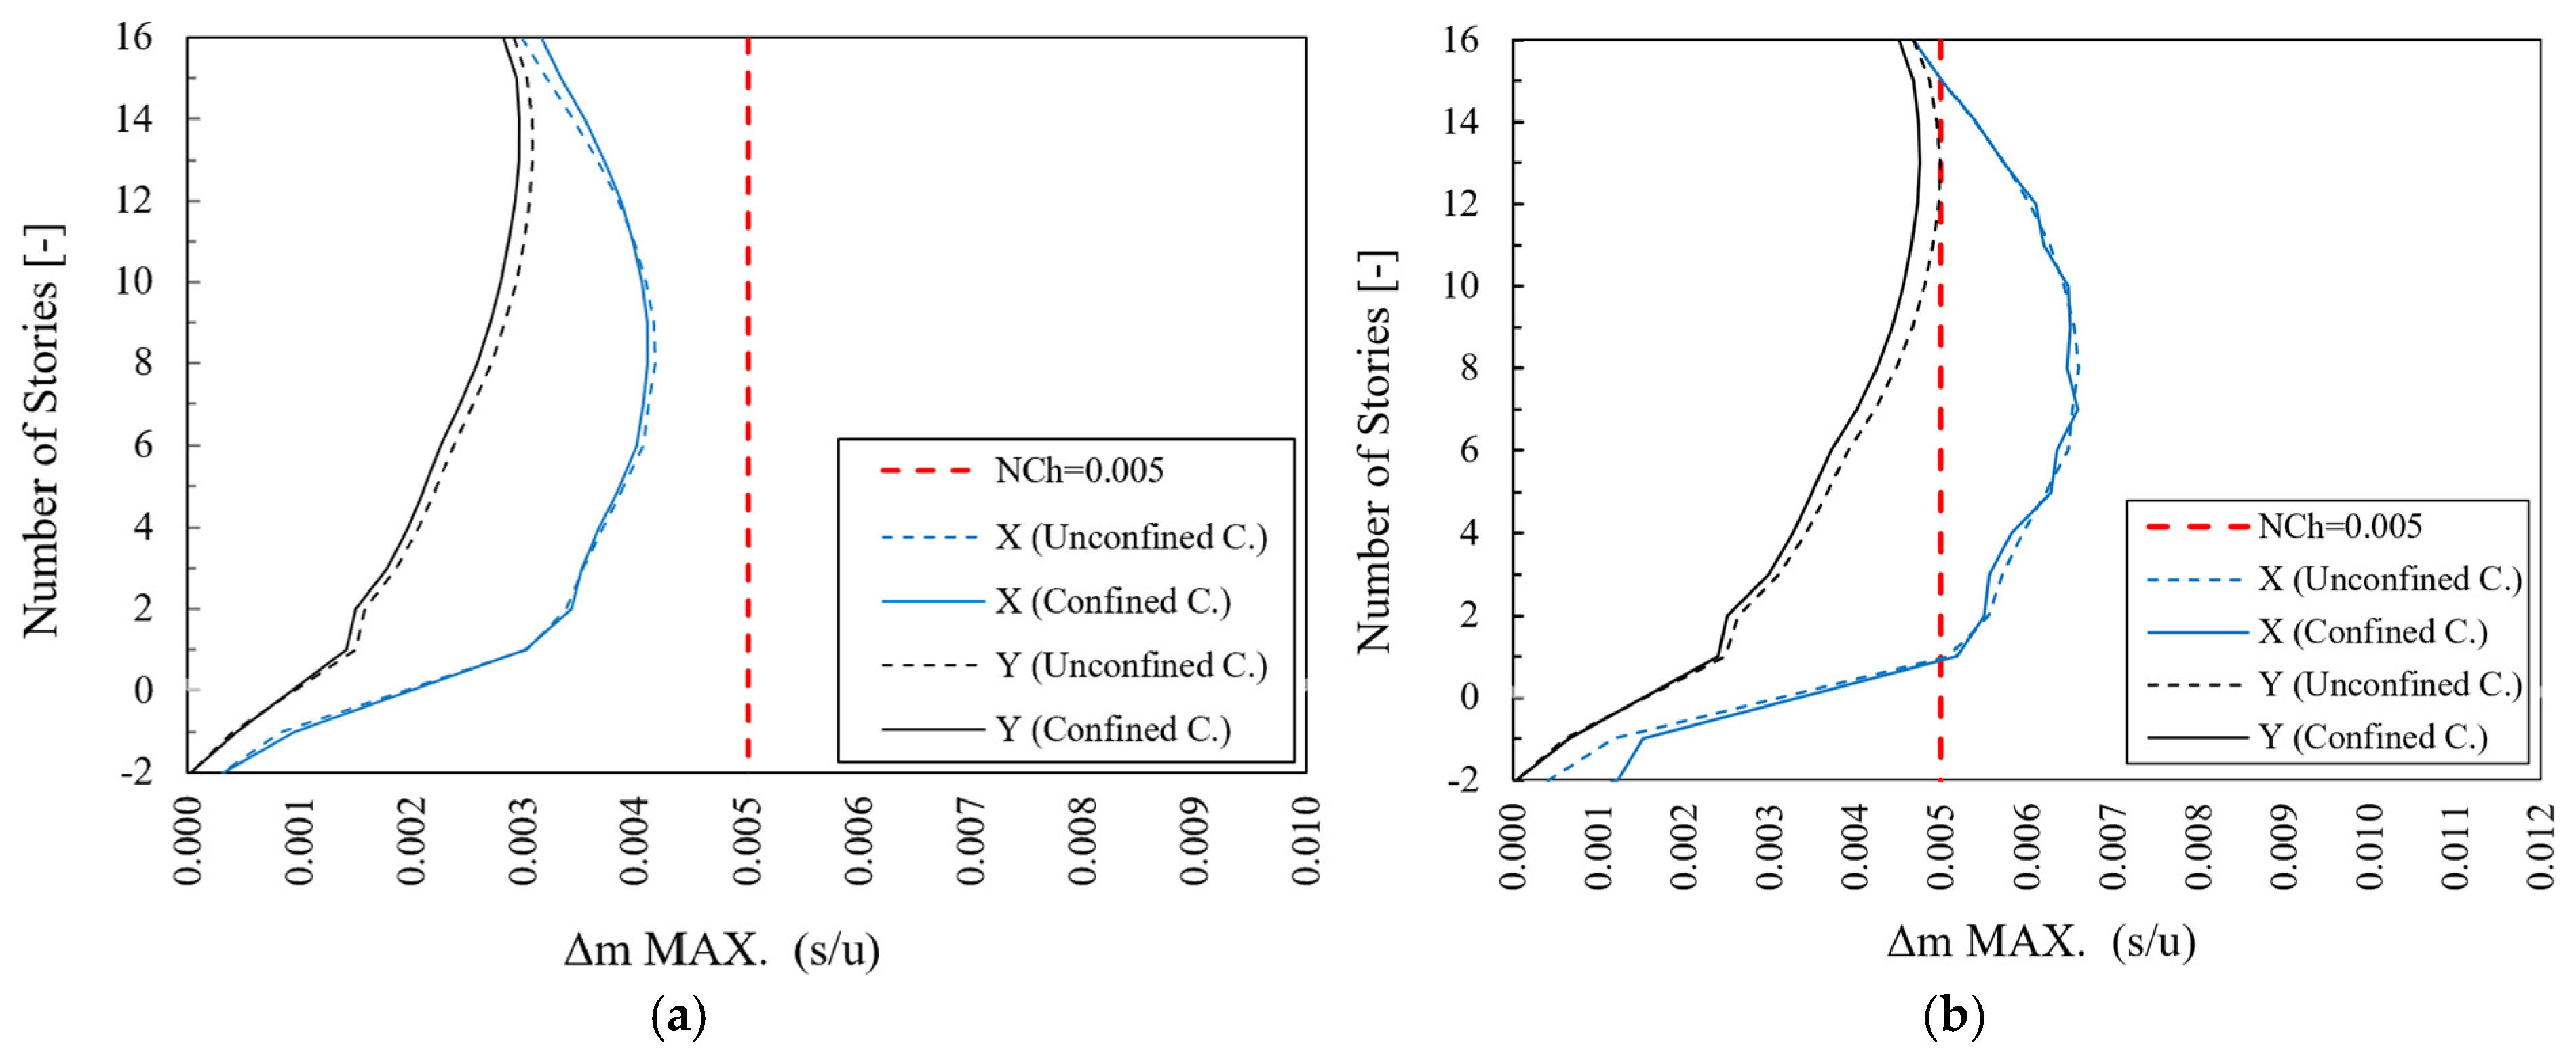
3.5.1. Global Response Analysis

In terms of drifts, Figure 7 presents a comparison between the confined and unconfined model’s results with a top building displacement of 155 mm, which is the proposed limit according to the Chilean Guide.

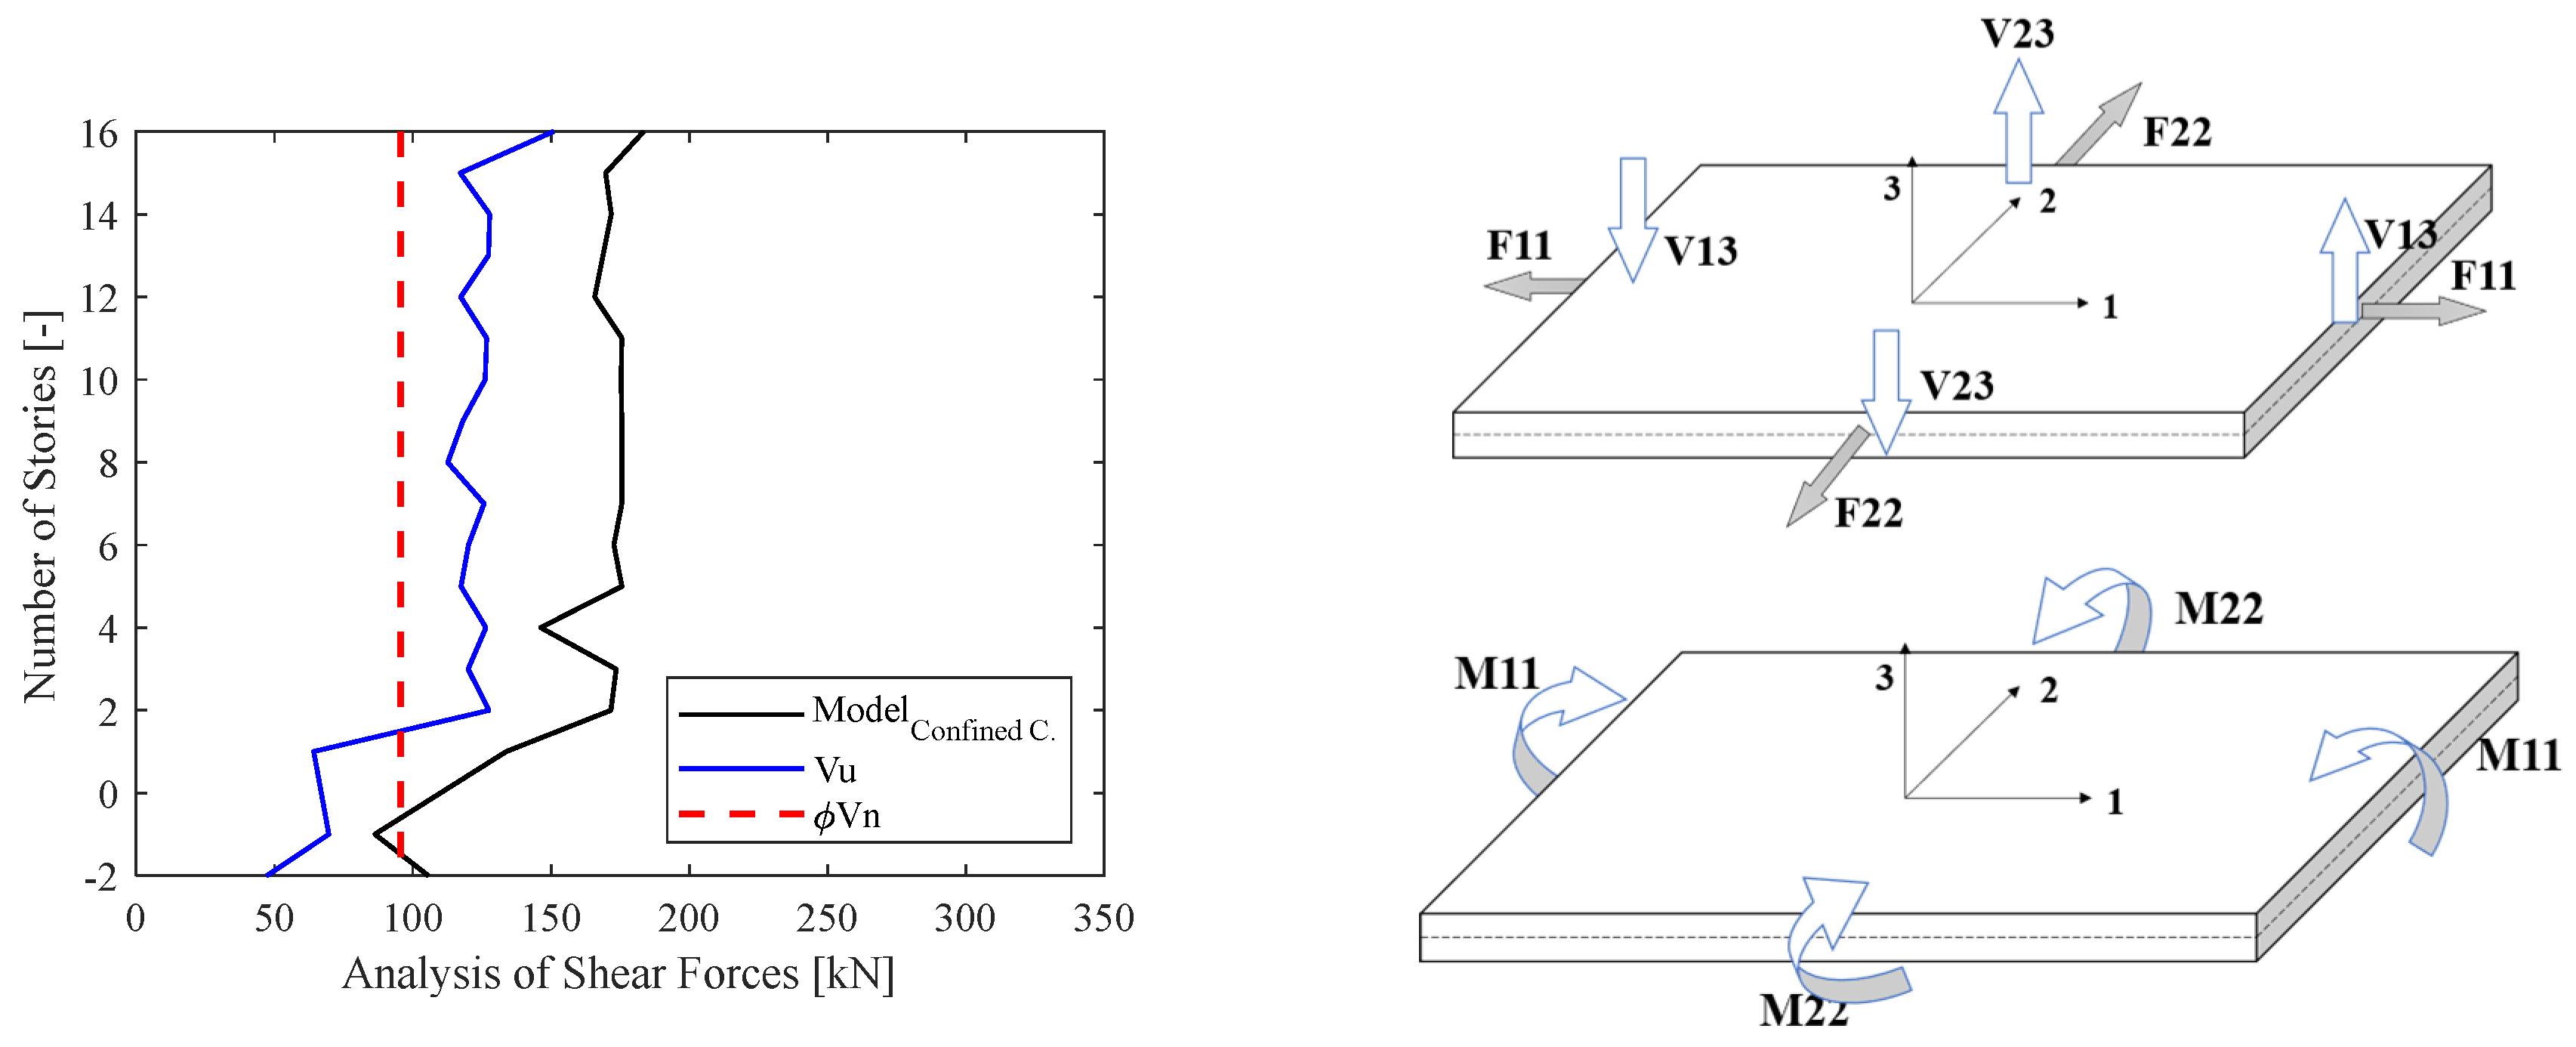
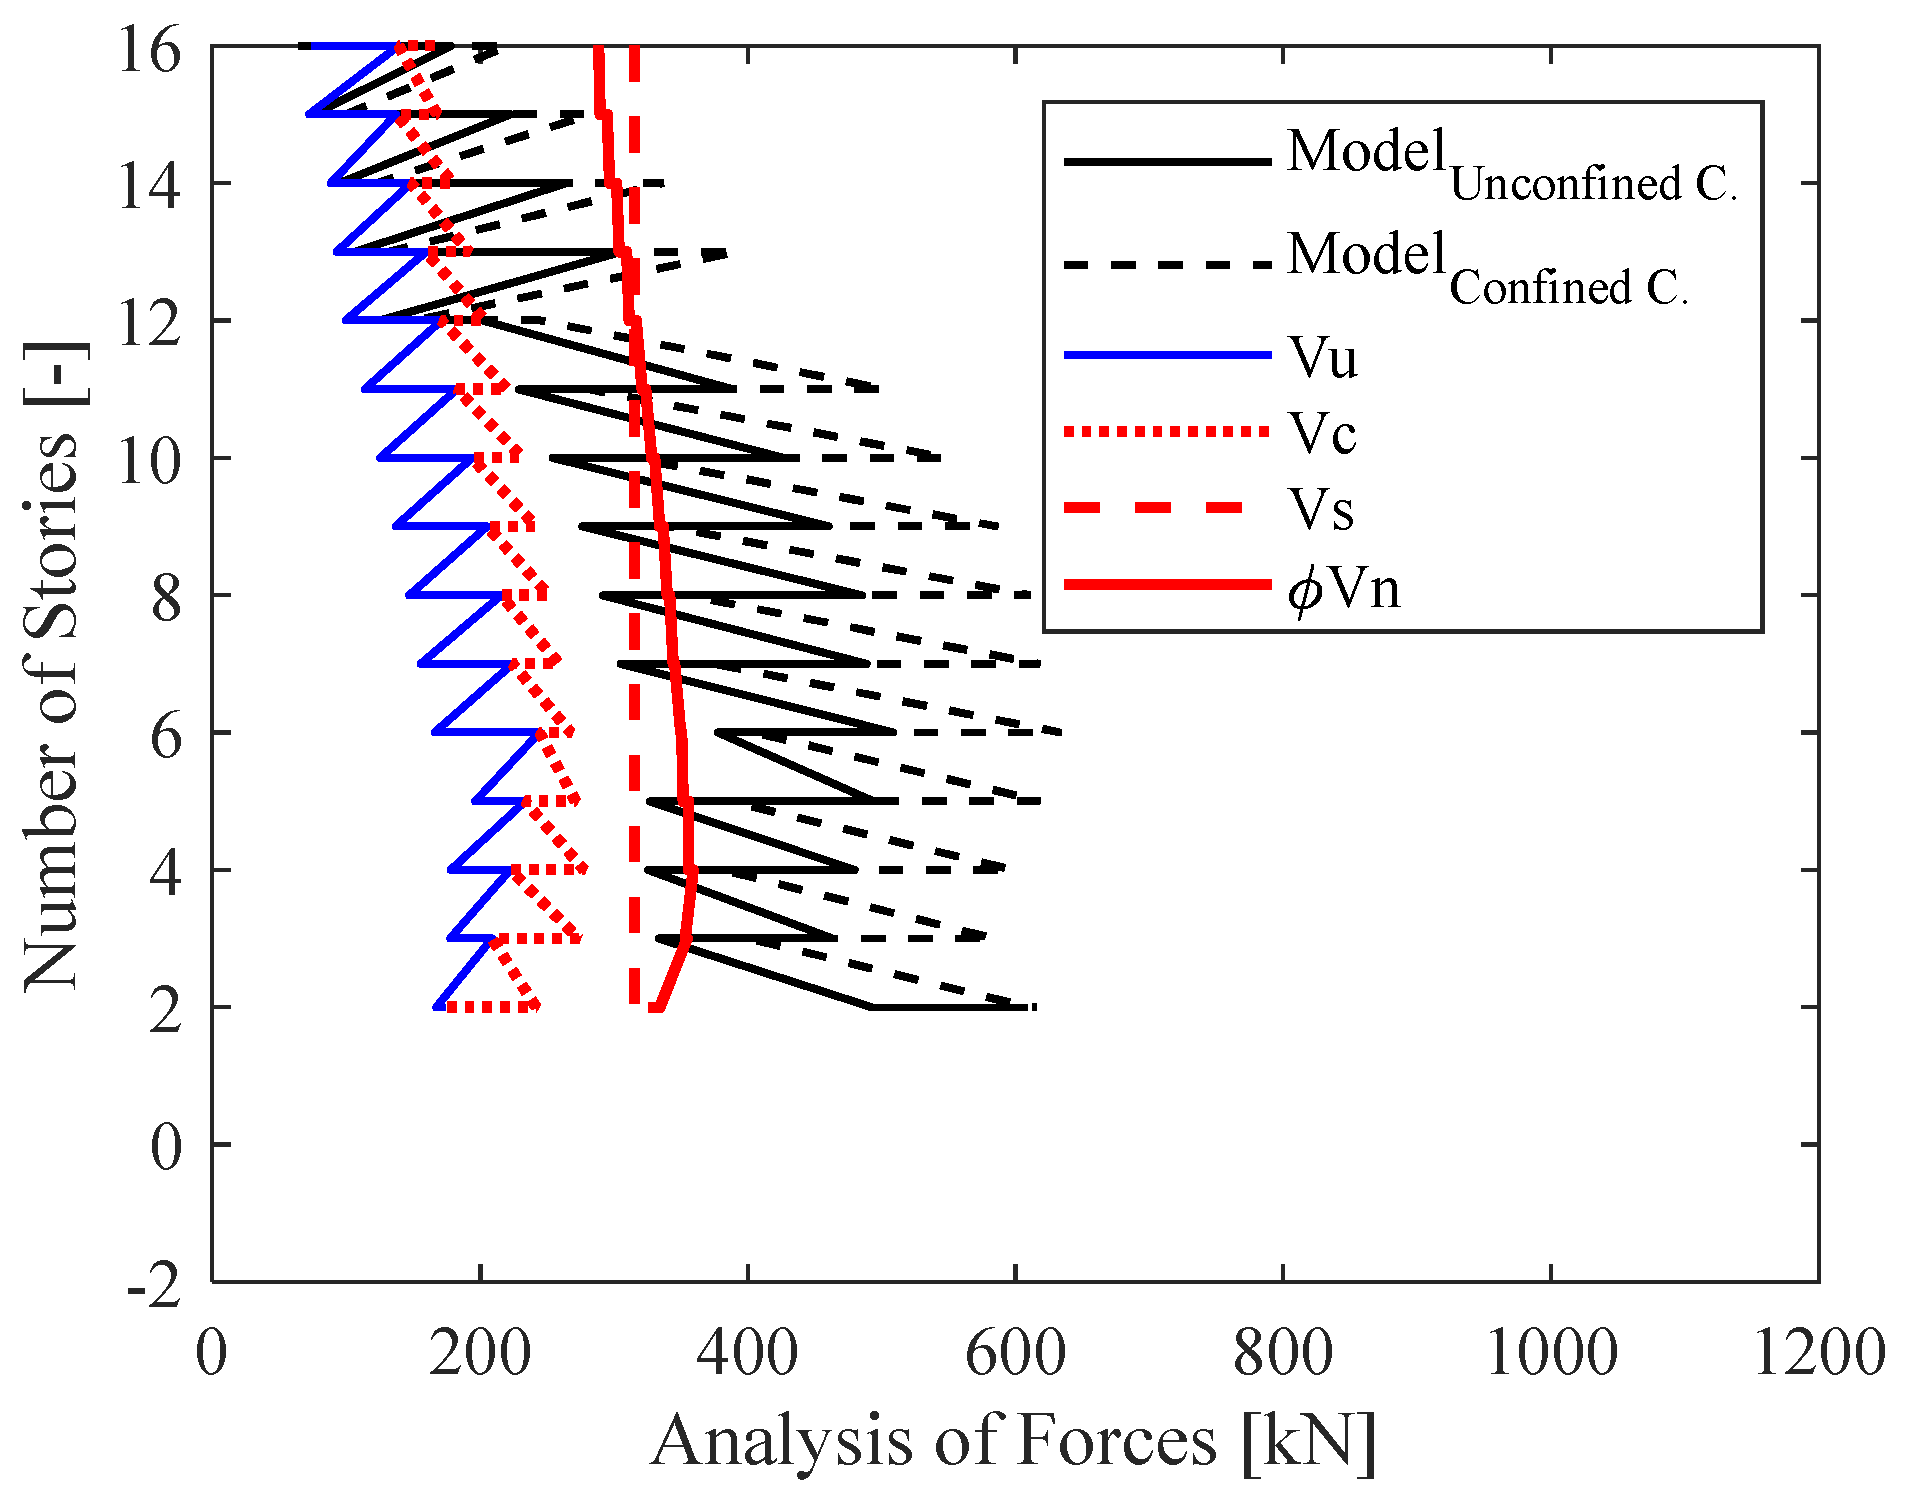
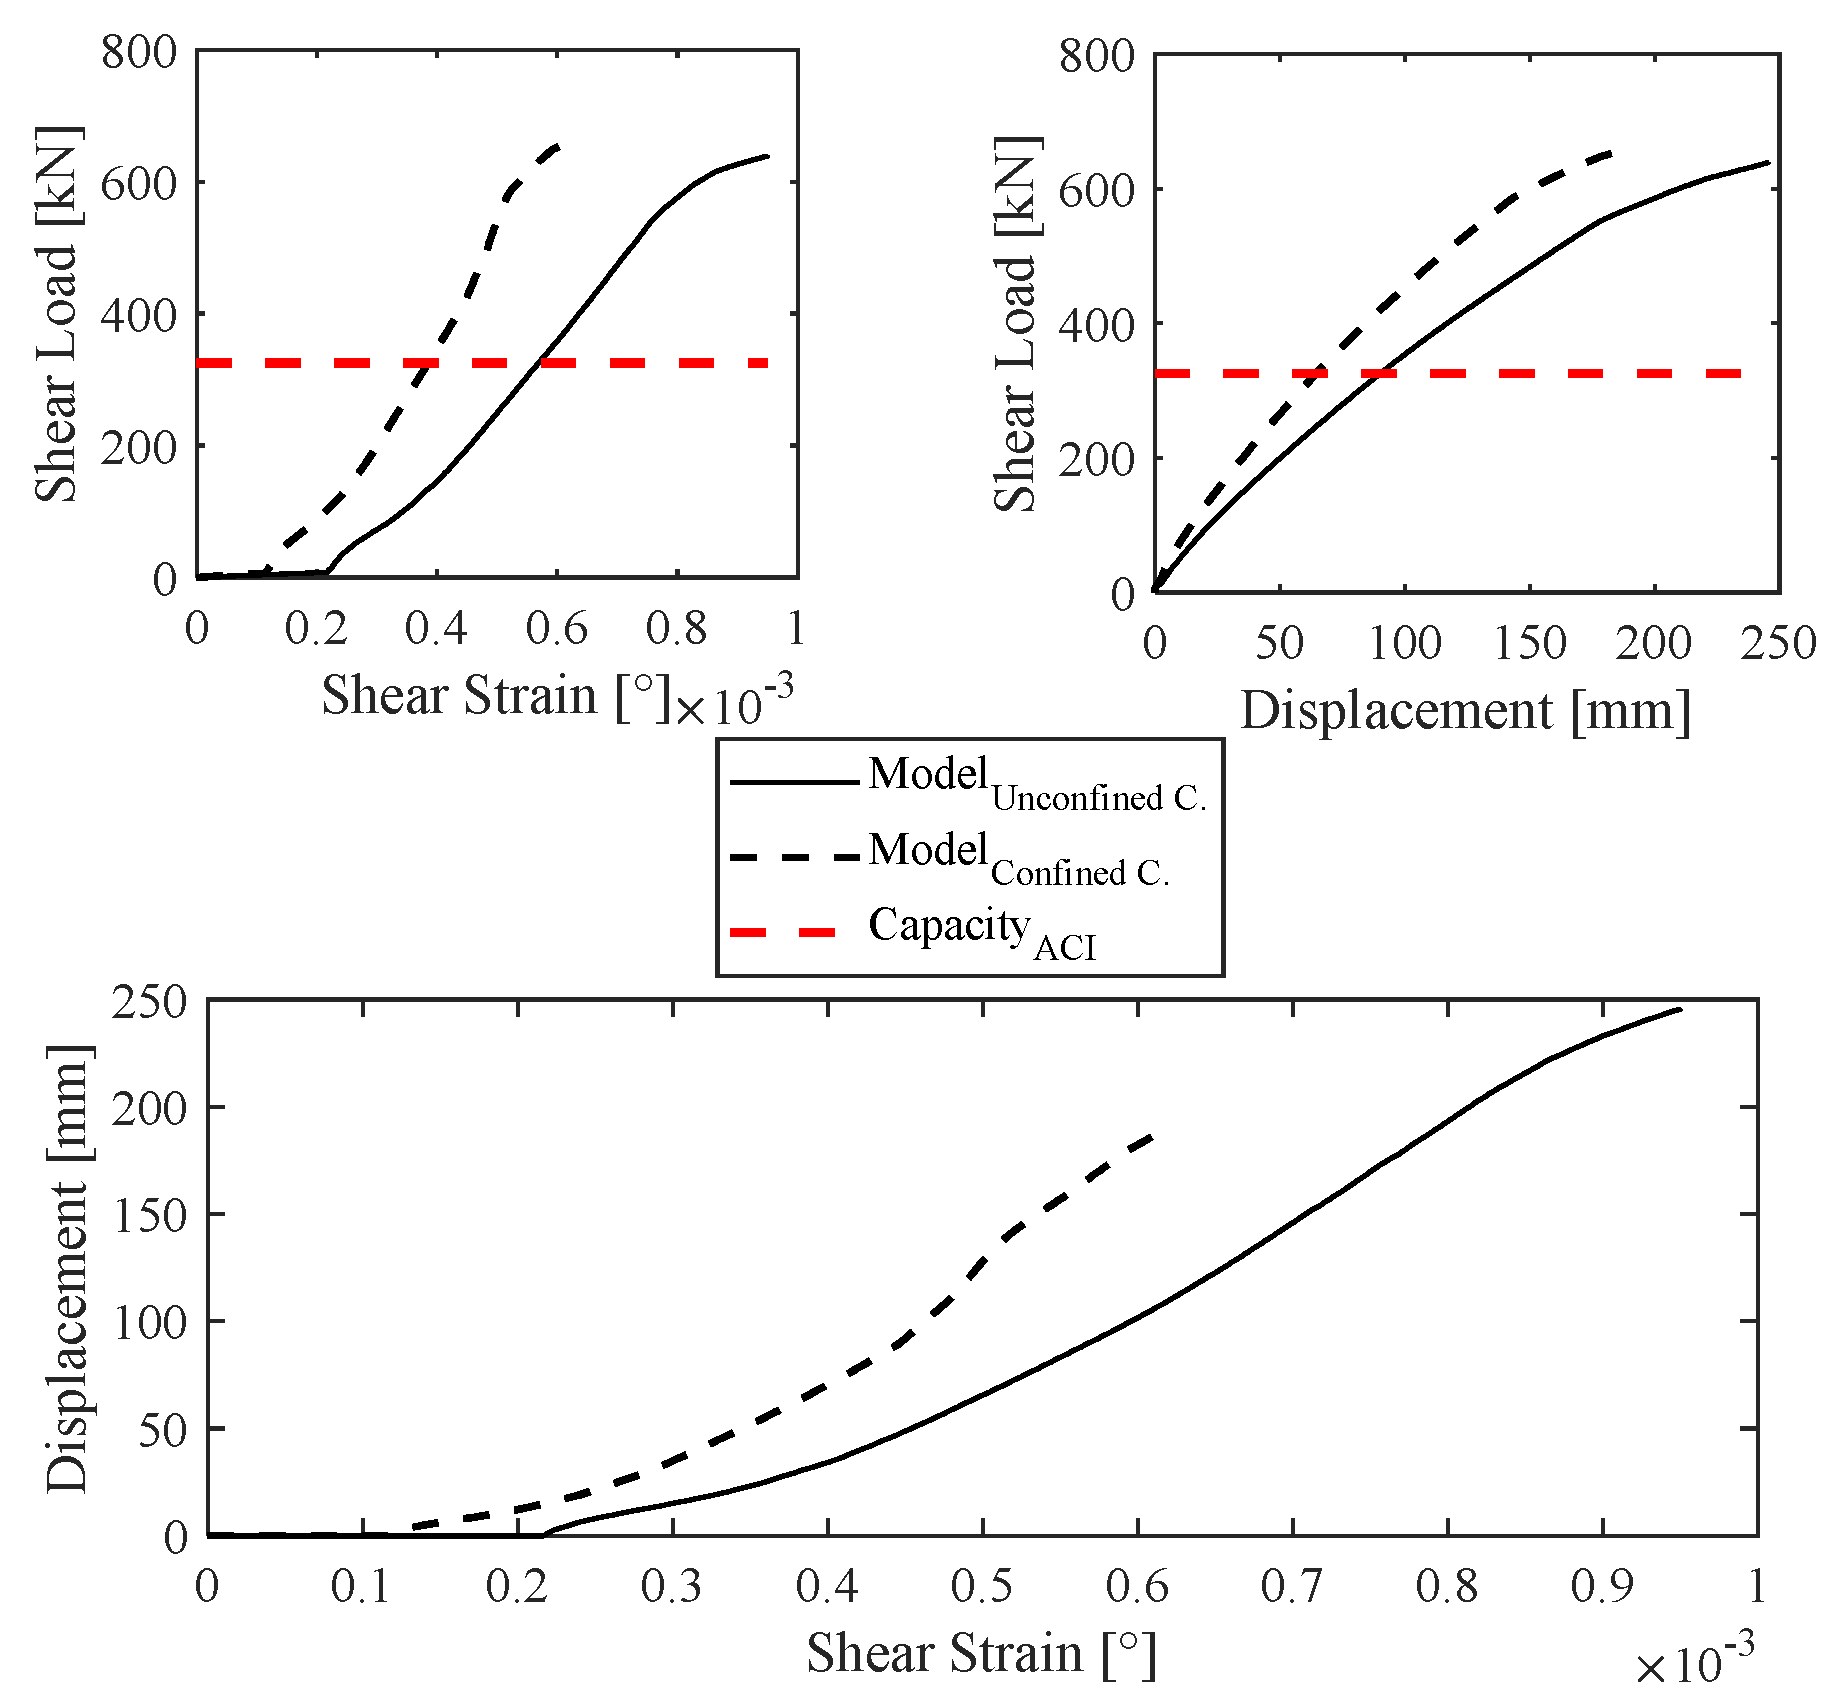
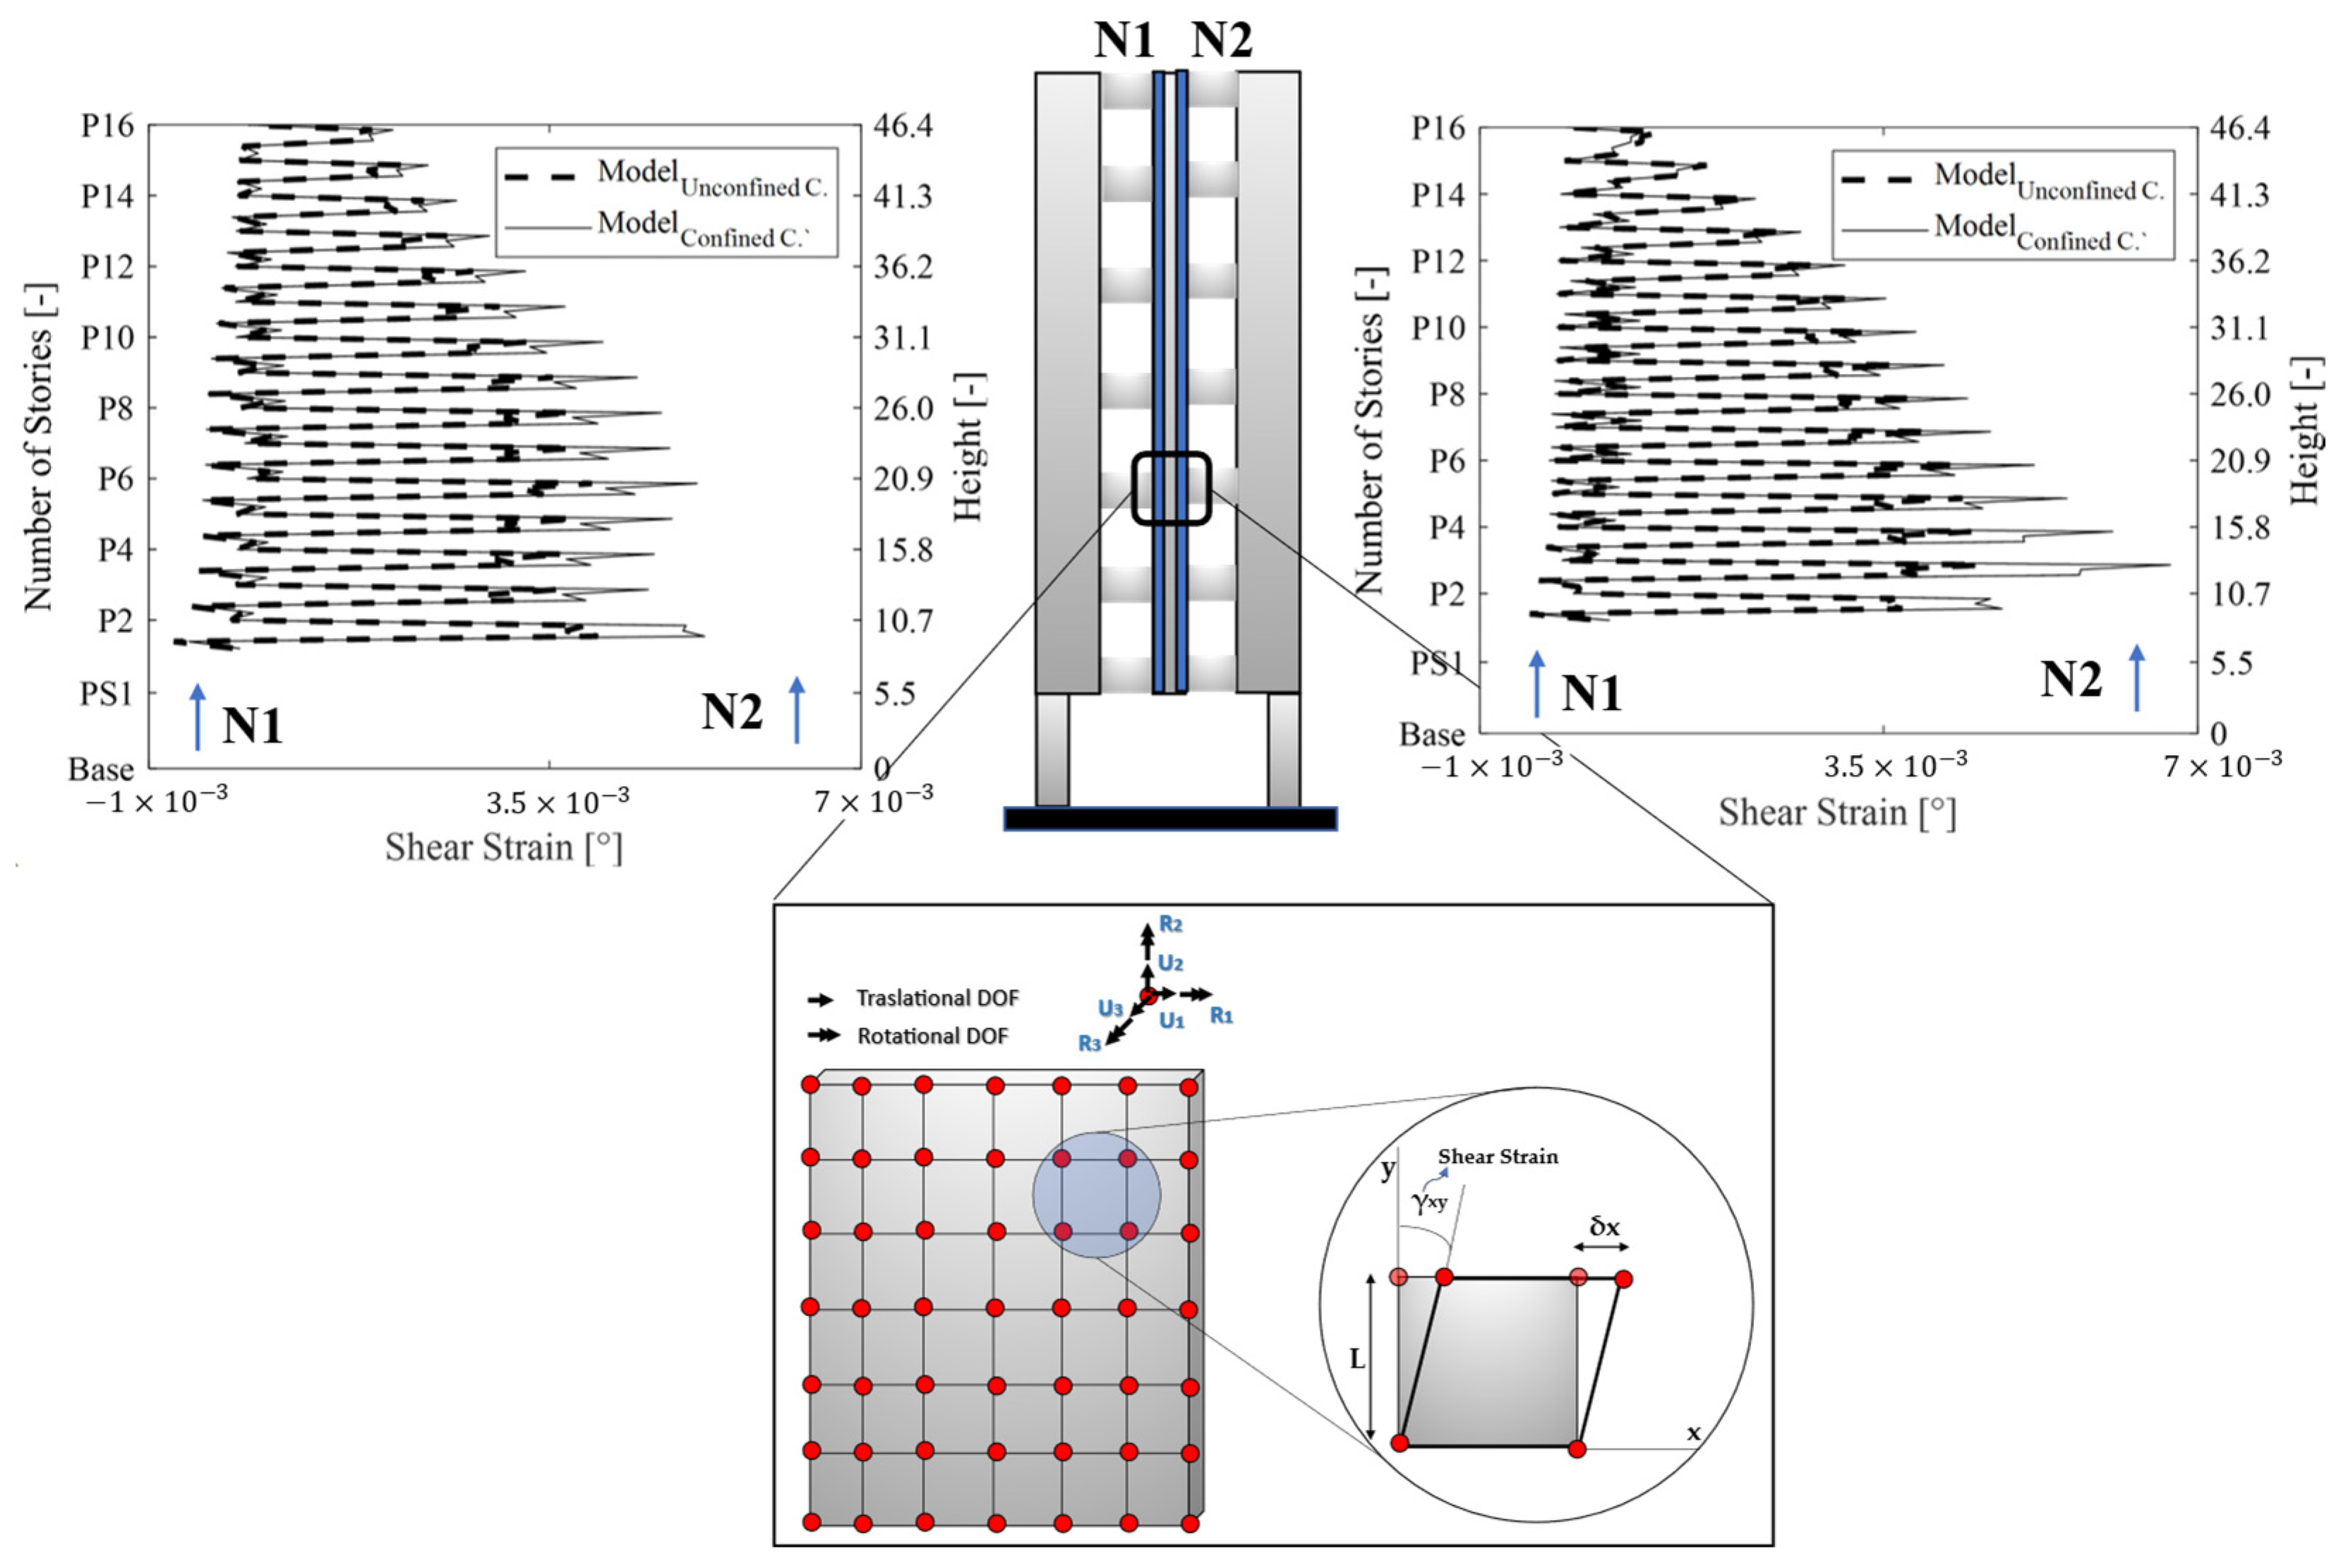
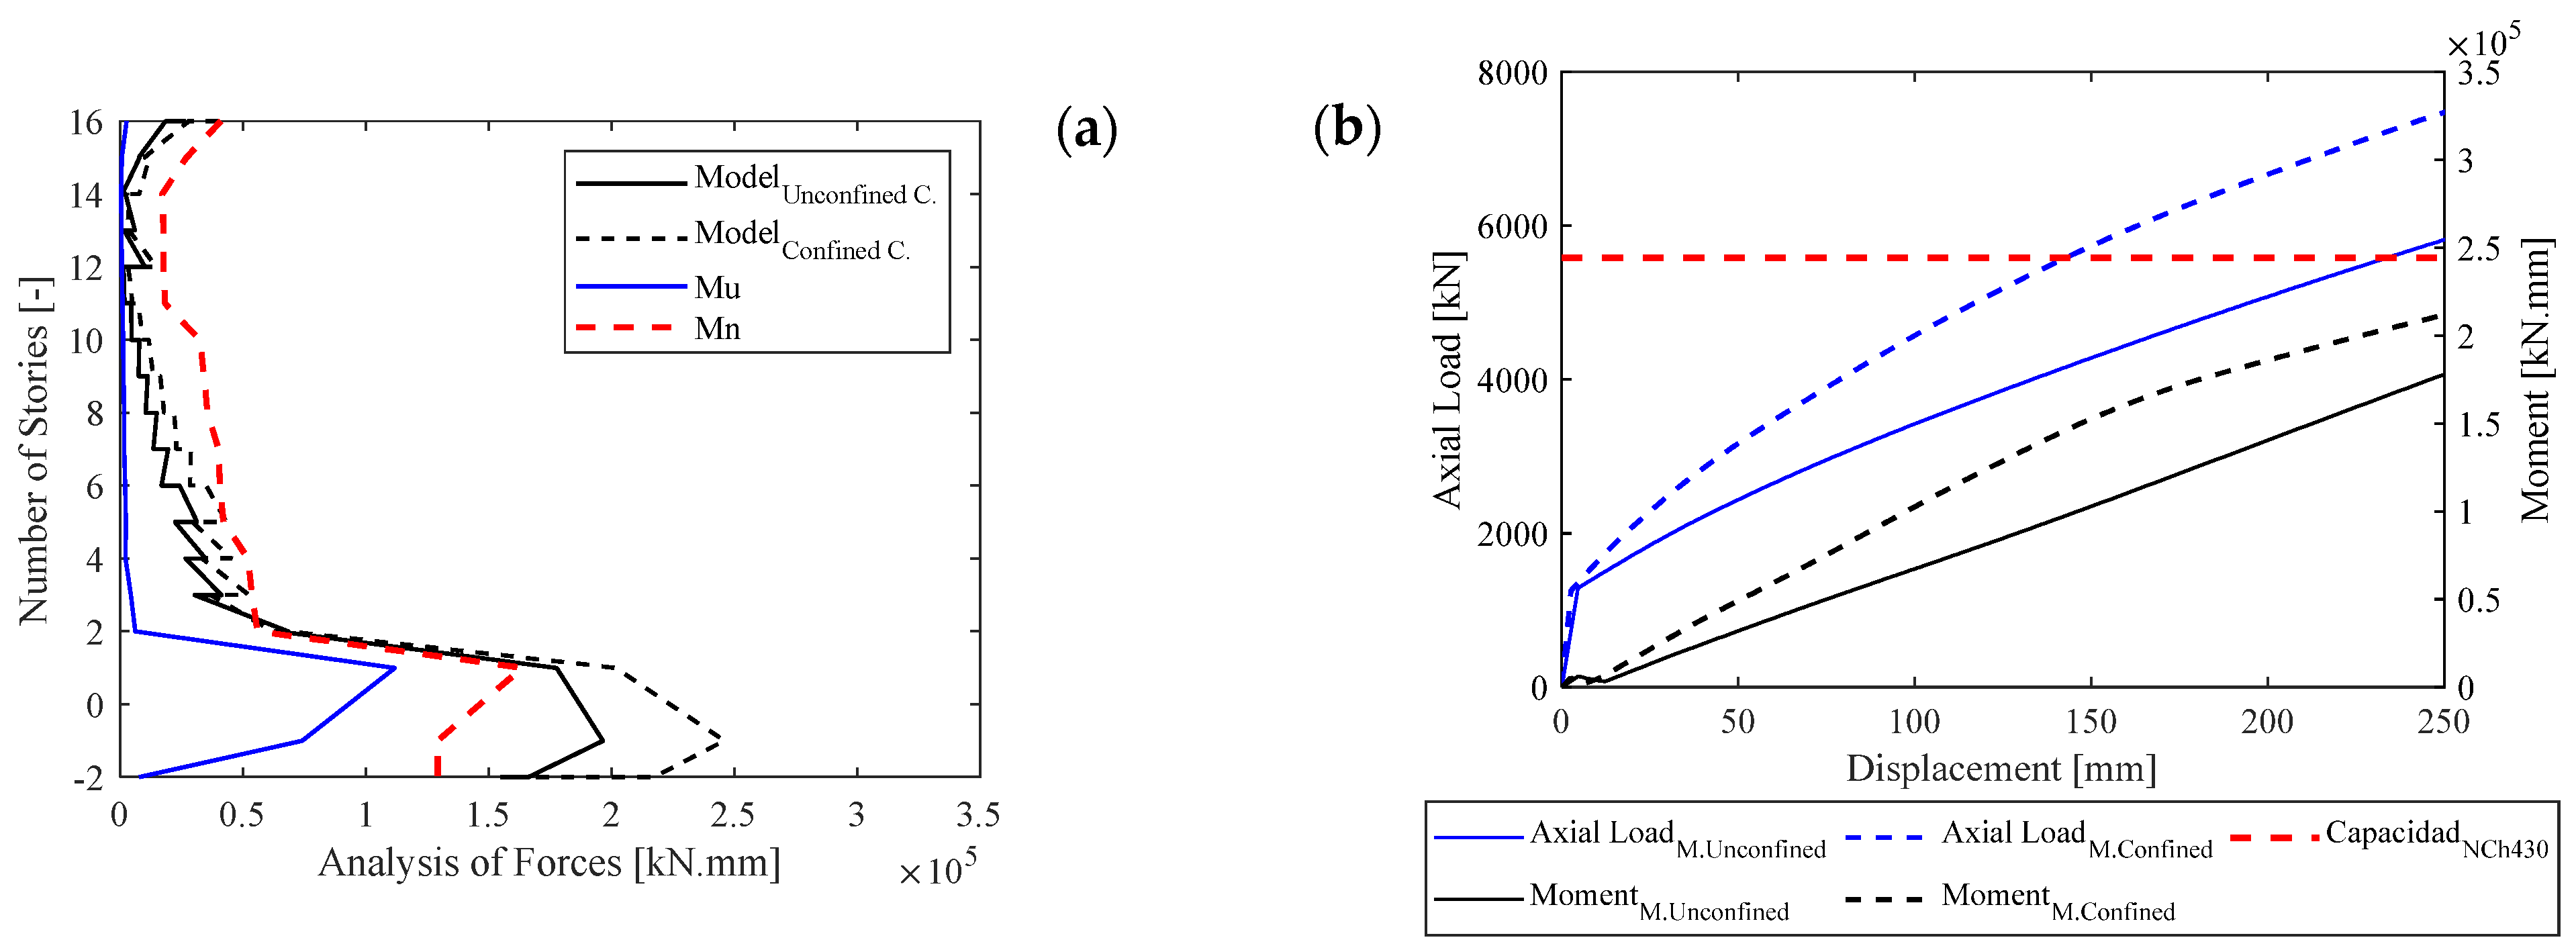
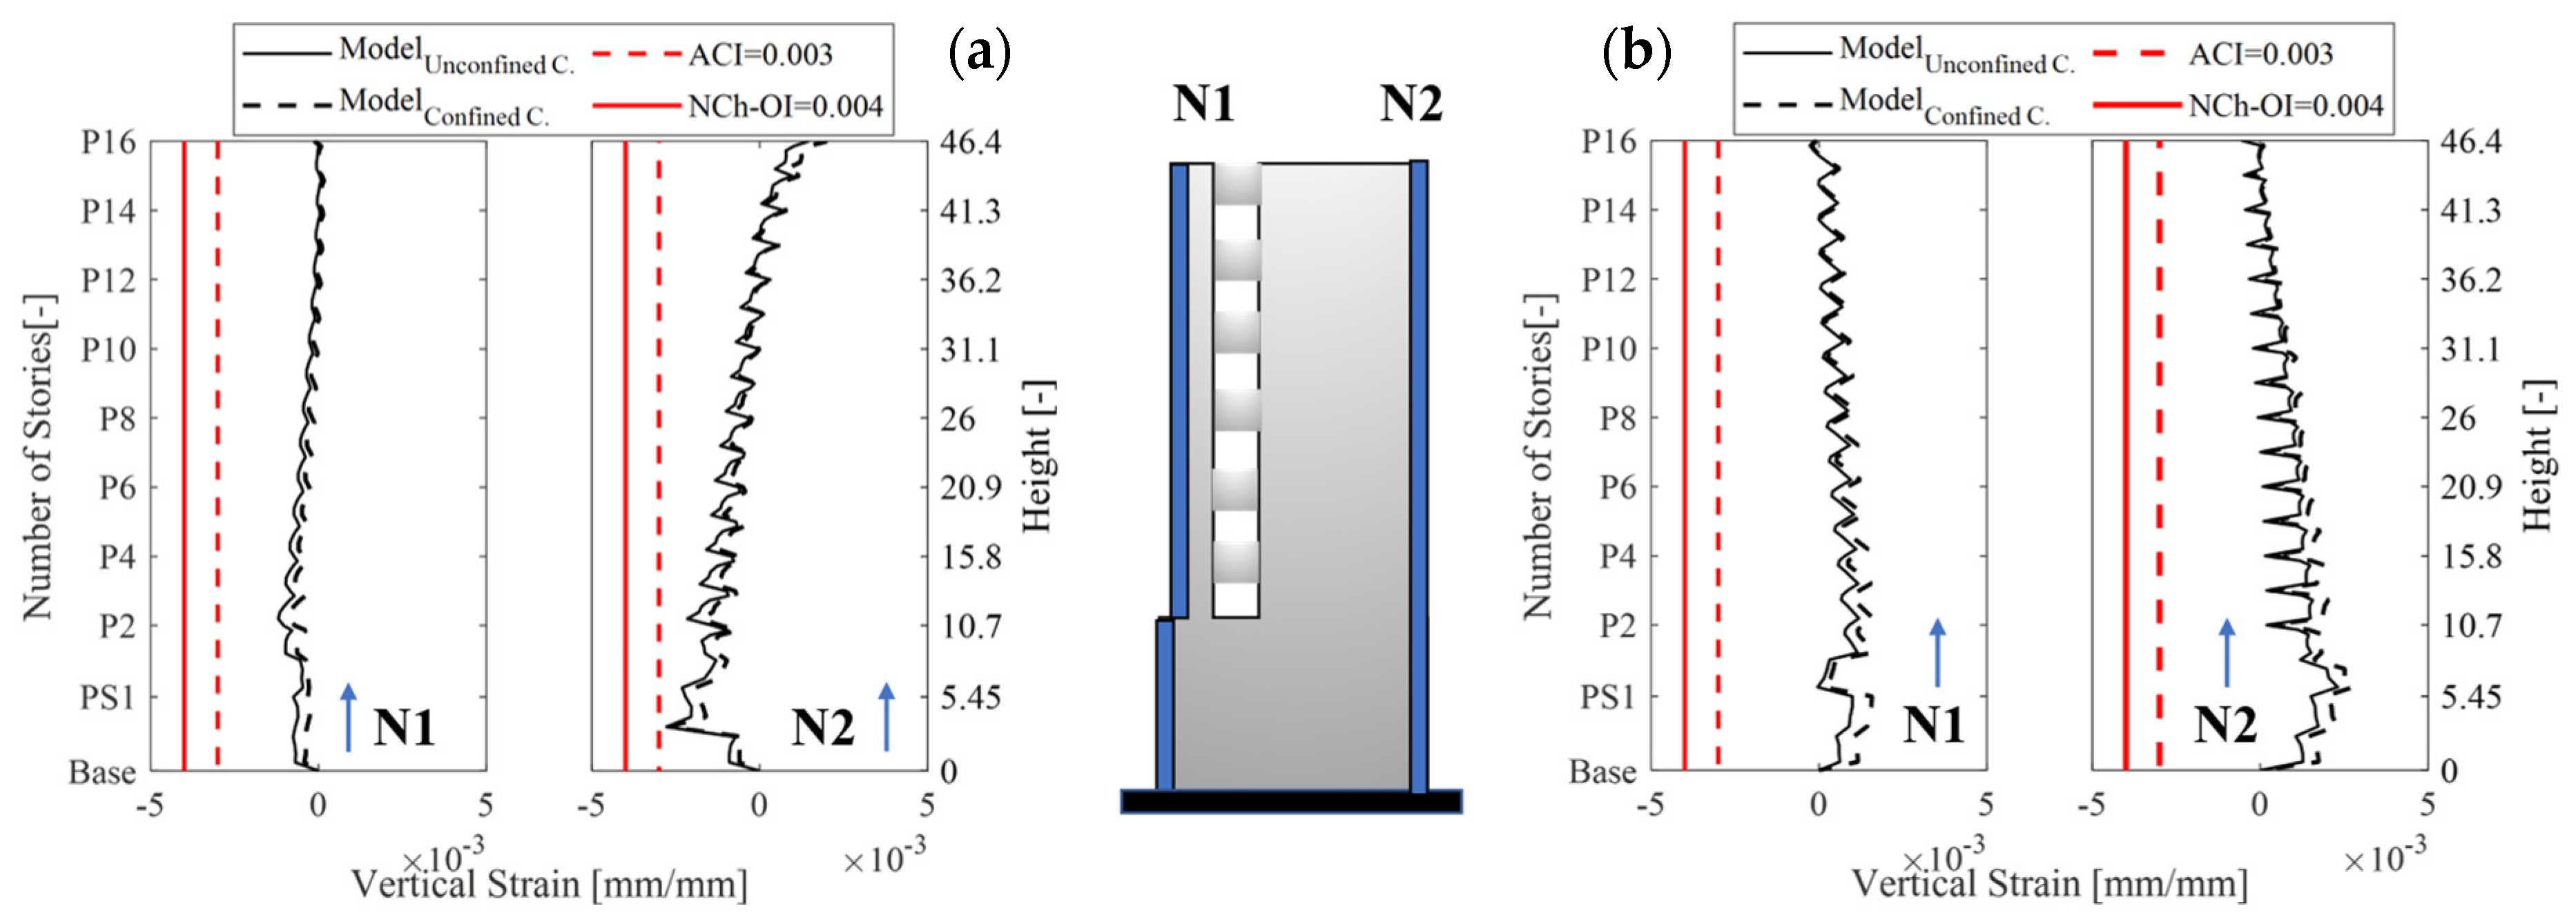
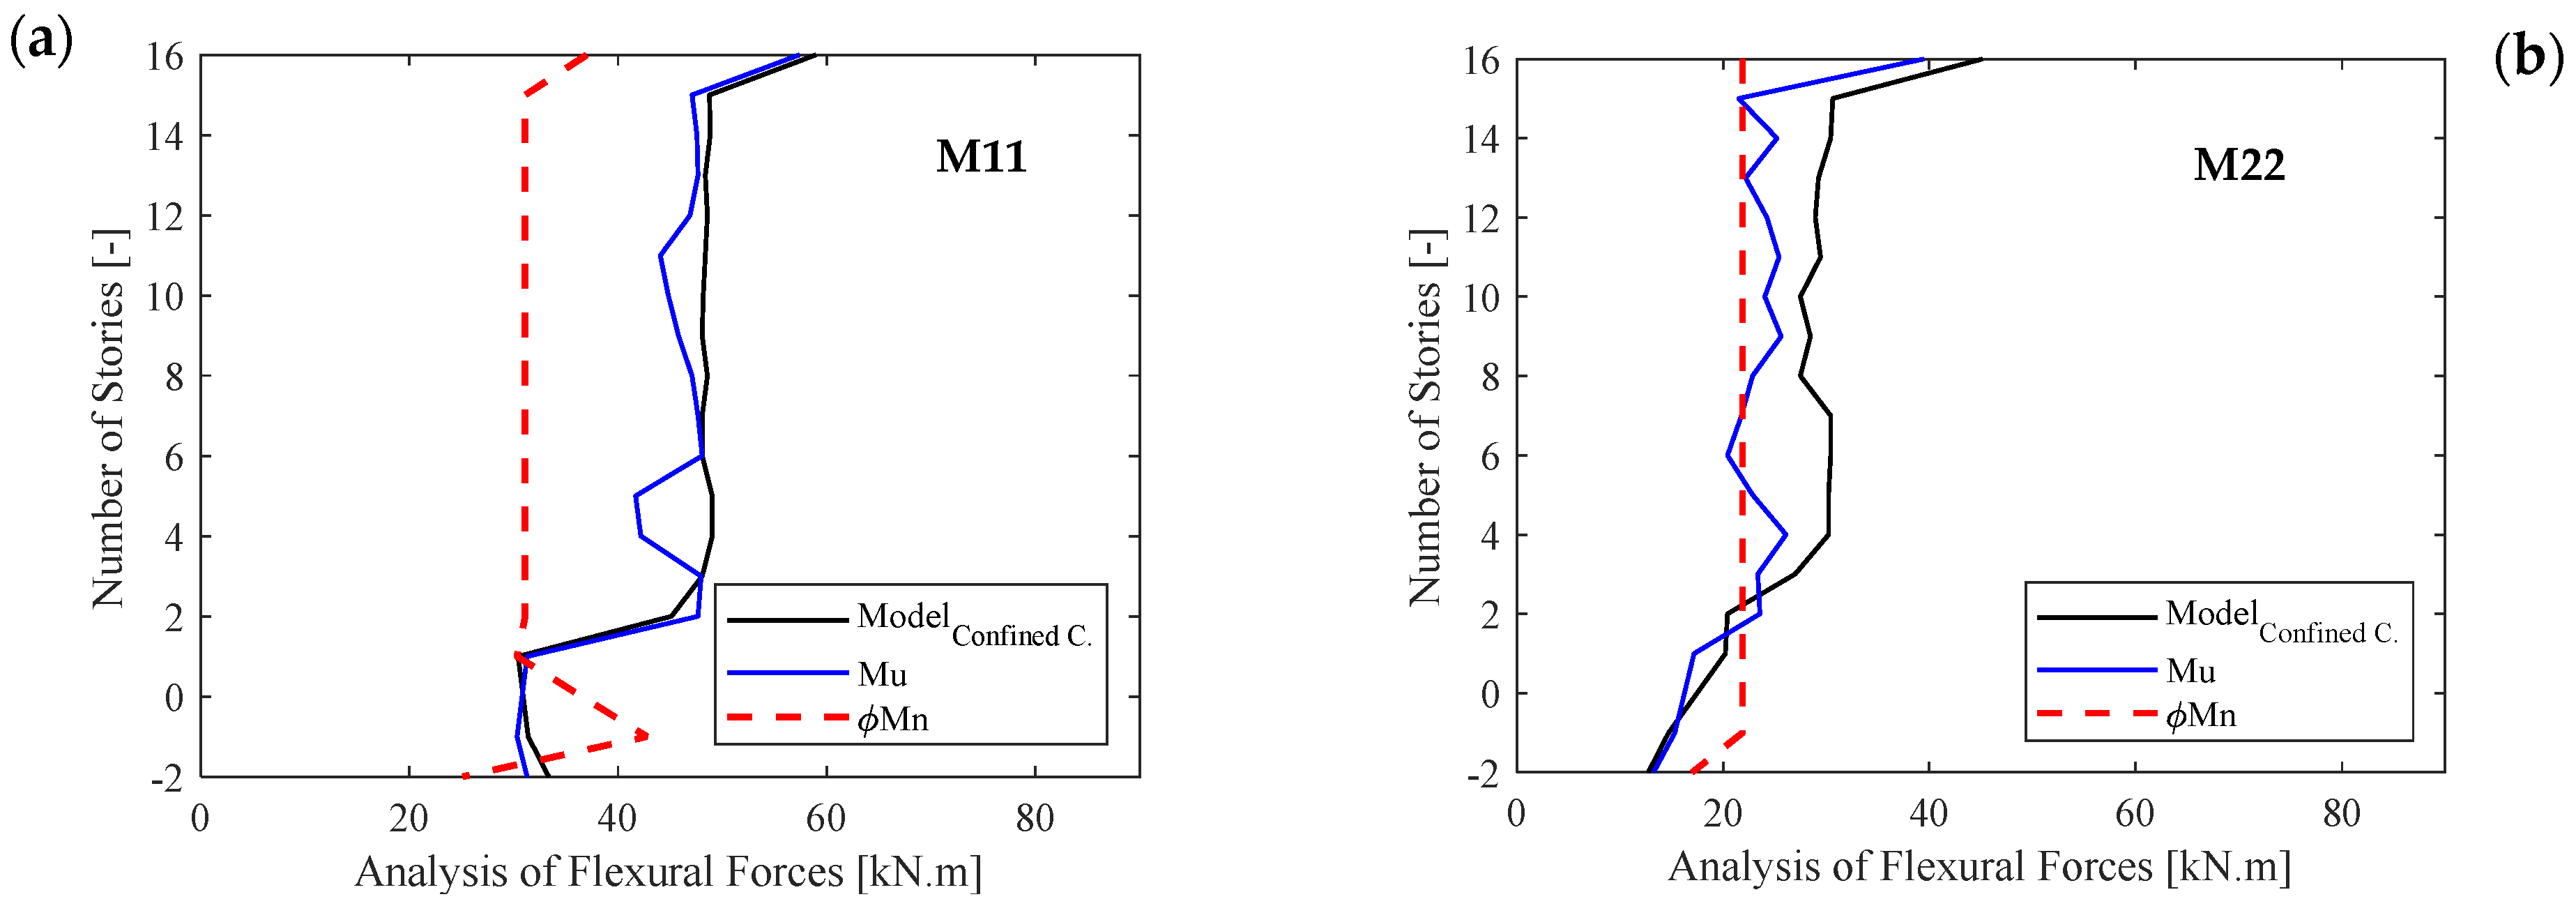
3.5.2. Local Response Analysis

As previously stated, the local analysis, encompassing forces and deformations, focuses on walls and elements that sustained damage during the earthquake. By juxtaposing the outcomes of the numerical analysis with the observed post-earthquake damage, our aim is to evaluate the model’s capability to pinpoint damage zones using the Chilean procedure for performance assessment. Three elements (X17, Y7 and S1) are chosen for scrutiny: one wall (Y7) primarily exhibiting flexo-compression damage, another wall (X17) subjected to shear behavior and one slab (S1) displaying flexural behavior during the 2010 earthquake. These elements are examined in terms of solicitations and displacements. The forces analysis entails a comparison between the element’s capacity, the demand resulting from the modal–spectral analysis and the outcomes from static nonlinear analysis, with the capacity assessed in accordance with ACI 318 (2014) [33] standards. Furthermore, photographs from the damage report are provided for each studied element. For deformation analysis, the strains in the elements at an overall displacement of 155 mm, as predicted by the model, are evaluated and juxtaposed with the acceptance limits established by the Chilean Performance-Based Procedure.
  • Wall X17
The wall selected for analysis has a thickness of 250 mm and a length of 660 mm (See Figure 8). It extends from the 2nd to the 16th floor on the north façade and is classified as a squat wall based on the aspect ratio defined by Paulay and Priestley [34], primarily exhibiting shear stress behavior. Therefore, the focus is on the pier that exhibits the most significant shear stress in the model. The primary damage observed consists of shear cracking in the central pier and the deep beams, as shown in Figure 8.
Analysis of forces
A shear analysis is conducted on the wall, comparing its demand and capacity in terms of shear forces. The concrete’s shear capacity (Vc) and the reinforcing steel’s contribution (Vs) are calculated using the ACI 318 (2019) [33] formulation. The shear demand considers shearing stresses acquired from the modal–spectral analysis and after using the load combinations according to NCh3171.Of.2010 (Vu), as well as from nonlinear analysis of both unconfined (unconfinement) and confined concrete (confinement) models, specifically focusing on the core of the elements (See Figure 9).
Furthermore, Figure 10 presents the shear demands on the story that sustained the most damage (Story 3), plotted against roof displacement and shear strain. This is compared with the shear capacity, as defined by the ACI 318 (2014), demonstrating that the wall reached its capacity limits.
Analysis of displacements
Given that the wall predominantly exhibits shear behavior, being a beam-coupled wall, as illustrated in Figure 11, the shear strain (i.e., the ratio of horizontal displacements generated by shear forces to the height of the element) becomes the critical parameter for evaluation. Figure 11 shows the distribution of shear strain along the building’s height for each direction of analysis, resulting from a roof displacement of 155 mm. The most significant shear strains are observed in the longitudinal direction (X+ and X−), which aligns with the wall’s analysis direction, with a maximum value of around 0.006 (°). This magnitude of strain corresponds to the displacement that the wall underwent in the analysis direction during the earthquake. In addition, the curves show a jagged form, indicative of a strut effect induced by the slab at each floor level, a consequence of load transfer between the slabs and the walls.
  • Wall Y7
The wall selected for analysis has a thickness of 250 mm and a length of 2575 mm, located on the east façade (See Figure 12). It primarily exhibits flexo-compression behavior and sustained damage at the base of the first floor, characterized by flexure–compression failure at the wall boundary, including concrete crushing and the buckling of vertical reinforcement bars.
Analysis of forces
The wall behaves under flexo-compression conditions, necessitating a flexural analysis where capacity and demand in terms of bending moments are assessed. The section’s resistive bending moment (Mn) is derived from a sectional analysis for capacity. Demand is determined via flexural loads from modal–spectral analysis after using the load combinations according to NCh3171.Of.2010 to obtain the maximum moment demand Mu and from the nonlinear analyses (confined and unconfined concrete). These analyses consider both confined and unconfined concrete in the core of the boundary elements, as shown in part “a” and “b” of Figure 13 shows the bending moment supported by the wall at the base story (Story 1) relative to roof displacement.
Analysis of displacements
The key measurement parameters are vertical unitary strains due to the flexural behavior of the wall. Figure 14 presents the vertical unitary deformations at the wall’s boundary elements, observed along the height of the building for each analysis direction, for a corresponding roof displacement of 155 mm.
The greatest compression deformations are observed in the transversal direction (Y+ y Y−), consistent with the direction of the wall analysis, with a peak value of 0.0027 mm/mm. This value aligns with the displacement experienced during the earthquake. Additionally, the figure indicates a strut effect induced by the slab at each story level.
The outcomes revealed a strong correlation with the documented damage locations in the photographic report. Nonetheless, the magnitude of the strains observed in the models does not entirely align with the photographic record.
  • Slabs
The Chilean structural system is open to the generation of walls coupled with slabs due to the different architectural requirements, meaning that in the photographic record, it can be seen that the slabs sustained cracking and spalling of concrete due to a coupling effect, as shown in Figure 15. To analyze the observed damages in the 180 mm thick slabs, nonlinearity was introduced in the affected areas based on an equivalent area approach, capturing the damage induced by coupling.
Analysis of forces
To analyze damages in the slabs, both shearing and bending analyses are conducted, as the slabs are subject to these types of solicitations. The analysis compares the capacity of and demand for each stress type. In the shear analysis, the slab’s concrete shear capacity (φVn) is calculated using the formulations of ACI 318-14, considering the slab’s thickness. Shear stresses, representing the demand, are obtained through modal–spectral analysis and load combinations, according to NCh3171.Of.2010, to derive Vu. Additionally, nonlinear analysis (Confined C.) is utilized for this purpose. Similarly, flexural analysis is conducted in both longitudinal (M11) and transverse (M22) directions, as depicted in Figure 16 and Figure 17. The flexural capacity is determined with reinforcing steel placed in each analysis direction.
The bending and shearing analysis reveal that the demand exceeds the capacity, indicating that damage to the slab is anticipated. This expectation aligns with what is observed in the photographic records.
The damage inspection photographs indicate that damage was primarily concentrated in the northeast sector of the structure. This concentration can be attributed to the combined effect of forces in both directions and the impact induced by the earthquake on the dynamic behavior of the structure. Despite the analysis being monotonic and subject to the limitations of the commercial software, the results of this analysis proved to be representative of the actual building damages. The analysis results, encompassing both demands and deformations, effectively reflected the location and extent of damage in walls subjected to shearing, as well as those experiencing flexo-compression.
The analyses performed corroborate the effectiveness of the performance metrics used in the Chilean methodology. This observation is consistent with the findings of Forcellini D (2023) [35], which proposes an integral approach to evaluate seismic resilience, incorporating metrics such as structural vulnerability, residual load capacity and recovery time. Through this perspective, the effectiveness of the Chilean structural design approach, characterized by a system of reinforced concrete walls, is demonstrated. In addition, the amendments to the seismic and reinforced concrete design regulations following the 2020 earthquake have contributed to improving the capacity of structures to resist and recover from the effects of earthquakes. It is important to consider that the capacity of a building to resist and recover from an earthquake is significantly influenced by the interaction between the structure and the soil upon which it is constructed. Furthermore, this study emphasizes that adopting performance-based design methodologies moves us closer to achieving the desired seismic resilience while also acknowledging that the quantification of seismic resilience necessitates considerations beyond engineering to include socio-political decisions [36,37].

4. Conclusions

This paper details the characteristics and application of the Chilean performance-based design approach, specifically aimed at assessing the behavior of a building with reinforced concrete (RC) walls that sustained damage during the 2010 Mw8.8 Chile Earthquake. To evaluated the effectiveness and limitations of this methodology, a comparative analysis is conducted between photographic records of the damage sustained by the structure and the results obtained from the numerical analysis of the building under the Maule Mw8.8 2010 earthquake.
Initially, the Chilean proposal was examined and compared with international standards and procedures. A key difference identified was the performance measurement variable used locally, such as unit strain for the materials constituting the structural elements, as opposed to those used in international practices, such as plastic hinges rotation. To evaluate the seismic performance of a residential building, the Chilean performance procedure was applied. The analysis utilized the commercial software ETABS (2016) [38]. Various models were created to analyze the structure’s pre-2010 earthquake configuration, and post-2010 earthquake configuration (Confined of the wall boundary elements). Validation was achieved by comparing the models with photographic evidence of the damage. The 2010 Mw8.8 Chile Earthquake predominantly impacted the structure’s North-East sector, a result of force superposition and earthquake-induced dynamics. Despite the monotonic nature of the analysis and the inherent limitations of commercial software, the results were indicative of the actual building damage. This was corroborated via a demand and capacity analysis of each element, as well as deformation analysis (concrete and steel strain), consistent with the performance parameters established by the Chilean performance analysis methodology. The analysis’ outcomes, in terms of both demands and deformations, showed that the numerical models accurately represent the location and extent of damage to slabs and walls, particularly those subjected to shearing forces and flexo-compression. Consequently, the results obtained indicate that the performance limits of the structural walls, as proposed by the Chilean methodology, align with the performance objectives at the desired level of damage.

Author Contributions

B.S.: Conceptualization, Methodology, Software, Validation, Formal analysis, Investigation, Data Calibration, Writing—Review and Editing, Visualization. F.R.: Conceptualization, Methodology, Software, Resources, Review and Editing, Supervision. L.M.M.: Conceptualization, Methodology, Review & Editing, Supervision. All authors have read and agreed to the published version of the manuscript.

Funding

This study was provided by the National Agency for Research and Development (ANID) under National Doctorate Scholarship, N°21230038, and the Fondecyt Regular 2020, project number 1200709.

Data Availability Statement

The original contributions presented in the study are included in the article, further inquiries can be directed to the corresponding authors.

Conflicts of Interest

The authors declare that they have no known competing financial interests or personal relationships that could have appeared to influence the work reported in this paper.

References

  1. Murota, T. Concept of the Regulation of Seismic Design of Buildings in Japan; National Disaster Prevention Center: Mexico City, Mexico, 1995; pp. 1–477. Available online: http://cidbimena.desastres.hn/pdf/spa/doc6526/doc6526.htm (accessed on 20 January 2024). (In Spanish)
  2. Fischinger, M.; Rejec, K.; Isaković, T. Inelastic Shear Response of RC Walls: A Challenge in Performance Based Design and Assessment. In Performance-Based Seismic Engineering: Vision for an Earthquake Resilient Society. Geotechnical, Geological and Earthquake Engineering; Springer: Dordrecht, The Netherlands, 2014; Volume 32. [Google Scholar] [CrossRef]
  3. Performance Based Seismic Engineering of Buildings; SEAOC-Vision 2000 Committee: Sacramento, CA, USA, 1995.
  4. Applied Technology Council. Seismic Evaluation and Retrofit of Concrete Buildings; California Seismic Safety Commission: Redwood City, CA, USA, 1996; Volume 1.
  5. FEMA 356 Prestandard and Commentary for the Seismic Rehabilitation of Building; No. November; Federal Emergency Management Agency: Washington DC, USA, 2000.
  6. PEER-TBI. Guidelines for Performance Based Seismic Design of Tall Buildings; No. May; Pacific Earthquake Engineering Center: Berkeley, CA, USA, 2017. [Google Scholar]
  7. ASCE/SEI-41-17; Seismic Evaluation and Retrofit of Existing Buildings. American Society of Civil Engineers: Reston, VA, USA, 2017. [CrossRef]
  8. LATBSDC. An Alternative Procedure for Seismic Analysis and Design of Tall Buildings Located in the Los Angeles Region, 2020th ed.; LATBSDC: Los Angeles, CA, USA, 2020. [Google Scholar]
  9. ACHISINA. Performance-Based Seismic Design. An Alternative Procedure for Seismic Analysis and Design of Buildings, 1st ed.; ACHISINA: Santiago de Chile, Chile, 2017; Available online: http://www.achisina.cl/index.php/publicaciones/manuales-guias (accessed on 24 January 2024). (In Spanish)
  10. Regulation that Establishes the Design and Calculation Requirements for Reinforced Concrete; DS60; Ministry of Housing and Urbanism: Santiago, Chile, 2011. (In Spanish)
  11. Regulation That Establishes the Seismic Design of Buildings; DS61; Ministry of Housing and Urbanism: Santiago, Chile, 2011; Volume 1. Available online: https://medium.com/@arifwicaksanaa/pengertian-use-case-a7e576e1b6bf (accessed on 11 June 2011). (In Spanish)
  12. Ruiz, S.; Saragoni, R. Attenuation Formulas for the Chilean Subduction considering the two Mechanisms of Seismogenesis and Soil Effects (Spanish). In Congreso Chileno de Sismología e Ingeniería Antisísmica; ACHISINA: Concepción, Chile, 2005. [Google Scholar]
  13. NCh433; Seismic Design of Buildings. Instituto Nacional de Normalización INN: Santiago, Chile, 2012. (In Spanish)
  14. LATBSDC. An Alternative Procedure for Seismic Analysis and Design of Tall Buildings located in the Los Angeles Region, 2014th ed.; LATBSDC: Los Angeles, CA, USA, 2015. [Google Scholar]
  15. Petrone, F.; McCallen, D.; Buckle, I.; Wu, S. Direct measurement of building transient and residual drift using an optical sensor system. Eng. Struct. 2018, 176, 115–126. [Google Scholar] [CrossRef]
  16. Lagos, R.; Lafontaine, M.; Bonelli, P.; Boroschek, R.; Guendelman, T.; Massone, L.M.; Saragoni, R.; Rojas, F.; Yañez, F. The quest for resilience: The Chilean practice of seismic design for reinforced concrete buildings. Earthq. Spectra 2021, 37, 26–45. [Google Scholar] [CrossRef]
  17. Ahumada, M. Finite Element Modeling of HA Slender Walls with Discontinuities at the Base. Design Recommendations. Bachelor’s Thesis, Universidad de Chile, Santiago de Chile, Chile, 2014. (In Spanish). [Google Scholar]
  18. Massone, L.M.; Polanco, P.; Herrera, P. Experimental and analytical response of RC wall boundary elements. In Proceedings of the NCEE 2014—10th U.S. National Conference on Earthquake Engineering: Frontiers of Earthquake Engineering, Anchorage, Alaska, 21–25 July 2014. [Google Scholar]
  19. Cáceres, I. Compilation of Information on Flexural Compression Damage in Reinforced Concrete Walls for the Earthquake of February 27, 2010 and Study of Deformation Demands; Universidad de Chile: Santiago de Chile, Chile, 2012. [Google Scholar]
  20. FEMA 306, Evaluation of Earthquake-Damaged Concrete and Masonry Wall Buildings, 1st ed.; Applied Technology Council: Washington, DC, USA, 1998; Available online: https://www.atcouncil.org/files/FEMA306.pdf (accessed on 21 February 2024).
  21. Anas, S.M.; Alam, M.; Umair, M. Experimental and numerical investigations on performance of reinforced concrete slabs under explosive-induced air-blast loading: A state-of-the-art review. Struct. J. 2021, 31, 428–461. [Google Scholar] [CrossRef]
  22. Li, G.; Dong, Z.Q.; Li, H.N. Simplified Collapse-Prevention Evaluation for the Reserve System of Low-Ductility Steel Concentrically Braced Frames. J. Struct. Eng. 2018, 144, 04018071. [Google Scholar] [CrossRef]
  23. Li, G.; Zhang, H.; Wang, R.; Dong, Z.Q.; Yu, D.H. Seismic damage characteristics and evaluation of aboveground-underground coupled structures. Eng. Struct. 2023, 283, 2023. [Google Scholar] [CrossRef]
  24. Park, R.; Priestley, M.; Gill, W.D. Ductility of Square Confined Concrete Columns. J. Struct. Div. 1982, 108, 929–950. [Google Scholar] [CrossRef]
  25. NCh430; Norma Chilena Oficial NCh430.Of2008 Hormigón Armado—Requisitos de Diseño y Cálculo. Instituto Nacional de Normalización INN: Santiago, Chile, 2008.
  26. Darwin, D.; Pecknold, D.A.W. Inelastic Model for Cyclic Biaxial Loading of Reinforced Concrete; University of Illinois at Urbana-Champaign, United States: Urbana-Champaign, IL, USA, 1974. [Google Scholar]
  27. Darwin, D.; Pecknold, D.A. Analysis of cyclic loading of plane RC structures. Comput. Struct. 1977, 7, 137–147. [Google Scholar] [CrossRef]
  28. Mander, J.B.; Priestley, M.J.N.; Park, R. Theoretical Stress-Strain Model for Confined Concrete. Struct. Eng. J. 1988, 114, 1804–1826. [Google Scholar] [CrossRef]
  29. Saatcioglu, M.; Razvi, S. Strength and Ductility of Confined Concrete. J. Struct. Eng. 1992, 118, 1590–1607. [Google Scholar] [CrossRef]
  30. Belarbi, A.; Hsu, T.T.C. Constitutive Laws of Concrete in Tension and Reinforcing Bars Stiffened By Concrete. Struct. J. 1994, 91, 465–474. [Google Scholar] [CrossRef]
  31. Massone, L.M.; Orakcal, K.; Wallace, J. Shear-flexure interaction for structural walls. ACI Simp. Pap. 2006, SP-236, 127–150. [Google Scholar]
  32. Forcellini, D. Seismic fragility of tall buildings considering soil structure interaction (SSI) effects. Struct. J. 2022, 45, 999–1011. [Google Scholar] [CrossRef]
  33. ACI 318R-19; Building Code Requirements for Structural Concrete and Commentary. American Concrete Institute: Indianapolis, IN, USA, 2019. [CrossRef]
  34. Paulay, T.; Priestley, M.N. Seismic Design of Reinforced Concrete and Masonry Buildings; Wiley: New York, NY, USA, 1992. [Google Scholar]
  35. Forcellini, D. An expeditious framework for assessing the seismic resilience (SR) of structural configurations. Struct. J. 2023, 56, 105015. [Google Scholar] [CrossRef]
  36. Bruneau, M.; Reinhorn, A. Exploring the concept of seismic resilience for acute care facilities. Earthq. Spectra 2007, 23, 41–62. [Google Scholar] [CrossRef]
  37. Scarfone, R.; Morigi, M.; Conti, R. Assessment of dynamic soil-structure interaction effects for tall buildings: A 3D numerical approach. Soil Dyn. Earthq. Eng. J. 2020, 128, 105864. [Google Scholar] [CrossRef]
  38. ETABS. CSI: Analysis Reference Manual, 2016th ed.; 2016; Volume 1, Available online: www.csiamerica.com (accessed on 16 March 2024).
Figure 1. Relationship between global and local acceptability criteria.
Buildings 14 01028 g001
Figure 2. General view of the building.
Buildings 14 01028 g002
Figure 3. Antigona building: (a) plan view of a story type with damaged walls; (b) damaged walls.
Buildings 14 01028 g003aBuildings 14 01028 g003b
Figure 4. Finite element dimensions for nonlinear analysis.
Buildings 14 01028 g004aBuildings 14 01028 g004b
Figure 5. (a) Elastic response spectrum; (b) lateral pattern of nonlinear static load.
Buildings 14 01028 g005
Figure 6. Comparison of instrumental periods and models analyzed.
Buildings 14 01028 g006
Figure 7. Drifts for displacement at (a) 155 mm and (b) 254 mm.
Buildings 14 01028 g007
Figure 8. Wall X17. Damage to the north façade of the building.
Buildings 14 01028 g008
Figure 9. Analysis via shear load for wall X17.
Buildings 14 01028 g009
Figure 10. Analysis via shear strain vs. displacement for the wall X17.
Buildings 14 01028 g010
Figure 11. Shear strain for the displacement of 155 mm for the wall X17.
Buildings 14 01028 g011
Figure 12. Wall Y7. Damage in first story.
Buildings 14 01028 g012
Figure 13. Analysis for wall Y7: (a) Flexion analysis with a section in the first five floors; (b) axial load vs. roof displacement with static nonlinear analysis.
Buildings 14 01028 g013
Figure 14. Vertical strains for the displacement of 155 mm for wall Y7: (a) direction Y+; (b) direction Y−.
Buildings 14 01028 g014
Figure 15. Slab S1. Damage in the first story.
Buildings 14 01028 g015
Figure 16. Analysis via shear in coupled slabs.
Buildings 14 01028 g016
Figure 17. Analysis via bending in coupled slabs: (a) longitudinal direction; (b) transversal direction.
Buildings 14 01028 g017
Table 1. Comparison of international guidelines of the global acceptability criteria.
Performance LevelVision 2000FEMA 356TBI/LATBSDCASCE 41
Drift
Transient
Drift
Permanent
Drift
Transient
Drift
Permanent
Drift
Transient
Drift
Permanent
Loss of
Resistance
Drift
Transient
Drift
Permanent
Operational<±0.2%
Immediate
Occupancy
<±0.5% 1%Negligible0.50%Negligible Minor or non-structural damageNegligible
Life Safety<±1.5%<±0.5%2%1% Enough to cause non-structural damageNotable
Collapse
Prevention
<±2.5%<±2.5%4%4%0.03 Қi */0.045 Қi **0.01 Қi */0.015 Қi **20%Extensive
Қi: It is a factor of the seismic risk coefficient. * Mean of the absolute values of the peak transient drift. ** The absolute value of the maximum story drift.
Table 2. Comparison of exceedance probability in the earthquake design level of international guidelines.
Earthquake Design LevelVision 2000FEMA 356TBI/LATBSDCASCE 41
Frequent50%/30 years 50%/30 years
Occasional50%/50 years
Rare10%/50 years10%/50 years 10%/50 years
Very Rare10%/100 years2%/50 years10%/100 years2%/50 years
Table 3. Comparison of the global acceptability criteria.
Global Acceptability
Criteria
LATBSDCChilean Code
20142017
Performance Level→Serviceability EvaluationImmediate Occupancy
Inter-Story Drift0.5%0.5–0.7%
Performance Level→Collapse Prevention EvaluationAdditional Deformation Capacity
Peak Transient Drift0.03 Қi */0.045 Қi **Not Applicable
Peak Permanent Drift0.01 Қi */0.015 Қi **
Loss of Resistance20%
Қi: It is a factor of the seismic risk coefficient. * Mean of the absolute values of the peak transient drift. ** The absolute value of the maximum story drift.
Table 4. Performance objectives.
Earthquake Design LevelPerformance Level
Immediate OccupancyAdditional Deformation Capacity
Design Earthquake
Maximum Earthquake Considered
Table 5. Global acceptance criteria for each performance level.
Performance LevelsInter-Story Drift
Immediate OccupancyFragile non-structural elements0.005
Ductile non-structural elements0.007
Additional Deformation CapacityNot applicable
Table 6. Local acceptance criteria for each performance level.
Deformation-Controlled ElementsDescriptionPerformance Level
Immediate OccupancyAdditional Deformation
Capacity
Unconfined Boundary ElementConfined Boundary
Element
Unconfined Boundary ElementConfined Boundary
Element
Concrete structural wallsConcrete’s strain0.0030.0080.0030.015
Steel’s strain0.030.05
Structural columns in concrete framesPlastic rotation0.0050.025
Structural beams in concrete framesPlastic rotation0.010.02
Concrete coupling beamsPlastic rotation0.01-
Table 7. Numerical models.
Model TypesDescriptionDirection
Lineal100% Inertia ModelX/Y
Cracked Model
Reducing the out-of-plane bending slabs’ inertia by 25%.
X/Y
NonlinearUnconfined C. Model
Representative of buildings designed with NCh433 (2009).
X/Y
Confined C. Model
Representative of buildings designed with NCh433 (2012)
X/Y
Confined C. Model
Reducing the inertia of the elastic slabs by 40% in membrane and a 10% in bending.
X/Y
Table 8. Materials in the Antigona building.
MaterialQualityf’c/Fy [MPa]
ConcreteH3025
SteelA630-420H420
Table 9. Dead and live loads in the structure.
Load TypeDescriptionLoad
Live LoadParking lots50[MPa]
Departments and halls20[MPa]
Terraces25[MPa]
Dead LoadPartition walls10[MPa]
Over slab10[MPa]
Disclaimer/Publisher’s Note: The statements, opinions and data contained in all publications are solely those of the individual author(s) and contributor(s) and not of MDPI and/or the editor(s). MDPI and/or the editor(s) disclaim responsibility for any injury to people or property resulting from any ideas, methods, instructions or products referred to in the content.

