Abstract
This study explored the tensile and shear characteristics of fully prefabricated partially composite floor slab joints through the design and testing of two tensile specimens, three steel–concrete specimens, and three concrete–concrete shear specimens. These tests aimed to evaluate how various connection designs influence the joints’ load-bearing capabilities and failure patterns. The findings revealed that the tensile specimens predominantly showed bond failures at the interface of the precast and cast-in-place layers, accompanied by rebar pull-out. Incorporating reinforcing bars or sleeves was found to potentially increase their ultimate load-bearing capacity by about 20%. The shear failures in the steel–concrete specimens were primarily due to interactions between the steel beam and adjacent composite slab, whereas the concrete–concrete specimens mostly underwent local crushing at the load application point and failure at the bonding interface. These observations affirmed the accuracy of the existing methods for calculating tensile and shear strengths, offering vital insights for the architectural design and construction of such floor joints.
1. Introduction
Pre-stressed concrete (PC) structures, widely utilized in contemporary architecture, are favored for their superior construction quality, lower labor costs, and faster project completion times []. Composite floor slabs, integral to PC residential flooring systems, combine a precast base plate with cast-in-place concrete, yielding robust structural integrity [,]. The design of these slabs necessitates reinforced connections to facilitate the coordinated load-bearing capacity of both post-cast and precast sections, with poorly executed designs potentially leading to structural vulnerabilities [,,]. Owing to the dimensional limitations of precast slabs, assembling several pieces is often necessary for floor construction. Thus, the effectiveness of composite floor slabs hinges on two pivotal aspects: the capability of connection joints to effectively transfer forces and the need for optimal bonding at the interface between the precast and cast-in-place concrete [].
Recent studies have delved into the connection joints of composite floor slabs. Ye et al. [] executed four-point bending tests on two post-cast strip-connected composite plates and a pair of cast-in-place plates, showing that using steel bars to reinforce the joints or altering the bottom longitudinal reinforcement to increase the joint’s sectional depth effectively facilitates internal force transfer. Ding et al. [] improved the design of joints in post-cast strip-connected composite plates through empirical research, finding that the updated joint design offers bending resistance comparable to that of cast-in-place plates. Liu et al. [] subjected laminated plates with varying rib geometries to static testing, concluding that despite differing rib shapes, the deformation characteristics remained largely consistent, ensuring compatibility with the precast base. Han et al. [] explored the bending resistance of pre-stressed composite plates, revealing that the cracking load and stiffness depend significantly on the reinforcement ratio and pre-stress levels. Concurrently, Huang et al. [] analyzed the elasticity of bidirectional concrete composite plates, proposing a method to simplify anisotropic plates into isotropic ones. Wang [,] studied the longitudinal shear strength and capacity of steel–concrete composite beams with novel joint designs, observing that combining short transverse reinforcements with rectangular slots offers an efficient and effective solution for composite action compared to different precast elements. Additionally, the use of post-cast ultra-high-performance concrete in local shear bands has proven to be an effective method for connecting concrete slabs and steel beams, although this approach requires specific considerations for shear band dimensions, the number of shear connectors, and the use of specialized reinforcing steel, increasing the complexity of the structural assembly [,,].
Concurrently, the study of bonding characteristics between precast and cast-in-place concrete has garnered attention. Sifan et al. [] explored the effects of different surface treatments on the flexural capacity of composite slabs, finding that mechanically roughening the interface with steel wire brushes markedly improves bond strength. Gohnert et al. [,] assessed the impact of surface roughness on shear strength, with their theoretical analysis confirming a positive relationship between surface roughness and enhanced shear strength, consistent with earlier research. Lam et al. [] evaluated the bond strength of composite slabs, observing substantial bonding at interfaces, even without reinforcement bridging them. Jiang et al. [] investigated the influence of coarse aggregate size and enhancer quantity on the shear performance of laminated slabs. Adawi et al. [,] investigated the bending behavior of composite hollow-core slabs, indicating that surfaces roughened mechanically adhere to North American standards for shear strength. Further, Ibrahim et al. [] performed tests on precast hollow-core slabs, demonstrating that increased surface roughness leads to improved shear resistance, a finding supported by Girhammar et al. []. Gromysz [] developed a nonlinear model accounting for slip between laminated surfaces. Collectively, these studies underscore the paramount importance of connection performance among precast slabs, precast steel beams, and post-cast wet joints in precast steel–concrete composite beams, particularly for sustaining composite actions and curtailing relative displacements under varying load conditions [].
In the context of seismic forces, ensuring the floor system’s compatibility with floor forces to align with the rigid diaphragm assumption in seismic analysis necessitates that the floor slabs can withstand in-plane shear forces and bending moments. Therefore, it is essential to investigate the tensile and shear resistances of fully precast partially composite floor slab joints. This study conducts experimental investigations into the tensile and shear resistances of joints in entirely precast, partially composite floor slabs. This research contrasts the effects of diverse constructional elements, delves into the failure mechanics of the joints, and assesses their tensile and shear strengths. Based on the analysis results, the calculation methods for the tensile and shear load-bearing capacities of the joints were validated.
2. Experimental Program
2.1. Specimens and Parameters
Informed by the Chinese Steel Structure Design Standard [], the Chinese Concrete Structure Design Specification [], and the directives of Eurocode 4 [], we designed eight push-out test samples, as delineated in Table 1, Table 2 and Table 3. The series included two tensile specimens (LB1 and LB2), distinguished by the application of steel bars and sleeves, illustrated in Figure 1. Additionally, it featured three steel–concrete shear specimens (SP1, SP2, and SP3), characterized by the inclusion of notches and steel bars, depicted in Figure 2, and three concrete–concrete shear specimens (SJ1, SJ2, and SJ3), differentiated by shear reinforcement and the presence of key teeth, shown in Figure 3.

Table 1.
Parameters of the tensile specimens.
Table 2.
Parameters of the steel–concrete shear specimens.
Table 3.
Parameters of the concrete–concrete shear specimens.
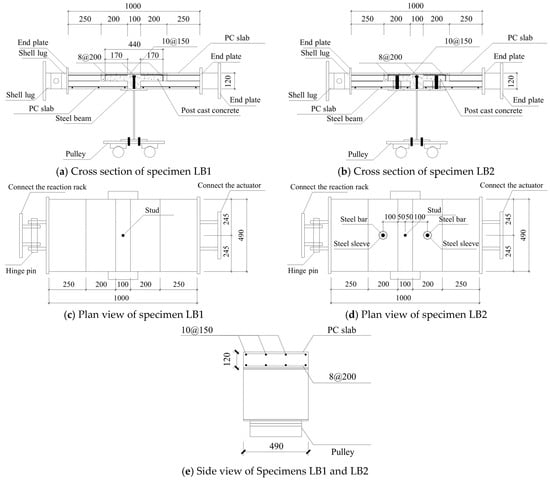
Figure 1.
Configurations of the tensile specimens (mm).
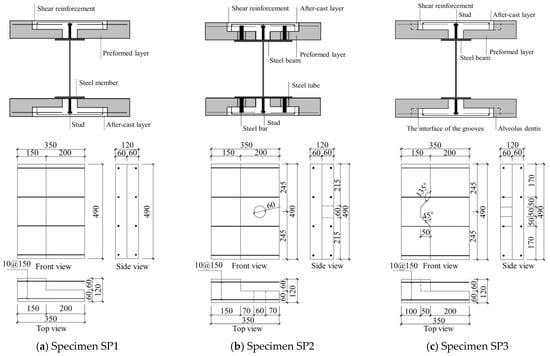
Figure 2.
Configurations of the steel–concrete shear specimens (mm).
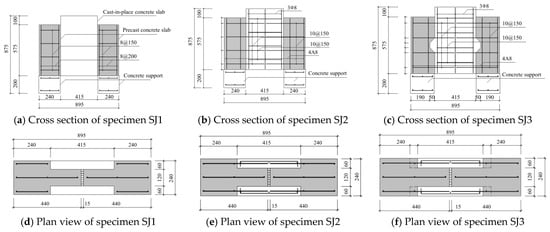
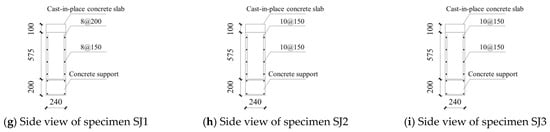
Figure 3.
Configurations of the concrete–concrete shear specimens (mm).
2.2. Specimen Preparation and Loading
The fabrication of the test specimens, illustrated in Figure 4, involved a series of steps: (1) constructing forms with wooden molds cut to the specimens’ exact dimensions, along with tying the reinforcement bars in place; (2) pouring concrete, consolidating it with a vibrating poker, and then leveling the surface after casting; (3) curing the cast precast panels; (4) after curing, performing casting operations at the joint areas.
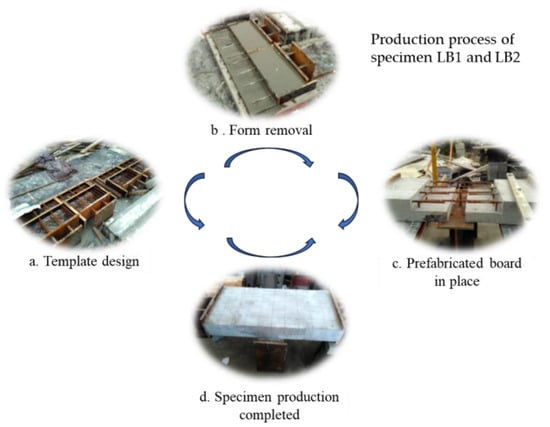
Figure 4.
Fabricating process of the specimens.
The setups for the experiments, shown in Figure 5, Figure 6 and Figure 7, followed Eurocode 4 [] guidelines for push-out tests. These tests started with force control and switched to displacement control as they were near the ultimate load, continuing until failure. The increments in the force and displacement rate were maintained at 100 kN and 1 mm/min, respectively. A comprehensive inspection of all the instruments ensured their readiness before the beginning of the experiments. This preparatory step was followed by the start of the loading process, with test phenomena observed and recorded after stabilizing the instrument readings at each load stage.
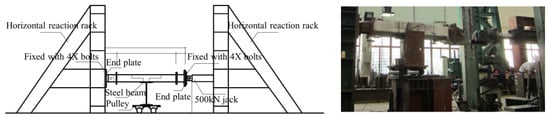
Figure 5.
Tensile test loading setup.
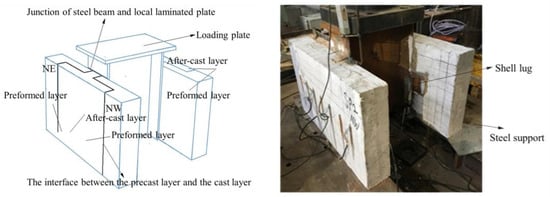
Figure 6.
Steel-concrete shear test loading setup.
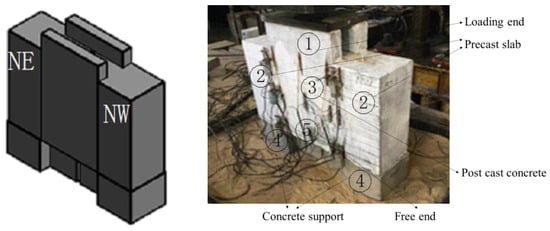
Figure 7.
Concrete-concrete shear test loading setup.
2.3. Material Properties
For the construction of the precast slabs, C30-grade concrete was utilized, whereas the composite layers were composed of C40-grade micro-expansion concrete. The specimens were reinforced with 10 mm dia. ribbed grade III steel bars, and Q355B steel was employed for all the steel components. The concrete’s strength was verified using 150 mm cubic test blocks, as presented in Table 4. The steel’s reinforcement properties were determined using 50 cm long specimens, recorded in Table 5.
Table 4.
Compressive strength test results of the concrete.
Table 5.
Parameters of the steel bars.
2.4. Test Point Arrangement
The configurations of the measurement points on the specimens are shown in Figure 8. The strain gauges, labeled as SX (where ‘S’ represents strain and ‘X’ is the gauge number), were systematically positioned on the concrete surface. In the tensile tests, displacement transducers were installed to quantify the relative displacement between the precast panels, and strain gauges were positioned to analyze the stress distributions in the composite slabs. During the steel–concrete shear tests, displacement transducers were employed to track the relative displacements between the post-cast concrete and precast slabs, while strain gauges were used to evaluate both the bonding stress and the stress distributions across the composite slabs. Additionally, in the steel–concrete shear tests, displacement transducers were used to monitor the relative displacements between the post-cast concrete and steel beams, with strain gauges being used to measure the bonding strength at the laminated interface.
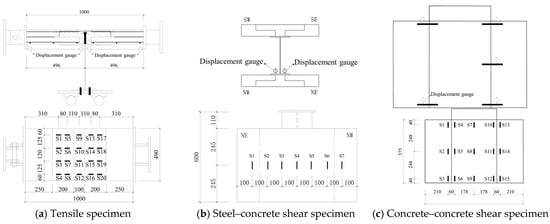
Figure 8.
Arrangement of the test points.
3. Analysis and Discussion of the Test Results
3.1. Failure Modes of the Specimens
3.1.1. Tensile Test
The tensile specimens predominantly exhibited bonding failure at the interface between the precast and post-cast layers, as detailed in Figure 9. Specimen LB1 showed initial cracking at 52.5 kN. By 65 kN, the cracks at the joint interconnected, necessitating a switch to displacement loading. At 85.46 kN, a significant crack sound occurred, and the load reduced to 74.77 kN, revealing extensive cracking. The specimen continued to endure higher loads despite increased displacement. At 95.76 kN, diagonal cracks developed, merging with existing ones. Upon reaching 151.19 kN, horizontal cracks appeared, leading to a load reading drop to 120.49 kN. The primary failure mode was bonding failure at the precast and post-cast interface, with the composite layer’s concrete displaying web-like cracks and signs of spalling due to the ribbed steel bars’ outward pull, indicating rebar bond failure. LB2’s failure resembled LB1’s but with more severe concrete spalling and rebar exposure. Notably, in LB2, concrete bulging and fracturing were observed around the steel bars and sleeves due to the concrete’s localized compression by the steel sleeves.
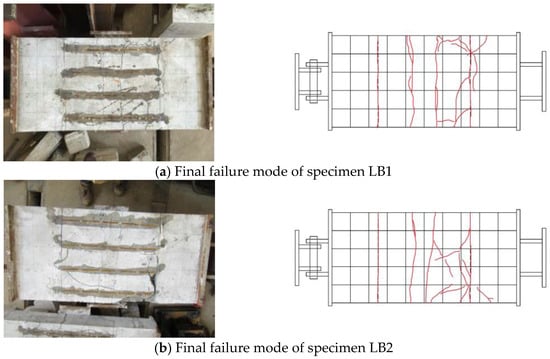
Figure 9.
Failure modes of the tensile specimens.
In order to examine the internal damage of the test specimens, the outer layer of concrete was removed to reveal the steel reinforcement, as illustrated in Figure 10. The reinforcement bars and their welding points to the end plates were intact. The tie bars within the composite area and the steel rods and sleeves in LB2’s steel beam (including the concrete inside the sleeves) were also undamaged. This suggests that the reinforcement provided at the local composite joints was adequate, with the primary determinant of the ultimate load-bearing capacity being the bond strength between the precast slab and the post-cast concrete, as well as between the reinforcement and the post-cast concrete.
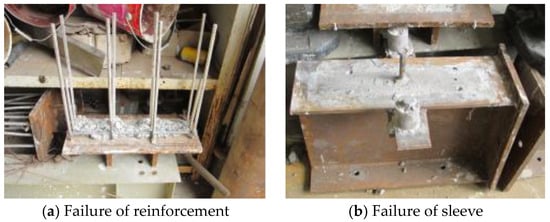
Figure 10.
Internal failures of the tensile specimens.
3.1.2. Steel–Concrete Shear Test
Figure 11 illustrates the ultimate failure states of the steel–concrete shear test specimens. Failure occurred due to shearing off of the shear keys between the precast slab and the steel flange, leading to a complete separation of the beam from the slab. In the initial loading stages, damage manifested at the composite slab and steel beam flange intersection, evidenced by multiple transverse cracks. As the loading increased, the slip between the slab and beam grew, causing vertical forces to be transmitted via the bolts and steel bars, inducing cracking. Near the peak load, concrete spalling at the composite slab and steel beam outer flange became pronounced, accompanied by warping of the ear plate in relation to the steel component and the slab’s interior. Further loading produced significant noises as the shear keys between the post-cast layer and the steel flange gave way, leading to a swift load decline followed by the composite slab’s detachment and collapse from the beam, culminating in failure.
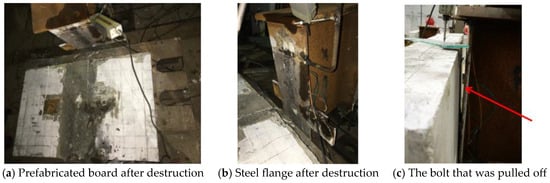
Figure 11.
Failure modes of the steel–concrete shear specimens.
The failure primarily occurred at the steel beam and local composite slab junction rather than the interface between the precast and post-cast layers. This was ascribed to the steel beam’s downward force, which induced an opposing upward force on the concrete, thereby increasing bending moments and shear forces at the bolts’ anchored ends on the beam. When the stress exceeded the maximum bearable limit, a brittle failure characterized by shearing occurred at the shear keys and beam junction.
3.1.3. Concrete–Concrete Shear Test
The ultimate failure modes of the concrete-sheared specimens are depicted in Figure 12. SJ1 and SJ2 underwent brittle local crushing at the loading end, while SJ3 faced adhesive failure at the precast and cast-in-place concrete interface, along with outward bulging at the cast-in-place slab’s longitudinal middle.
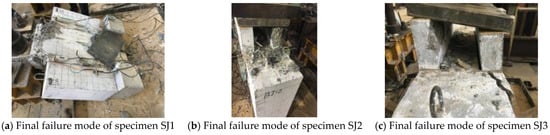
Figure 12.
Failure modes of the concrete–concrete shear specimens.
In the early stages of loading specimen SJ1, vertical cracks appeared on the cast-in-place slab’s bottom surface, with fine cracks forming at the juncture with the precast slab. As the loading increased, these vertical cracks widened, leading to compression-induced cracking at the load application point. Upon approaching the peak load, extensive cracking at the loading end crushed the concrete on one side, tilting the specimen and ending the test. Notably, only minor cracks were present near the new and old concrete interface, showing slight relative movement, while the reinforcement’s position stayed largely unchanged. Specimen SJ2 exhibited a failure pattern akin to SJ1, marked by localized crushing at the loading end and a minimal displacement between the cast-in-place and precast slabs of no more than 0.2 mm.
During the testing of specimen SJ3, noticeable cracks were observed at the interface between the precast slab and the cast-in-place slab, and these cracks expanded. A distinct U-shaped shear pattern emerged cross-sectionally. At the end of the test, the cast-in-place slab’s upper portion bulged outward, with the midsection also bulging. Cracks at the interface were visible, with concrete near the precast side pushing out, revealing and deforming the shear reinforcement. The cast-in-place slab’s longitudinal distribution bars were also compressed and buckled at mid-span. These observations indicate that a significant bond strength existed at the precast and cast-in-place concrete interface under dense concrete casting conditions.
For specimens SJ1 and SJ2, the shear resistance at the interface between the precast slab and the cast-in-place slab was substantial, resulting in brittle local crushing failure at the loading end when the applied loads reached 1307.06 kN and 988.13 kN, respectively. In contrast, specimen SJ3 exhibited adhesive failure at the interface between the precast concrete and the cast-in-place concrete, along with outward bulging in the longitudinal middle portion of the cast-in-place slab. During the testing of specimen SJ3, noticeable cracks were observed at the interface between the precast slab and the cast-in-place slab, and these cracks expanded. From a cross-sectional perspective, a distinct U-shaped shear surface was evident. At the conclusion of the test, it was observed that the upper part of the cast-in-place slab was pressed outwards, and the middle section exhibited bulging. There were noticeable cracks at the interface, and the concrete near the precast slab side was extruded, exposing the shear reinforcement at the interface, which underwent shear deformation. The longitudinal distribution bars in the cast-in-place slab were compressed and buckled at the mid-span location. This is evident that, when the cast-in-place concrete was densely compacted, there existed a certain bond strength at the interface between the precast and cast-in-place concrete.
3.2. Load–Slip Curves
Figure 13 displays the load–slip curves for the specimens. The horizontal axis represents the vertical relative displacement, taken as the average relative slip on both sides, while the vertical axis represents the applied load.
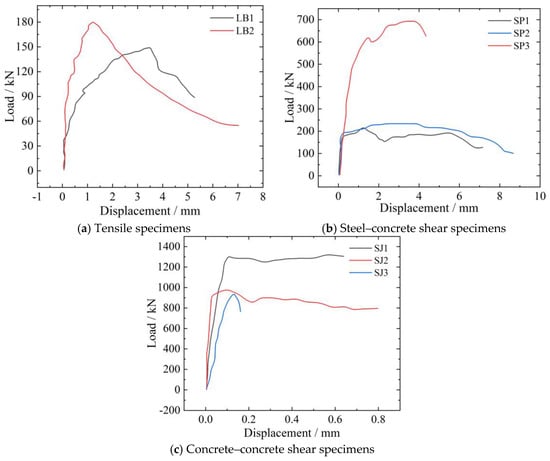
Figure 13.
Load–slip curves.
The loading of the tensile specimens unfolded in three distinct stages. In stage I, the linear elastic phase was characterized by the development of minor cracks at the joints and a nearly linear load–displacement relationship with slight deformations. In stage II, lateral propagation of the joint cracks led to a unified crack, with transverse cracks emerging at the specimen’s center. This stage resulted in a reduced slope in the load–displacement curve, signaling the onset of yielding. Upon reaching the peak load, stage III began, marked by accelerated crack widening, increased deformation, and eventual specimen failure.
The steel–concrete shear specimens also underwent three phases during loading: the elastic, plastic, and failure phases. Initially, the joint’s load was counteracted by the bonding strength at the composite slab and steel flange interface. Once this bond failed, the load–displacement curve’s slope lessened, transitioning into the plastic phase. In this stage, the load at the joint of the grooved component was borne by the shearing action of the shear connector, and the load at the joint of the grooved component was shared between the shearing action of the shear connector and the grooves. With increasing load, the shear connectors were sheared, leading to specimen failure.
In the concrete–concrete shear specimens, SJ1 and SJ2’s brittle local crushing failures at the loading end rendered their displacement curves ineffective for depicting the specimens’ overall stress conditions. Conversely, specimen SJ3 demonstrated an alternate failure pattern. Initially, under a low load, its load–slip curve exhibited a linear increase, followed by a slight slip after further loading, signifying a shift in the curve’s slope and marking the beginning of yielding. Upon reaching the ultimate load, the diagonal cracks from the loading end towards the precast slab’s surface expanded, leading to a downturn in the load–slip curve. The specimen then progressed to a phase of residual load capacity until its eventual failure.
Table 6 summarizes the test outcomes for the specimens under the varying conditions. Tensile specimen LB2 showed a notably higher initial stiffness than LB1, but its yield and ultimate displacements were considerably less, which was attributed to the steel bars in LB2 that bolstered its nodal stiffness and augmented the load capacity by around 20%.
Table 6.
Summary of the shear test results.
For the steel–concrete shear specimens, SP1 and SP3 displayed comparable initial stiffnesses, ductilities, and peak load capacities, suggesting the interface grooves between the precast and cast-in-place layers minimally affected the shear capacity of the steel–concrete composite beam–column joints. SP2, with a marginally lower initial stiffness and reduced ductility but the highest ultimate load capacity, demonstrated that the steel bars significantly boosted the specimen’s load capacity while diminishing its ductility, predisposing it to brittle failure.
In the concrete–concrete shear tests, specimens SJ1 and SJ2 demonstrated comparatively similar initial stiffnesses, marginally surpassing SJ3’s stiffness. SJ1 showcased a transient yield plateau upon reaching its ultimate load capacity and then succumbed to compression failure at the load application point. Specimen SJ2 showed better ductility after reaching the ultimate load-carrying capacity, indicating that the inclusion of reinforcement in this specimen significantly improved its ductility. The ultimate failure mode revealed that despite pronounced cracking, the cast-in-place slab remained integral with the specimen. For SJ3, the specimen experienced adhesive failure at the interface between the precast and cast-in-place concrete slabs.
3.3. Strain Analysis
The strain–load relationships for the tensile specimens, as illustrated in Figure 14, paralleled the load–slip behaviors observed. At lower loads (below 100 kN), the strain measurements remained minimal (below 100 µε). However, upon surpassing a 100 kN load, the strains sharply increased, reflecting tensile stress from the growing and spreading cracks. Yet, due to the uneven crack distribution, the strains varied significantly across the different points.
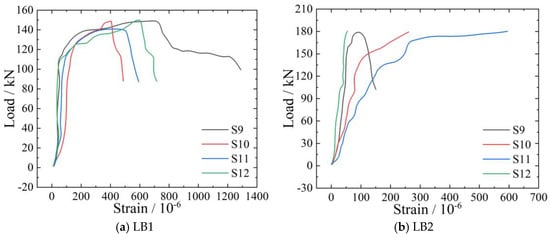
Figure 14.
Load–strain relationships of the tensile specimens.
The strain–load curves for the steel–concrete shear specimens are shown in Figure 15. Focusing on SP1, it is evident that the shear studs’ presence in the local composite slab’s center caused much higher compressive strains at strain gauge S4 compared to the adjacent locations. There were no noticeable abrupt changes in the strain readings between strain gauges S1 and S2, as well as between strain gauges S6 and S7, indicating good bonding at the interface between the precast layer and the cast-in-place layer during the test. The reverse readings between strain gauges S5 and S6 may be attributed to the fact that strain gauge S5 was primarily influenced by compression due to the steel beam, while strain gauge S6 was more affected by the support reaction of the precast slab, preventing tensile stress resulting from the relative slip between the steel beam and the concrete slab.
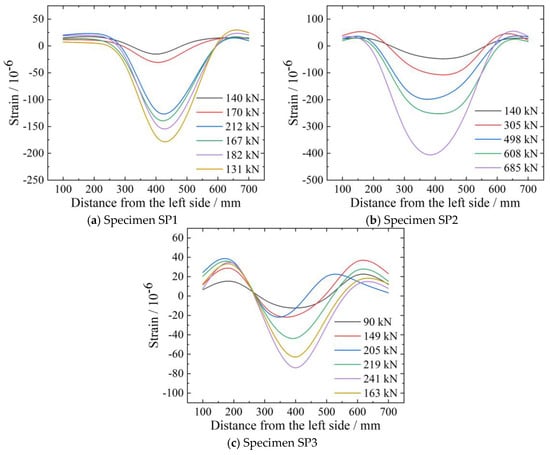
Figure 15.
Strain distributions in the steel–concrete shear specimens.
For the concrete–concrete shear specimens, SJ1 and SJ2’s strain measurements, affected by brittle local crushing failures at the loading end, did not fully represent the specimens’ overall stress conditions. An analysis of the stresses from the longitudinal strain gauges indicated the longitudinal bond’s magnitude between the gauges through the loading process. By examining the strain gauges across the interface between the transverse prefabricated panels and the backing plate, the stress transfer during loading became apparent. An uptick in the stress differential between the two transverse gauges implied that the concrete at the interface was intact and could sustain a specific level of shear stress. These observations and corresponding stress calculations are detailed in Table 7 and Table 8.
Table 7.
The stress differences between the adjacent horizontal strain gauges of specimen SJ1.
Table 8.
The stress differences between the adjacent horizontal strain gauges of specimen SJ3.
On both sides of the interface between the precast and cast-in-place concrete and at the midpoint of the cast-in-place slab, three strain gauges (top, middle, and bottom) were positioned to measure the magnitudes of the bonding forces at the interface during the test and the stresses at the same locations along the axis of the cast-in-place slab. An observed reduction in bonding forces with the increasing test load suggested a bonding failure at this interface in specimen SJ3, leading to the outward displacement of the upper part of the cast-in-place concrete slab.
4. Design Method and Recommendations
4.1. Calculation of Tensile Load-Carrying Capacity
The joint emerged as the specimens’ most vulnerable point. The analysis simplifies the loading condition at the joint as a tension test for the reinforcing bars. The calculation of the anchorage failure load of the reinforcing bars at the joint serves as the ultimate load-carrying capacity of the specimen. The calculation primarily relies on the formula for calculating the bond strength of reinforcing bar splicing proposed by Xu []:
where d represents the diameter of the spliced reinforcing bars; lsl represents the splice length; c denotes the thickness of the protective cover, set at 20 mm; ρsv represents the shear reinforcement ratio, considering that the transverse distribution bars are located on the inner side of the plate, and this value is assumed to be 0; and ft stands for the tensile strength of the concrete.
The ultimate load capacity of the tensile specimens is derived from the average bond stress on the spliced reinforcement’s surface, calculated using Equation (2).
The comparisons between the theoretical values calculated using the above equation and the experimental measurements are presented in Table 9. The errors between the theoretical value Fs1 and the measured value Fs were less than 15%, and the agreement was good.
Table 9.
Comparisons between the theoretical and measured values of the load-bearing capacity of the tensile specimens.
4.2. Calculation of the Shear Load-Carrying Capacity
The ultimate shear load-bearing capacity at the steel–concrete interface in the shear specimens can be estimated using Equation (3), where the shear keys are analogized to shear studs []. In this equation, Nv denotes the shear capacity of the steel–concrete composite specimen. The variables As, Ec, fc, and fy correspond to the cross-sectional area of the shear connectors, the elastic modulus of the concrete, the standard compressive strength of the concrete, and the yield strength of the shear connectors, respectively.
Comparisons between the theoretical values calculated using the above equation and the experimental measurements are presented in Table 10. The average ratio of the theoretical value Nv1 to the measured value Nv is 1.791, with a standard deviation of 0.66. This discrepancy arises because the experiment considers the shear load-bearing capacity as a combination of the shear studs’ resistance and the bond strength between the steel beam and concrete. However, in real-world ultimate failure scenarios, it is unlikely that both components achieve their maximum load-bearing capacity simultaneously. Thus, the true ultimate failure load is expected to be lower than the cumulative shear capacity of the shear studs and the bond strength at the steel beam–concrete interface.
Table 10.
Comparisons between the theoretical and measured values of the load-bearing capacity of the steel-concrete shear specimens.
The ultimate shear capacity at the interface between the precast concrete slabs and the cast-in-place concrete nodes is determined by considering interface bonding, concrete key shear strength, and the shear strength of the transverse tensile reinforcement crossing the interface. Vu represents the ultimate shear strength, Vc is the interface bonding strength, vs. is the concrete key shear strength, and Vr is the shear strength of the transverse tensile reinforcement (due to shear connectors), as shown in Equation (4).
The interfacial bonding performance between distinct concrete materials hinges on the interface conditions and the comparatively lower concrete strength at the interface, as noted in reference []. The shear bond strength, reaching its zenith upon interface cracking, correlates with surface roughness. This study did not employ any special surface treatment methods, and Vc is calculated according to Equation (5), where ft represents the tensile strength of the concrete and Ac is the interface area.
The shear capacity contribution of the concrete shear keys to the node’s peak load is crucial and is influenced by the shear key’s size, shape, and material properties, as discussed in references [,]. In this paper, the formula for calculating vs. is given in Equation (6), where fc represents the axial compressive strength of the concrete and As is the cross-sectional area of the shear plane.
As interface slip amplifies, the transverse tensile reinforcement initiates shear load resistance, referenced in reference []. Vr is calculated according to Equation (7). In this equation, Ar represents the area of transverse reinforcement on the interface and k1 is a parameter that considers the extent of strain development at the ultimate point of the reinforcement. When pure shear keys are used, k1 is set to 0.5. k2 is a parameter that considers the effective anchoring effect. When the anchorage length is sufficient, k2 = 1, and k2 linearly decreases with the actual anchorage length compared to the critical anchorage length.
From this, the shear load-carrying capacity can be calculated according to Equation (8).
The comparisons between the theoretical values calculated using the above equation and the experimental measurements are presented in Table 11. The average ratio of the theoretical value Vu1 to the measured value Vu is 1.033, with a standard deviation of 0.31, indicating a good agreement between the two.
Table 11.
Comparisons between the theoretical and measured values of the load-bearing capacity of the concrete-concrete shear specimens.
5. Conclusions
To investigate the mechanical performances of fully prefabricated local composite floor slab nodes and the influences of connector types and shear groove structures on the load-bearing performances of joints, two tensile tests, three steel–concrete shear tests, and three concrete–concrete shear tests were conducted. Through a comparative analysis of the experiments, the main conclusions are drawn as follows:
- (1)
- The failure of the tensile specimens primarily occurred due to bond failure at the interface between the prefabricated and cast-in-place concrete layers, coupled with the pullout failure of the reinforcement. Incorporating steel bars/sleeves into the specimens enhanced their ultimate load-carrying capacity by an estimated 20%, but it had a limited impact on the deformation capacity when reaching the ultimate load.
- (2)
- The failure modes of the steel–concrete shear specimens included shear failure at the interface between the steel beam and the local composite slab, and the welded shear keys on the steel beam resulted in brittle bending–shear failure. Whether the interface between the prefabricated layer and the cast-in-place layer was grooved did not significantly affect the shear load-carrying capacity of the interface between the steel beam and the local composite slab. The use of steel bars can enhance the load-carrying capacity of the specimens. The concrete–concrete shear specimens exhibited different failure modes, including brittle failure at the loading end and interface failure at the concrete junction.
- (3)
- Design formulas accounting for interface bonding, concrete shear keys, and embedded steel reinforcement were proposed. The effectiveness of these formulas was subsequently validated, offering valuable insights for the design and analysis of similar structural components.
Author Contributions
Conceptualization, Y.L.; Methodology, Y.L.; Software, G.Z.; Resources, K.C. and Y.Y.; Writing—original draft, Y.Z.; Writing—review & editing, G.Z.; Visualization, Y.Z.; Funding acquisition, K.C. and Y.Y. All authors have read and agreed to the published version of the manuscript.
Funding
This research received no external funding.
Data Availability Statement
The original contributions presented in the study are included in the article, further inquiries can be directed to the corresponding author.
Conflicts of Interest
Author Kanghui Chang was employed by the company Green Building Integrated Technology Co., Ltd. Author Yukun Yang was employed by the company Shanghai Jieyi Construction Technology Co., Ltd. Author Yanjun Liu was employed by the company Fujian Zuohai Technology Co., Ltd. The remaining authors declare that the research was conducted in the absence of any commercial or financial relationships that could be construed as a potential conflict of interest.
References
- Chong, X.; Xie, L.; Ye, X.; Jiang, Q.; Wang, D. Experimental study on the seismic performance of superimposed RC shear walls with enhanced horizontal joints. J. Earthq. Eng. 2019, 23, 1–17. [Google Scholar] [CrossRef]
- Lou, F.; Chen, X.; Luo, B.; Chen, Z. Mechanical behavior of a new type of reinforced concrete composite slab with a joint. Case Stud. Constr. Mater. 2023, 20, e02773. [Google Scholar] [CrossRef]
- Wang, H.; Zhou, Z.; Zhang, Z.; Zou, Y.; Jiang, J.; Zeng, X. Experimental and numerical studies on shear behavior of prefabricated bridge deck slabs with compact UHPC wet joint. Case Stud. Constr. Mater. 2023, 19, e02362. [Google Scholar] [CrossRef]
- Qiang, X.; Chen, L.; Jiang, X. Experimental and theoretical study on flexural behavior of steel–concrete composite beams strengthened by CFRP plates with unbonded retrofit systems. Compos. Struct. 2023, 309, 116763. [Google Scholar] [CrossRef]
- Dehghani, A.; Hayatdavoodi, A.; Aslani, F. The ultimate shear capacity of longitudinally stiffened steel-concrete composite plate girders. J. Constr. Steel Res. 2021, 179, 106550. [Google Scholar] [CrossRef]
- Abokifa, M.; Moustafa, M.A.; Itani, A.M. Comparative structural behavior of bridge deck panels with polymer concrete and UHPC transverse field joints. Eng. Struct. 2021, 247, 113195. [Google Scholar] [CrossRef]
- Wu, H.; Qiao, G.; Qiao, Y.; Zhong, Z.; Zhou, Z.; Ye, T. Experimental and theoretical research on flexural performance of truss reinforced concrete two-way composite slab with prefabricated baseplate. Structures 2023, 58, 105470. [Google Scholar] [CrossRef]
- Ye, X.G.; Hua, H.G.; Xu, T.S.; Wang, D.C. Experimental study on connection of superimposed slabs. Ind. Constr. 2010, 40, 59–63. (In Chinese) [Google Scholar]
- Ding, K.W.; Wu, F.; Liu, Y.L. Experimental study on connections of superimposed slabs. Adv. Mater. Res. 2014, 908, 3–7. [Google Scholar] [CrossRef]
- Liu, J.; Hu, H.; Li, J.; Chen, Y.F.; Zhang, L. Flexural behavior of prestressed concrete composite slab with precast inverted T-shaped ribbed panels. Eng. Struct. 2020, 215, 110687. [Google Scholar] [CrossRef]
- Han, S.J.; Jeong, J.H.; Joo, H.E.; Choi, S.-H.; Choi, S.; Kim, K.S. Flexural and shear performance of prestressed composite slabs with inverted multi-ribs. Appl. Sci. 2019, 9, 4946. [Google Scholar] [CrossRef]
- Huang, H.; Li, J.; Zeng, C.; Zhu, M.; Zhang, M. Simplified elastic design method using equivalent span ratio for two-way concrete composite slabs with precast ribbed panels. Struct. Concr. 2019, 20, 213–224. [Google Scholar] [CrossRef]
- Wang, H.; Liu, X.; Yue, Q.; Zheng, M. Effects of different design factors on the shear performance of assembled steel–concrete composite beam with local laminated joint. Structures 2022, 46, 1881–1895. [Google Scholar] [CrossRef]
- Wang, H.; Liu, X.; Yue, Q.; Zheng, M. Shear resistance of a novel wet connection for prefabricated composite beams under shear-bending coupling loading. J. Build. Eng. 2022, 45, 103636. [Google Scholar] [CrossRef]
- Ding, J.; Zhu, J.; Kang, J.; Wang, X. Experimental study on grouped stud shear connectors in precast steel-UHPC composite bridge. Eng. Struct. 2021, 242, 112479. [Google Scholar] [CrossRef]
- El-Khier, M.A.; Morcous, G. Precast concrete deck-to-girder connection using Ultra-High Performance Concrete (UHPC) shear pockets. Eng. Struct. 2021, 248, 113082. [Google Scholar] [CrossRef]
- Wang, H.; Liu, X.; Yue, Q.; Wang, N.; Zheng, M. Longitudinal shear behavior and design method of UHPC connection for prefabricated slabs in composite beams. Eng. Struct. 2023, 277, 115386. [Google Scholar] [CrossRef]
- Mohamed, M.I.S.; Thamboo, J.A.; Jeyakaran, T. Experimental and numerical assessment of the flexural behaviour of semi-precast-reinforced concrete slabs. Adv. Struct. Eng. 2020, 23, 1865–1879. [Google Scholar] [CrossRef]
- Gohnert, M. Horizontal shear transfer across a roughened surface. Cem. Concr. Compos. 2003, 25, 379–385. [Google Scholar] [CrossRef]
- Gohnert, M. Proposed theory to determine the horizontal shear between composite precast and in situ concrete. Cem. Concr. Compos. 2000, 22, 469–476. [Google Scholar] [CrossRef]
- Lam, S.S.E.; Wong, V.; Lee, R.S.M. Bonding assessment of semi-precast slabs subjected to flexural load and differential shrinkage. Eng. Struct. 2019, 187, 25–33. [Google Scholar] [CrossRef]
- Jiang, H.; Fang, Z.; Liu, A.; Li, Y.; Feng, J. Interface shear behavior between high-strength precast girders and lightweight cast-in-place slabs. Constr. Build. Mater. 2016, 128, 449–460. [Google Scholar] [CrossRef]
- Adawi, A.; Youssef, M.A.; Meshaly, M.E. Experimental investigation of the composite action between hollowcore slabs with machine-cast finish and concrete topping. Eng. Struct. 2015, 91, 1–15. [Google Scholar] [CrossRef]
- Adawi, A.; Youssef, M.A.; Meshaly, M.E. Finite element modeling of the composite action between hollowcore slabs and the topping concrete. Eng. Struct. 2016, 124, 302–315. [Google Scholar] [CrossRef]
- Ibrahim, I.S.; Elliott, K.S.; Abdullah, R.; Kueh, A.; Sarbini, N. Experimental study on the shear behaviour of precast concrete hollow core slabs with concrete topping. Eng. Struct. 2016, 125, 80–90. [Google Scholar] [CrossRef]
- Girhammar, U.A.; Pajari, M. Tests and analysis on shear strength of composite slabs of hollow core units and concrete topping. Constr. Build. Mater. 2008, 22, 1708–1722. [Google Scholar] [CrossRef]
- Gromysz, K. Nonlinear analytical model of composite concrete slab free and forced vibrations. Procedia Eng. 2017, 193, 281–288. [Google Scholar] [CrossRef]
- Wang, H.; Wang, N.; Liu, X.; Yue, Q.R.; Yan, J.L.; Zhang, Y. Effects of UHPC shear key on strengthening shear performances of wet joint in prefabricated composite beams. Eng. Struct. 2024, 299, 117130. [Google Scholar] [CrossRef]
- GB 50017-2017; Standard for Design of Steel Structures. China Planning Press: Beijing, China, 2017. (In Chinese)
- GB 50010-2010; Code for Design of Concrete Structures. China Architecture and Building Press: Beijing, China, 2010. (In Chinese)
- EN 1994-1-1; Eurocode 4 Design of Composite Steel and Concrete Structures, Part 1-1: General Rues and Rules for Buildings. European Committee for Standardization (CEN): Brussels, Belgium, 2005.
- Xu, Y.L.; Wang, H.; Shen, W.D. Experimental study on force transfer performance of steel bar bond. Build. Struct. 1993, 4, 20–24. (In Chinese) [Google Scholar]
- Semendary, A.A.; Hamid, W.K.; Steinberg, E.P.; Khoury, I. Shear friction performance between high strength concrete (HSC) and ultra high performance concrete (UHPC) for bridge connection applications. Eng. Struct. 2020, 205, 110122. [Google Scholar] [CrossRef]
- Hussein, H.H.; Sargand, S.M.; Steinberg, E.P. Shape optimization of UHPC shear keys for precast, prestressed, adjacent box-girder bridges. J. Bridge Eng. 2018, 23, 04018009. [Google Scholar] [CrossRef]
- Feng, Z.; Li, C.X.; Pan, R.S.; Zhou, J.; Ke, L.; Ke, H. Experimental investigation and calculation method of UHPC direct shear capacity. China J. Highw. Transp. 2021, 34, 78–90. (In Chinese) [Google Scholar]
Disclaimer/Publisher’s Note: The statements, opinions and data contained in all publications are solely those of the individual author(s) and contributor(s) and not of MDPI and/or the editor(s). MDPI and/or the editor(s) disclaim responsibility for any injury to people or property resulting from any ideas, methods, instructions or products referred to in the content. |
© 2024 by the authors. Licensee MDPI, Basel, Switzerland. This article is an open access article distributed under the terms and conditions of the Creative Commons Attribution (CC BY) license (https://creativecommons.org/licenses/by/4.0/).