
Optimizing the Shading Device Configuration of Kinetic Façades through Daylighting Performance Assessment


Abstract
1. Introduction
2. Materials and Methods
2.1. Formulating Configuration Parameters
2.1.1. Indoor Space Parameters
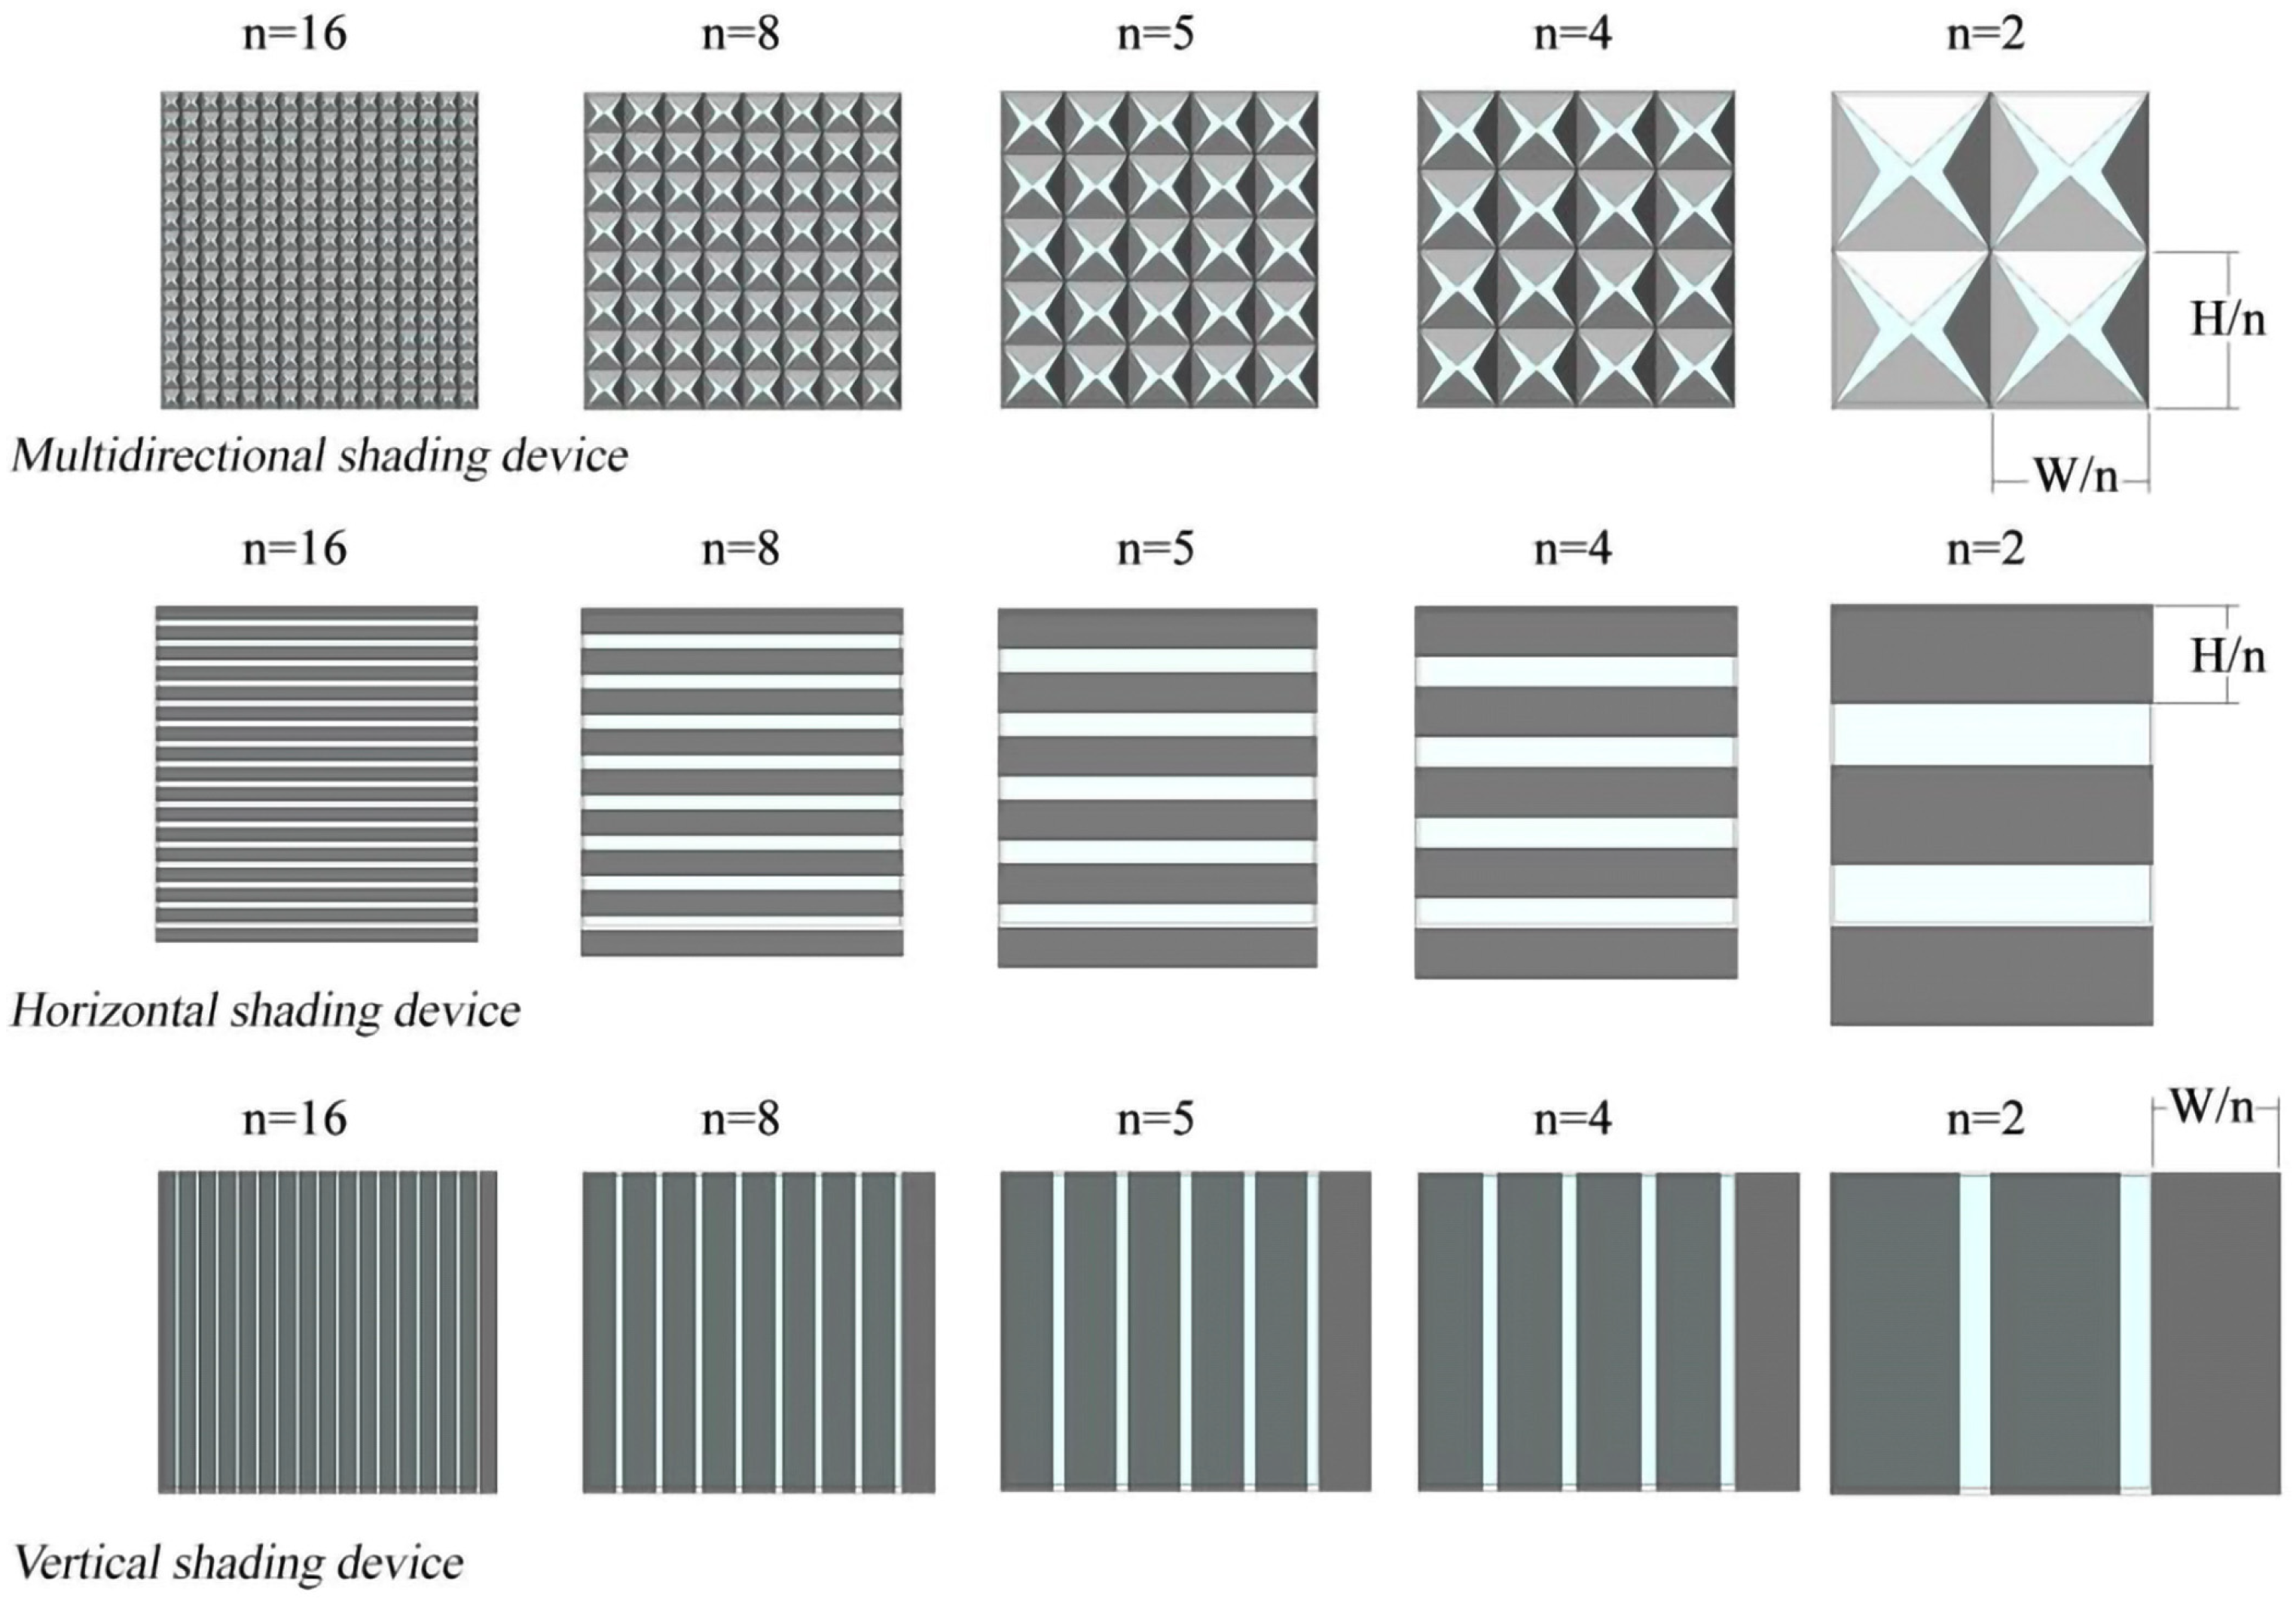
2.1.2. Formulating Configuration Parameters of the Shading Panel
2.1.3. Daylighting Calculation Parameters
- Ambient Parameter: For accurate radiance simulation in a low-complexity scene, such as a typical side-lit space with a standard window, use the parameters recommended in Table 4.
- 2.
- Sun-Path Diagram and Daylight Deflection Scheme: Utilize a sun-path diagram and daylight deflection scheme to establish solar angles and optimal louvre tilt angles at different times of the day and month, especially for specific latitudes. These parameters are crucial for solar shading design, a focus of this study. Solar angle changes for March, June, September, and December in Incheon, South Korea, are sourced from Honeybee.
- Simulations focus on the 21st day of March, June, September, and December to represent the beginning of each season, providing reliable results for seasonal evaluations.
- The dynamic façade system under investigation in this research is designed to dynamically respond to environmental changes driven by the movement of the sun. Consequently, the climatic conditions and geographical features of the location play pivotal roles in deriving meaningful findings. Considering this contextual relevance, Incheon, South Korea, was selected as the primary experimental site, thereby facilitating more informed design decisions and practical implementations of dynamic façade technology.
- Research focuses on basic geometrical shading panels (horizontal, vertical, multi-directional). A fixed distance parameter of 10 cm between shading panels is set for accurate evaluation under given conditions.
- Configuration parameters include the number of shading devices on a specific façade area and the tilt angle of shading panels. Simulations will cover five different sizes for each shading shape, representing various panel dimensions commonly used in practice. The variable “n” denotes the number of shading devices on the façade, with values of 2, 4, 5, 8, and 16, corresponding to panel dimensions of 2 m, 0.8 m, 0.5 m, and 0.25 m.
2.2. Methodology of Optimizing Design Configuration and Operational Scenarios for Dynamic Shading Device System
2.2.1. Genetic Algorithms
2.2.2. Optimization Tool
2.2.3. Optimization Objectives
2.2.4. The Methodology for Optimizing the Design Configuration for Dynamic Shading Panels
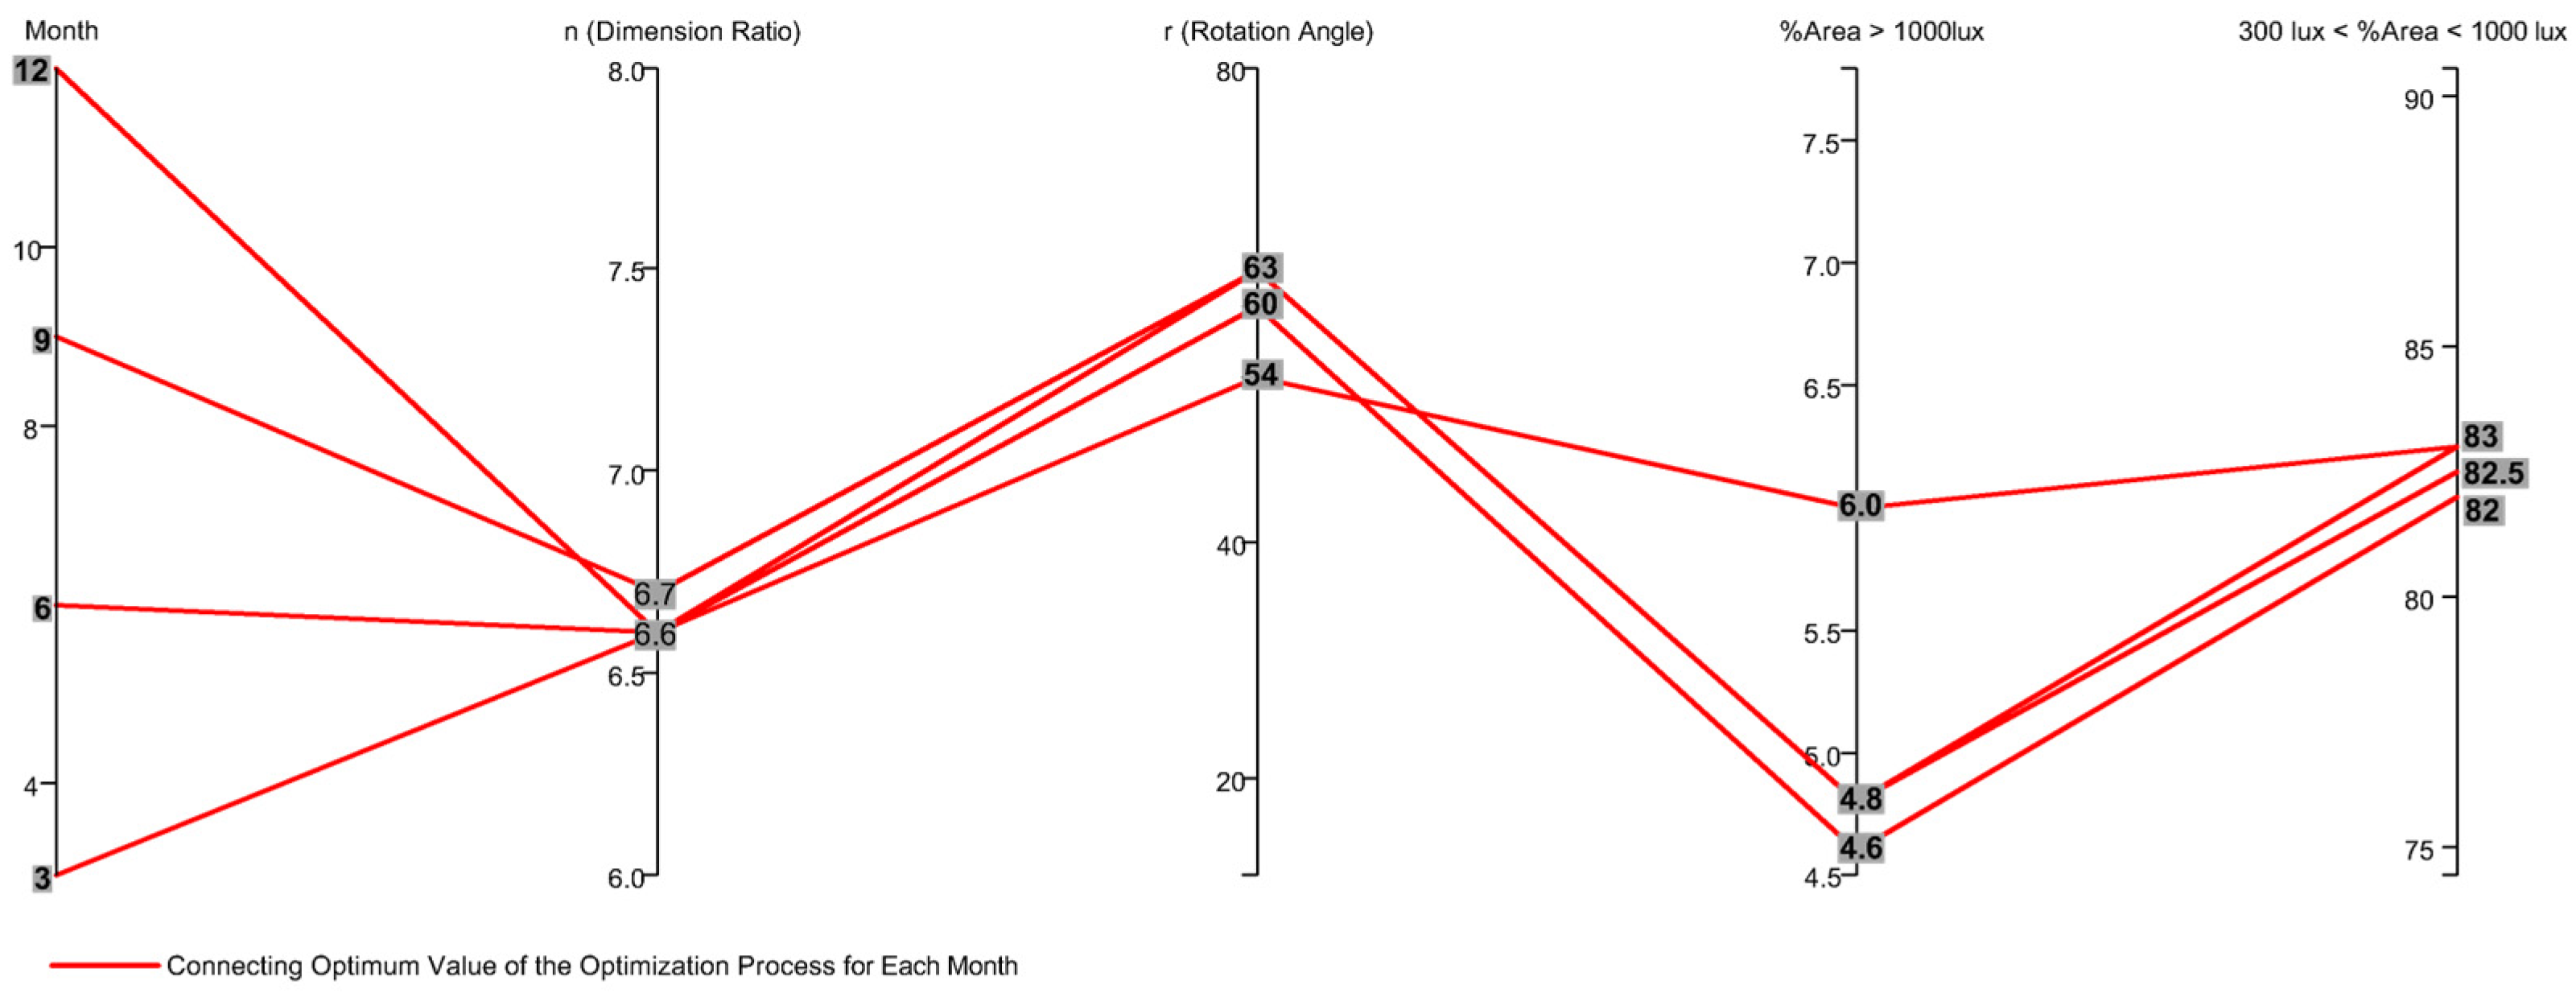
- Perform an optimization with “Month” and “n” variables. The value of “Month” ranges from 1 to 12, corresponding to January to December, respectively. The shift in the sun’s direction’s vector during the change in “Month” causes the shading panel tilt angle to transition. The best solution from this optimization will result in the best optimization objective for all months.
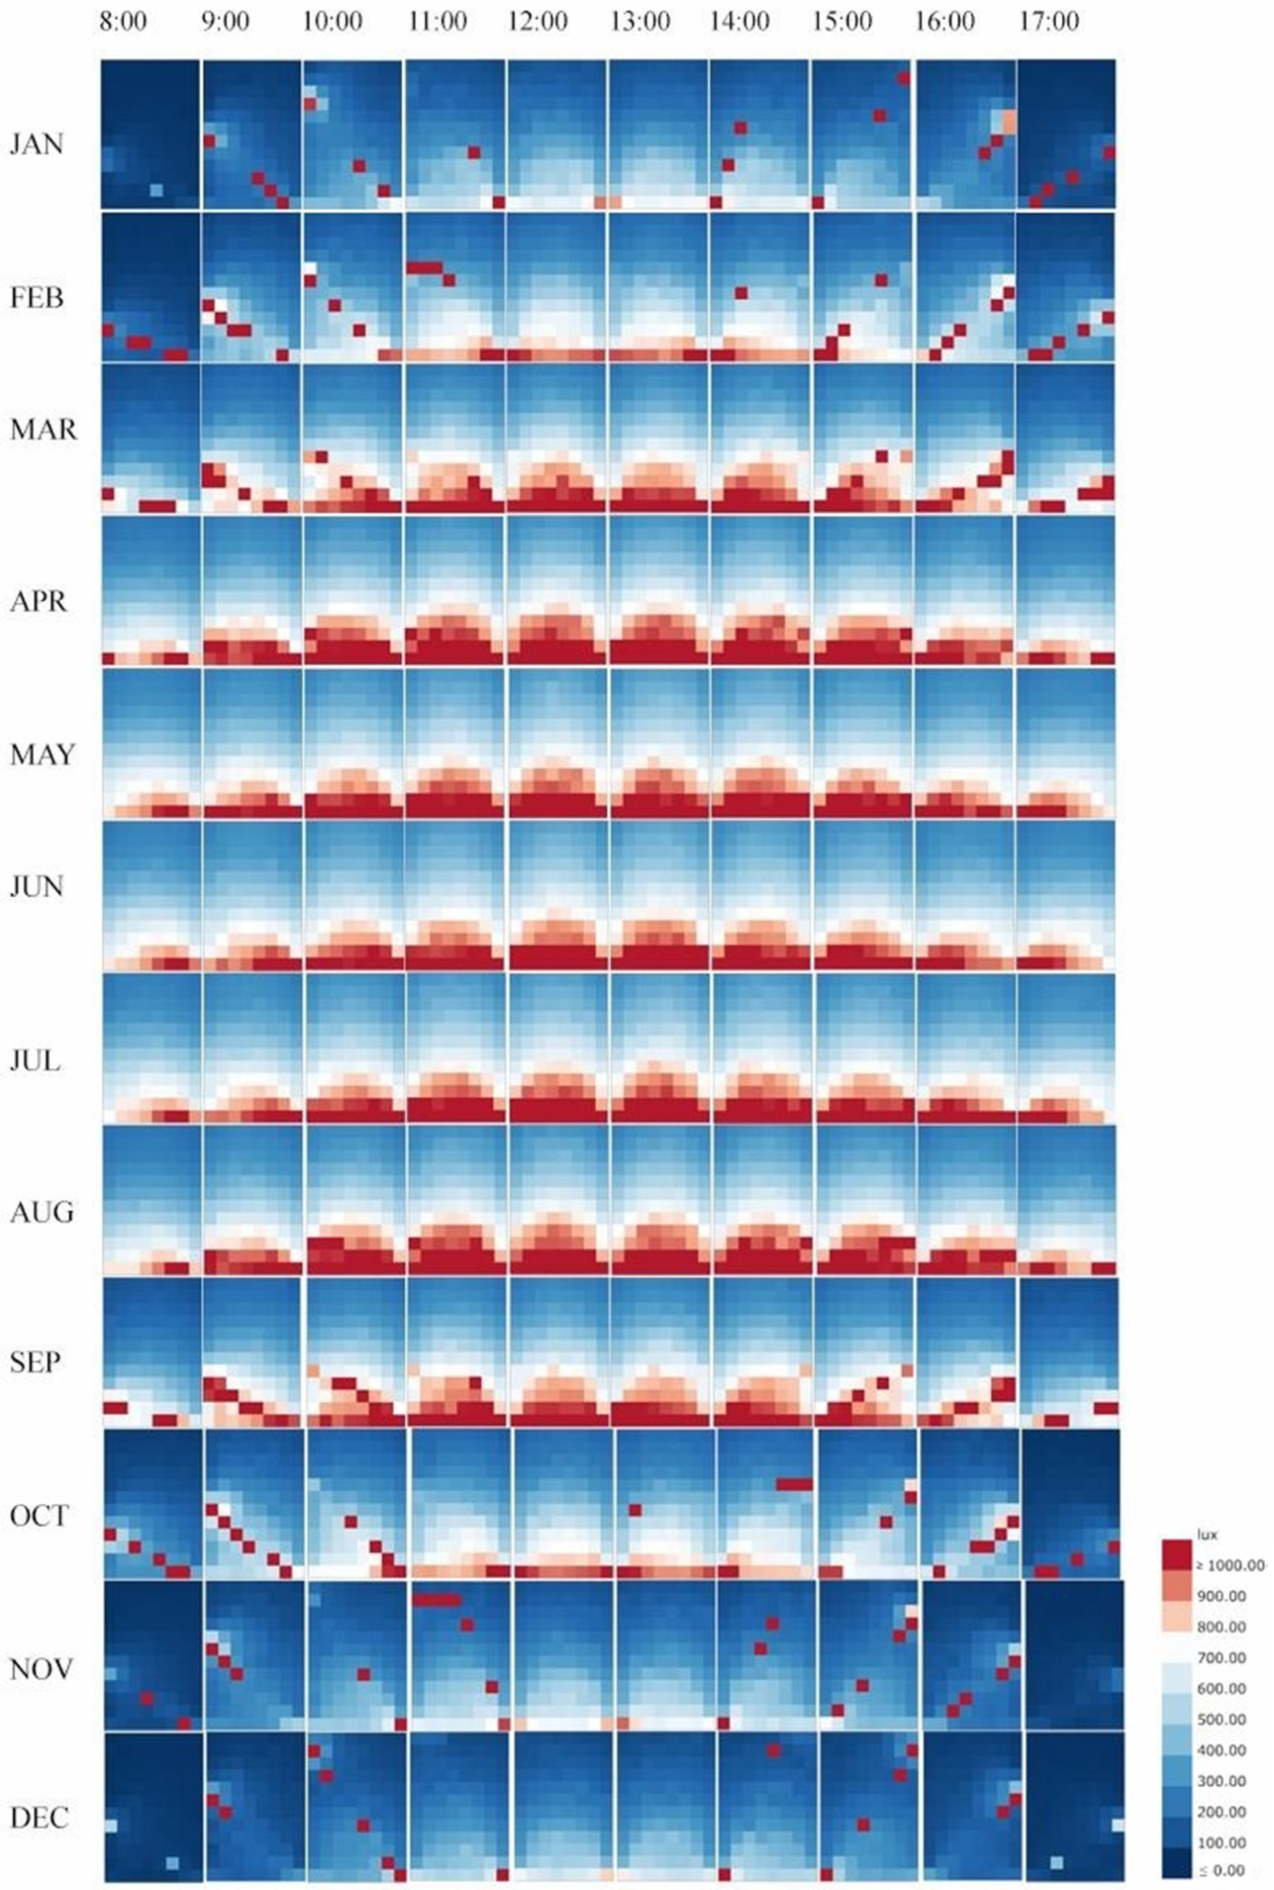
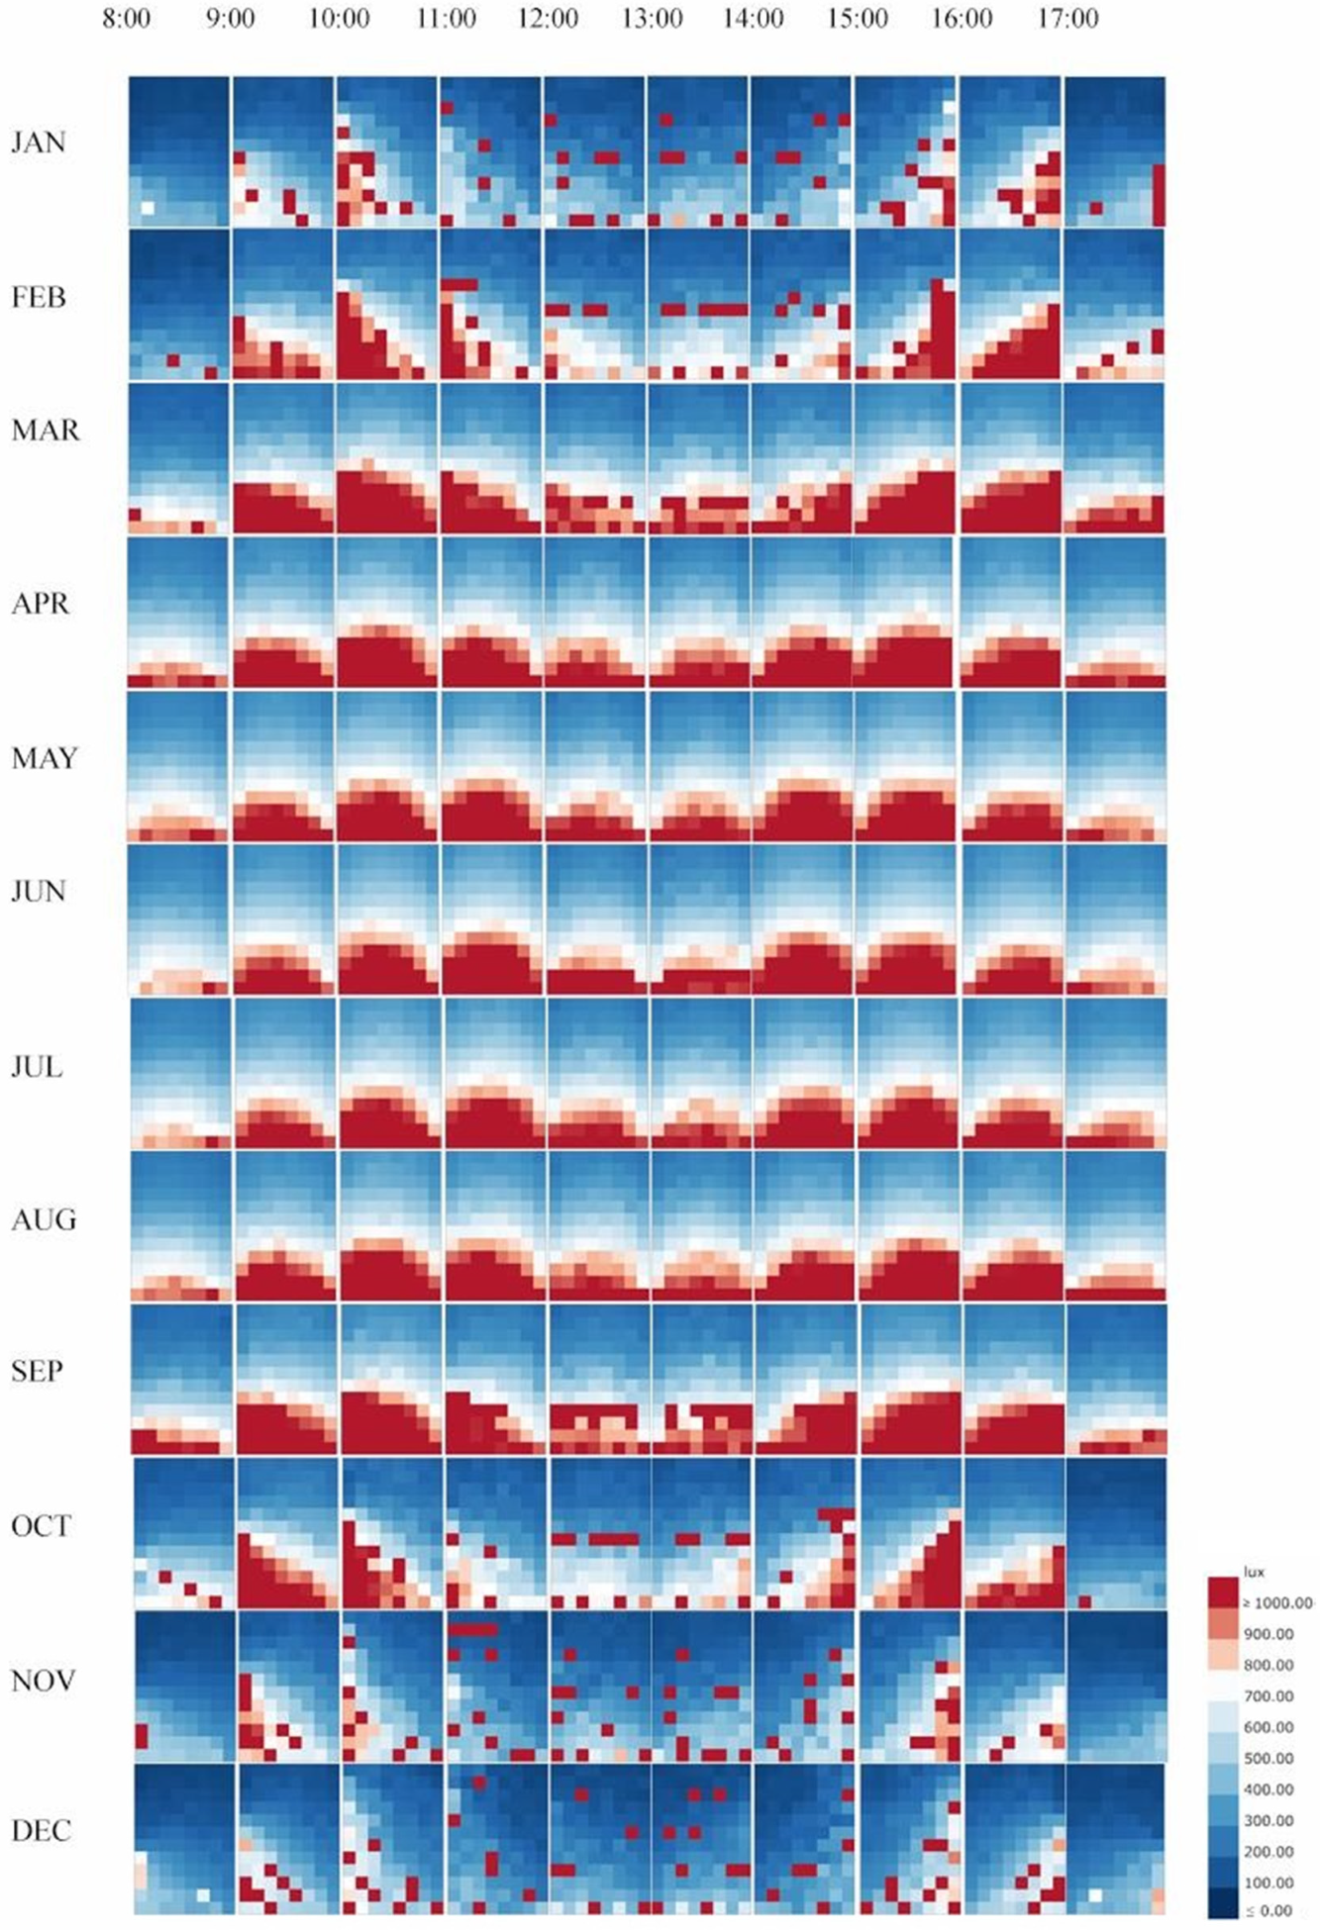
- Conduct another optimization to search for the best shading configuration to meet the optimization objective at every time step within a month. This optimization utilizes up to three variables: “Date”, “Hour”, and “n”. The “Date” value ranges from 1 to 31, corresponding to the 1st day to the 31st day of each month, respectively. The variable “Hour” includes values corresponding to all occupied hours of a day, from 8:00 am to 6:00 pm. Changes in both the “Date” and “Hour” variables, like the “Month” variable, affect the opening angle of each panel in response to solar radiation.
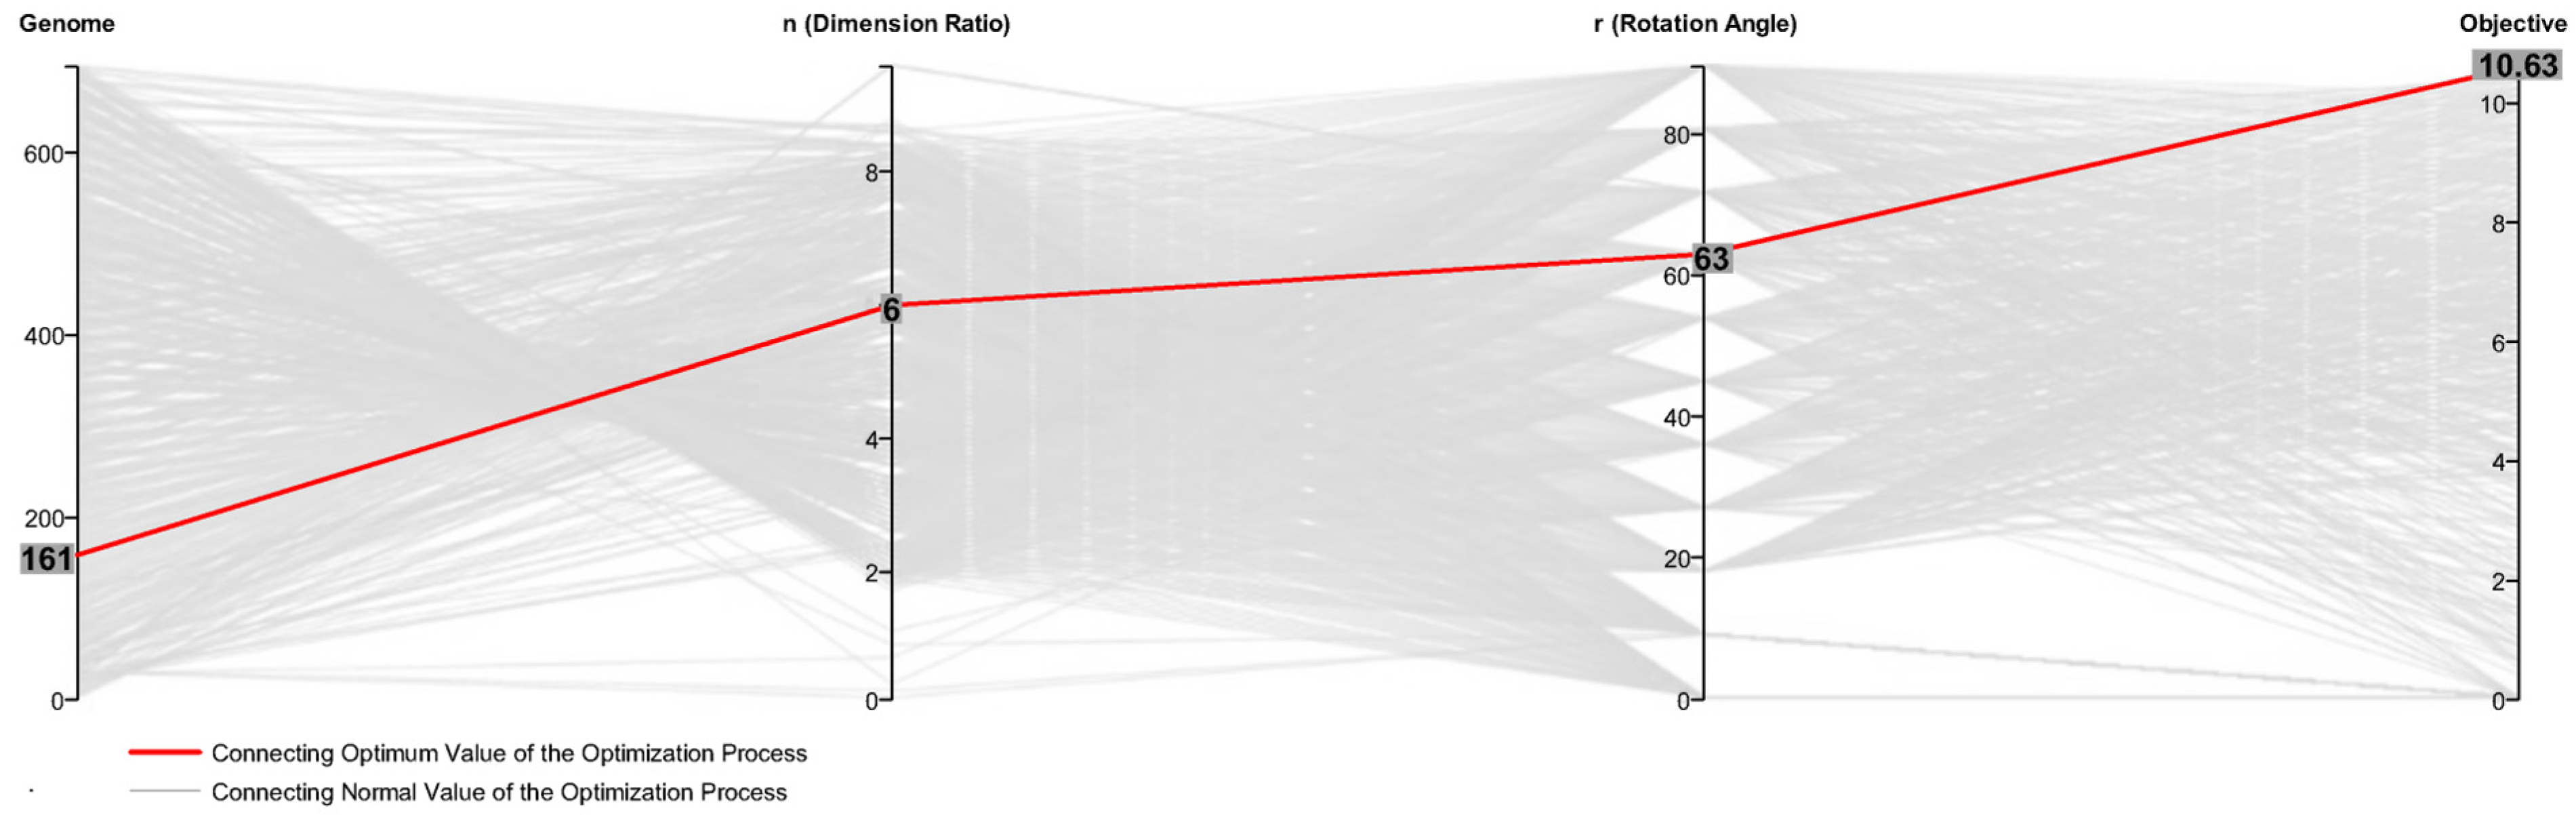
- Visualize the best solutions from the two optimization processes on an excellent graphic to identify their relationship. The variable “n” is common to both optimization processes, while the outcomes derived from each optimization will be the optimum variables of each method. Therefore, if the two optimization processes result in a similar value of “n,” that value will be considered the best solution for both operations and can meet all requirements. Suppose no typical result emerges from the two processes. In that case, it can be concluded that the shading device cannot achieve the best optimization objective in any scenario or with any modification of the design configuration.
2.2.5. Methodology of Optimizing Operational Scenarios for Dynamic Shading Device System
3. Results
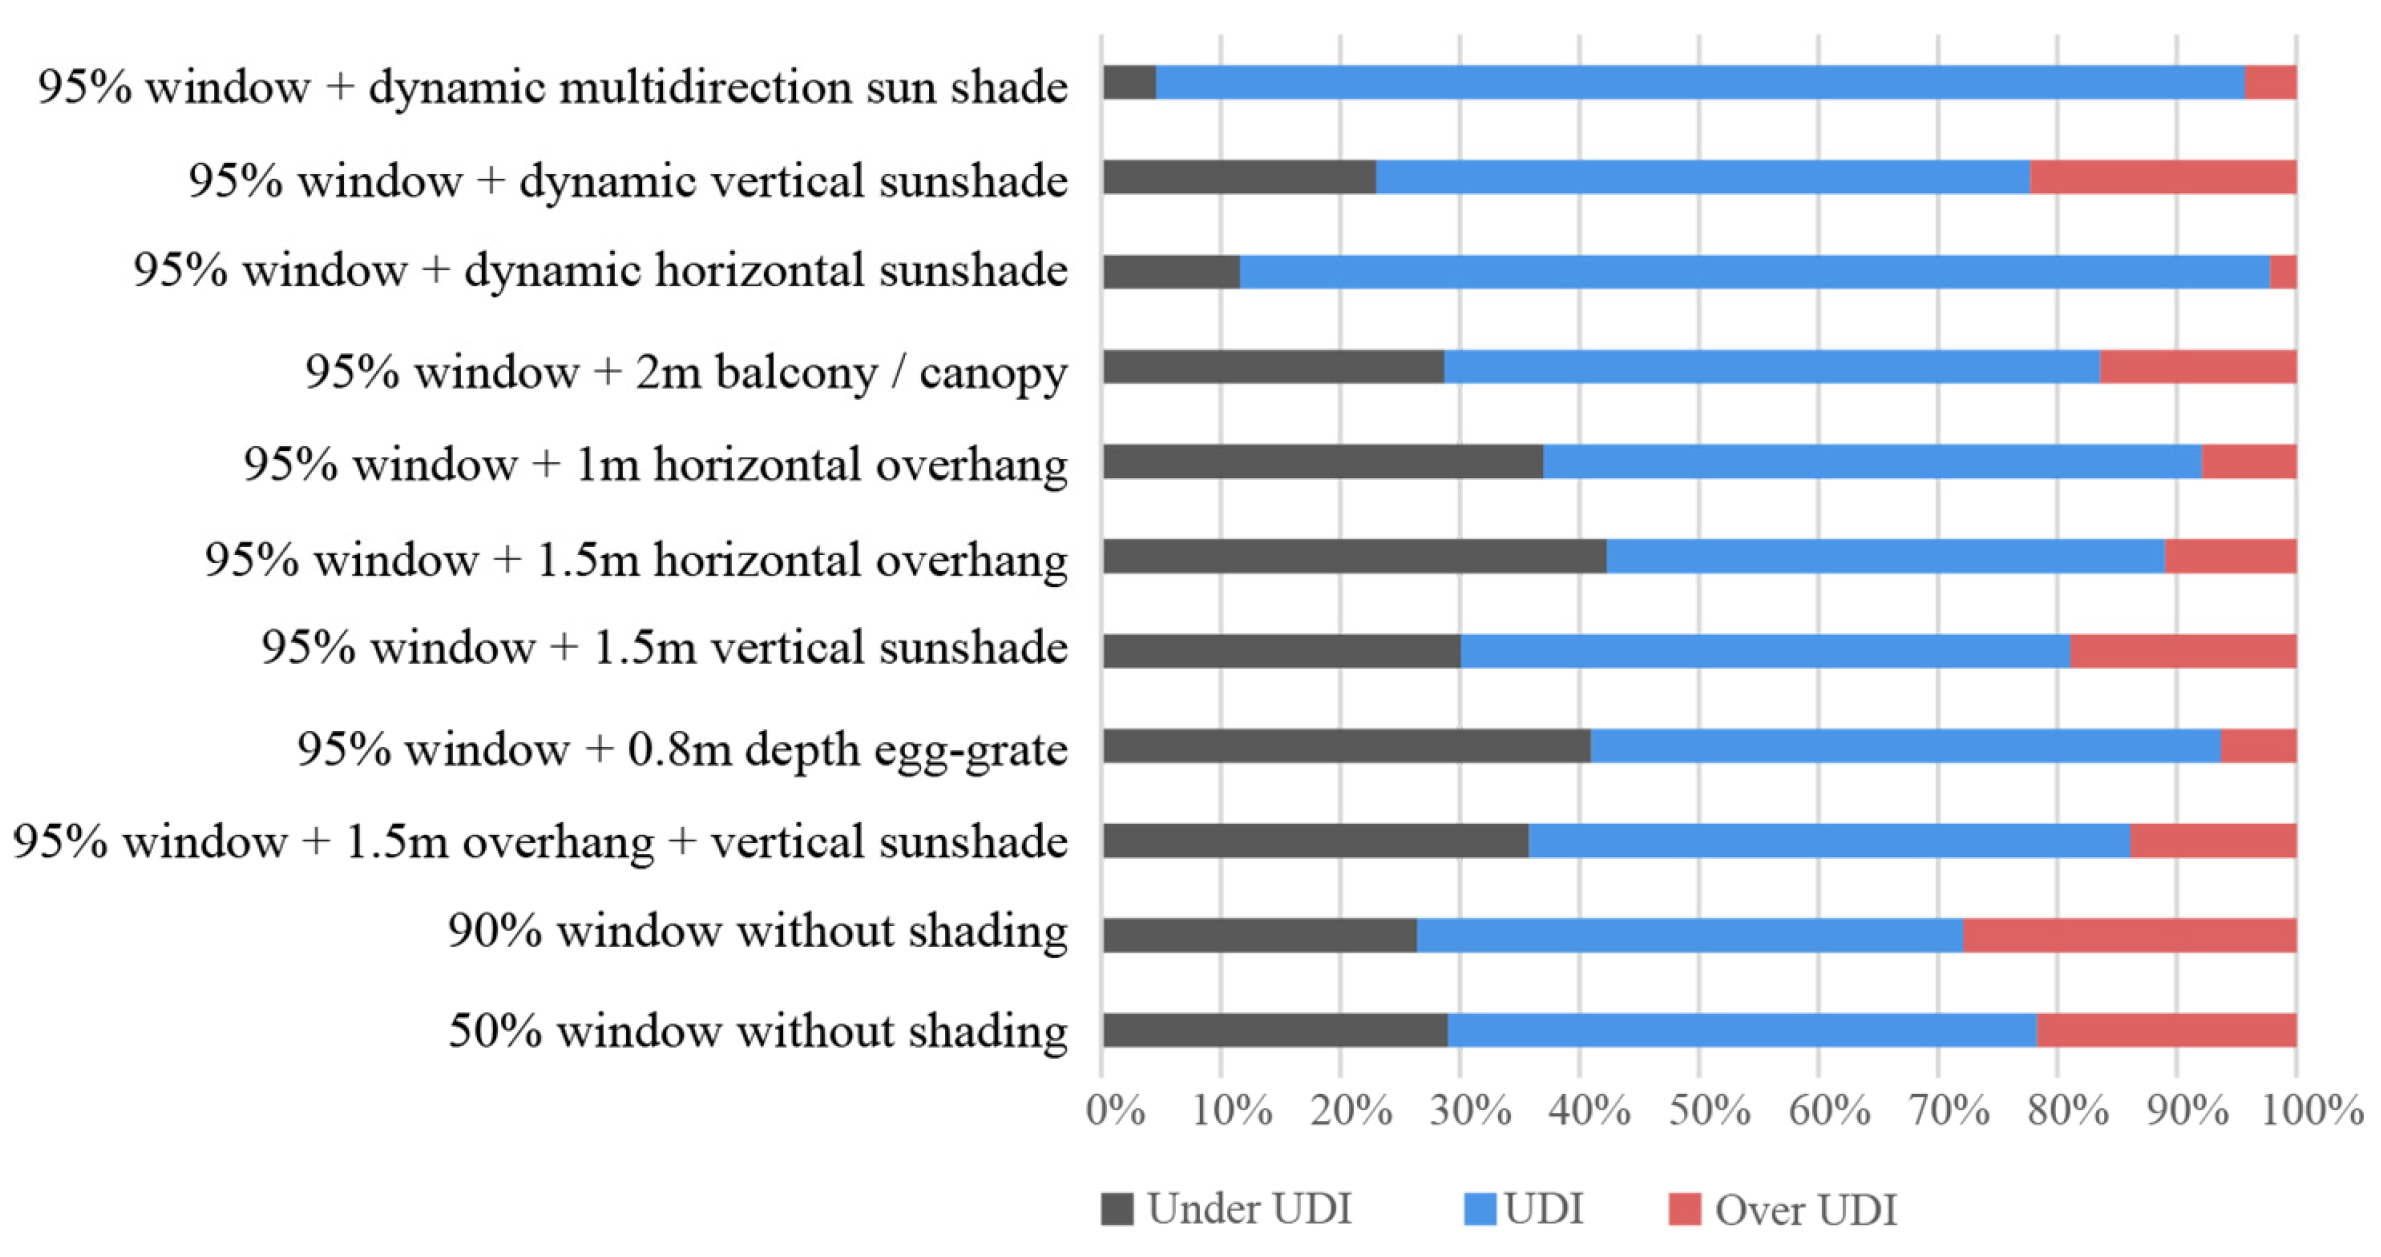
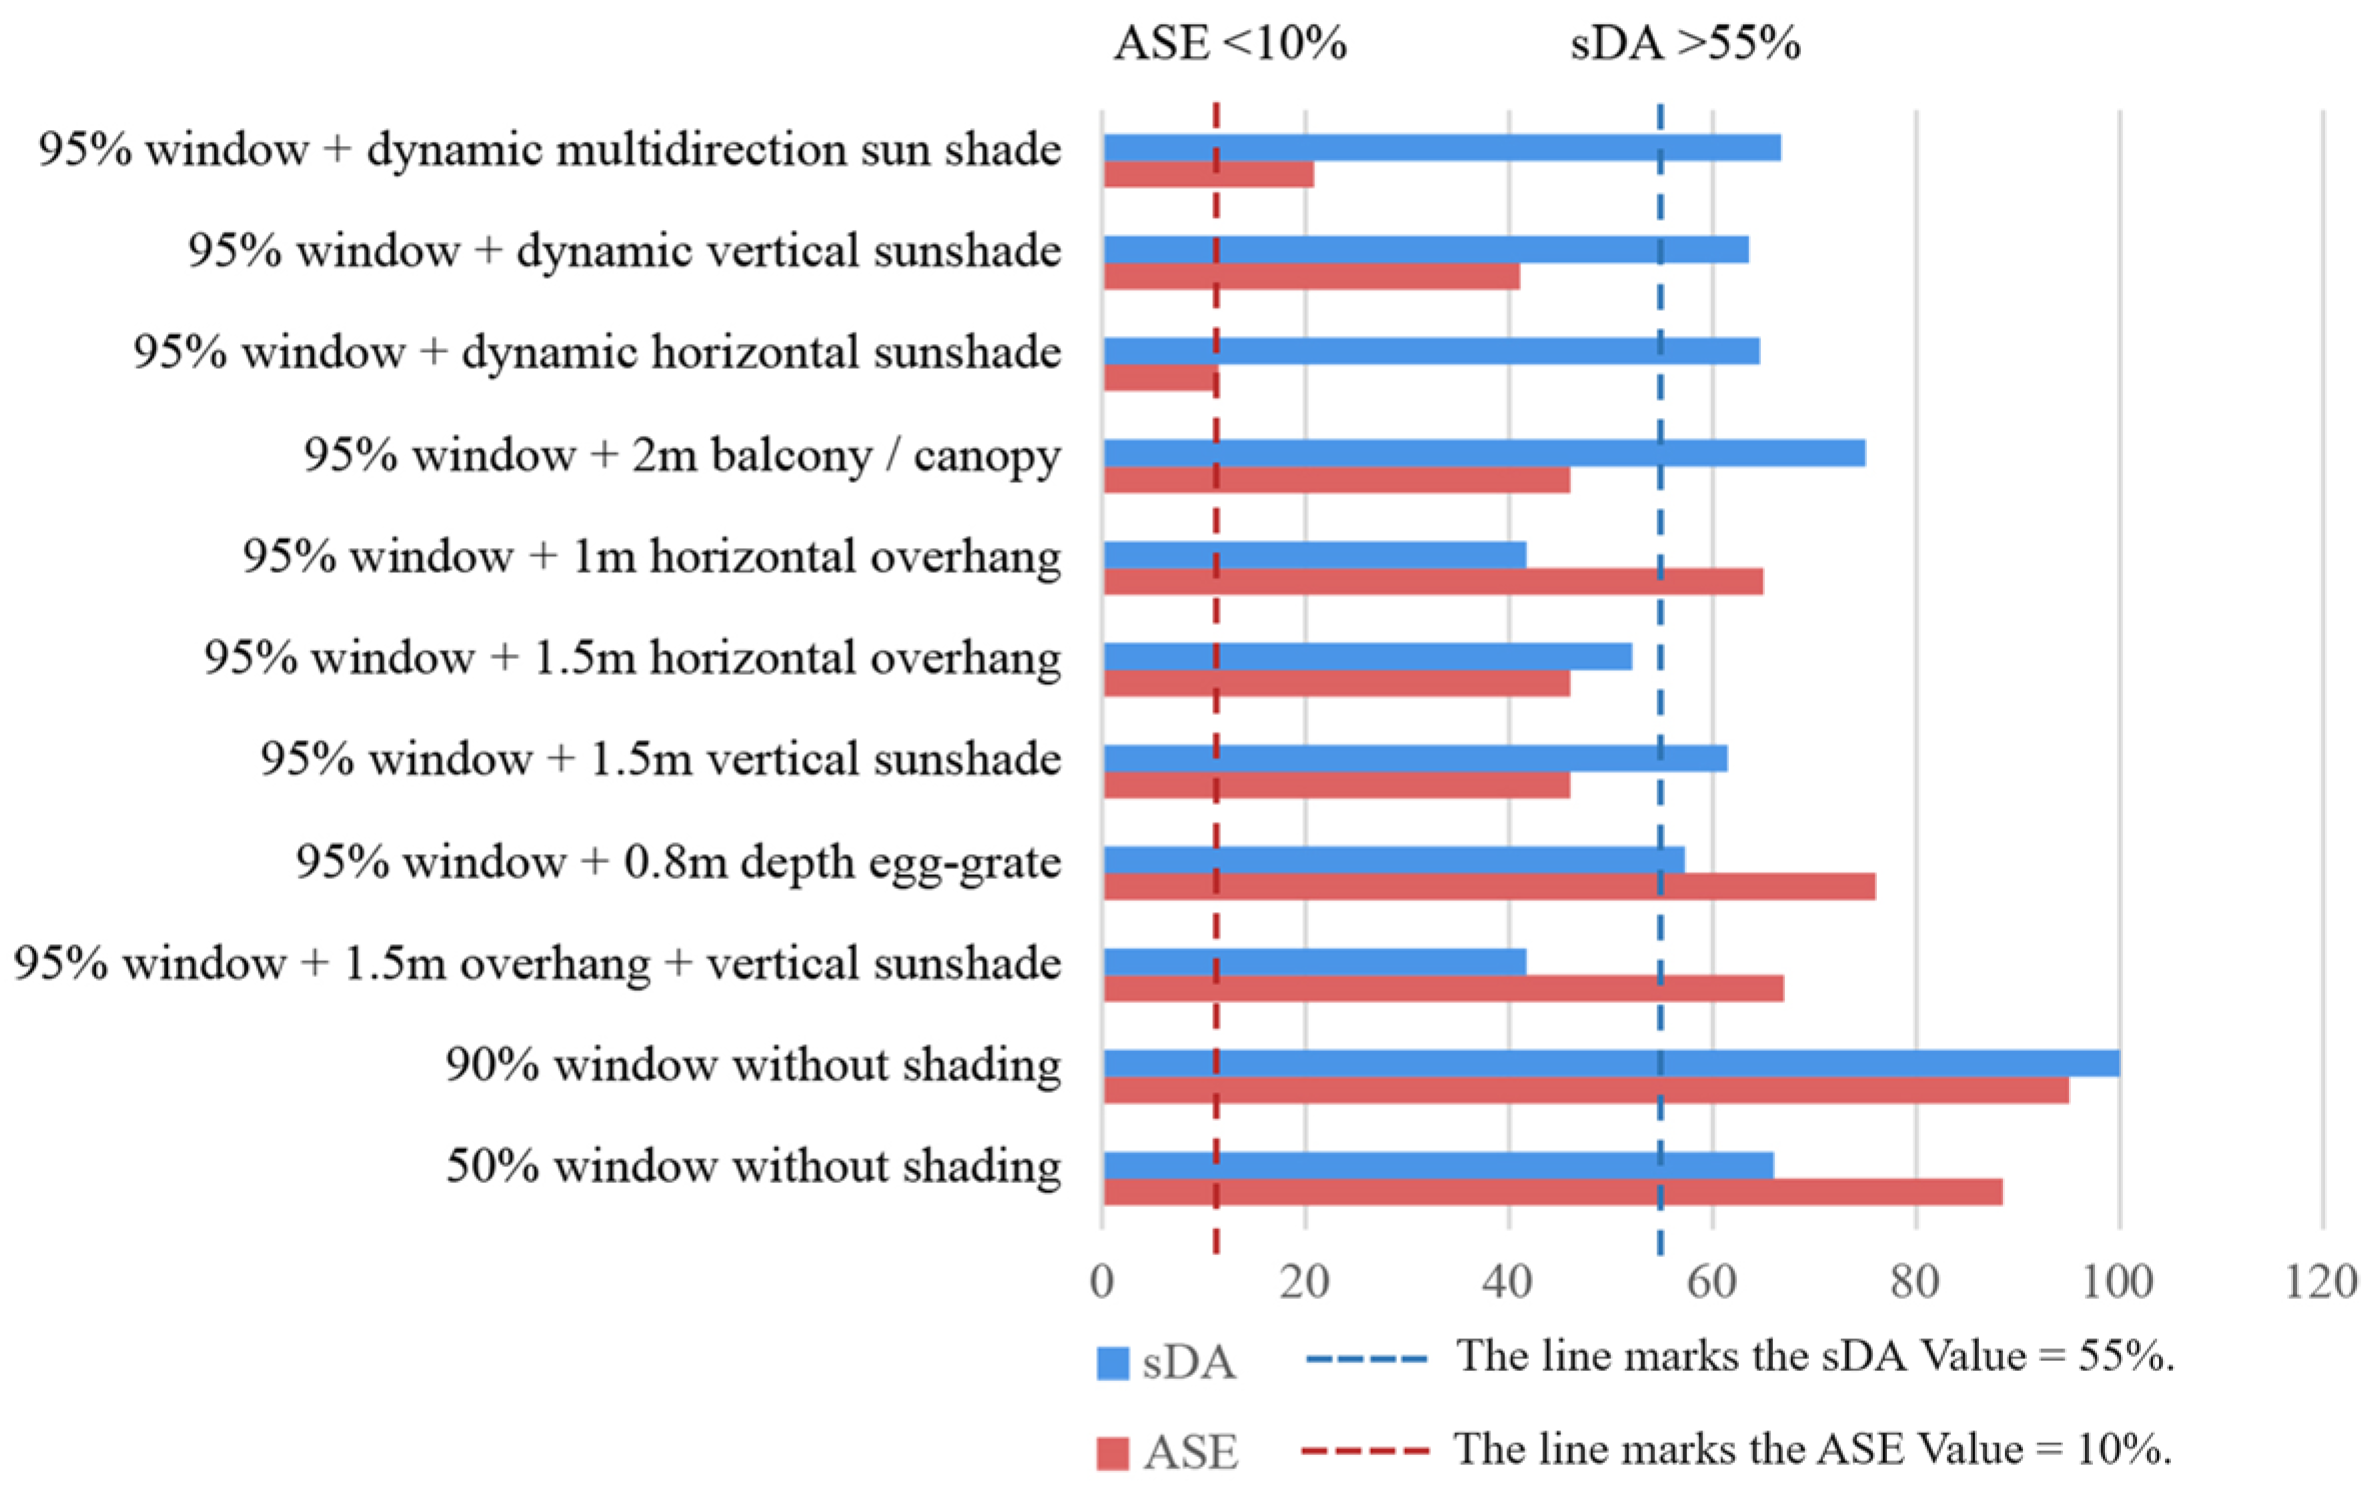
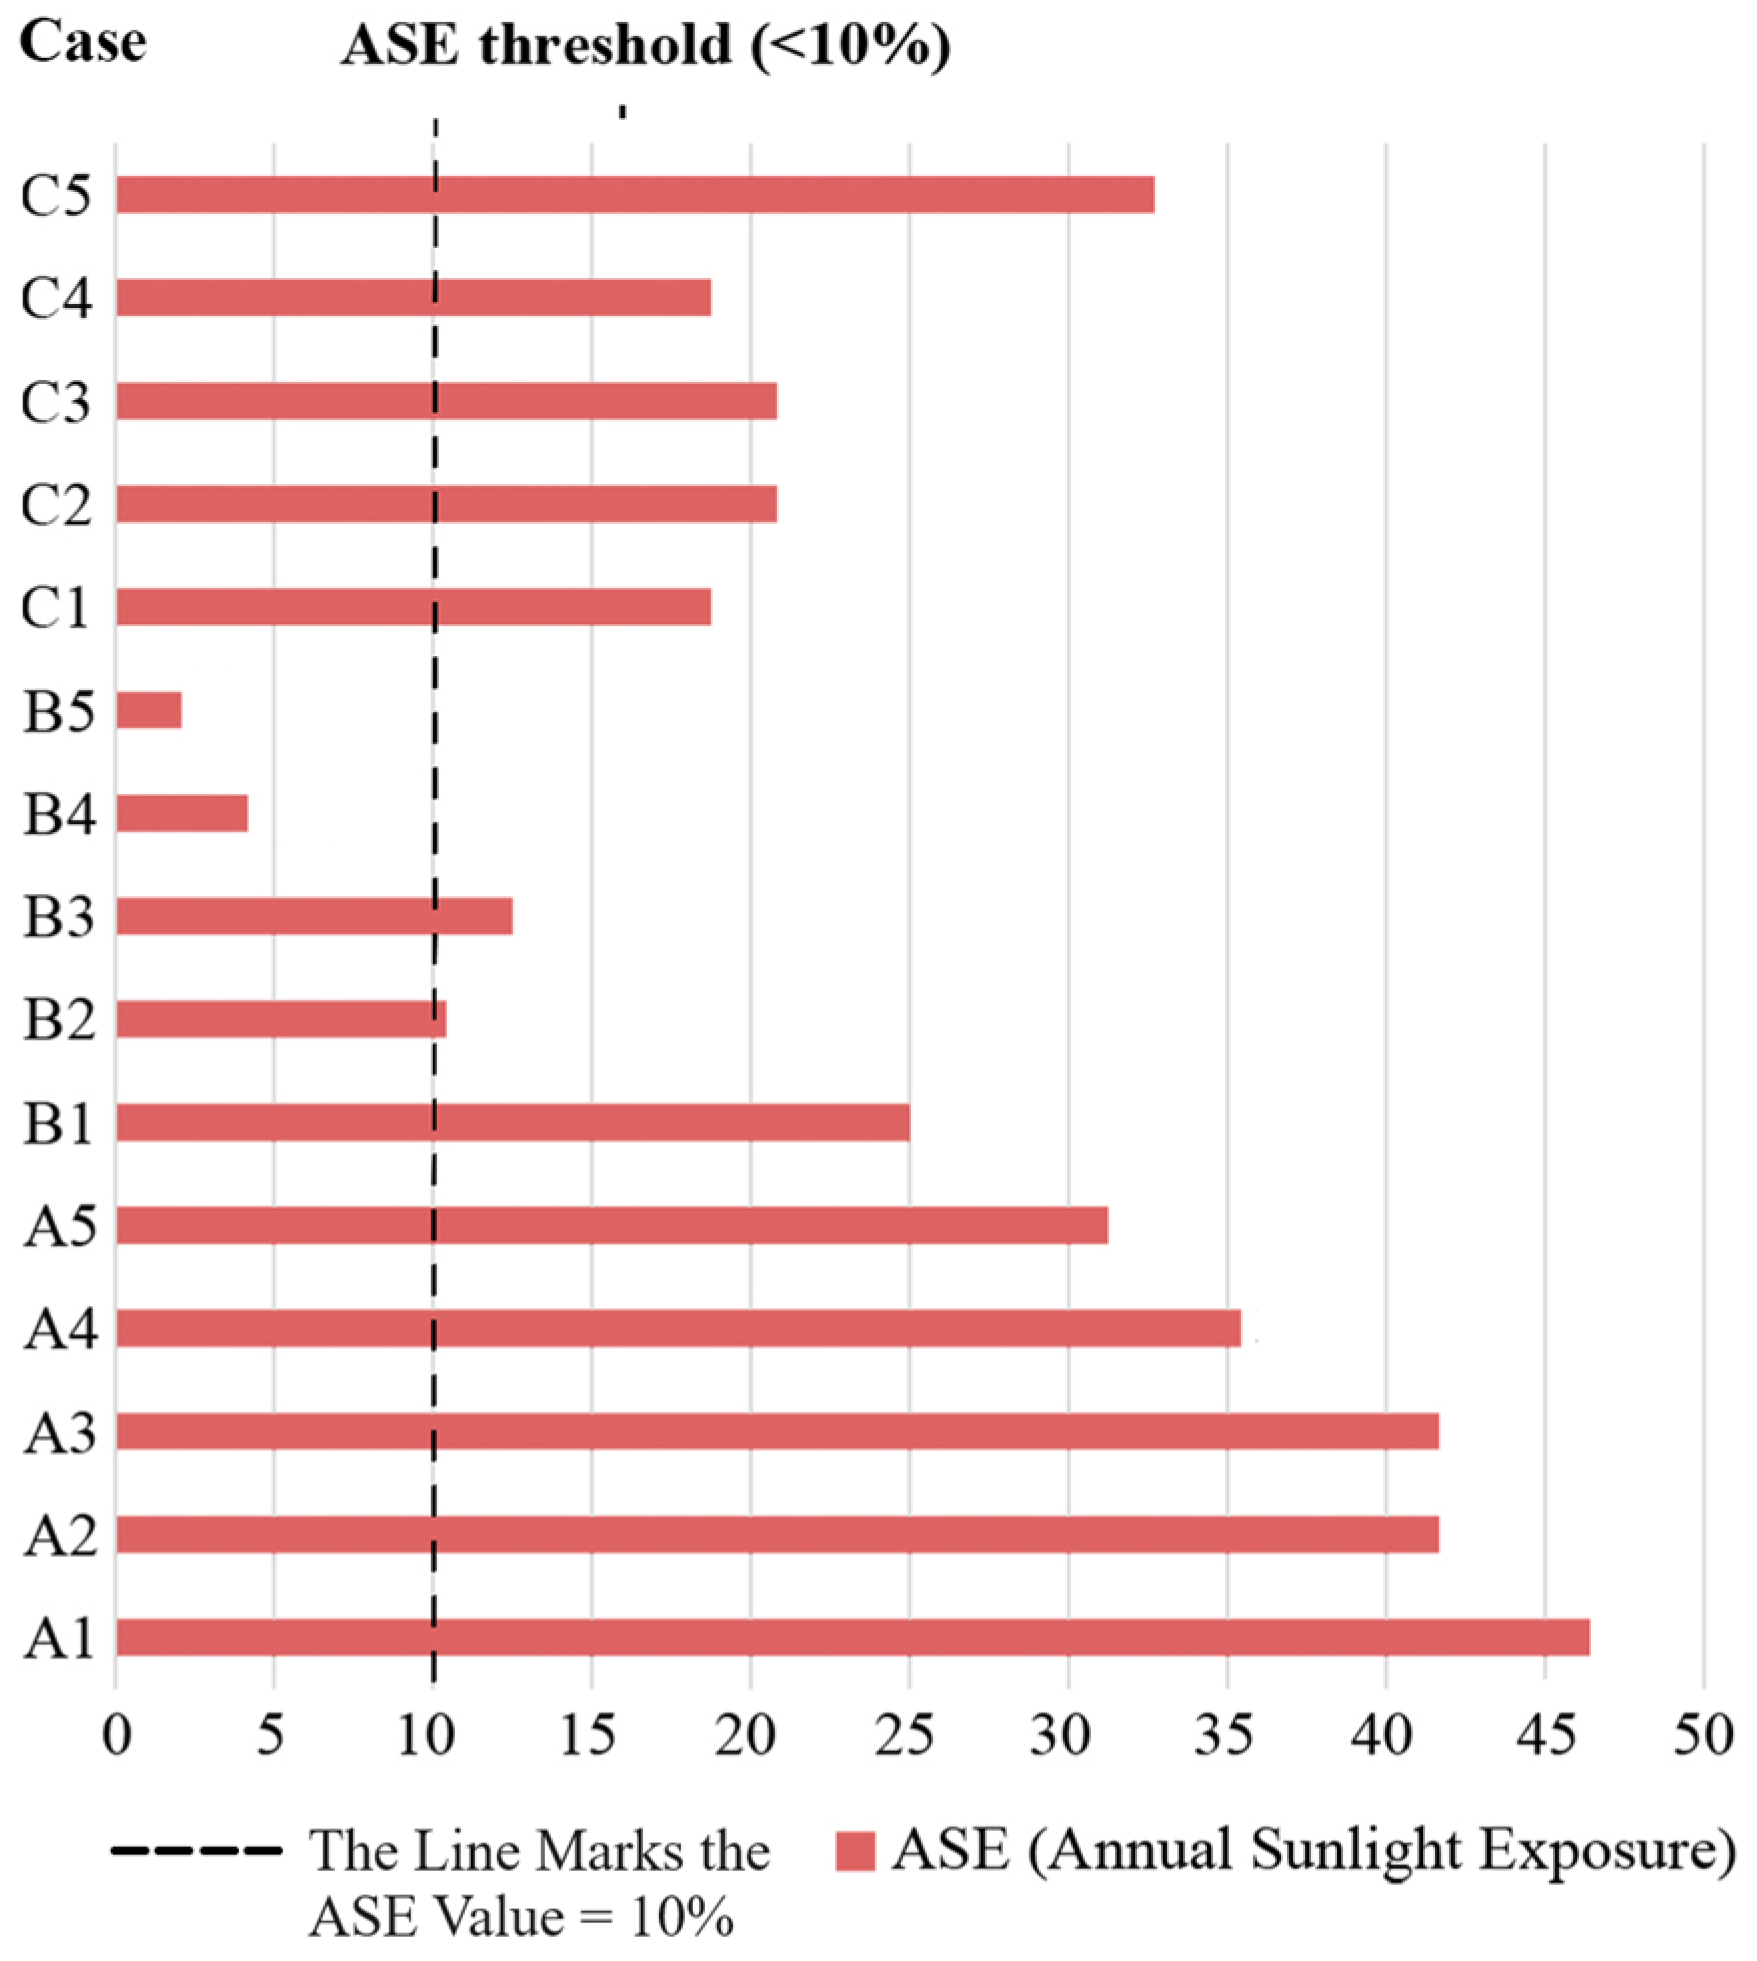
3.1. Compare Daylight Performance of Dynamic Shading Device System with Static Façades
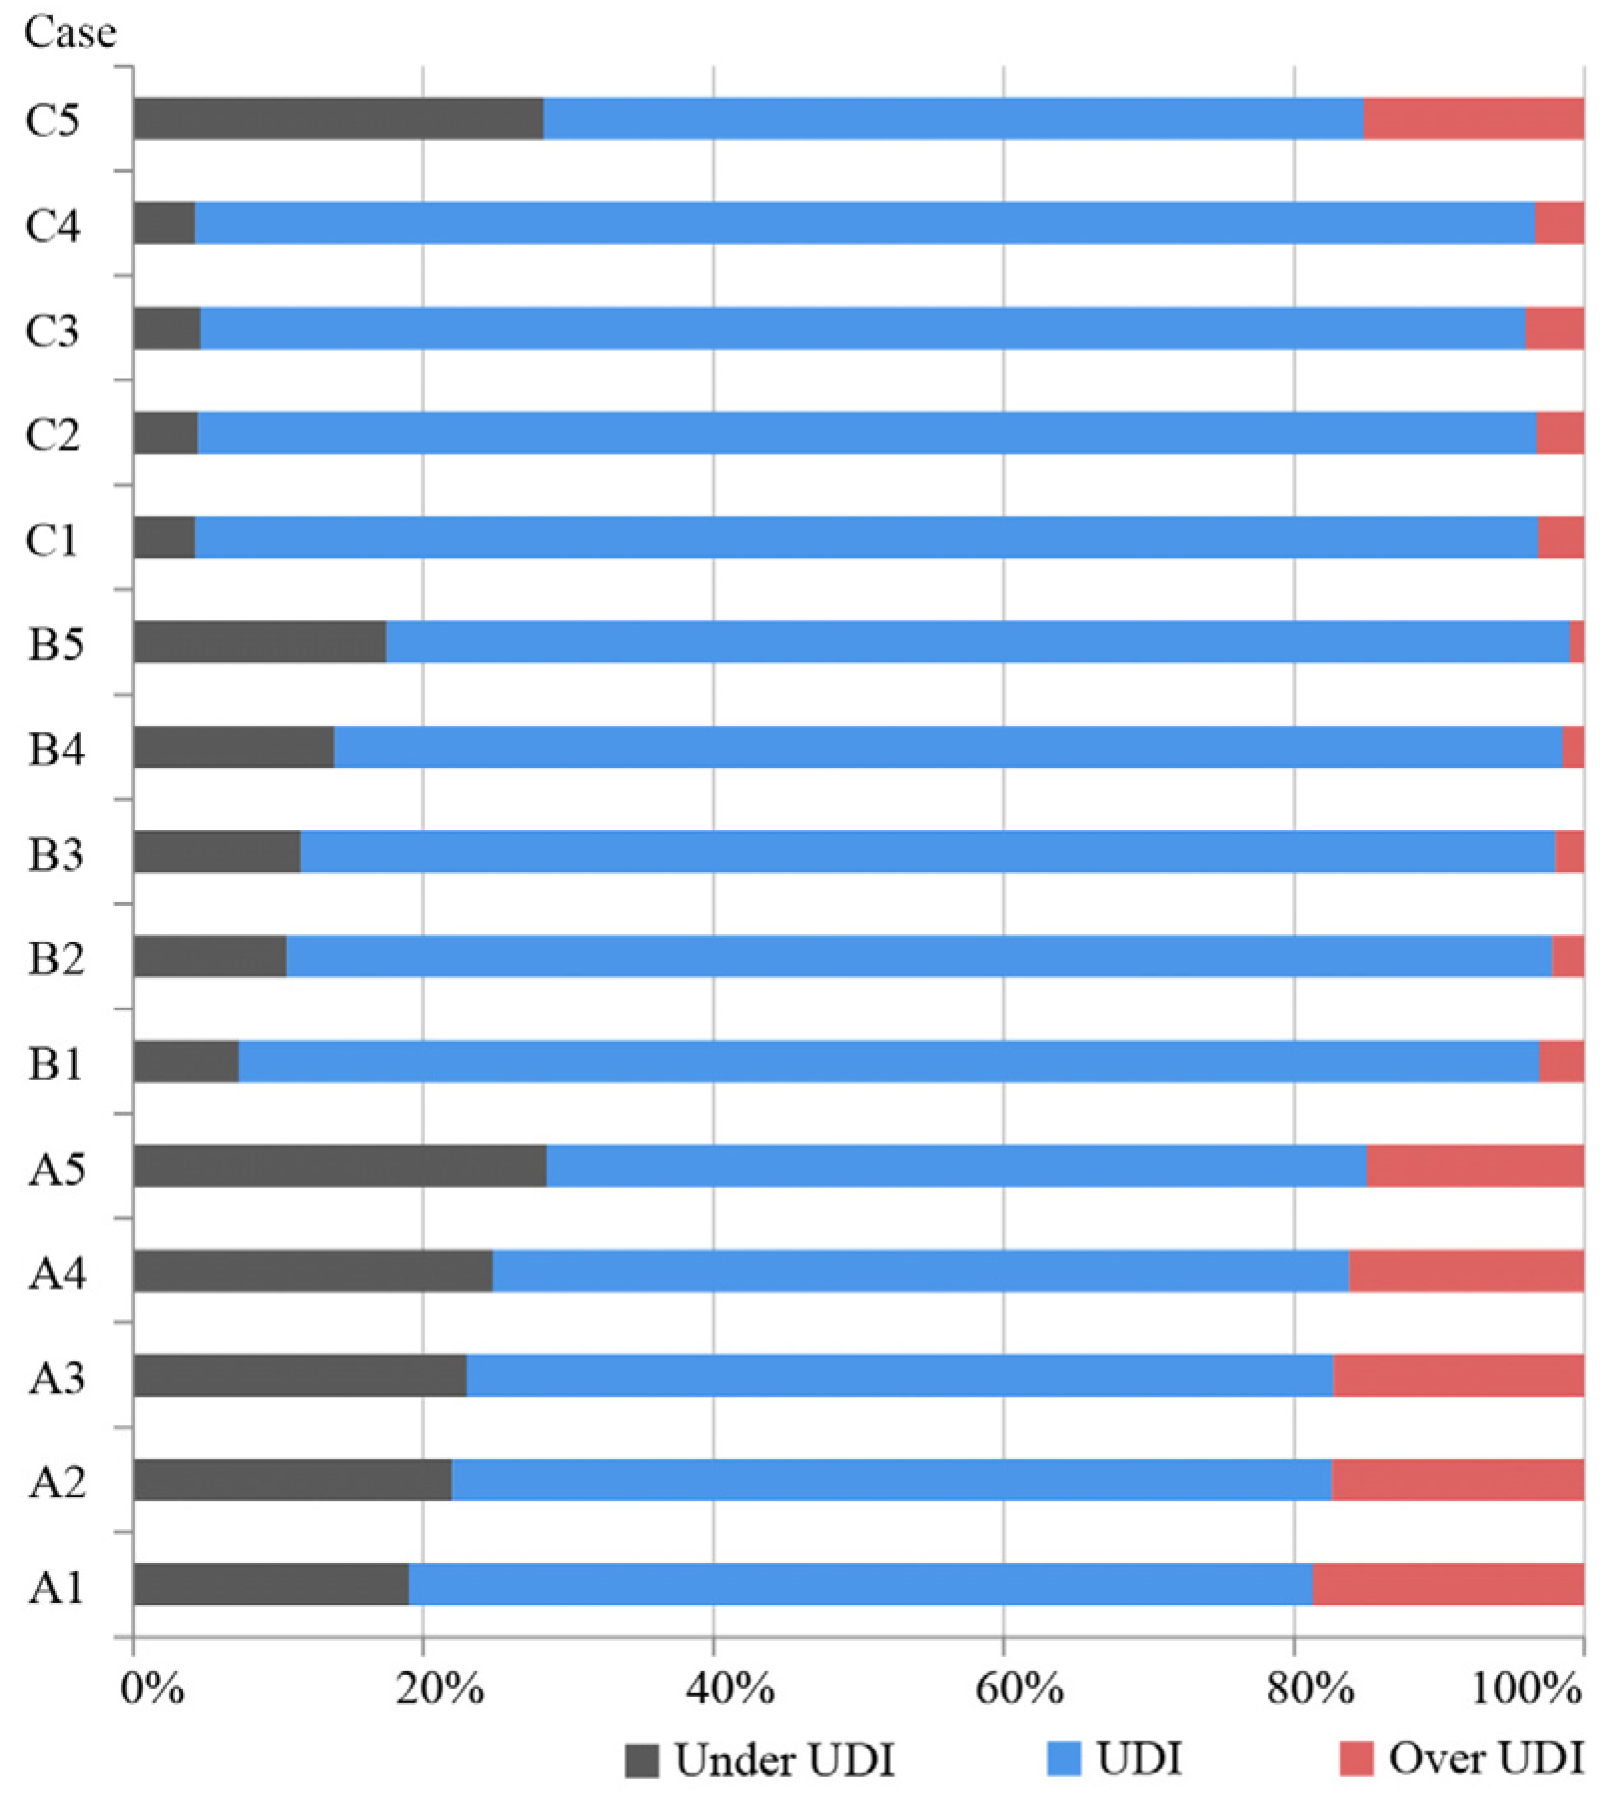
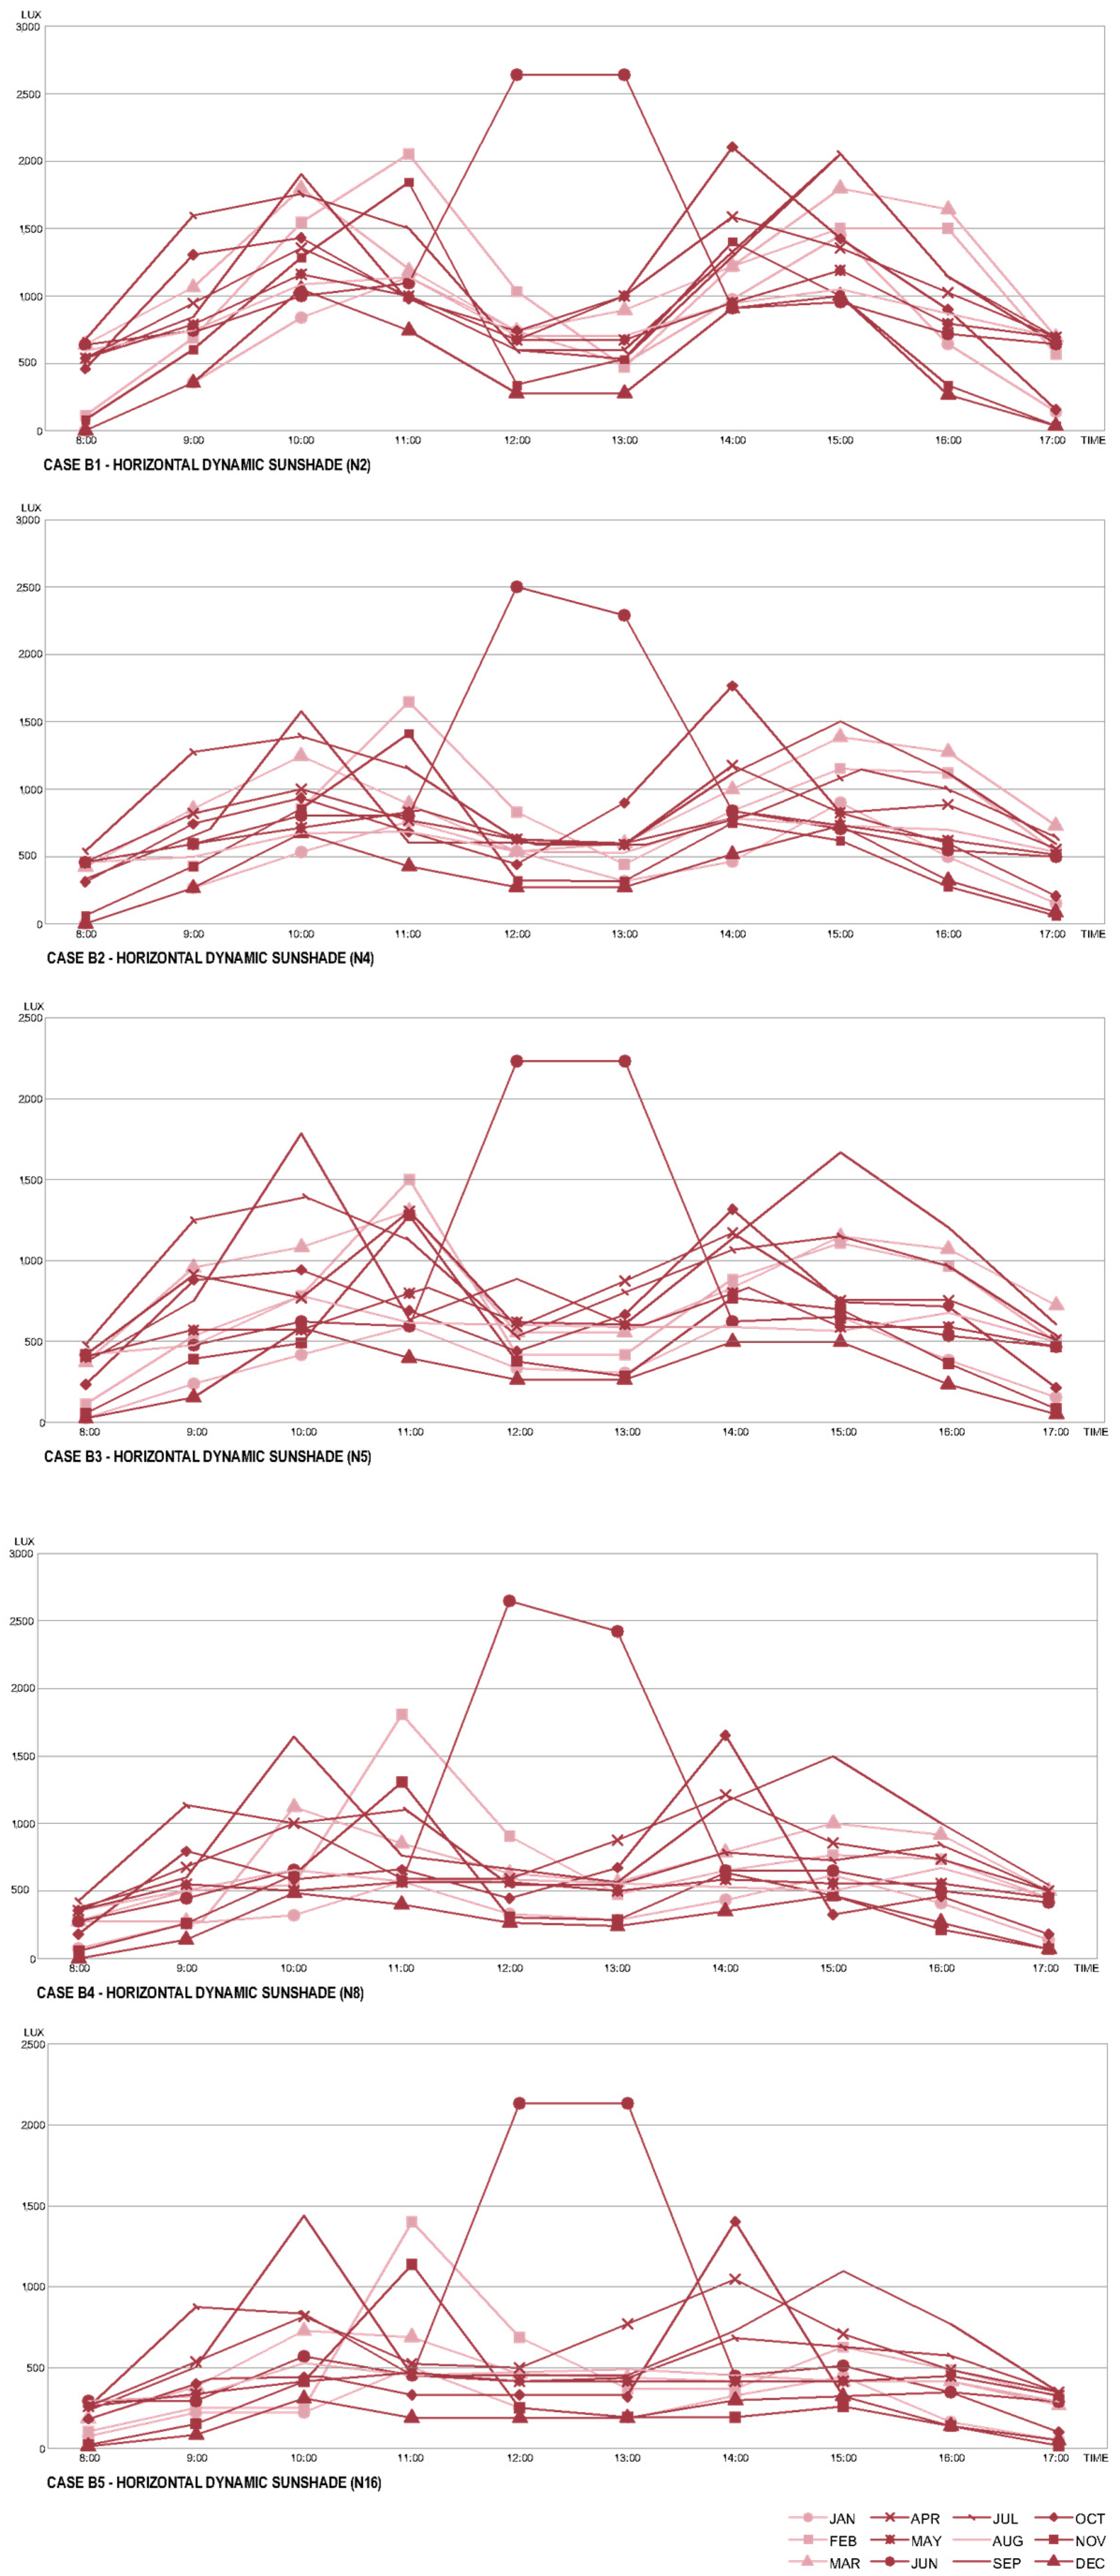
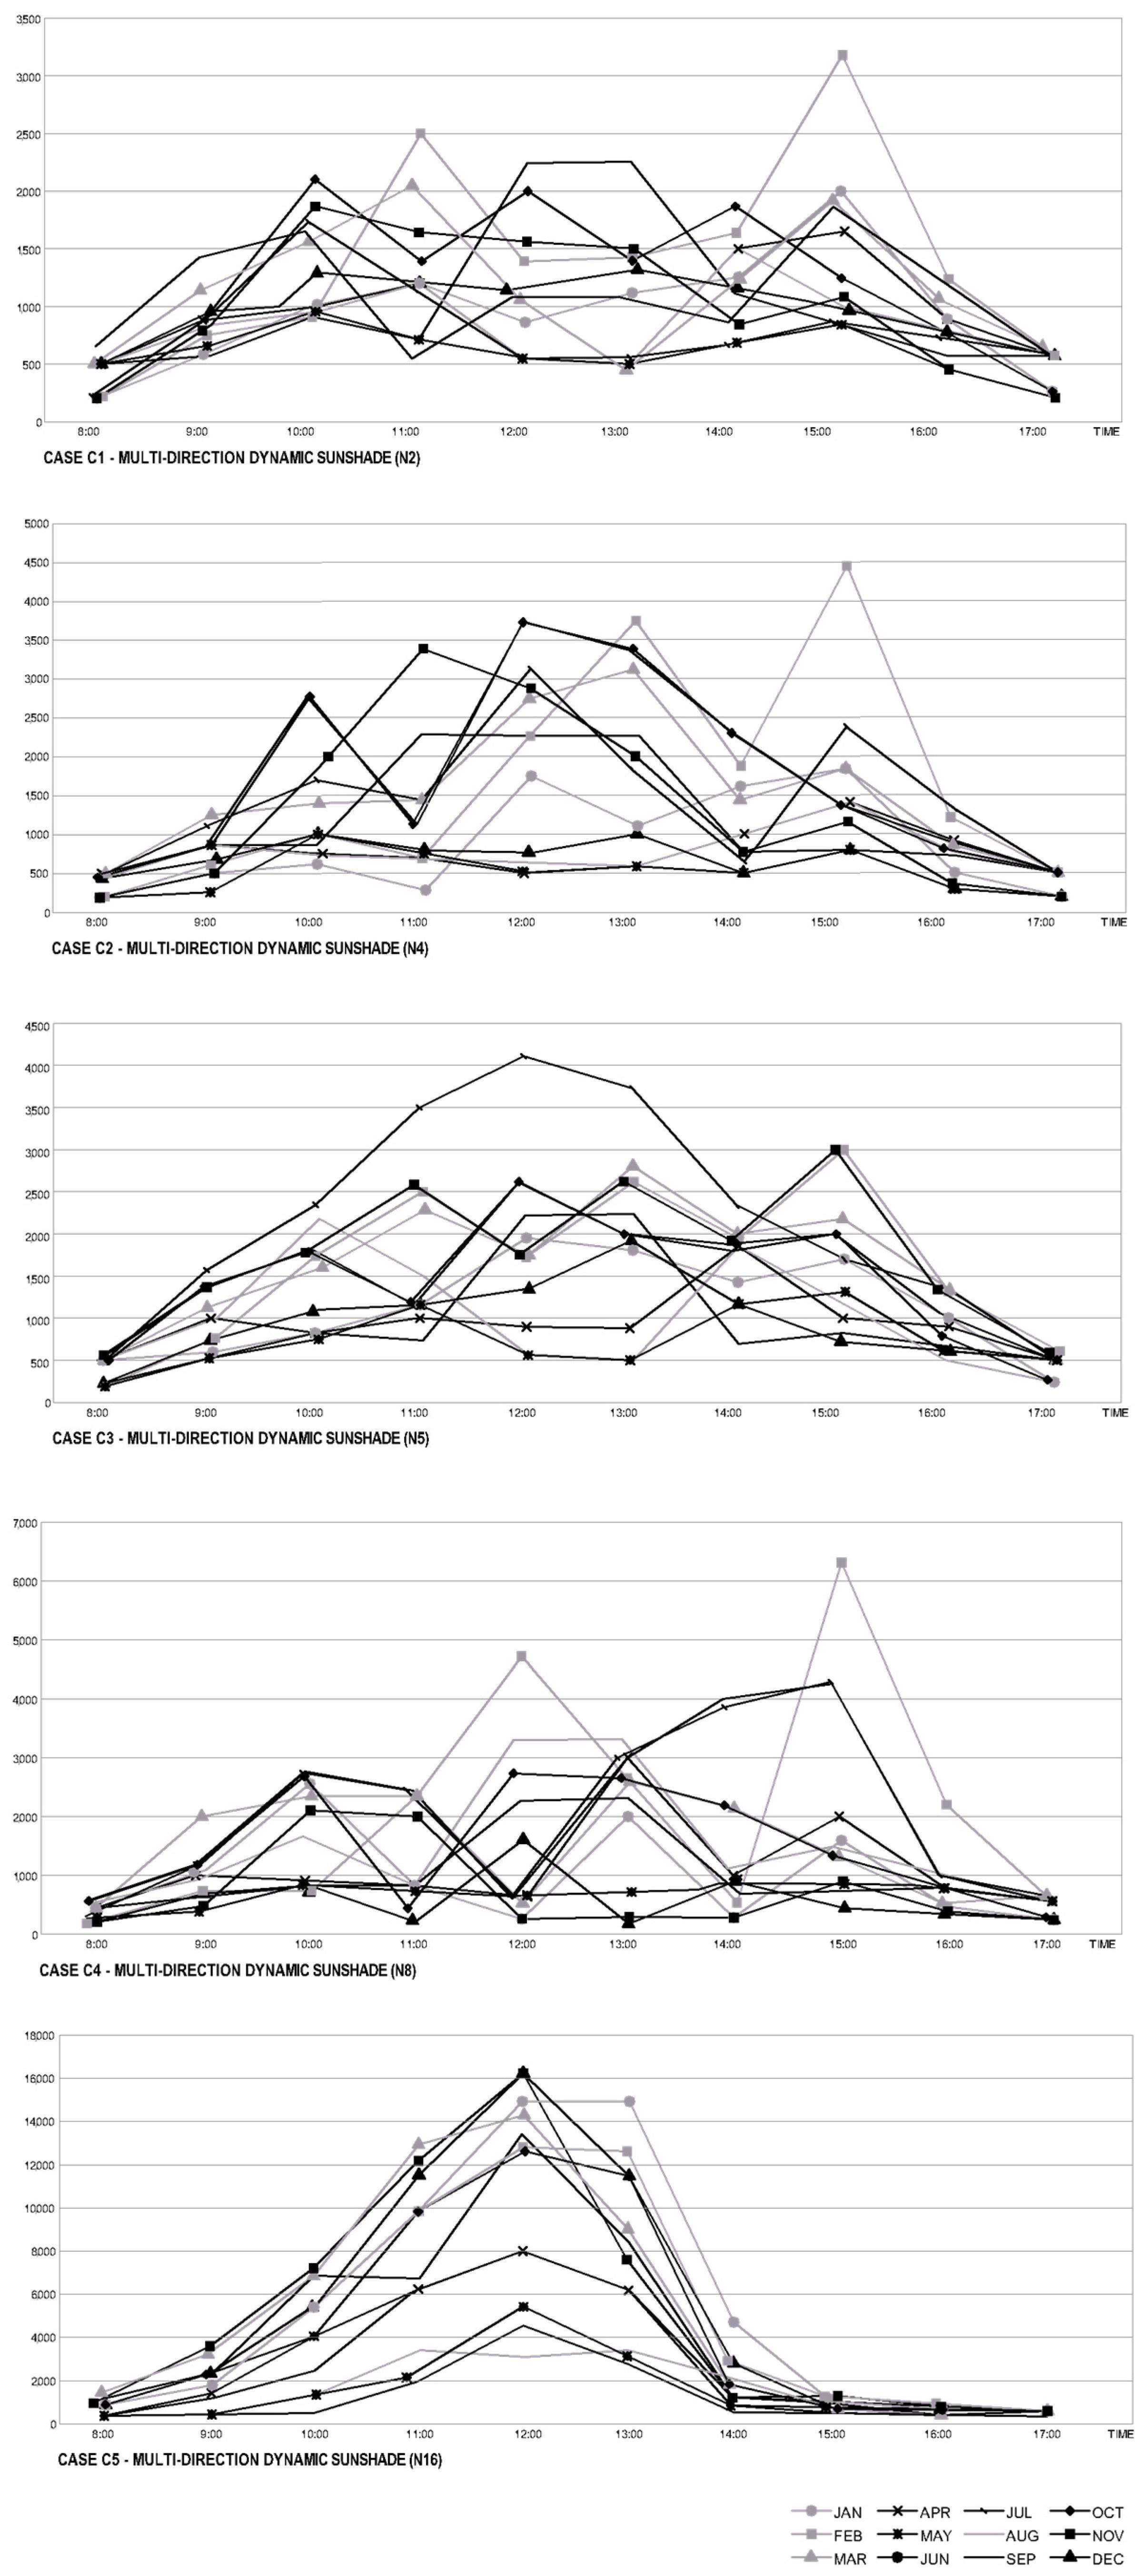
3.2. Compare Daylight Performance between Variations in Dynamic Shading Device Systems
3.3. Influences of Shading Device Configuration on Daylight Performance
3.3.1. Geometric Configuration
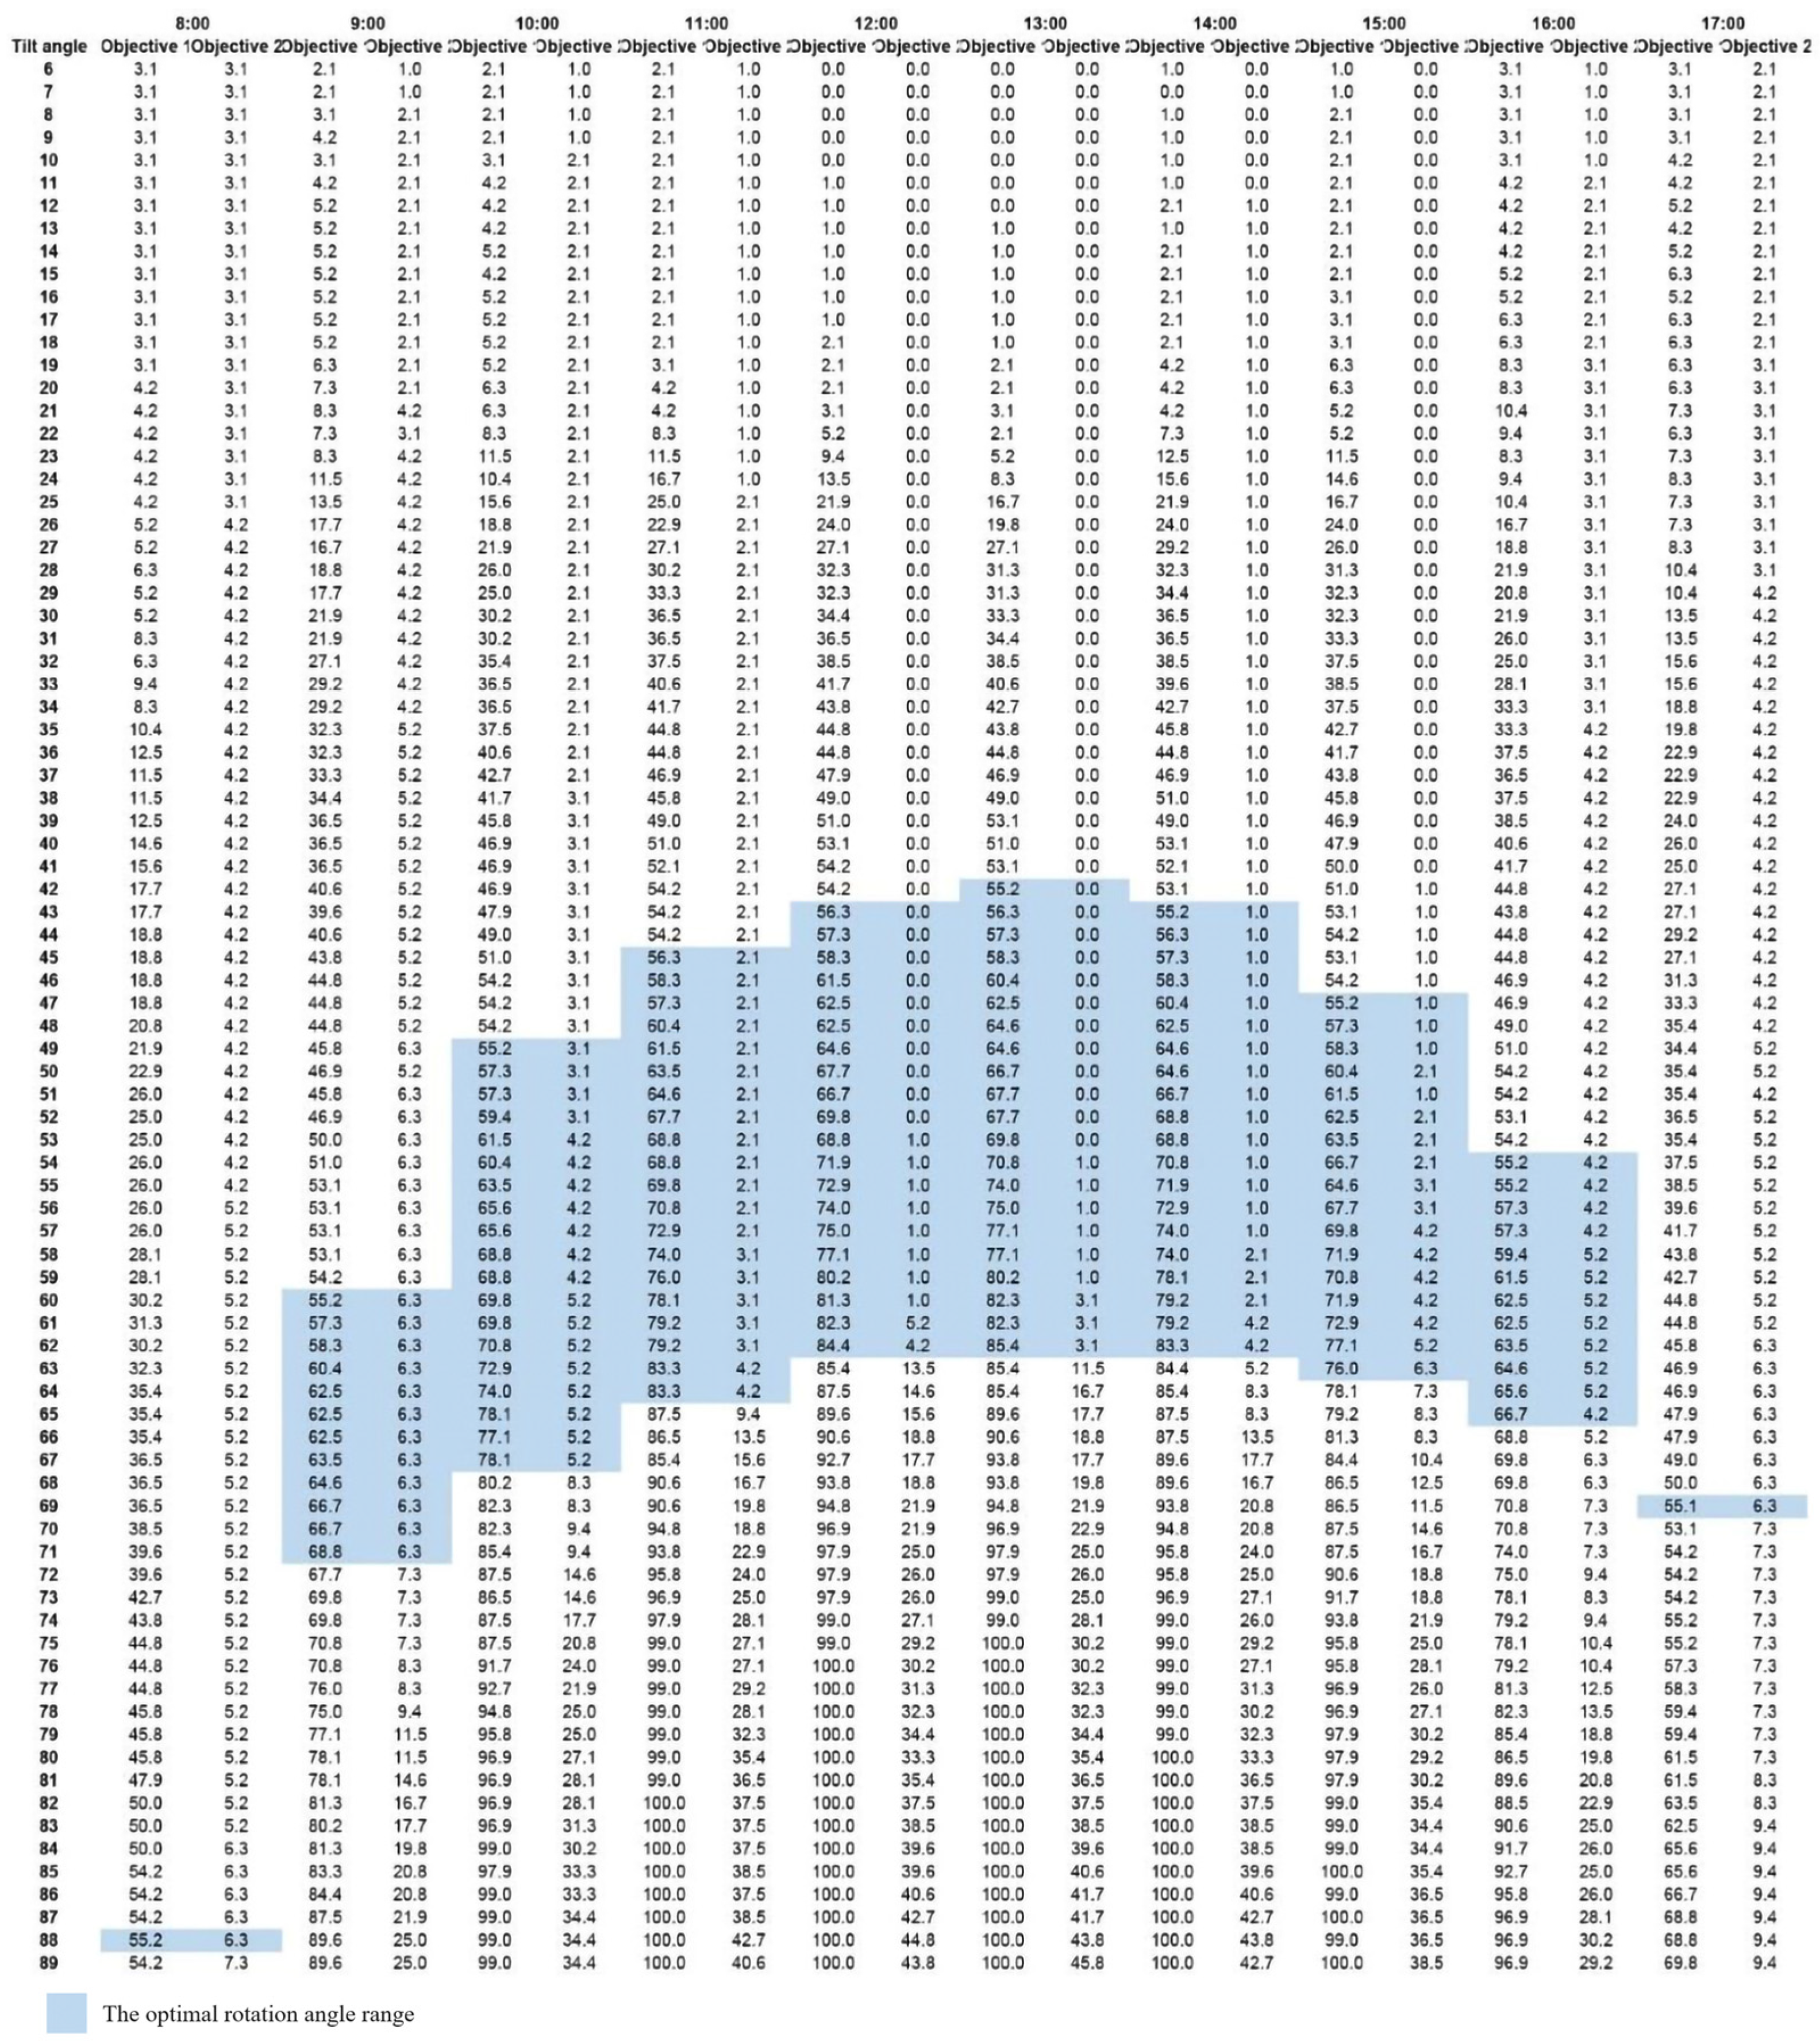
3.3.2. Rotation Angle of the Shading Panel
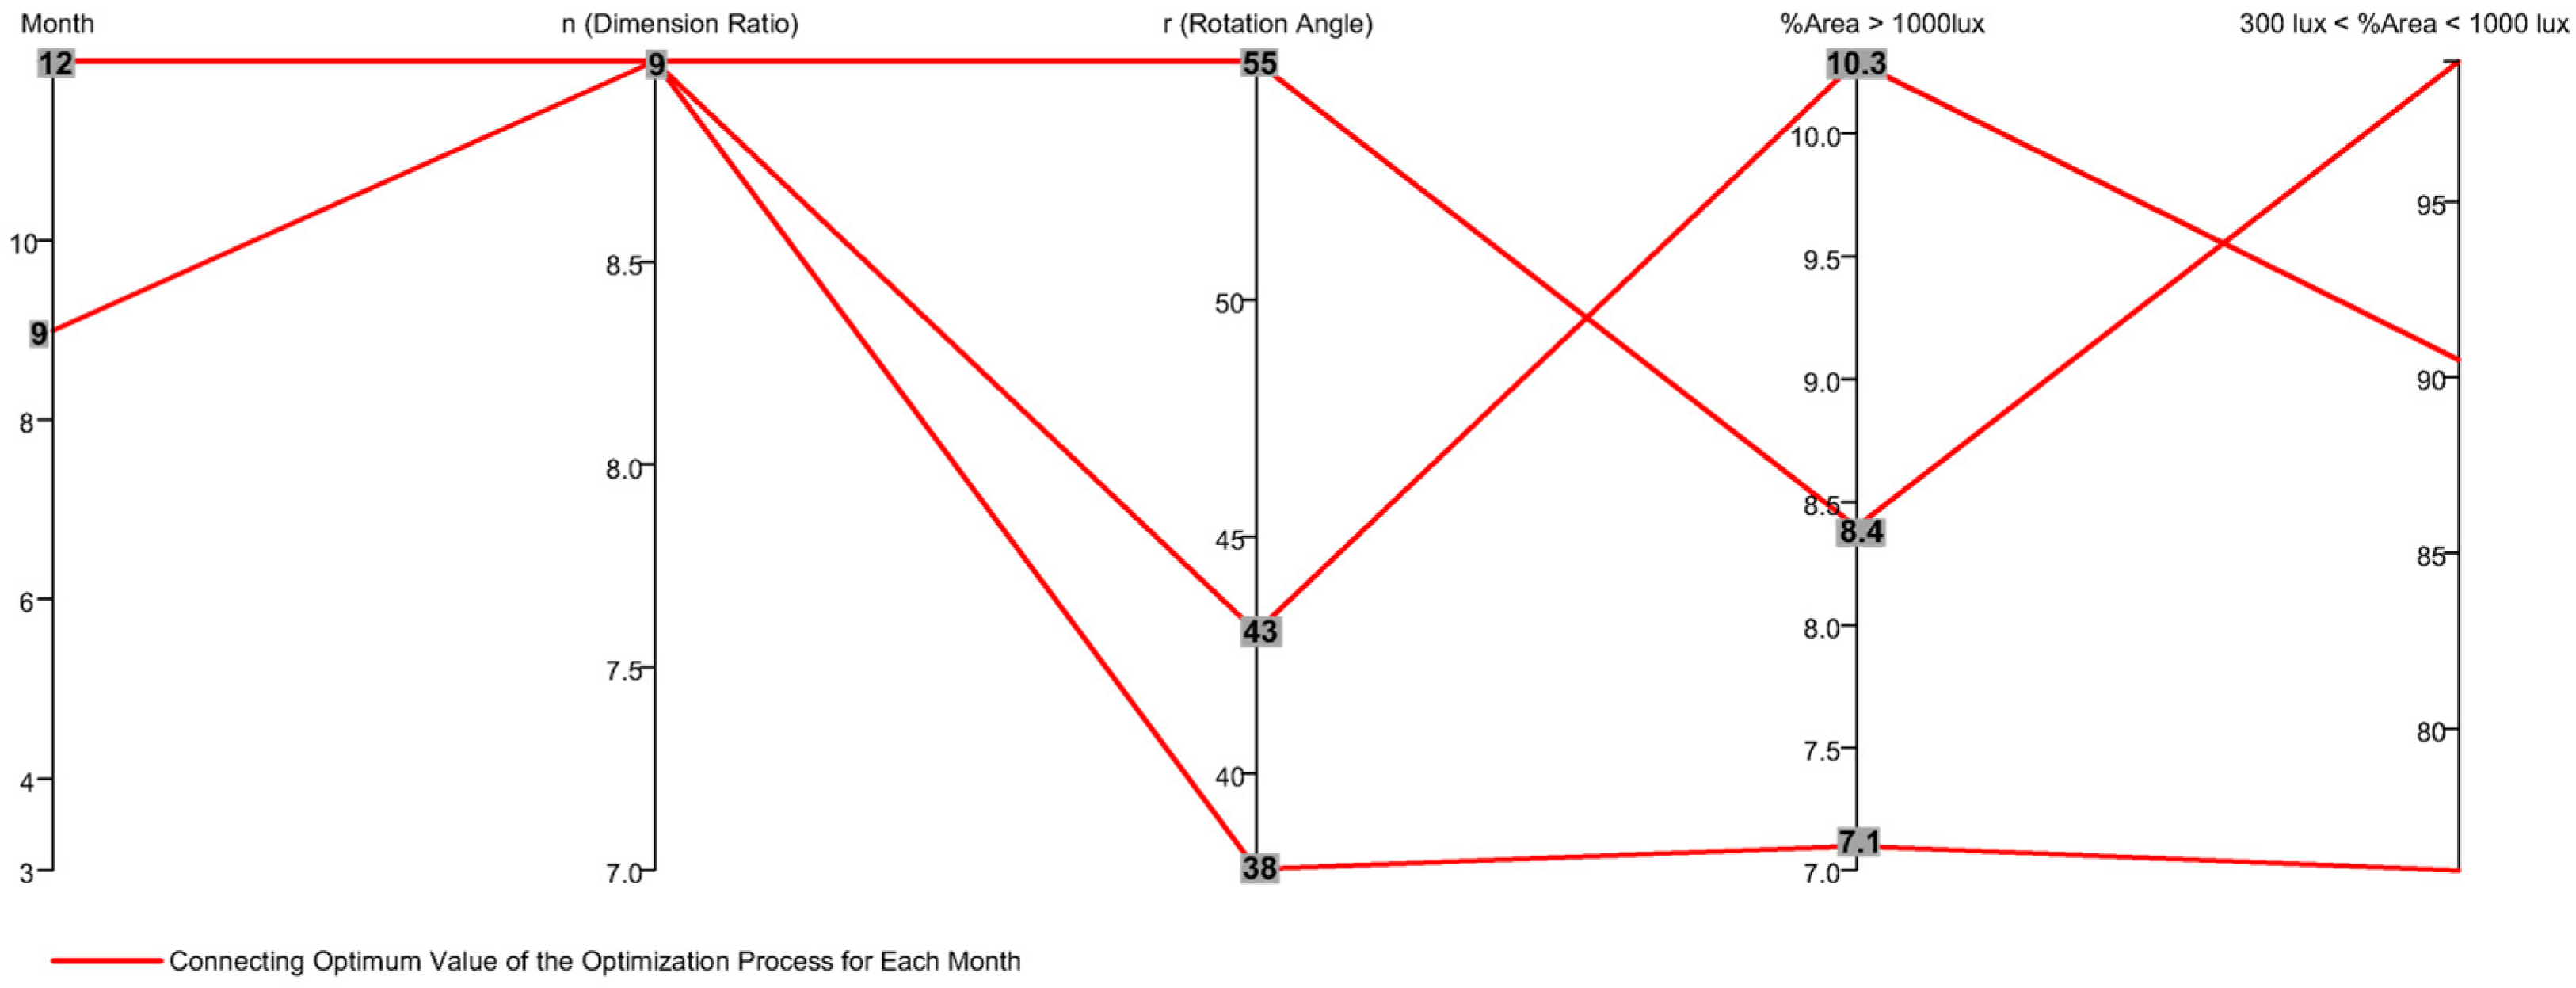
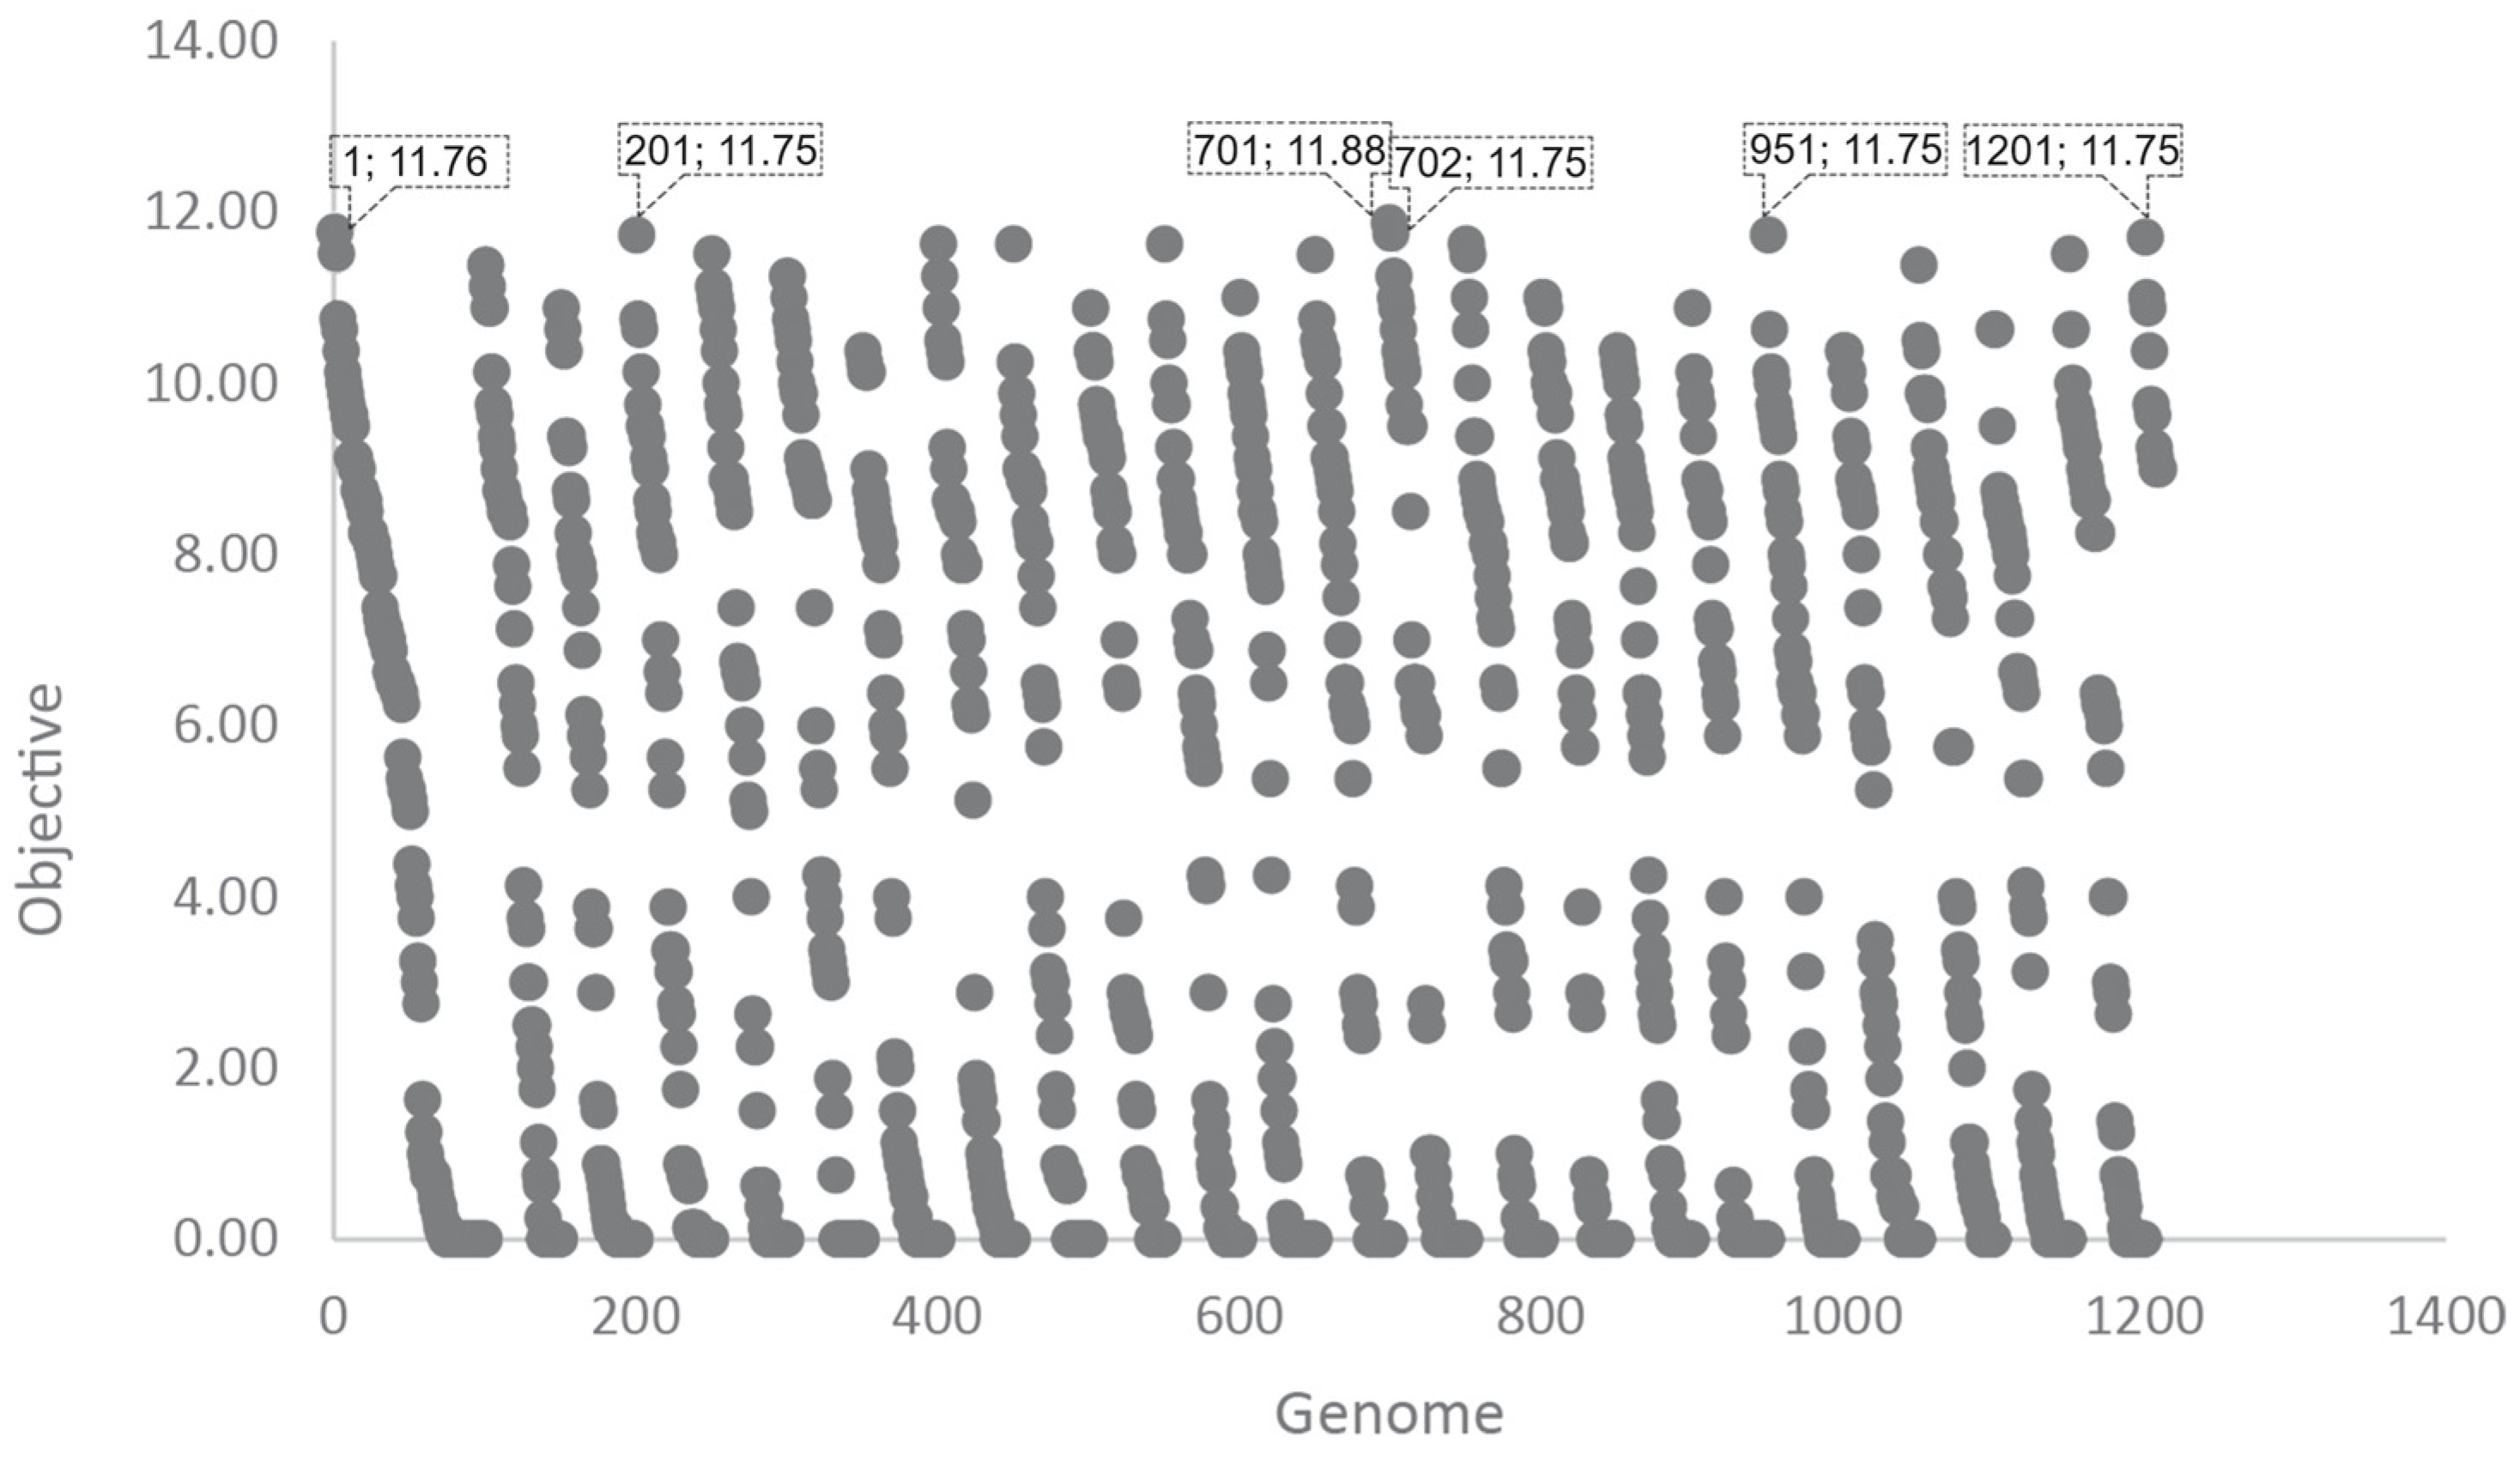
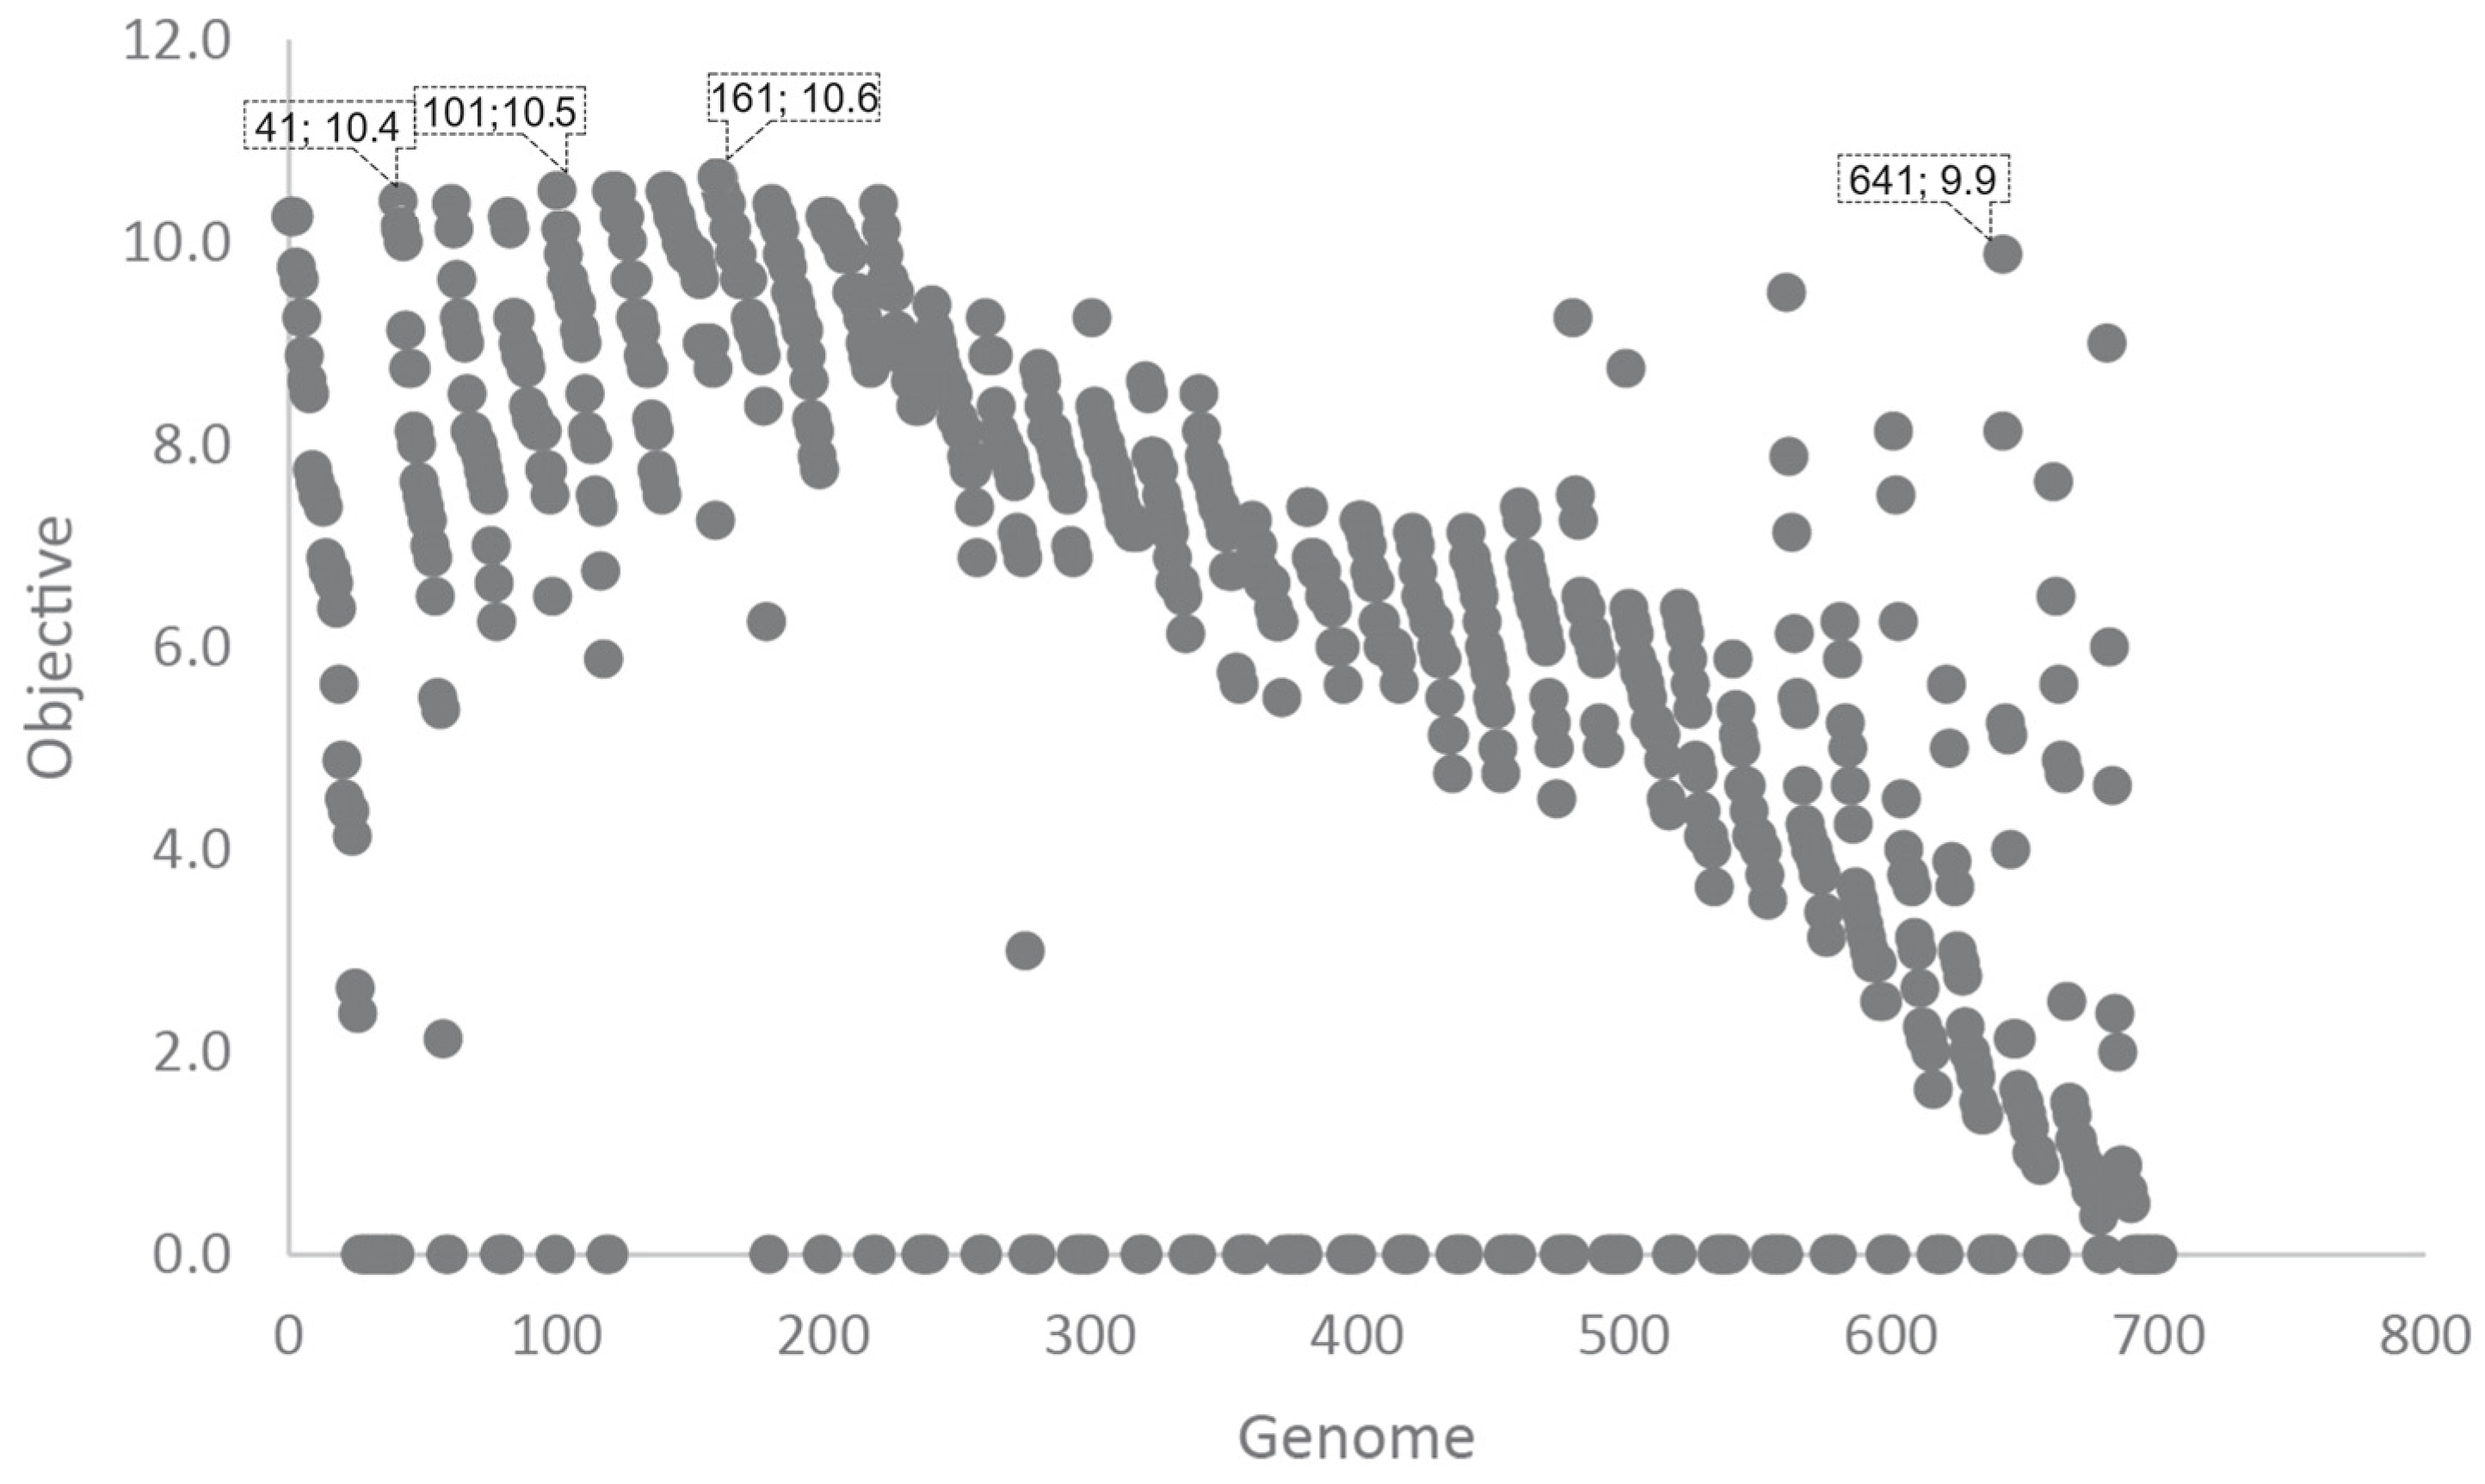
3.4. Outcomes from Optimization Processes
3.4.1. Optimizing Geometric Configuration for Horizontal Shading Device
3.4.2. Optimizing an Operational Scenario for Dynamic Shading Device System
4. Conclusions
4.1. Limitations
4.2. Future Research Opportunities
Author Contributions
Funding
Data Availability Statement
Conflicts of Interest
Appendix A


References
- Zuk, W.; Clark, R.H. Kinetic Architecture; Van Nostrand Reinhold: Washington, DC, USA, 1970. [Google Scholar]
- Moloney, J. A Framework for the Design of Kinetic Façades. Computer-Aided Architectural Design Futures (CAAD Futures) 2007; Springer: Dordrecht, The Netherlands, 2007; pp. 461–474. [Google Scholar] [CrossRef]
- Al-Masrani, S.M.; Al-Obaidi, K.M.; Zalin, N.A.; Isma, M.I.A. Design optimisation of solar shading systems for tropical office buildings: Challenges and future trends. Solar Energy 2018, 170, 849–872. [Google Scholar] [CrossRef]
- Tabadkani, A.; Roetzel, A.; Li, H.X.; Tsangrassoulis, A. Design approaches and typologies of adaptive facades: A review. Autom. Constr. 2021, 121, 103450. [Google Scholar] [CrossRef]
- Jayathissa, P.; Caranovic, S.; Hofer, J.; Nagy, Z.; Schlueter, A. Performative design environment for kinetic photovoltaic architecture. Autom. Constr. 2018, 93, 339–347. [Google Scholar] [CrossRef]
- Hosseini, S.M.; Mohammadi, M.; Guerra-Santin, O. Interactive kinetic façade: Improving visual comfort based on dynamic daylight and occupant’s positions by 2D and 3D shape changes. Build. Environ. 2019, 165, 106396. [Google Scholar] [CrossRef]
- Im, O.-K.; Kim, K.-H.; Amirazar, A.; Lim, C. A Unified Framework for Optimizing the Performance of a Kinetic Façade. In Proceedings of the Symposium on Simulation for Architecture and Urban Design, Atlanta, GA, USA, 7–9 April 2019; Society for Computer Simulation International: San Diego, CA, USA, 2019; pp. 32–39. [Google Scholar]
- Nakapan, W.; Pattanasirimongkol, A. Developing a kinetic façade towards a solar control façade design prototype. In Proceedings of the 4th RSU National and International Research Conference on Science and Technology, Social Sciences, and Humanities 2019 (RSUSSH 2019), Pathumthani, Thailand, 26 April 2019. [Google Scholar]
- Yoon, J. SMP Prototype Design and Fabrication for Thermo-responsive Façade Elements. J. Facade Des. Eng. 2019, 7, 41–62. [Google Scholar] [CrossRef]
- Hosseini, S.M.; Mohammadi, M.; Schröder, T.; Guerra-Santin, O. Integrating interactive kinetic façade design with colored glass to improve daylight performance based on occupants’ position. J. Build. Eng. 2020, 31, 101404. [Google Scholar] [CrossRef]
- Karaseva, L.V.; Cherchaga, O.A. Conceptual Designs of Kinetic Facade Systems. IOP Conf. Ser. Mater. Sci. Eng. 2021, 1079, 042053. [Google Scholar] [CrossRef]
- Hosseini, S.M.; Fadli, F.; Mohammadi, M. Biomimetic Kinetic Shading Facade Inspired by Tree Morphology for Improving Occupant’s Daylight Performance. J. Daylighting 2021, 8, 65–85. [Google Scholar] [CrossRef]
- Kim, J.-H.; Han, S.-H. Indoor Daylight Performances of Optimized Transmittances with Electrochromic-Applied Kinetic Louvers. Buildings 2022, 12, 263. [Google Scholar] [CrossRef]
- Khidmat, R.P.; Fukuda, H.; Kustiani Paramita, B.; Qingsong, M.; Hariyadi, A. Investigation into the daylight performance of expanded-metal shading through parametric design and multi-objective optimisation in Japan. J. Build. Eng. 2022, 51, 104241. [Google Scholar] [CrossRef]
- Chandrasekaran, C.; Sasidhar, K.; Madhumathi, A. Energy-efficient retrofitting with exterior shading device in hot and humid climate—Case studies from fully glazed multi-storied office buildings in Chennai, India. J. Asian Archit. Build. Eng. 2022, 22, 2209–2223. [Google Scholar] [CrossRef]
- Sankaewthong, S.; Horanont, T.; Miyata, K.; Karnjana, J.; Busayarat, C.; Xie, H. Using a Biomimicry Approach in the Design of a Kinetic Façade to Regulate the Amount of Daylight Entering a Working Space. Buildings 2022, 12, 2089. [Google Scholar] [CrossRef]
- Hosseini, S.M.; Heidari, S. General morphological analysis of Orosi windows and morpho butterfly wing’s principles for improving occupant’s daylight performance through interactive kinetic façade. J. Build. Eng. 2022, 59, 105027. [Google Scholar] [CrossRef]
- Sadegh, S.O.; Gasparri, E.; Brambilla, A.; Globa, A. Kinetic facades: An evolutionary-based performance evaluation framework. J. Build. Eng. 2022, 53, 104408. [Google Scholar] [CrossRef]
- Sanakaewthong, S.; Miyata, K.; Horanont, T.; Xie, H.; Karnjana, J. Kinetic Façade Design with Eshelby Twist for Sunlight Exposure Reduction. In Proceedings of the 2022 International Conference on Cyberworlds (CW), Kanazawa, Japan, 27–29 September 2022; pp. 8–15. [Google Scholar] [CrossRef]
- Sangtarash, F.; Fayaz, R.; Nikghadam, N.; Matini, M.R. Optimal window area of a kinetic facade to provide daylight in an office building in Tehran. Space Ontol. Int. J. 2022, 11, 61–75. [Google Scholar] [CrossRef]
- Rafati, N.; Hazbei, M.; Eicker, U. Louver configuration comparison in three Canadian cities utilizing NSGA-II. Build. Environ. 2023, 229, 109939. [Google Scholar] [CrossRef]
- Kahramanoğlu, B.; Çakıcı Alp, N. Enhancing visual comfort with Miura-ori-based responsive facade model. J. Build. Eng. 2023, 69, 106241. [Google Scholar] [CrossRef]
- Choi, H.S. Kinetic Photovoltaic Facade System Based on a Parametric Design for Application in Signal Box Buildings in Switzerland. Appl. Sci. 2023, 13, 4633. [Google Scholar] [CrossRef]
- Reinhart, C.F. Daylighting Handbook. II, Daylight Simulations, Dynamic Facades; Stein, R., Ed.; Building Technology Press: Cambridge, MA, USA, 2018. [Google Scholar]
- Field, K.; Deru, M.; Studer, D. Using DOE Commercial Reference Buildings for Simulation Studies. In SimBuild 2010; National Renewable Energy Laboratory: New York, NY, USA, 2010. Available online: https://www.osti.gov/servlets/purl/988604 (accessed on 4 May 2023).
- Naderi, E.; Sajadi, B.; Behabadi, M.A.A.; Naderi, E. Multi-objective simulation-based optimization of controlled blind specifications to reduce energy consumption, and thermal and visual discomfort: Case studies in Iran. Build. Environ. 2020, 169, 106570. [Google Scholar] [CrossRef]
- Reinhart, C. Opinion: Climate-based daylighting metrics in LEEDv4—A fragile progress. Light Res. 2015, 47, 388. [Google Scholar] [CrossRef]
- Elghazi, Y.; Wagdy, A.; Abdalwahab, S. Simulation-driven design for the kinetic system; optimise kaledocycle facade configuration for daylighting adequacy in hot arid climates. In Proceedings of the 14th Conference of International Building Performance Simulation Association, Hyderabad, India, 7–9 December 2015; pp. 182–189. [Google Scholar] [CrossRef]


| Cite No. | Author | Researched Shading Devices |
|---|---|---|
| [5] | Jayathissa, P et al., (2018) | Adaptive solar façade |
| [6] | Hosseini, S. M., Mohammadi, M., & Guerra-Santin, O. (2019) | 2D and 3D rectangle transformation module façade SD |
| [7] | Im et al., (2019) | Oculi kinetic façade system |
| [8] | Nakapan, W., & Pattanasirimongkol, A. (2019) | Kinetic façade made of vertical aluminum fins |
| [9] | Yoon, J. (2019) | Kinetic SMP applications in circular cell-type shading devices with five different morphologies |
| [10] | Hosseini et al., (2020) | Integration of interactive kinetic façade with colored glass |
| [11] | Karaseva, L. V., & Cherchaga, O. A. (2021) | Mashrabiya-inspired façade module component |
| [12] | Hosseini, S. M., Fadli, F., & Mohammadi, M. (2021) | Vertical and horizontal louvres |
| [13] | Kim, J.-H., & Han, S.-H. (2022) | Multilayered and complex kinetic façade form inspired by dense mass and curvature intersected vectors |
| [14] | Khidmat et al., (2022) | Horizontal louver with rotatable right and left edges |
| [15] | Chandrasekaran, C., Sasidhar, K., & Madhumathi, A. (2022) | Electrochromic-applied kinetic louvers |
| [16] | Sankaewthong et al., (2022) | Expanded-metal shading |
| [17] | Hosseini, S.M., & Heidari, S. (2022) | Fixed and dynamic vertical-folding SD |
| [18] | Sadegh et al., (2022) | SD module merging physical DNA and phototropism behavior, compared with vertical static louvre and vertical rotating louvre |
| [19] | Sanakaewthong et al., (2022) | Kinetic façade of hexagonal modular shapes in grid forms |
| [20] | Sangtarash et al., (2022) | Triangular module and triangular grid SD |
| [21] | Rafati, N., Hazbei, M., Eicker, U. (2023) | Louver |
| [22] | Kahramanoğlu, B., & Çakıcı Alp, N. (2023) | Miura-ori-based responsive façade |
| [23] | Choi, H. S (2023) | Hexagon cell module components |
| Internal Surface and Window Parameter | |
|---|---|
| Walls | Reflectance = 50% |
| Ceiling | Reflectance = 80% |
| Floor | Reflectance = 20% |
| Shading device | Reflectance = Metal diffuses |
| Glazing | VT = 95% |
| Panel Type | Size | a (m) | b (m) | d (m) | n | r (°) |
|---|---|---|---|---|---|---|
Vertical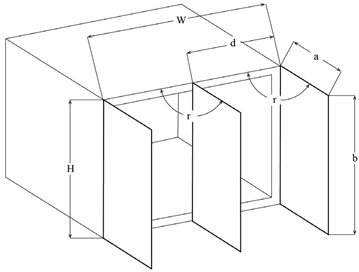 | Min | 0.2 | 20 | 0 | ||
| Default | W */n | 5 | 90 | |||
| Max | 2 | 4 | a | 2 | 180 | |
Horizontal | Min | 0.2 | 20 | 0 | ||
| Default | H */n | 5 | 90 | |||
| Max | 2 | 4 | a | 2 | 180 | |
Multi-direction | Min | 0.2 | 20 | 0 | ||
| Default | H */n | 5 | 45 | |||
| Max | 2 | 4 | 1 | 90 |
| Ambient Bounces (-ab) | Ambient Accuracy (-aa) | Ambient Divisions (-ad) | Ambient Super Samples (-as) | Ambient Resolution (-ar) |
|---|---|---|---|---|
| 4 | 0.10 | 1500 | 1024 | 100 |
| Cite No. | Objectives | Tools * | Simulation Time |
|---|---|---|---|
| [5] | Presents a practical PDE for the design and fabrication of kinetic architectural elements | R, G, L, Python, and experiment | All working hours/year |
| [6] | Compare daylighting and visual comfort performance of the two SD types | R, G, D | 9:00, 12:00, 15:00 of 21st of Mar, Jun, and Dec |
| [7] | Investigated the integration process using the normalization method to find an optimal rotational angle of oculi at the given time | R, G, D, Energy Plus | 9:00, 12:00, 15:00 of 21st of Mar, Jun, Sep and Dec |
| [8] | Investigate the possibility of a kinetic system made of vertical aluminum fins | R G, D (Simulation), Arduino (Experiment) | 21st of Mar, Jun, Sep, and Dec |
| [9] | Summarize the coordination process of SMP material programming, design, and fabrication, and analyze the performance of the proposed prototypes | R, G, Cubicreator, and Kangaroo | 6:00–18:00 of May 1st and Sep 30th |
| [10] | Investigate the integration of colored glass from Orosi with interactive kinetic façade triggered by sun timing and occupant’s positions | R, G, D | 9:00, 12:00, 15:00 of 21st of Mar, Jun, and Dec |
| [11] | Identify the best size/rotation angle by fulfilling both LEED V4.1 daylighting requirements and the DA | R, G, D | 8:00–16:00 of 21st of Mar, Jun, Sep, and Dec |
| [12] | Proposes a direction-adjusted kinetic façade design combined with horizontal fins on the south and vertical fins on the west-facing façade | not mentioned | 9:00–15:00 of August 14th |
| [13] | Proposes an SD system to enhance occupants’ daylight performance by providing adjustable daylighting strategies through complex forms and movements | R, G, D | 9:00, 12:00, 15:00 of 21st of Mar, Jun, and Dec |
| [14] | A novel method for considering the occupant’s position for designing an adaptive façade towards visual and thermal comfort | R, G, H, L | 10:00, 13:00, 16:00 of 21st of Mar, Jun, and Dec |
| [15] | Propose and analyze a louver-type electrochromic façade that can create a uniform indoor illuminance | R, G | 9:00 and 15:00 of Mar 20th |
| [16] | Investigate daylight performance of the expanded-metal shading depicting the sky conditions in Kitakyushu, Japan | R, G, D | 12:00 of Dec 21st |
| [17] | Evaluate the potential energy savings, visual comfort, and economics of the proposed SDs for successful decision-making at the early design stage of retrofitting fully glazed office buildings | Revit-Insight, E-Quest, Dynamo | 9:00 and 15:00 of Mar 21st and Sep 22nd |
| [18] | Investigate suitable façade forms (form-finding) that are effective in providing an appropriate interior environment with natural light using science | R, G, Climate Studio, Wallacei | 8:00–18:00 |
| [19] | Investigate the integration of colored glass from Orosi with an interactive kinetic façade triggered by sun timing and the occupant’s positions | R, G, H, L, Design Explorer, GMA | 9:00, 12:00, 15:00 of 21st of Mar, Jun, and Dec |
| [20] | Propose an integrated, systematic framework that supports kinetic façades’ performance design and decision-making from the projects’ early design stages | MOEA, NSGAII, PAES | Not mentioned |
| [21] | Evaluate EUI and UDI for the best louver configuration scenario for three Canadian cities | R, G, NSGA-II | 9:00–17:00 |
| [22] | Find the optimal level of the window area with a squared geometry rotational kinematic model with a horizontal axis in the south façade of an office building in Tehran | R, G, H, L | 8:00–16:00 of 21st of Mar, Jun, and Dec |
| [23] | Model and simulate a responsive façade incorporating Miura-ori techniques to enhance visual comfort for building occupants by considering their location and environmental conditions | R, G, H, Energy Plus, D, BCMO | 9:00, 12:00, 15:00 of 21st of Mar, Jun, and Dec |
| [26] | Utilizes an EnergyPlus-based optimization approach to optimize the specifications and control parameters of smart shading blinds, resulting in significant reductions in building energy consumption, discomfort glare index (DGI), and predicted percentage of dissatisfied occupants (PPD) | R, G, Energy Plus, NSGA-II | Not mentioned |
| Case Study | Shading Device System |
|---|---|
| Case A1 | 95% window + Vertical dynamic sunshade (n2) |
| Case A2 | 95% window + Vertical dynamic sunshade (n4) |
| Case A3 | 95% window + Vertical dynamic sunshade (n5) |
| Case A4 | 95% window + Vertical dynamic sunshade (n8) |
| Case A5 | 95% window + Vertical dynamic sunshade (n16) |
| Case B1 | 95% window + Horizontal dynamic sunshade (n2) |
| Case B2 | 95% window + Horizontal dynamic sunshade (n4) |
| Case B3 | 95% window + Horizontal dynamic sunshade (n5) |
| Case B4 | 95% window + Horizontal dynamic sunshade (n8) |
| Case B5 | 95% window + Horizontal dynamic sunshade (n16) |
| Case C1 | 95% window + Multi-directional dynamic sunshade (n2) |
| Case C2 | 95% window + Multi-directional dynamic sunshade (n4) |
| Case C3 | 95% window + Multi-directional dynamic sunshade (n5) |
| Case C4 | 95% window + Multi-directional dynamic sunshade (n8) |
| Case C5 | 95% window + Multi-directional dynamic sunshade (n16) |
| Case | Rotation Angle |
|---|---|
| A | α |
| B | α + 15° |
| C | α + 30° |
| D | α = 45° |
| Hours | 8:00 | 9:00 | 10:00 | 11:00 | 12:00 | 13:00 | 14:00 | 15:00 | 16:00 | 17:00 | |
|---|---|---|---|---|---|---|---|---|---|---|---|
| Months | |||||||||||
| Mar 21st | 88° | 60–71° | 49–67° | 45-64° | 43-62° | 43-62° | 43-62° | 47-63° | 54-65° | 69° | |
| Jun 21st | 60–71° | 69–89° | 55–89° | 50-89° | 46-72° | 46-74° | 48-89° | 54–89° | 66–89° | 76° | |
| Sep 21st | 78–89° | 56-74°, | 48-68° | 44-63° | 42-63° | 42-63° | 44-63° | 48-68° | 59-69° | 84-89° | |
| Dec 21st | 65–66° | 48–49°, 56°, 63° | 47-57° | 46-55° | 44-54° | 44-54° | 45-56° | 46-60° | 48°, 60° | 64-67° | |
| Hours | 8:00 | 9:00 | 10:00 | 11:00 | 12:00 | 13:00 | 14:00 | 15:00 | 16:00 | 17:00 | |
|---|---|---|---|---|---|---|---|---|---|---|---|
| Months | |||||||||||
| Mar 21st | 71–85° | 48–53° | 42–46° | 33–34° | 39–40° | 32°;38° | 34° | 43° | 43–44° | 59–64° | |
| Jun 21st | 70–89° | 64–83° | 53–65° | 45–54° | 43–45° | 43° | 45–53° | 49°; 50–64° | 61–79° | 66°; 67–89° | |
| Sep 21st | 62–89° | 41°; 46–47° | 42° | 34° | 36° | 40° | 39–40° | 42–43° | 44° | 65–72°; 73° | |
| Dec 21st | 45–68° | 36–41° | 36–37° | 33°; 37° | 35° | 34° | 34–35° | 35–36° | 38° | 66° | |
Disclaimer/Publisher’s Note: The statements, opinions and data contained in all publications are solely those of the individual author(s) and contributor(s) and not of MDPI and/or the editor(s). MDPI and/or the editor(s) disclaim responsibility for any injury to people or property resulting from any ideas, methods, instructions or products referred to in the content. |
© 2024 by the authors. Licensee MDPI, Basel, Switzerland. This article is an open access article distributed under the terms and conditions of the Creative Commons Attribution (CC BY) license (https://creativecommons.org/licenses/by/4.0/).
Share and Cite
Kim, D.-H.; Luong, H.T.; Nguyen, T.T. Optimizing the Shading Device Configuration of Kinetic Façades through Daylighting Performance Assessment. Buildings 2024, 14, 1038. https://doi.org/10.3390/buildings14041038
Kim D-H, Luong HT, Nguyen TT. Optimizing the Shading Device Configuration of Kinetic Façades through Daylighting Performance Assessment. Buildings. 2024; 14(4):1038. https://doi.org/10.3390/buildings14041038
Chicago/Turabian StyleKim, Dong-Hyun, Hieu Trung Luong, and Trang Thao Nguyen. 2024. "Optimizing the Shading Device Configuration of Kinetic Façades through Daylighting Performance Assessment" Buildings 14, no. 4: 1038. https://doi.org/10.3390/buildings14041038
APA StyleKim, D.-H., Luong, H. T., & Nguyen, T. T. (2024). Optimizing the Shading Device Configuration of Kinetic Façades through Daylighting Performance Assessment. Buildings, 14(4), 1038. https://doi.org/10.3390/buildings14041038