1. Introduction
In our country, although the system of cast-in-place structures has reached maturity, whether from the aspect of design or the construction, it cannot satisfy the requirements of higher construction function and period [
1], because of its lower level of industrialization, longer production period, and higher production cost. In order to meet the requirements of an increasingly developing construction market, and promote the industrial progress of housing, the construction plan of prefabricated housing has been put forward.
In recent years, with the increasing development of hybrid structures, composite structures with fabricated floors have gradually developed [
2,
3,
4,
5]. However, the previous experimental research shows that it is hard for a structure with a prefabricated floor to reach the same structural performance as a cast-in-place slab, whose integrality and anti-seismic property are greatly different from that of a cast-in-place structure. In recent years, with the booming of prefabricated construction, how to improve prefabricated structures so as to raise the integrality and anti-seismic property has become a priority, making it possible for the prefabricated floor structure to reach or come close to the properties of a cast-in-place floor structure system [
6,
7]. Following examining the consequences of earthquakes, a shear connector should be added to the post-pouring strip between precast slabs or lateral support should be placed under the precast slabs.
This paper studies adding lateral support to the boom of the precast slab. In addition, the 50 mm surface course of the precast slab results in the weaknesses of high cost and heavy weight. If lateral support can replace the precast slab while improving structural performance, the anti-seismic property of the structure will be further raised, cost input reduced, and economic returns improved.
At present, it is not common to study the fabricated structure either at home or abroad. In China, the design code for the special effect of the assembled structured floor slabs is not perfect. To promote the wide application of the fabricated structure in construction, improve its economic benefits and social benefits, and make the design of the fabricated structure more reasonable, this important problem must be solved by the construction industry, by studying it further.
In this paper, a frame–shear wall structure model with a cast-in-place floor and a frame–shear wall structure model with a prefabricated floor are respectively tested. The displacement, PGA, response time history curve of base shear, envelope diagram of displacement response, hysteresis curve, inter-story displacement angle, and inter-story stiffness of the two structures are analyzed under different working conditions. The stiffness degradation curve is drawn to determine whether the rigidity of the structural model floor meets the requirements according to the distribution of shear forces between floors. However, both of them have good shear transfer ability and can ensure the integrity of the structure, providing a scientific basis for the prefabricated new floor to replace the ordinary precast slab with the post-cast layer or the cast-in-situ floor [
8,
9].
2. Modal Design and Experimental Facility
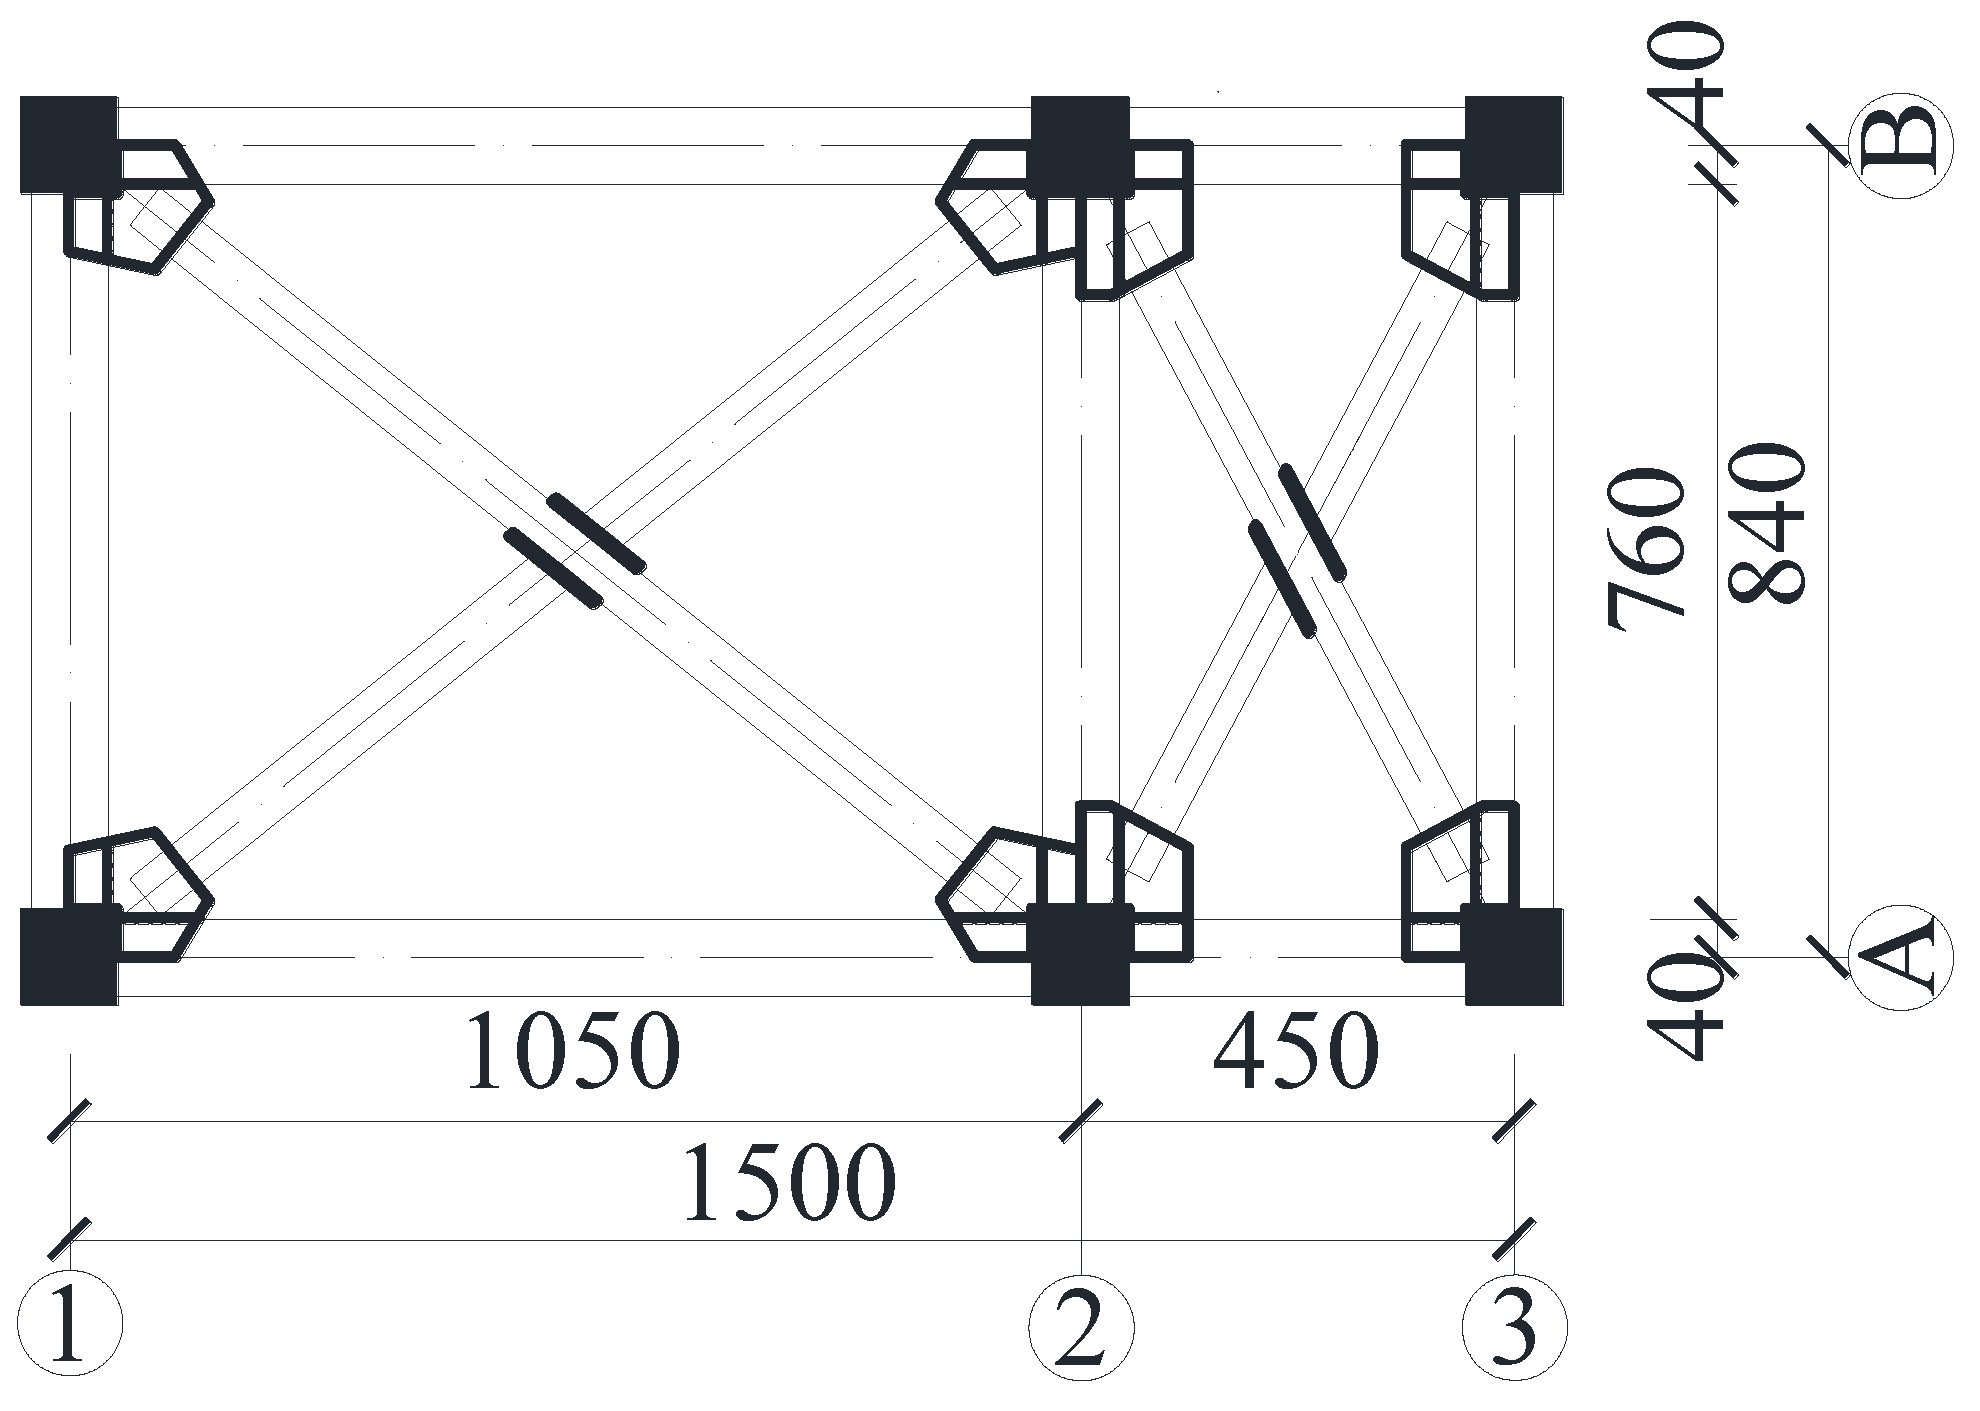
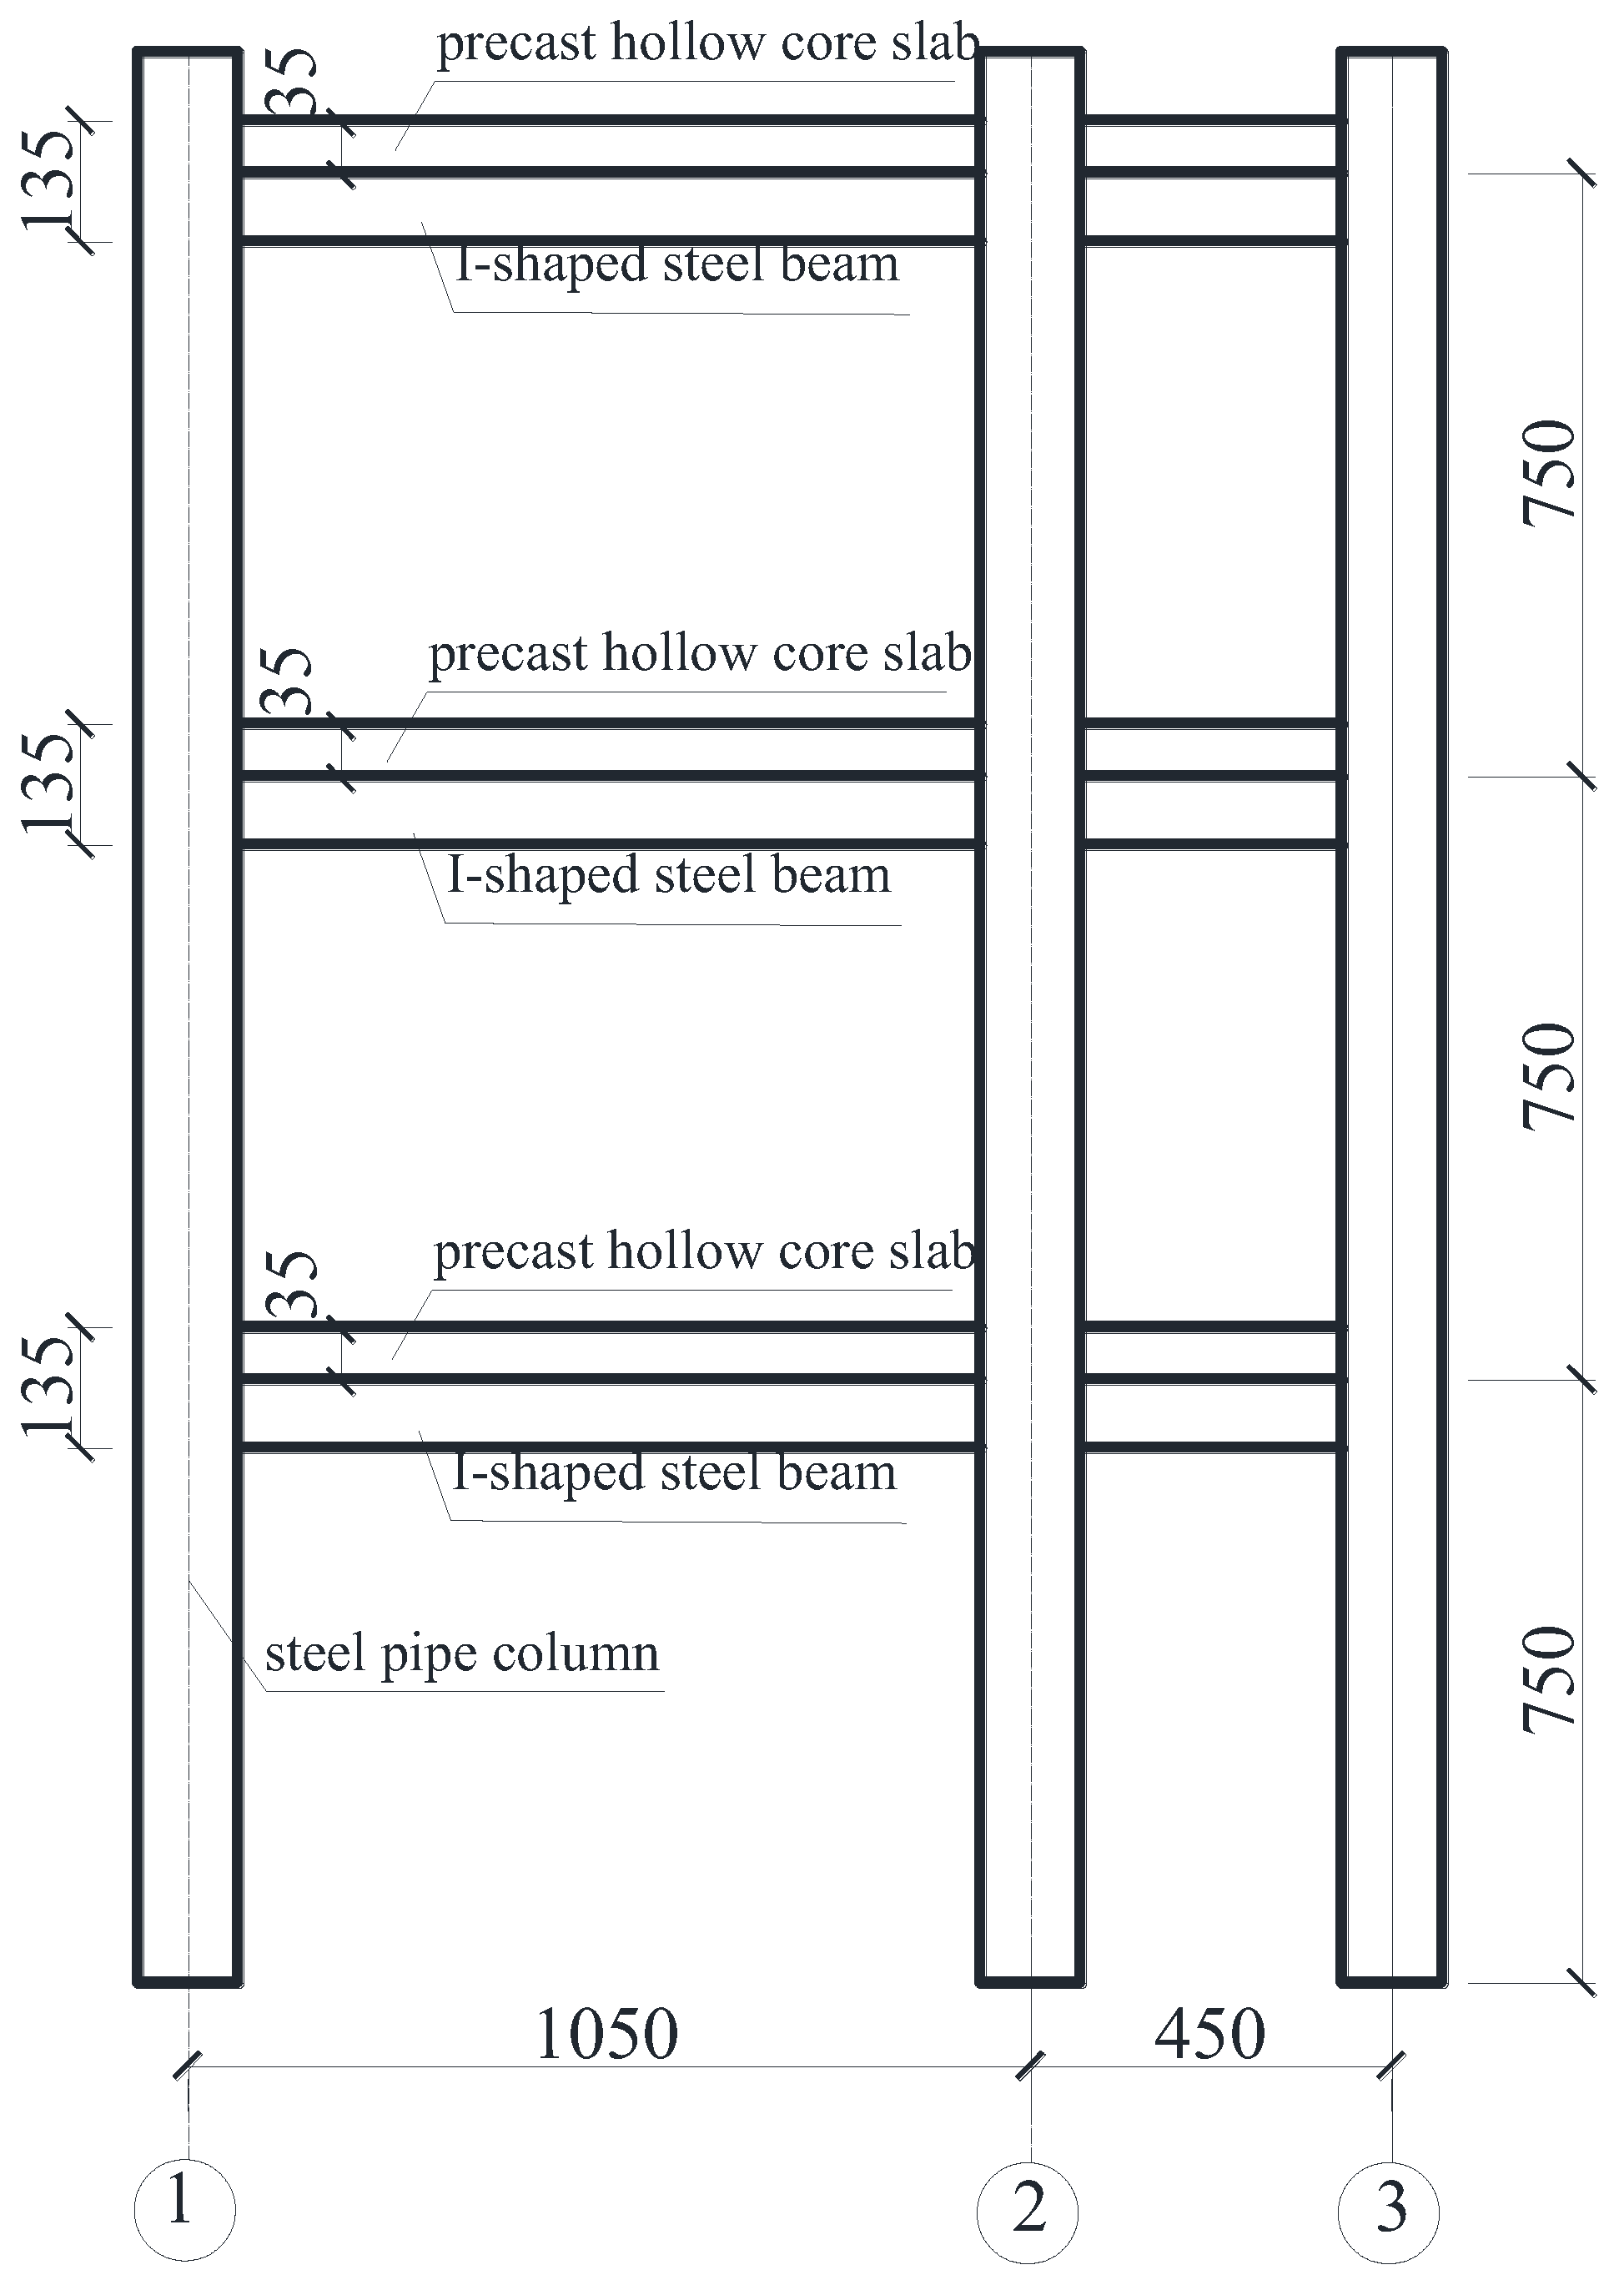
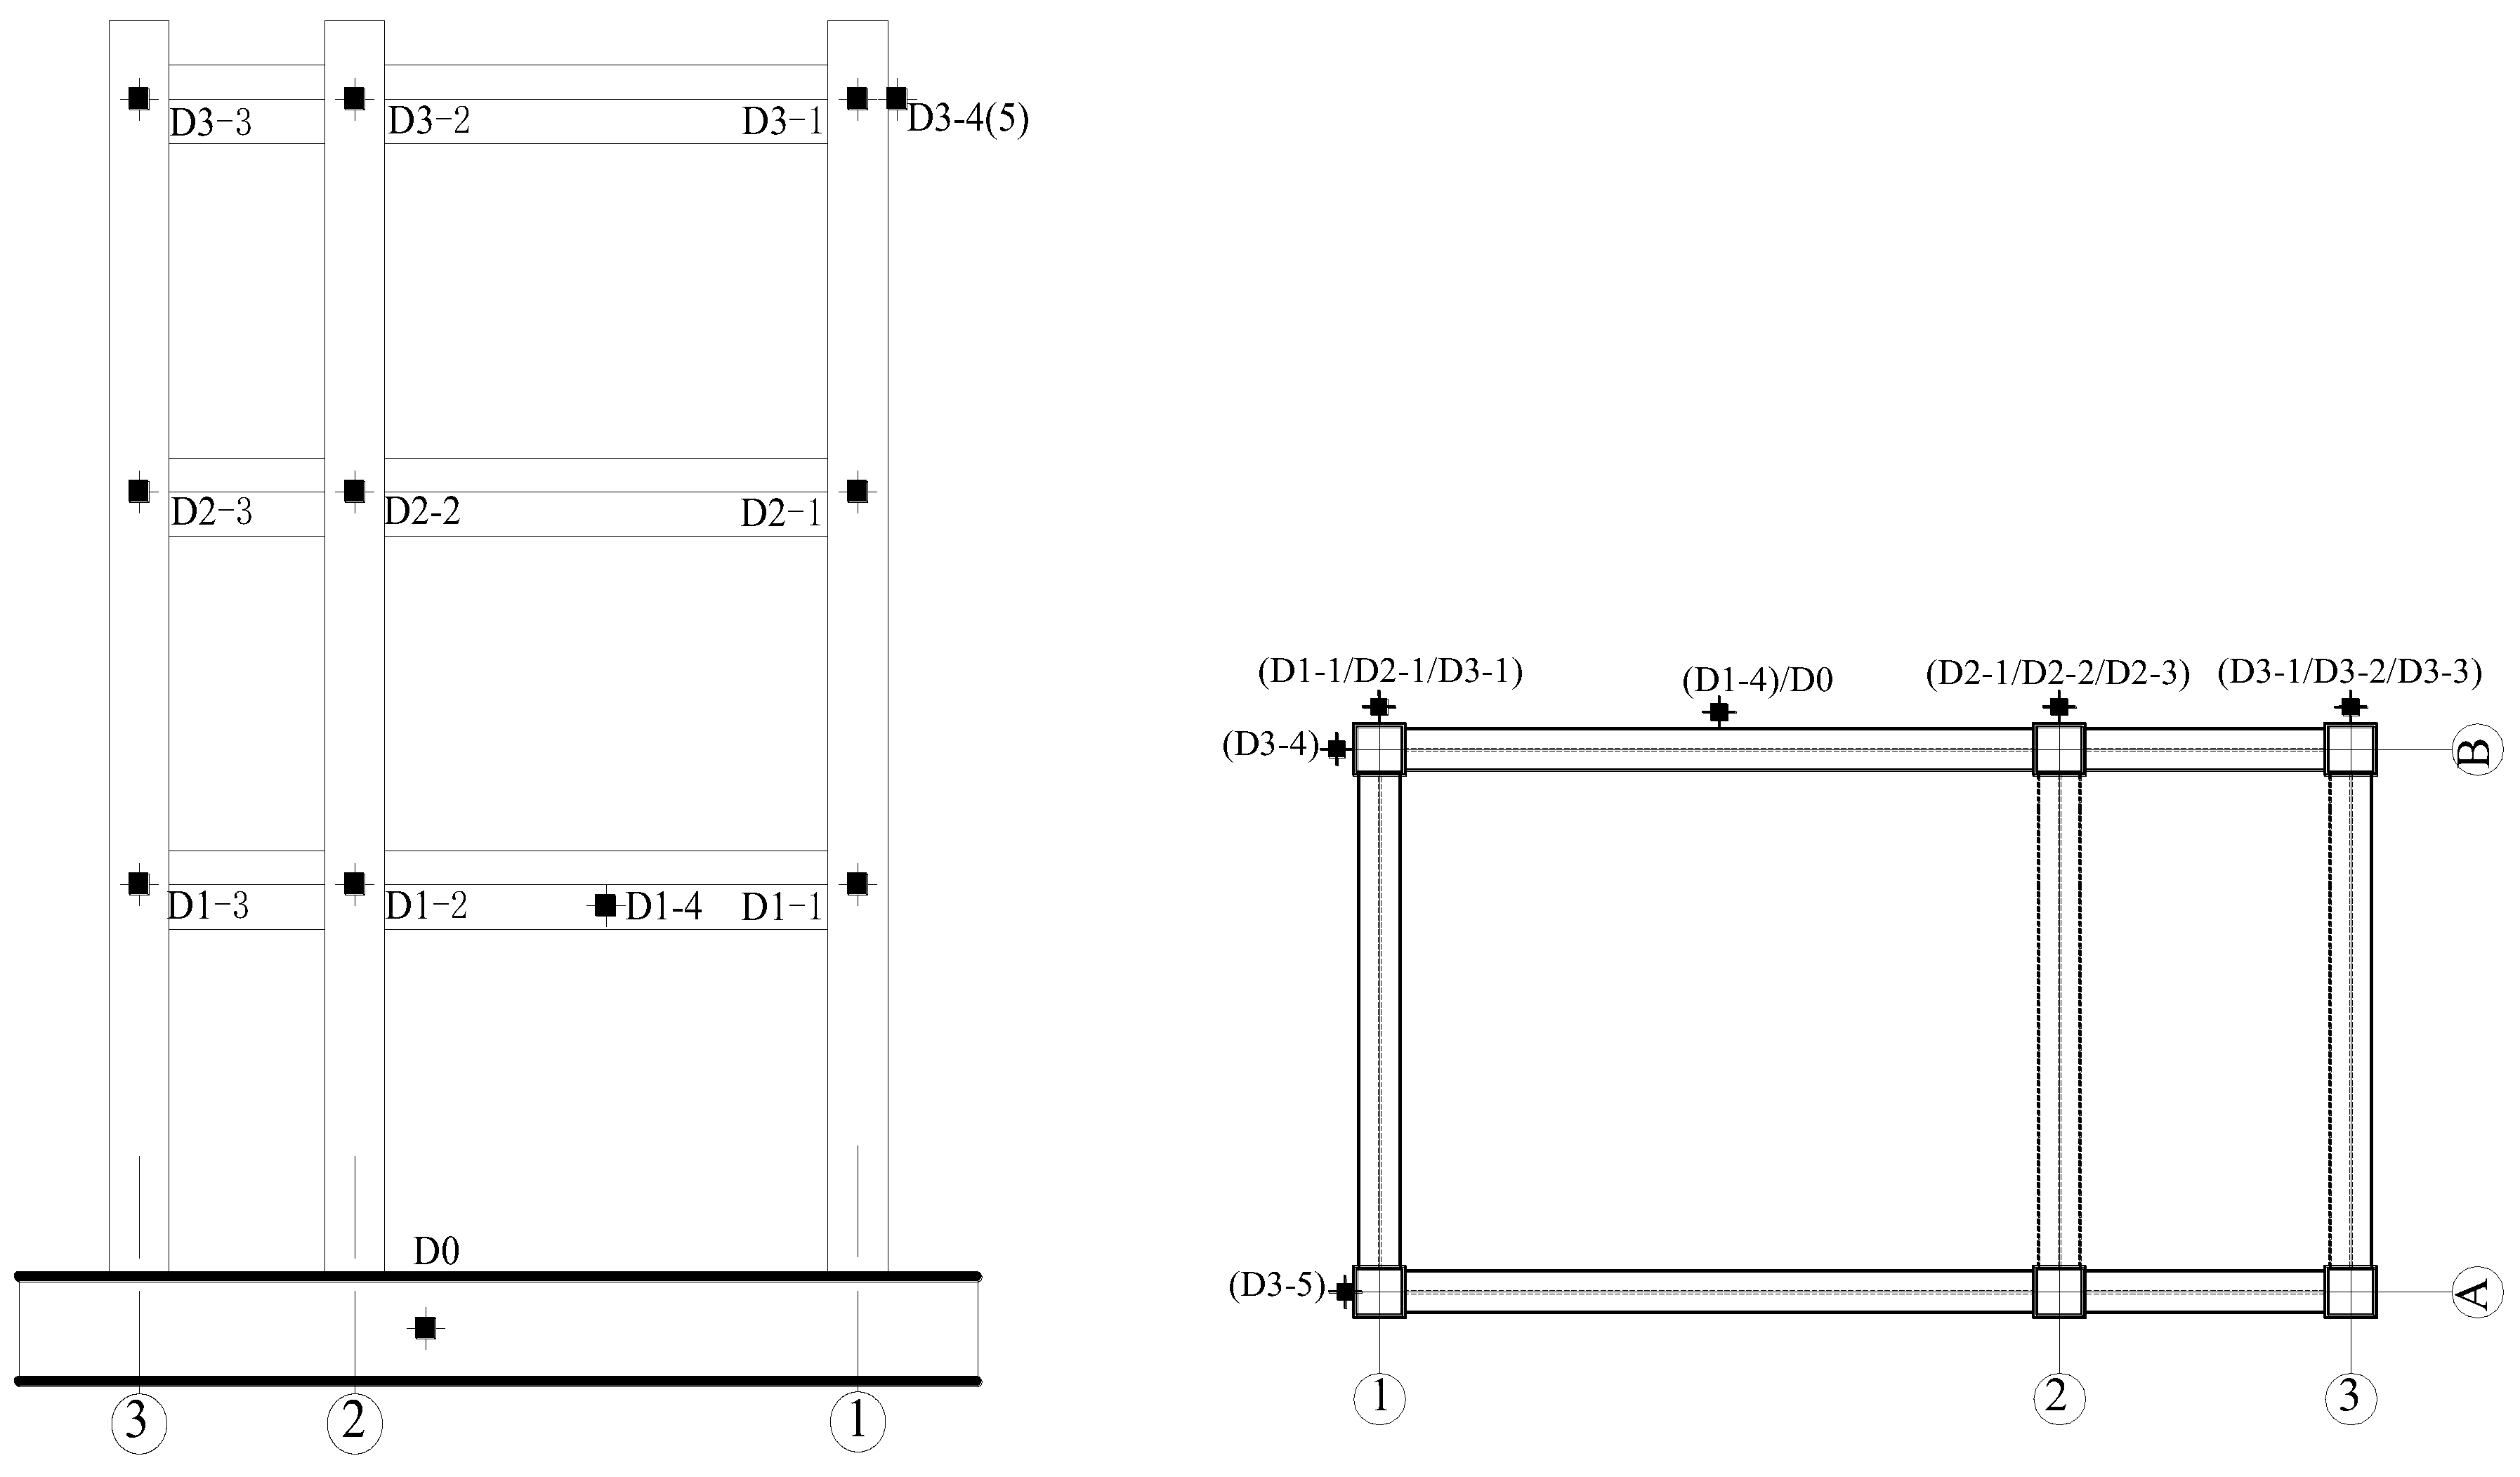
The experimental model is modeled after Baigou international luggage city in Baoding, Hebei province, built by Longitaihe Industrial Limited Company, with a reduced one-quarter scale and a frame–shear wall structure of unequal span.
There are two models. Model one is made by pouring an in situ concrete floor on the frame after the frame–shear wall structure is finished. This is the cast-in-place floor frame–shear wall structure, SJ1. The section size is shown in
Figure 1 and
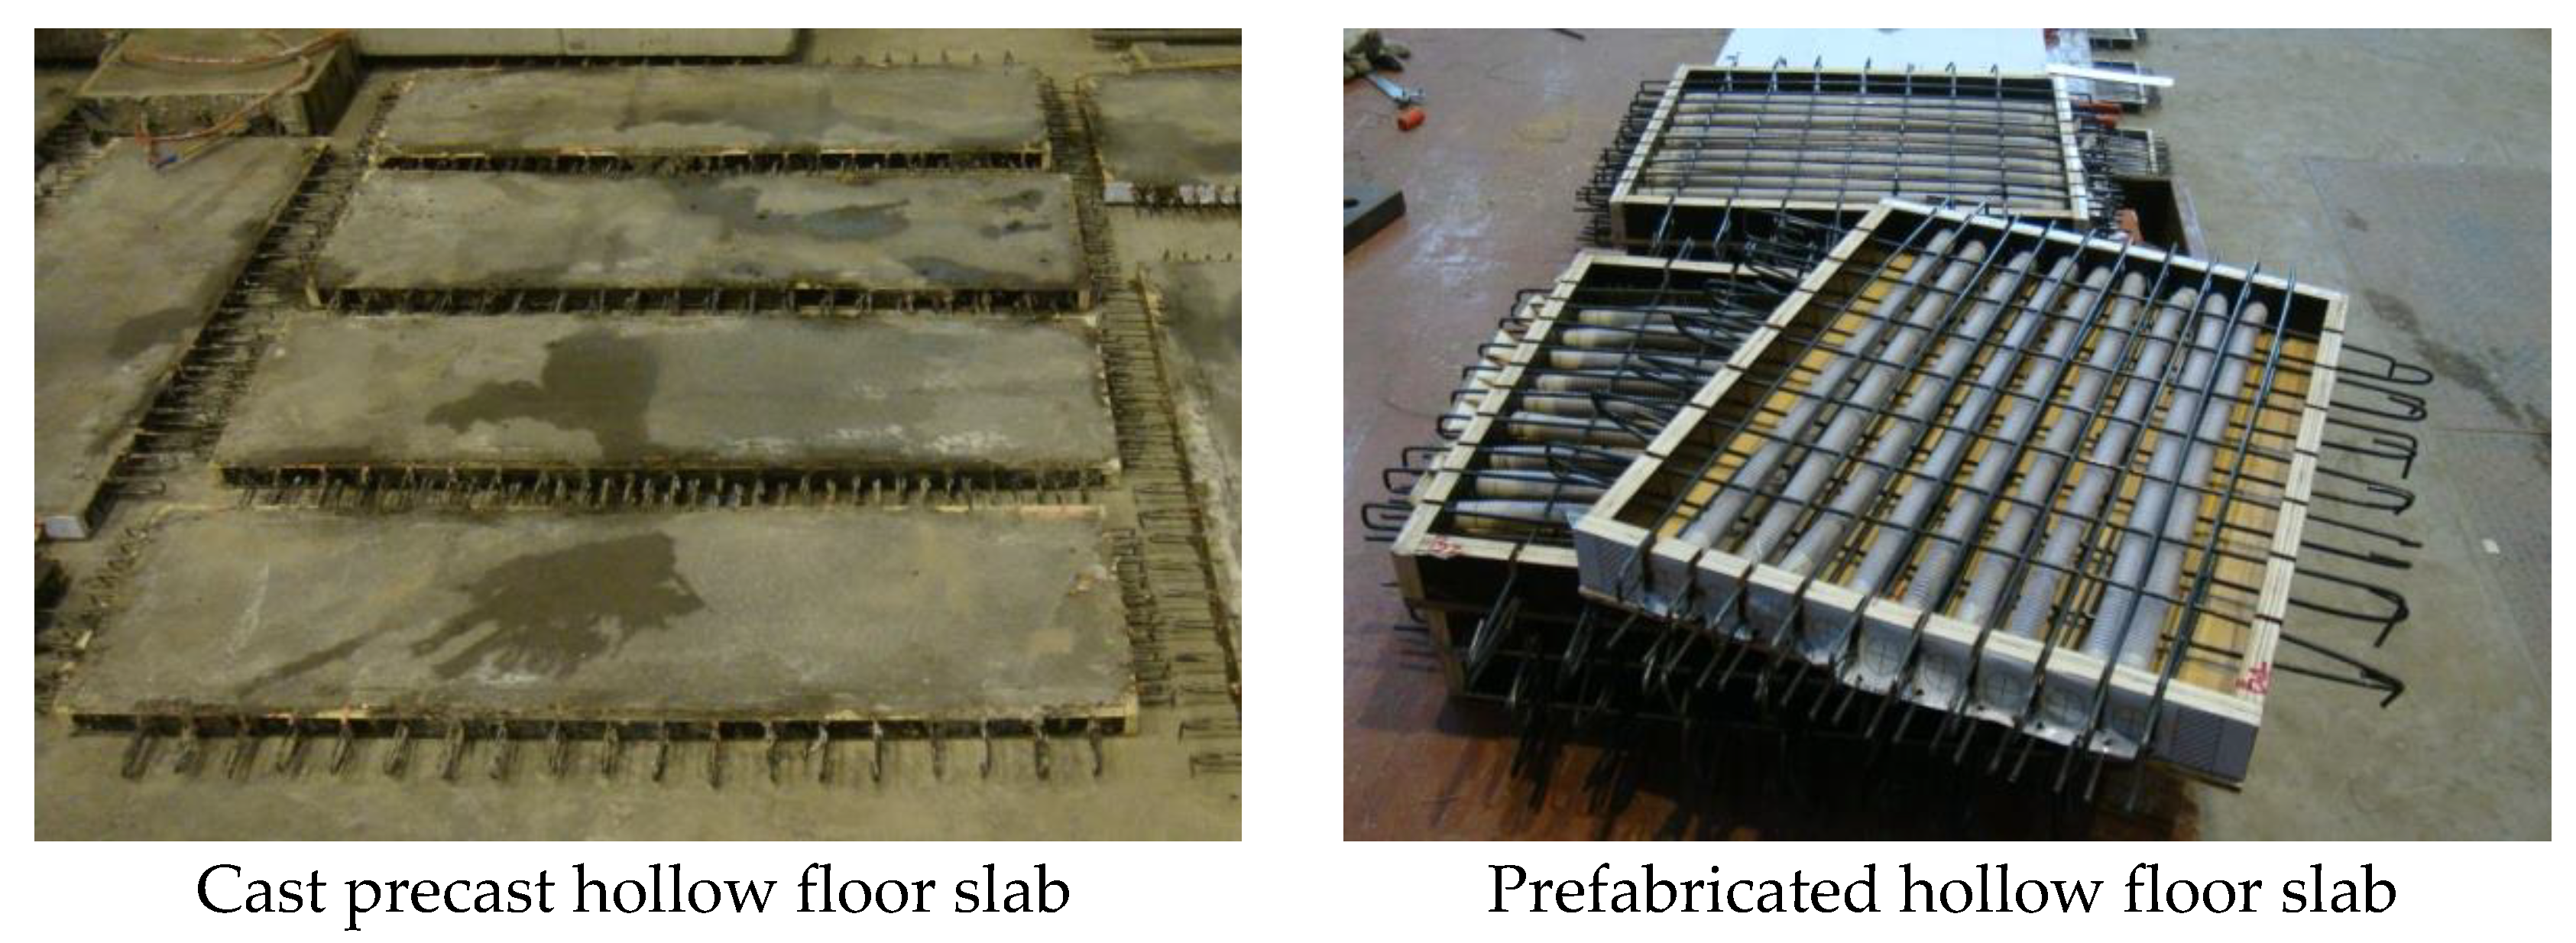
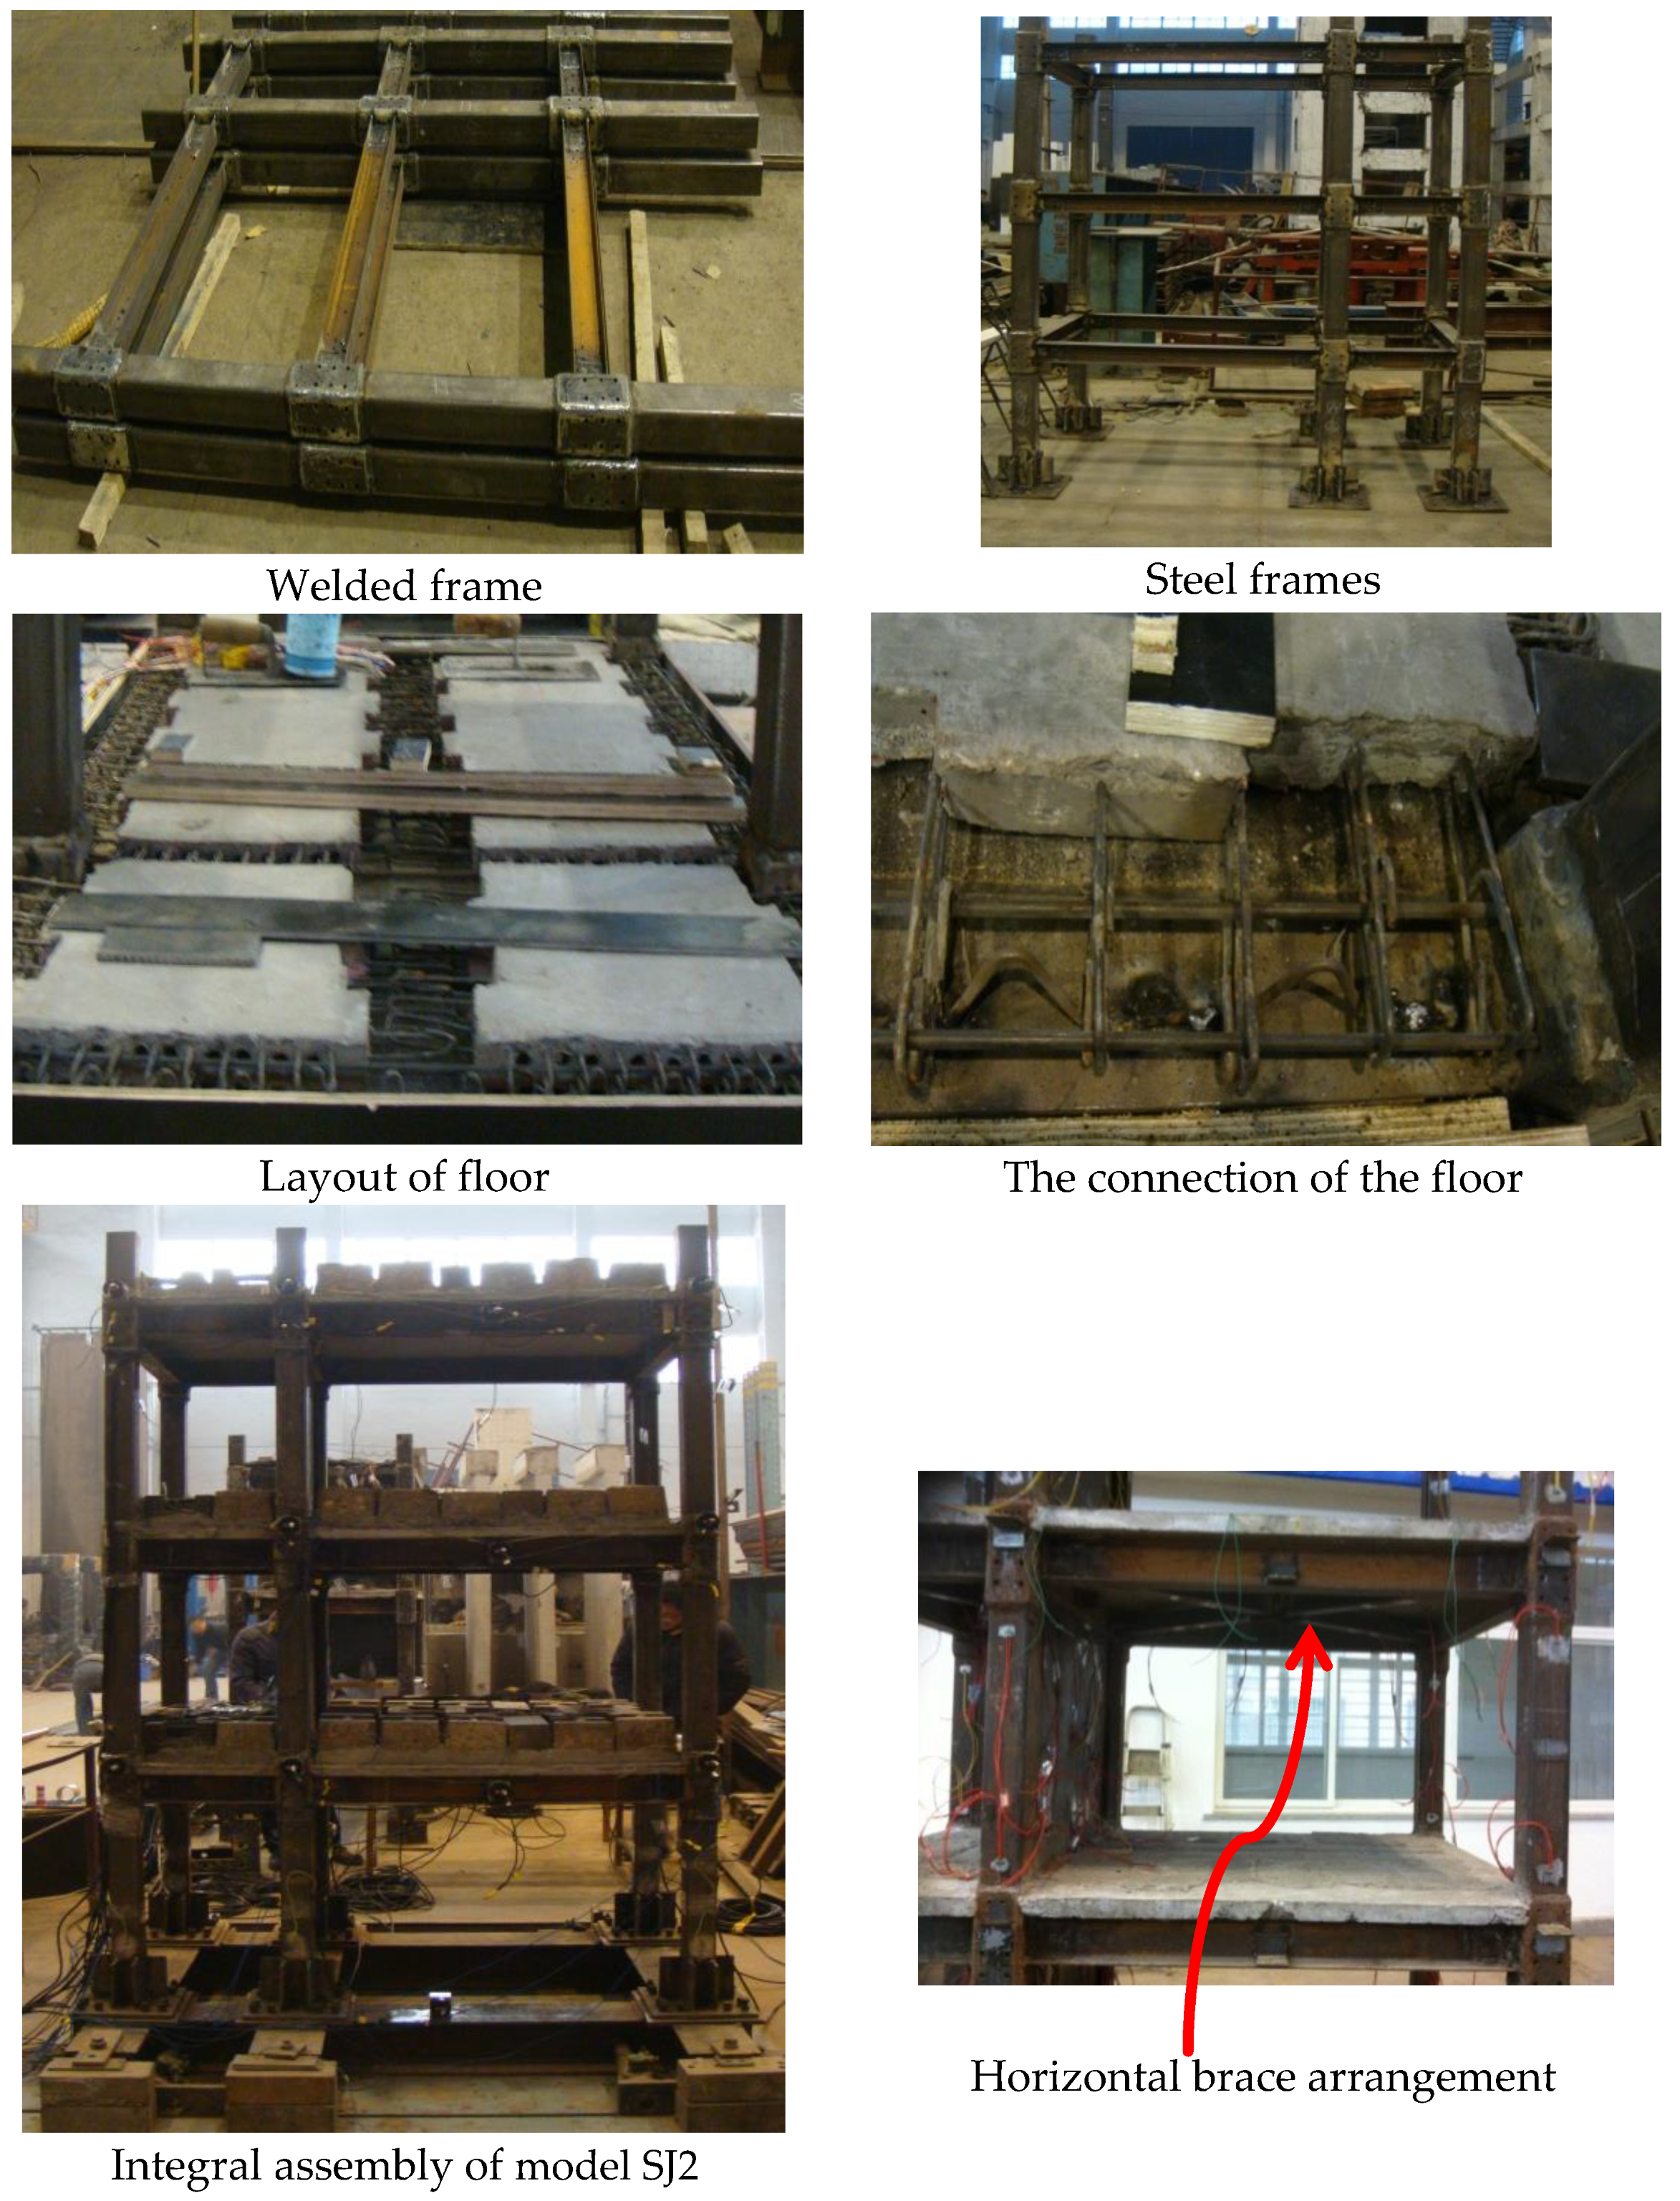
Figure 2. The biggest difference between two models is changing the cast-in-place floor into a prefabricated hollow floor and adding horizontal diagonal bracing to the bottom. The diagonal bracing is welded on the web plate of the flanged beam with a joint panel. This is the assembled monolithic floor slab frame–shear wall structure (SJ2). The shear wall is built on the second axis of wall model’s layer and uses the welding form.
2.1. Node Design
2.1.1. Connection between Beams and Plates
The shear connector of the bend reinforcing bar is placed between the cast-in-place slab and girder. The shear connector of the bend-reinforcing bar is made of a girder with a diameter of no less than 10 mm, whose construction and welding require a similarity with the bend bar connector. This enhances the connection reliability and reduces the stress concentration [
10].
It is proper to weld on the girder flange. Because a scale model is used in the experiment, the steel wire with a diameter of 3 mm was used. In addition, as the flange is narrow, only one row of bend-reinforcing bar shear connectors are used. SJ1 beam–slab connector is shown in
Figure 3. There are two advantages for the bend-reinforcing bar. First, it can bear the horizontal shear force more than anti-shear studs. Second, the bend-reinforcing bar is continuous, which makes it possible to function without the tensile and anti-lift anchoring.
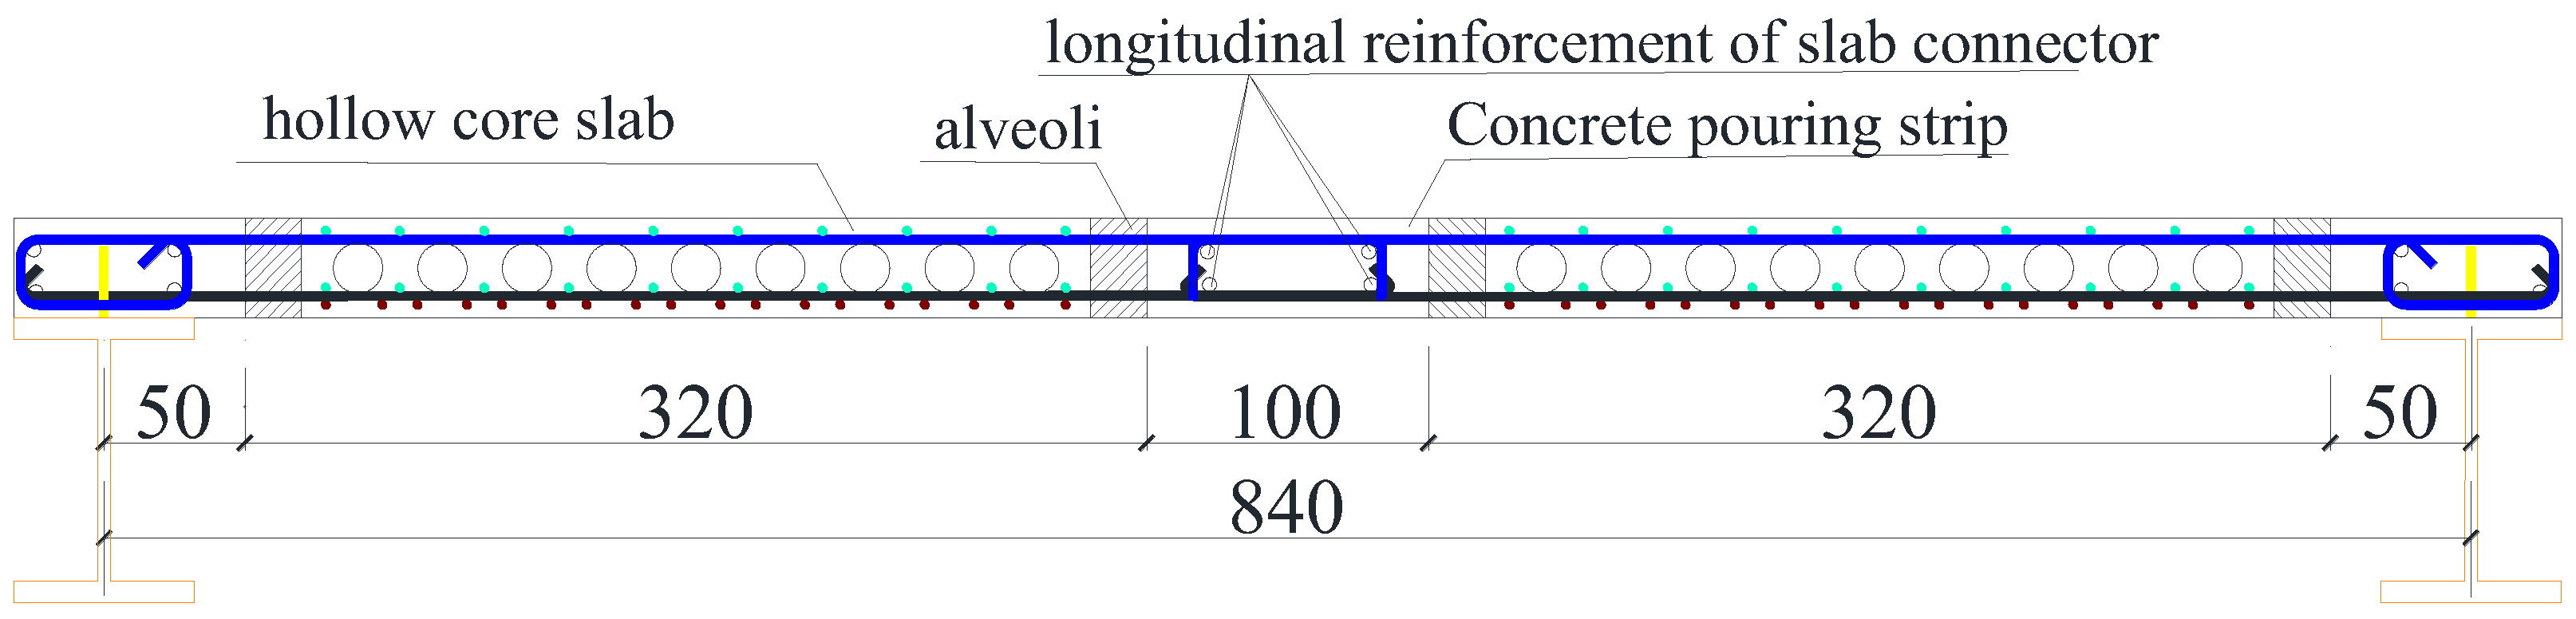
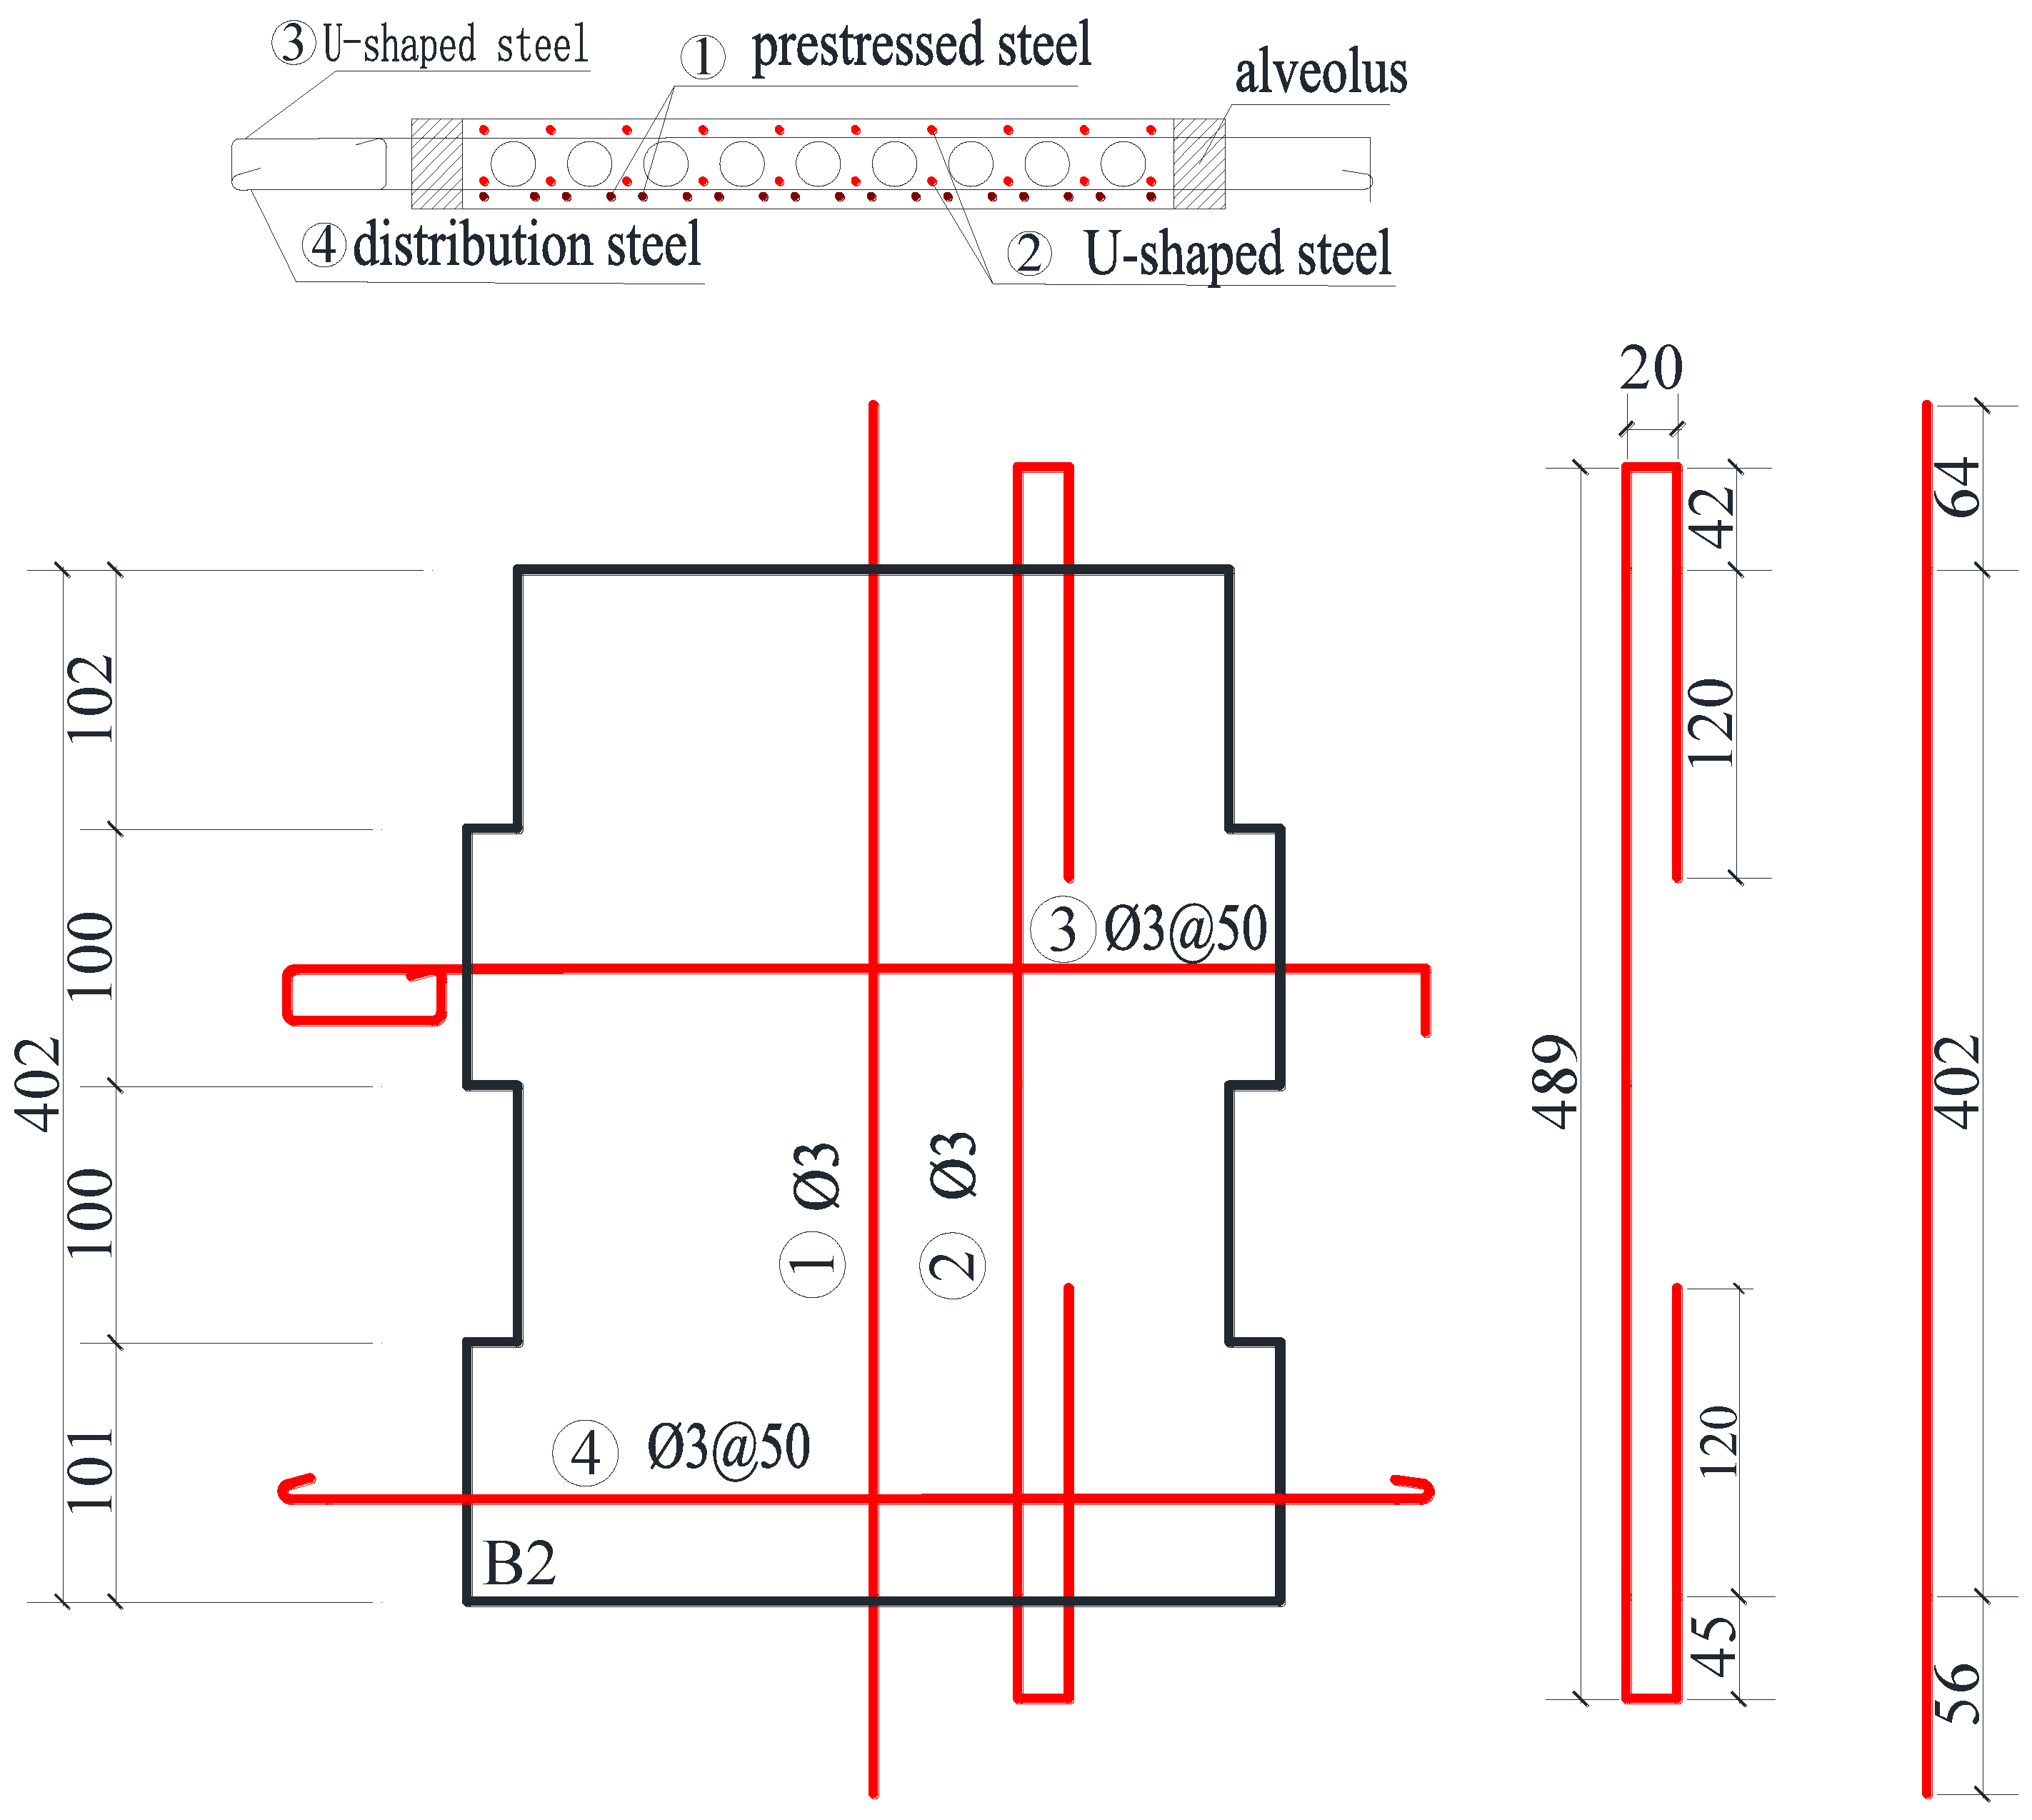
In general, the precast concrete floors we mention mostly adopt the two-way, single-layer reinforcement. In this experiment, high-strength reinforcement is used in the new type of precast hollow floors and the forced direction of the place is a double-layer reinforcement to ensure the precast floor bears the vertical load better. A u-shaped rebar is set at each hollow core slab end; a post-pouring joint is adopted on the concrete and beam. A steel shear connector with a diameter of 5 mm is installed between the precast slab and girder. At the same time, the longitudinal bar, which has a diameter of 3 mm and installed on the upper part of the beam, is firmly tied to the u-shaped rebar of the plate, and then the concrete is poured, which makes it possible to share the bending moment produced by the vertical load, as well as increase the stiffness of the boundary beam. The connection of the beam–plate SJ2 is shown in
Figure 4 under the influence of horizontal load.
We used a perforated panel to replace the (steel) shear connector between the girder and concrete at the second axis and enable the longitudinal bar of the cast-in-place panel bottom and negative bending reinforcement to pass though the perfobond strip. The perforated panel and rebar through the hole form shear connectors similar to PBL [
11], and have the function of resisting shear as shown in
Figure 5.
The thickness of the cast-in-place plate is 26 mm, the adopted concrete strength is C35, and the traditional single two-way reinforcement 3@50 is used. The thickness of the precast hollow slab is 35 mm, the diameter of circular hole is 17.5 mm, and concrete strength C35 is also adopted. The detailed reinforced arrangement is shown in
Figure 6.
In SJ2, the plate–plate connections firstly depend on the shear connector formed by the cogging of the plate side to transmit the horizontal shear; secondly, two prestressed steel wires with a diameter of 5 mm are tied to the reinforced joints between two precast slabs, and the post-cast strip with a width of 100 mm is formed by concreting; in addition to bearing vertical load, the bending stiffness in the plane of precast slab can also be increased. The production process of model SJ2 is shown in
Figure 7.
2.1.2. Other Joint Connections
Welding is used to connect the beam–column joints. To increase the joints strength, the externally bonded steel plate is welded to the square steel tube of the joint and then the transverse stiffer is welded to the beam web of the joint. The model base is made by the H Beam and both integral structure and foundation connection are fastened by high strength bolts.
2.2. Model Similarity Relation
The scale ratio used in the test model is 1:4. The stress ratio
. The same material as in the prototype is used in the model, and the elastic modulus
. The power’s similarity coefficient of the model can be derived according to the similarity theory [
12], as is seen in
Table 1. The model’s sectional dimension made according to the reduced scale relation is shown in
Table 2.
2.3. Material Property [13]
The steel frame adopts the steel strength Q235 and by material characteristic test, yield strength, ultimate strength, and ductility are 236.1 MPa, 350.5 MPa, and 25.43%. The concrete strength C35 is adopted in precast hollow floor while the concrete strength C40 is used in the post-cast strip. By the material characteristic test, the compressive strength of the post-cast strip concrete is 31.21 MPa. The precast hollow core slab in the test uses the high-strength steel wire with a yield strength of 1200 MPa. The mechanical properties of materials is shown in
Table 3.
2.4. Loading Method and Testing Apparatus
2.4.1. Horizontal Load
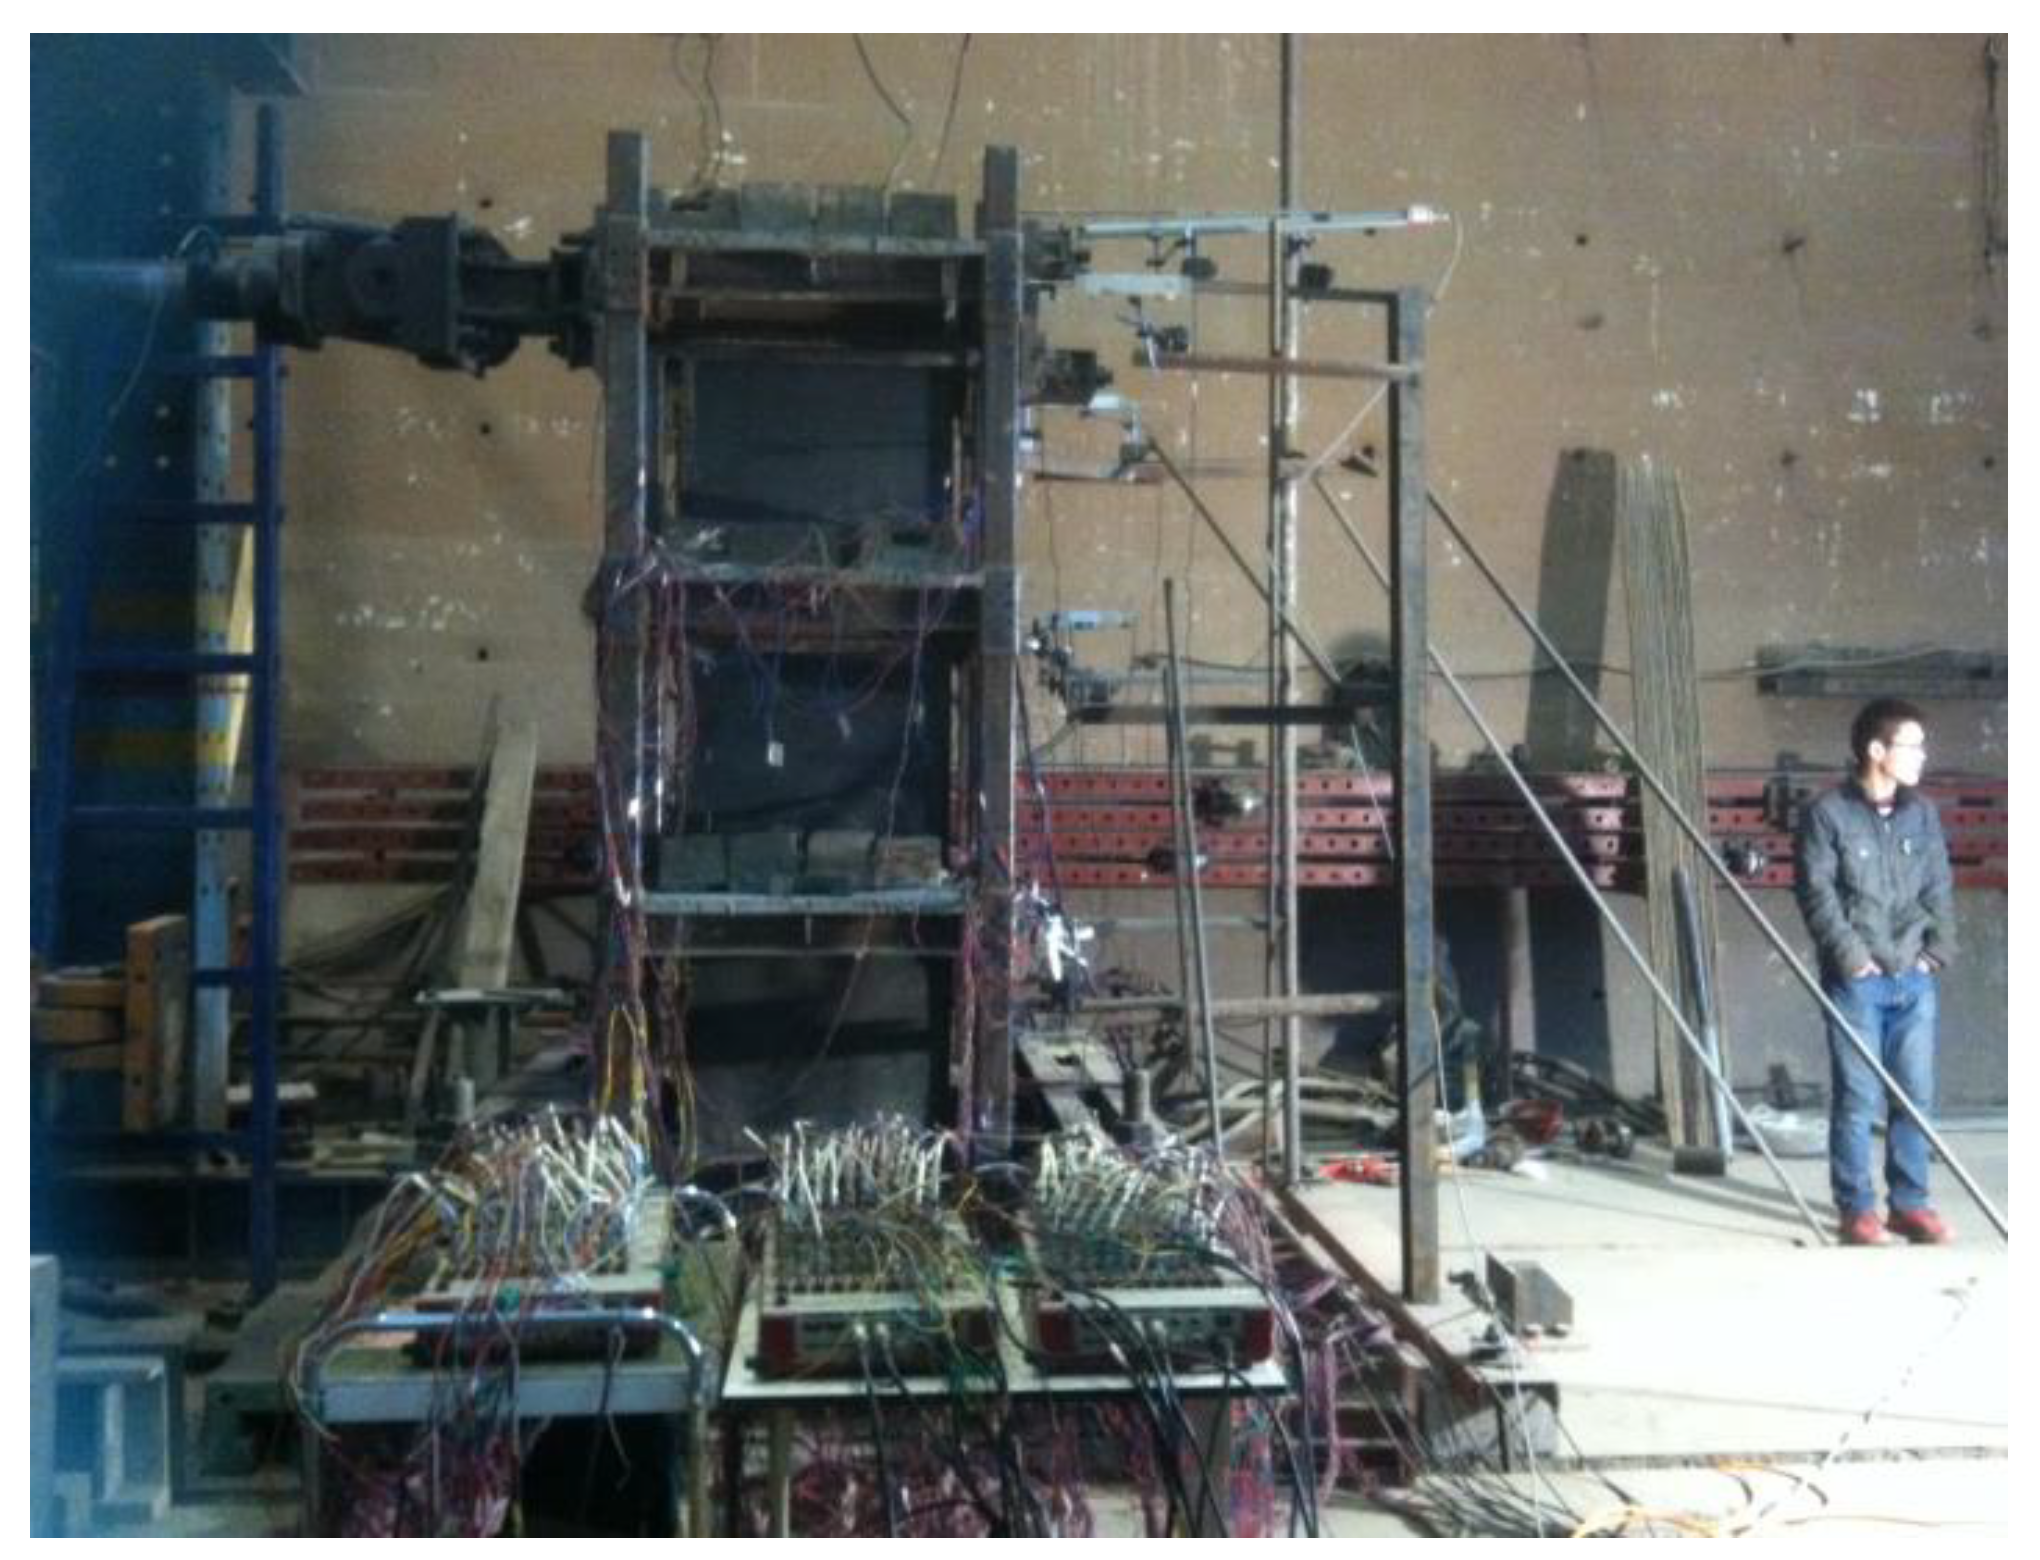
The test loading is conducted in the lab of structure and seismic of Xi’an University of Architecture and Technology, and the MTS electro-hydraulic servo loading system from the USA is used here. In the experiment, the test model is fastened on the large-scale experiment pedestal. By using the reinforced concrete reaction wall and with the help of an electro-hydraulic servo machine, the transverse horizontal load is applied to the model’s third layer: model joints 3-2 are loading points.
Figure 8 is the loading layout with the maximal weight 500 kN and the maximal displacement 250 mm. The test is equivalent to a single-degree-of-freedom system test loading and by using an equivalent single partied reaction and analyzing the displacement and base shear, an equivalent displacement is calculated, by which the test loader is controlled [
14,
15].
2.4.2. Vertical Load
During the test, the load is actually applied to the test model by the actuator and there is no need to use the model’s mass to set up the inertia force. Therefore, it is unnecessary to actually put the model mass on the test specimen, worked out by dynamic similar relations, and it is enough to input the model mass as the numerical value before the experiment begins. To meet the similar condition of the vertical load, the method of evenly arranging the balance weight in each layer of the model is adopted [
12,
16,
17]. According to the reduced scale of 1:4, every floor counter weight is SJ1(SJ2) is shown in
Table 4.
2.4.3. Monitoring Point Arrangement
To measure the strain to different parts of the structure, resistance strain gauges are systematically arranged on the key parts such as column, shear wall, the diagonal bracing, and so on. To obtain the structure’s horizontal displacement, the displacement percentage scale is arranged at the beam–column joints and the center of long-span floor beam. The MTS magnetic displacement sensor is arranged at the joint of D3-2 (position: the second axis of the third layer). In each test model, 130 strain gauges and 15 displacement meters are arranged and have the same layout position. The layout of the displacement meter is seen in
Figure 9.
2.4.4. Selection of Seismic Wave
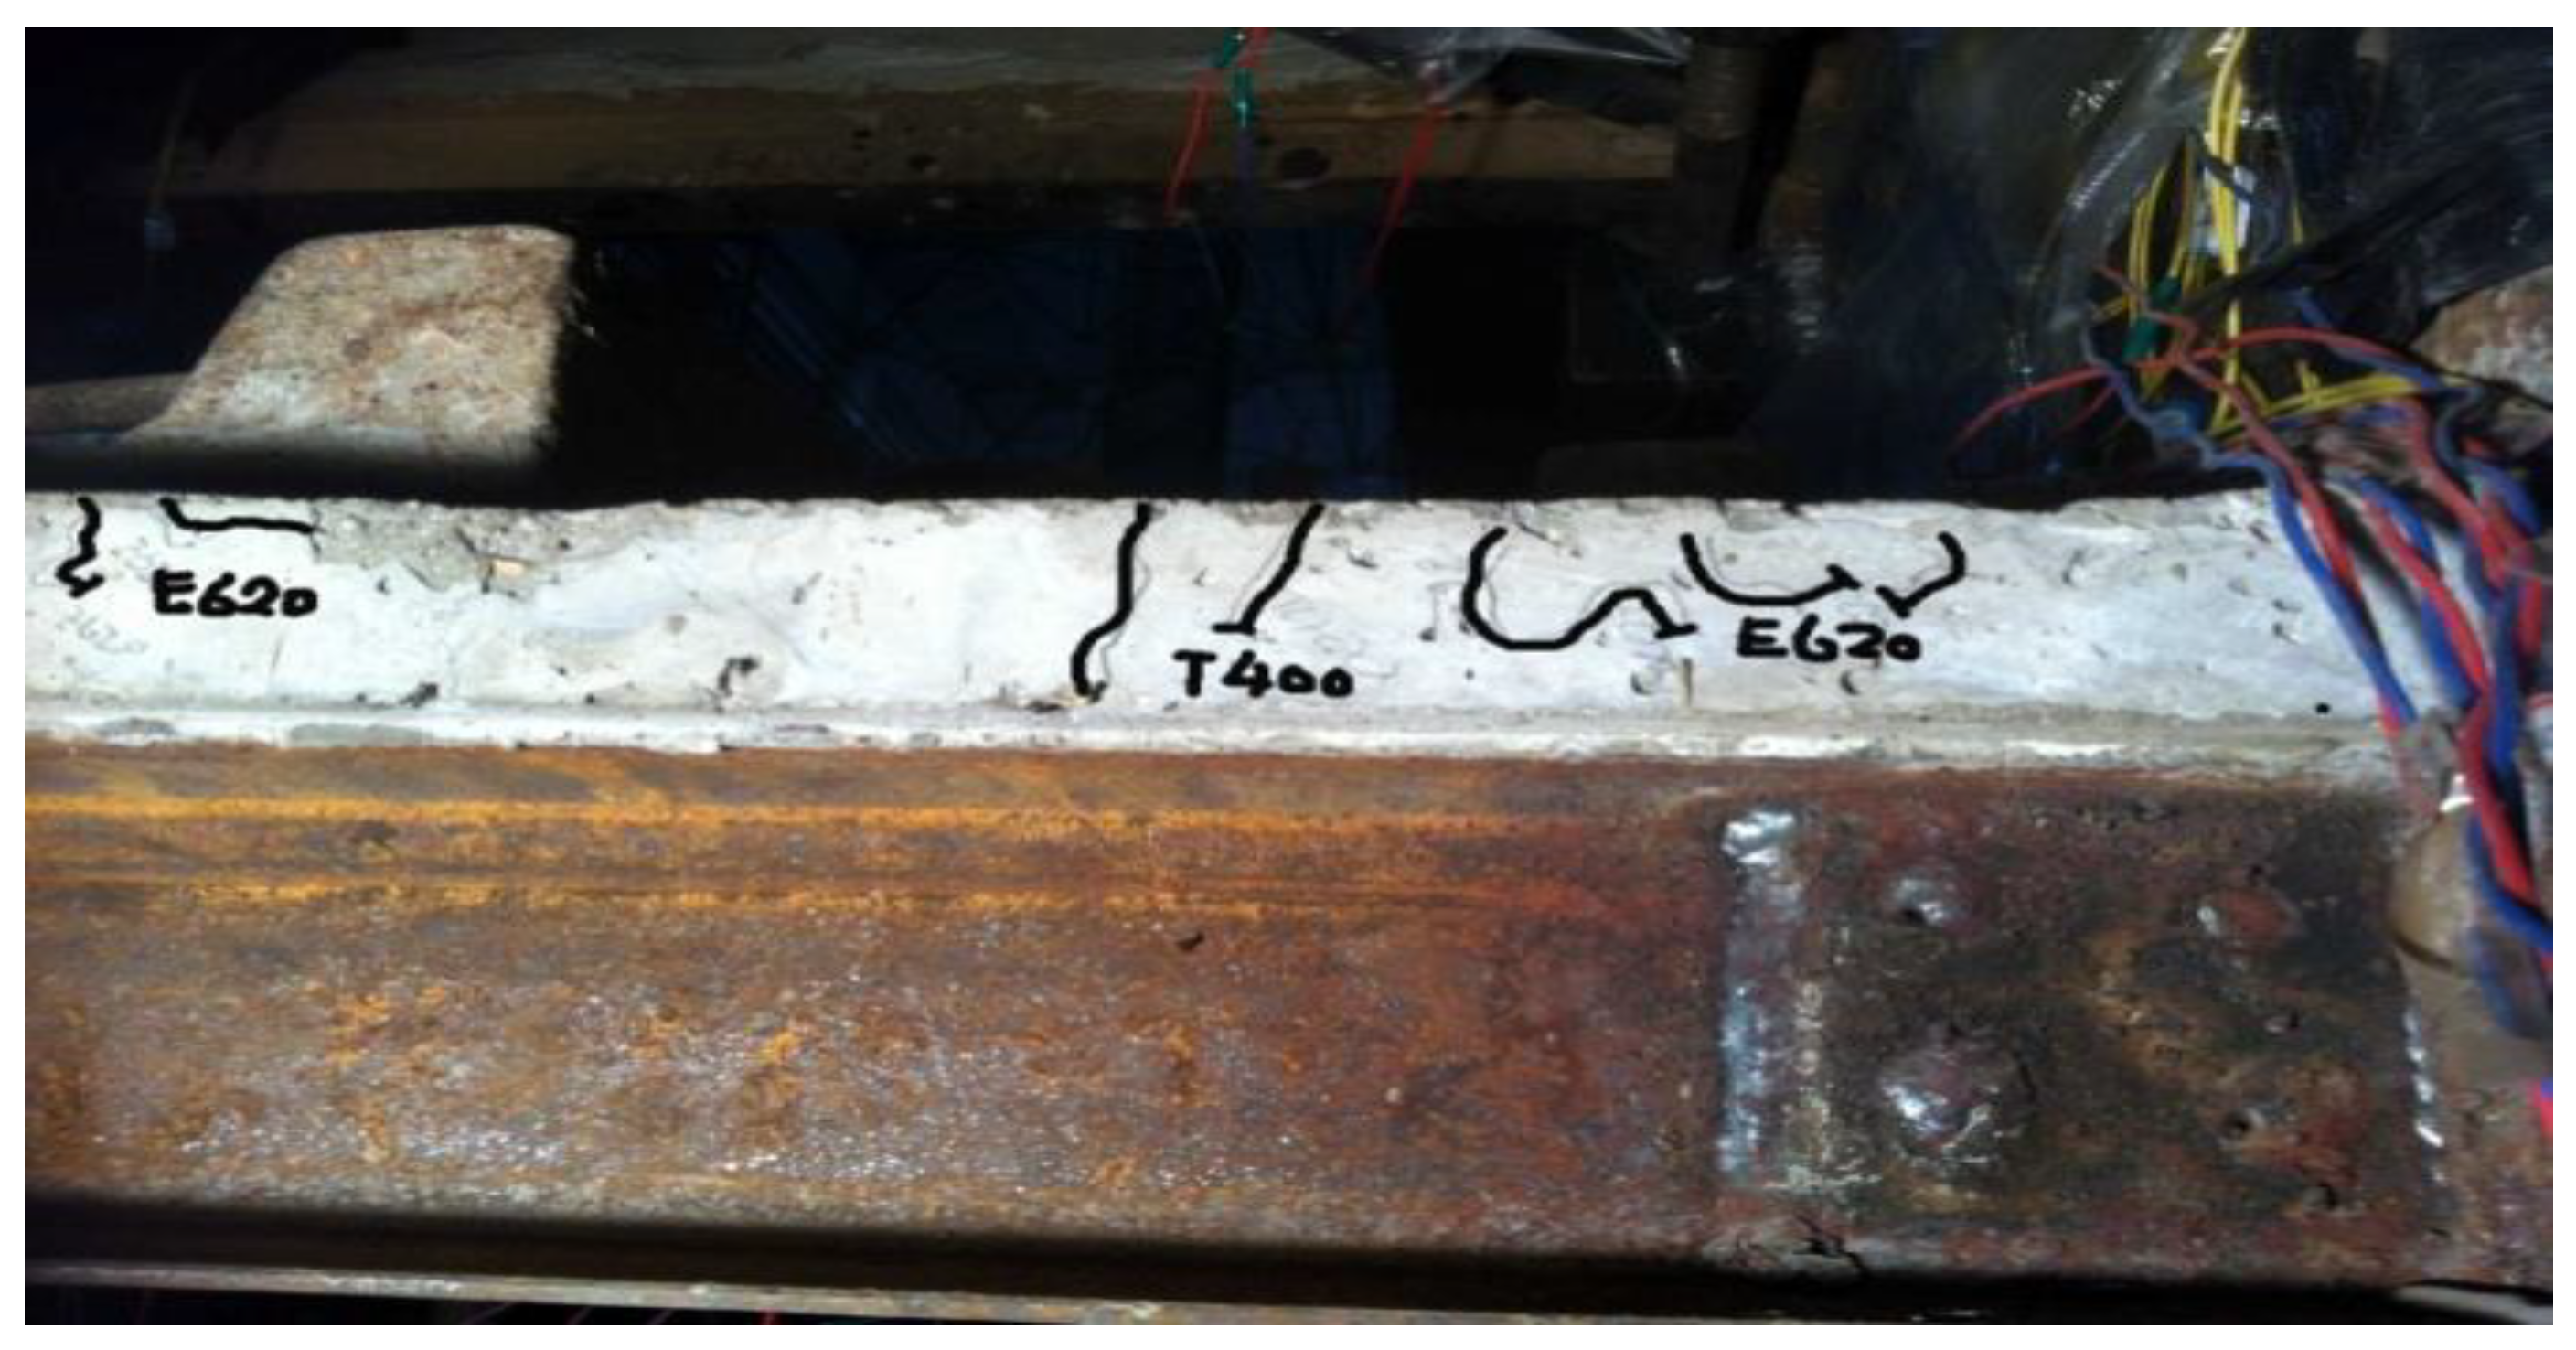
The test prototype is located in Baoding, Hebei Province, whose seismic fortification intensity is 7 degrees. According to the requirement of the code for seismic design of buildings [
17], the test chooses two groups of seismic waves, El Centro waves and Taft waves.
To measure the seismic response feature that the model shows under different earthquake intensities, four experimental conditions are designed in the test and their intensities are 7-degree basic, 7-degree severe, 8-degree, and 9-degree severe, of which the seismic wave’s duration is 10 s, △t = 0.01 s.
3. Process and Phenomenon of the Test
3.1. The Phenomenon of Cast-in-Place Floor Frame–Shear Wall Structure (SJ1)
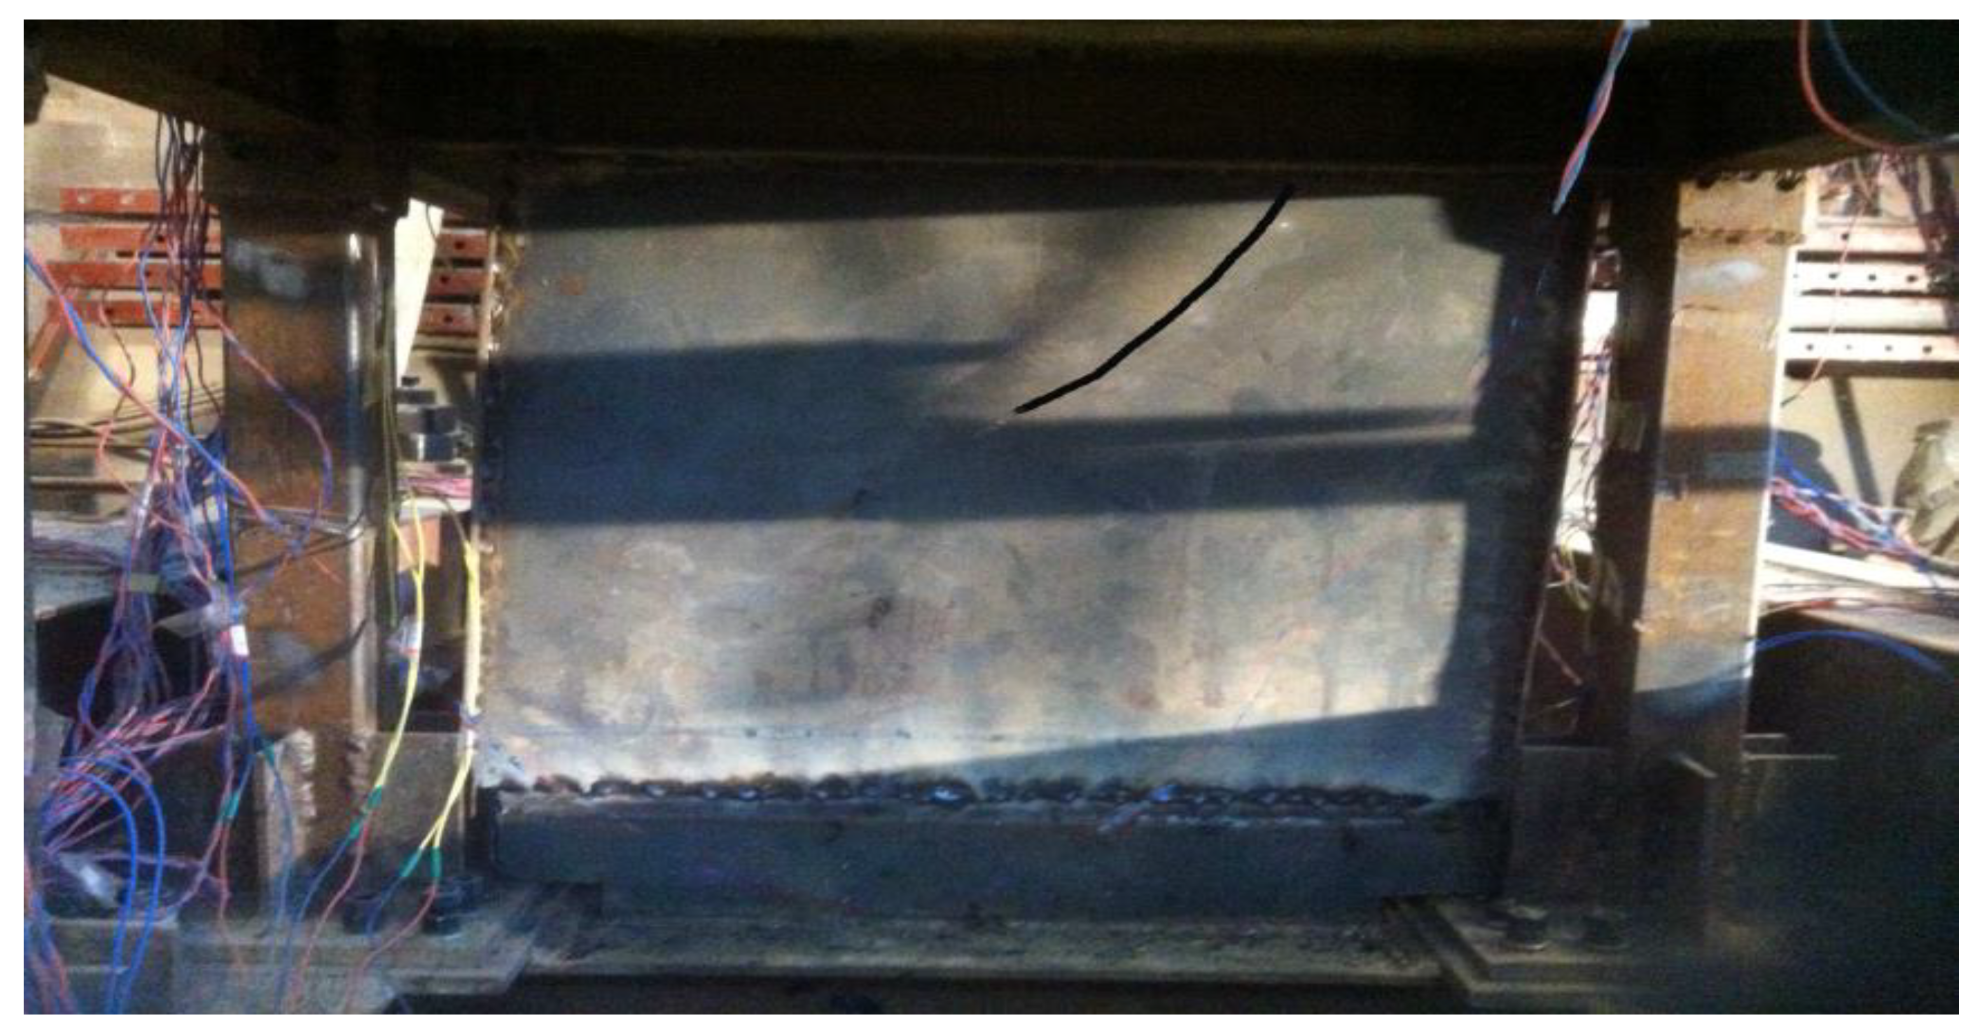
Under the influence of an earthquake with a PGA of 100 gal and 200 gal, slight clicks happen on the shear wall. There are almost no cracks on the floor and the structure is almost in the elastic stage.
Under EI Centro 400 gal, the click increase and the sound on the second and the third floors is louder. The obvious change appears in the shear region when pushing and pulling are made, which shows that under this kind of state, the shear wall has basically reached the buckling.
Under the influence of the earthquake with an PGA of EI Centro 620 gal, the sound of the shear wall continues to increase. Less fine cracks appear in the direction of the floor’s 45-degree angle of the interaxial floor on the third layer; the width is about 0.1 mm, the length about 7 mm. At this time, the maximum positive displacement of the model’s integral level reaches 22.09 mm, and the maximum negative displacement −31.53 mm.
Under the earthquake with a peak PGA of Taft 620 gal, the steel shear wall on the second layer first buckles, followed by the third layer, but there are no new cracks appearing. This shows that for the whole structure, only part of the shear wall buckles. Under 620 gal, 9-degree severe, the whole structure does not reach the plastic stage, having a good anti-seismic property. The damage to model SJ1 is shown in
Figure 10 and
Figure 11.
3.2. The Test Phenomenon of Assembled Monolithic Floor Frame–Shear Wall Structure (SJ2)
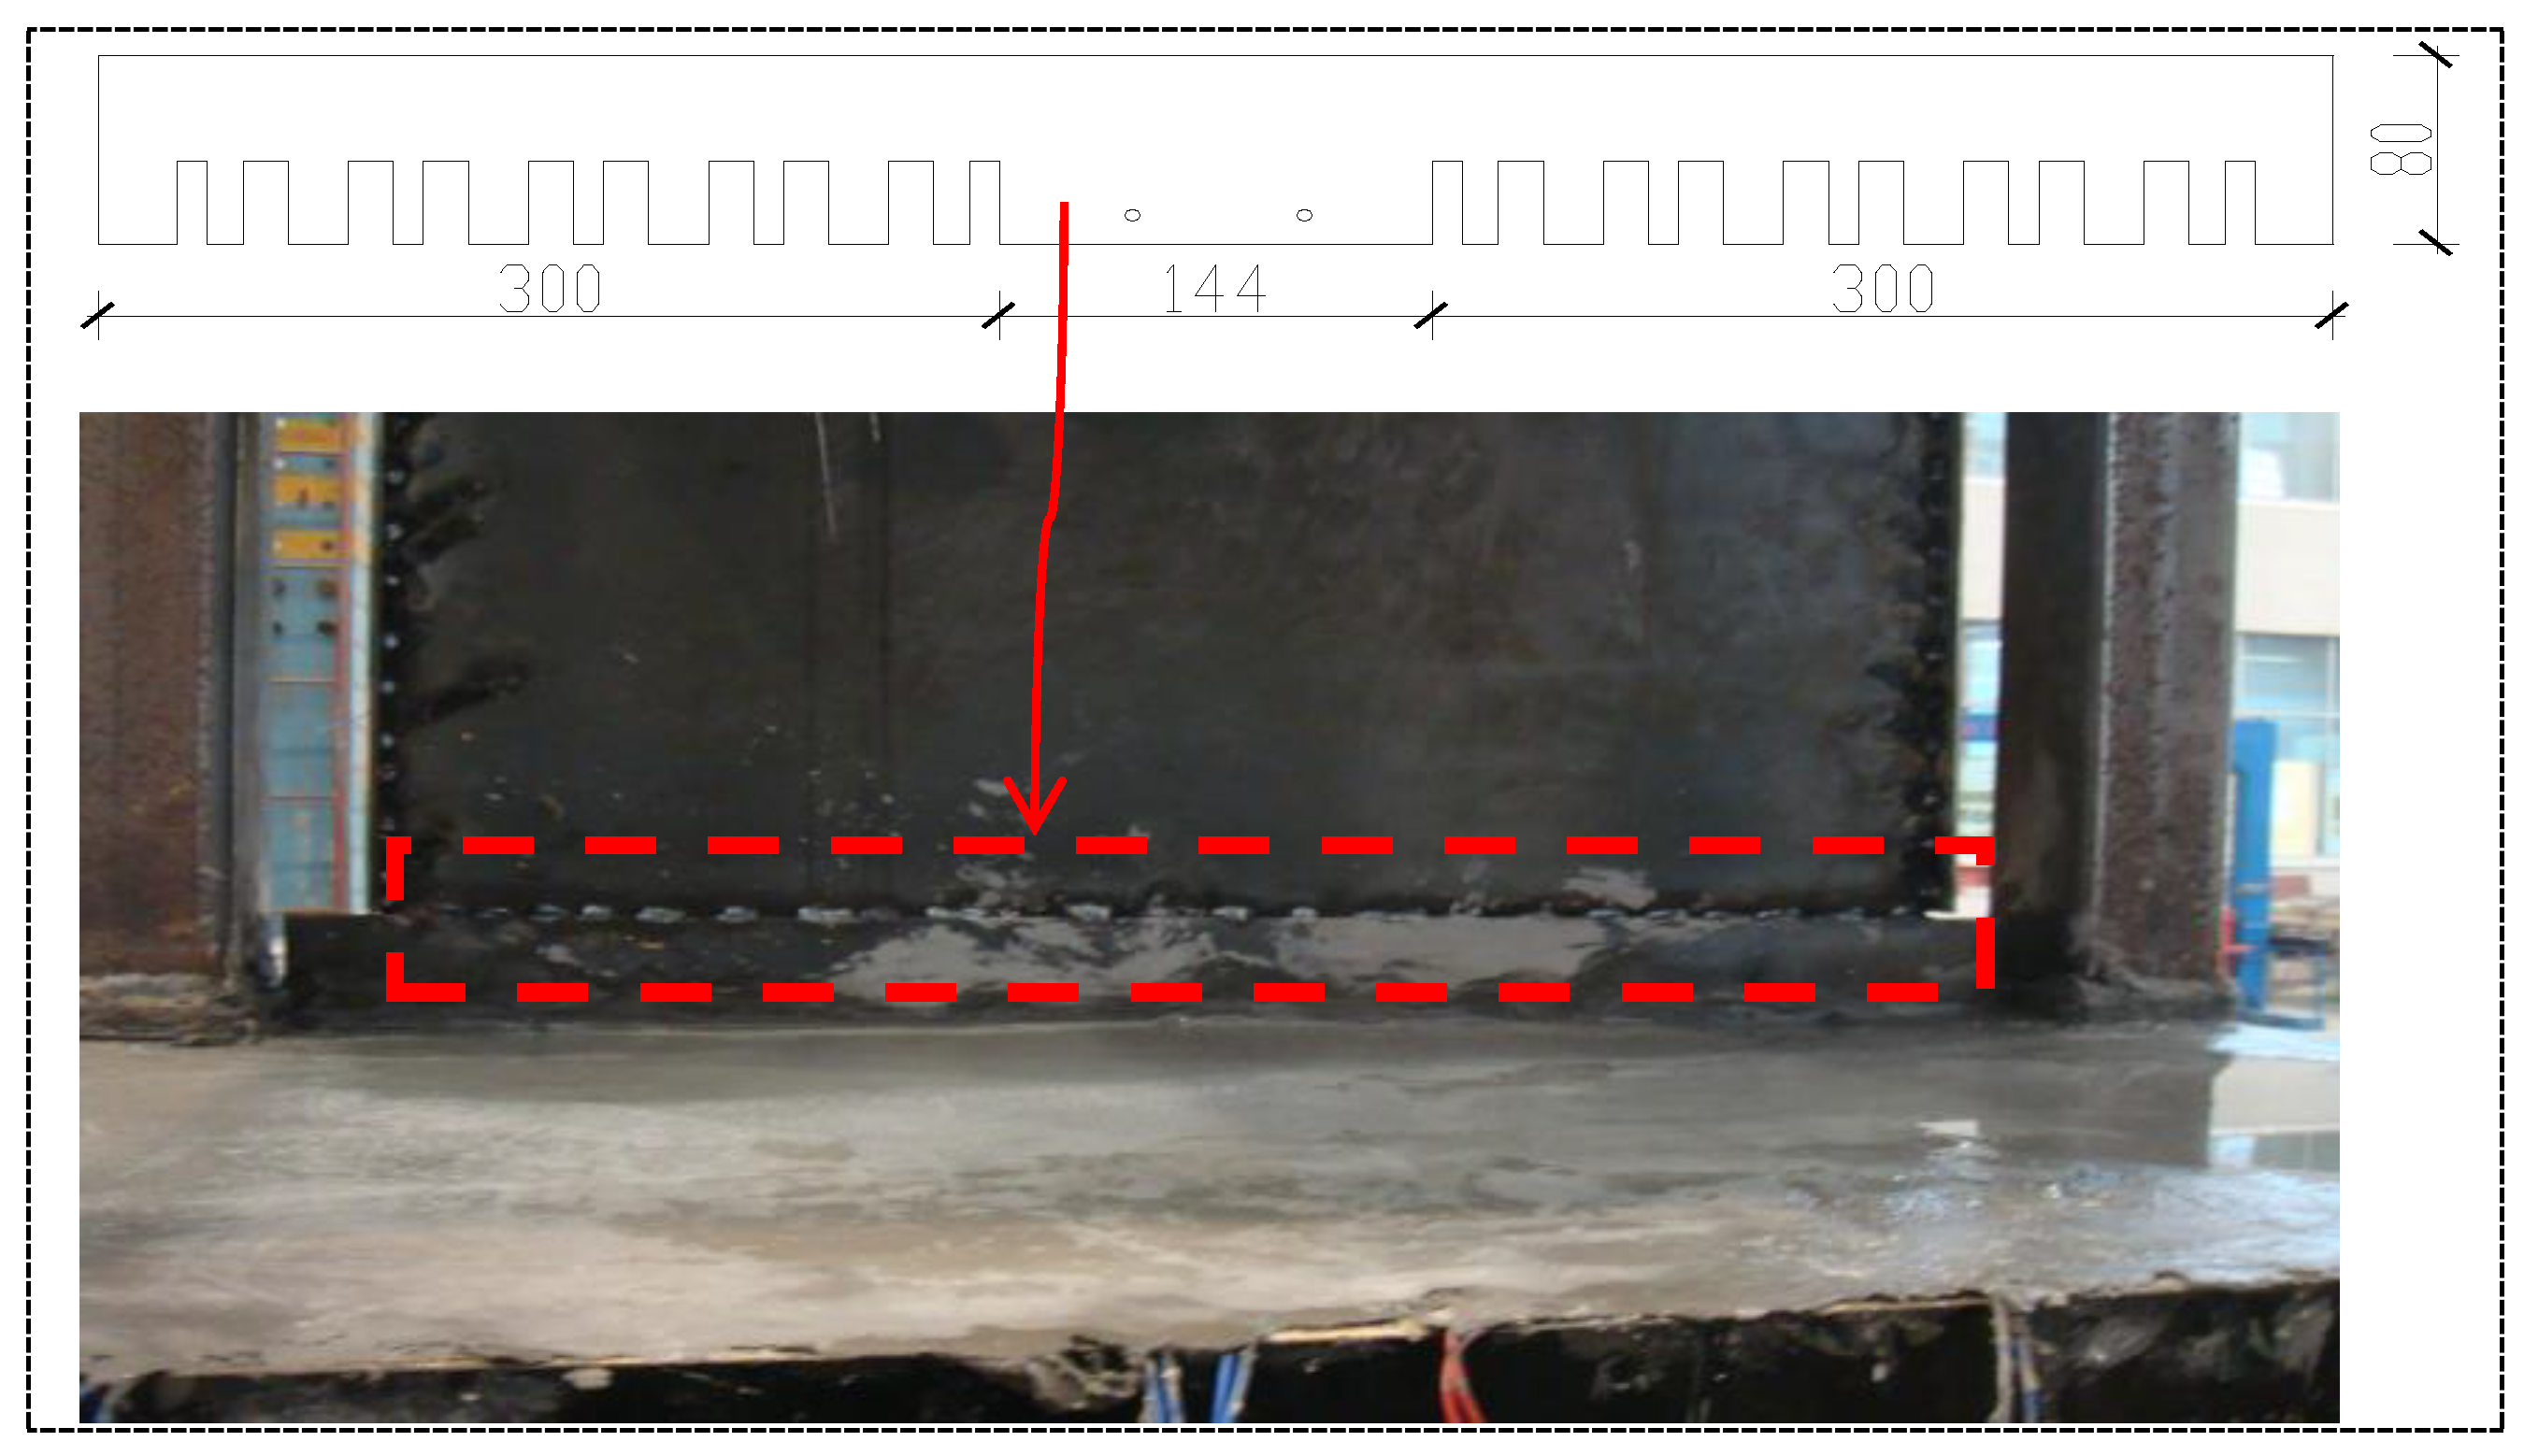
There is almost no crack on SJ2 under the seismic wave of the 100 gal peak PGA. When the peak PGA of the seismic wave increases to 200 gal, a little fine vertical crack appears on the slab side paralleling the long axis, and fine cracks appears on the shear wall. Under El Centro 400 gal, the click sound increases and the shear region appears. A little fine crack appears at the bottom of the long-span floor on each layer and a new vertical crack continues to appear on the slab side.
Under El Centro 620 gal, fine crack appears in the direction of 45 degrees of the plate bottom and a little concrete falls off on the floor of the second layer’s beam–column joints. Meanwhile, the shear wall of the second and the third layers buckles, an obvious cross pull strap is formed and loud clicks can be heard. At this time, the maximum positive displacement of the structure’s integral level reaches 28.29 mm, and the maximum negative displacement −32.73 mm. After the experiment is finished, although there is a little crack on the floor, no crack happens and it can be put into normal use. Except the steel shear wall, the other parts do not buckle and the whole structure does not reach the plastic stage totally. The damage to model SJ2 is shown in
Figure 12 and
Figure 13.
4. Results and Analysis of the Test
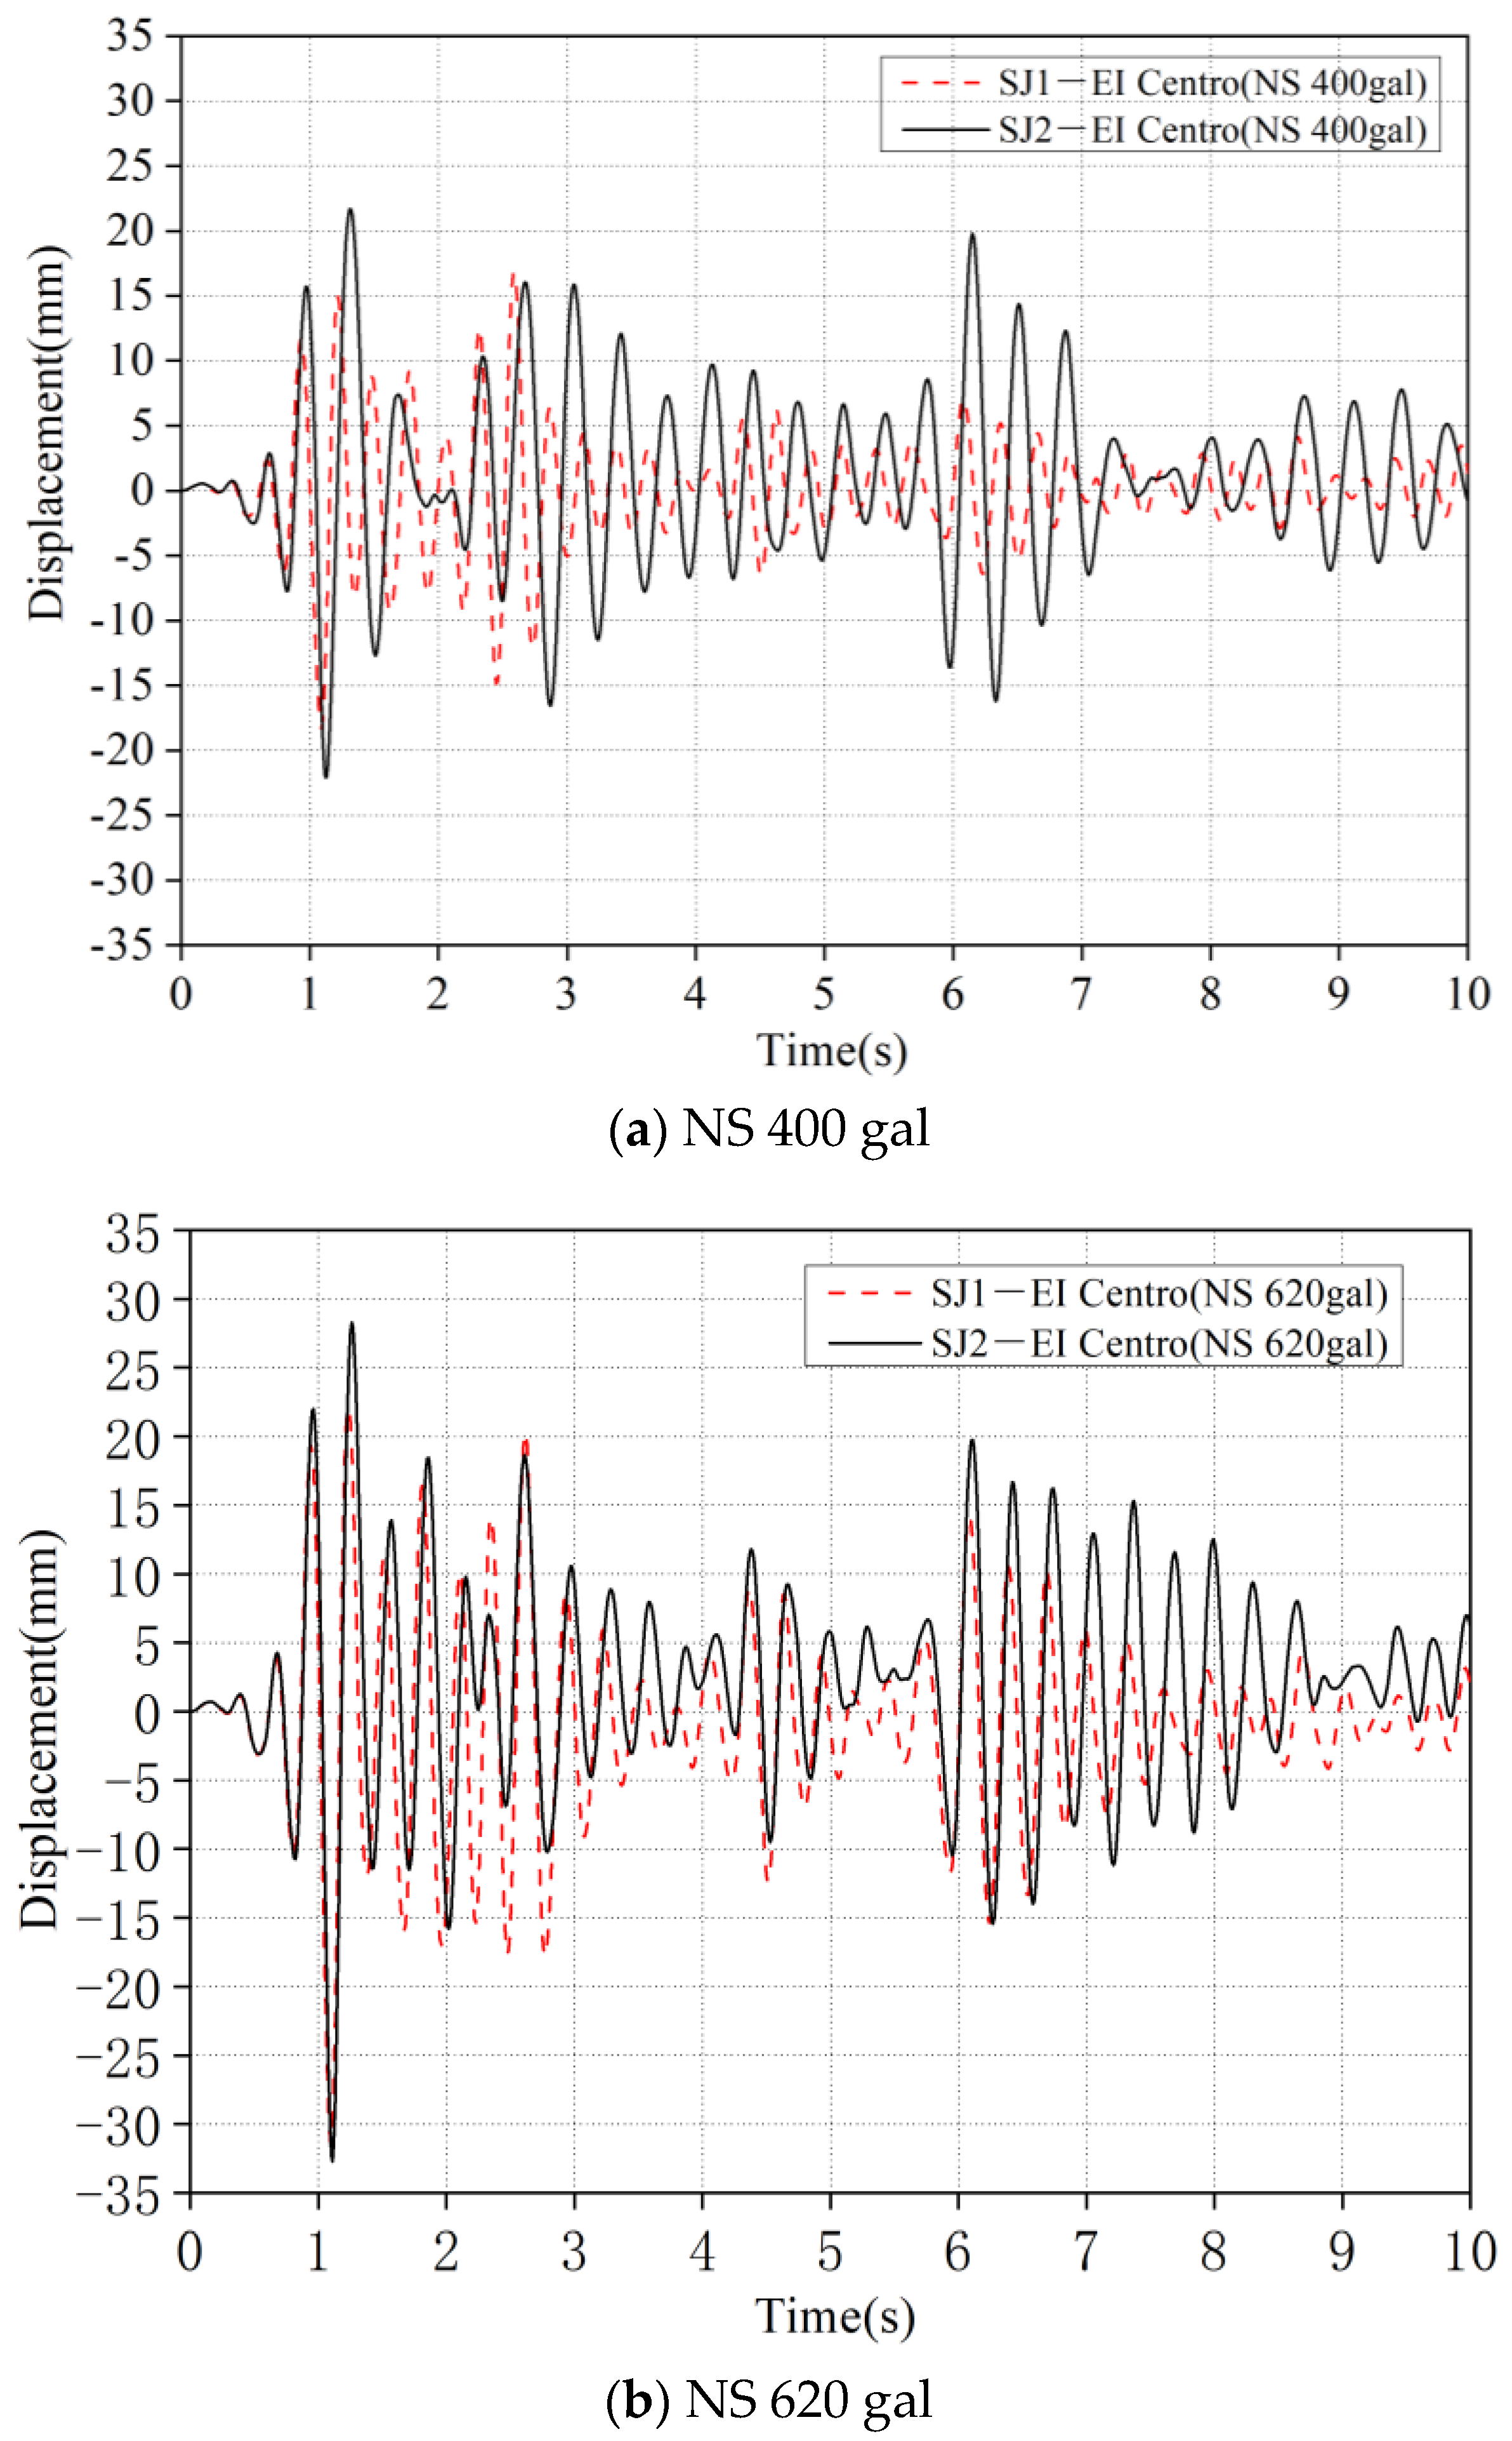
With the almost same reaction rule to both the Taft wave and El Centro wave and a peak PGA of 100 gal and 200 gal, the displacement on the structure’s layer presents the state of uniform variation on the whole. There is less displacement at each layer’s peak and no obvious change happens to the whole structure. Therefore, parts of the test results are only analyzed under El Centro 620 gal and no unnecessary details are given in the other cases.
4.1. Time–History Curve
By analyzing the test data collected by the displacement meter of the joints 3-2, the time–history curve of the test specimen’s horizontal displacement under different working conditions can be obtained, just as
Figure 14 shows. At the same time, the time–history curve of the test specimen’s top restoring force can be obtained.
As is seen above, under different working conditions, the peak displacement appears at the same time with the peak load. In different periods of time and different measuring points, the extreme displacement of SJ2 is a little bigger than that of SJ1, which proves that, compared with SJ1, a certain gap still exists in SJ2, both in the integral performance and in stiffness.
4.2. Joint Displacement
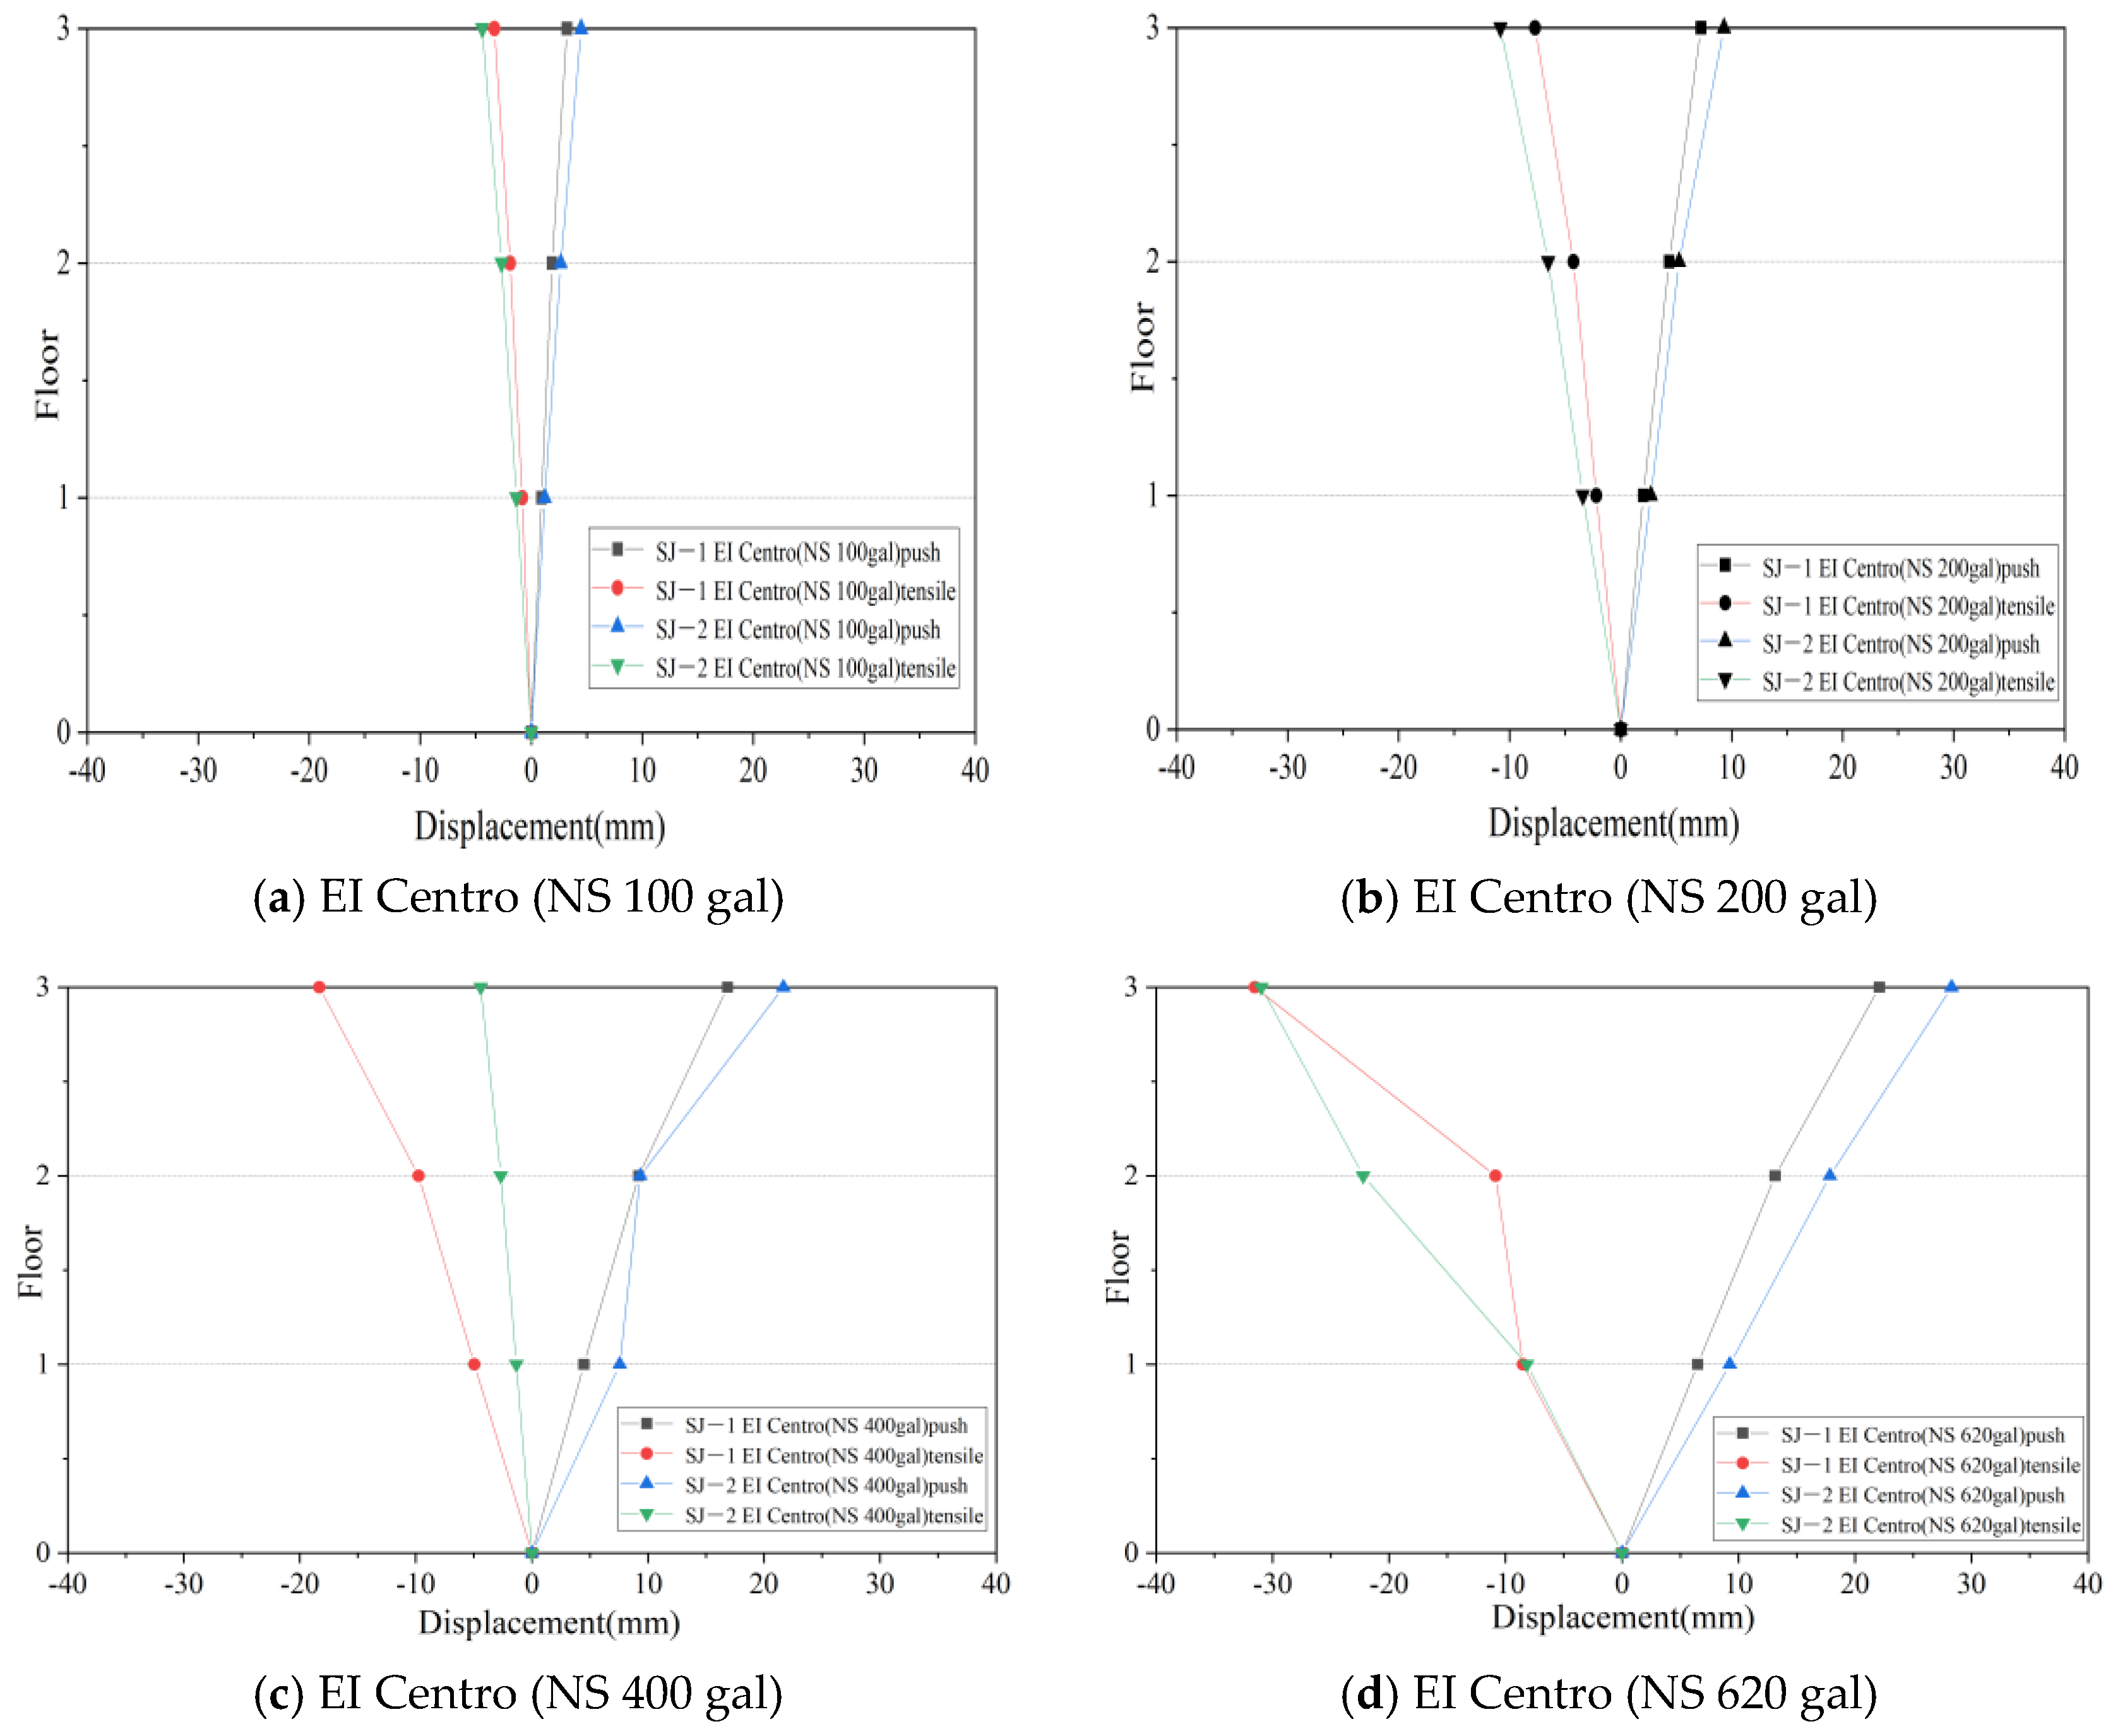
By analyzing the data collected from different joint displacement meters on the second axis, the envelope graph of joint displacement of joints 1-2, 2-2, and 3-2 can be obtained under different working conditions, as is shown in
Figure 15.
Under the influence of the El Centro 100 gal wave and El Centro 200 gal wave, the displacement in different floor changes uniformly and there is small peak displacement. Under the El Centro 400 gal wave and El Centro 620 gal wave, the displacement of the second and the third floors increases suddenly. Meanwhile, under the same working conditions, much deviation occurs to the horizontal displacement in the direction of actuators push–pull, which results from the accumulated damage as the experiment progresses, making the structure’s plastic property emerge gradually. The phenomenon is mainly because the integral rigidity of the test specimen decreases continuously due to the shear wall’s gradual buckling, leading to the displacements’ sudden change. From
Figure 10, under the different working condition, the maximum displacement of different joints in SJ2 is larger than that of SJ1, showing that the whole performance of SJ2 is worse than that of SJ1 and so is the seismic behavior.
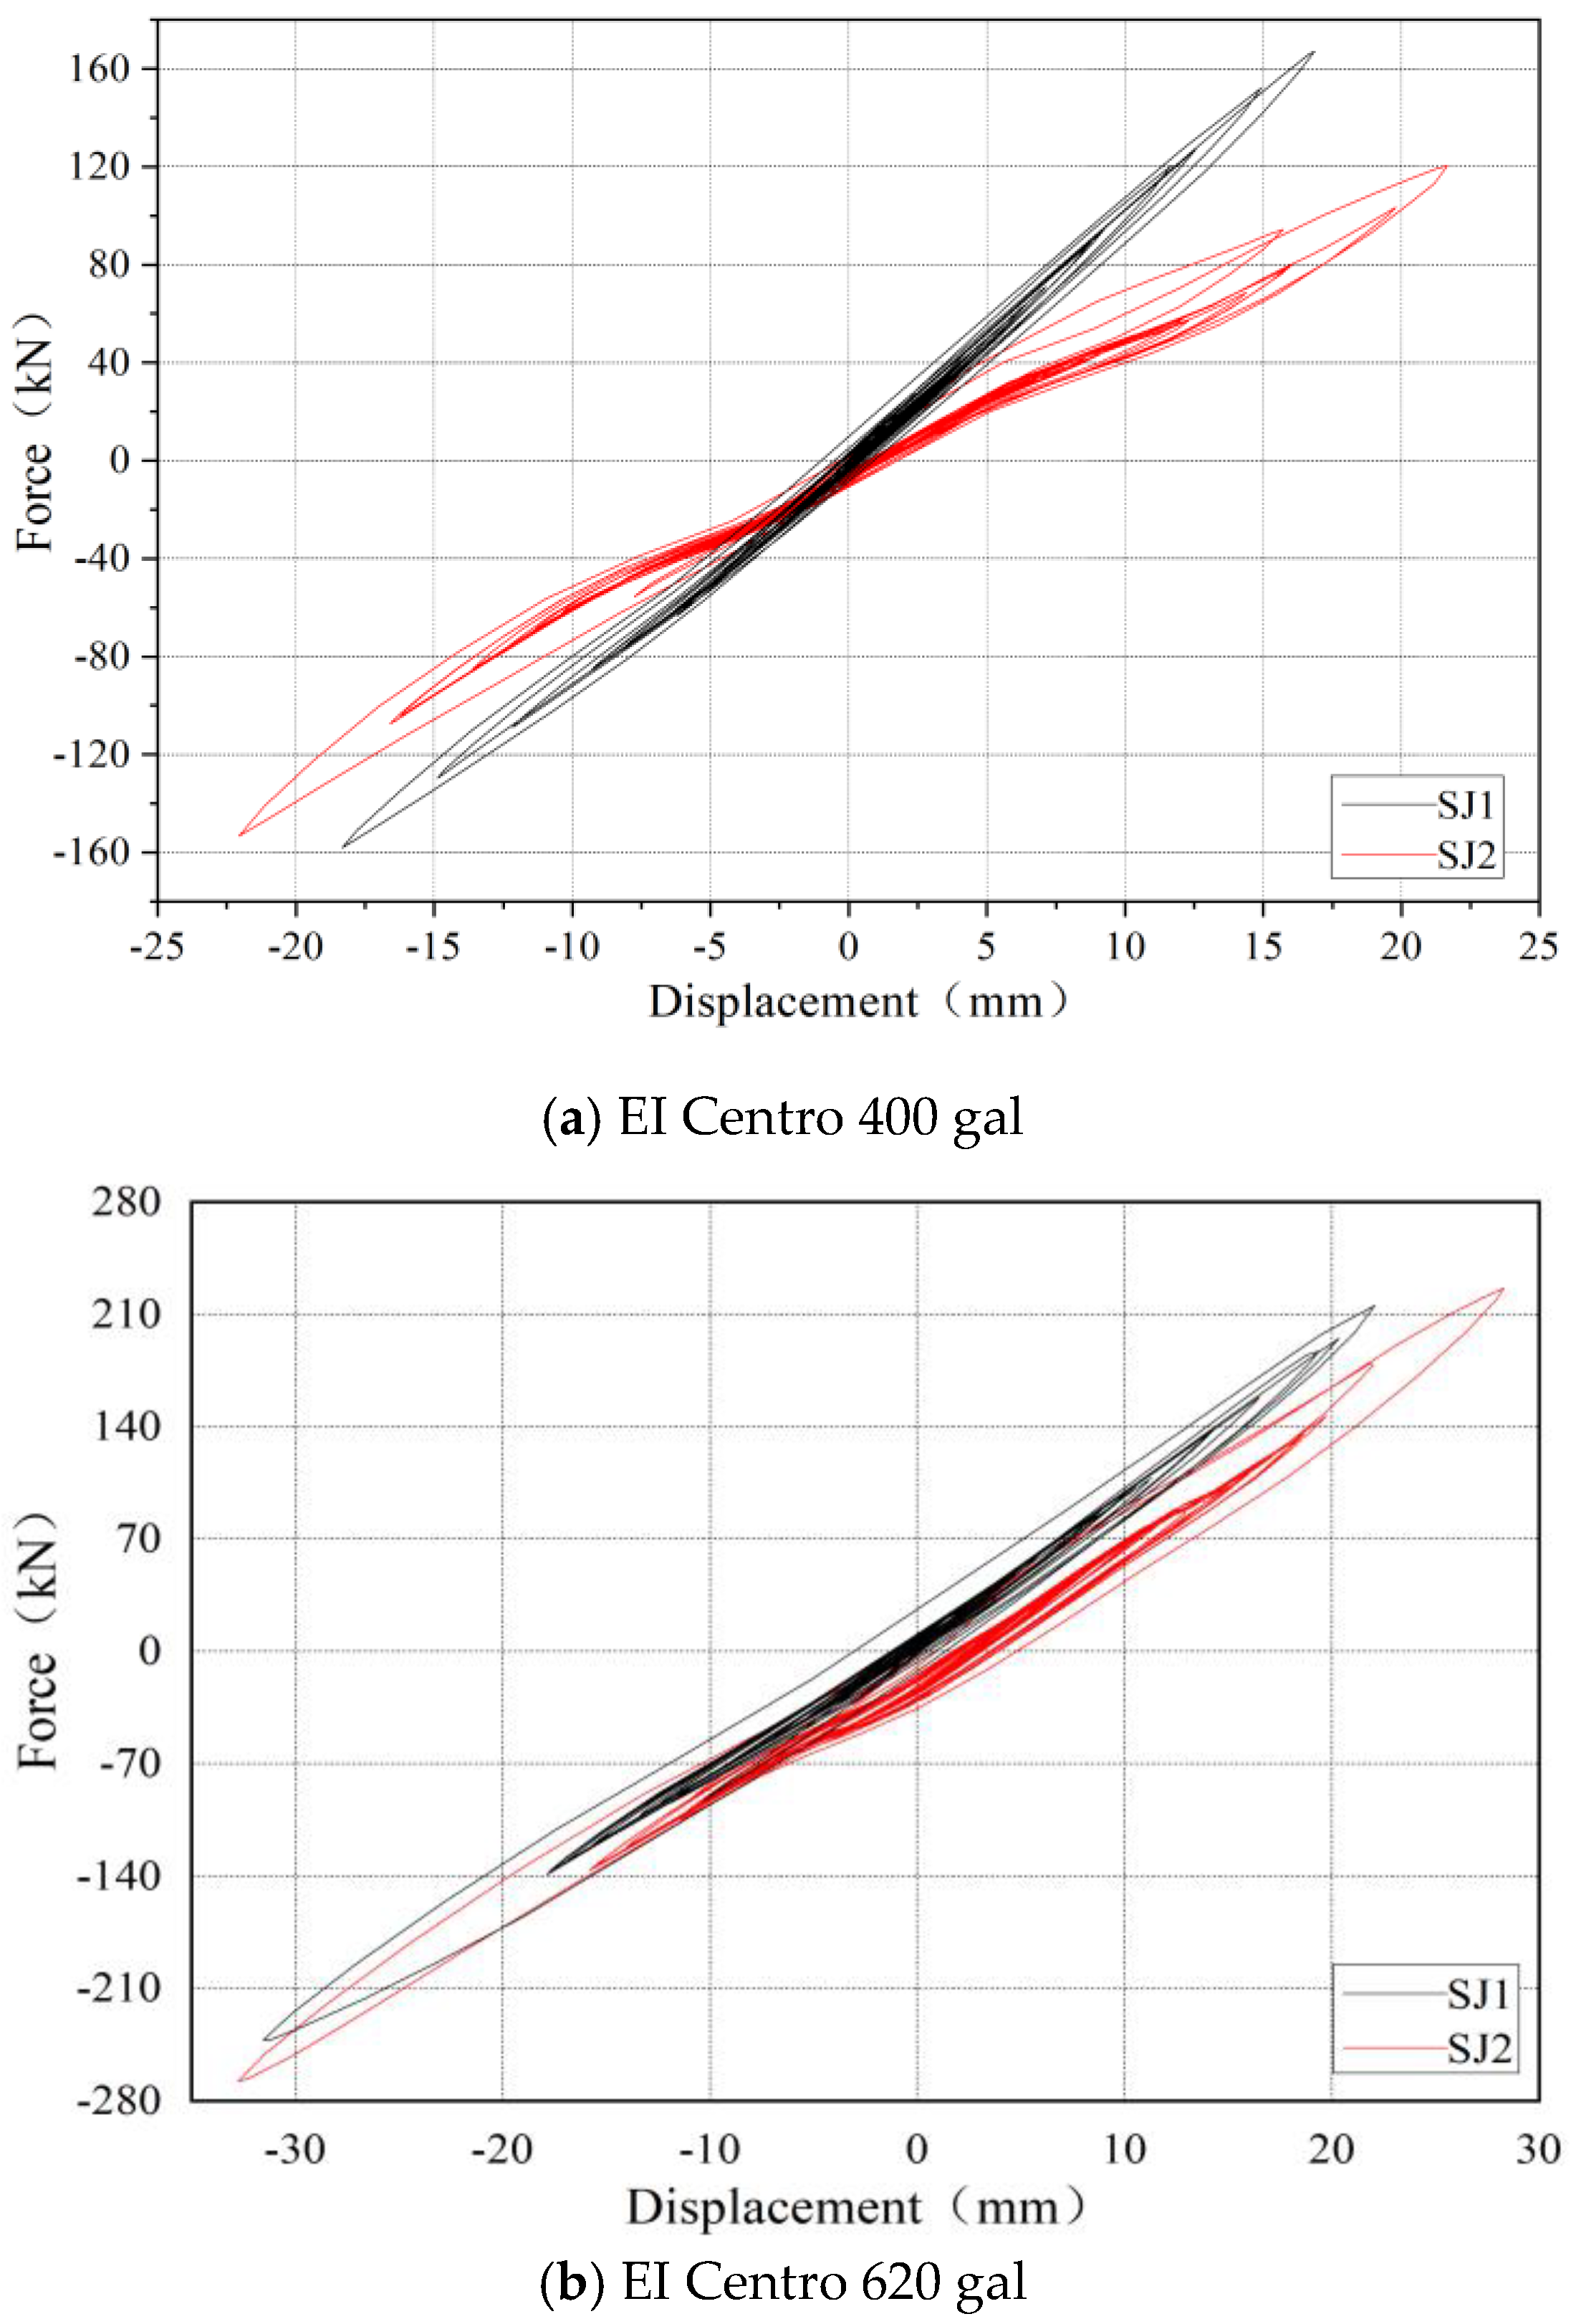
4.3. Hysteresis Loops and Energy Dissipation
The hysteresis loops refer to the relation between the force on the structure and the corresponding displacement. It reflects the restoring force features under the low-frequency cyclic loading, including these mechanical characteristics such as strength stiffness deformation, ductility, and energy-dissipating capacity and it is the comprehensive reflection of anti-seismic property. In this test, the study is carried out with the structural model being the equivalent of a single-freedom system.
By the top displacement, the top equivalent displacement of the equivalent single-freedom system can be calculated according to the reference [
14], corresponding to the restoring force and the hysteresis curves of equivalent vertex force–displacement can be obtained under different working conditions, as is seen in
Figure 11.
Under the seismic force of 100 gal and 200 gal, small horizontal displacement happens to the structure. The relationship between the equivalent force and displacement change appears to be linear and flat hysteresis curves are formed. With the increase in the seismic wave’s PGA, the hysteresis loop area increases gradually and the structure’s energy dissipation capacity constantly increase as well. However, during the process of the test, an apparent pinching phenomenon appears on the hysteresis loops. The reason is that in the steel frame–shear wall system, the steel shear wall structure bears the horizontal load during the initial period and plays a leading role in energy dissipation. However, with the test load continuously increasing, the shear wall gradually buckles, stiffness degenerates little by little, and then the pinching phenomenon appears on the hysteresis curves [
10,
18].
From
Figure 16, under different working conditions, although the displacement of SJ2 is bigger than that of SJ1, the area of SJ2′s hysteresis curves is larger than that of SJ1, which shows that SJ2 has better energy dissipation and anti-seismic properties than SJ1.
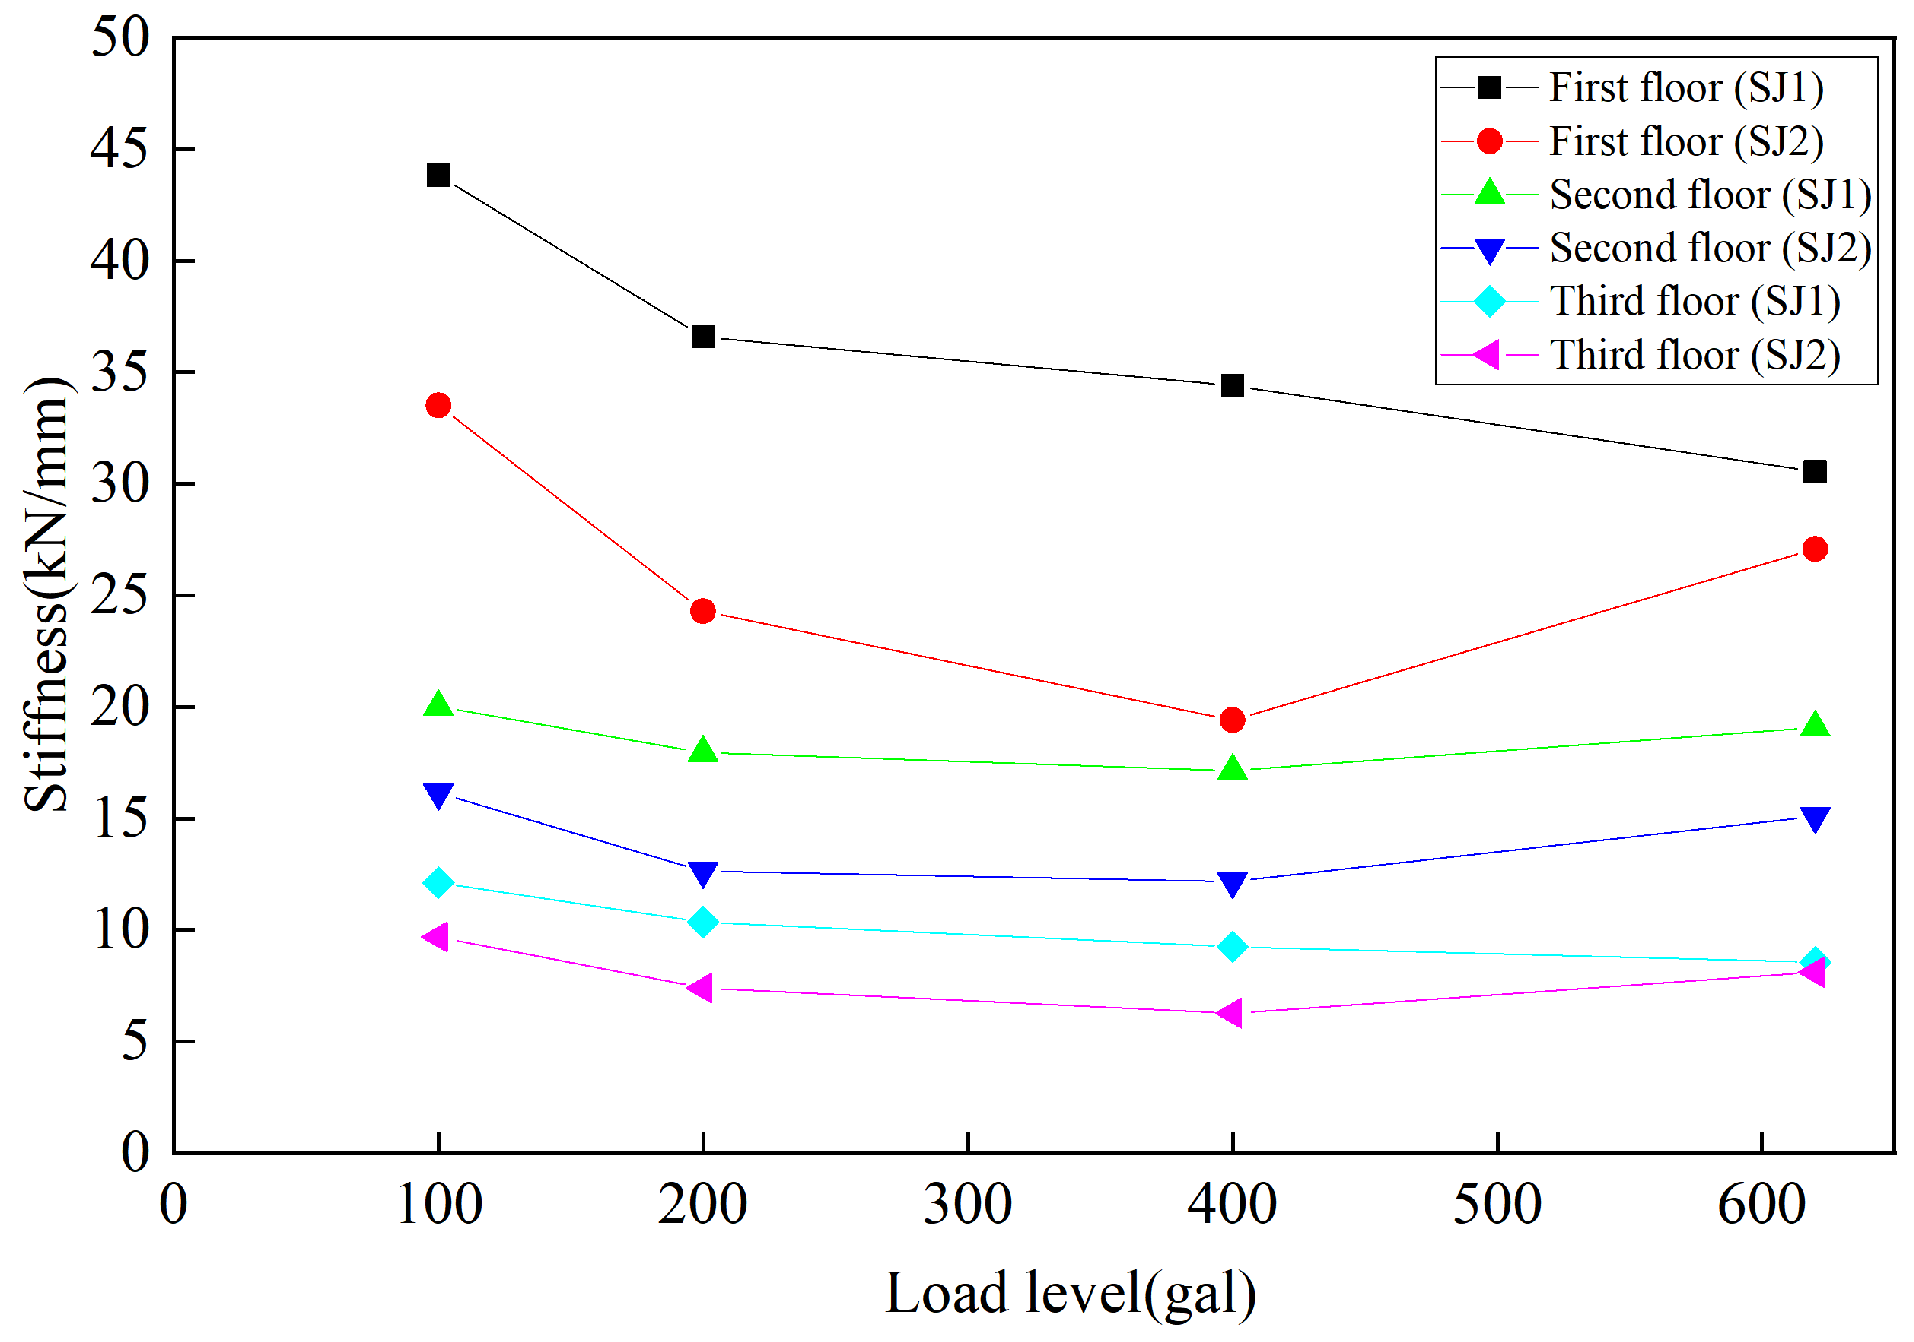
4.4. Story Stiffness
Before the pseudo-dynamic test is conducted, the story stiffness of the model needs to be measured to be combined into the model’s initial stiffness matrix as part of the test’s conditions. The structure’s story stiffness is measured so as to learn whether accumulated damage and stiffness degeneration appear in the test. In the test, the mean stiffness is adopted to evaluate the model’s stiffness degeneration. That is to say, under the same working conditions, the quotient is taken, which is calculated from the load absolute value from the positive and negative directions divided by that of corresponding displacement.
is used to express its value [
19]:
In the formula, and are the maximum load value and corresponding displacement under the i level working condition.
According to the experimental data, the floor shear and mean stiffness of the test structure under the different working conditions can be seen in
Table 4.
From
Figure 17, it can be seen that under the earthquake, the structure’s base shear shows the linear variation with the number of the seismic PGA. Under different conditions, the floor mean stiffness of SJ1 is bigger than that of SJ2. With seismic acceleration continuously increasing, the stiffness of SJ1 and SJ2 decreases with the accumulated structural damage, having the approximately same changing trend.
5. Conclusions
By the pseudo-dynamic test research of two models according to the reduced scale of 1:4, one of which is a cast-in-place floor frame–shear wall structure (SJ1) with a two-span and three-story and the other is a precast monolithic floor frame–shear wall structure with X horizontal braces, the anti-seismic property indexes can be analyzed and obtained, including failure mechanism, deformation, energy dissipation, rigidity degeneration, and so on. The following conclusions can be obtained.
- (1)
The steel shear hybrid structure has a good deformation restoring capacity with small residual deformation after unloading. The model’s hysteretic curve shows that the steel frame–shear wall composite structure has a good carrying capacity and lateral rigidity;
- (2)
The steel frame–shear wall composite structure system has a good integral performance and anti-seismic properties. Under the influence of horizontal earthquake, the shear wall bears the major shearing force of the structure, that is to say, the shear wall enters the plastic stage firstly and the structural damage begins with the shear wall’s yielding;
- (3)
With the increase in the seismic wave’s PGA, there are some differences in integral performance and anti-seismic properties between SJ2 and SJ1, but the operational requirements can be satisfied. Therefore, it is suggested that the post-cast surface should be cancelled in the seismic area with a fortification intensity under 8 degrees in order to reduce structural self-weight, while in a seismic area with a fortification intensity above 8 degrees, preserving the post-cast surface of the fabricated floor is suggested.
Author Contributions
Conceptualization, writing—original draft, C.H.; Conceptualization, writing—review and editing, X.D.; Conceptualization, Q.S.; Formal analysis, C.D.; Methodology, G.T. All authors have read and agreed to the published version of the manuscript.
Funding
The Key scientific research projects of colleges and universities in Henan Province (no. 22A410005), China Postdoctoral Science Foundation Funded Project (no. 2023M731007), The Open Research Fund of Key Laboratory of Engineering Geophysical Prospecting and Detection of Chinese Geophysical Society (no. CJ2021GA07).
Data Availability Statement
The original contributions presented in the study are included in the article, further inquiries can be directed to the corresponding author/s.
Conflicts of Interest
Author Dong Xinhong and Author Su Qunshan were employed by the company Henan D.R. Construction Group Co., LTD and Henan Fair-Faced Concrete Engineering Technology Research Center. Author Duan Chunming was employed by the company State Grid Jibei Engineering Management Company. And author Tian Guoping was employed by the company State Nuclear Electric Power Planning Design&Research Institute Co., LTD. The remaining authors declare that the research was conducted in the absence of any commercial or financial relationships that could be construed as a potential conflict of interest.
References
- Sun, G.X.; Ma, X.R.; Zhang, W.Q.; Sun, L. Constructing assembled type residence pushes forward industrialization of residential construction. Hous. Sci. 2010, 12, 34–37. [Google Scholar]
- Xue, W.C. Research Progress of Precast Concrete Frame Residential System; Housing Industrialization Promotion Center of Housing and Urban-Rural Development: Harbin, China, 2010. [Google Scholar]
- Fleischman, R.B.; Restrepo, J.I.; Naito, C.J.; Sause, R.; Zhang, D.; Schoettler, M. Integrated analytical and experimental research to develop a new seismic design methodology for precast concrete diaphragms. J. Struct. Eng. 2013, 139, 1192–1204. [Google Scholar] [CrossRef]
- Fleischman, R.B.; Farrow, K.T.; Eastman, K. Seismic performance of perimeter lateral-system structures with highly flexible diaphragms. Earthq. Spectra 2002, 18, 251–286. [Google Scholar] [CrossRef]
- Restrepo, J.I. Preliminary results of the shake-table testing for the development of a diaphragm seismic design methodology. PCI J. 2009, 54, 100–124. [Google Scholar]
- Ren, R.; Naito, C. Precast concrete diaphragm connector performance database. J. Build. Struct. 2012, 139, 15–27. [Google Scholar] [CrossRef]
- Nie, J.G.; Che, G.; Sun, C.W.; Zhou, J.J.; Lian, H.Y. Experimental study of steel and concrete composite floor space. J. Tsinghua Univ. (Sci. Technol.) 2005, 45, 749–752. [Google Scholar]
- Lu, T.J.; Qin, S.J.; Luo, Y.S.; Yu, Z.W. Pseudo-dynamic experimental study on high rise steel-concrete hybrid structure. J. Build. Struct. 2009, 30, 27–35. [Google Scholar]
- Zhang, D.C.; Fleischman, R.B. Establishment of performance-based seismic design factors for precast concrete floor diaphragms. Earthq. Eng. Struct. D. 2016, 45, 675–698. [Google Scholar] [CrossRef]
- Zheng, X.C.; Li, Q.N.; Pan, S.B.; Jiang, W.S. The shaking table test on a prefabricated integral frame-shear wall structure with a new prefabricated floor. J. Earthq. Eng. Eng. Vib. 2013, 33, 140–147. [Google Scholar]
- Leonhard, F.N. Vorteilhafters Verbundmittel fur Stahlverbund-Tragwerke mit Hoher Dauerfestigkeit. Beuton-und Stahlbetonbau 1987, 12, 325–331. [Google Scholar] [CrossRef]
- JGJ101-96; Specificating of Testing Methods for Earthquake Resistant Building. China Architecture & Building Press: Beijing, China, 1997. (In Chinese)
- Li, Q.N.; Chen, M.G.; Jiang, W.S. Shaking table test study on a new assembled monolithic floor-steelplate and frame shear wall structure. Sichuan Build. Sci. 2014, 40, 158–163. [Google Scholar]
- Liang, X.W. The Design Theory and Method of Structural Seismic Performance; China Science Press: Beijing, China, 2011. (In Chinese) [Google Scholar]
- Guo, M.H.; Tang, D.X.; Wu, Z.S. An Equivalent SDOF Method of Interface Moment Simulation in Sub-structural PSD Test. Proceedings of PR.C/U.S. Workshop on Experimental Methods in Earthquake Engineering, Shanghai, China, 10–12 November 1992; pp. 10–12. [Google Scholar]
- Fan, L.; Zhao, B.; Lv, X.L. Discussion on Some Problems in Pseudodynamic Tests. Struct. Eng. 2006, 22, 50–53. [Google Scholar]
- GB50011; Code for Seismic Design of Buildings. China Architecture & Building Press: Beijing, China, 2010.
- Chen, B.W.; Wang, H.B.; Shen, P.S. Reinforced concrete tube in tube structure pseudo dynamic test study and theoretical analysis. J. Earthq. Eng. Eng. Vib. 2006, 26, 87–92. [Google Scholar]
- Liu, R.J. Frame—Shear Wall Structure Pseudo Dynamic Test and Elastic-Plastic Finite Element Analysis. Master’s Thesis, Xi’an University of Architecture and Technology, Xi’an, China, 2004. [Google Scholar]
Figure 1.
Plan layout and bottom braces (units: mm).
Figure 1.
Plan layout and bottom braces (units: mm).
Figure 2.
Elevation layout (units: mm).
Figure 2.
Elevation layout (units: mm).
Figure 3.
Connector of slab–steel beam (units: mm): (a) detailed drawing of specimen dimensions; (b) serpentine bar; (c) layout diagram of connector of slab–steel beam.
Figure 3.
Connector of slab–steel beam (units: mm): (a) detailed drawing of specimen dimensions; (b) serpentine bar; (c) layout diagram of connector of slab–steel beam.
Figure 4.
Connector of precast hollow core slab (units: mm).
Figure 4.
Connector of precast hollow core slab (units: mm).
Figure 5.
Connector of shear wall and ear plate.
Figure 5.
Connector of shear wall and ear plate.
Figure 6.
precast hollow core diaphragm (units: mm).
Figure 6.
precast hollow core diaphragm (units: mm).
Figure 7.
Construction process of structural model SJ2.
Figure 7.
Construction process of structural model SJ2.
Figure 8.
Test layout (units: mm).
Figure 8.
Test layout (units: mm).
Figure 9.
Elevation layout of the displacement meter arrangement.
Figure 9.
Elevation layout of the displacement meter arrangement.
Figure 10.
Cracks in the floor of SJ1 model.
Figure 10.
Cracks in the floor of SJ1 model.
Figure 11.
Shear wall tension band of SJ1 model.
Figure 11.
Shear wall tension band of SJ1 model.
Figure 12.
Cracks in the floor of SJ2 model.
Figure 12.
Cracks in the floor of SJ2 model.
Figure 13.
Shear wall tension band of SJ2 model.
Figure 13.
Shear wall tension band of SJ2 model.
Figure 14.
Roof displacement time–history curves.
Figure 14.
Roof displacement time–history curves.
Figure 15.
Joint displacement.
Figure 15.
Joint displacement.
Figure 16.
Hysteresis curves.
Figure 16.
Hysteresis curves.
Figure 17.
Stiffness degradation curve.
Figure 17.
Stiffness degradation curve.
Table 1.
Model similarity relation.
Table 1.
Model similarity relation.
| Physical Quantities | Length | Area | Elastic Modulus | Shear Modulus | Mass |
|---|
| Similarity coefficient | 1/4 | 1/16 | 1 | 1 | 1/16 |
| Physical quantities | Time | Velocity | PGA | Poisson’s ratio | Frequency |
| Similarity coefficient | 1/2 | 1/2 | 1 | 1 | 2 |
Table 2.
Specimens prototype and scaled dimensions (units: mm).
Table 2.
Specimens prototype and scaled dimensions (units: mm).
| Type | The Section Size of Prototype | The Section Size of Model |
|---|
| Beam | 400 × 200 × 12 × 12 | 100 × 68 × 4.5 × 7.5 |
| Column | 320 × 320 | 80 × 80 |
| Steel plate shear wall | 2600 × 2600 × 6 | 650 × 650 × 3 |
| Square steel tube (X-bracing) | 200 × 160 | 50 × 4 |
Table 3.
Mechanical properties of materials.
Table 3.
Mechanical properties of materials.
| Type | Yield Strength (MPa) | Ultimate Strength (MPa) | Compressive Strength Ductility |
|---|
| Steel | 236.1 | 350.5 | 25.43 |
| Concrete | - | - | 31.2 |
| High-strength steel wire | 1200 | - | - |
Table 4.
The test model’s weight (units: kg).
Table 4.
The test model’s weight (units: kg).
| Layer | Prototype Mass | Model Mass | Weight | Steel-Bearing Mass |
|---|
| 1 | 18,096 | 484 | 647 | 897 |
| 2 | 19,401 | 498 | 715 |
| 3 | 19,401 | 498 | 715 |
| Total | 56,898 | 1480 | 3556 |
| Disclaimer/Publisher’s Note: The statements, opinions and data contained in all publications are solely those of the individual author(s) and contributor(s) and not of MDPI and/or the editor(s). MDPI and/or the editor(s) disclaim responsibility for any injury to people or property resulting from any ideas, methods, instructions or products referred to in the content. |
© 2024 by the authors. Licensee MDPI, Basel, Switzerland. This article is an open access article distributed under the terms and conditions of the Creative Commons Attribution (CC BY) license (https://creativecommons.org/licenses/by/4.0/).


