Article

Shear Performance of Demountable High-Strength Bolted Connectors: An Experimental and Numerical Study Based on Reverse Push-Out Tests

1
Shandong Provincial Key Laboratory of Civil Engineering Disaster Prevention and Mitigation, Shandong University of Science and Technology, Qingdao 266590, China
2
College of Civil Engineering and Architecture, Shandong University of Science and Technology, Qingdao 266590, China
3
Caoxian Highway Development Center, Heze 274000, China
*
Author to whom correspondence should be addressed.
Buildings 2024, 14(4), 1052; https://doi.org/10.3390/buildings14041052
Submission received: 9 March 2024 / Revised: 31 March 2024 / Accepted: 8 April 2024 / Published: 9 April 2024
(This article belongs to the Section Building Structures)

Abstract

:
Steel–concrete composite beams, essential for large-span structures, benefit from connectors that reduce cracking at the supports. The crack resistance and alignment with sustainable building trends of high-strength bolted connectors have been extensively researched. Nevertheless, only a few studies exist on their load–slip behavior in hogging sections. In this study, the shear performance of high-strength bolted connectors subjected to tension due to hogging moments was studied based on experiments and numerical modeling according to numerous reverse push-out tests. The results revealed that tensile and splitting cracks were produced in the concrete. Their distribution was affected primarily by the concrete strength and bolt diameter; this distribution became denser at decreasing concrete strengths and increasing bolt diameters. Subsequently, an analysis of the out-of-plane displacement and load–slip response was performed to investigate the phenomenon of anchor rod sliding. A cost-effective and time-efficient finite-element (FE) model was developed to investigate the internal microstates of the specimens. It revealed a correlation between bolt cracking, specimen hardening, steel yield, and failure. A correction factor is also proposed for the shear capacity of bolts within concrete subjected to tension. The findings offer insights into the load–slip response of high-strength bolted connectors subjected to hogging moments, aiding in safer, more durable supports for steel–concrete composite beams.

1. Introduction

Steel–concrete composite beams are extensively used in large-span bridges and buildings because of their excellent cross-sectional properties. However, the concrete at the support, which is subjected to hogging moments, is prone to tension-induced cracking, posing a threat to the structure’s durability and stiffness. Addressing this concern commonly involves the enhancement of the concrete properties in the tensile zone to elevate its cracking load and reduce the occurrence rate and crack widths. Illustrative engineering approaches include the use of prestressed concrete [1,2,3], fiber-reinforced concrete [4,5], engineered cementitious composites [6], ultrahigh-performance concrete [7,8], and the incorporation of high-performance concrete overlays utilizing a wire mesh atop conventional concrete slabs [9]. Another practical measure involves modifying the form of the shear connectors. Conventional headed studs welded to steel girders are in direct contact with both the concrete and the girder, which renders the concrete susceptible to tension cracking. Consequently, connectors have been developed to enable sliding between the steel girder and concrete slab, thereby relieving tension stresses in the concrete subjected to hogging moments. Nie et al. [10] and Li et al. [11] proposed three new uplift-restricted and slip-permitted connectors—that is, a sliding-type, T-shape, and screw-type—that could improve the crack resistance of concrete slabs without weakening the overall stiffness and ultimate capacity of the composite beams. Su et al. [12,13] investigated the effects of rubber-sleeved stud connectors using experiments and simulations and concluded that these connectors exhibited limited interactions and could reduce the risk of cracking with little or no impact on the shear strength. High-strength bolted connectors with sliding characteristics could also relieve tensile stresses in concrete. Hogging moment tests [14,15] have demonstrated that composite beams with high-strength bolted connectors displayed enhanced crack resistance compared with their counterparts with conventional welded studs. Thus, high-strength bolted connectors that can transmit forces by sliding through installation apertures should be examined for their potential to suppress concrete cracks when subjected to hogging moments.
In addition to their aforementioned benefits of crack resistance, the ease of deconstruction and installation of bolted connectors that align with sustainable development and prefabricated building trends has resulted in increased attention on the use of bolted connectors in recent years. Consequently, extensive studies have been undertaken on bolted connectors. Push-off tests conducted by Dai et al. [16] demonstrated that deconstructable threaded stud connectors exhibited bearing capacities similar to those of welded studs. Ataei et al. [17] further demonstrated that composite beams incorporating high-strength bolted connectors exhibited greater ductility compared with those featuring conventional welded studs. Using single-shear connector tests, Kwon et al. [18] concluded that post-installed, high-strength bolted connectors had superior fatigue strength compared with the strength of welding studs.
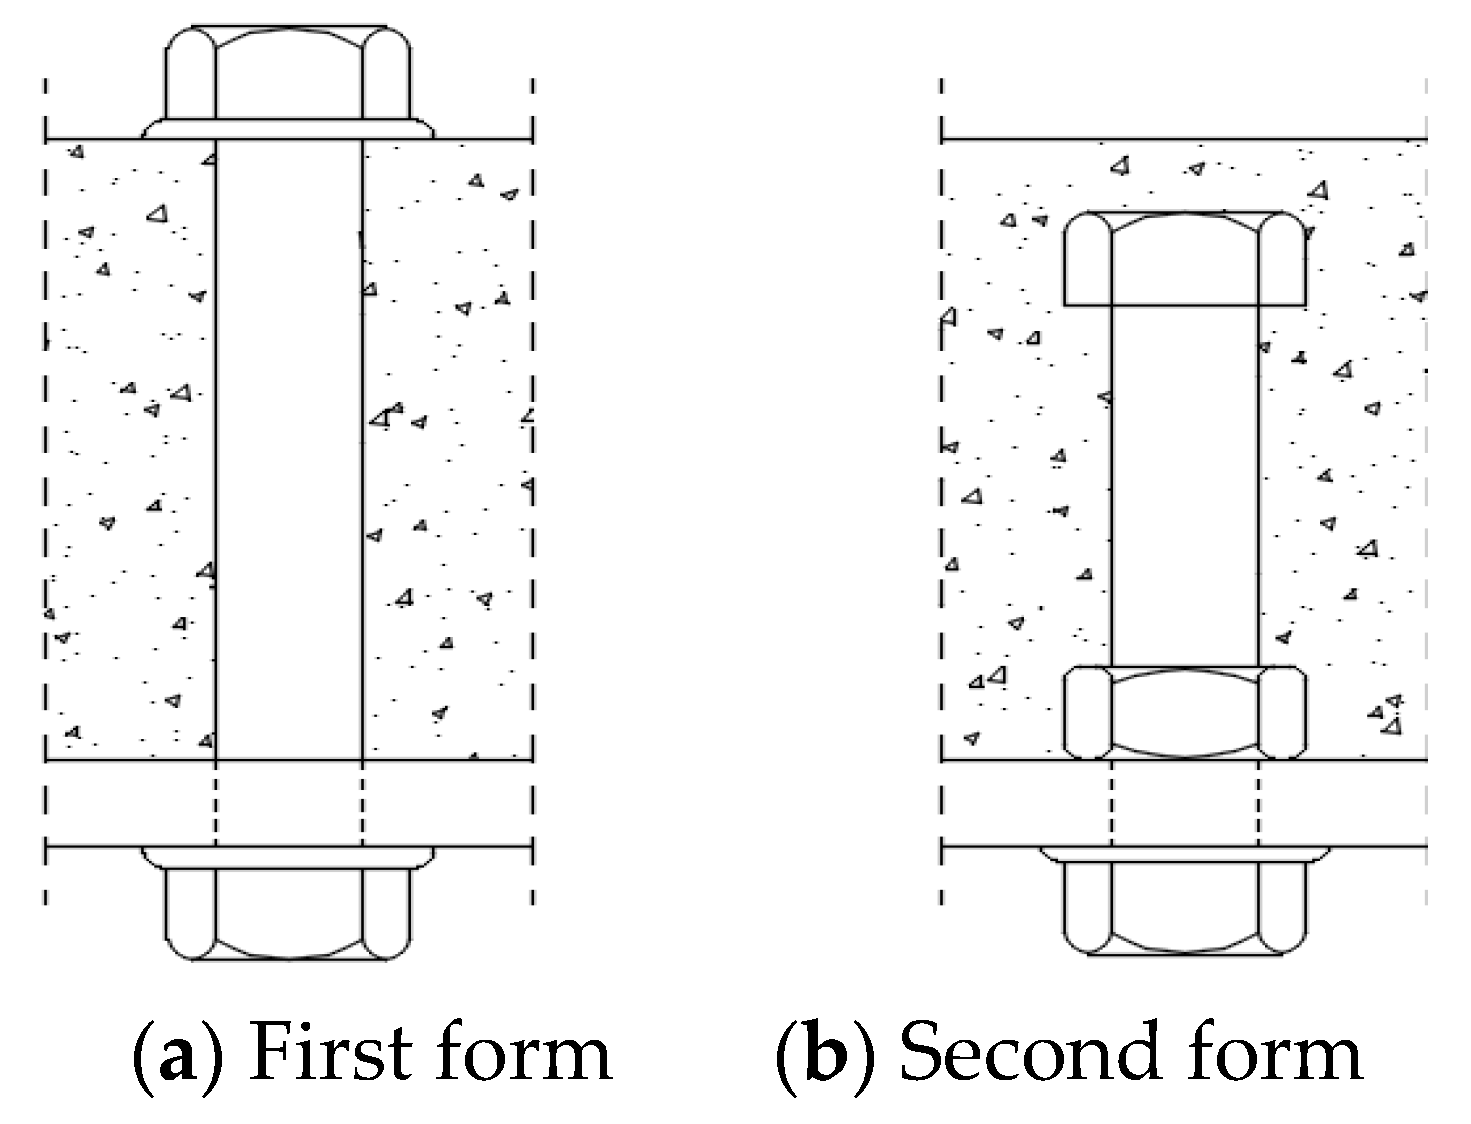
Two main types of high-strength bolted connectors are shown in Figure 1. Both tend to transmit shear forces due to the generated friction by applying pretension to the high-strength bolts. This frictional transfer mechanism enables a composite beam with a partial shear connection to achieve an initial stiffness close to that of a beam with a full shear connection [17]. Sliding occurs when the interface shear exceeds the maximum friction, and stops when the bolted shank is obstructed by the hole wall. This can be summarized in the “full–zero–full” shear-interaction model [19]; the mechanism can be advantageous in inhibiting the cracking of concrete subjected to tension. In a push test conducted to determine the load-carrying capacity of connectors, Lee et al. [19] attributed the load–slip curve to three distinctive stages of full–zero–partial interaction. Based on experimental tests and finite element (FE) analysis, Liu et al. [20] demonstrated the three distinct stages of the load–slip response, namely the early strong stiffness, sliding after overcoming friction, and third-stage characteristics following bearing pressure. Zhang et al. [21] summarized these four stages—that is, frictional transfer, slip, bolt shank transfer, and failure. Moreover, there are two modes of failure—that is, shearing of the high-strength bolts and crushing of the concrete—depending on their relative strengths [22]. In the quasistatic tests of full-size composite beams conducted by Ataei et al. [17], the final failure mode was characterized by splitting failure and eventual crushing of the concrete. However, to our knowledge, very few research studies [6,9,11,14,15] have been conducted on the load–slip characteristics and failure modes of hogging sections.
Using the existing Chinese GB 50017 [23] and Eurocode 4: Design of Composite Steel and Concrete Structures [24] standards, the shear capacity of connectors of composite beams can be calculated from two perspectives—that is, the connector fracture and localized concrete failure. High-strength bolts can also be considered based on two distinct modes of failure that have been studied. In tests conducted by Kwon et al. [18] and Liu et al. [20], the high-strength bolts sheared off; thus, their proposed equations were only multiplied by a correction factor based on pure shear. Du et al. [25,26] introduced a correction to account for the effects of the embedded slender ratio based on localized concrete failure. Zhang et al. [21] modified the equations corresponding to two failure modes at the same time. Chen et al. [27] proposed a fitting equation considering the concrete strength, bolt diameter, and strength. Pavlovic et al. [28] divided the bolted shear capacity in push-out tests into four components—pure shear resistance, catenary force, nut friction, and concrete friction. However, in the reverse push-out tests conducted by Zhou et al. [29], the concrete slabs tended to separate from each other. Consequently, the friction between the concrete and the steel girder should be neglected. Moreover, in the hogging moment region, the performance of each component can be weakened owing to concrete tension. Consequently, the existing equations do not accurately express the bolted shear capacity within concrete subjected to tension.
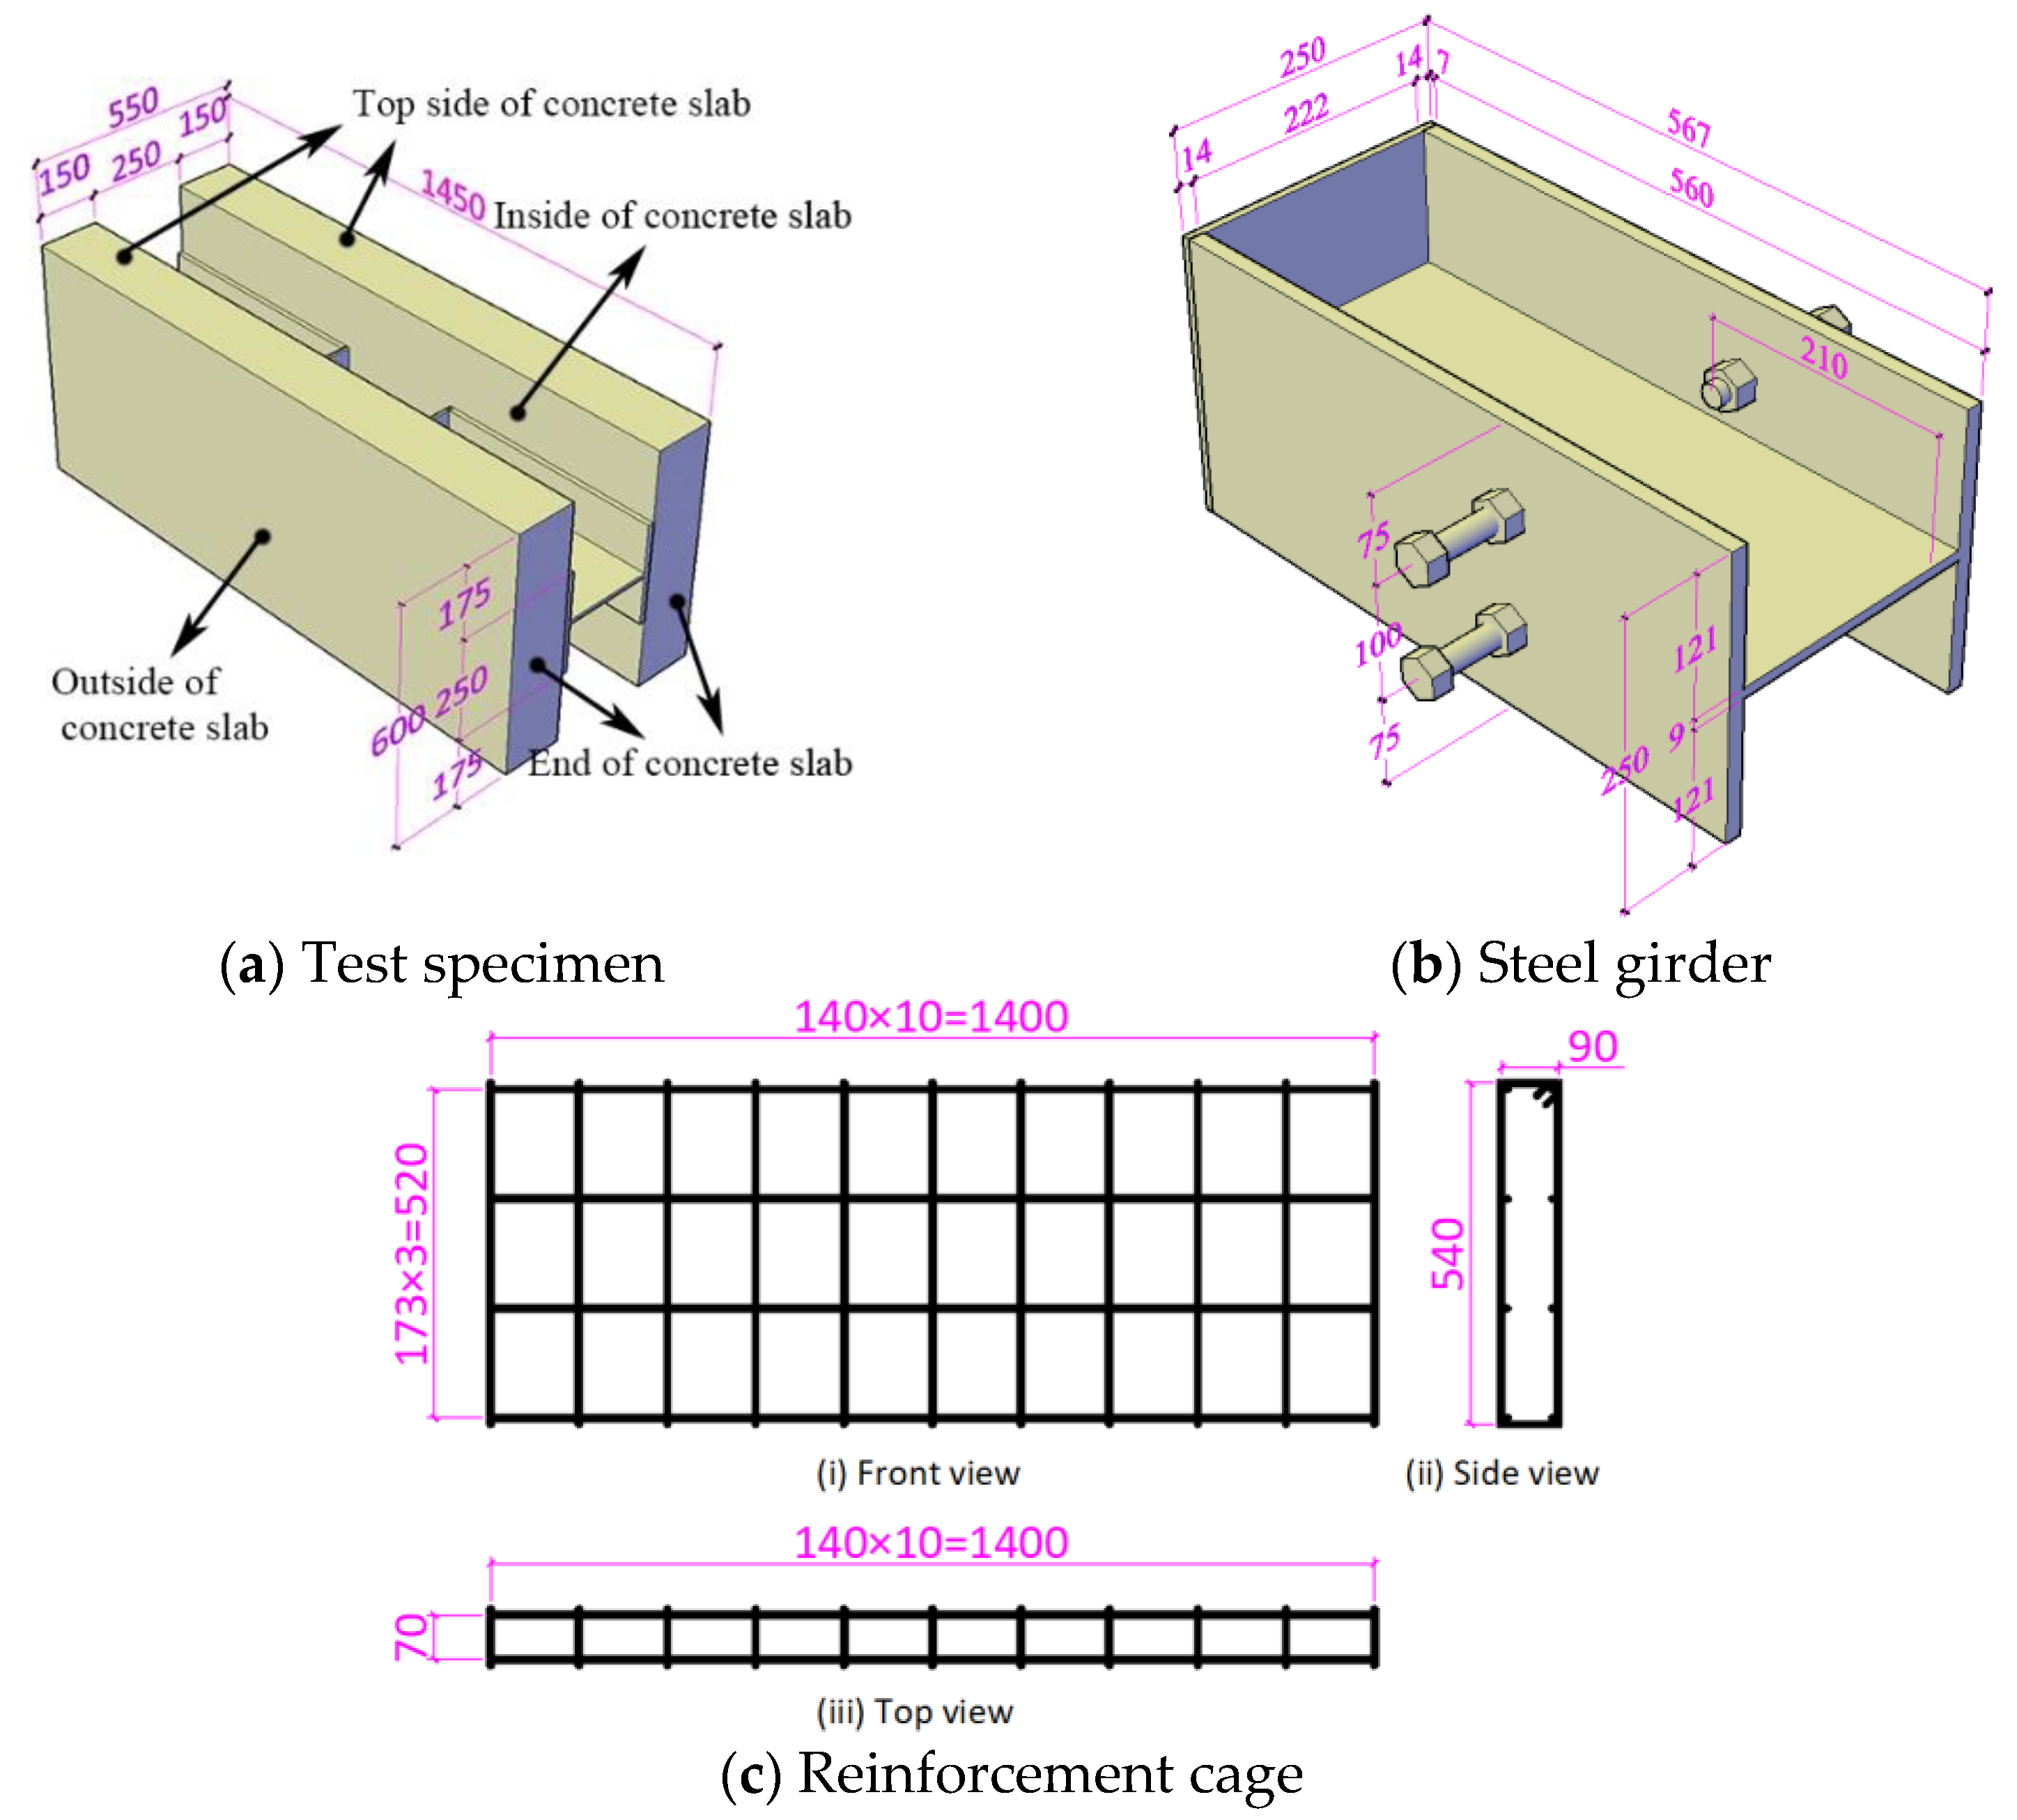
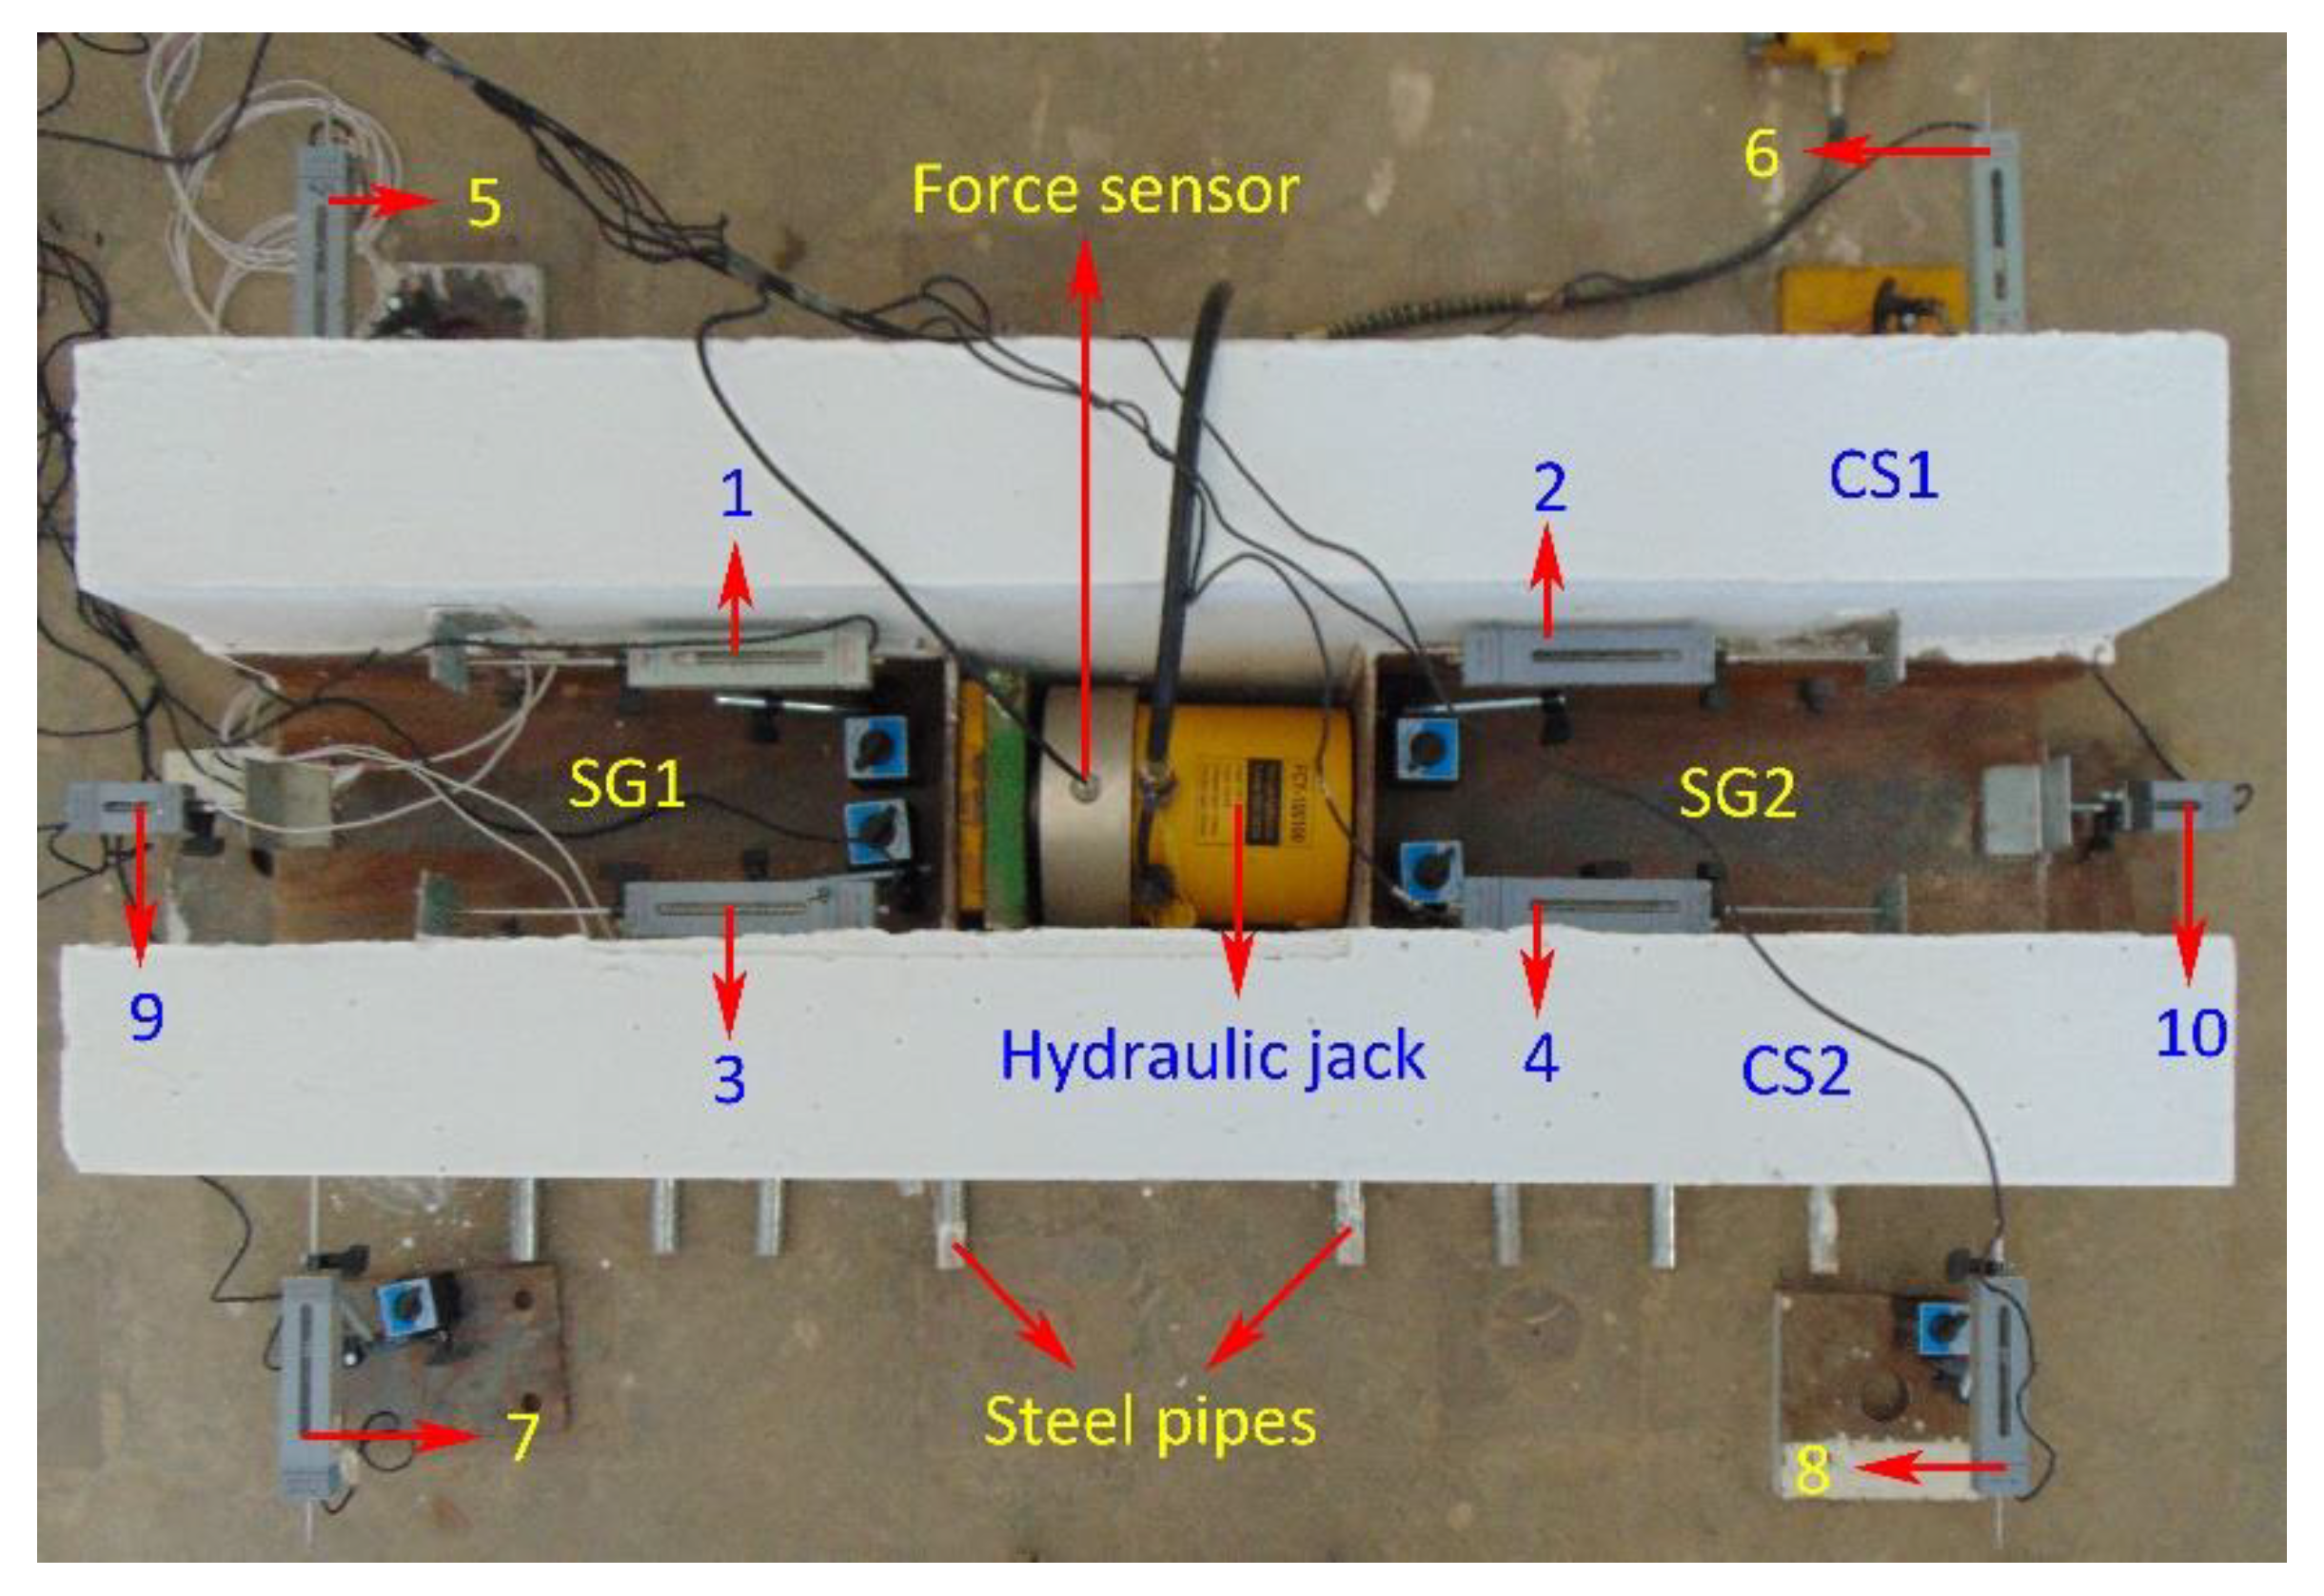
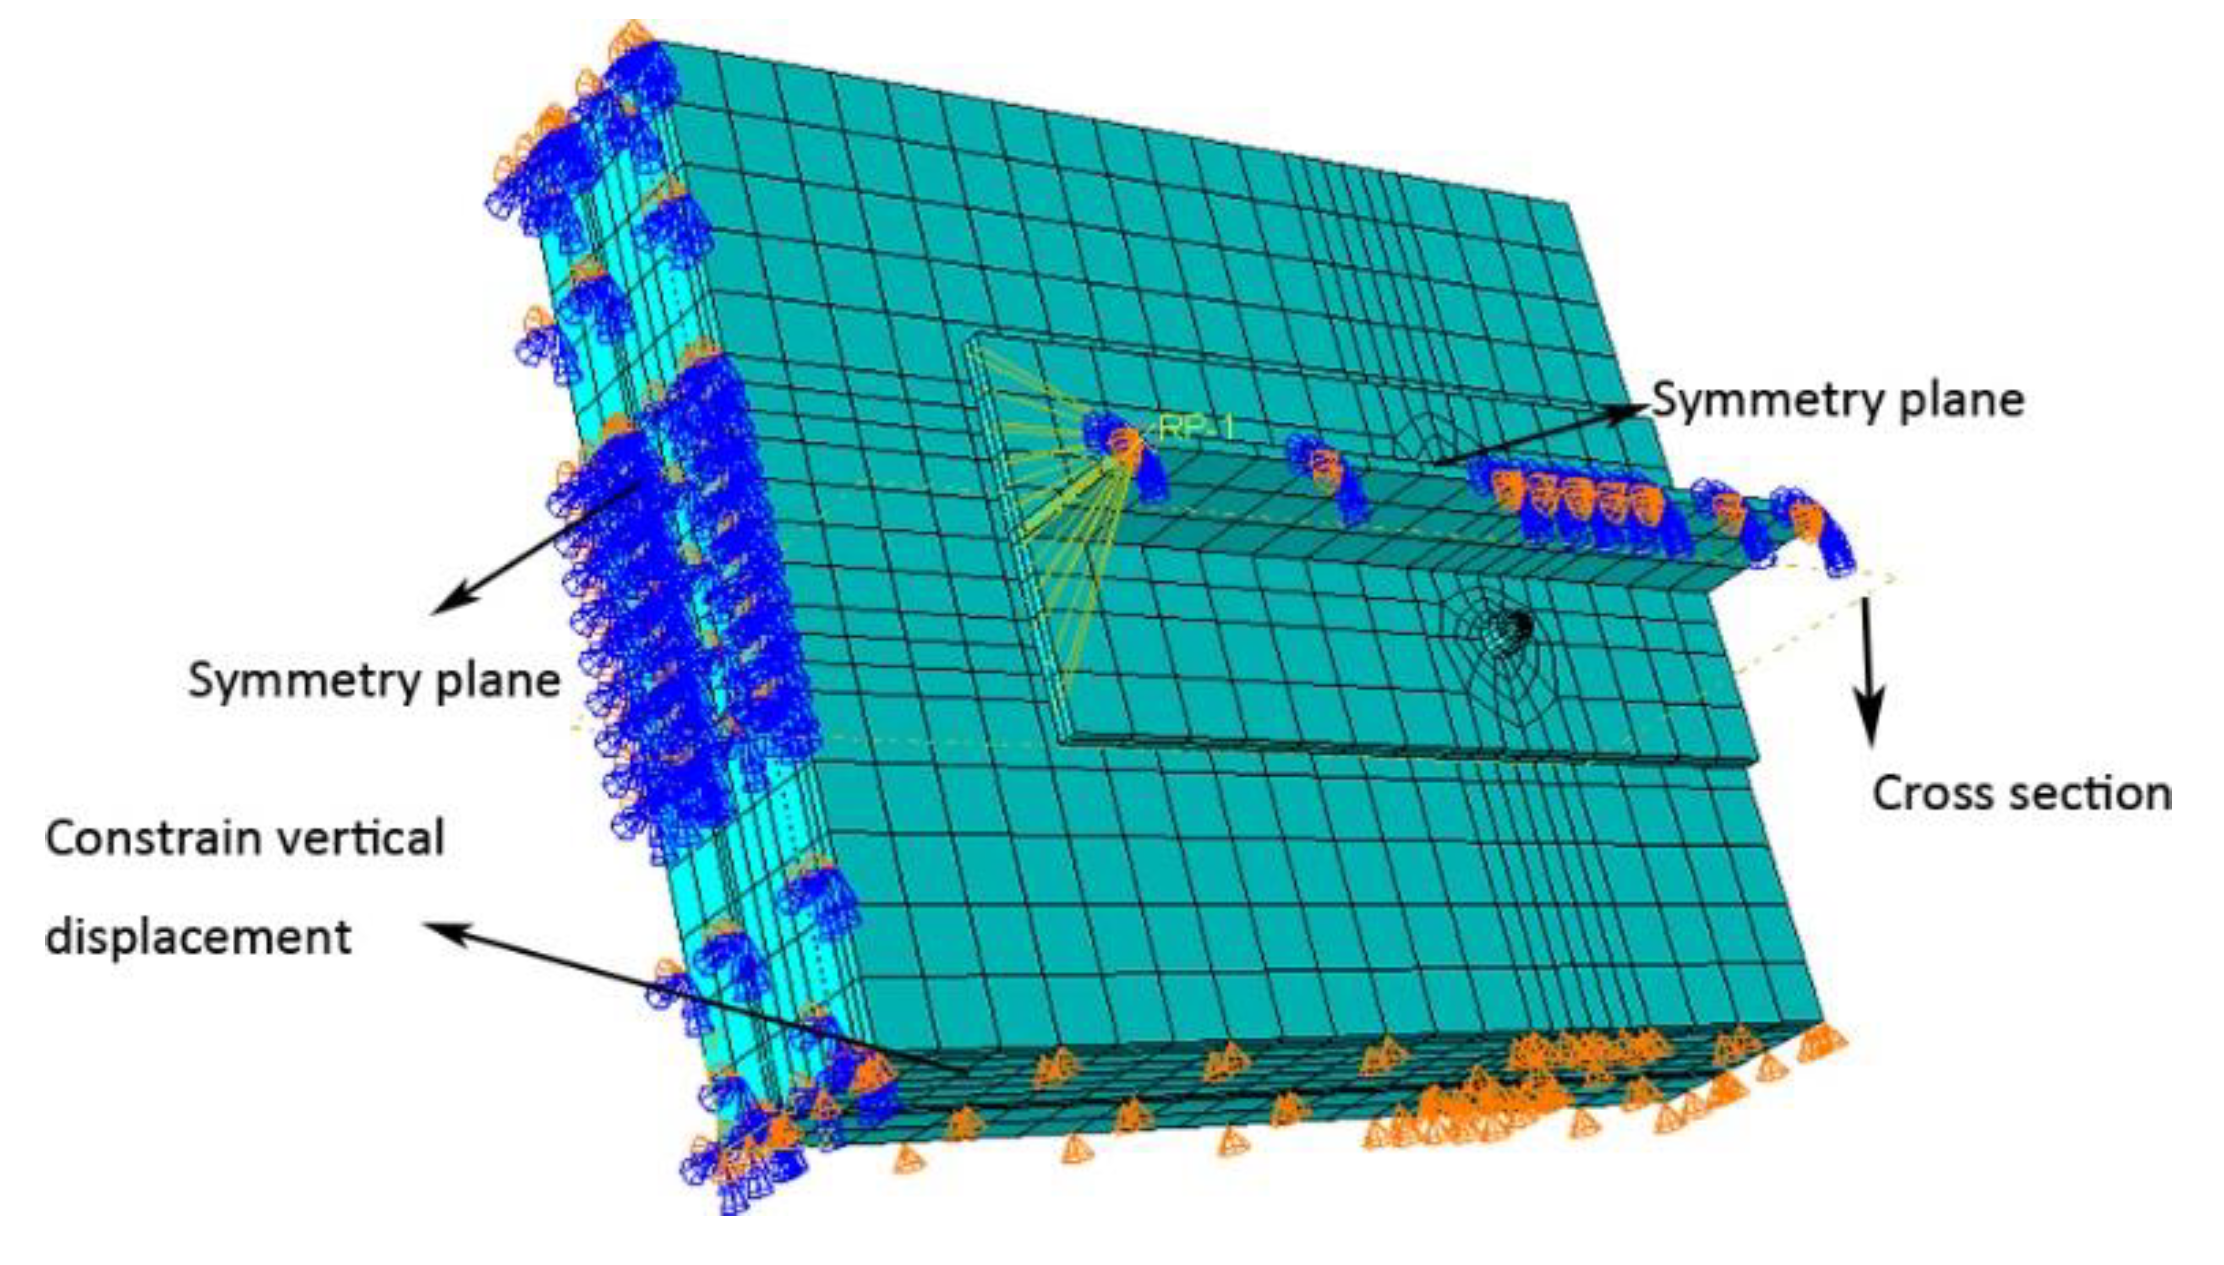
Although extensive literature exists on high-strength bolted connectors, research on their shear performance subjected to hogging moments is notably lacking. Our study pioneered the use of a reverse push-out test procedure to investigate the performance of high-strength bolted connectors in concrete subjected to tension. The adoption of high-strength bolted connectors with sliding characteristics in the hogging moment region of steel–cement composite structures can improve the crack resistance of concrete at the support. Four reverse push-out specimens were specifically designed to scrutinize their performance when the concrete is subjected to tension induced by hogging moments. A cost-effective and time-saving FE model (each model required about 6 h to execute) was developed to examine the internal microstates of the specimens, after which a correction factor for the shear capacity of bolts within concrete subjected to tension was proposed.

2. Reverse Push-Out Tests

2.1. Geometrical Dimension and Material Properties

The geometric dimensions and relative positions of the reverse push-out specimens are shown in Figure 2 The bolts were assembled into predrilled holes in the steel girders using a torque wrench. The dimensions of the reinforcement cage initiate and conclude at the central axis of the 10 mm diameter steel reinforcement, with a concrete cover depth of 25 mm. The four specimens were named based on the bolt diameter and concrete grade. Their detailed parameters are listed in Table 1.
The steel girders were made of Q235B steel, using grade 8.8 bolts and HRB400 steel reinforcement. The yield strength, ultimate strength, and Young’s modulus of the reinforcement, steel girder, and bolts were also measured. The compressive strength of the concrete was tested by pressing the reserved cubic specimens. The results of the material property tests are presented in Table 2.

2.2. Test Program and Phenomena

To avoid the influence of the self-weight of the specimens on the test results, eight identically sized steel pipes were placed at the bottom of each specimen, as shown in Figure 3. A hydraulic jack was placed between the steel girders SG1 and SG2, and the concrete slabs CS1 and CS2 were painted white to improve the visibility of cracks. Numbers 1–10 represent the displacement gauges.
Before the tests, the load capacity of each specimen could be estimated using Equation (1) [23] and preloaded by a factor of 0.05, as listed in Table 1, to eliminate installation gaps. During testing, the load was slowly increased until it reached a peak before decreasing. For safety reasons, the load was removed and released when it resulted in severe failure of the specimen after peaking, or reduced to approximately 0.8 times the peak load.
P u = 0.387 A s E c f c 0.63 A s f u
where P u denotes the ultimate strength (N), A s denotes the cross-sectional area (mm2), and E c denotes the Young’s modulus of the concrete (MPa).
From a macroscopic perspective, two main types of concrete slab cracks exist—splitting cracks (which develop from the bolted connectors to the end of the slab) and tension cracks (which grow transversely). Regarding the D16C30 steel, a splitting crack appeared at the end of CS2 when the load reached 187 kN, as shown in Figure 5a. As the load increased, a new splitting crack appeared on CS1, and two tension cracks appeared on CS1 and CS2, respectively, as shown in Figure 4c,d and Figure 5a. Subsequently, the load peaked at 246 kN. When the load decreased to 219 kN, a penetrating tension crack developed in CS1, as shown in Figure 4b. As the load continued to decrease to 216 kN, the bolt sheared off with a large explosion, as shown in Figure 4c, and the test was terminated.
Among the four specimens, the D16C40 steel specimen was the only specimen without splitting cracks. When the load exceeded 189 kN, tension cracks were initiated, which increased and extended, as shown in Figure 6a,c,d. After the load peaked at 255 kN, similar to the D16C30 steel specimen, a visible penetrating tension crack was generated on CS2 at 237 kN (Figure 6b), and the bolt sheared off at 228 kN (Figure 6c).
Because of the larger bolt diameter, the tension and splitting cracks in the D20C30 specimen were denser, and the corresponding loads were considerably higher than those in the D16C30 specimen. The tension and splitting cracks shown in Figure 5b and Figure 7a initially appeared as the load respectively increased to 240 kN and 244 kN. Subsequently, these cracks developed (as loads that peaked at 269 kN increased). Figure 7c,d shows that the most intense cracks originated from the SG2 bolted connectors. When the load reached a peak of 268 kN, a penetrating tension crack on CS2 was generated (with a load as low as 255 kN), as shown in Figure 7b.
The tension cracks were intense (Figure 8a), and splitting cracks were evident at both ends of the D20C40 specimen (Figure 5c,d). Figure 8b shows that most of the cracks originated at the bolted connectors. When the load increased to 295 kN and 257 kN, visible tension cracks were respectively produced on the outer parts of CS1 and CS2, as shown in Figure 8c,d. After the peak load was reached, a nonpenetrating crack was formed in CS2, as shown in Figure 8d. CS1 and CS2 were excavated, and visible bending of the bolts and a slight deformation of the hoop reinforcement were evident, as shown in Figure 8a.
Overall, for the reverse push-out specimens with concrete subjected to tension, the improvement in the concrete strength effectively inhibited the cracks in the concrete slab. However, large shear connector diameters exacerbated the cracks.

2.3. Load–Slip Response

The average value of gauges 1, 2, 3, and 4 can be defined as the slip (Δ), and the average load on the bolts as P. Accordingly, the results of the reverse push-out tests are listed in Table 3 and the P–Δ curves are shown in Figure 9. All four curves are almost linear initially, subsequently yielding and slipping up to the peak point. Finally, the specimens fail, the load drops, and the slip increases. However, in the D16C30 and D16C40 specimens, the slip increases suddenly; the increase is approximately 1 mm of the mounting clearance between the bolt shank and the steel predrilled hole. This phenomenon could be caused by the bolt, which overcomes the friction and slides in the hole. The bolt slip value (not being 1 mm but close to 1 mm) could be due to the installation error. The 16-mm diameter bolt had the same pretension, but the D16C30 specimen slid (at a smaller friction) compared with the D16C40 specimen, probably owing to its more severe loading eccentricity.
The effects of the concrete strength and bolt diameter on the strength and slip of the specimens were calculated (Table 4). When the bolt diameter increased, there was an evident bolt slip in the 16 mm bolt specimens, which was not comparable to that of the 20 mm bolt specimens. Moreover, as the Δy value in the 20 mm bolt specimens is small, the increase rate is inaccurate. Considering the findings of Figure 8 and Table 4, the concrete upgrade contributes to an increase in Py and Pu but causes specimens to be less ductile and more brittle; consequently, the slip at the ultimate load is considerably reduced. An increase in the bolt diameter considerably increases the shear bearing capacity but has a smaller effect on Py.

2.4. Out-of-Plane Displacement Results

The normal direction of the contact surface between the concrete slab and steel girder can be defined as the direction of the out-of-plane displacement, as shown in Figure 10a. Displacement gauges 5–8 were placed centrally at the end of the concrete slabs to measure the out-of-plane displacement, adopting the mean values of the same-side gauges (Gauges 5, 6, 7, and 8 in Figure 3).
When P was less than 15 kN, there was almost no out-of-plane displacement, except for CS2 of the D20C30 specimen. The initial (minor) displacement could be attributed to the lack of effective bonding at the steel–concrete interface after casting. As the load increased, the concrete slabs gradually moved away from the steel girders. Moreover, CS2 of the D16C30 specimen suddenly reversed at approximately 47 kN, as shown in Figure 10a, which may have been caused by the creation of splitting cracks (Figure 5a).
Because the high-strength bolts slid and failed, the out-of-plane displacements of the D16C30 and D16C40 specimens exhibited randomness. In relative terms, the relative separation of the D20C30 and D20C40 specimens without bolt failure increases essentially monotonically before peaking. The effect of the loading eccentricity became increasingly important as the load increased. Moreover, the CS1 and CS2 of the D20C40 specimen moved isotropically after reaching a peak of 74 kN, and the two slabs of the D20C30 specimen were always isotropically deflected because of their load eccentricity.
Although the idealization of materials and operations was satisfied to the extent possible, there were still material heterogeneities, fabrication differences, and loading eccentricities, which led to considerable randomness in the relative separation. Additionally, the out-of-plane displacement was influenced by friction with the pipes at the bottom of each specimen. Consequently, the displacement difference between CS1 and CS2 could be considered to be the relative separation, as shown in Figure 10b, which indicates that the P-separation curve tends to be monotonic before reaching its peak. However, the separation of the D20C30 and D20C40 specimens was respectively mitigated at 63 and 73 kN; this could be attributed to the splitting cracks shown in Figure 5b–d.

3. Numerical Modeling and Analysis

3.1. FE Model and Validation

The basic material properties used for numerical modeling were first defined. The densities of the steel and concrete were 7850 and 2400 kg/m3, respectively. Table 2 lists the yield strength, ultimate strength, and Young’s modulus of steel—for example, the bars, bolts, and girders—whose Poisson’s ratios were set to be 0.3; the stress–strain relationship is as shown in Figure 11. The Poisson’s ratio of concrete was set to be 0.2, and the elastic modulus was calculated based on the GB 50010 [30]. Its brittle–plastic properties could be described using the concrete-damaged plasticity model in ABAQUS 2022, whose constitutional relationship could be obtained based on the compressive strength (Table 2) and the calculated Young’s modulus. The damage parameters could be calculated using Equation (3) [31].
d = 1 σ c E c ε c
where σ c denotes the concrete stress and ε c denotes the concrete strain.
Numerical analyses were performed using ABAQUS considering its excellent nonlinear analysis capabilities. To reduce computational costs, quarter-size models were created for FE simulations. Three components were constructed—reinforcements, steel girders, and a combination of bolts and concrete slabs. The joints of the hoop and longitudinal bars shared a common node, thus rendering the reinforcement more realistic. The combination of bolts and concrete within the same part, each with its material properties, avoids complex contact problems between the two and improves calculation efficiency. The components were then separately divided and meshed. The appropriate global mesh size was 40 mm, and the grid near the bolts was encrypted, as shown in Figure 12. A 2-node linear three-dimensional truss element (T3D2) was used for the steel reinforcement, which was embedded in the concrete. An 8-node linear brick with a reduced integration (C3D8R) element was used for all other components. The numerical results using the T3D2 and C3D8R elements agree with the experimental results, and the use of T3D2 and C3D8R improves the computational efficiency. Finally, all the components were assembled. The dynamic implicit procedure (comprising three steps) was applied to the analysis. During the initial step, the reinforcement was embedded into the concrete, coupling the reference point and loading surface, the basic boundary conditions of which are shown in Figure 12.
Simultaneously, the frictional interaction between the nuts and the steel girder was established using the same coefficients as those used in the experiments. The steel girder and concrete slab tend to separate from each other and their interaction is defined as frictionless [32]. The contact of the sliding-end bolts with the holes of the steel girder was set to “hard contact”. In the second analysis step, the concrete and shank elements around the embedded nuts were deactivated to maintain the concrete in a stress state consistent with the experiment. Subsequently, bolt pretension was applied using the bolt load model in ABAQUS. In the final step, the aforementioned elements were reactivated, and loading was performed via the reference point. The displacement in the direction of the loading was monitored at the same points on the steel girder and concrete as in the experiment; the difference between the two was defined as the slip value.
A comparison of the FE results with the test curves is shown in Figure 13. The trends are similar. These markers were then used for subsequent analyses. The smaller initial stiffness of the numerical results compared with that of the experimental results was because FE analysis simplified the interaction between the concrete and steel girder by using a “hard” contact in the normal direction and a frictionless contact in the tangential direction, while in the tests, the postcast concrete generated a certain bonding force with the steel girder during the setting process. Another difference between the numerical and the experimental results pertains to the loads for the sliding of the bolts of D16C30. This is because in the numerical simulations, the material is idealized and the interfacial friction coefficients are the same for the different concrete strengths so that the numerical results obtained for the sliding loads of D16C30 and D16C40 are almost the same. However, in the tests, the same friction coefficient could not be guaranteed; therefore, different sliding loads were obtained. Lastly, the damage constitutive relation of the metal connectors was not defined to improve the computational efficiency. Therefore, the numerical results did not exhibit a decreasing segment as that observed in the experimental tests. The single-bolt load capacities and aberrations are listed in Table 5.
As the numerical FE model has been successfully verified with those of experimentally observed data, future research can use the numerical approach and the existing experimental results for suitable training for the functional relationship between external data sources and bolt performance [33,34]. This crucial task can be performed economically and technically using machine learning [34,35], artificial intelligence [36,37], and neural network algorithms [38,39].

3.2. Evolution of Stress and Damage

Using the ABAQUS visualization module, we dissected the cross-section in Figure 12 to observe the development of the bolt stress, which compensates for the failure of the strain gauges in the experiments. Figure 13a,b indicates that the D16C30 and D16C40 specimens exhibit a similar stress development process comprising the elastic segment, bolt sliding, stiffness recovery, hardening, and failure stages; consequently, only the D16C30 specimen was used to illustrate this process. The stress evolution in each component is shown in Figure 14. After the pretension force on the bolt is complete and before loading, the local pressure in the steel flanges is evident. As soon as the loading starts, the concrete around the bolts is initially damaged by tension, and a crack is first produced between the two bolts and quickly develops on both sides. In the experiments, visible tension cracks starting at the connectors were evident during the initial loading stage. At this point, the longitudinal reinforcement near the bolts was subjected to tensile stress. As the load increased, the area of concrete damage increased, the reinforcement stress increased, the concrete near the bolts was compressed, and the distribution of the bolt pretension stresses along the cross-section became uneven.
Up to point B in Figure 13, the bolt slid in the reserved hole as the grip of the nut on the steel-plate flange was overcome. During this period, the bolt pretension stress and concrete damage no longer develop and stabilize at their current state. Once the sliding ends, the bolt and inner wall of the reserved hole come into contact and are subjected to pressure. Thereafter, the stiffness of the specimen recovers, and concrete damage and an uneven distribution of the bolted pretension stresses continue to develop. As the load continues to increase, the bolt yields and the stiffness decreases. When point E is reached, the reinforcement begins to yield, as shown in Figure 13. The tensile eccentricity of the bolt is more severe at this stage. Subsequently, the load increases slowly. Notably, the descending section of the curve was not obtained as damage to the metal was not defined.
For the D20C30 and D20C40 specimens, respectively shown in Figure 13c,d, the reinforcement first yields, followed by the bolts. Based on the FE results, during loading, the bolts of the D20C30 specimen slide slightly in the prefabricated holes, but eventually, there is no contact bearing between the two, as shown in Figure 15a. The concrete damage is already more severe when the reinforcement yields, as shown in Figure 15b, which is consistent with the severe splitting damage in the experiments. The bolts also slide slightly throughout the loading process of the D20C40 specimen, and obvious compressive stresses are evident as shown in Figure 15c, wherein the interaction may be determined by a combination of friction and compressive bearing. The development of concrete damage is slower compared with that of the D20C30 specimen.

4. Parametric Studies

To analyze the effects of the bolt strength, pretension, diameter, and concrete strength and enrich the experimental data, 30 FE models were executed for analysis. Normal bolt pretension was obtained according to the standard [23] and multiplied by 0.75 and 1.25 to study the effect of variation on the bolt pretension. The parametric results are presented in Table 6.

4.1. Effects of Bolt Properties

Experimental and FE studies have demonstrated that the sliding of 16 mm bolts in predrilled holes is significant. N v b was calculated based on Ref. [23]. In Table 6, by comparing Ps with N v b , the standard-based calculation provides a good estimation of the sliding loads.
N v b = 0.9 k n μ F P
where k = 0.97 is the hole size coefficient, n = 2 is the number of friction surfaces, and μ = 0.28 is the coefficient of friction.
As shown in Figure 16a,b, the sliding loads are affected considerably by the bolt pretension. The maximum friction of B109D16C40P1.25 is similar to the ultimate carrying capacity; thus, no obvious sliding phase can be found in Figure 16b. Conversely, the concrete damage remains constant during the sliding process at which point the concrete damage in the visualization module increases as a function of the pretension force, as shown in Figure 17. Figure 17 also indicates that for the same loading displacement, specimens with a larger pretension are more prone to concrete cracking because the bolt is restricted from sliding in the hole. When the slide ends, specimen stiffness recovery and the distributions of concrete damage gradually converge.
As the bolt grade and diameter increase, it is customary to increase artificially the prestressing to utilize fully the material. When the bolt grade is increased, the increased prestressing will raise the maximum friction without affecting the load-carrying capacity, as shown in Figure 16c. However, when the bolt diameter increases, in addition to the maximum friction increases, the load-carrying capacity also increases as shown in Figure 16d. This is because the increase in the bolt diameter increases the pressure-bearing area between the bolt and the concrete.

4.2. Effects of Concrete Strength

Figure 18a shows that as the concrete strength decreases, the load–slip response moves from the stiffness recovery phase to the hardening phase earlier. Finally, the shear-load capacity increases with the increasing concrete strength. Comparing the B88D16C30P1 and B88D16C50P1 specimens in the early stages, as shown in Figure 17, the crack in the specimen with higher-performance concrete develops more slowly. Figure 17 shows the concrete tensile damage during the bolt sliding process. These observations lead to the conclusion that increasing the concrete strength can considerably inhibit the development of concrete cracks. Consequently, the distribution of concrete damage converges as the specimen fails.

5. Shear Resistance of Single Bolt

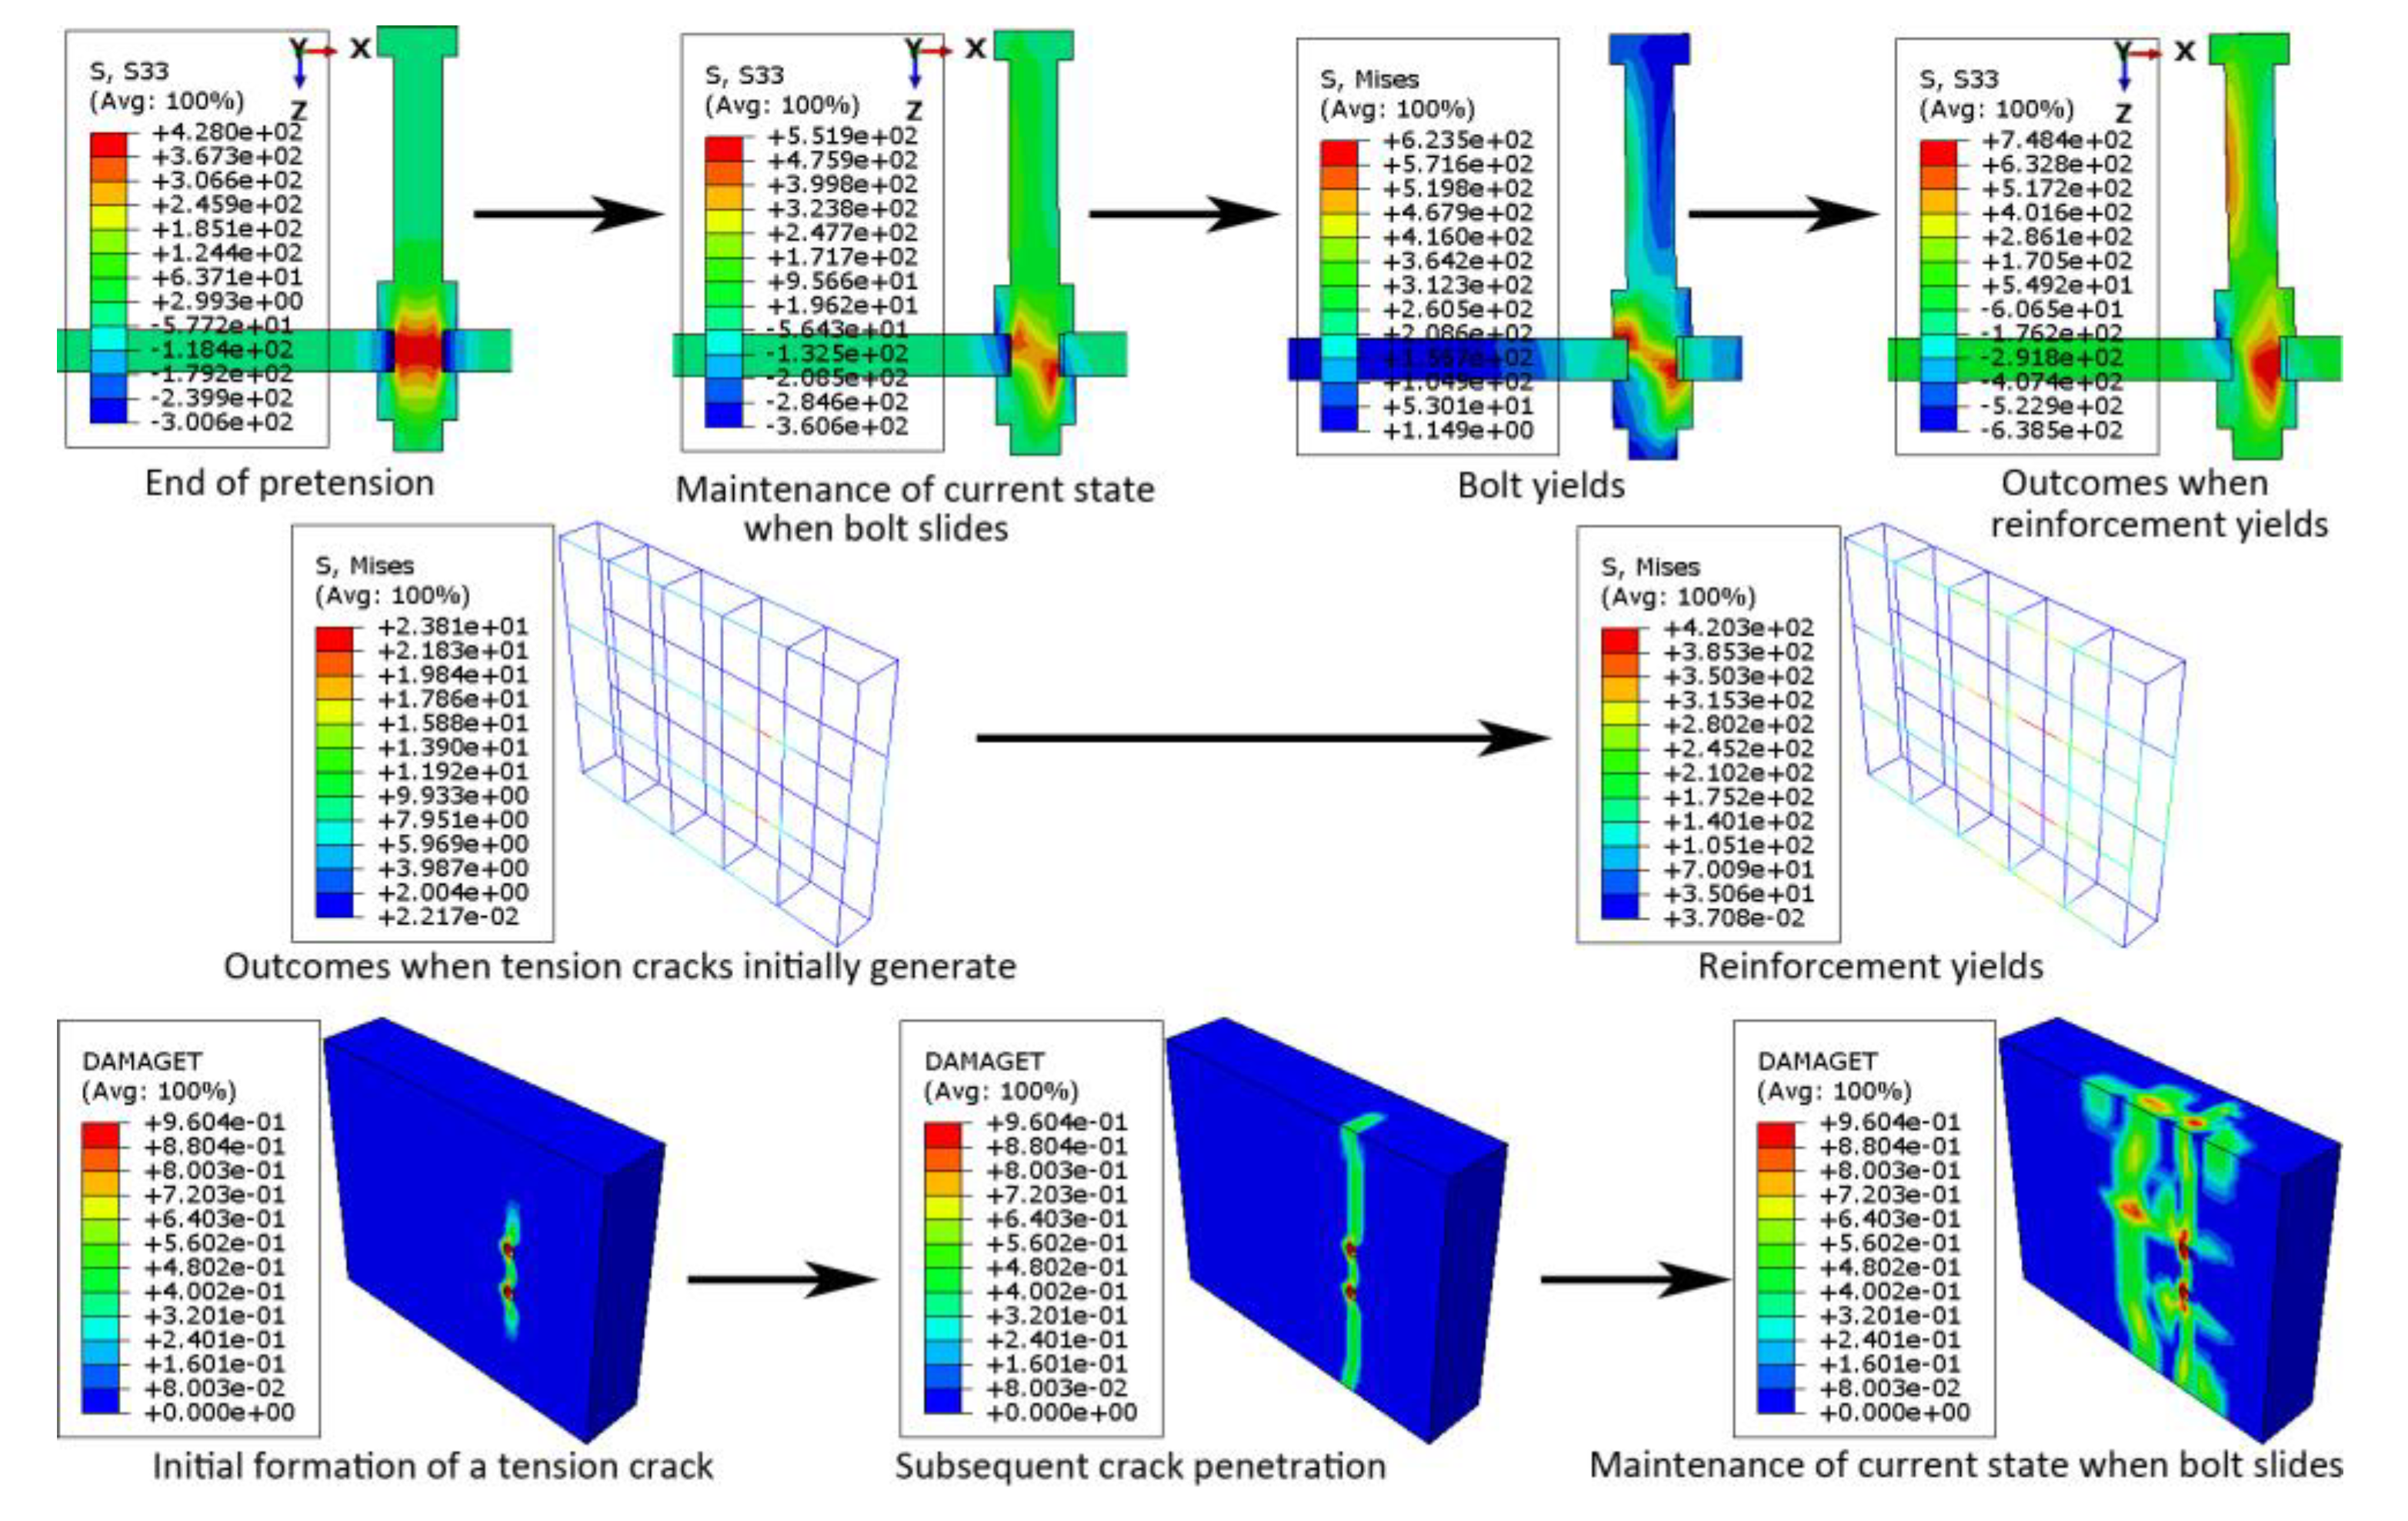
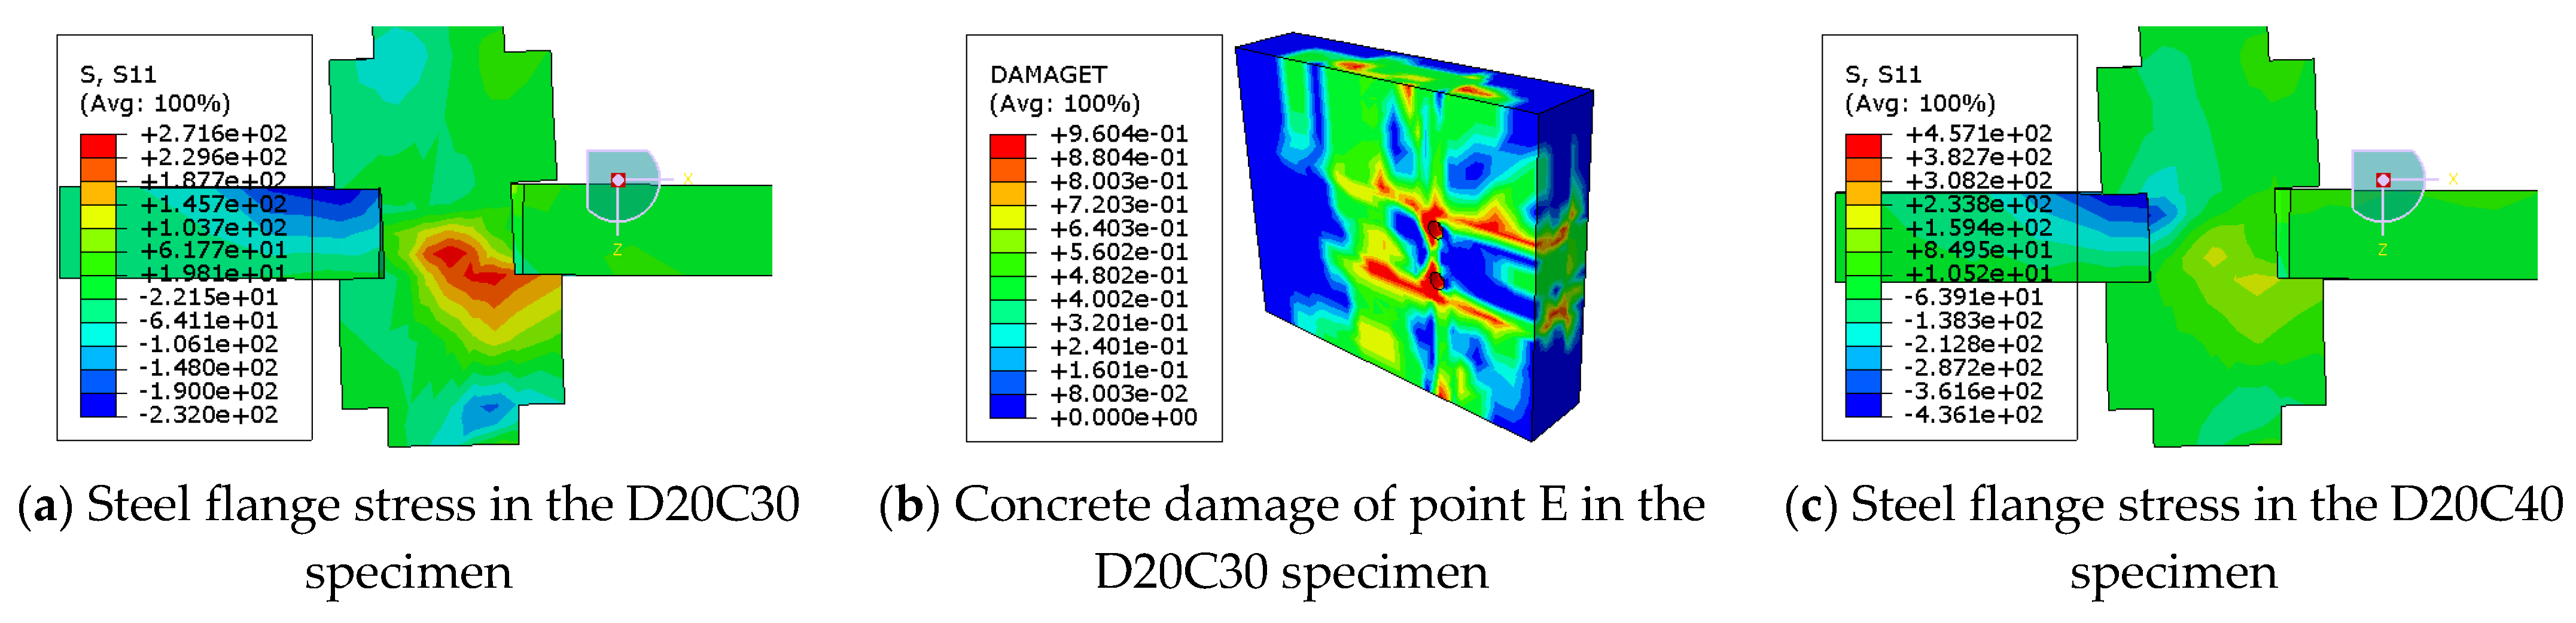
When failure occurs as the connector is sheared off, the shear capacity in the reverse push-out tests should be the same as that in the conventional push-out tests. However, the experimental and numerical results were considerably smaller than the values calculated in various codes and studies. The FE results showed that the failure mode of the reverse push-out specimens was mainly localized compressive crushing of the concrete. Considering that the contribution of both the concrete and connectors to the shear capacity is weakened within concrete under tension, a discount factor (λ) can be introduced to correct the capacity. According to Ref. [23], λ was set to 0.9, which is higher than the results of our tests and numerical simulations; this value is suitable for studs but not for high-strength bolts. This localized failure is directly affected by the concrete strength and bearing area and is closely related to the bolt diameter. Consequently, the following discount factor was proposed,
λ = α f c β γ + d δ
where λ denotes the reduction coefficient, f c denotes the compressive strength of concrete (MPa), d denotes the bolt diameter (mm), and α = 39.934 , β = 0.381 , γ = 0.063 , and δ = 0.715 .
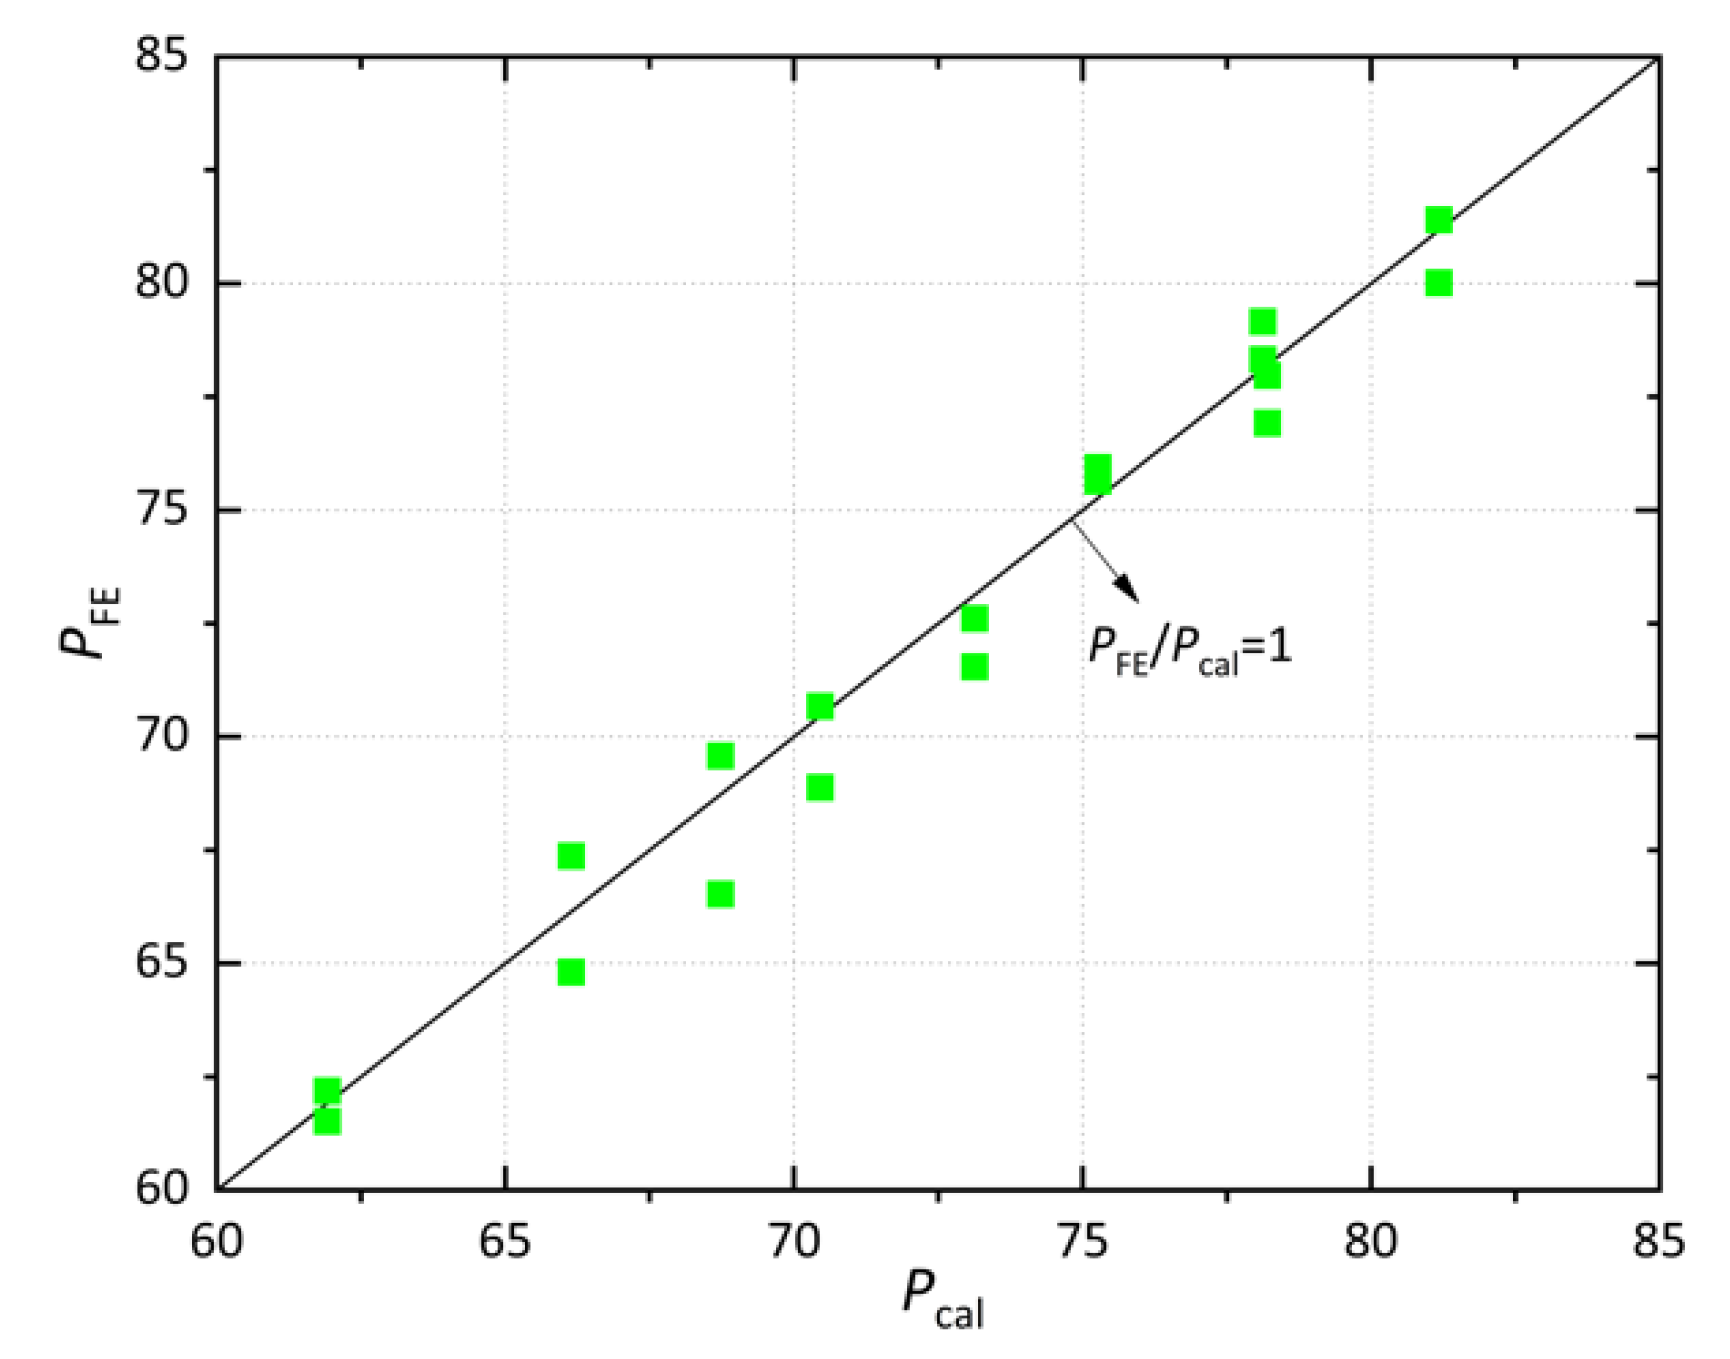
The modified version of the shear capacity of high-strength bolts applicable to the hogging moment section based on [23] is expressed by Equation (5). The values of α, β, γ, and δ were obtained by nonlinear fitting using SPSS 26 based on the FE results. As shown in Figure 19, the corrected equation describes more accurately the shear-bearing capacity of high-strength bolts within concrete under tension.
P u = 0.43 λ A s E c f c

6. Conclusions

Four reverse push-out specimens were constructed to investigate the performance of high-strength bolted shear connectors when concrete is subjected to tension in hogging moment conditions. The following conclusions can be drawn:
(1)
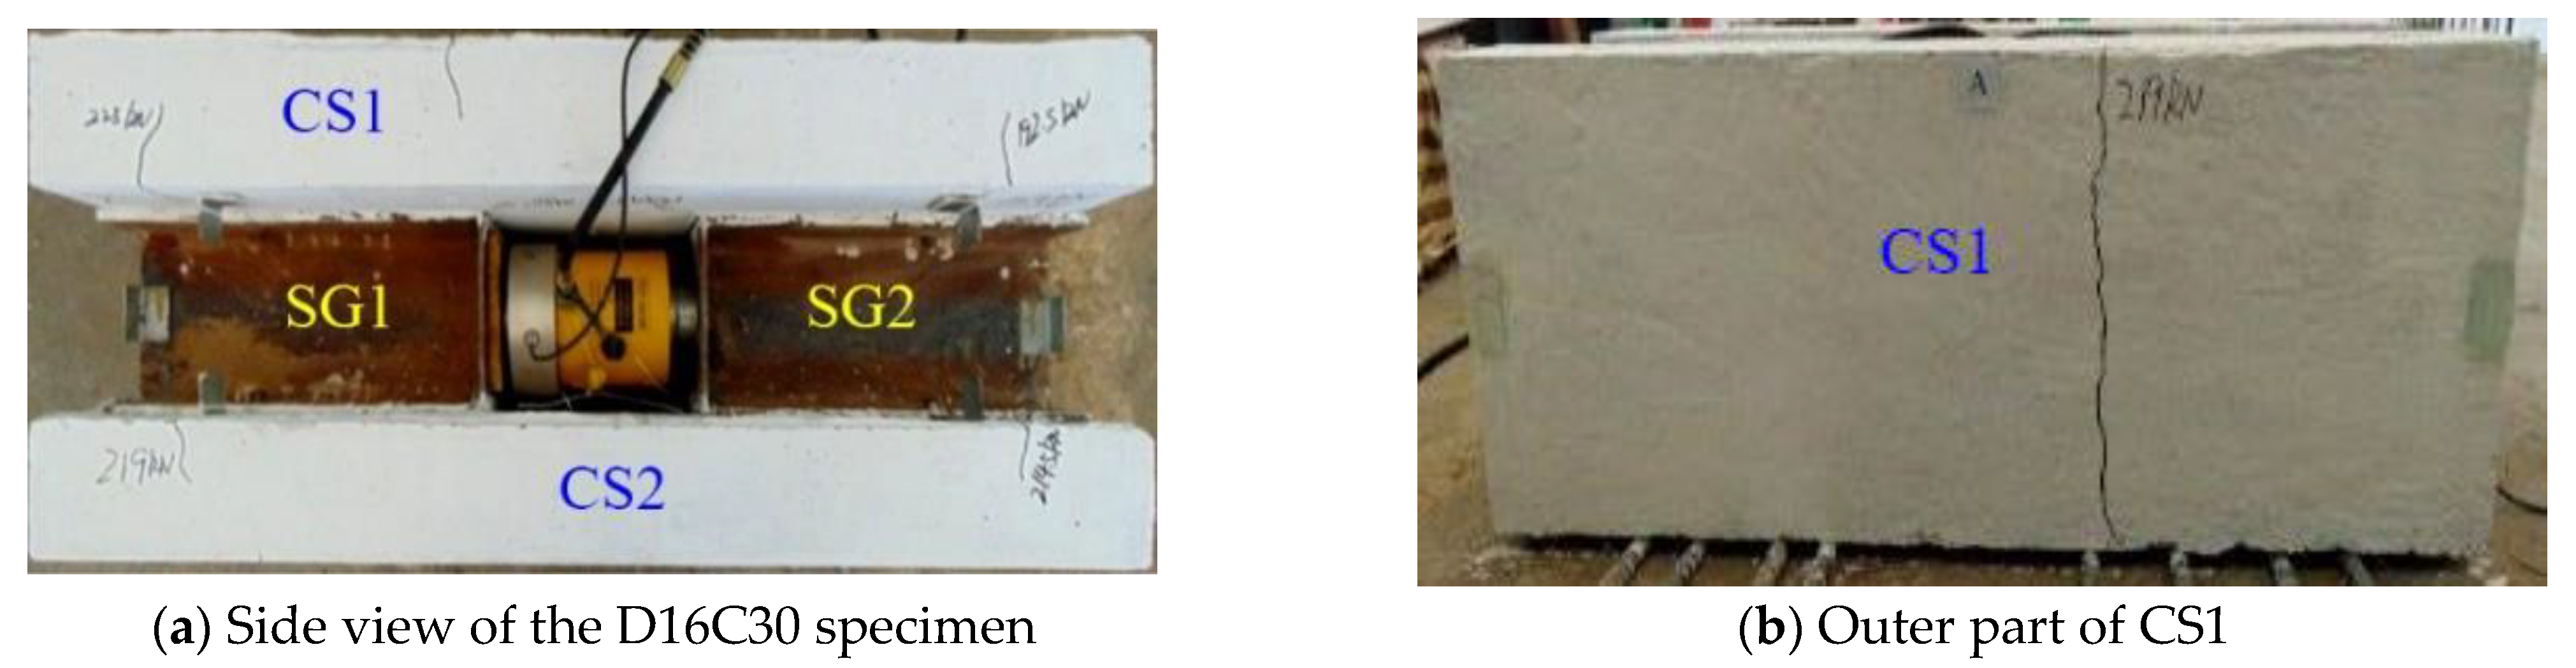
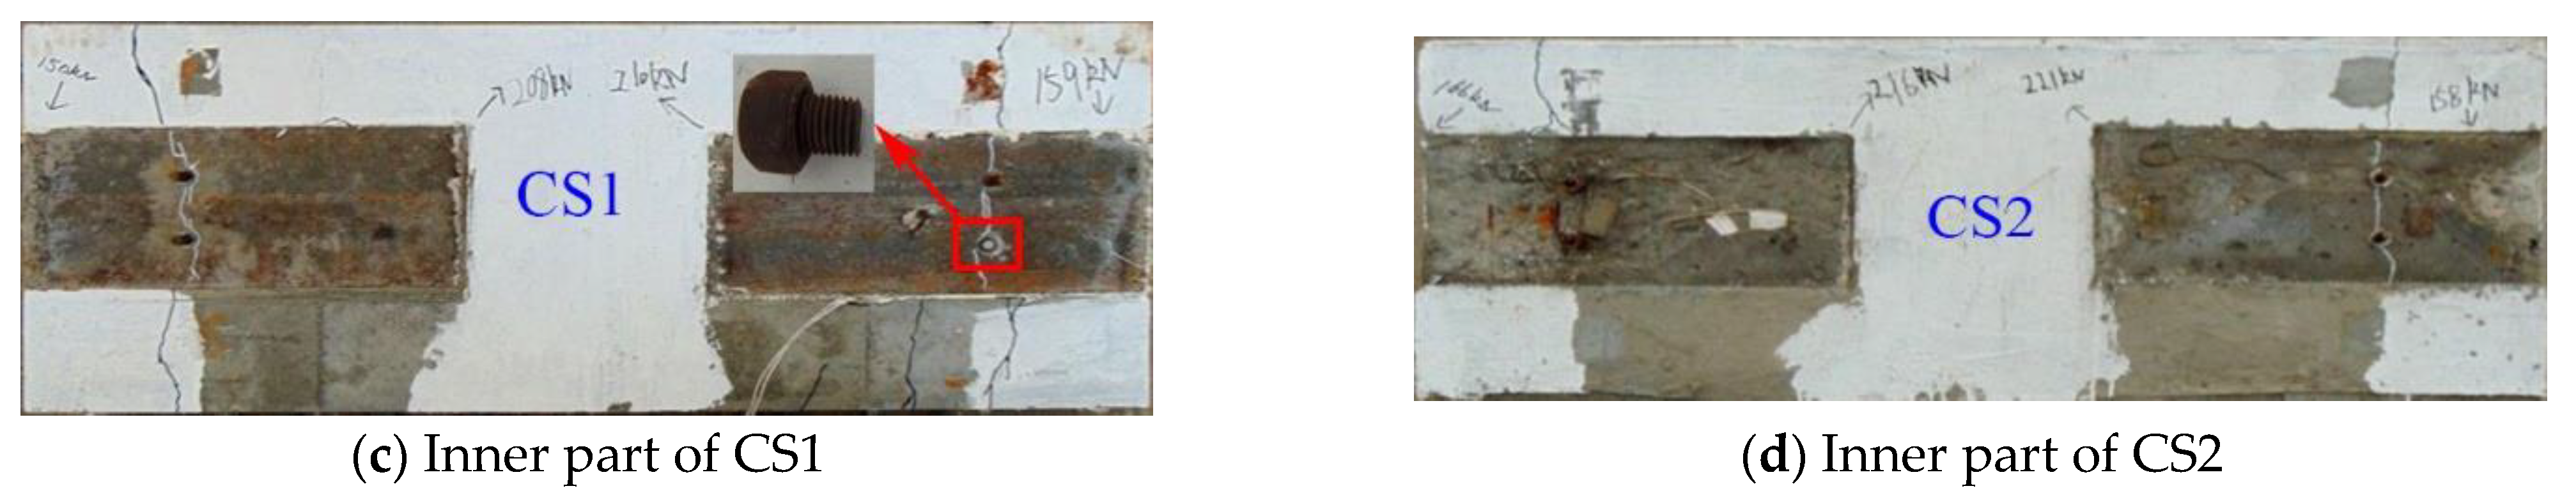
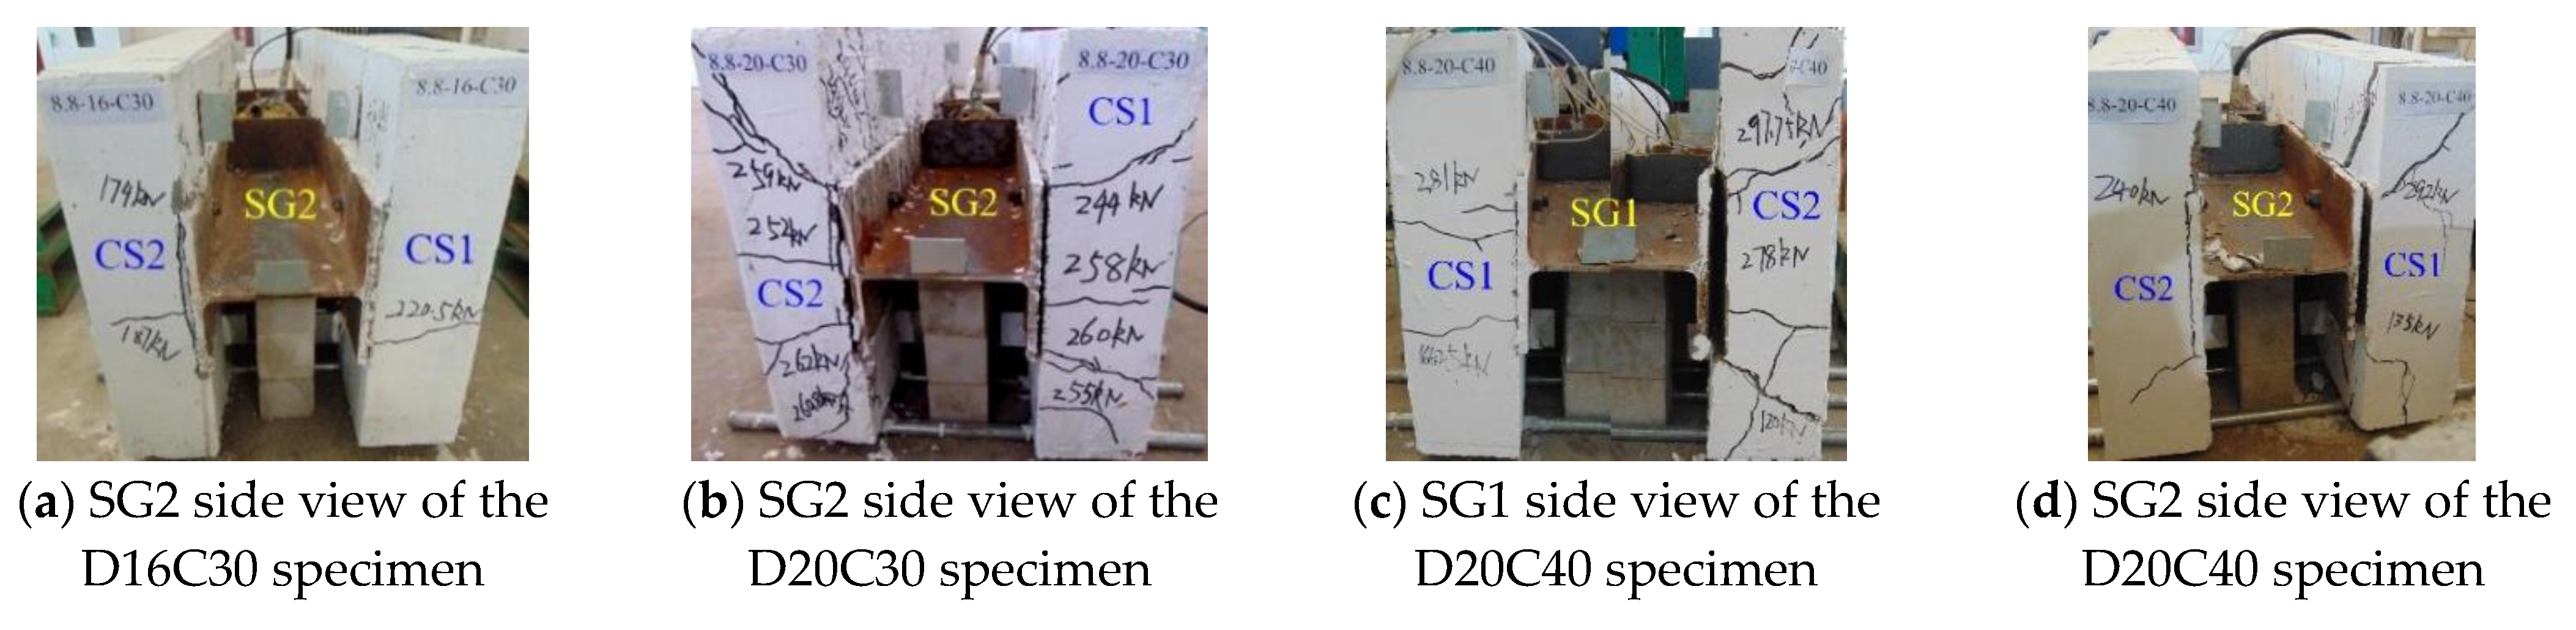
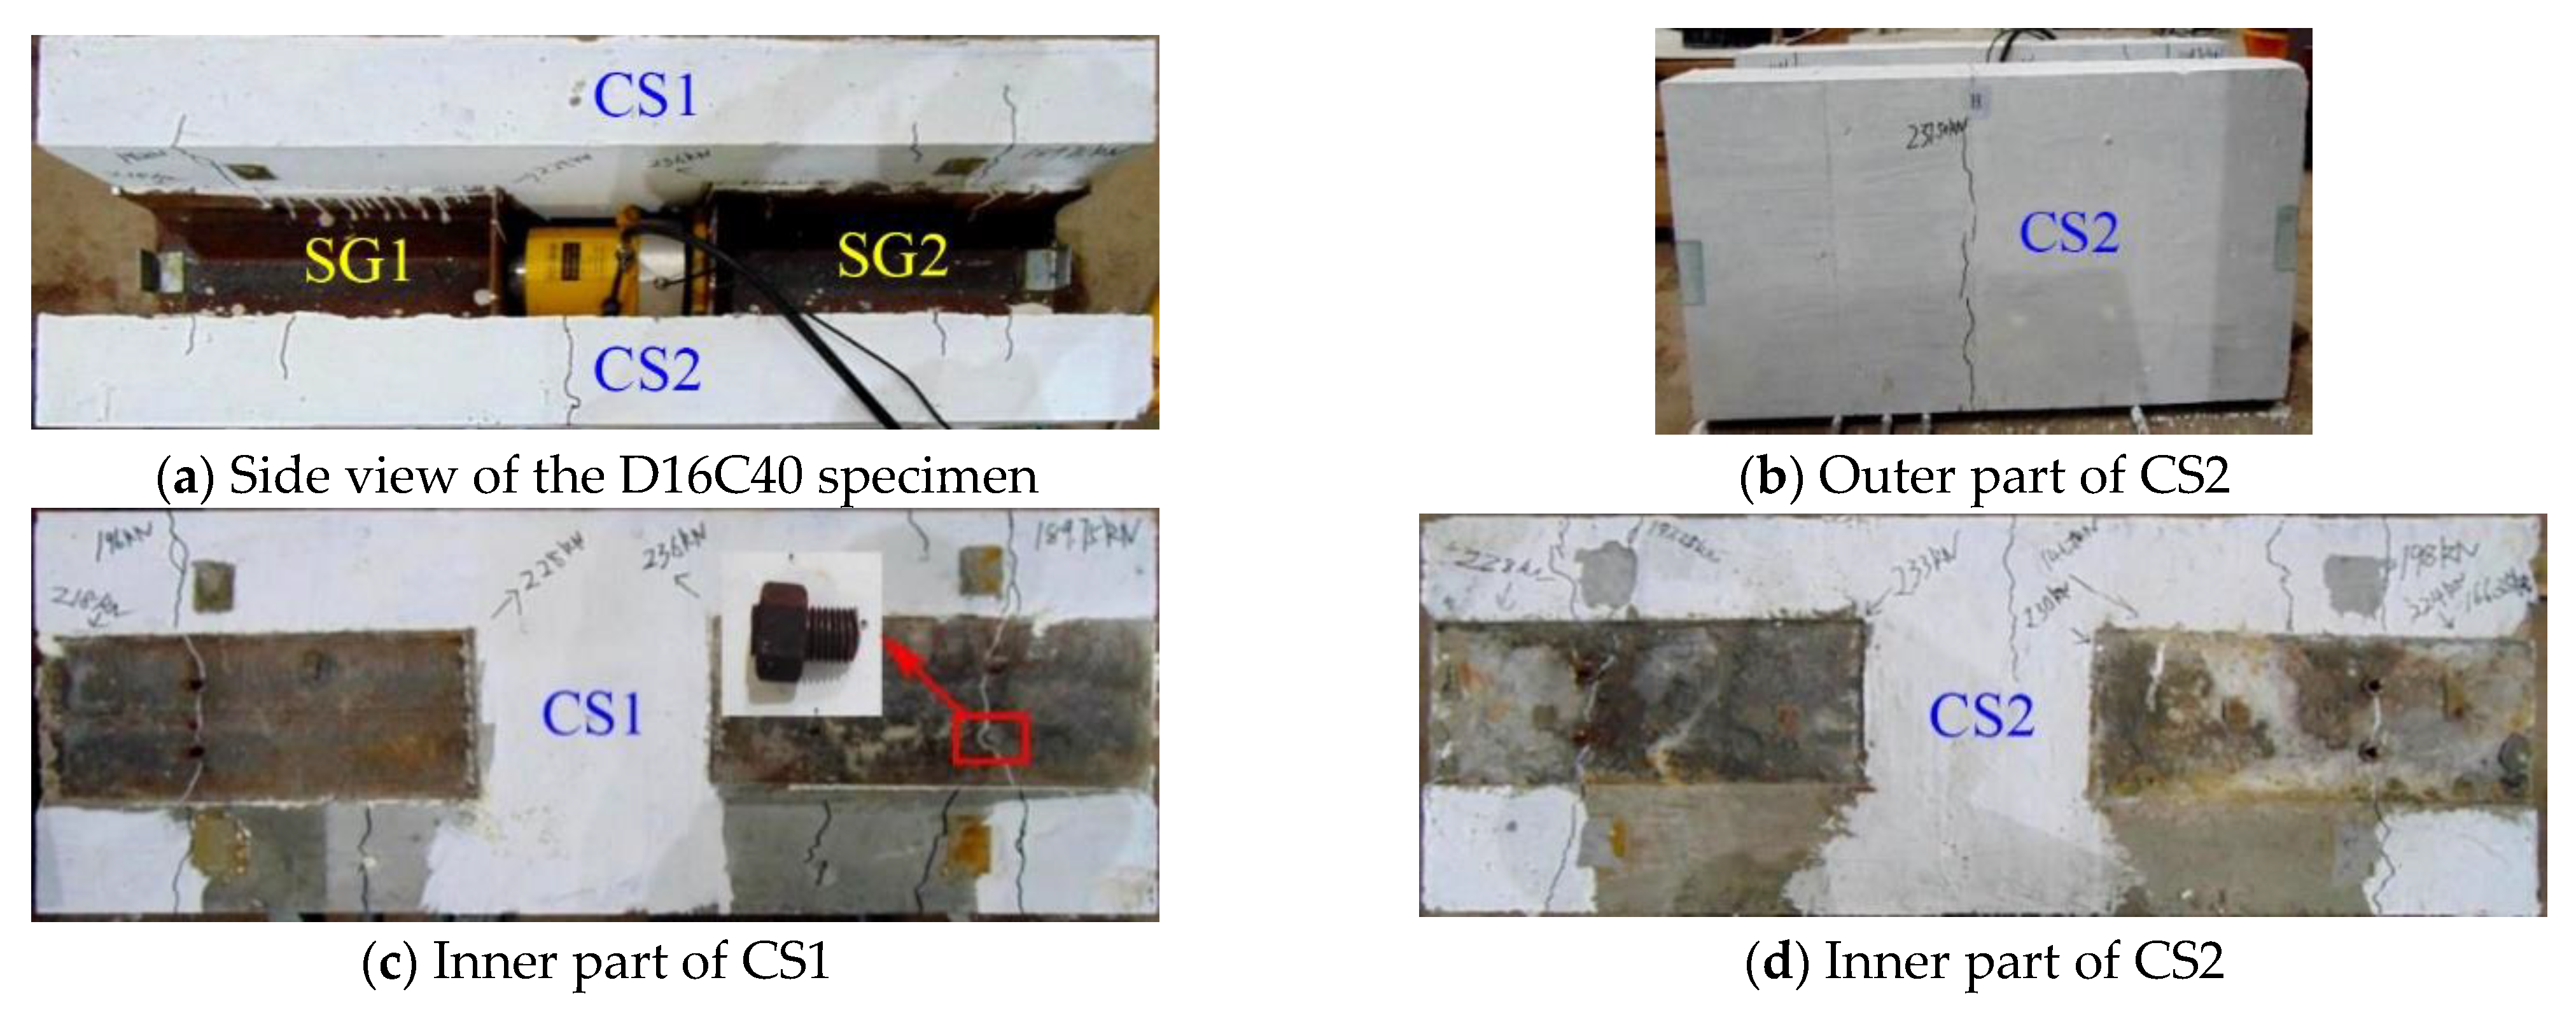
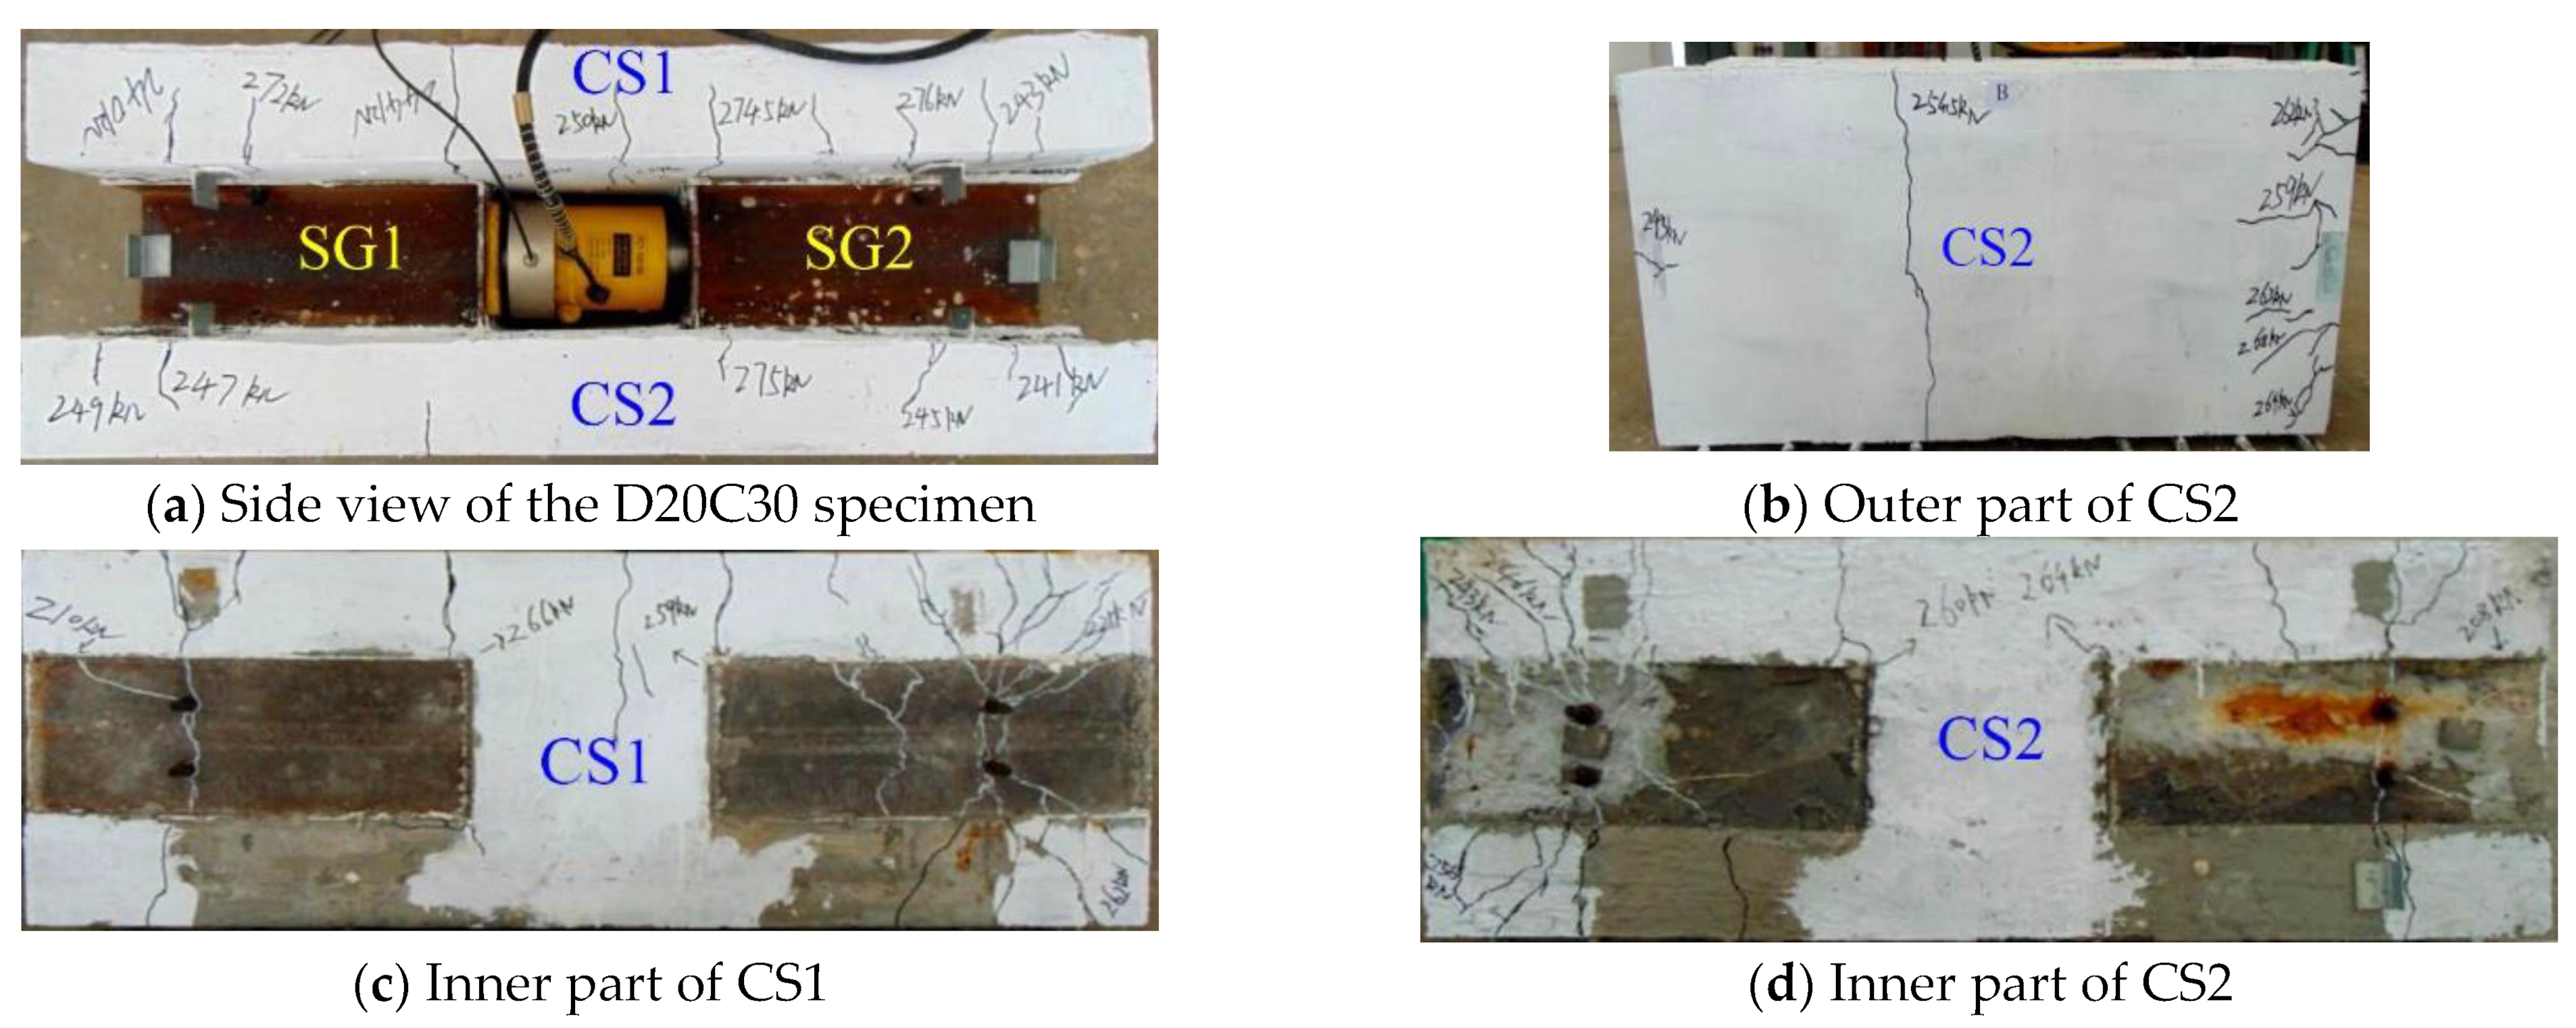
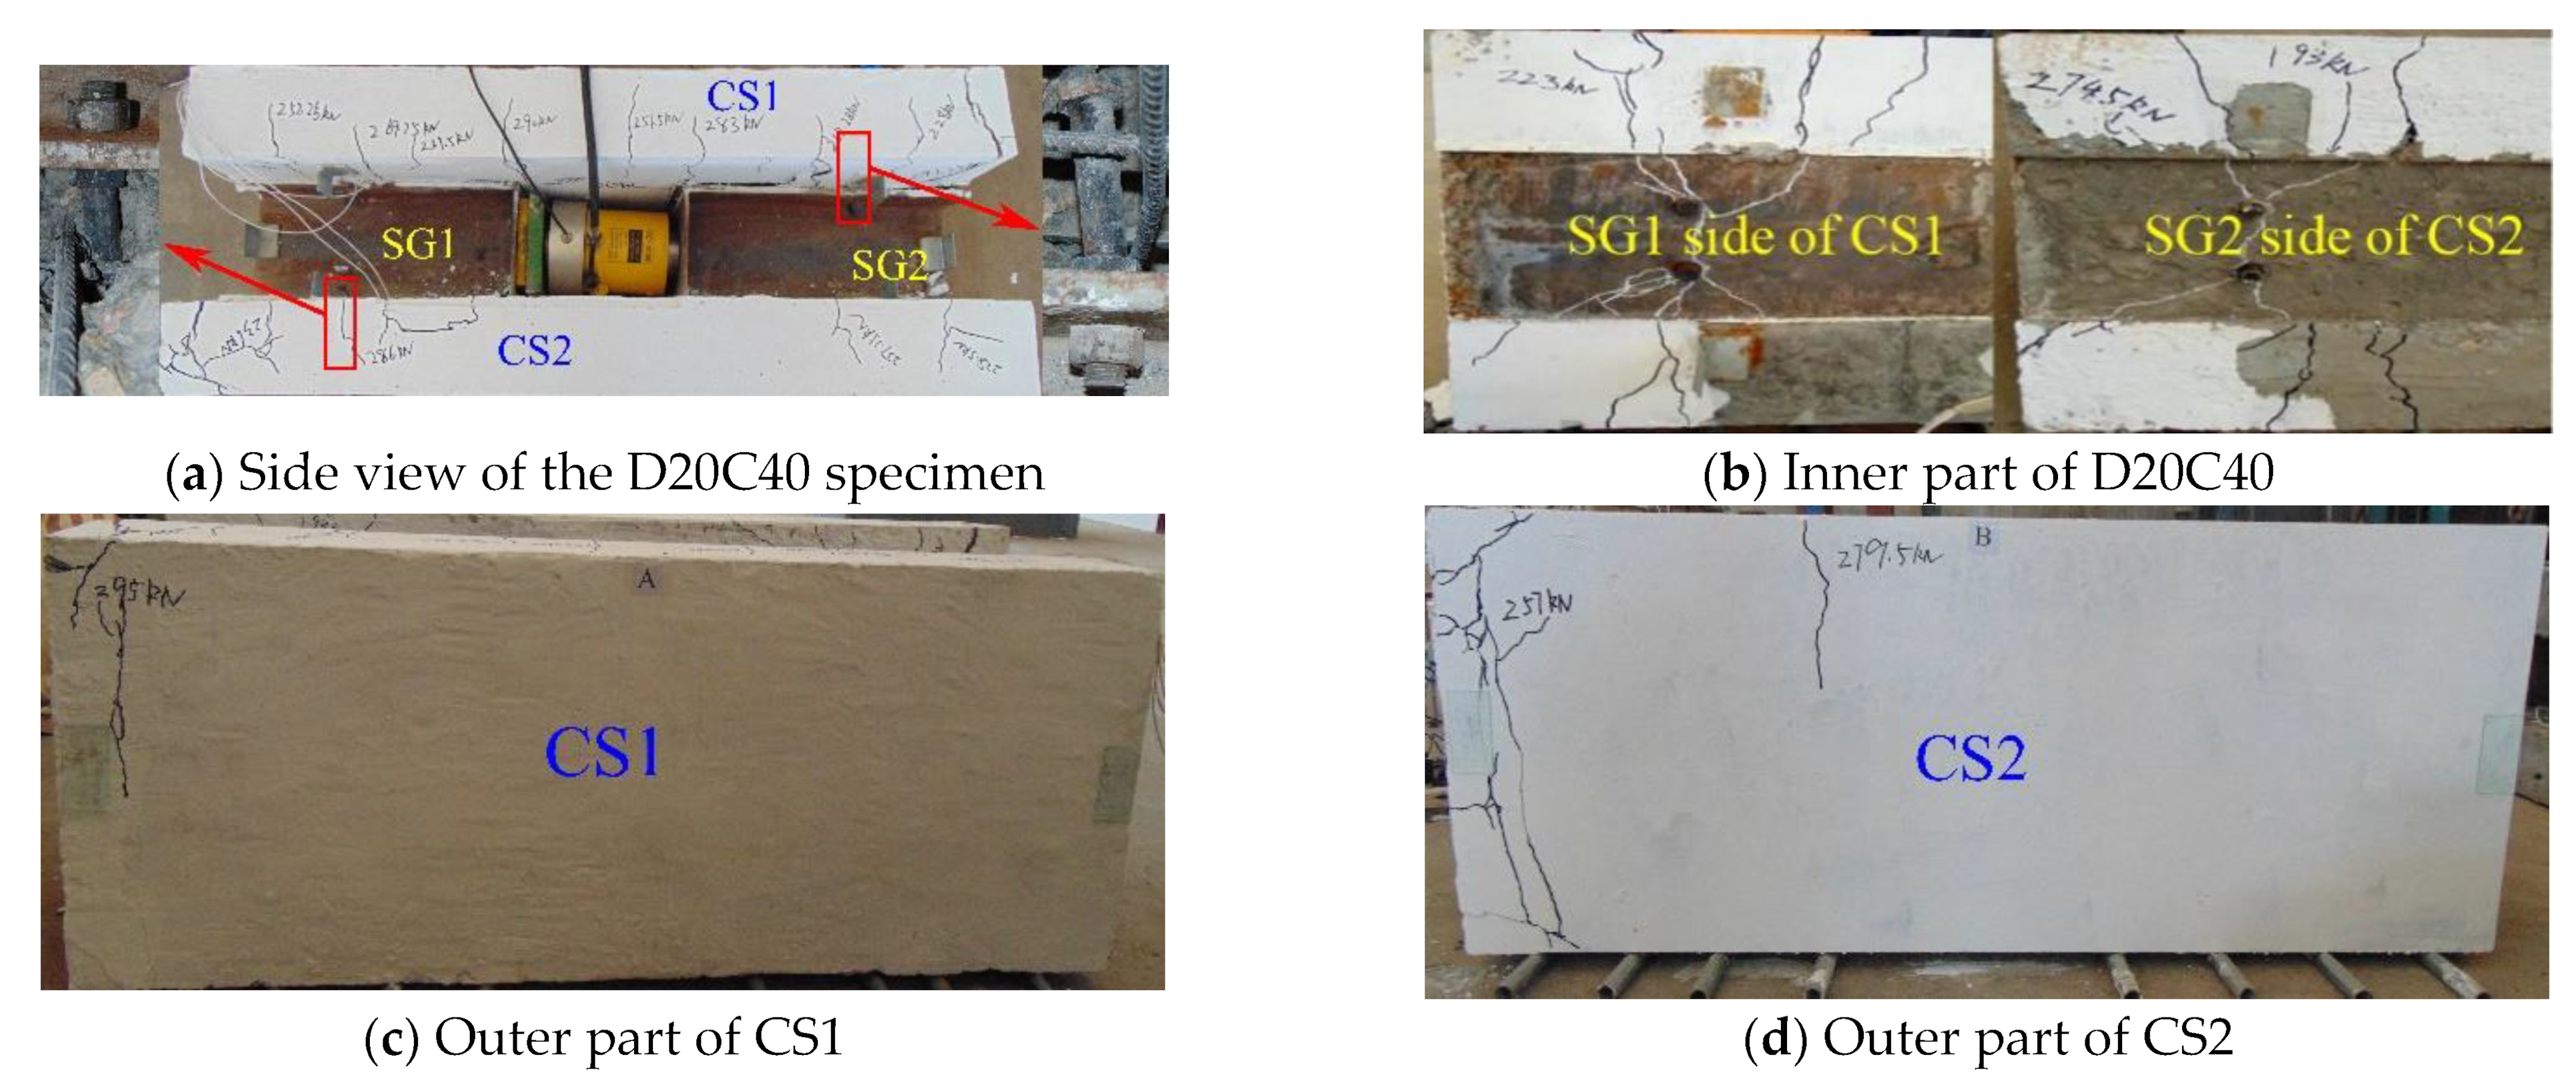
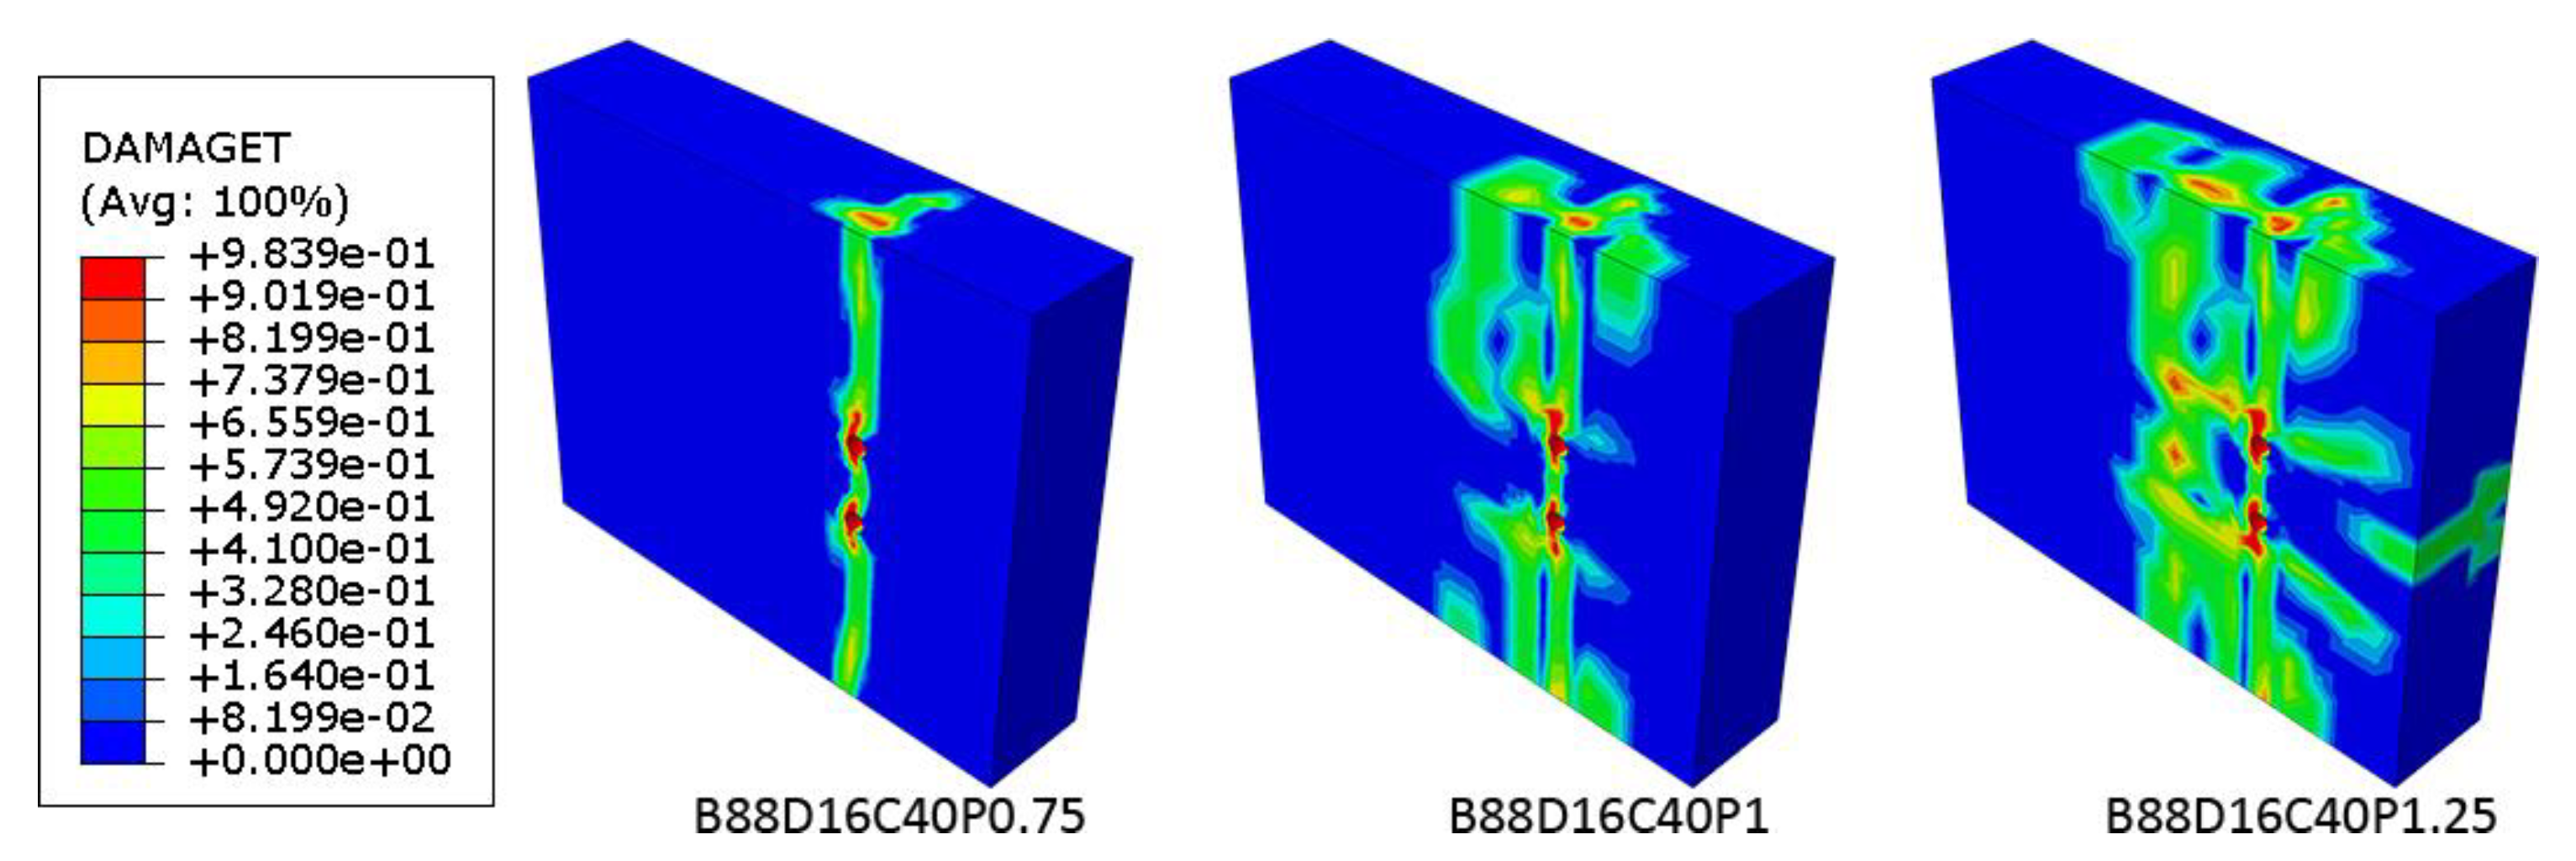
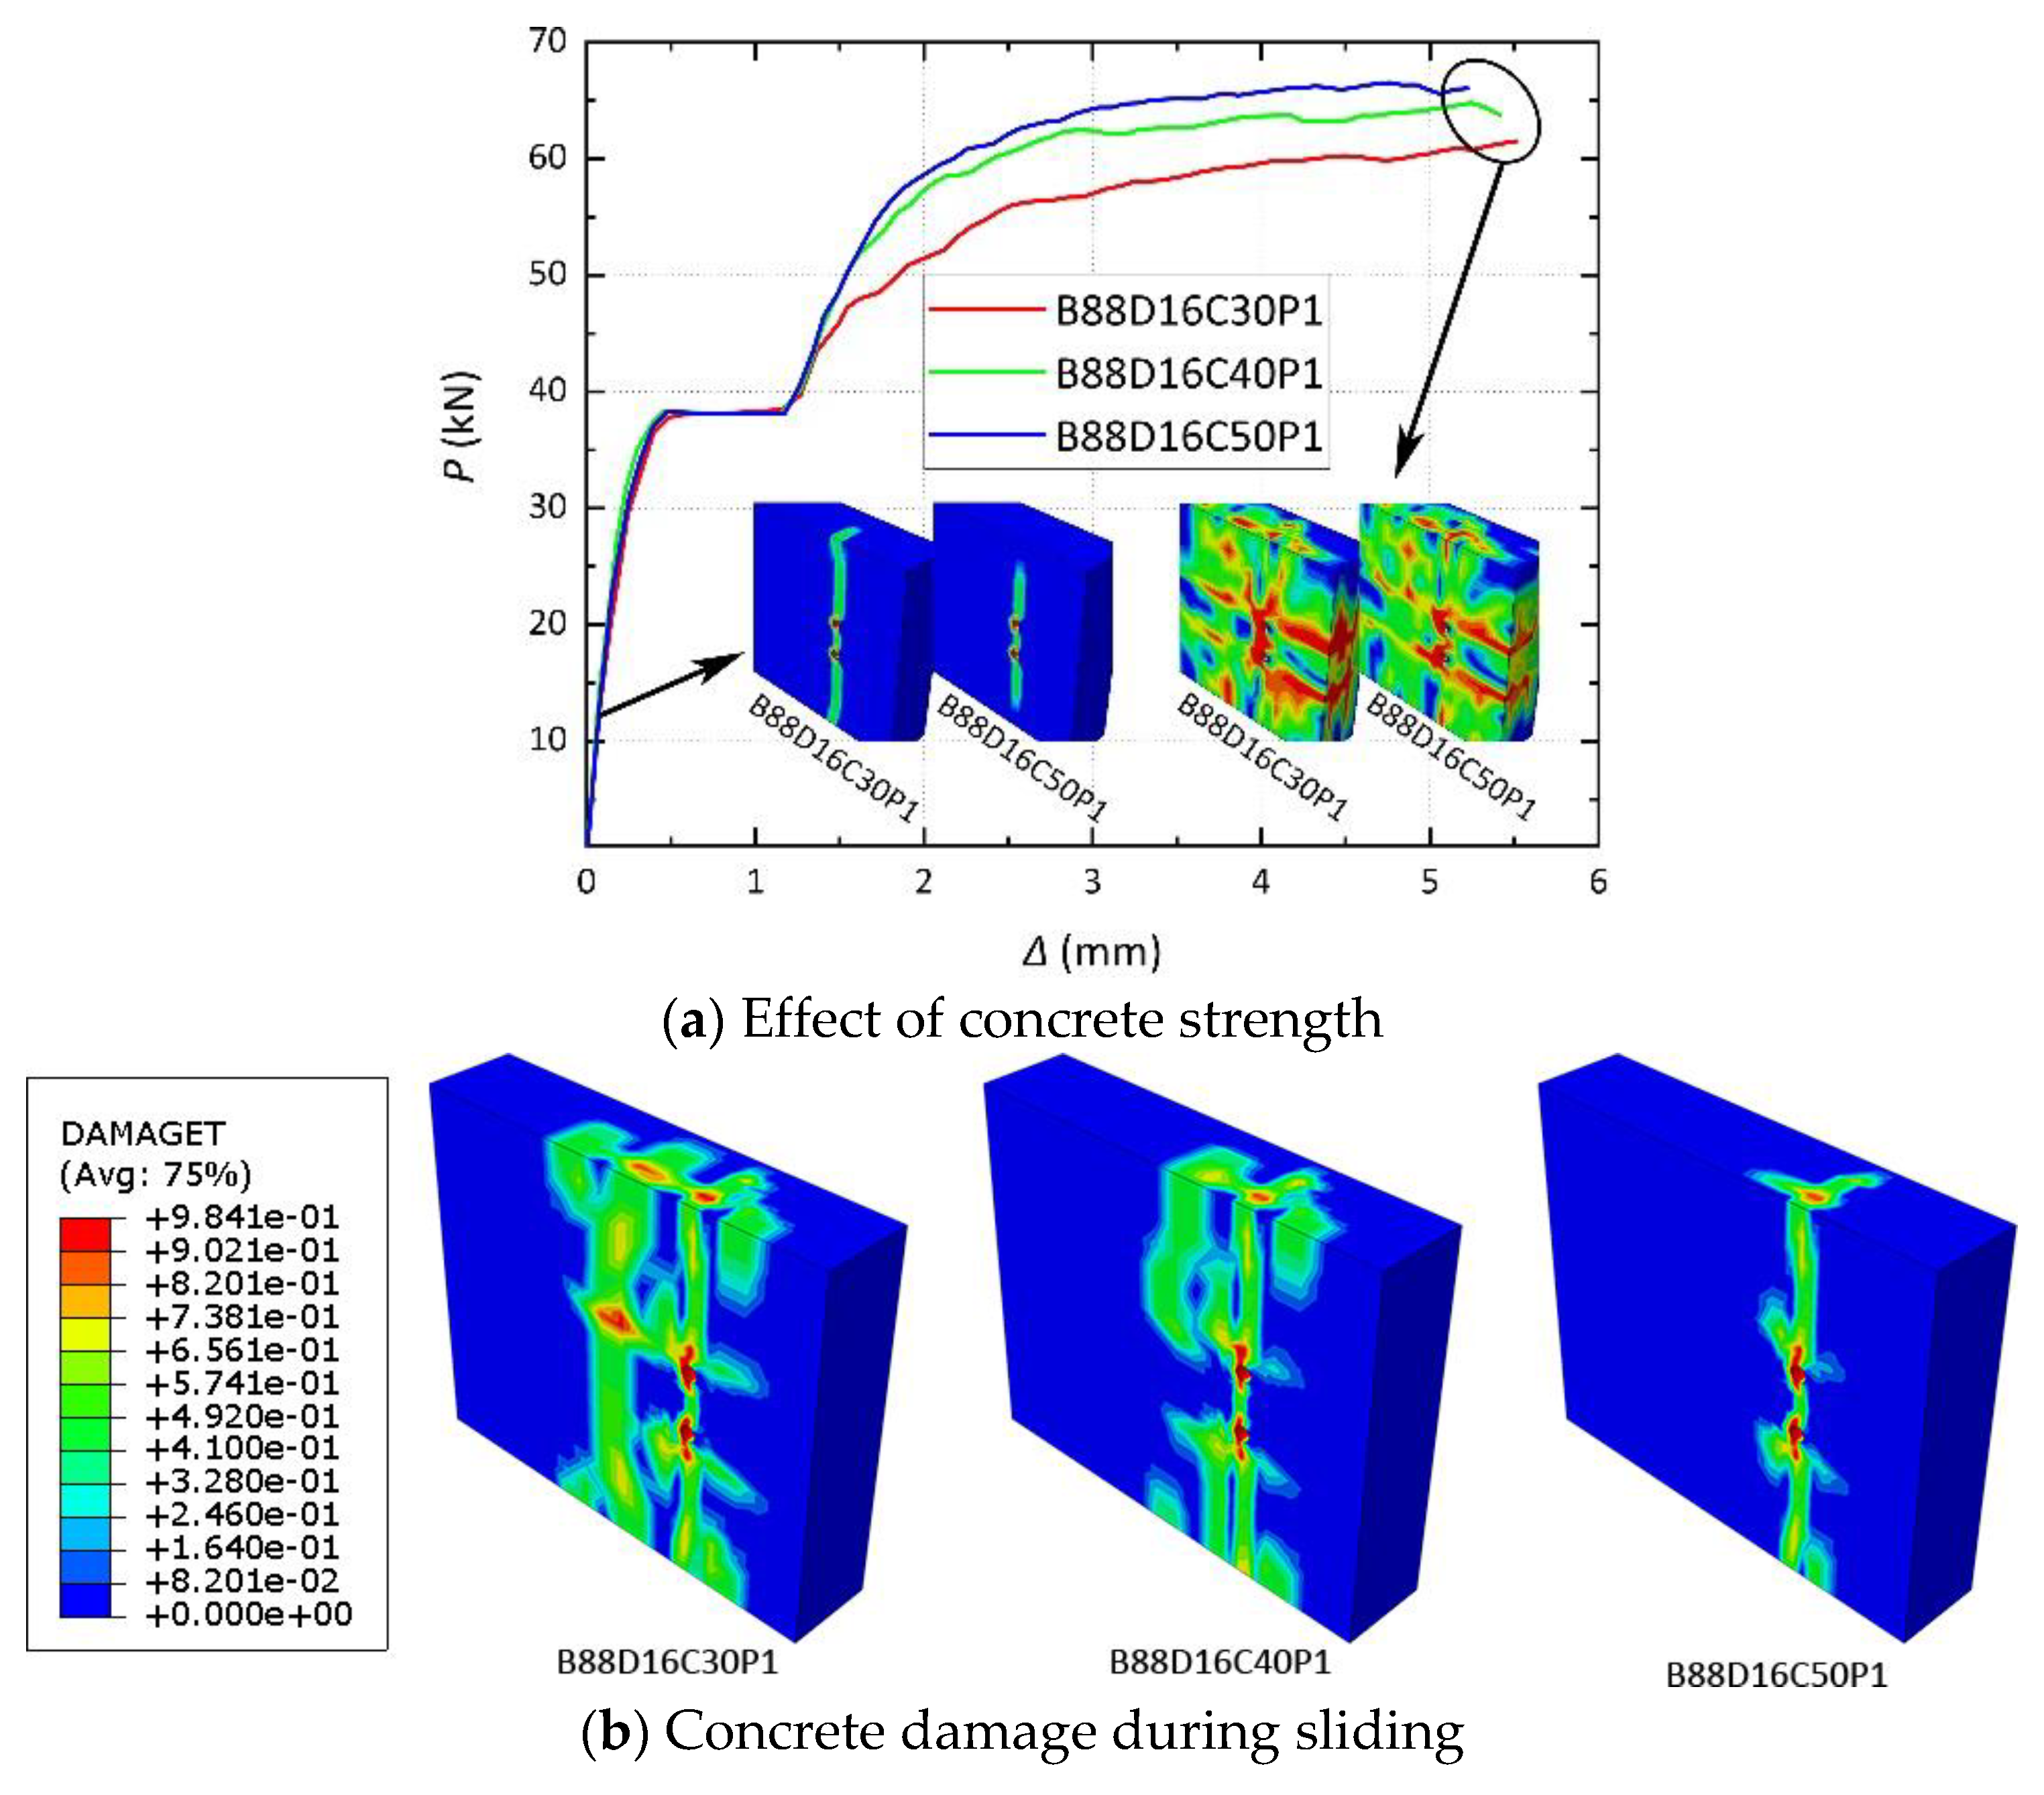
During the loading process, tensile and splitting cracks were produced in the concrete, the distribution of which became denser with decreasing concrete strength and increasing bolt diameter.
(2)
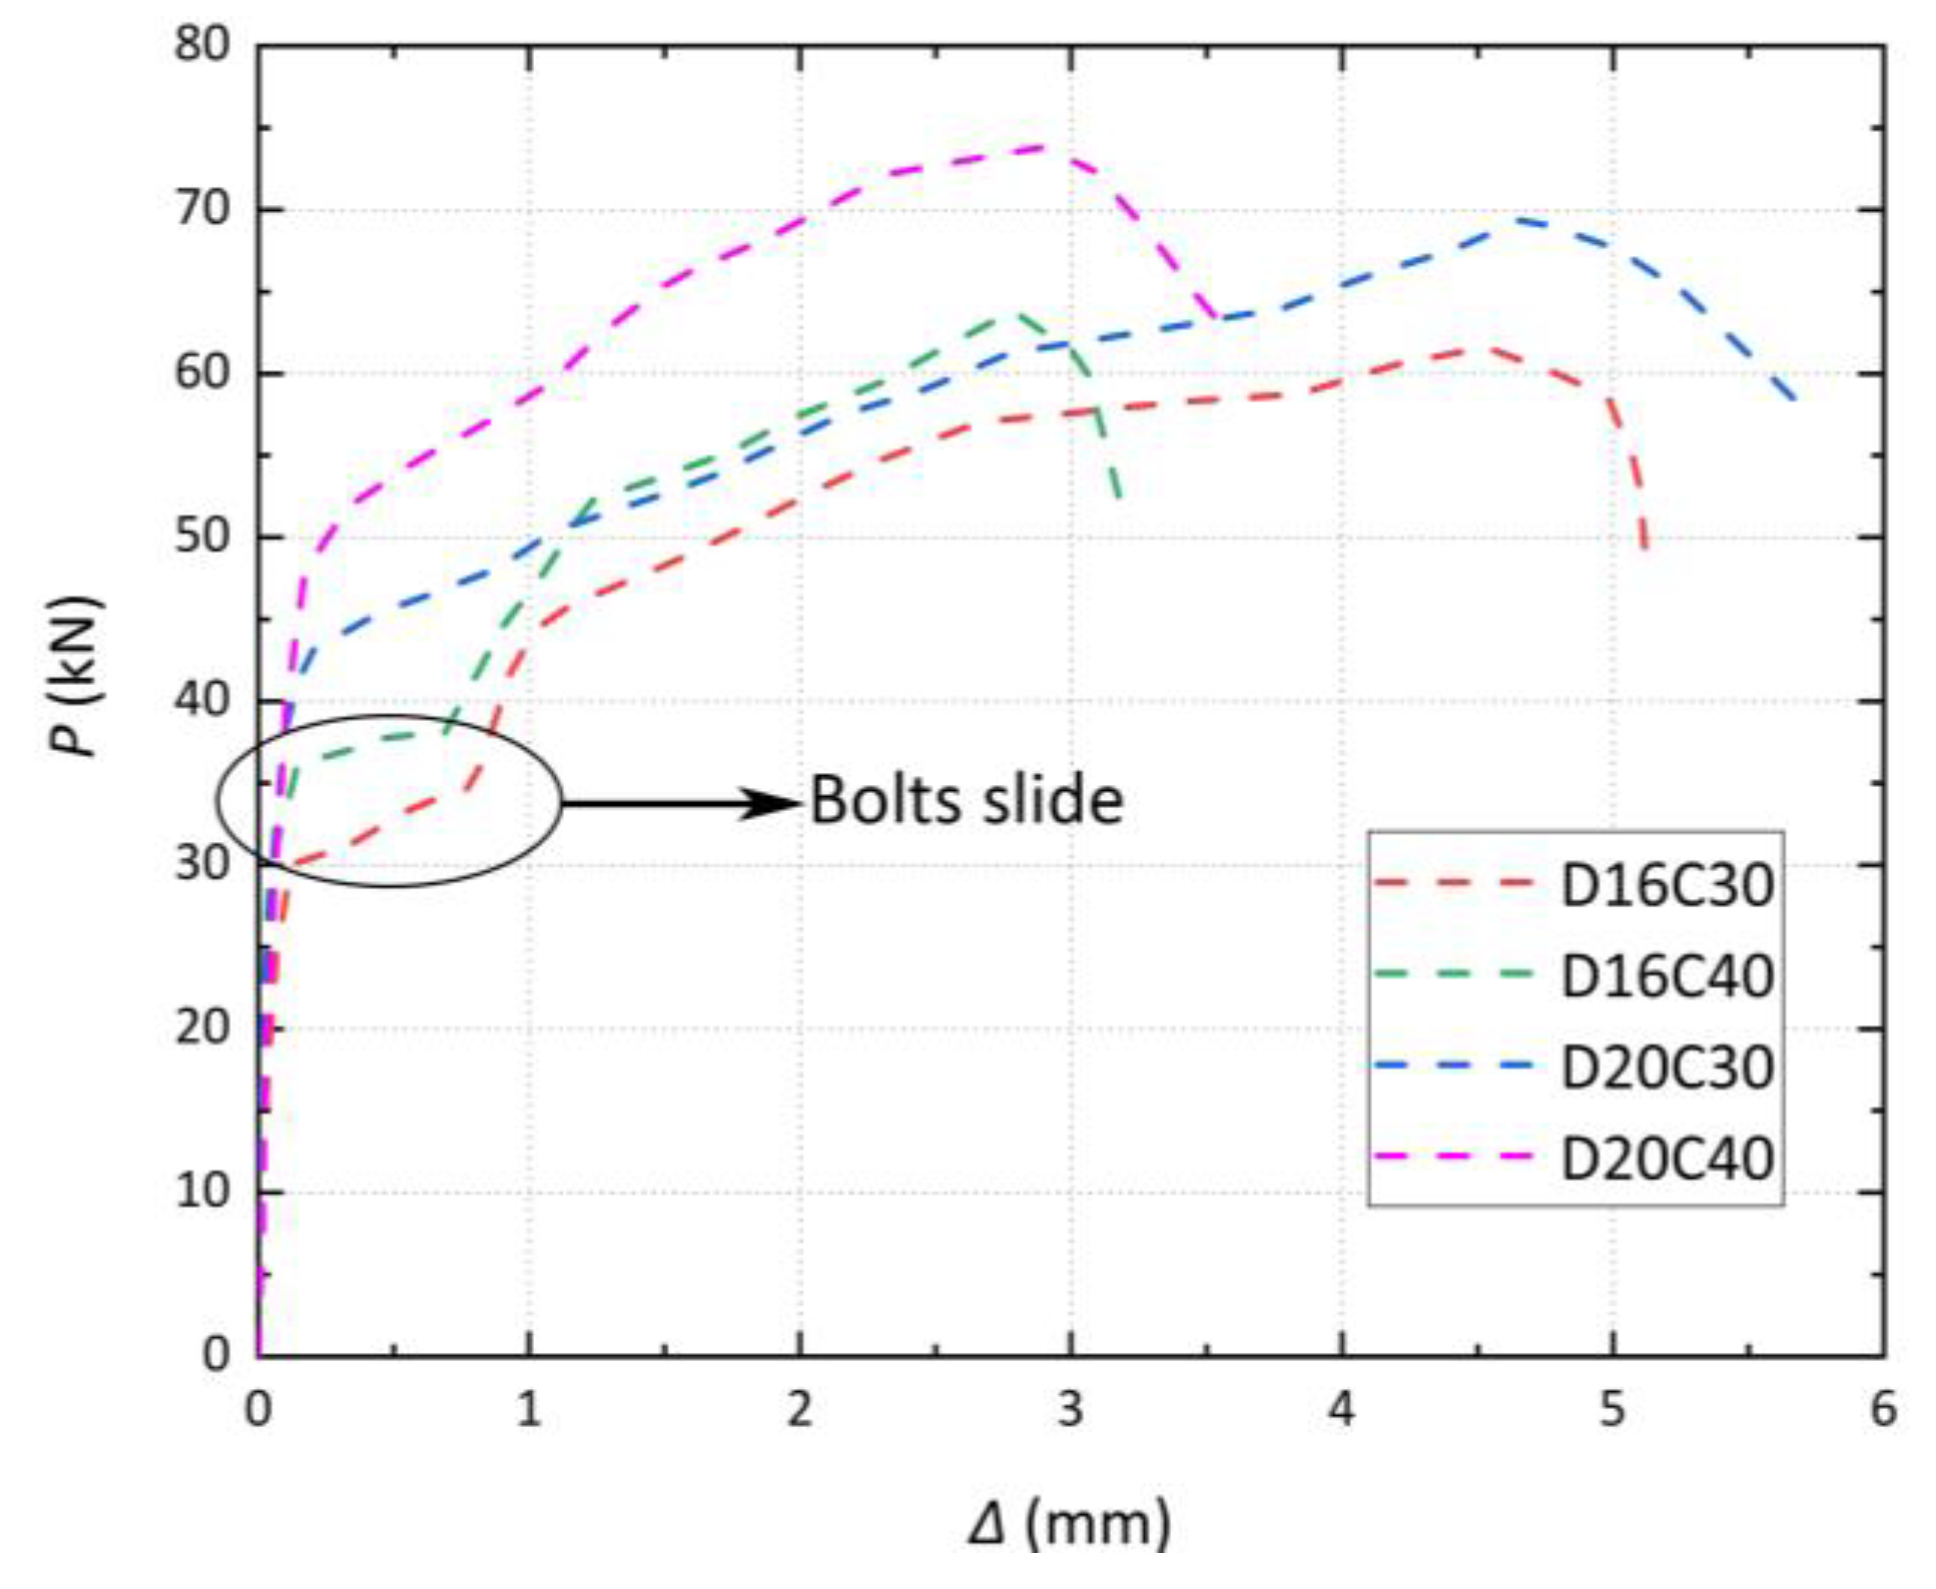
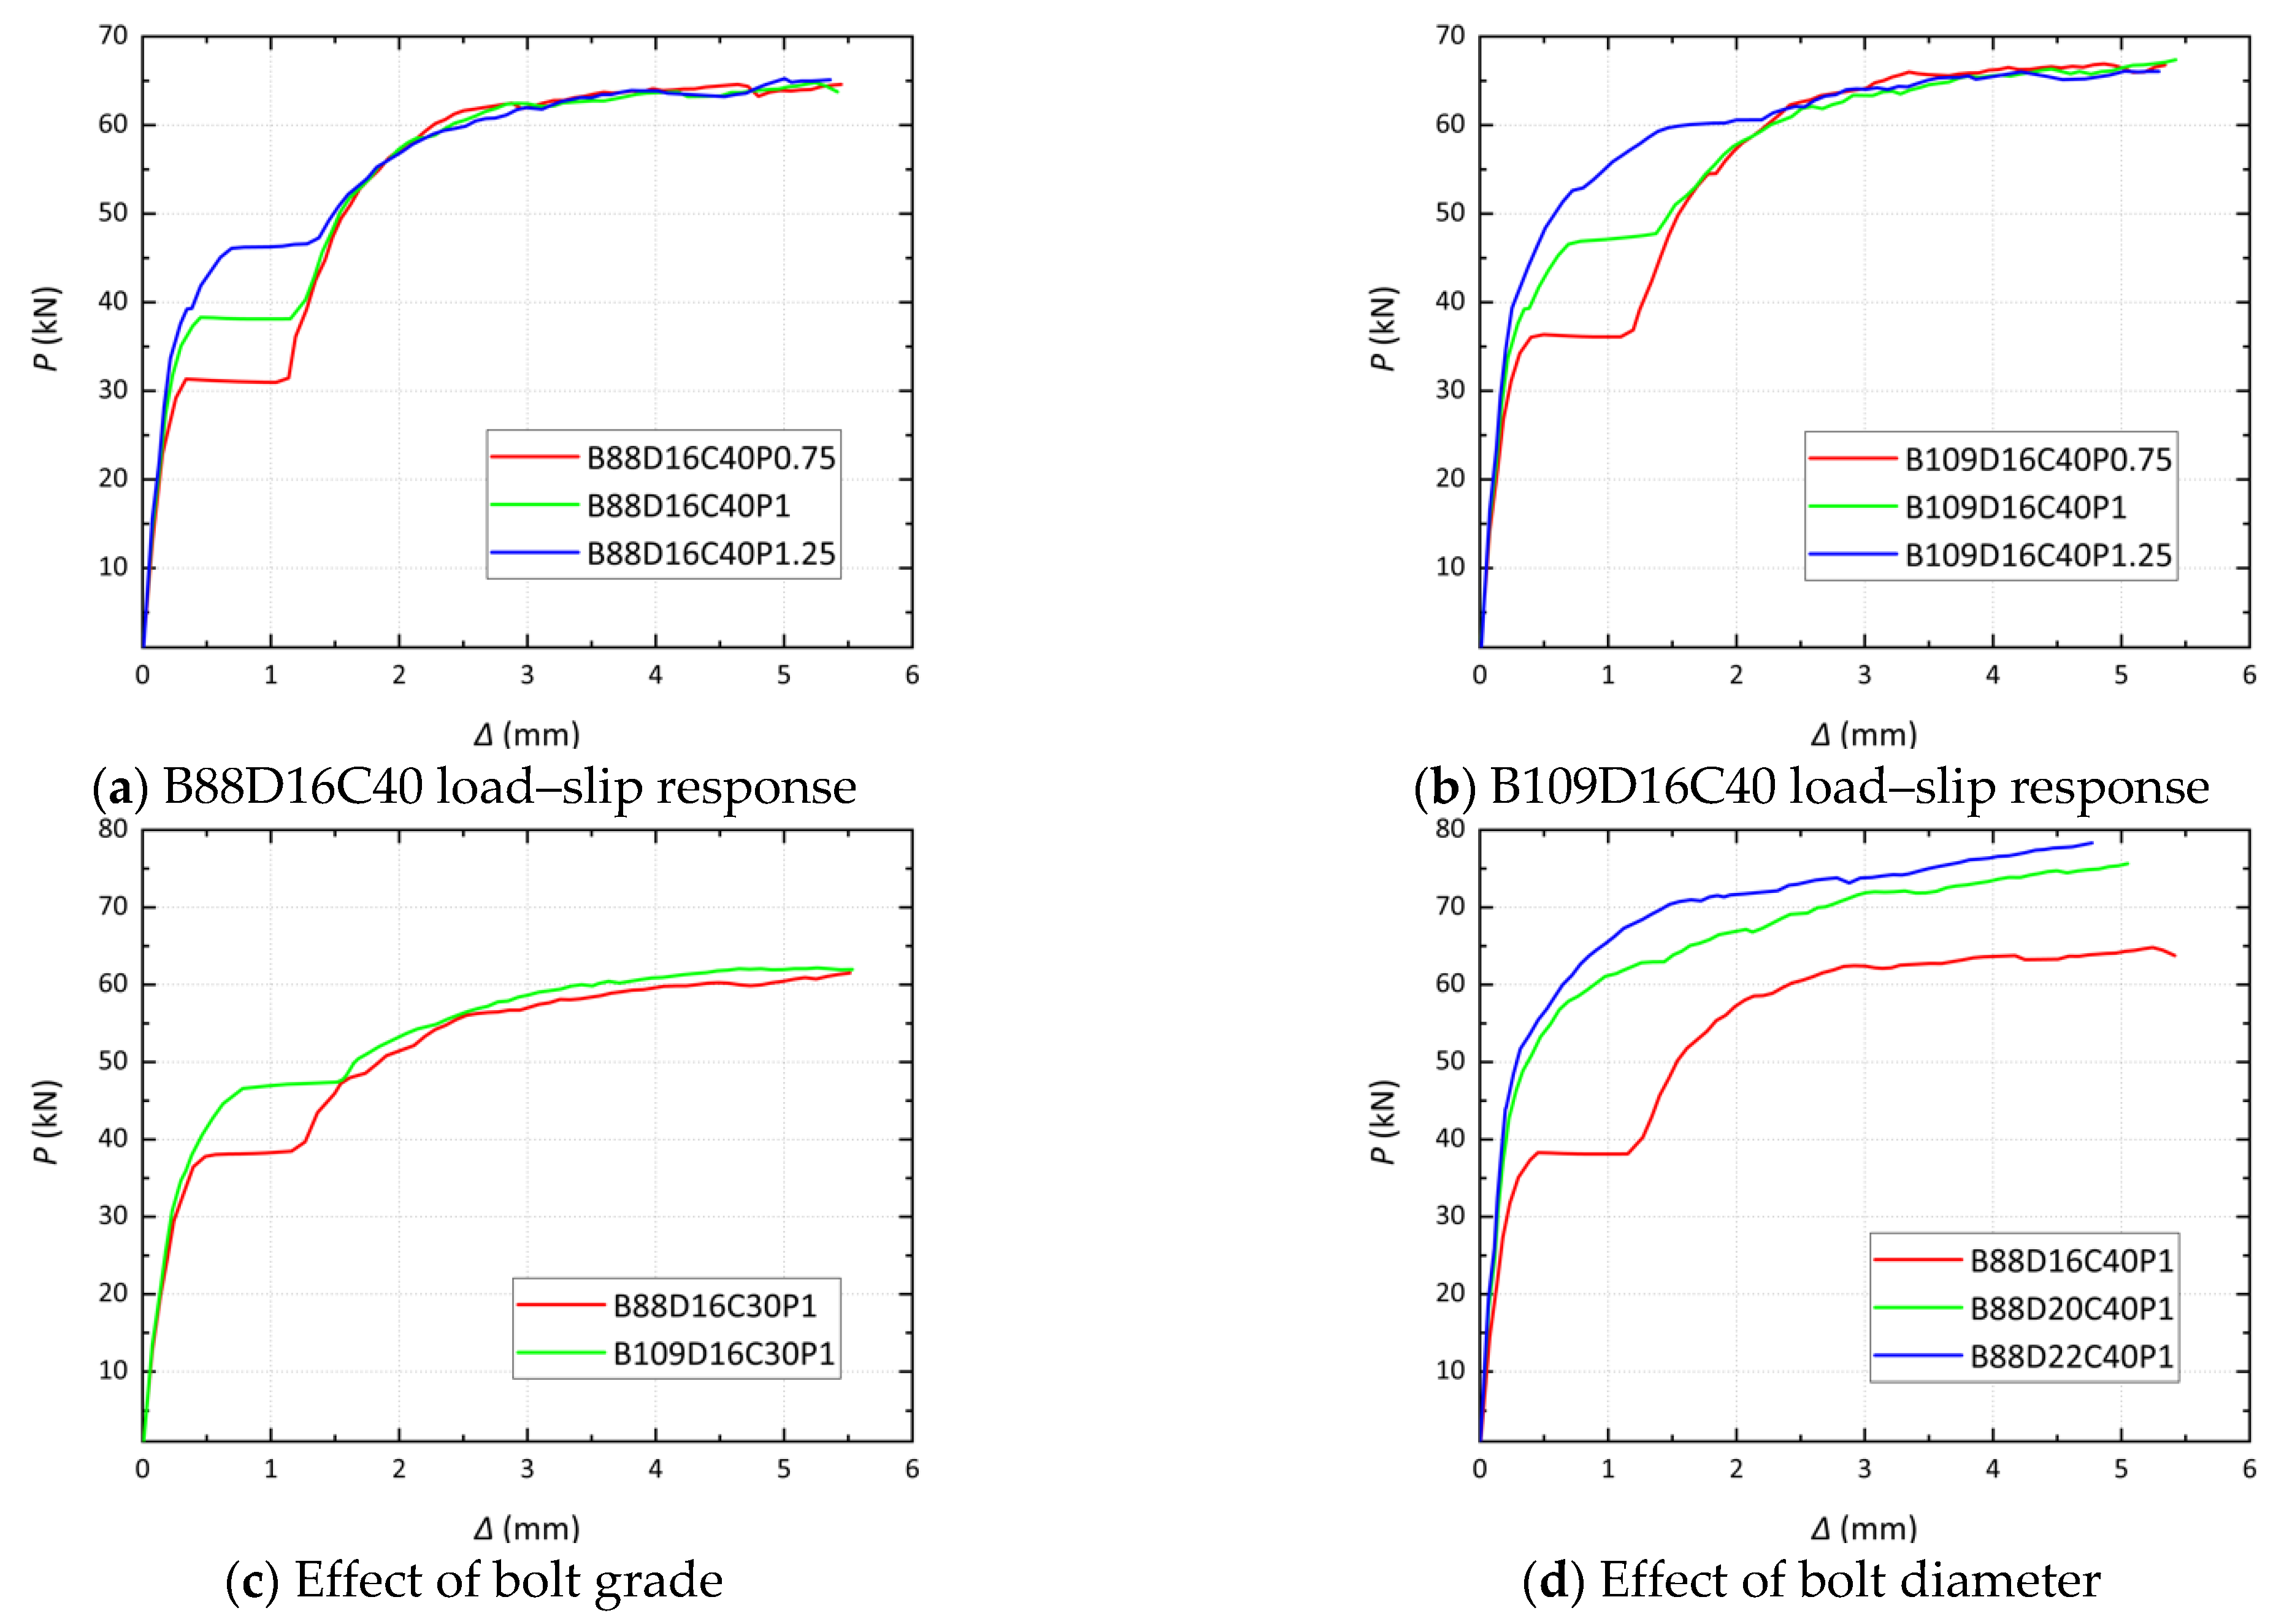
When the concrete strength increased from 30 to 40, the ultimate strength with 16 mm and 20 mm bolts increased by 3.6% and 6.2%, respectively.
(3)
When the diameter of the bolts increased from 16 to 20 mm, the ultimate strength with C30 and C50 concrete increased by 12.8% and 15.6%, respectively.
(4)
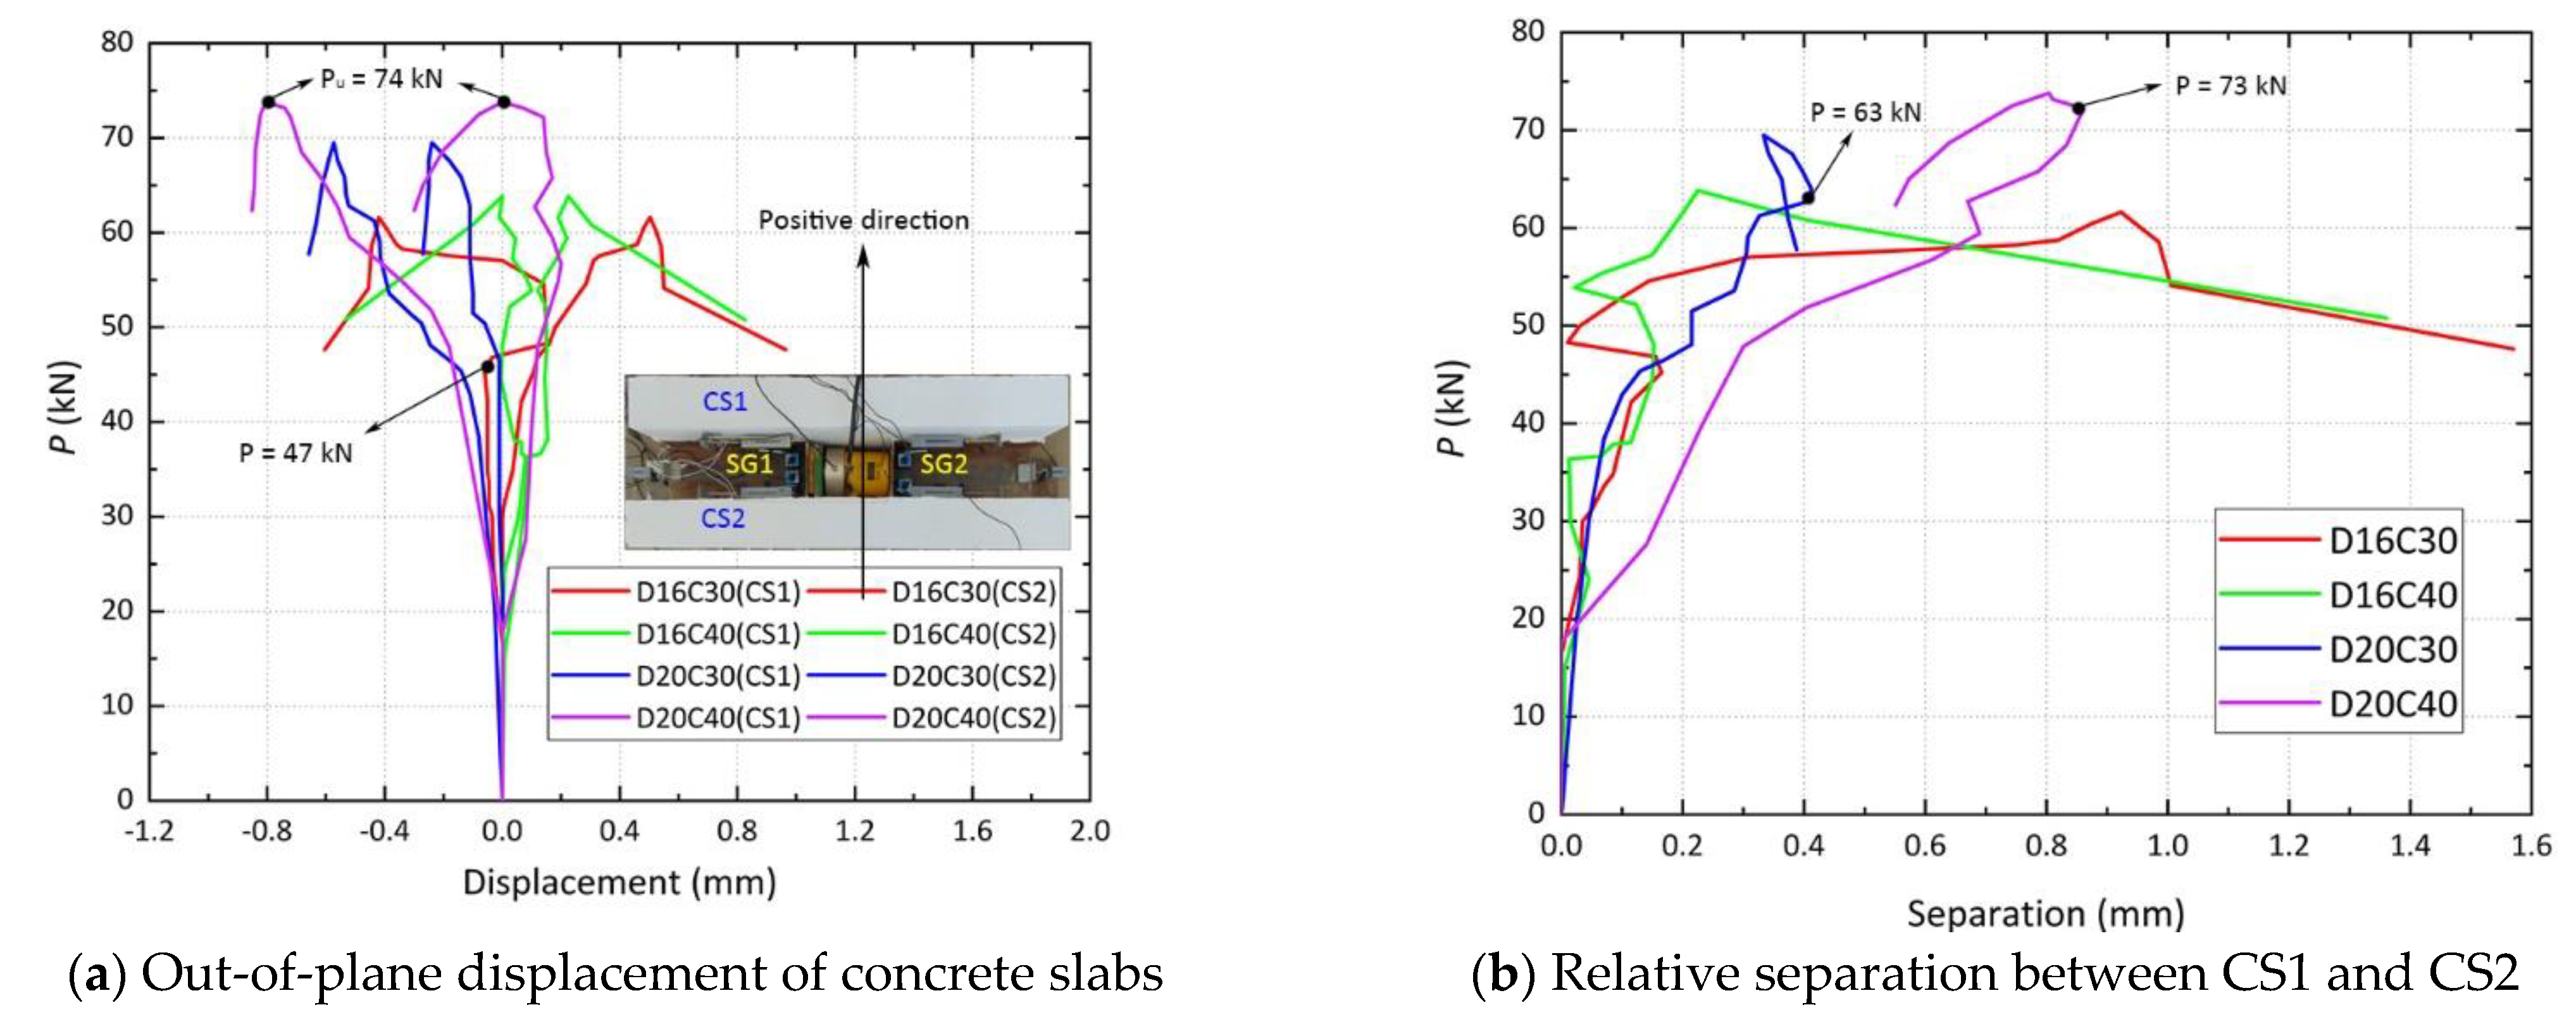
The concrete slabs tended to separate from each other, but this was mitigated when splitting cracks occurred.
The four specimens were modeled using ABAQUS and validated by comparing them with the experimental test results. The conclusions of the analysis are as follows:
(1)
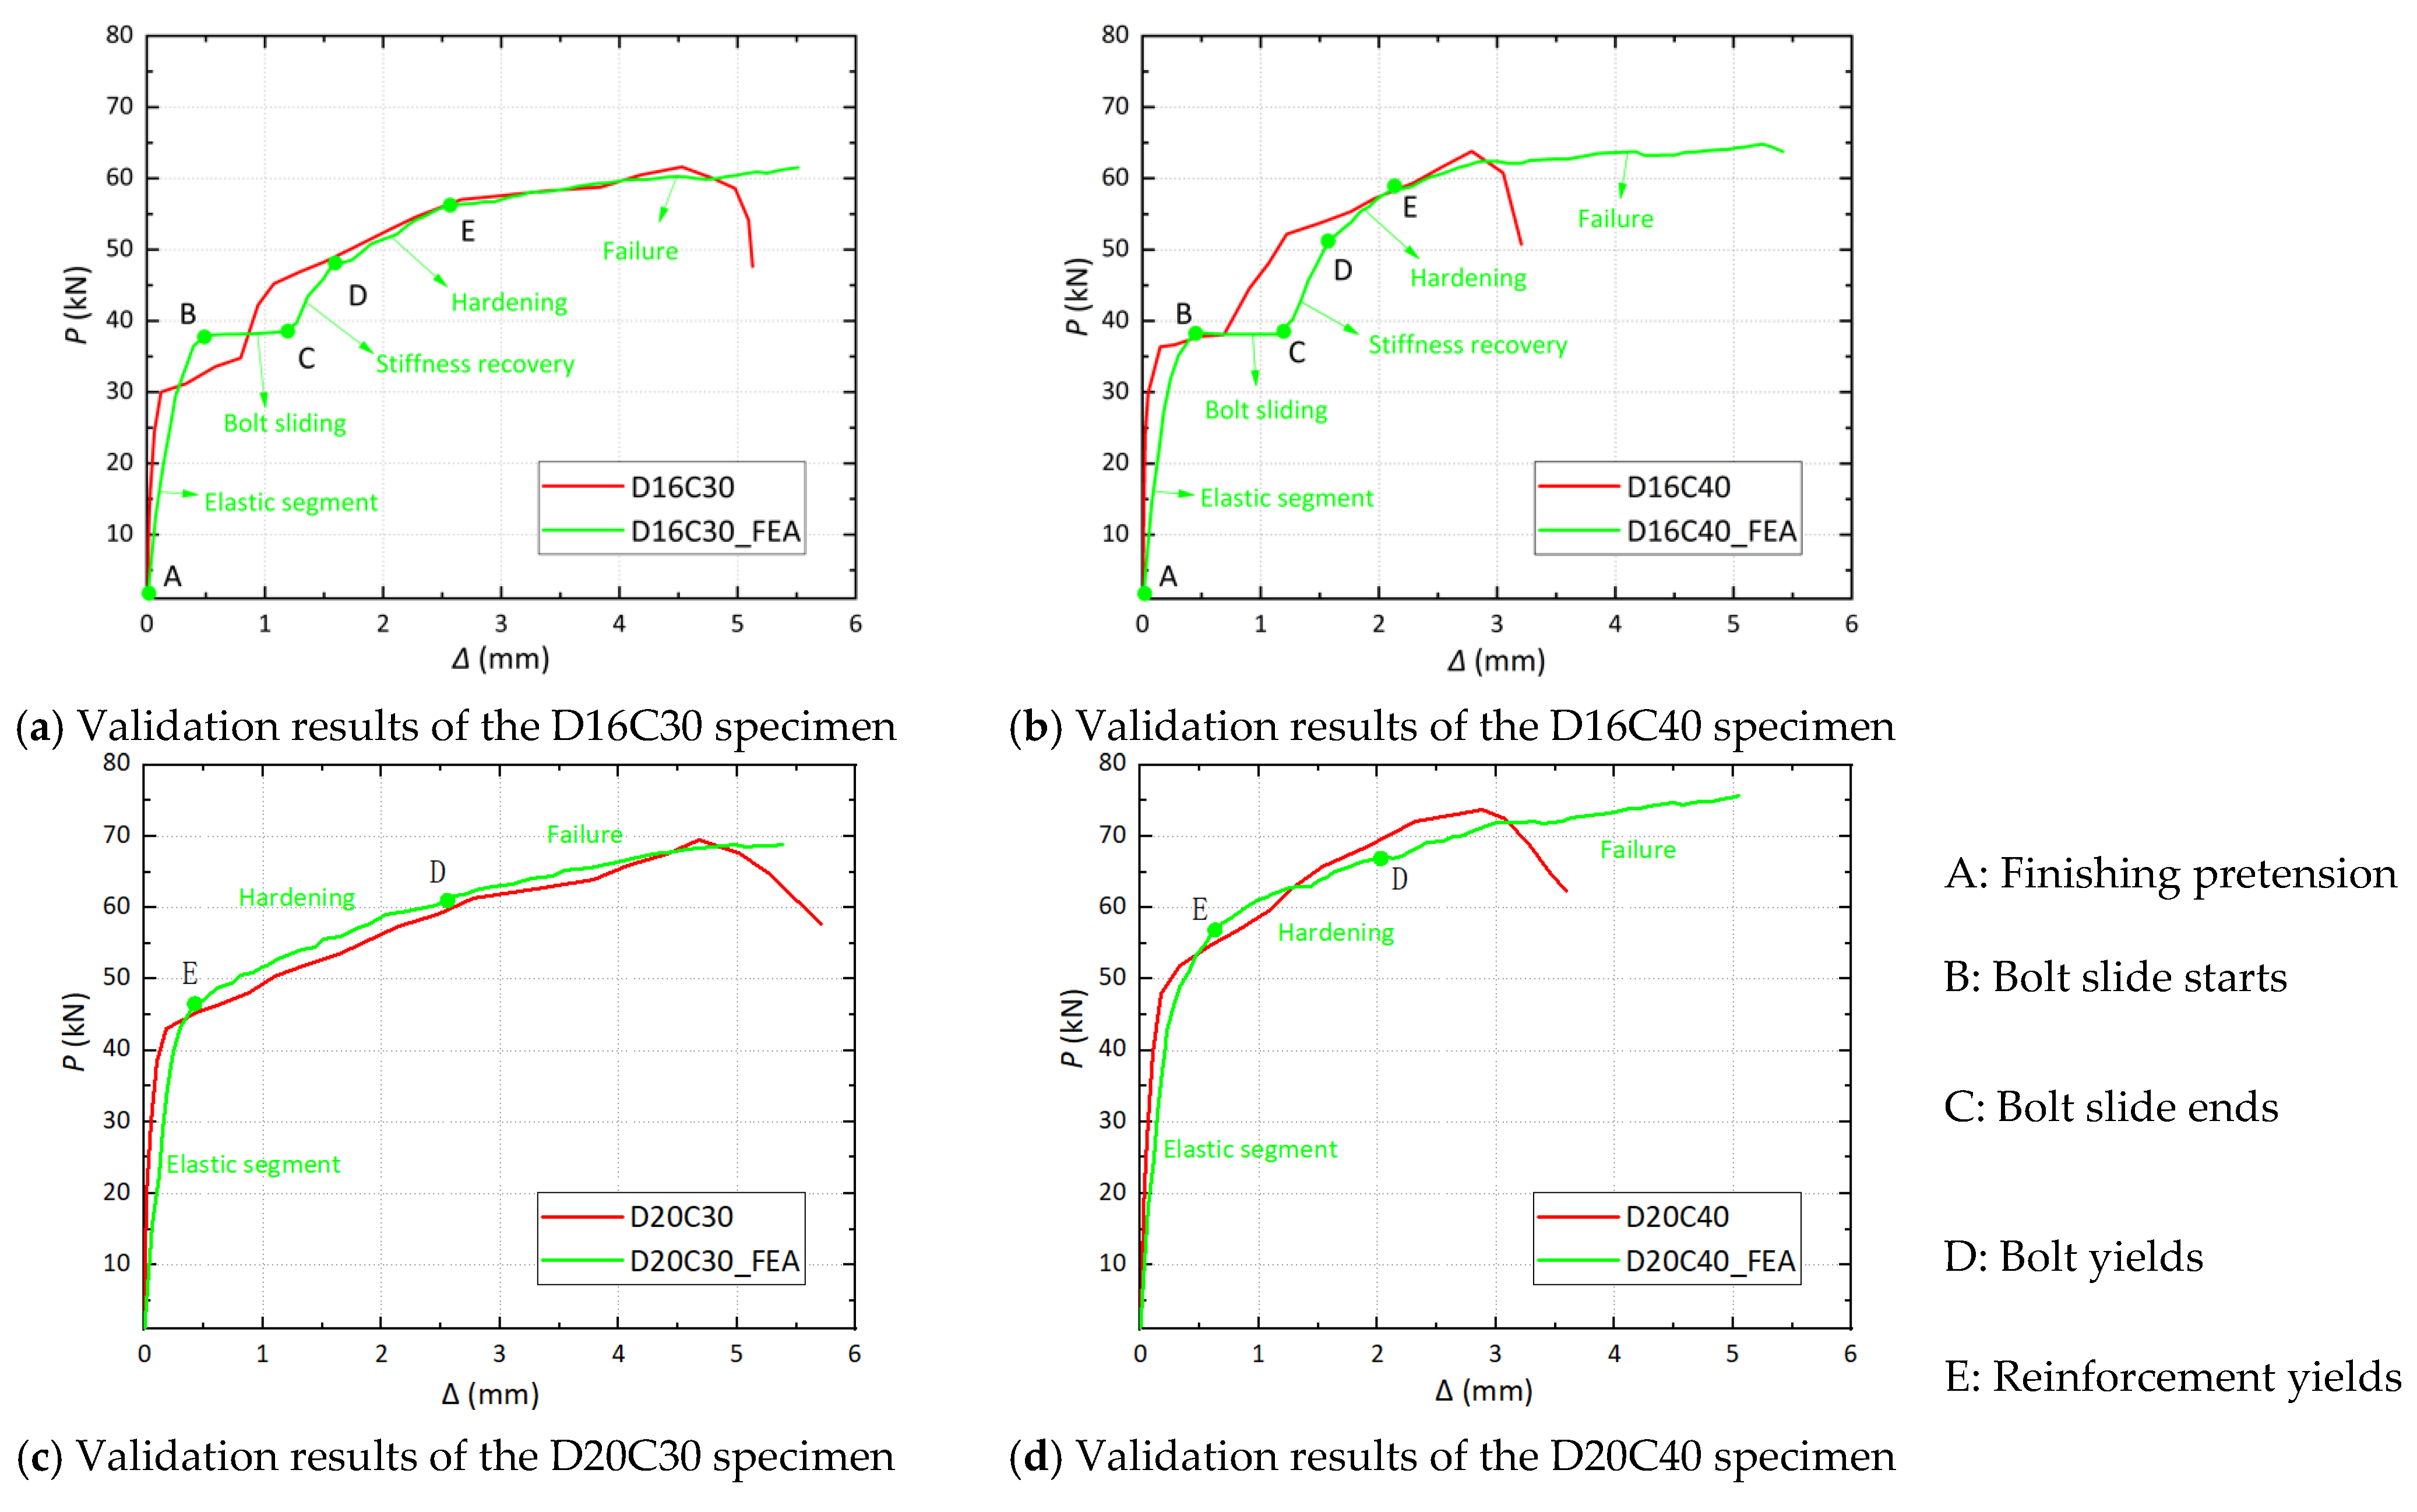
The load–slip responses of the specimens with 16 mm bolts could be divided into five phases, i.e., elastic segment, bolt sliding, stiffness recovery, hardening, and failure.
(2)
The load–slip responses of the specimens with 20 mm bolts could be divided into three phases, i.e., elastic segment, hardening, and failure. The fact that bolt slip was not observed does not mean that it did not occur; instead, it occurred simultaneously with the concrete deformation and failure, rendering it difficult to be reflected in the load–slip response.
Based on the parametric analysis of 18 FE analysis models, an equation was proposed to calculate the shear capacity of high-strength bolted connectors to fill the evident gap in prior studies on the hogging moment.
When the research was applied to actual projects, the sliding characteristics of high-strength bolted connectors were effective in inhibiting concrete cracking in the hogging moment zone of steelconcrete composite beams.

Author Contributions

P.D.: Conceptualization, Methodology, Formal analysis, Funding acquisition. Z.-W.N.: Software, Writing—original draft, Visualization. Y.-H.S.: Investigation, Writing—review and editing. Y.L.: Resources, Supervision, Project administration. W.-L.W.: Validation, Investigation, Data curation. All authors have read and agreed to the published version of the manuscript.

Funding

This research received no external funding.

Data Availability Statement

The data presented in this study are available on request from the corresponding author.

Conflicts of Interest

The authors declare no conflicts of interest.

References

  1. Sánchez, B.D.; Tamayo, J.P.; Morsch, I.B.; Miranda, M.P. A nonlinear geometric model for pre-stressed steel-concrete composite beams. J. Braz. Soc. Mech. Sci. 2021, 43, 233. [Google Scholar] [CrossRef]
  2. Radnic, J.; Markic, R.; Glibic, M.; Cubela, D.; Grgic, N. Experimental testing of concrete beams with different levels of prestressing. Proc. Inst. Mech. Eng. Part. L-J. Mater. Des. Appl. 2016, 230, 760–779. [Google Scholar] [CrossRef]
  3. Rezaie, F.; Bayat, A.M.; Farnam, S.M. Sensitivity analysis of pre-stressed concrete sleepers for longitudinal crack prorogation effective factors. Eng. Fail. Anal. 2016, 66, 385–397. [Google Scholar] [CrossRef]
  4. Mohammadi, T.; Wan, B.L.; Harries, K.A. Bond-slip behavior of fiber-reinforced polymer/concrete interface in single shear pull-out and beam tests. J. Reinf. Plast. Comp. 2016, 35, 375–386. [Google Scholar] [CrossRef]
  5. Asaduzzaman, S.M.; Islam, G.M.S. Using Jute Fiber to Improve Fresh and Hardened Properties of Concrete. J. Nat. Fibers 2023, 20, 2204452. [Google Scholar] [CrossRef]
  6. Hamoda, A.; Hossain, K.M.A.; Sennah, K.; Shoukry, M.; Mahmoud, Z. Behaviour of composite high performance concrete slab on steel I-beams subjected to static hogging moment. Eng. Struct. 2017, 140, 51–65. [Google Scholar] [CrossRef]
  7. Arafa, A.; Farghaly, A.S.; Ahmed, E.A.; Benmokrane, B. Laboratory testing of GFRP-RC panels with UHPFRC joints of the Nipigon River cable-stayed bridge in Northwest Ontario, Canada. J. Bridge. Eng. 2016, 21, 05016006. [Google Scholar] [CrossRef]
  8. El-Khoriby, R.S.; Taher, S.E.; Ghazy, M.F.; Abd-Elaty, M.A. Performance of pre-cracked beams exposed to corrosion environment cast with ultra-high performance concrete. Ain Shams Eng. J. 2023, 14, 102171. [Google Scholar] [CrossRef]
  9. Wan, Z.Y.; Fang, Z.; Liang, L.N.; He, S.H.; Sun, X.D. Structural performance of steel–concrete composite beams with UHPC overlays under hogging moment. Eng. Struct. 2022, 270, 114866. [Google Scholar] [CrossRef]
  10. Nie, J.G.; Tao, M.X.; Nie, X.; Fan, J.S.; Zhang, Z.X.; Tang, H.Y.; Zhu, L.; Li, Y.X. New technology and application of uplift-restricted and slip-permitted connection. Civ. Eng. J. 2015, 48, 4. [Google Scholar] [CrossRef]
  11. Li, C.; Nie, J.G.; Zhou, X.Y.; Liu, X.W. Anti-cracking design for hogging moment regions of steel-concrete continuous composite beam bridges. J. Build. Struct. 2022, 43, 3. [Google Scholar] [CrossRef]
  12. Su, H.; Su, Q.T.; Xu, C.; Zhang, X.L.; Lei, D.Y. Shear performance and dimension rationalization study on the rubber sleeved stud connector in continuous composite girder. Eng. Struct. 2021, 240, 112371. [Google Scholar] [CrossRef]
  13. Su, H.; Su, Q.T.; Casas, J.R.; Xu, C.; Tang, J.; Jiang, C. Influence mechanism of steel-concrete interlayer partial shear connections on mechanical properties of composite girders. Structures 2022, 46, 503–520. [Google Scholar] [CrossRef]
  14. Guo, J.Y.; Wang, J.Y.; Wang, Y.B.; Gao, X.L.; Bian, C. Experimental study on demountable steel ultra-high performance concrete composite slabs under hogging moment. Arch. Civ. Mech. Eng. 2022, 22, 137. [Google Scholar] [CrossRef]
  15. Zhang, Y.; Cai, S.K.; Zhu, Y.P.; Fan, L.; Shao, X.D. Flexural responses of steel-UHPC composite beams under hogging moment. Eng. Struct. 2020, 206, 110134. [Google Scholar] [CrossRef]
  16. Dai, X.H.; Lam, D.; Saveri, E. Effect of concrete strength and stud collar size to shear capacity of demountable shear connectors. J. Struct. Eng. 2015, 141, 04015025. [Google Scholar] [CrossRef]
  17. Ataei, A.; Bradford, M.A.; Liu, X.P. Experimental study of composite beams having a precast geopolymer concrete slab and deconstructable bolted shear connectors. Eng. Struct. 2016, 114, 1–13. [Google Scholar] [CrossRef]
  18. Kwon, G.; Engelhardt, M.D.; Klingner, R.E. Behavior of post-installed shear connectors under static and fatigue loading. J. Construct. Steel Res. 2010, 66, 532–541. [Google Scholar] [CrossRef]
  19. Lee, M.S.S.; Bradford, M.A. Sustainable composite beam behaviour with deconstructable bolted shear connectors. In Proceedings of the Composite Construction in Steel and Concrete VII, North Queensland, Australia, 28–31 July 2013. [Google Scholar]
  20. Liu, X.P.; Bradford, M.A.; Lee, M.S.S. Behavior of high-strength friction-grip bolted shear connectors in sustainable composite beams. J. Struct. Eng. 2015, 141, 04014149. [Google Scholar] [CrossRef]
  21. Zhang, Y.J.; Chen, B.C.; Liu, A.R.; Pi, Y.L.; Zhang, J.P.; Wang, Y.; Zhong, L.C. Experimental study on shear behavior of high strength bolt connection in prefabricated steel-concrete composite beam. Compos. Part B-Eng. 2019, 159, 481–489. [Google Scholar] [CrossRef]
  22. Zhang, Y.J.; Liu, A.R.; Chen, B.C. Experimental study on shear behavior of high-strength bolt connection in steel-concrete composite beam. J. Build. Struct. 2019, 40, 054. [Google Scholar] [CrossRef]
  23. GB 50017-2017; Standard for Design of Steel Structures. China Architecture & Building Press: Beijing, China, 2017.
  24. EN1994-2-2008; Eurocode 4: Design of Composite Steel and Concrete Structures—Part 2: General Rules and Rules for Bridges. European Committee for Standardization (CEN): Brussels, Belgium, 2010.
  25. Du, H.; Hu, X.M.; Meng, Y.F.; Han, G.H.; Guo, K.K. Study on composite beams with prefabricated steel bar truss concrete slabs and demountable shear connectors. Eng. Struct. 2020, 210, 110419. [Google Scholar] [CrossRef]
  26. Du, H.; Zhang, B.; Hu, X.M.; Kou, L.Y.; Xia, Y. Experimental study on shear performance of bolted connections in steel-concrete composite beams. J. Build. Struct. 2017, 38, 043. [Google Scholar] [CrossRef]
  27. Chen, J.; Wang, W.; Ding, F.X.; Xu, F.; Long, S.G.; Yang, C.Q. Shear bearing capacity of high-strength bolt connectors in steel-concrete composite beams. J. Railw. Sci. Eng. 2019, 16, 10. [Google Scholar] [CrossRef]
  28. Pavlović, M.; Markovic, Z.; Veljkovic, M.; Budevac, D. Bolted shear connectors vs. headed studs behaviour in push-out tests. J. Construct. Steel Res. 2013, 88, 134–149. [Google Scholar] [CrossRef]
  29. Zhou, A.; Dai, H.; Liu, Q.W.; Ding, F.; Dai, J.P. Experimental study on shear-bearing-bearing capacity of stud connectors within tension concrete. J. Highw. Transp. Res. Develop. 2008, 3, 70–74. [Google Scholar] [CrossRef]
  30. GB 50010-2010; Code for Design of Concrete Structures. China Architecture & Building Press: Beijing, China, 2015.
  31. Sidoroff, F. Physical Non-Linearities in Structural Analysis; Springer: Heidelberg/Berlin, Germany, 1981; pp. 237–244. [Google Scholar]
  32. Karalar, M.; Dicleli, M. Effect of pile orientation on the fatigue performance of jointless bridge H-piles subjected to cyclic flexural strains. Eng. Struct. 2023, 276, 115385. [Google Scholar] [CrossRef]
  33. Du, Q.Z.; Luo, G.Q.; Wang, X.; Wang, T.; Fu, G.Q.; Lu, C.J. Fast optimization method of flexible support structure based on mathematical model. Arch. Adv. Eng. Sci. 2023, 1–11. [Google Scholar] [CrossRef]
  34. Cao, Y.; Wakil, K.; Alyousef, R.; Jermsittiparsert, K.; Ho, L.S.; Alabduljabbar, H.; Alaskar, A.; Alrshoudi, F.; Mohamed, A.M. Application of extreme learning machine in behavior of beam to column connections. Structures 2020, 25, 861–867. [Google Scholar] [CrossRef]
  35. Purohit, J.; Dave, R. Leveraging deep learning techniques to obtain efficacious segmentation results. Arch. Adv. Eng. Sci. 2023, 1, 11–26. [Google Scholar] [CrossRef]
  36. Wei, Y.S.; Wang, J.F.; Wang, J.X.; Xu, Q.Y.; Lloret, J. Iteration dependent interval based open-closed-loop iterative learning control for time varying systems with vector relative degree. CAAI Trans. Intell. Technol. 2023, 8, 645–660. [Google Scholar] [CrossRef]
  37. Tao, Z.H.; Ouyang, C.P.; Liu, Y.B.; Chung, T.L.E.; Cao, Y.X. Multi-head attention graph convolutional network model: End-to-end entity and relation joint extraction based on multi-head attention graph convolutional network. CAAI Trans. Intell. Technol. 2023, 8, 468–477. [Google Scholar] [CrossRef]
  38. Zhao, L.M.; Sun, Z.B.; Liu, K.P.; Zhang, J.L. The dynamic relaxation form finding method aided with advanced recurrent neural network. CAAI Trans. Intell. Technol. 2023, 8, 635–644. [Google Scholar] [CrossRef]
  39. Poudel, Y.K.; Bhandari, P. Control of the BLDC Motor Using Ant Colony Optimization Algorithm for Tuning PID Parameters. Archives of Advanced Engineering Science. Arch. Adv. Eng. Sci. 2023, 1–12. [Google Scholar] [CrossRef]
Figure 1. Schematics of two forms of demountable connector.
Buildings 14 01052 g001
Figure 2. Geometrical dimensions of experimental specimens and parts (in mm).
Buildings 14 01052 g002
Figure 3. Photograph of the experimental equipment.
Buildings 14 01052 g003
Figure 4. Tension cracks of the D16C30 specimen.
Buildings 14 01052 g004aBuildings 14 01052 g004b
Figure 5. Splitting cracks of concrete slabs.
Buildings 14 01052 g005
Figure 6. Tension cracks of the D16C40 specimen.
Buildings 14 01052 g006
Figure 7. Tension cracks of the D20C30 specimen.
Buildings 14 01052 g007
Figure 8. Tension cracks of the D20C40 specimen.
Buildings 14 01052 g008
Figure 9. Load–slip results.
Buildings 14 01052 g009
Figure 10. Out–of–plane displacement and relative separation outcomes.
Buildings 14 01052 g010
Figure 11. Steel constitutional relationship.
Buildings 14 01052 g011
Figure 12. Finite element model.
Buildings 14 01052 g012
Figure 13. Validation of simulations.
Buildings 14 01052 g013
Figure 14. Evolution of stress and damage of the D16C30 specimen.
Buildings 14 01052 g014
Figure 15. Stress and damage in the D20C30 and D20C40 specimens.
Buildings 14 01052 g015
Figure 16. Effects of bolt properties.
Buildings 14 01052 g016
Figure 17. Concrete damage during sliding.
Buildings 14 01052 g017
Figure 18. Effects of concrete strength.
Buildings 14 01052 g018
Figure 19. Comparison between calculated and numerical results.
Buildings 14 01052 g019
Table 1. Parameters of specimens.
SpecimenConcrete GradeBolt Diameter (mm)Inner Diameter of Reserved Holes (mm) F p (kN)Preload (kN)
D16C30C3016188014
D16C40C4016188014
D20C30C30202212525
D20C40C40202212525
F p   = Pretensioned force of a single bolt.
Table 2. Material mechanical properties.
MaterialsYield Strength (MPa)Ultimate or Compressive Strength (MPa) f y (MPa) f u   or   f c (MPa)Young’s Modulus (MPa)
No. 1No. 2No. 3No. 1No. 2No. 3
Girder242.66237.21239.08385.48392.59396.24239.65391.44204.2
Bolt637.19615.73620.94789.26773.25784.32624.62782.28204.8
Reinforcement419.63417.09424.97557.35555.47561.63420.56558.15205.0
C3032.933.533.833.4
C4041.743.143.642.8
f y   = average steel yield strength; f u   = average steel ultimate strength; f c   = average concrete compressive strength.
Table 3. Reverse push-out test results.
SpecimenP When Bolts Slide (kN)Py (kN)Δy (mm)Pu (kN)Δu (mm)Py/Pu
D16C3030.00845.2141.07561.6224.5290.734
D16C4036.37352.1701.21863.8412.7850.817
D20C3042.9620.18569.5044.6730.618
D20C4047.8760.17173.7872.8870.649
Py and Δy: strength and slip in the turning point before the specimens begin hardening, respectively; Δu: slip corresponding to Pu.
Table 4. Effects of the concrete strength and bolt diameter.
Concrete GradeBolts Diameter (mm)Increase Rate of PyIncrease Rate of ΔyIncrease Rate of PuIncrease Rate of Δu
C30 C401615.4%13.3%3.6%−38.5%
2011.4%−7.6%6.2%−38.2%
C3016 20−5.0%12.8%
C40−8.2%15.6%
Table 5. Single-bolt load capacity and aberrations.
No.Shear Capacity Pu in Experiment (kN)Shear Capacity Pu-FE in Finite Element Simulations (kN)Aberration (|Pu-FEPu|/Pu)
D16C3061.62261.5190.17%
D16C4063.84164.8101.52%
D20C3069.50468.8830.89%
D20C4073.78775.6422.51%
Table 6. Parametric results.
No.Ps (kN) N v b (kN)Pu (kN)No.Pu (kN)No.Ps (kN) N v b (kN)Pu (kN)No.Pu (kN)
B88D16C30P0.7530.8729.3360.00B88D20C30P168.88B109D16C30P0.7536.2036.6760.77B109D20C30P170.67
B88D16C30P138.2239.1161.52B88D20C40P175.64B109D16C30P147.2848.8962.19B109D20C40P175.94
B88D16C30P1.2548.4148.8961.25B88D20C50P176.92B109D16C30P1.2561.1161.74B109D20C50P177.97
B88D16C40P0.7531.1529.3364.60B88D22C30P171.54B109D16C40P0.7536.2536.6766.92B109D22C30P172.61
B88D16C40P138.1739.1164.81B88D22C40P178.32B109D16C40P147.2848.8967.37B109D22C40P179.16
B88D16C40P1.2546.3348.8965.25B88D22C40P180.01B109D16C40P1.2561.1166.11B109D22C40P181.40
B88D16C50P0.7530.8929.3366.65 B109D16C50P0.7536.1736.6768.70
B88D16C50P138.1739.1166.53 B109D16C50P147.2648.8969.58
B88D16C50P1.2546.1848.8966.68 B109D16C50P1.2561.1167.89
Ps: Numerical results of sliding load; N v b : Calculated results according to Ref. [23]; Pu: Numerical results of single-bolt shear capacity; B88D16C30P0.75: bolt grade 8.8, diameter = 16 mm, concrete grade C30, and pretension multiplier = 0.75.
Disclaimer/Publisher’s Note: The statements, opinions and data contained in all publications are solely those of the individual author(s) and contributor(s) and not of MDPI and/or the editor(s). MDPI and/or the editor(s) disclaim responsibility for any injury to people or property resulting from any ideas, methods, instructions or products referred to in the content.

