


Evaluation of the New European Bauhaus in Urban Plans by Land Use Occurrence Indicators: A Case Study in Rijeka, Croatia


Abstract
1. Introduction
2. Materials and Methods
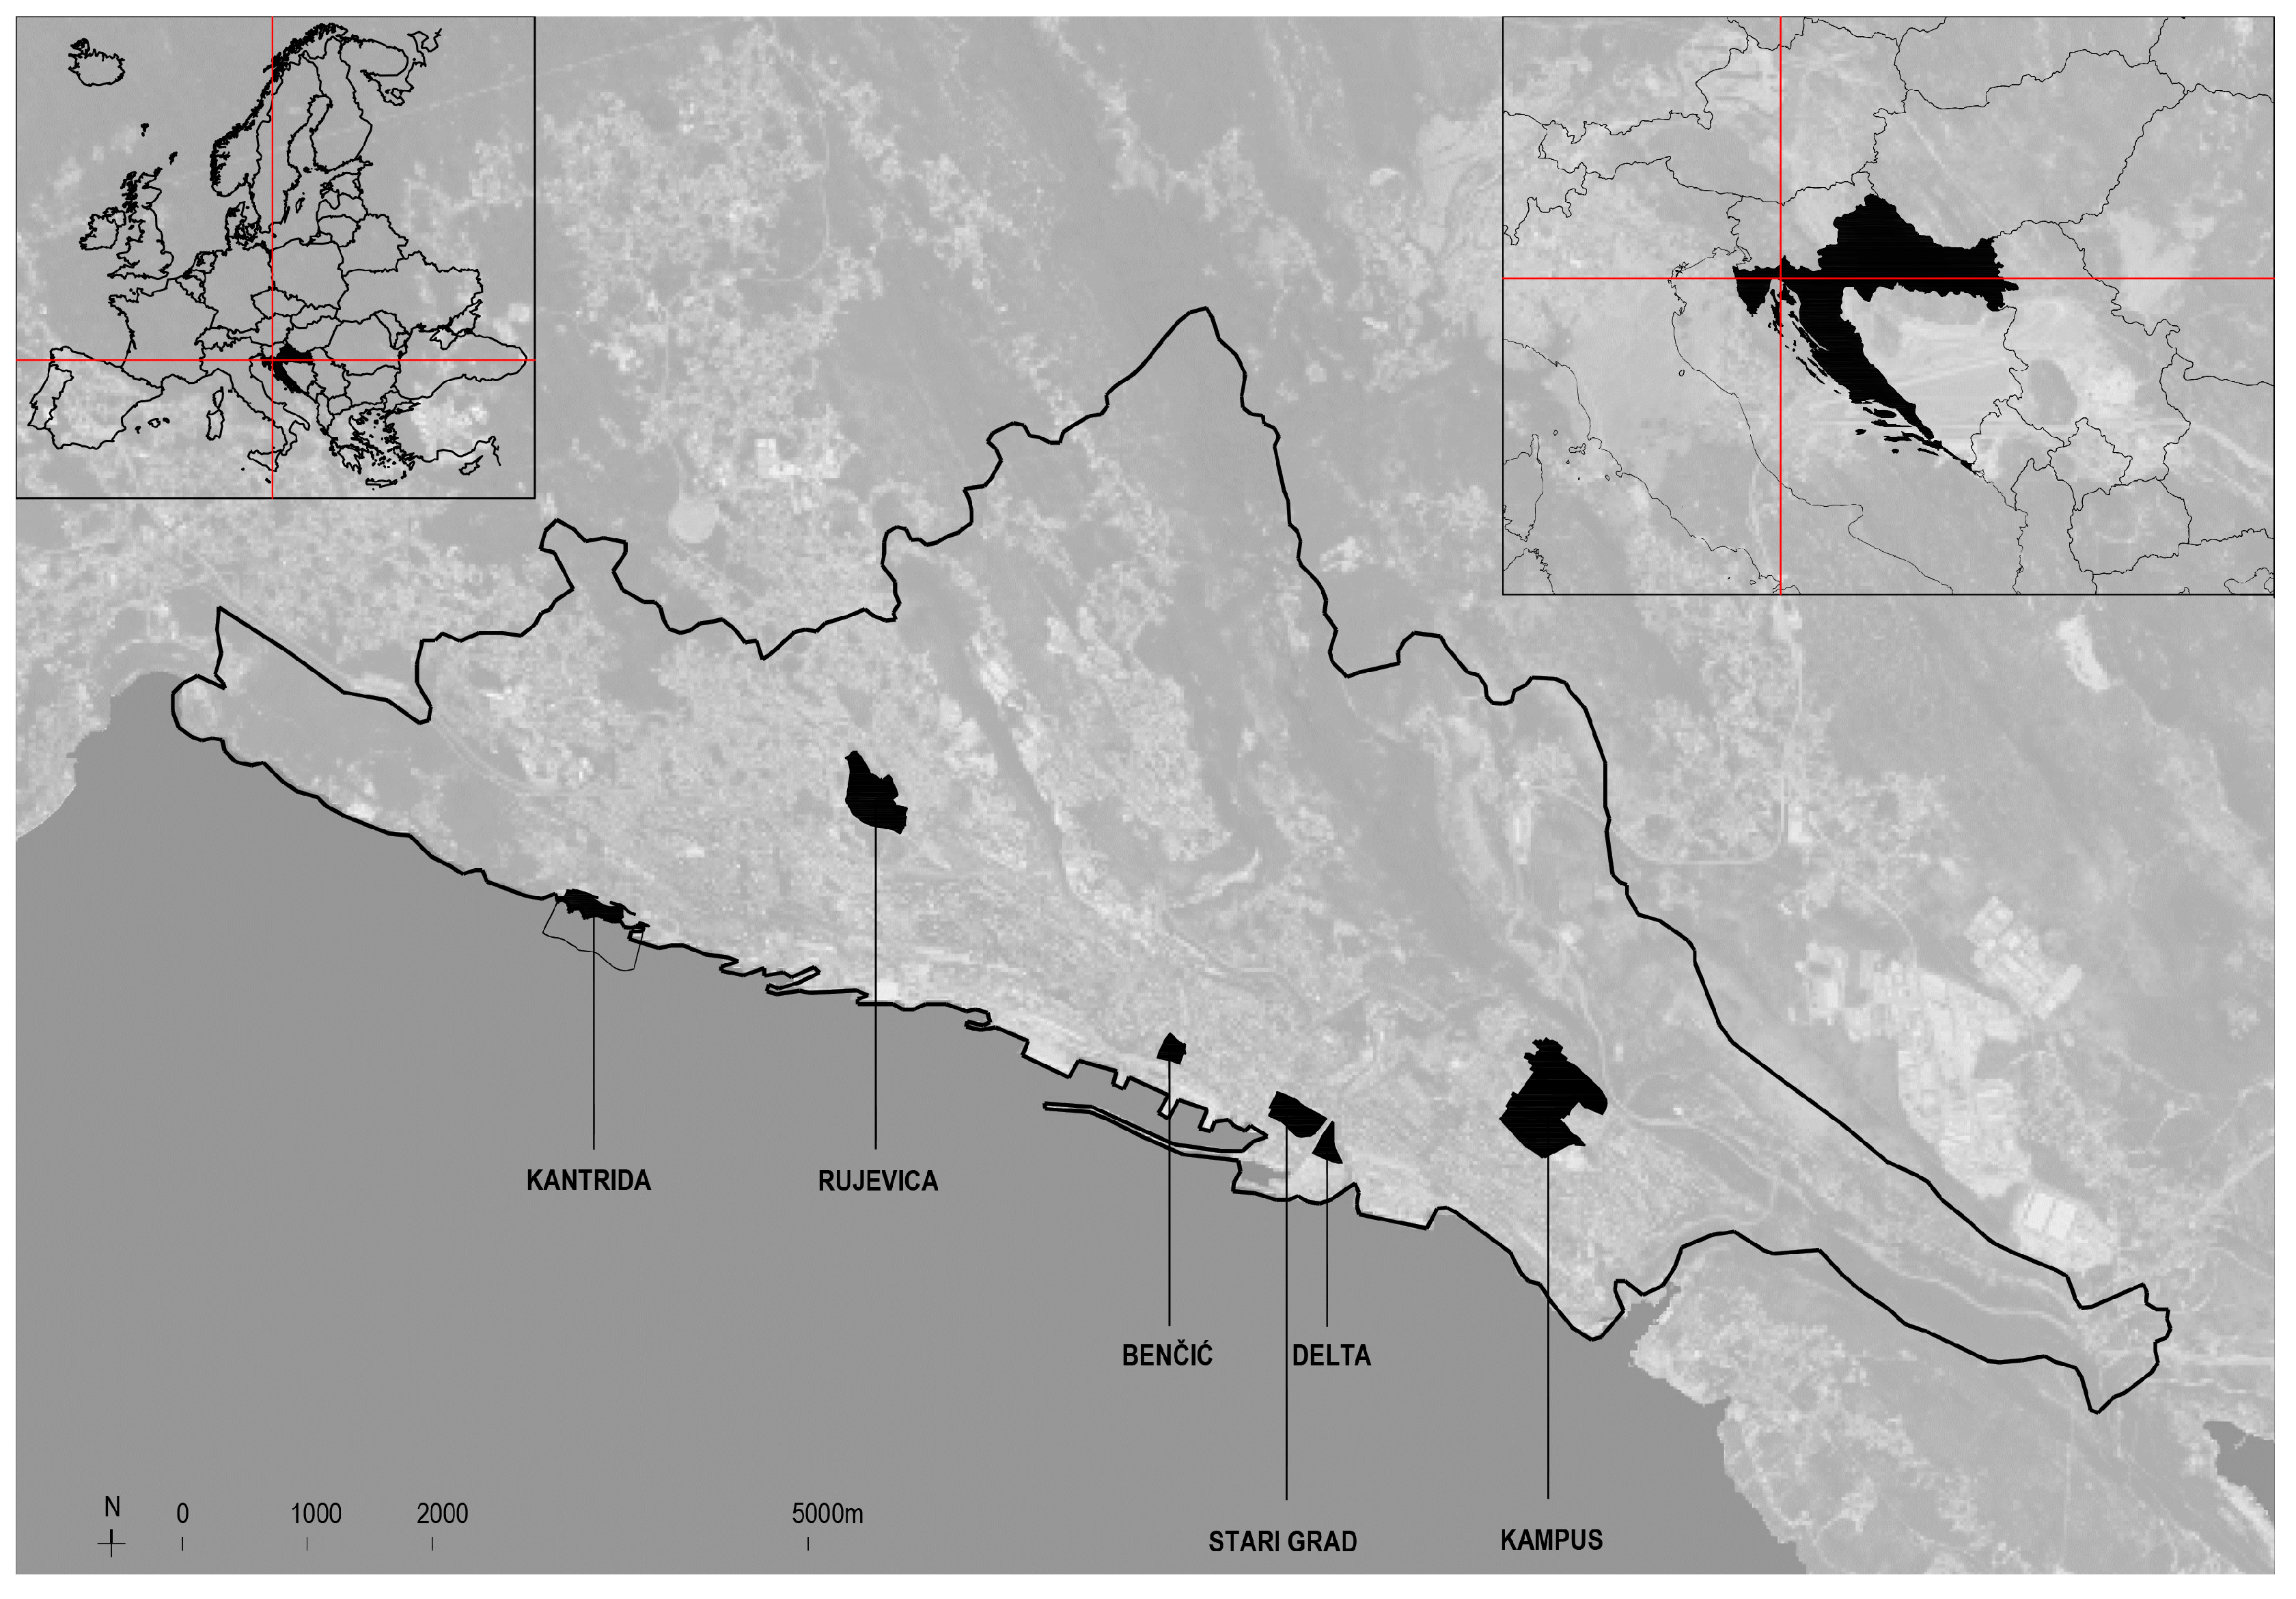
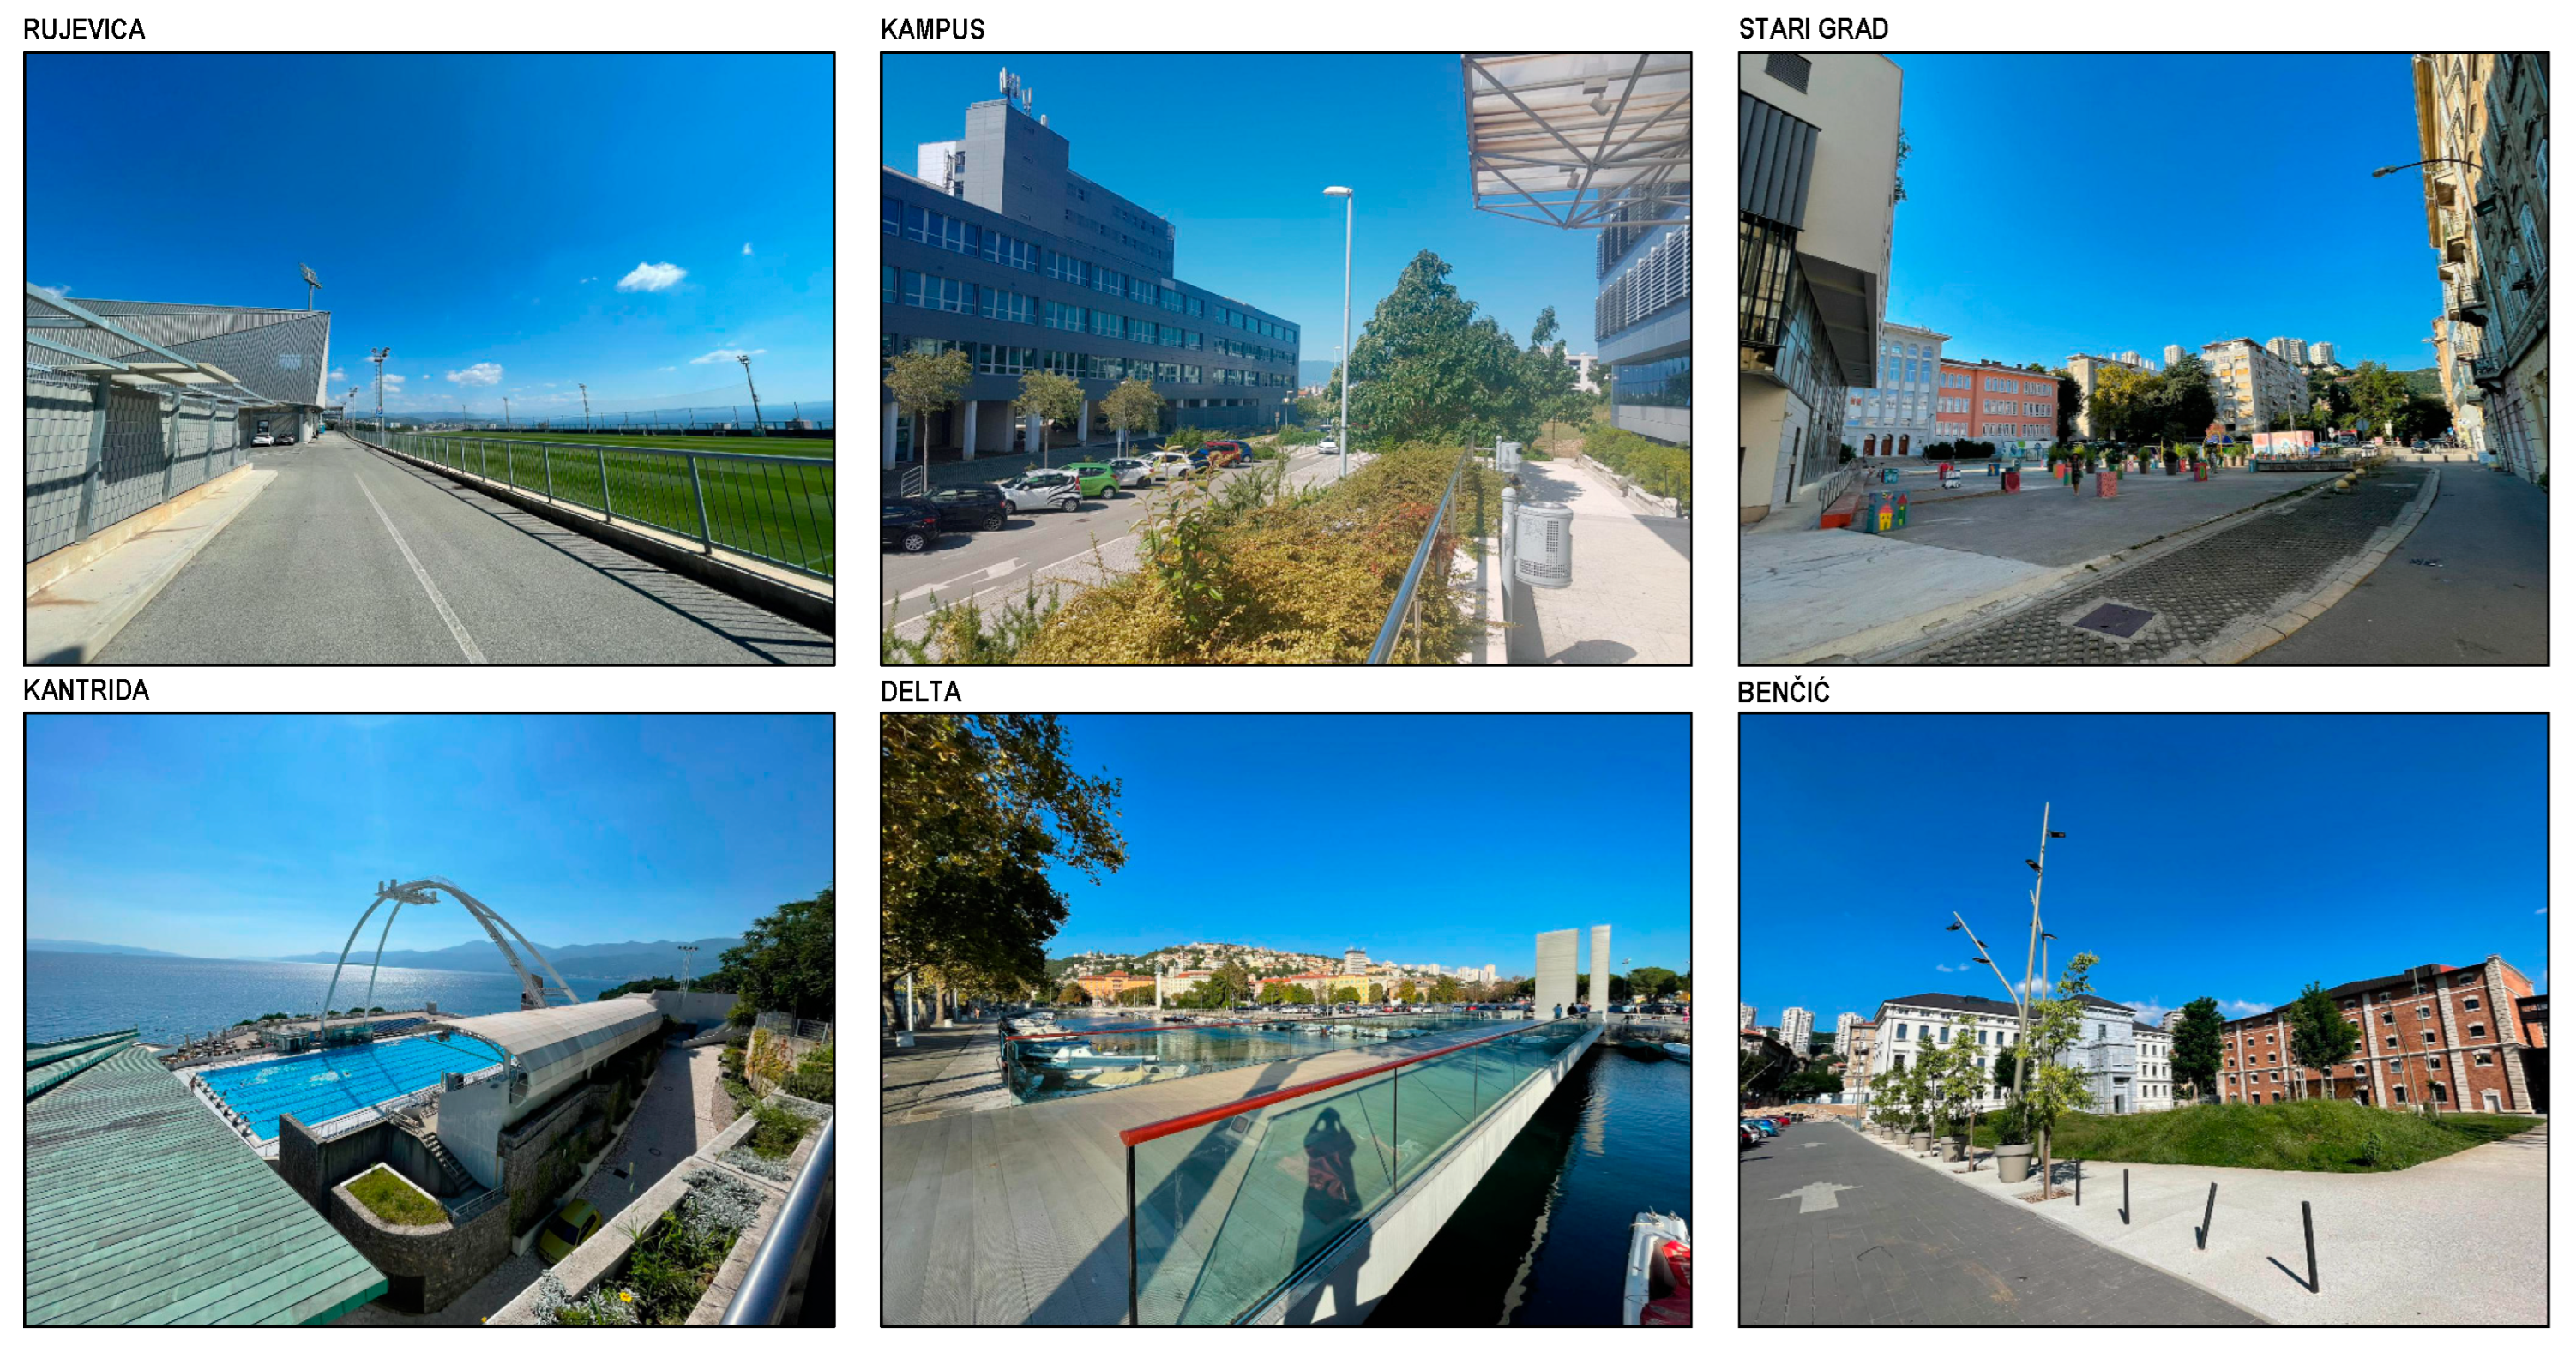
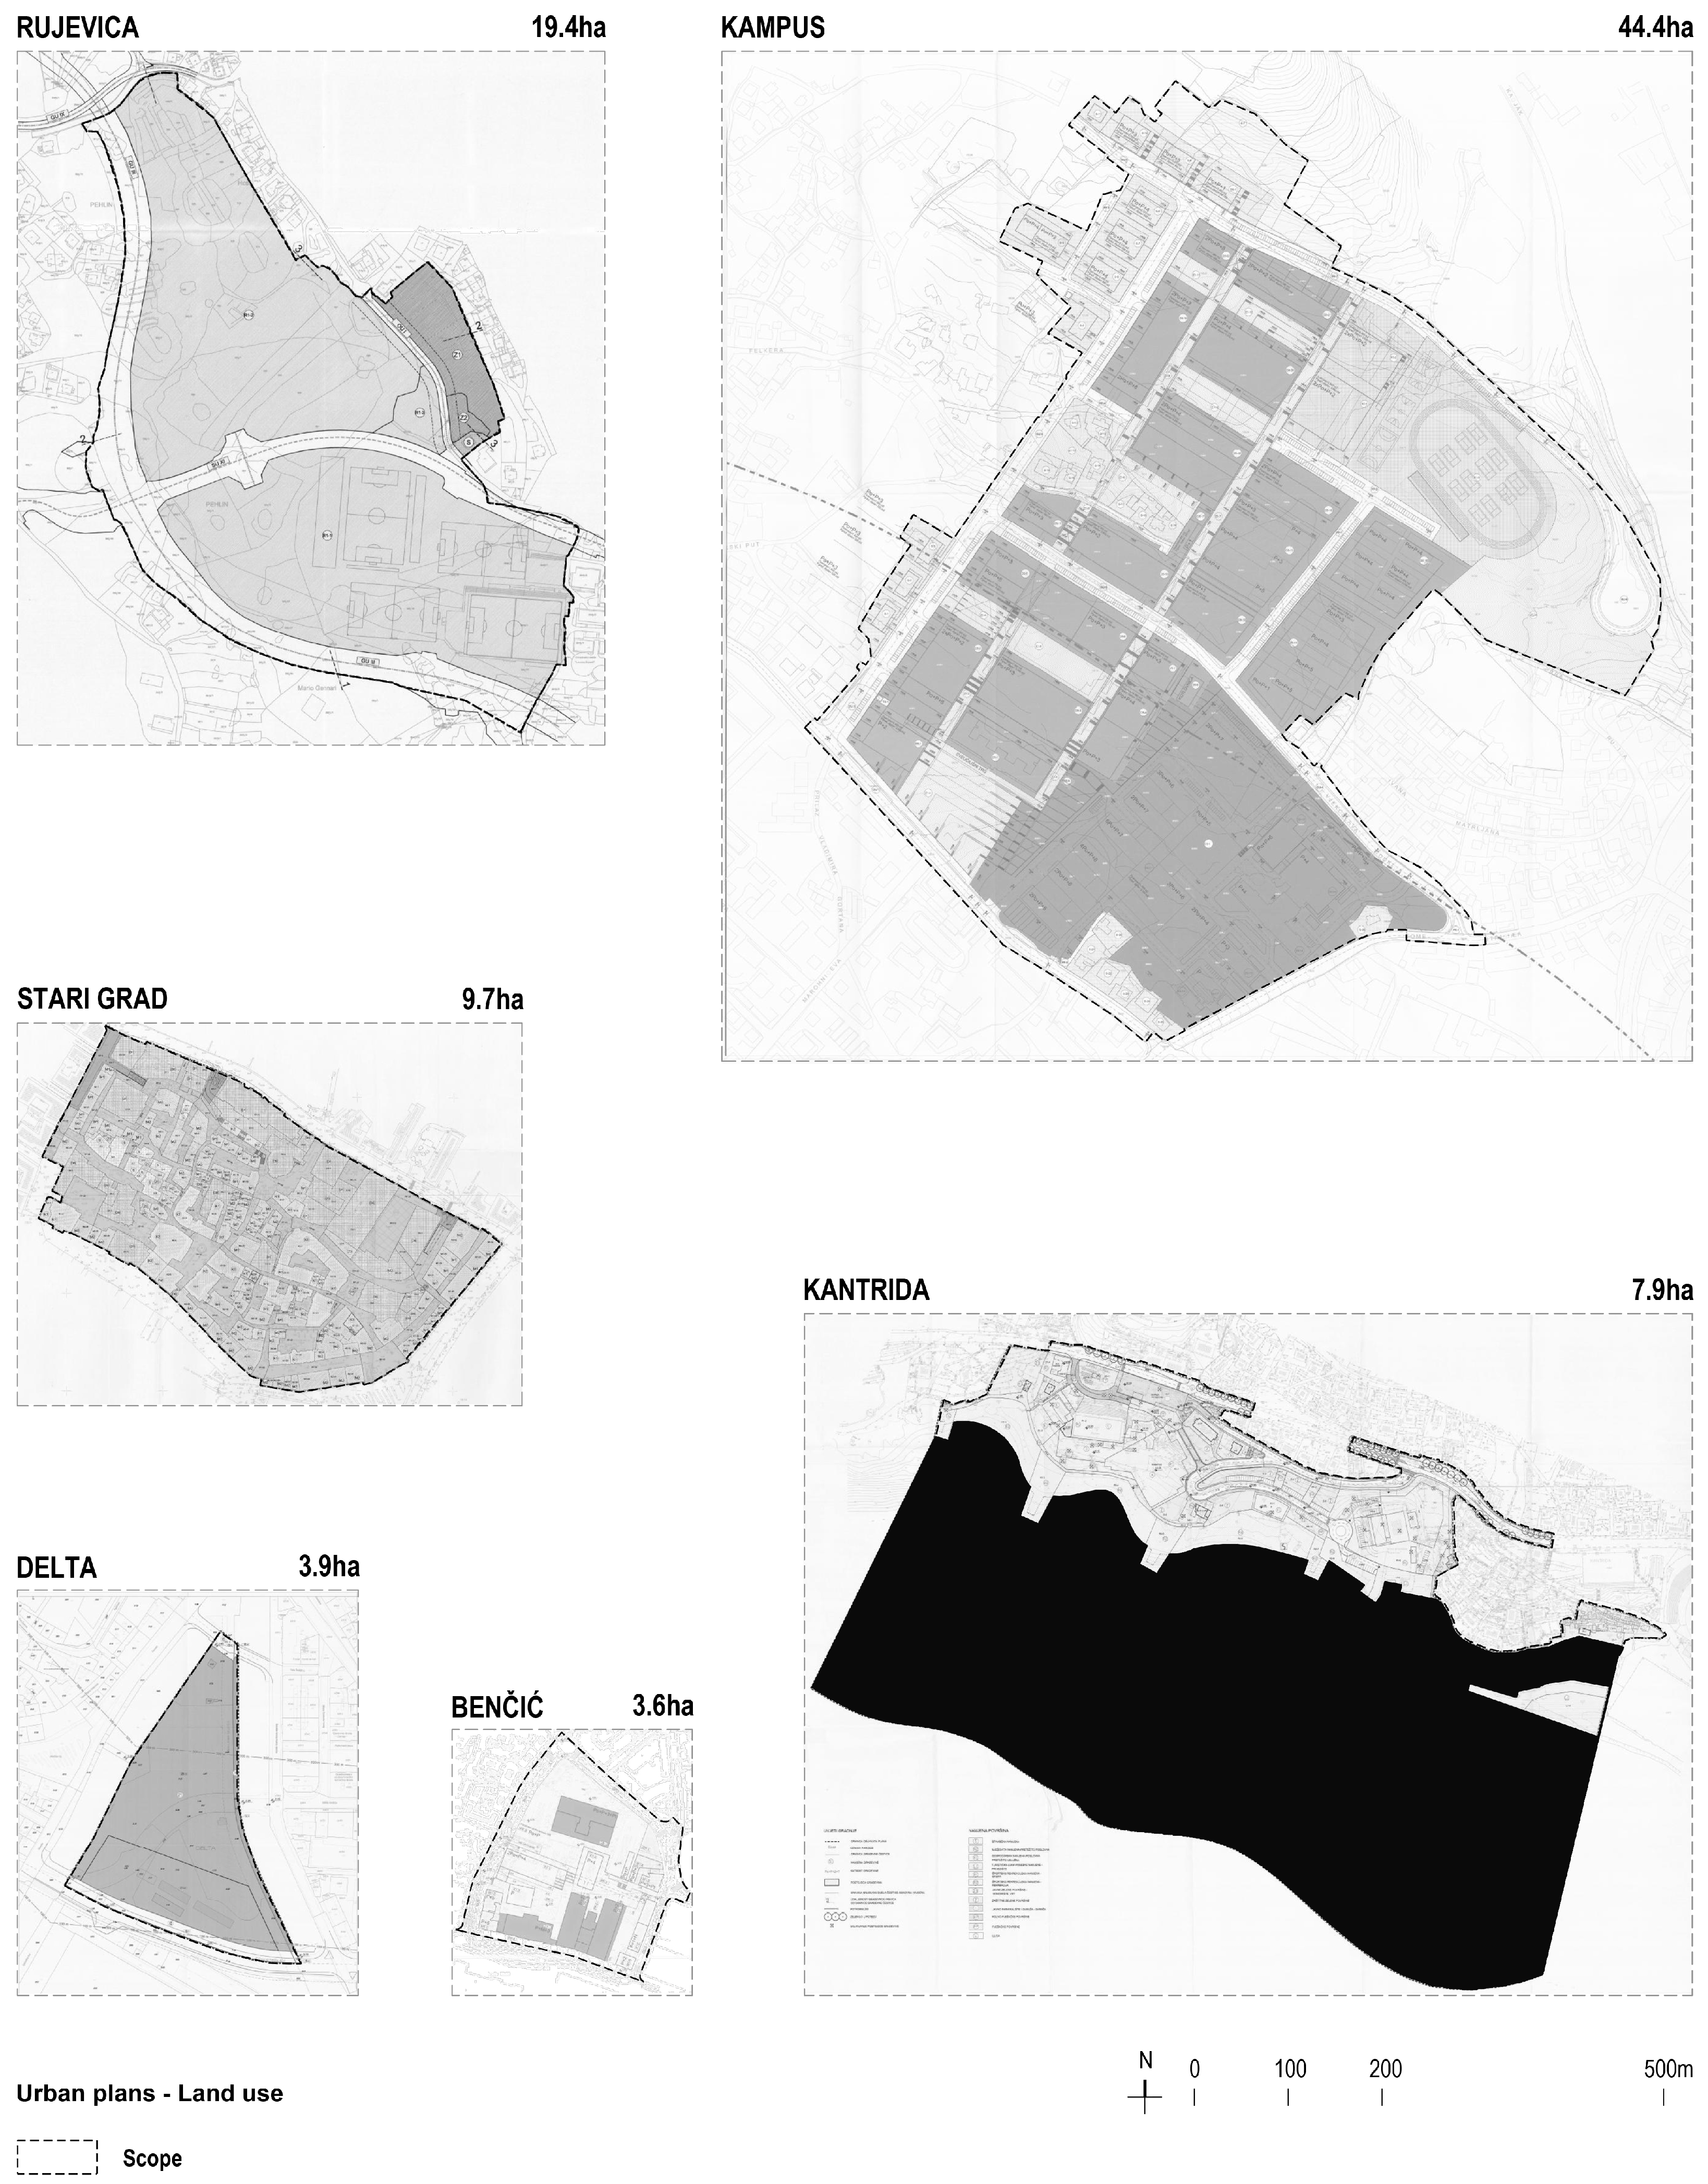
2.1. Studied Area
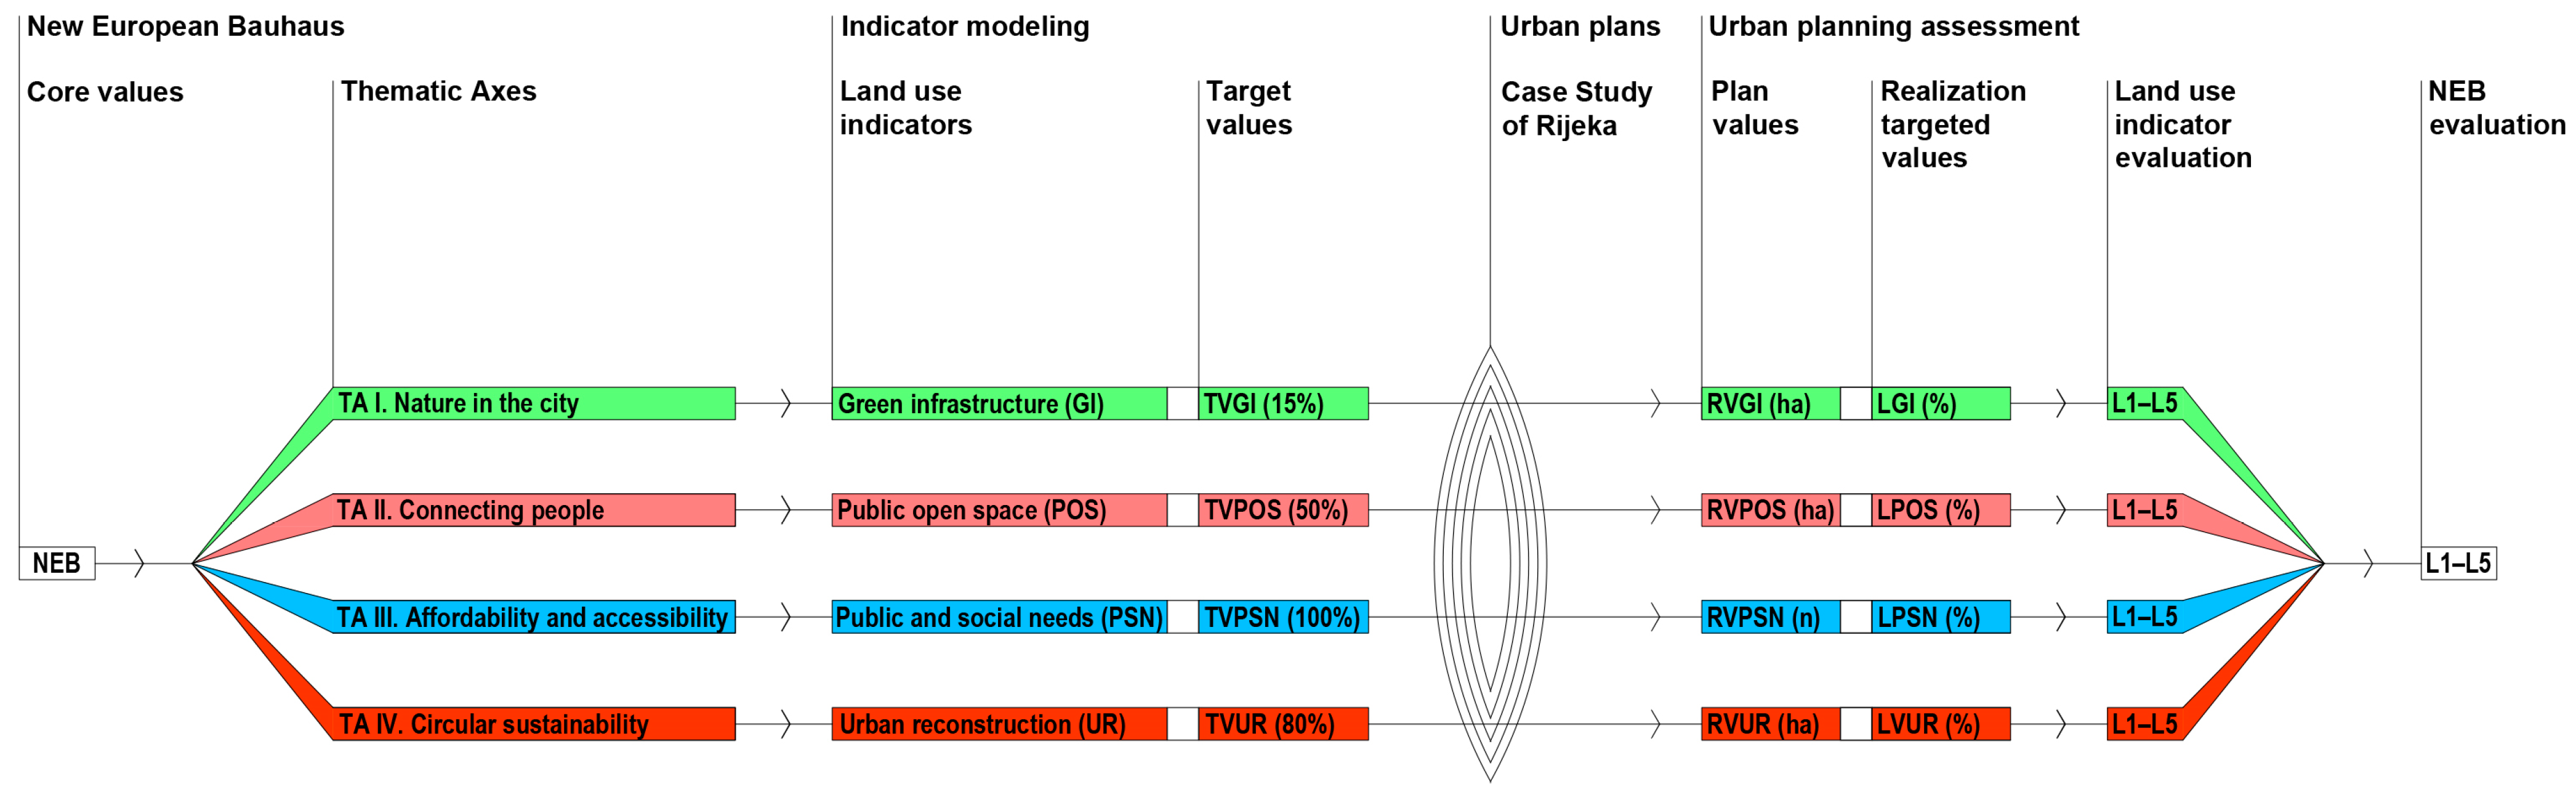
2.2. Determining Numerical Reference Values and Modeling Indicators
2.3. Assessment and Evaluation of NEB Occurrence through Land Use Indicators
3. Results and Discussion
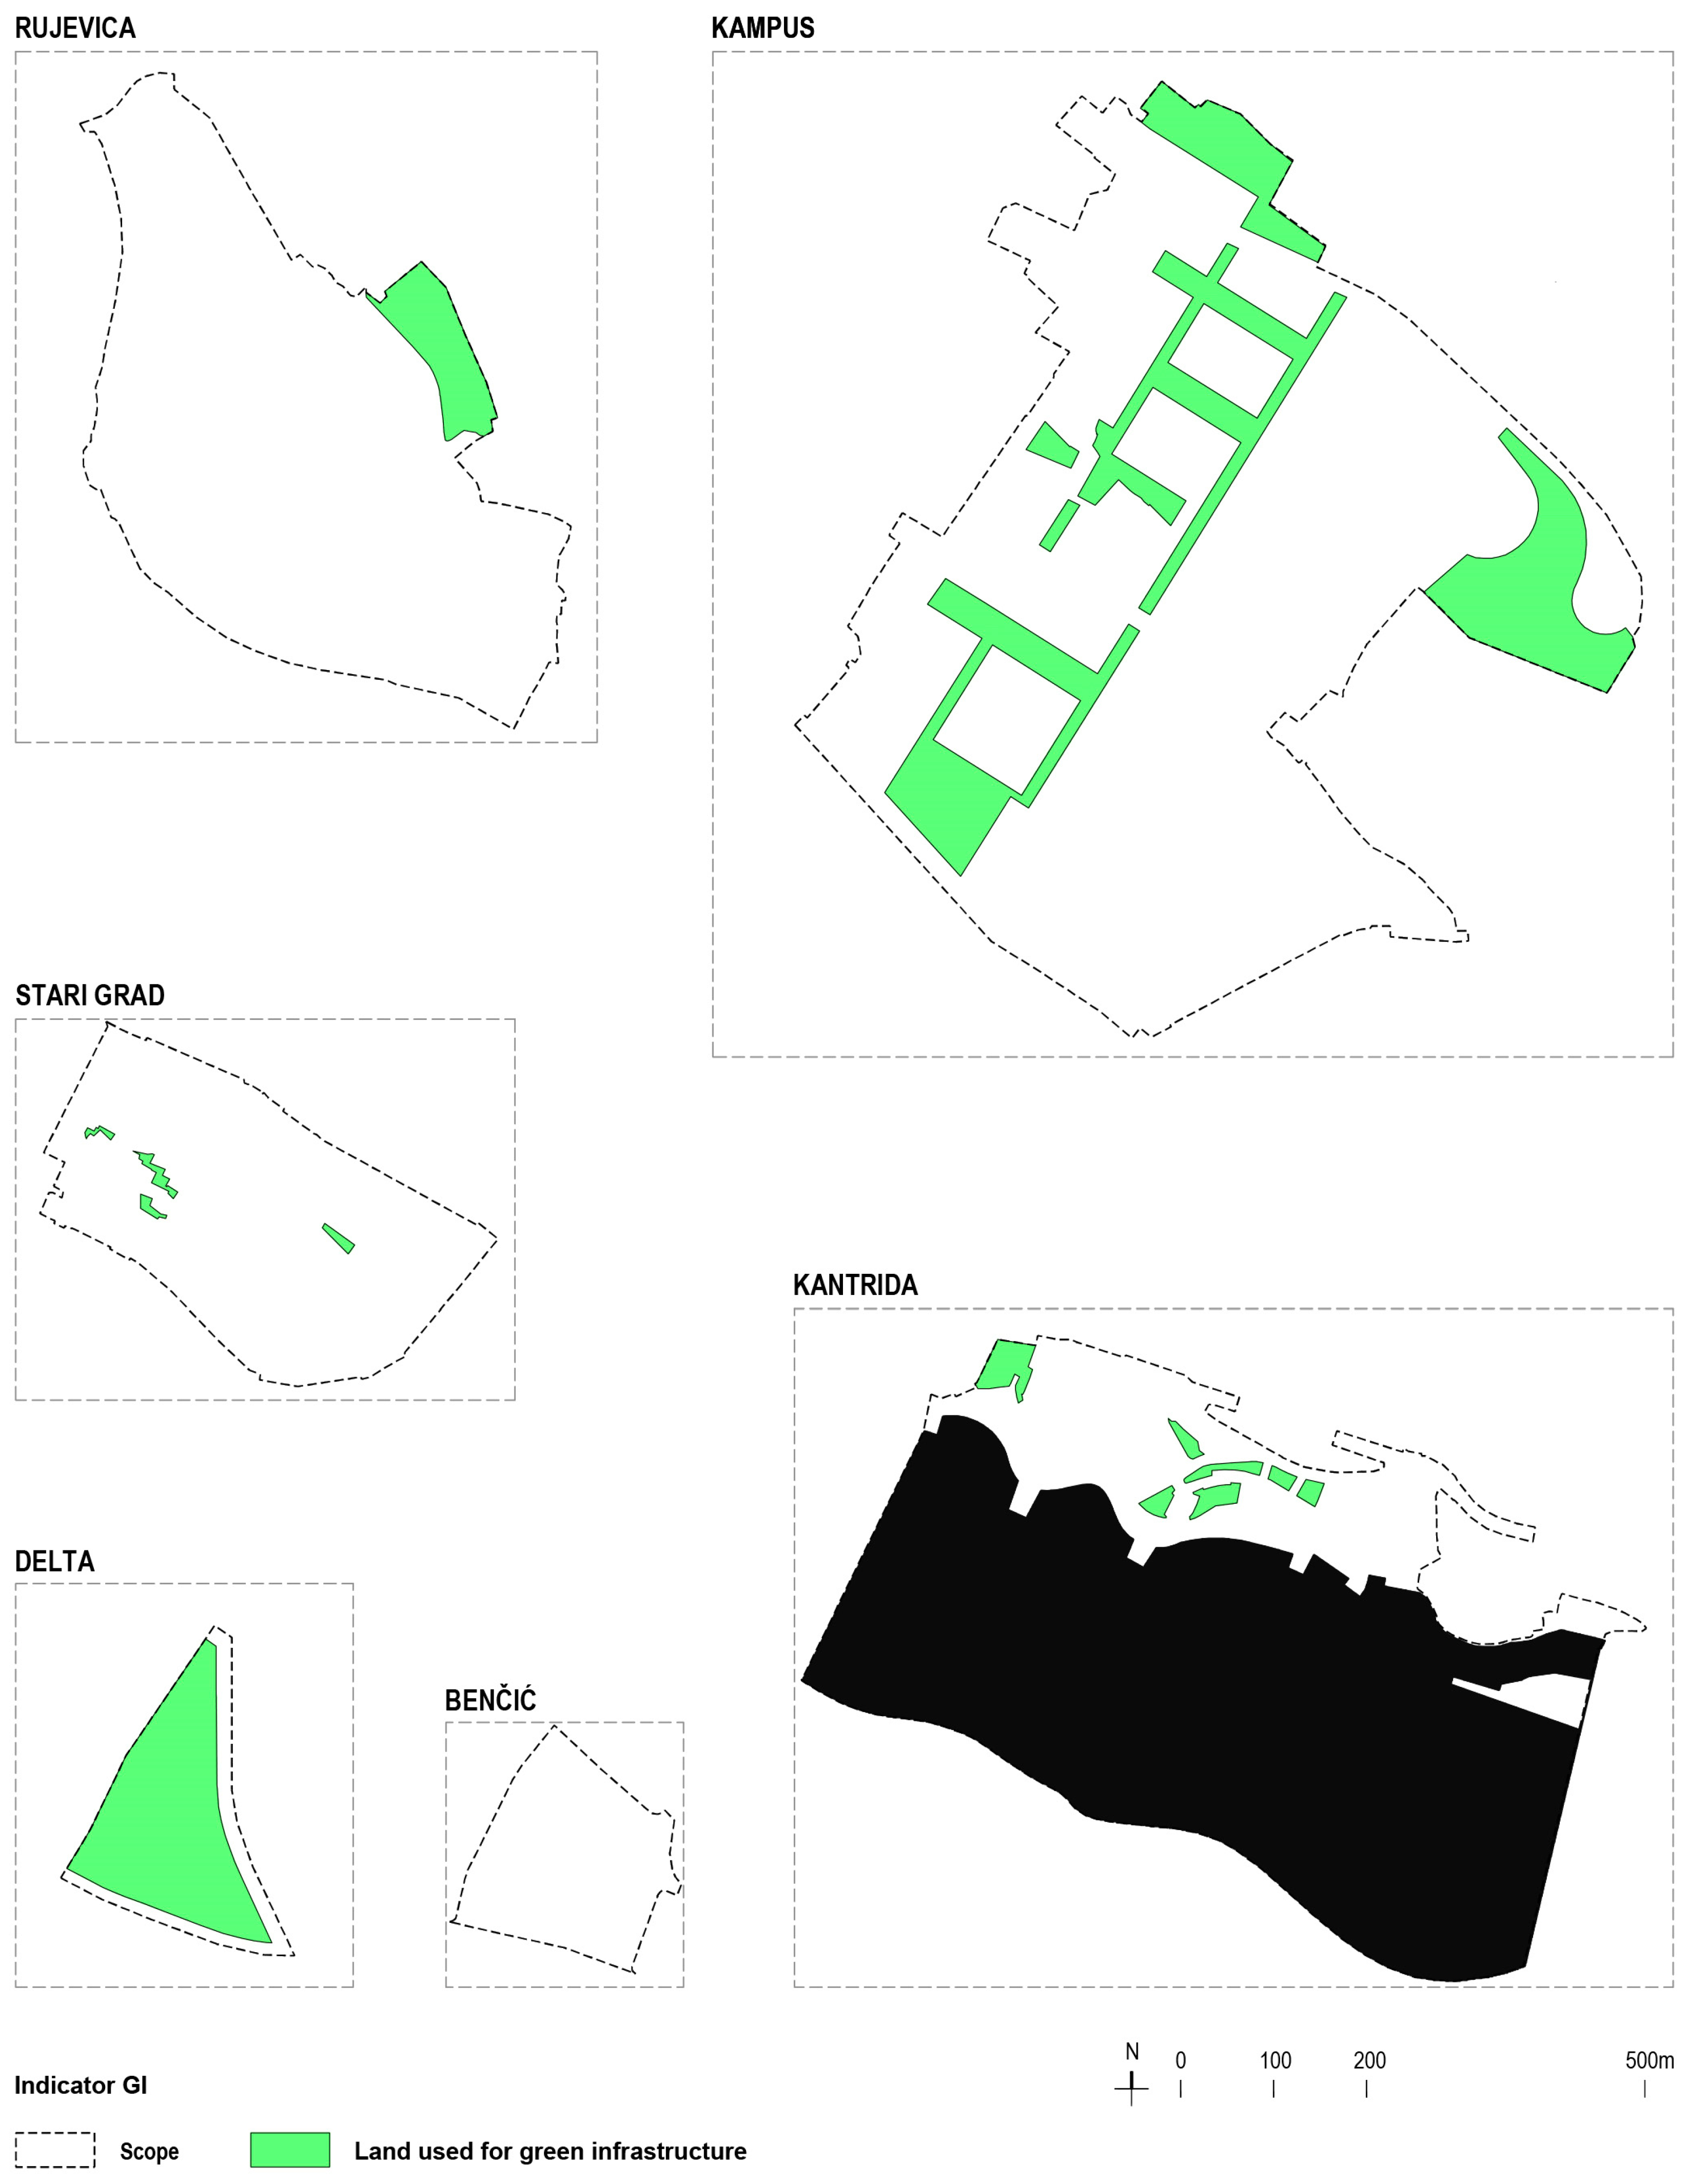
3.1. Planning New Natural Green Areas
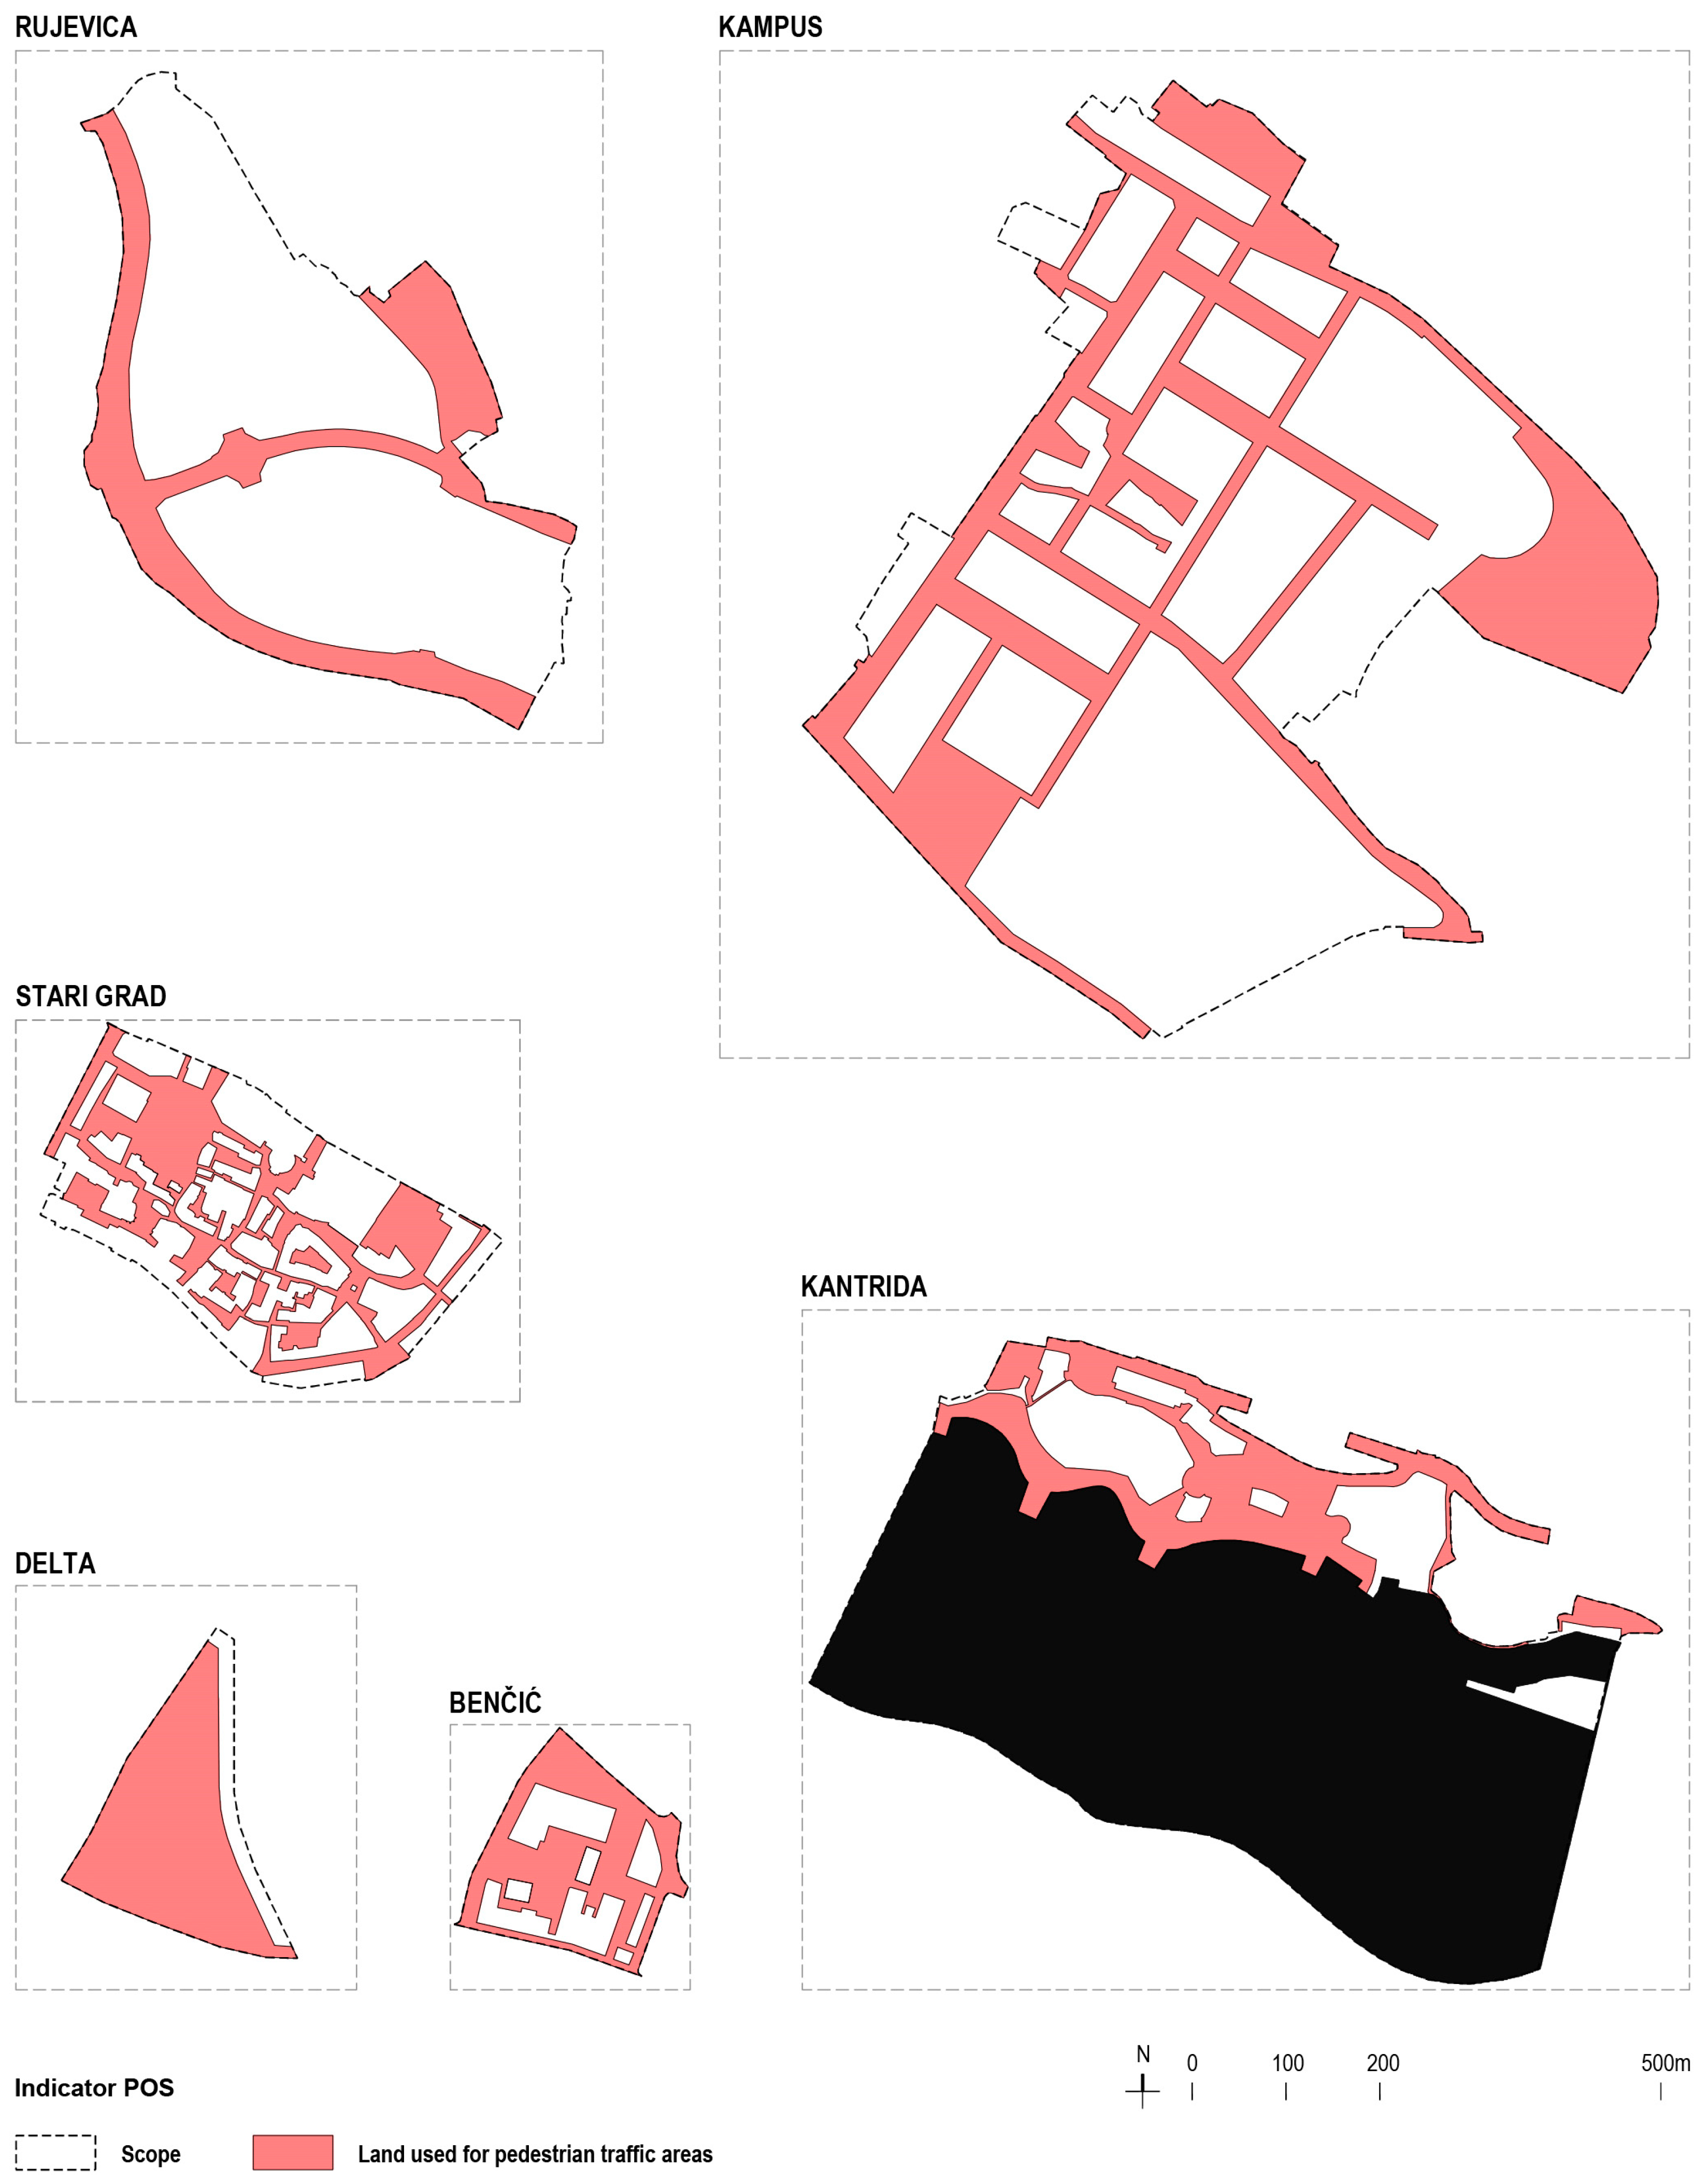
3.2. Maintenance and Development of Street Networks with an Increase in Pedestrian and Park Areas
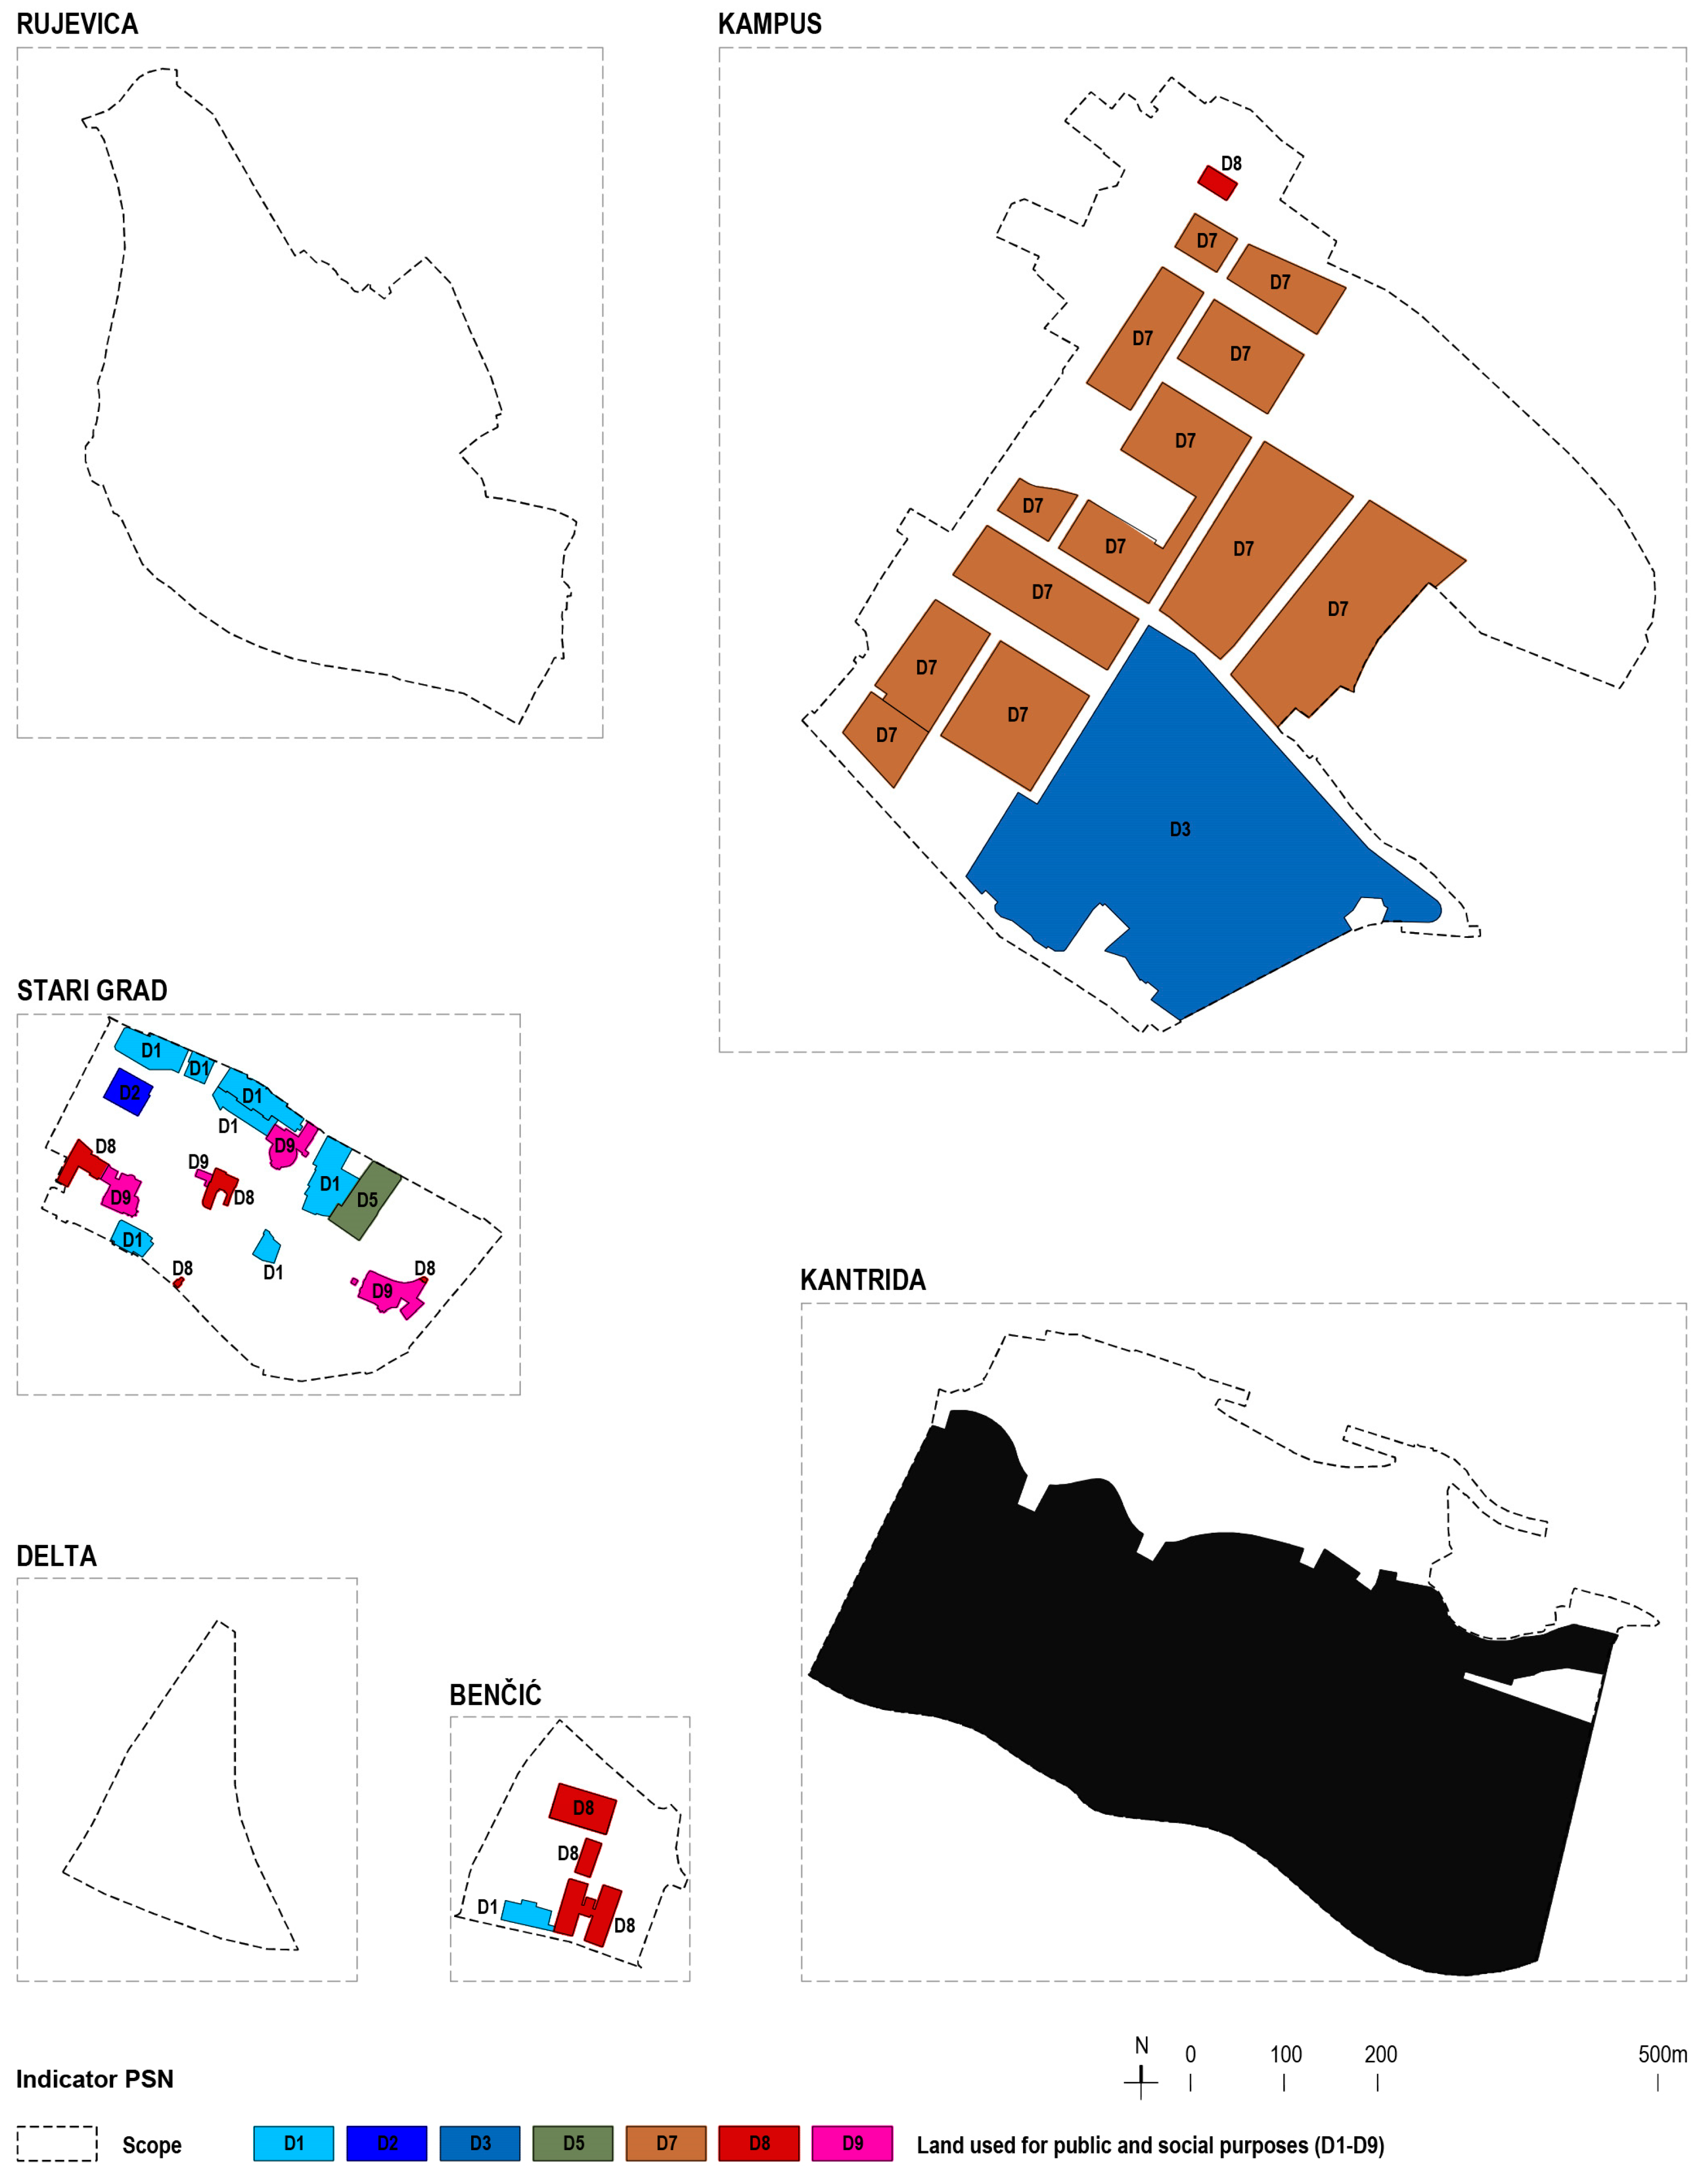
3.3. Achieving a More Even Distribution of Areas for All Types of Public and Social Needs
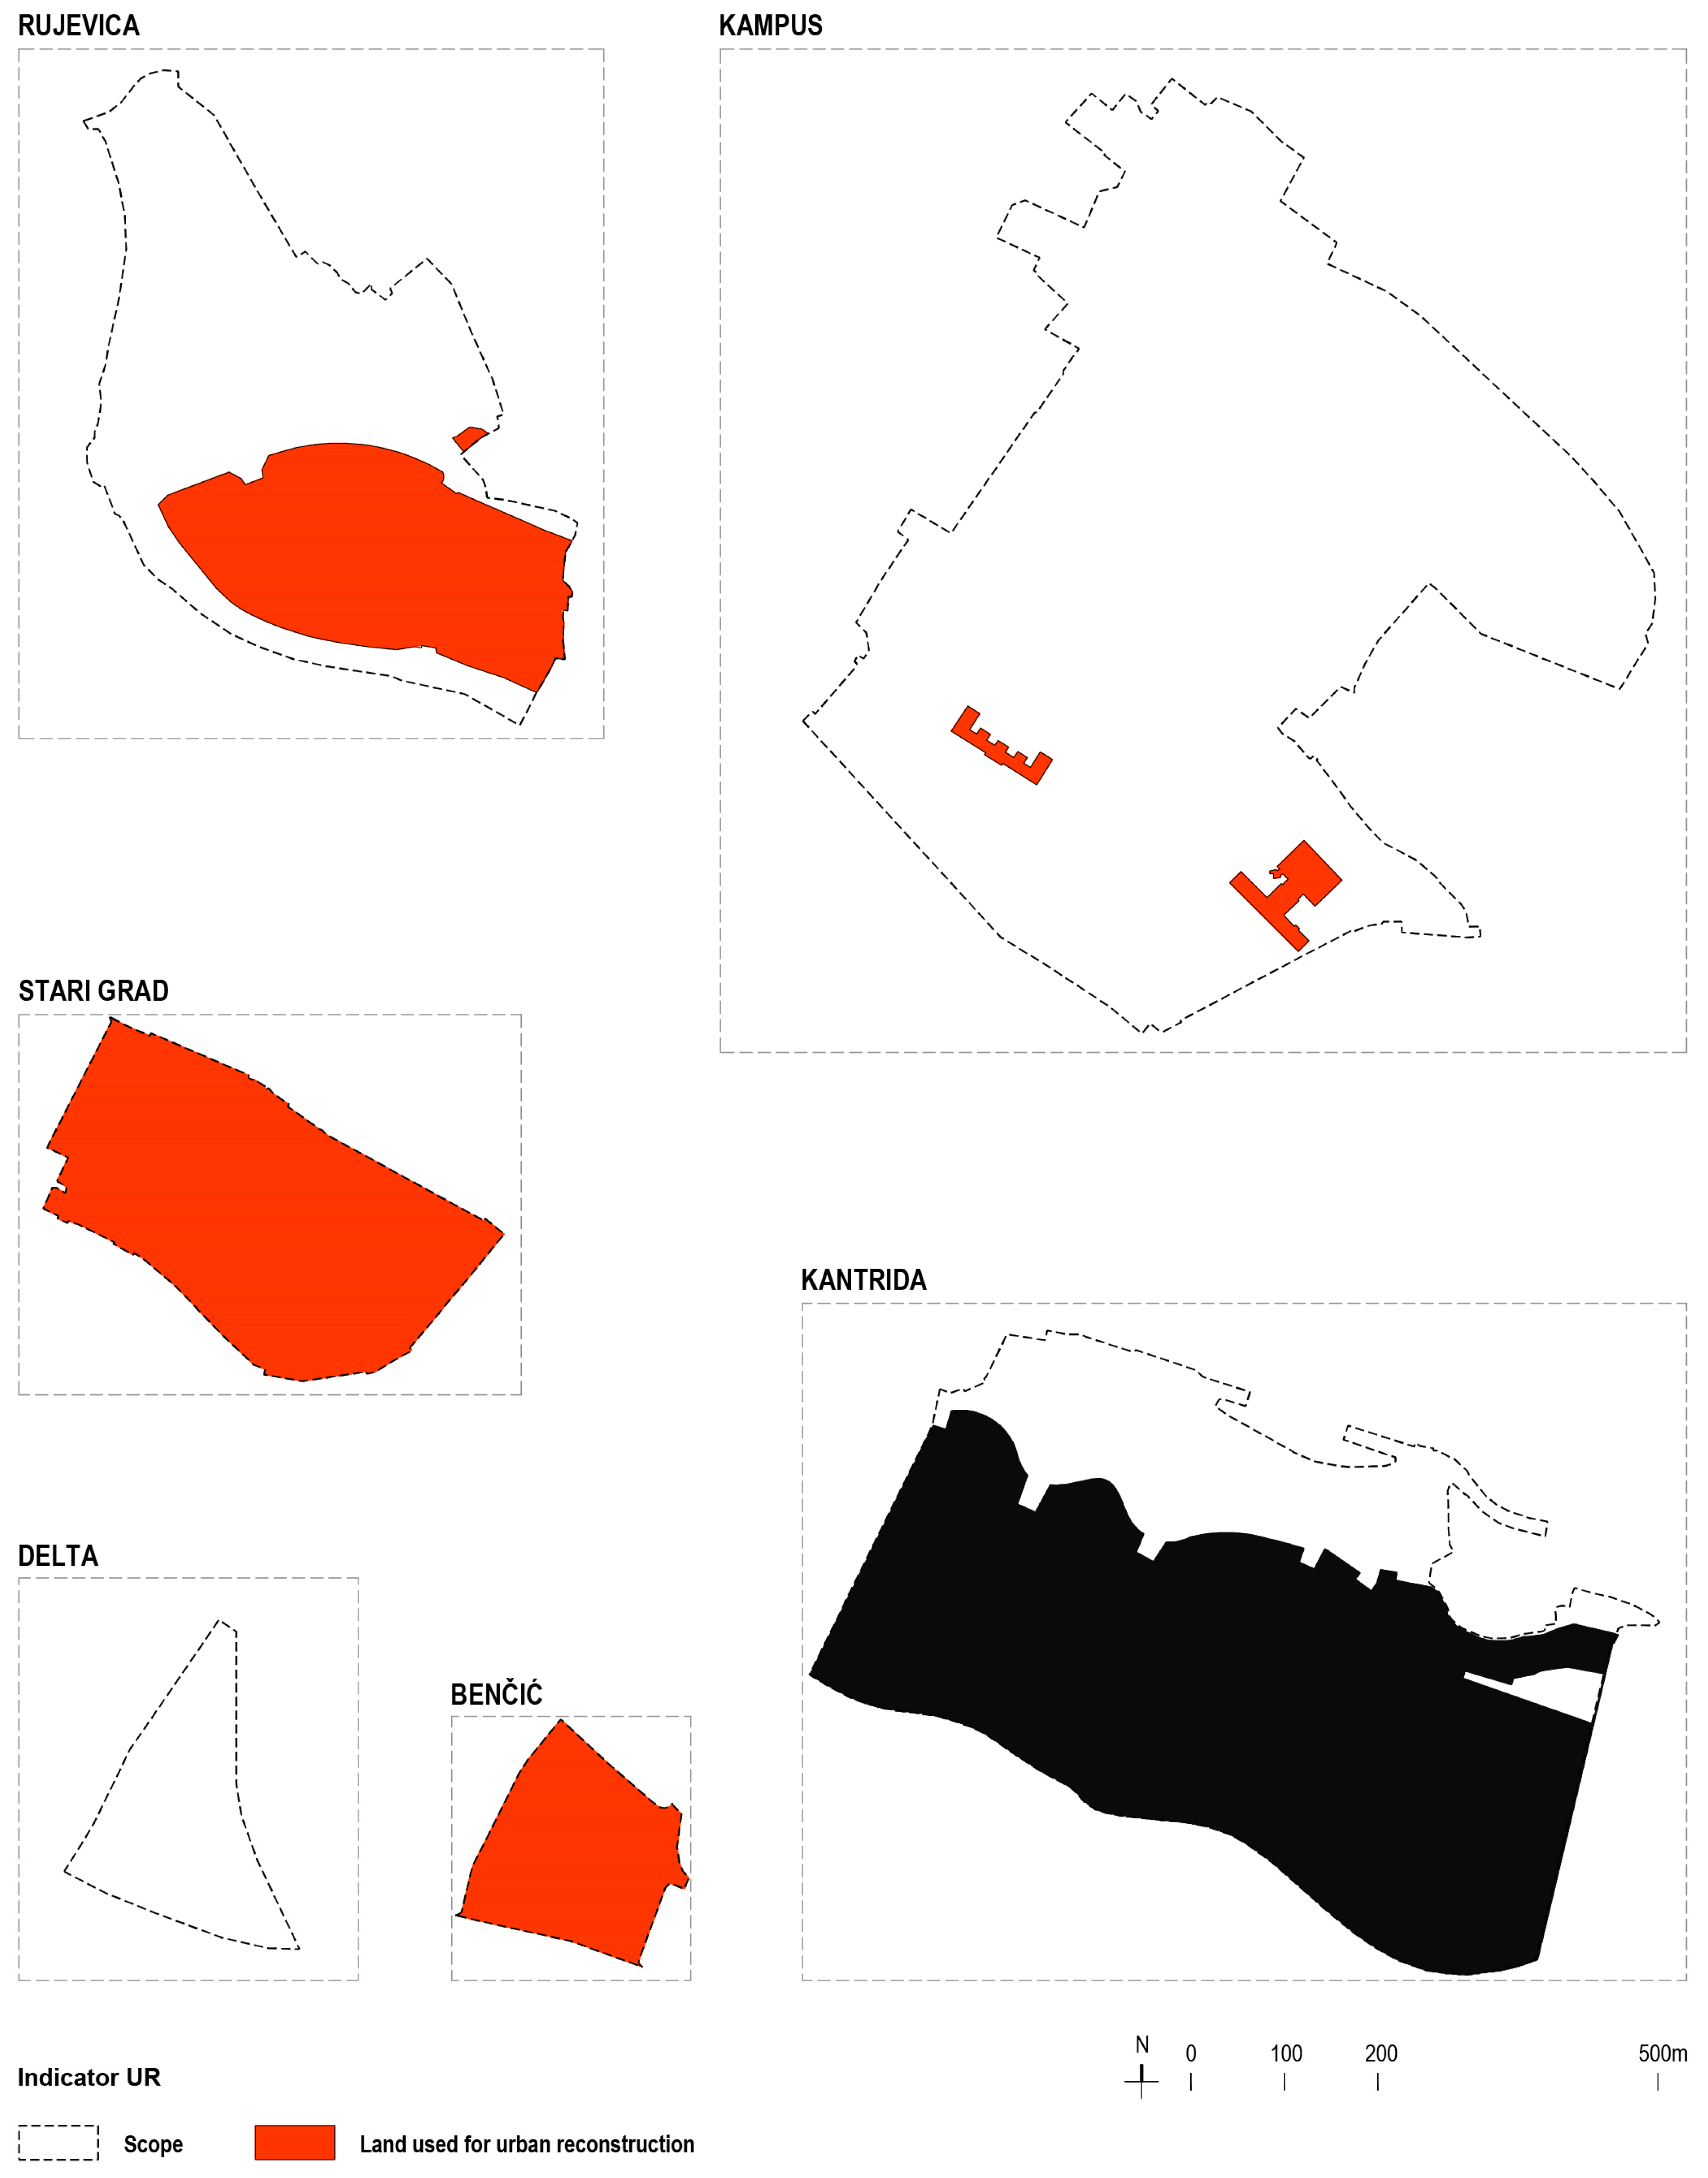
3.4. Increase in Areas for Urban Reconstruction of the City
3.5. Urban Plans with Programs for Public and Social Functions in Rijeka (Table 7 and Table 8, Figure 10, Figure 11, Figure 12 and Figure 13)


3.6. Implications of Research Results
3.7. Limitations and Future Works
4. Conclusions
Author Contributions
Funding
Data Availability Statement
Conflicts of Interest
Appendix A. Urban Plans with Public and Social Programs in Rijeka (2000–2023)


References
- European Commission. New European Bauhaus Beautiful, Sustainable, Together. Available online: https://new-european-bauhaus.europa.eu/system/files/2021-09/COM(2021)_573_EN_ACT.pdf (accessed on 3 March 2024).
- European Commission. The European Green Deal. 2019. Available online: https://commission.europa.eu/strategy-and-policy/priorities-2019-2024/european-green-deal_en (accessed on 3 March 2024).
- Sadowski, K. Implementation of the New European Bauhaus Principles as a Context for Teaching Sustainable Architecture. Sustainability 2021, 13, 10715. [Google Scholar] [CrossRef]
- Hu, M.; Świerzawski, J.; Kleszcz, J.; Kmiecik, P. What Are the Concerns with New European Bauhaus Initiative? Vernacular Knowledge as the Primary Driver toward a Sustainable Future. Next Sustain. 2023, 1, 100004. [Google Scholar] [CrossRef]
- Escobedo, F.J.; Giannico, V.; Jim, C.Y.; Sanesi, G.; Lafortezza, R. Urban Forests, Ecosystem Services, Green Infrastructure and Nature-Based Solutions: Nexus or Evolving Metaphors? Urban For. Urban Green. 2019, 37, 3–12. [Google Scholar] [CrossRef]
- Kabisch, N.; Korn, H.; Stadler, J.; Bonn, A. Nature-Based Solutions to Climate Change Adaptation in Urban Areas; Springer: Berlin/Heidelberg, Germany, 2017. [Google Scholar]
- Ahern, J. Infrastructure for Cities. The Spatial Dimension. In Cities of the Future. Towards Integrated Sustainable Water and Landscape Management; IWA Publications: London, UK, 2007; pp. 267–283. [Google Scholar]
- Nastran, M.; Kobal, M.; Eler, K. Urban Heat Islands in Relation to Green Land Use in European Cities. Urban For. Urban Green. 2019, 37, 33–41. [Google Scholar] [CrossRef]
- Alizadeh, B.; Hitchmough, J. A Review of Urban Landscape Adaptation to the Challenge of Climate Change. Int. J. Clim. Chang. Strat. Manag. 2019, 11, 178–194. [Google Scholar] [CrossRef]
- Lalović, K.; Sentić, I.; Živojinović, I. Urban and Regional Planning for Sustainability. In Climate Action. Encyclopedia of the UN Sustainable Development Goals; Springer: Cham, Switzerland, 2020; pp. 851–862. [Google Scholar] [CrossRef]
- Pozoukidou, G.; Chatziyiannaki, Z. 15-Minute City: Decomposing the New Urban Planning Eutopia. Sustainability 2021, 13, 928. [Google Scholar] [CrossRef]
- Barbieri, L.; D’Autilia, R.; Marrone, P.; Montella, I. Graph Representation of the 15-Minute City: A Comparison between Rome, London, and Paris. Sustainability 2023, 15, 3772. [Google Scholar] [CrossRef]
- Droste, C.; Lelevrier, C.; Wassenberg, F. Urban Regeneration in European Social Housing Areas. In Social Housing in Europe II; LSE London: London, UK, 2008; pp. 163–196. [Google Scholar]
- Fainstein, S.S. The Just City; Cornell University Press: Ithaca, NY, USA, 2011. [Google Scholar]
- Matković, I.; Jakovčić, M. Brownfield Spaces and Their Regeneration. Prostor 2019, 27, 348–359. [Google Scholar] [CrossRef]
- Joint Research Centre European Union. Available online: https://commission.europa.eu/about-european-commission/departments-and-executive-agencies/joint-research-centre_en (accessed on 3 March 2024).
- Publications Office of the European Union. Available online: https://op.europa.eu/en/home (accessed on 3 March 2024).
- European Committee of the Regions; Errico, B.; Bisogni, F.; Levi, T. The New European Bauhaus at the Local and Regional Level; European Committee of the Regions: Bruxelles, Belgium, 2023; Available online: https://data.europa.eu/doi/10.2863/327283 (accessed on 3 March 2024).
- Torchia, D.; Fresta, J.; Corazza, L.; Certomà, C. New European Bauhaus for a Circular Economy and Waste Management: The Lived Experience of a Community Container Garden at the University of Turin. Sustainability 2023, 15, 914. [Google Scholar] [CrossRef]
- Andrzejewska, A.K. Determining Urban Indicators in Local Plans—As One of the Sustainable Assumptions of the New European Bauhaus? Buildings 2024, 14, 100. [Google Scholar] [CrossRef]
- Cadastral Records and Land Registers. Available online: https://oss.uredjenazemlja.hr/map (accessed on 3 March 2024).
- Geoportal of Cultural Property of the Republic of Croatia. Available online: https://geoportal.kulturnadobra.hr/geoportal.html#/ (accessed on 3 March 2024).
- Spatial Planning Information System. Available online: https://ispu.mgipu.hr (accessed on 3 March 2024).
- Geoportal of the City of Rijeka. Available online: http://gis.rijeka.hr/gis/ (accessed on 3 March 2024).
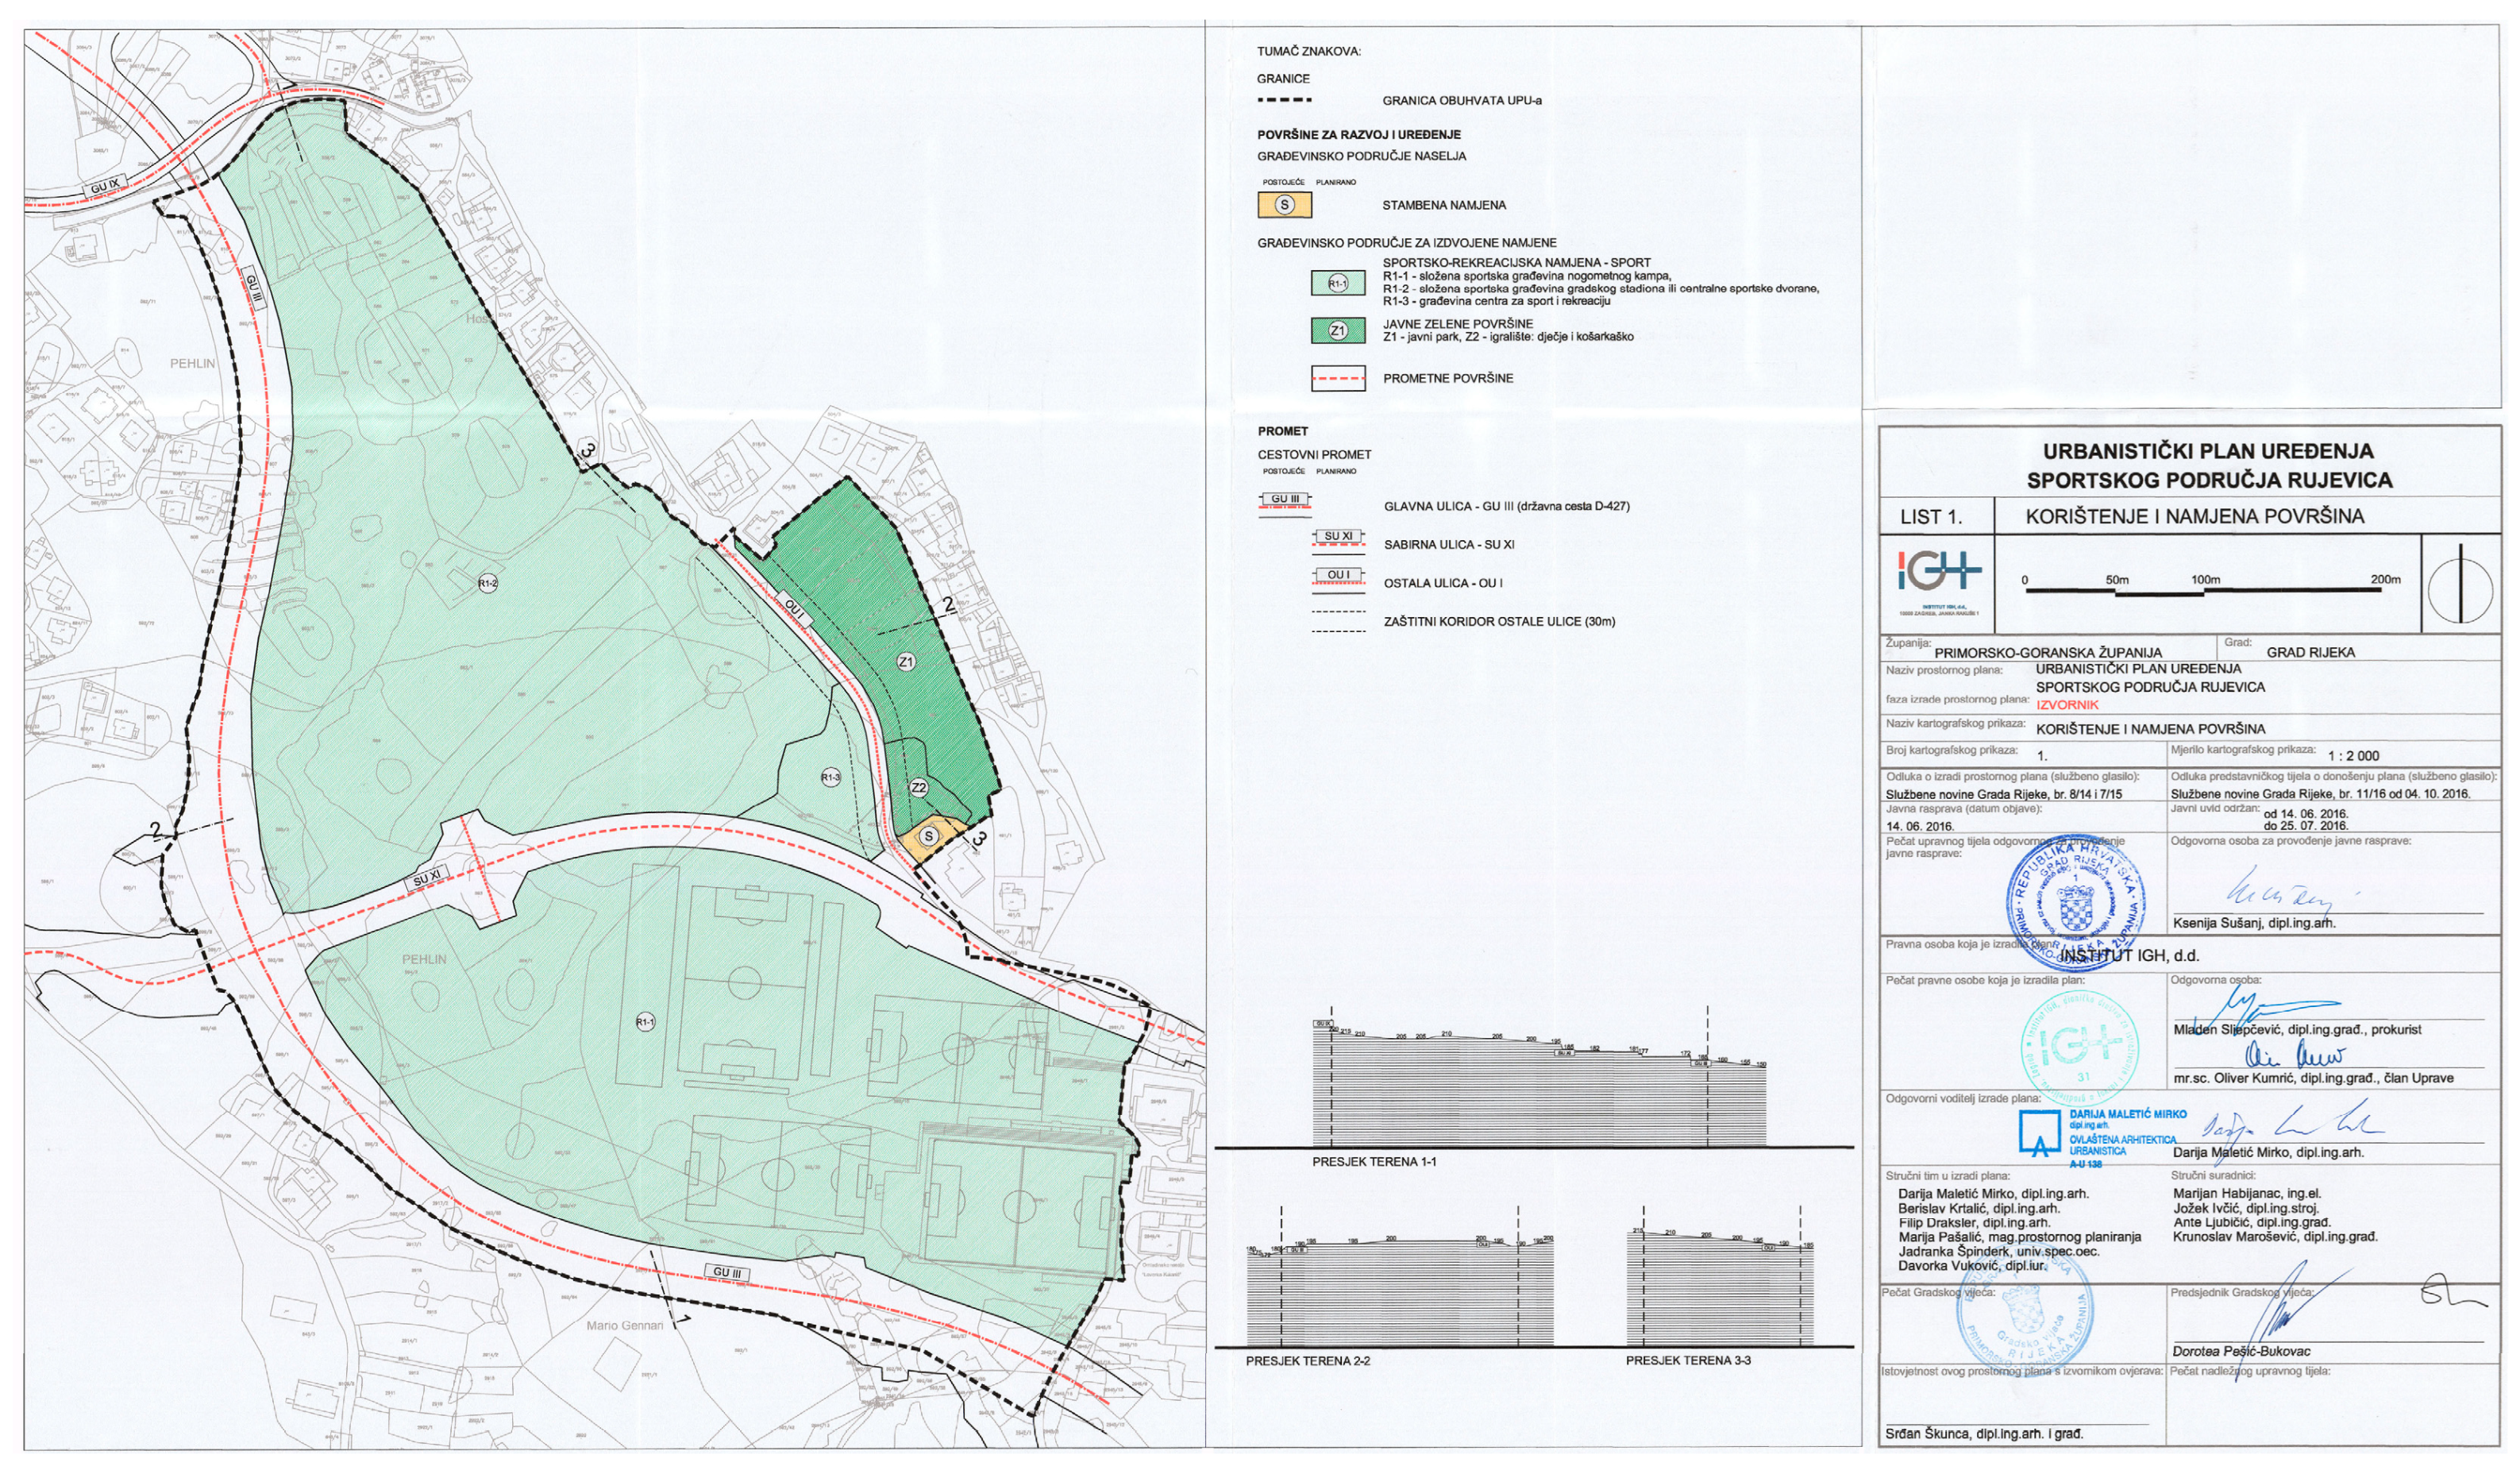
- Urban Plan for the Rujevica Sports Area. Available online: https://zavod.pgz.hr/planovi_i_izvjesca/registar-prostornih-planova (accessed on 3 March 2024).
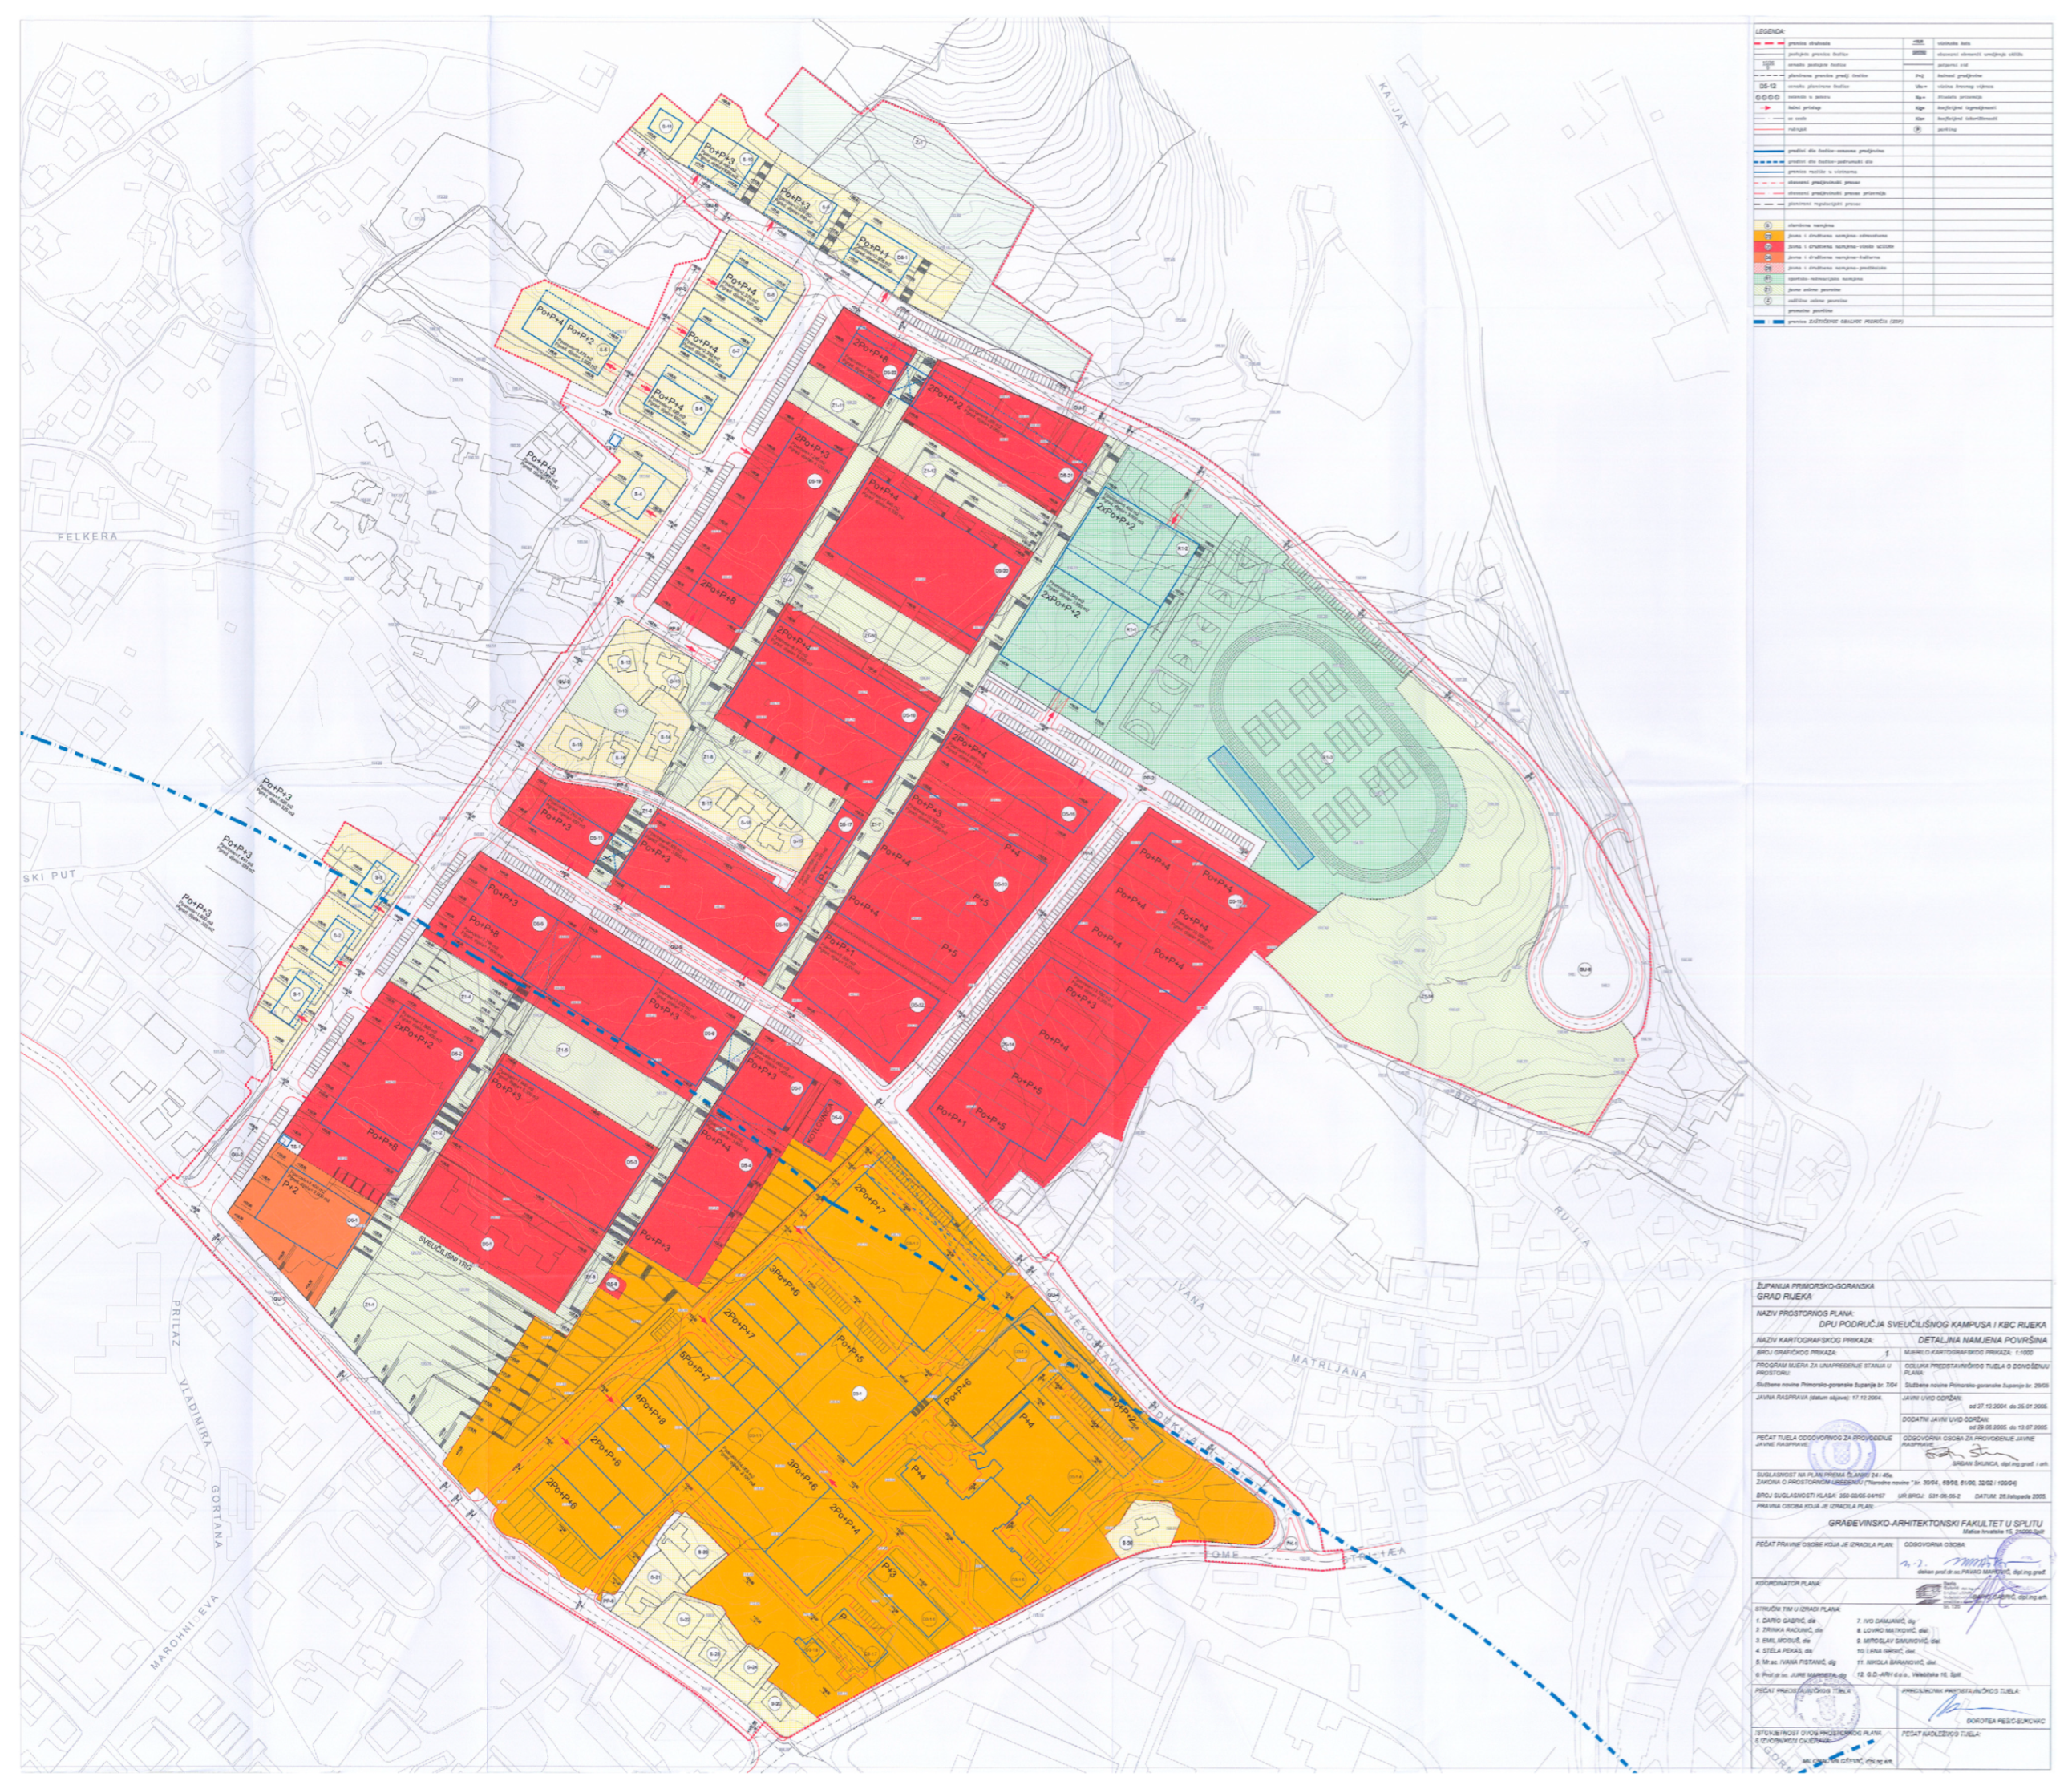
- Detailed Urban Plan of the University Campus and the University Hospital Center in Trsat. Available online: https://zavod.pgz.hr/planovi_i_izvjesca/registar-prostornih-planova (accessed on 3 March 2024).
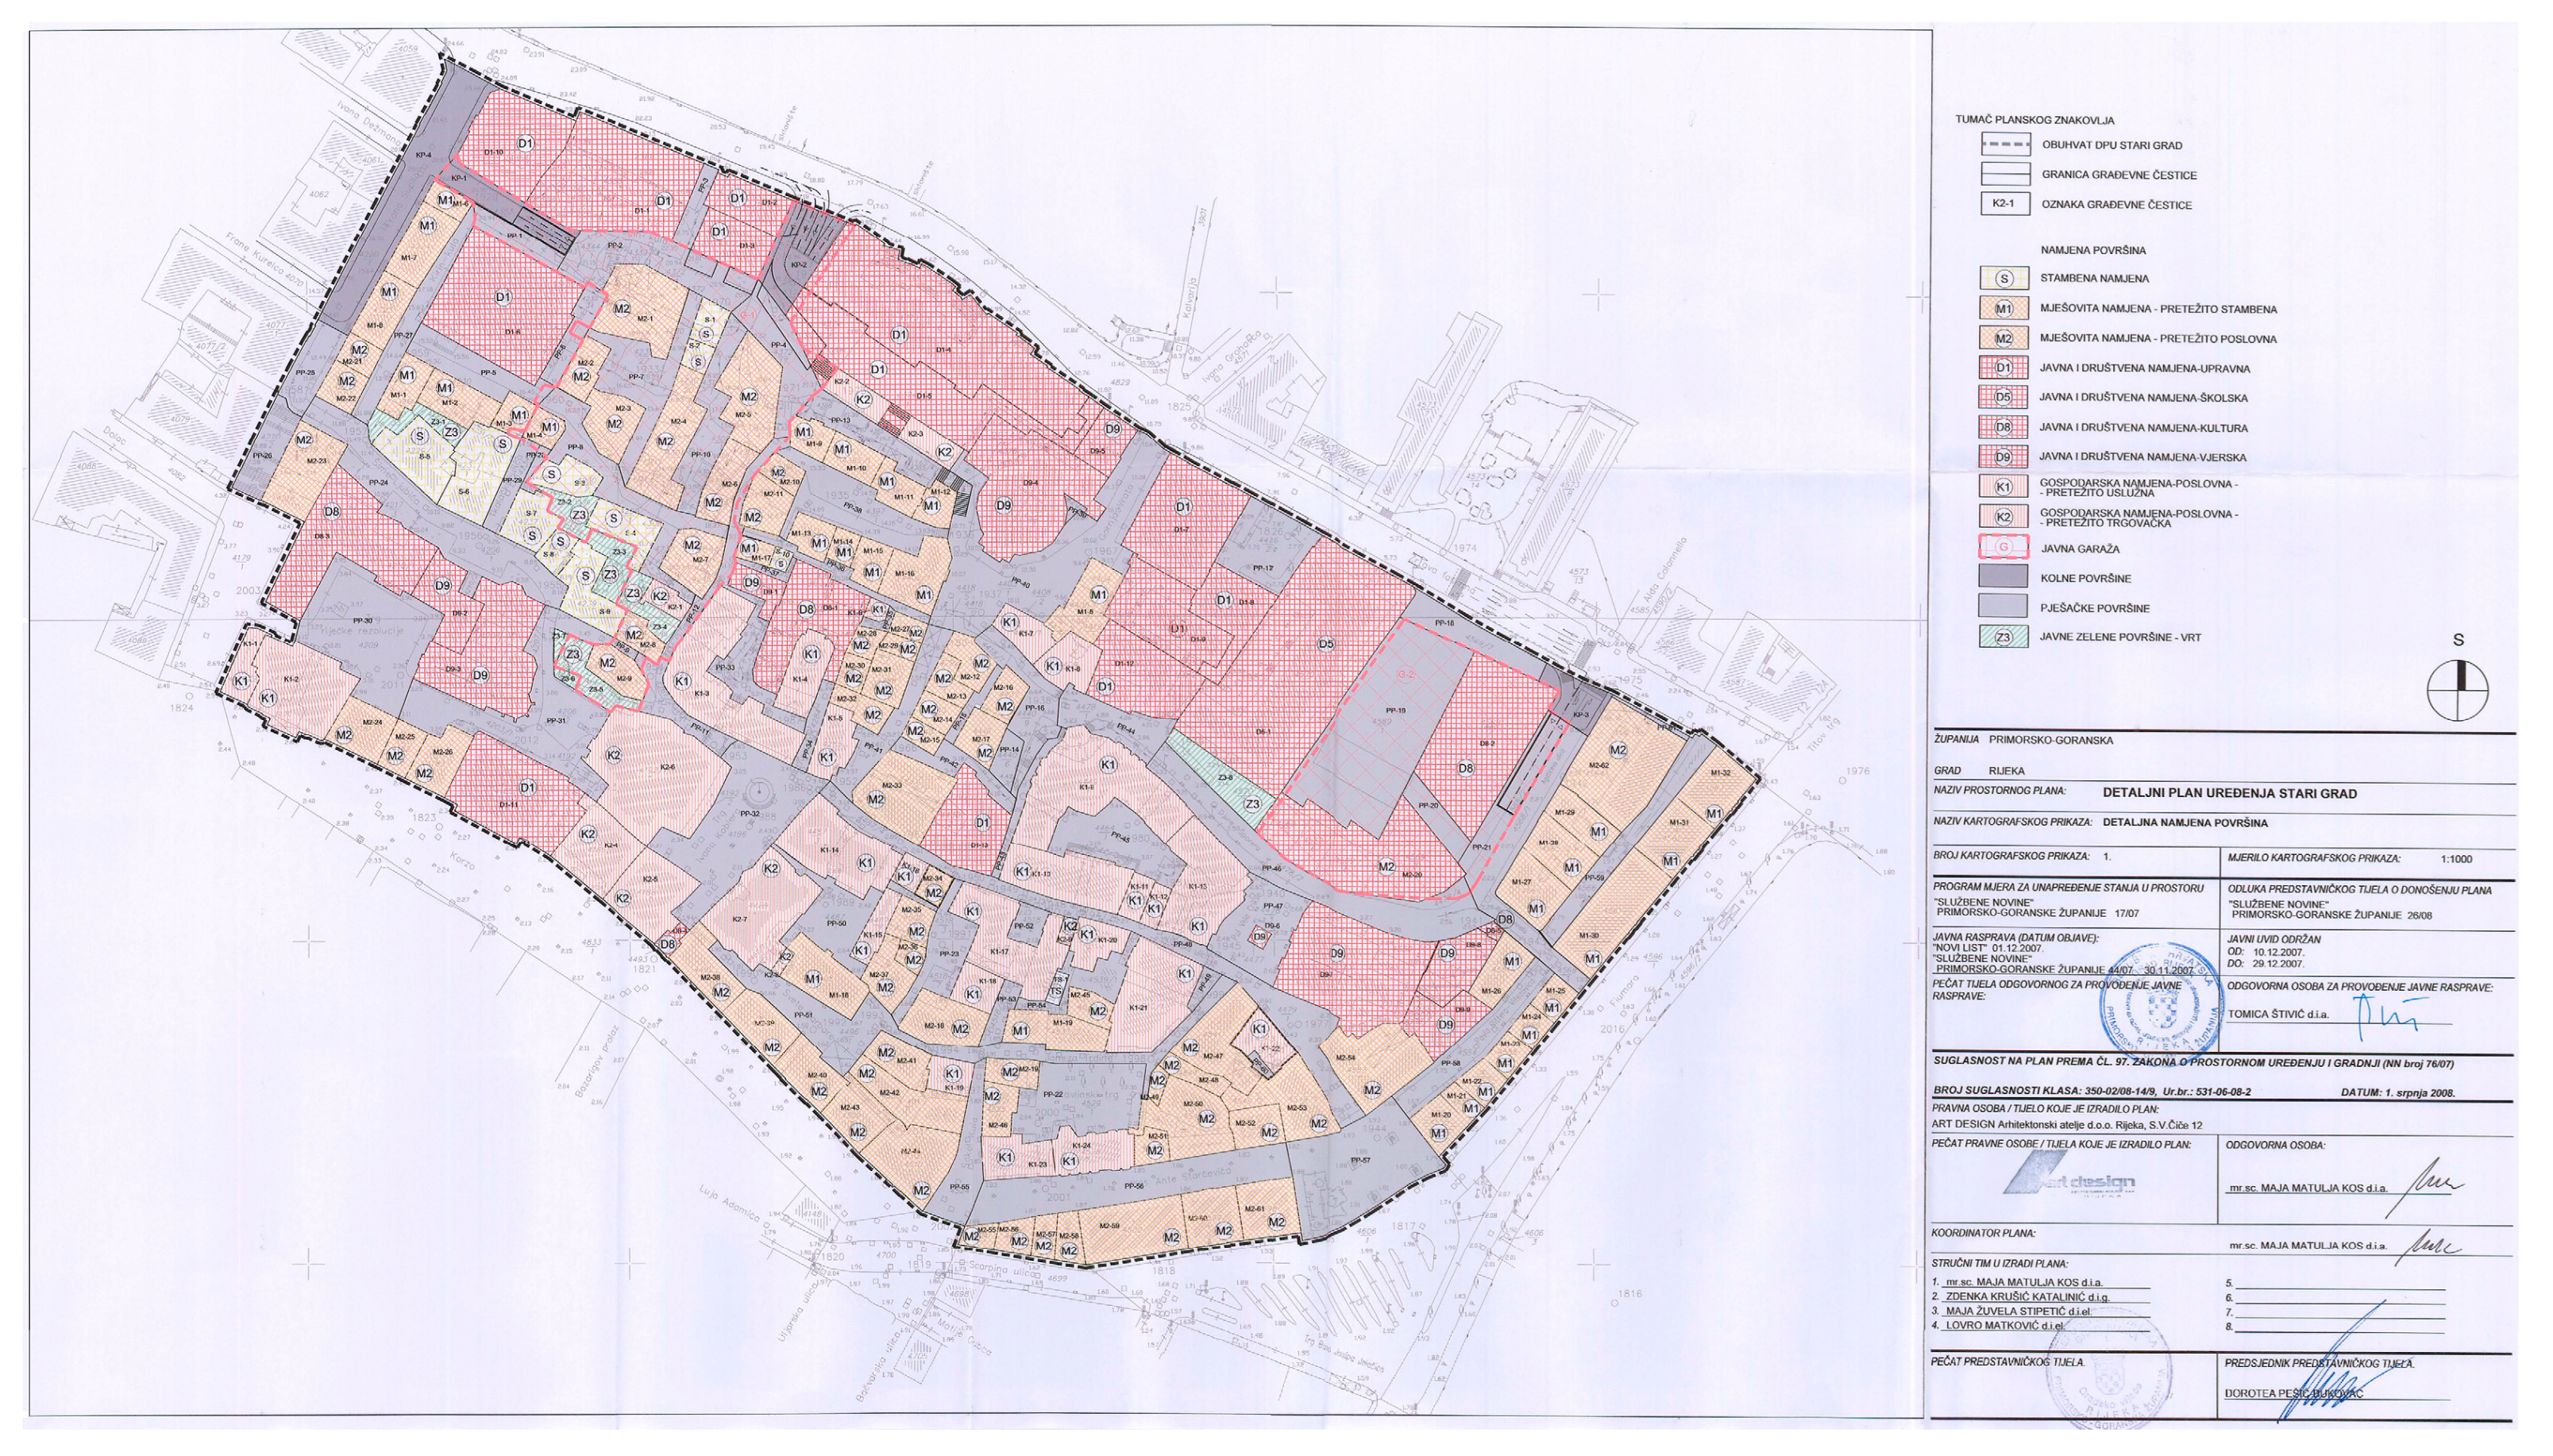
- Detailed Urban Plan of Stari Grad. Available online: https://zavod.pgz.hr/planovi_i_izvjesca/registar-prostornih-planova (accessed on 3 March 2024).
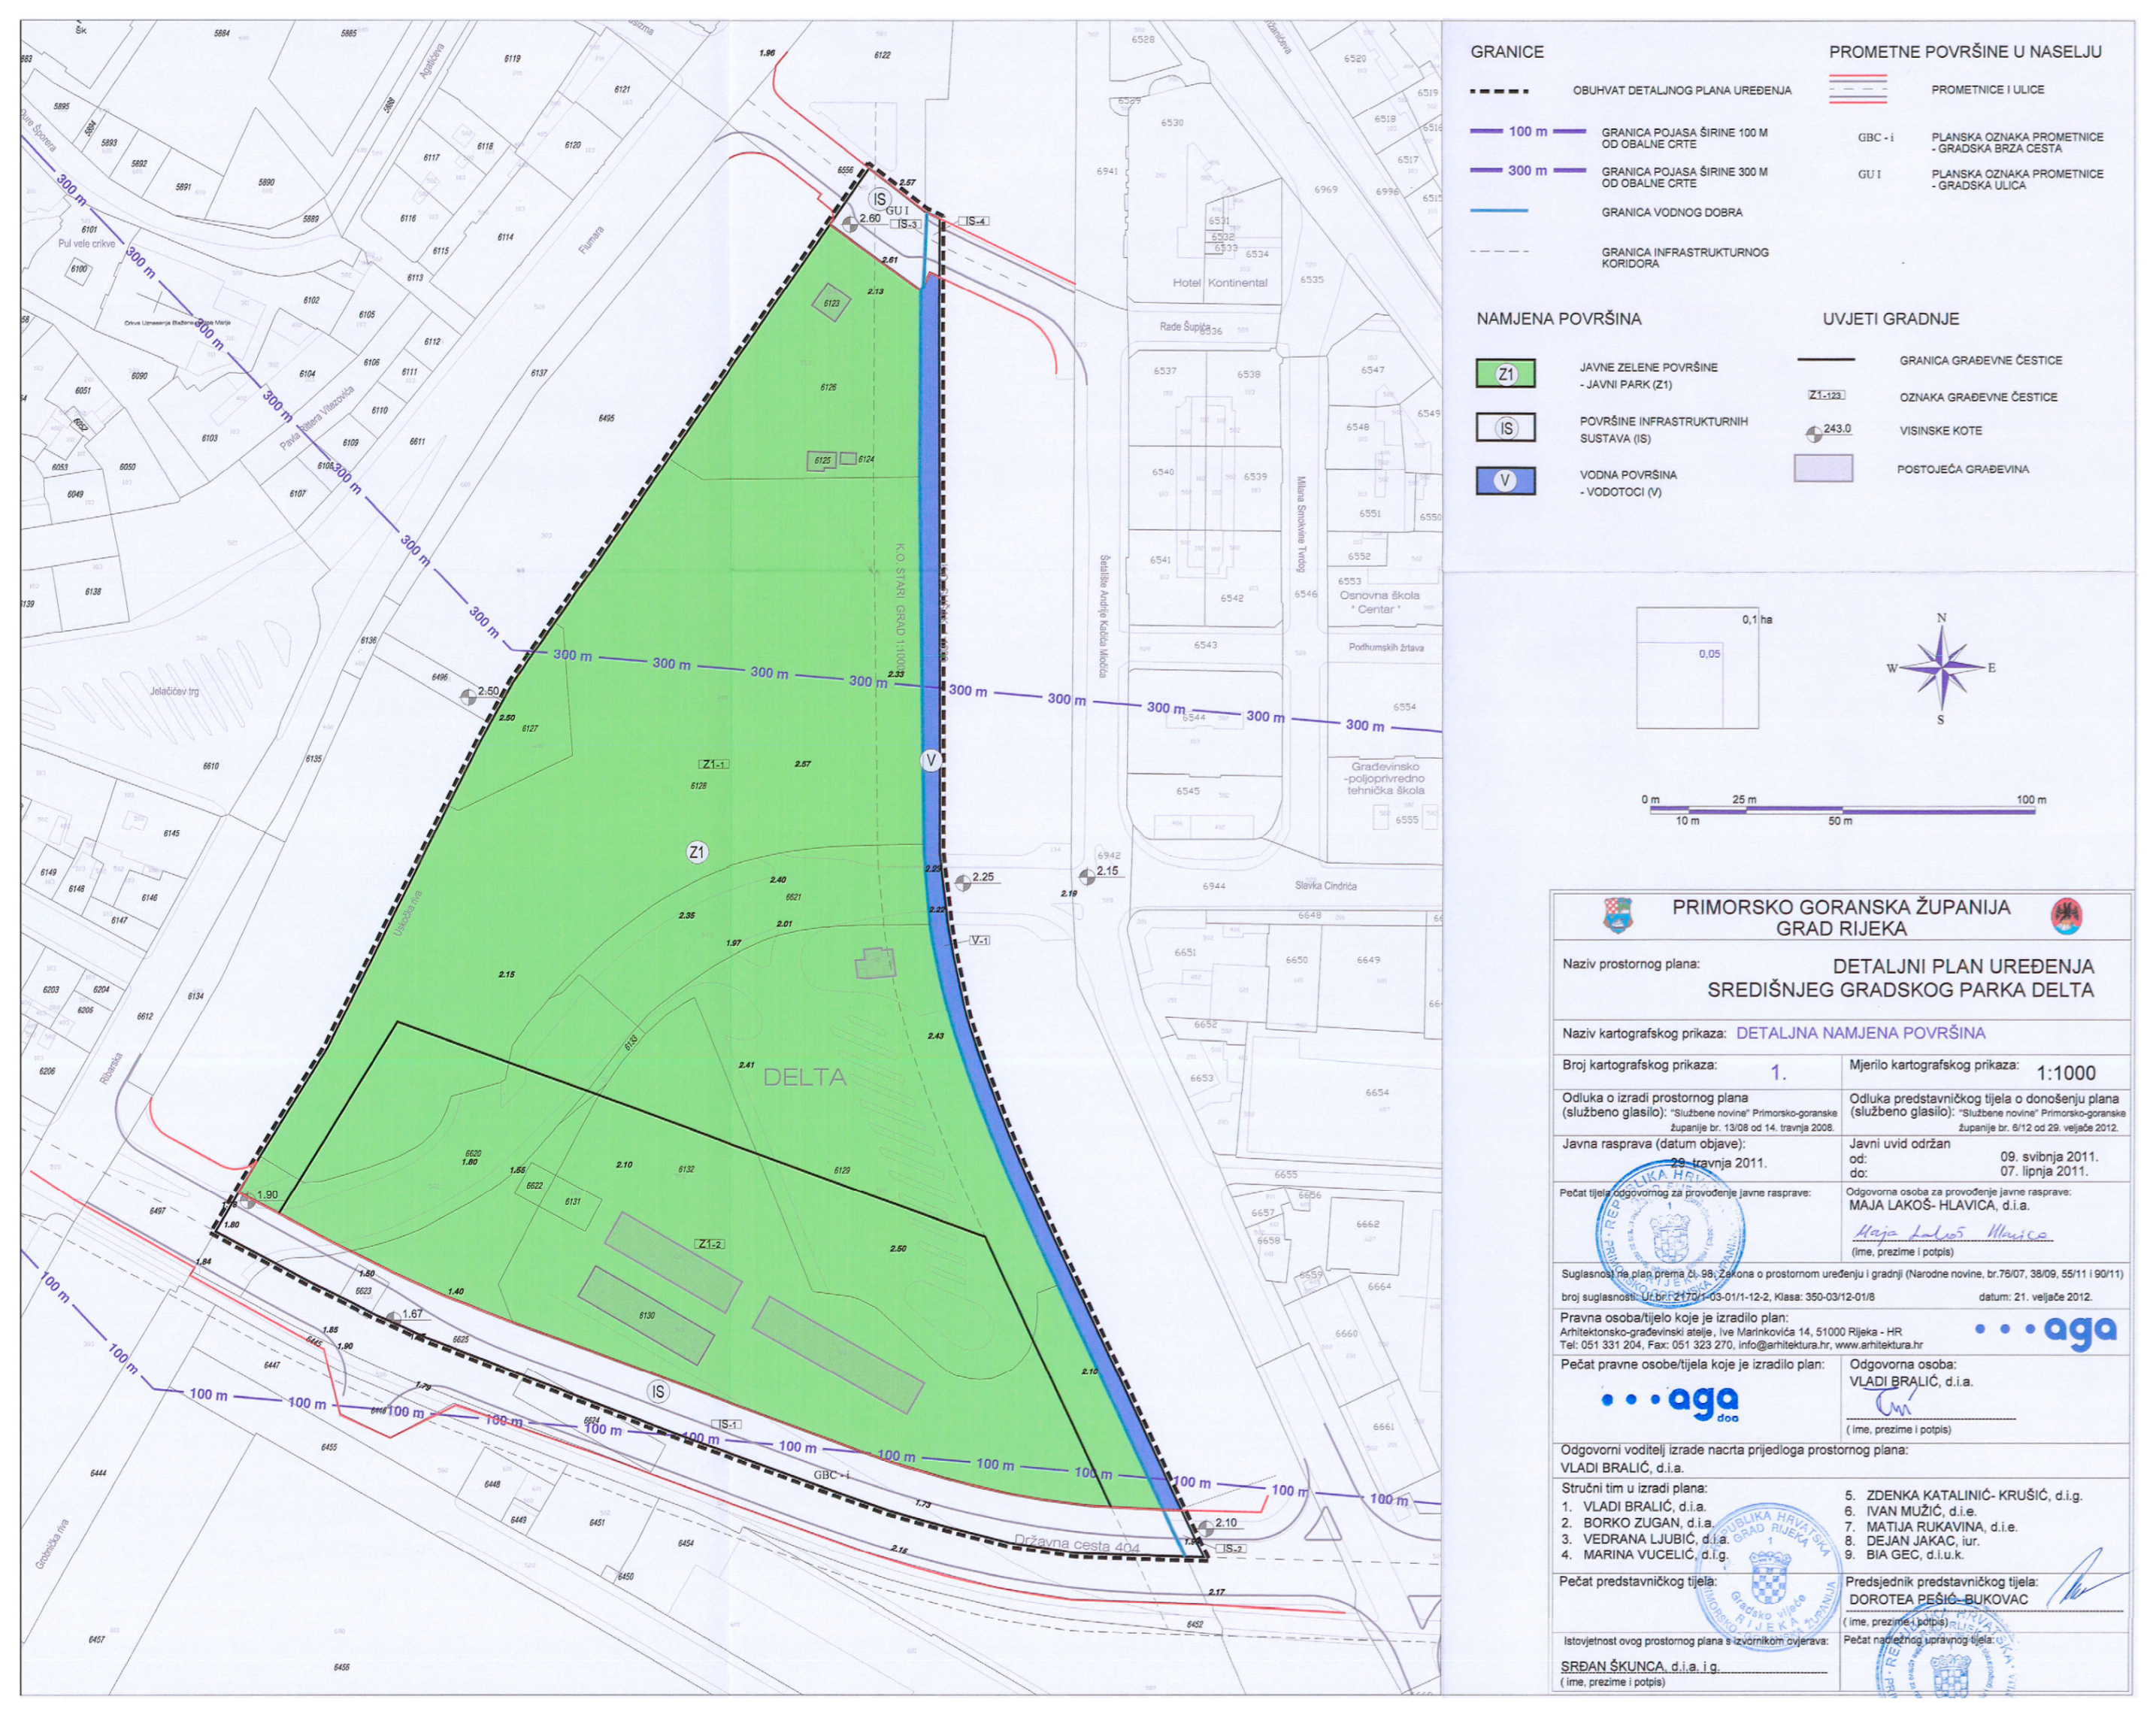
- Detailed Urban Plan of Central City Park Delta. Available online: https://zavod.pgz.hr/planovi_i_izvjesca/registar-prostornih-planova (accessed on 3 March 2024).
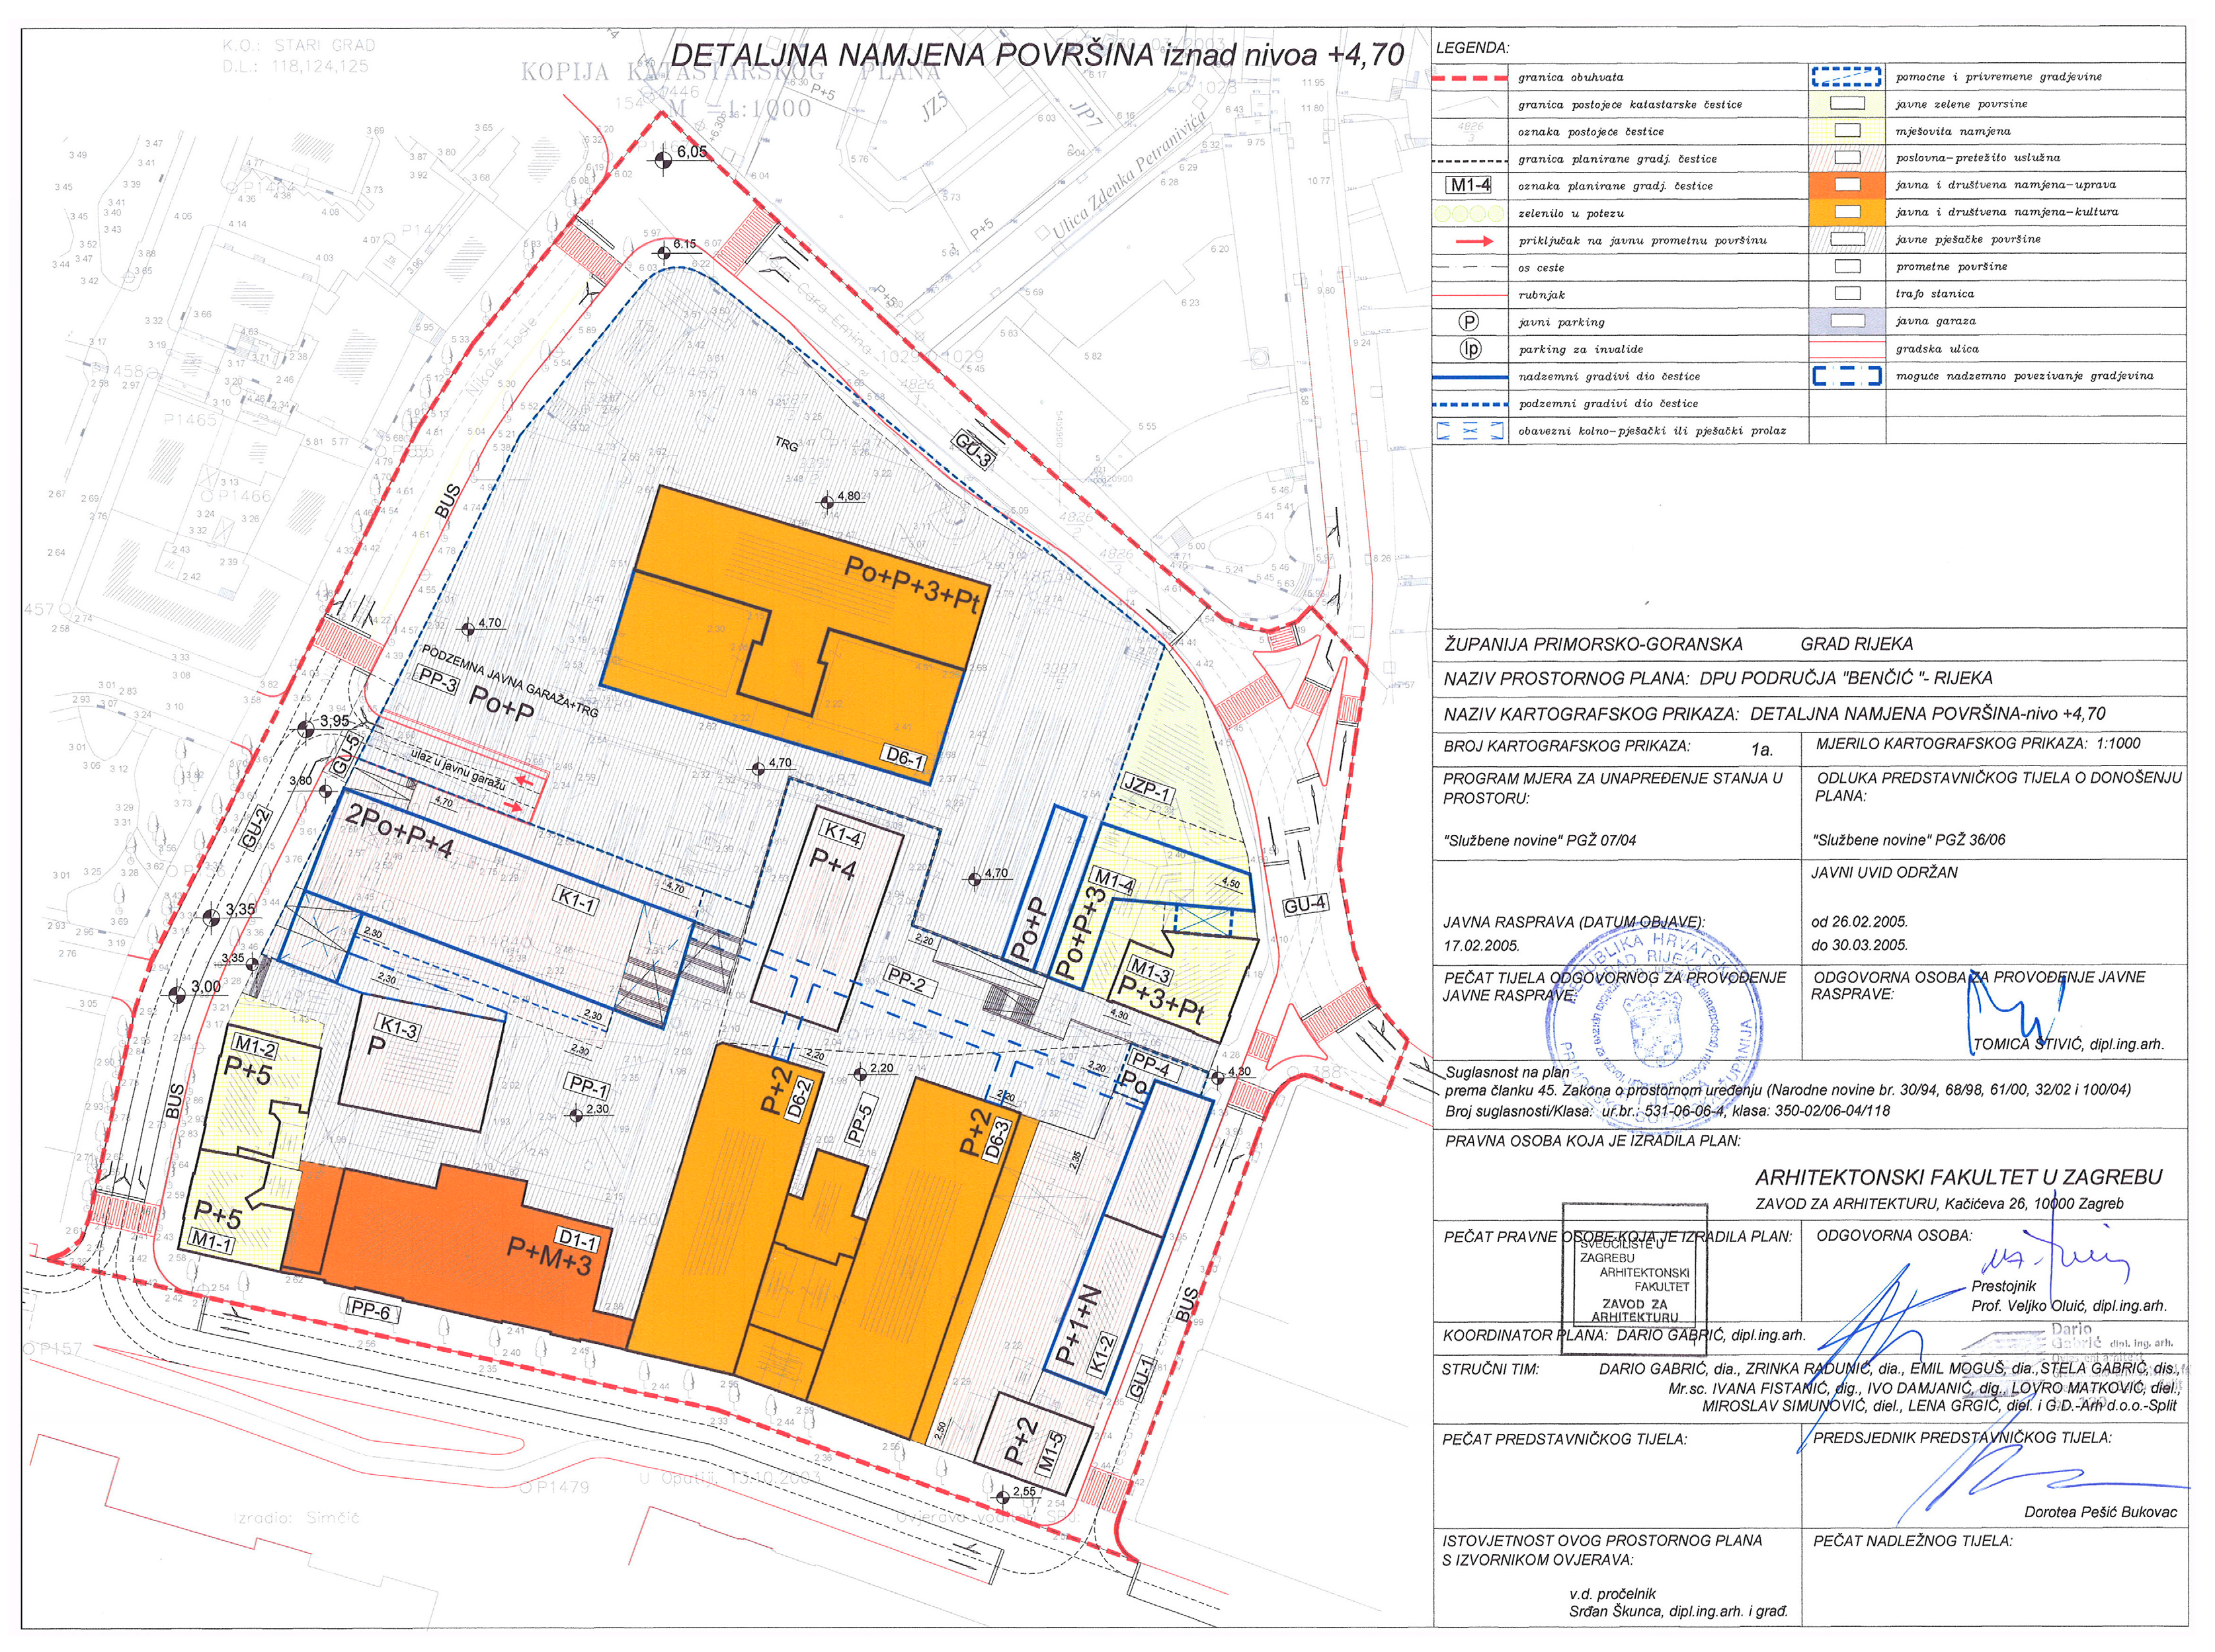
- Detailed Urban Plan of the “Benčić” Area. Available online: https://zavod.pgz.hr/planovi_i_izvjesca/registar-prostornih-planova (accessed on 3 March 2024).
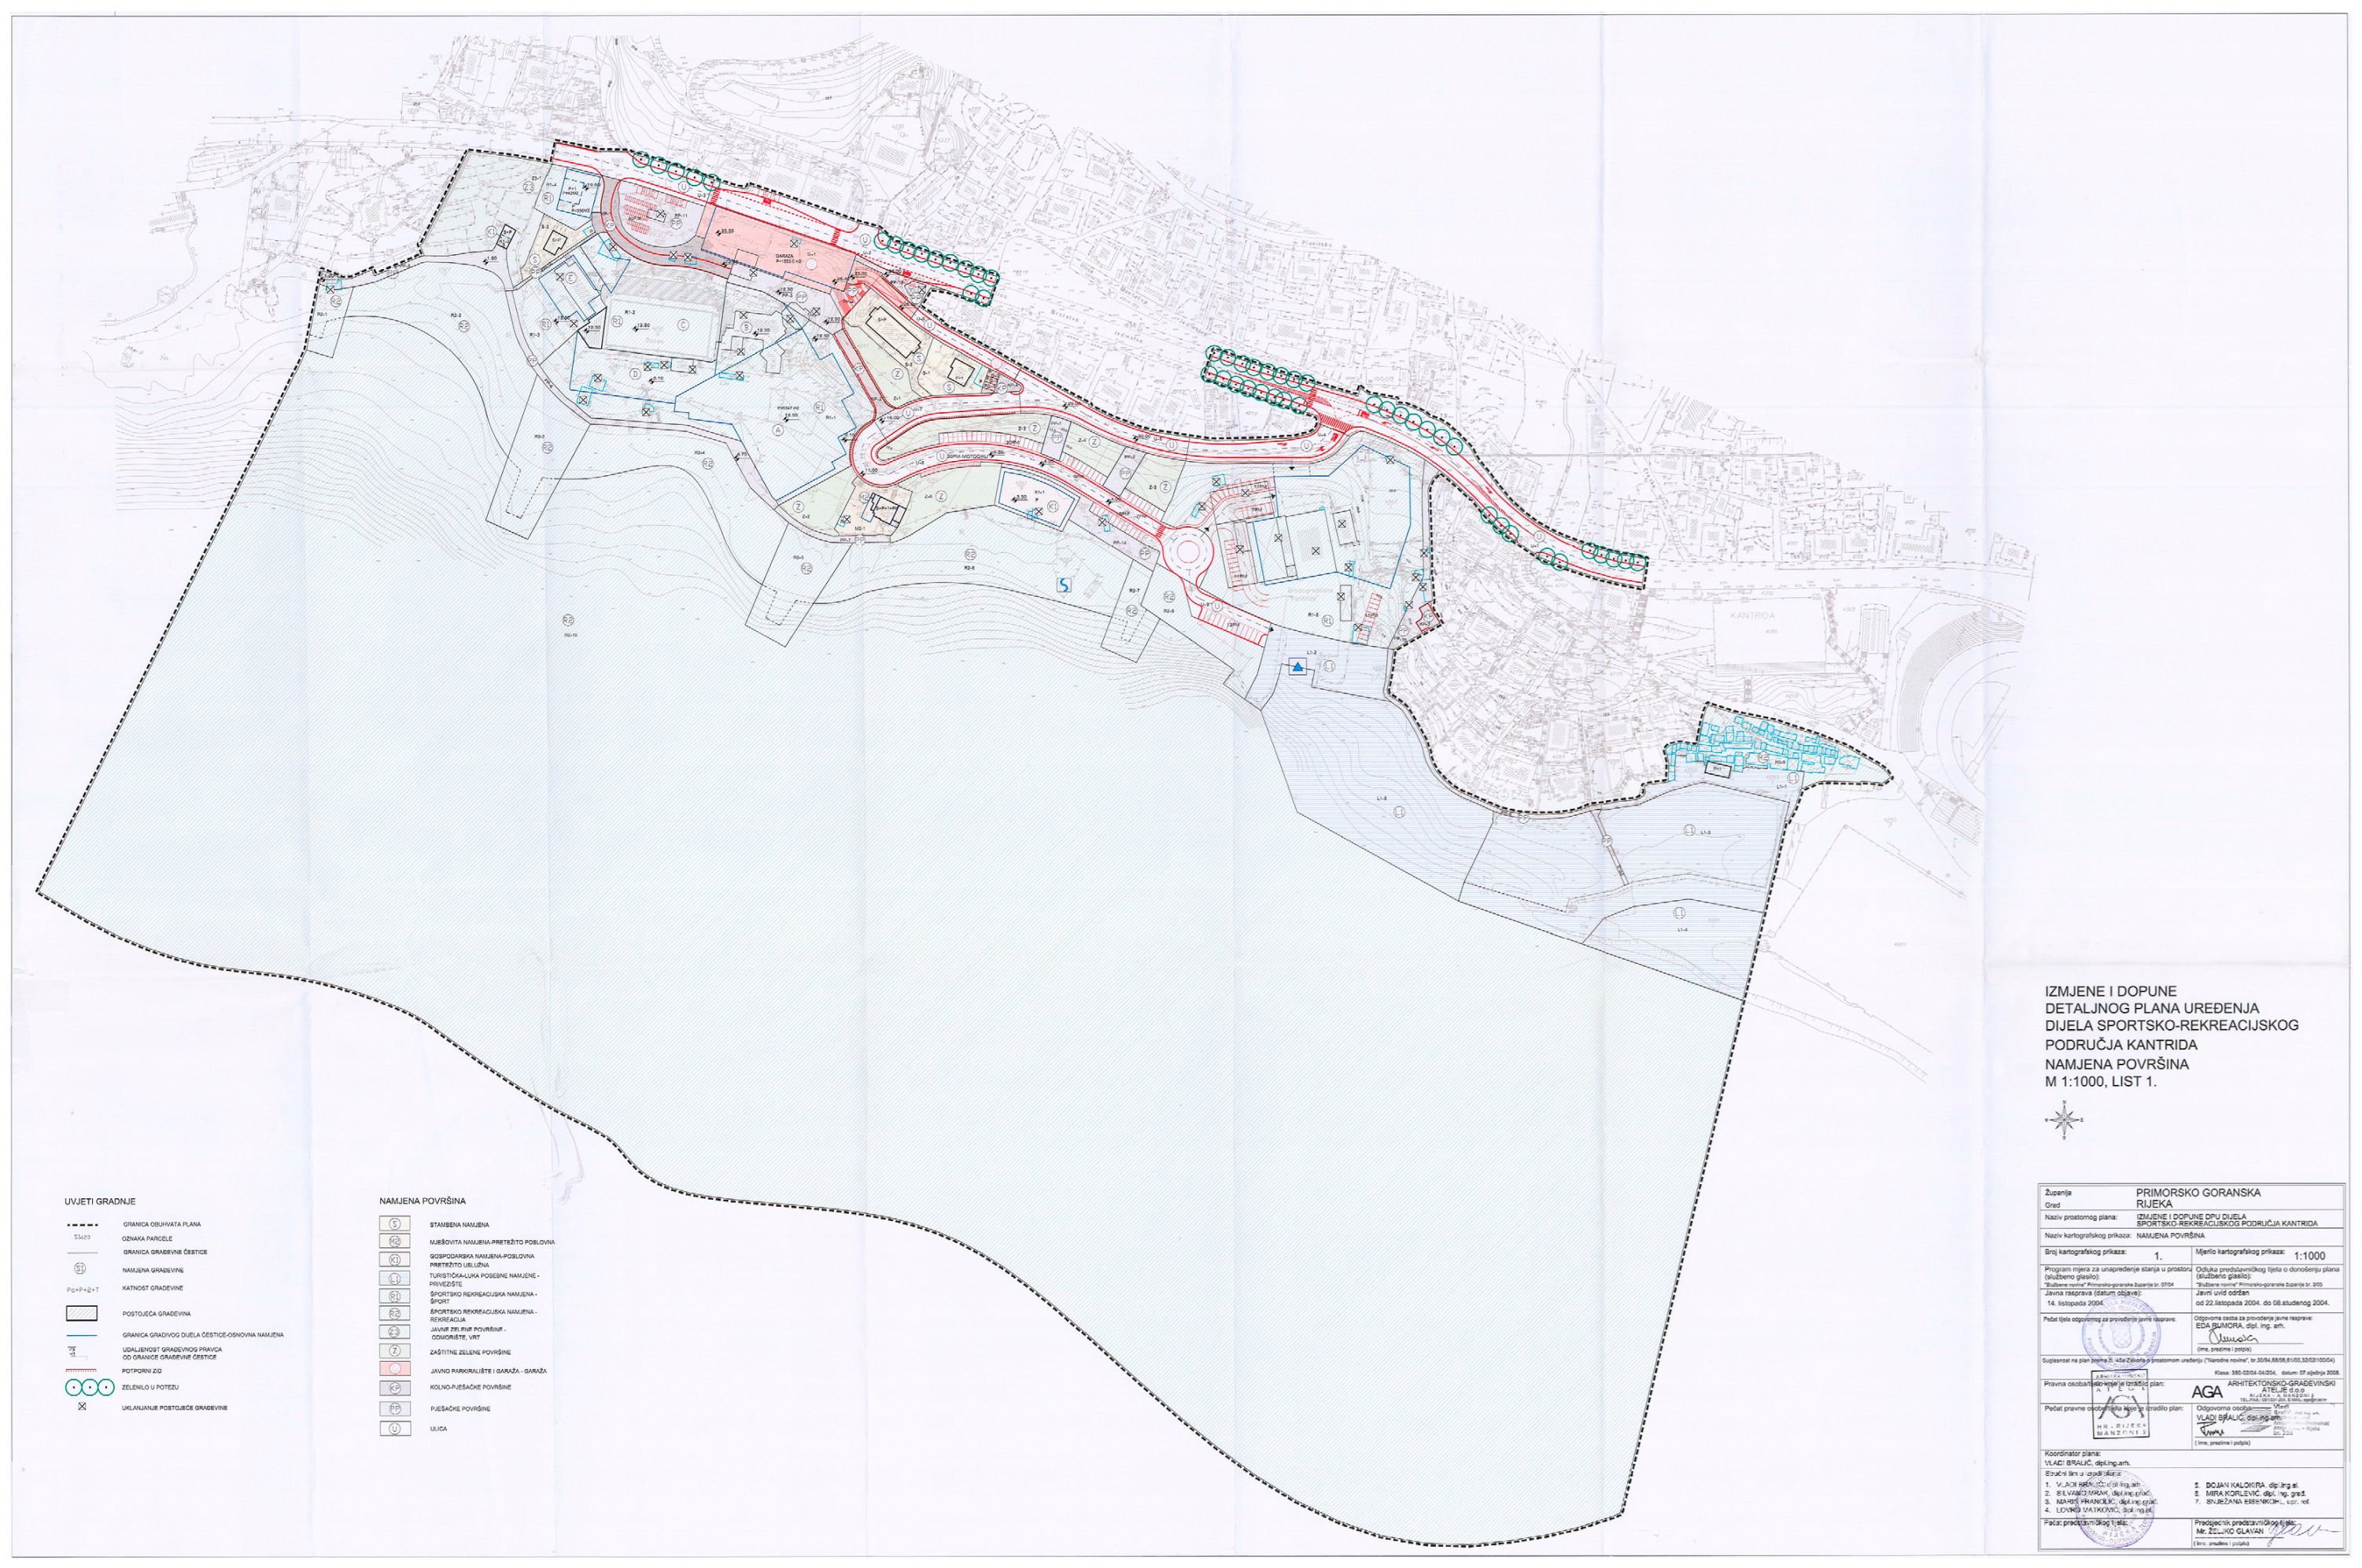
- Detailed Urban Plan of the Sports and Recreation Area Kantrida. Available online: https://zavod.pgz.hr/planovi_i_izvjesca/registar-prostornih-planova (accessed on 3 March 2024).
- Moreno, K. Definition of the 15-Minute city: What Is the 15-Minute City? 2021. Available online: https://www.researchgate.net/publication/362839186_Definition_of_the_15-minute_city_WHAT_IS_THE_15-MINUTE_CITY (accessed on 3 March 2024).
- Regional plan of the Primorje—Gorski Kotar County. Available online: https://zavod.pgz.hr/planovi_i_izvjesca/registar-prostornih-planova (accessed on 3 March 2024).
- Spatial Planning of the City of Rijeka. Available online: https://zavod.pgz.hr/planovi_i_izvjesca/registar-prostornih-planova (accessed on 3 March 2024).
- General Urban Plan of the City of Rijeka. Available online: https://zavod.pgz.hr/planovi_i_izvjesca/registar-prostornih-planova (accessed on 3 March 2024).
- Development Strategy of the City of Rijeka 2014–2020. Available online: https://www.rijeka.hr/wp-content/uploads/2013/09/Strategija-razvoja-Grada-Rijeke-za-razdoblje-2014.-–-2020.-godine.pdf (accessed on 3 March 2024).
- Report on the State of the City of Rijeka 2007–2018. Available online: https://www.rijeka.hr/izvjesce-o-stanju-u-prostoru-grada-rijeke-za-razdoblje-2007-2018-godine/ (accessed on 3 March 2024).
- Marinović-Uzelac, A. Teorija Namjene Površina u Urbanizmu; Tehnička Knjiga: Zagreb, Croatia, 1989. [Google Scholar]
- Chen, H.; Wang, N.; Liu, Y.; Zhang, Y.; Lu, Y.; Li, X.; Chen, C.; Liu, Y. A green infrastructure planning framework–guidance for priority, hubs and types. Urban For. Urban Green. 2022, 70, 127545. [Google Scholar] [CrossRef]
- Shen, L.Y.; Jorge Ochoa, J.; Shah, M.N.; Zhang, X. The Application of Urban Sustainability Indicators—A Comparison between Various Practices. Habitat Int. 2011, 35, 17–29. [Google Scholar] [CrossRef]
- UN-Habitat; Martinuzzi, C.; Lahoud, C. Public Space Site-Specific Assessment: Guidelines to Achieve Quality Public Spaces at Neighbourhood Level; Public Space Programme: Nairobi, Kenya, 2020; Available online: https://unhabitat.org/sites/default/files/2020/07/final_pssa_v.1_reviewed_compressed.pdf (accessed on 3 March 2024).
- Green Cities Europe. A Proposal for Green Norm 2.0, Methods and Tools for More and Better Urban Nature. 2021. Available online: https://thegreencities.eu/wp-content/uploads/2020/10/Green-norm-2.0-29032021.pdf (accessed on 3 March 2024).
- Study of Green Infrastructure of the City of Rijeka. Available online: https://www.rijeka.hr/wp-content/uploads/2021/03/Studija-zelene-infrastrukture-Grada-Rijeke.pdf (accessed on 3 March 2024).
- Barrie, H.; McDougall, K.; Miller, K.; Faulkner, D. The social value of public spaces in mixed-use high-rise buildings. Build. Cities 2023, 4, 669–689. [Google Scholar] [CrossRef]
- Un-Habitat; Stahle, A. Developing Public Space and Land Values in Cities and Neighbourhoods, Urban Planning and Design Branch/Urban Economy and Finance Branch. 2018. Available online: https://unhabitat.org/sites/default/files/download-manager-files/Discussion%20Paper%20-%20Developing%20Public%20Space%20and%20Land%20Values%20in%20Cities%20and%20Neighbourhoods.pdf (accessed on 16 September 2023).
- Albrechts, L.; Barbanente, A.; Monno, V. Practicing Transformative Planning: The Territory-Landscape Plan as a Catalyst for Change. City Territ. Archit. 2020, 7, 1. [Google Scholar] [CrossRef]
- Gehl, J. Cities for People; Island Press: Washington, DC, USA, 2010. [Google Scholar]
- Cushman & Wakefield. Decarbonizing Existing Real Estate Vital to Addressing Climate Change, Businesswire. 2022. Available online: https://www.businesswire.com/news/home/20221118005322/en/Cushman-Wakefield-Finds-Decarbonizing-Existing-Real-Estate-Vital-to-Addressing-Climate-Change-Defines-Business-Case-for-Net-Zero-Buildings (accessed on 3 March 2024).
- UKGBC. Climate Change Mitigation. 2024. Available online: https://ukgbc.org/our-work/climate-change-mitigation/ (accessed on 3 March 2024).
- Royal Institute of British Architects. RIBA 2030 Climate Challenge. 2021. Available online: https://www.structuraltimber.co.uk/news/riba-updates-the-2030-climate-challenge/ (accessed on 3 March 2024).
- Xue, C.; Jin, C.; Xu, J. Inequality in urban green space benefits: Combining street greenery and park greenery. PLoS ONE 2022, 17, e0273191. [Google Scholar] [CrossRef] [PubMed]
- Tong, M.; She, J.; Tan, J.; Li, M.; Ge, R.; Gao, Y. Evaluating Street Greenery by Multiple Indicators Using Street-Level Imagery and Satellite Images: A Case Study in Nanjing, China. Forests 2020, 11, 1347. [Google Scholar] [CrossRef]
- UN-Habitat. SDG Indicator 11.7.1, 2021. Available online: https://unstats.un.org/sdgs/metadata/files/Metadata-11-07-01.pdf (accessed on 3 March 2024).
- Rosado-García, M.J.; Kubus, R.; Argüelles-Bustillo, R.; García-García, M.J. A New European Bauhaus for a Culture of Transversality and Sustainability. Sustainability 2021, 13, 11844. [Google Scholar] [CrossRef]
- UN-Habitat; Garau, P. Global Public Space Toolkit: From Global Principles to Local Policies and Practice. United Nations Human Settlements Programme, 2016. Available online: https://www.local2030.org/library/82/Global-Public-Space-Toolkit--From-Global-Principles-to-Local-Policies-and-Practice.pdf (accessed on 3 March 2024).
- Acioly, C.; Madhuraj, A. City and Public Space: Urban Transgressions, Revolution and Prosperity. Available online: https://claudioacioly.com/sites/default/files/2020-02/128%202019_Acioly%20%26%20Madhuraj_Public%20Space%20Prosperity%20%26%20Revolution_Draft%20paper.pdf (accessed on 16 September 2023).
- Logan, T.; Hobbs, M.; Conrow, L.; Reid, N.; Young, R.; Anderson, M. The x-minute city: Measuring the 10, 15, 20-minute city and an evaluation of its use for sustainable urban design. Cities 2022, 131, 103924. [Google Scholar] [CrossRef]
- Wang, S. A comparative study of two urban planning models: The linear city model and the 15-minute city model. Appl. Comput. Eng. 2023, 25, 276–279. [Google Scholar] [CrossRef]
- Kurtović Folić, N.; Perović, S. Brownfield Regeneration—Imperative for Sustainable Urban Development. J. Croat. Assoc. Civil. Eng. 2012, 64, 373–383. [Google Scholar] [CrossRef]
- Conrad, A.; DeTroy, S.E.; Dross, M.; Eckert, K.; Meilinger, V.; Schröder, A. Advancing the New European Bauhaus: Sustainable Mobility and Resilient Urban Spaces for a Better Quality of Life—The AdNEB Project. elni Rev. 2022, 26–29. [Google Scholar] [CrossRef]
- Katurić, I.; Šmit, K.; Hajdinjak, I.; Kranjec, K. Razvojne strategije kao čimbenik održivog razvoja gradova. Prostor 2019, 27, 78–87. [Google Scholar] [CrossRef]
- Verma, P.; Raghubanshi, A.S. Urban Sustainability Indicators: Challenges and Opportunities. Ecol. Indic. 2018, 93, 282–291. [Google Scholar] [CrossRef]
- De la Barrera, F.; Reyes-Paecke, S.; Banzhaf, E. Indicators for Green Spaces in Contrasting Urban Settings. Ecol. Indic. 2016, 62, 212–219. [Google Scholar] [CrossRef]
- Mariano, C.; Rossi, F. RivEr/Generation_LAB-Linking Resilience with Inclusiveness in the Urban-Built Environment of Rome. Sustainability 2023, 15, 4774. [Google Scholar] [CrossRef]
- Gierko, A. Learning from the Past: Urban Landscape Transformation Praxis on the Example of Interwar German Housing Estates. Buildings 2024, 14, 900. [Google Scholar] [CrossRef]
- Krajewska, J. Development and Sustainability: A Case Study of the Industrial Park EURO-PARK Kobierzyce in Poland. Buildings 2024, 14, 862. [Google Scholar] [CrossRef]
- Ilkovičová, L.; Ilkovič, J.; Meziani, J. Industrial Clusters in Slovakia-Urban Development. Buildings 2023, 13, 2506. [Google Scholar] [CrossRef]
- Nowakowski, P. Beauty and Utility in Architecture, Interior Design and in the New European Bauhaus Concepts. Buildings 2024, 14, 870. [Google Scholar] [CrossRef]
- Jaglarz, A. Perception of Color in Architecture and Urban Space. Buildings 2023, 13, 2000. [Google Scholar] [CrossRef]
- Gotal, M. Epistemology of interdisciplinarity. Diskrepancija 2013, 12, 66–79. [Google Scholar]
- Pinson, D. Urban Planning: An ‘Undisciplined’ Discipline? Futures 2004, 36, 503–513. [Google Scholar] [CrossRef]
- Yoos, J.; James, V. The Multilevel Metropolis. Places J. 2016, 2016, 160518. [Google Scholar] [CrossRef] [PubMed]
- Semeraro, T.; Nicola, Z.; Lara, A.; Sergi Cucinelli, F.; Aretano, R. A Bottom-Up and Top-Down Participatory Approach to Planning and Designing Local Urban Development: Evidence from an Urban University Center. Land 2020, 9, 98. [Google Scholar] [CrossRef]
- Čaldarović, O.; Vukić, J.; Jukić, T. Small scale urbanism and social sustainability—Interdisciplinary study of public space in Zagreb. Sociol. I Prost. 2019, 57, 213. [Google Scholar]
- Gauthier, M.; Simard, L.; Waaub, J.P. Public Participation in Strategic Environmental Assessment (SEA): Critical Review and the Quebec (Canada) Approach. Environ. Impact Assess. Rev. 2011, 31, 48–60. [Google Scholar] [CrossRef]
- Della Spina, L.; Lorè, I.; Scrivo, R.; Viglianisi, A. An Integrated Assessment Approach as a Decision Support System for Urban Planning and Urban Regeneration Policies. Buildings 2017, 7, 85. [Google Scholar] [CrossRef]
- Mitić-Radulović, A.; Lalović, K. Multi-Level Perspective on Sustainability Transition towards Nature-Based Solutions and Co-Creation in Urban Planning of Belgrade, Serbia. Sustainability 2021, 13, 7576. [Google Scholar] [CrossRef]


| Study | Indicator | Quantification |
|---|---|---|
| The theory of land use in urban planning [37] | Green areas in urban plans | 13–17% |
| A green infrastructure planning framework [38] | Green infrastructure areas | 15% |
| “European green deal”: EU biodiversity strategy for 2030 [2,39] | Urban areas used for green infrastructure | 15% |
| “UN Habitat”: Guidelines to Achieve Quality Public Spaces [40] | Urban areas with green infrastructure along with a broader spectrum of facilities | 20–30% |
| A proposal for Green Norm 2.0: analyses of European cities and towns [41] | Areas of greenery in cities | 15–26 m2/inhabitant |
| Study of green Infrastructure of the City of Rijeka [42] | Green areas in a populated part of the city | 3–5 m2/inhabitant |
| “UN Habitat”: Global Public Space Toolkit [43] | Areas used for common goods (pedestrian traffic areas, meeting places, squares, and parks) | 50% |
| “UN Habitat”: Developing Public Space and Land Values [44] | Accessibility of areas for social cohesion | 5 min (400 m) |
| The “15-minute city”: urban planning concept [12,31,45,46] | Accessibility to the daily needs of residents (housing, work, food, health, education, culture, and leisure) | 15 min (1200 m) |
| Research on the impact of building construction on climate change [47,48,49] | Decarbonization of already built buildings | 80% |
| Indicators of Thematic Axes in Urban Plans (TA I.-IV.) | Goals | Parameters | Units | Target Value |
|---|---|---|---|---|
| TA I. Nature in the city: “green infrastructure” (GI) indicator | Determining the contribution of the urban plan to achieving connection with nature. | Using land for green infrastructure. Occurrence of areas for natural greenery. | % | 15% |
| TA II. Connecting people: “public open space” (POS) indicator | Determining the contribution of the urban plan to achieving connection among people. | Using land for public open spaces. Occurrence of areas for streets, squares, and parks. | % | 50% |
| TA III. Affordability and accessibility: “public and social needs” (PSN) indicator | Determining the contribution of the urban plan to meeting public and social needs. | Using land for public and social needs. Occurrence of all types of public and social facilities of a 15-minute city. | % | 100% |
| TA IV. Circular sustainability: “urban reconstruction” (UR) indicator | Determining the contribution of the urban plan to achieving long-term, lifelong, and integral management. | Using land for urban reconstruction. Occurrence of areas for reconstruction of buildings. | % | 80% |
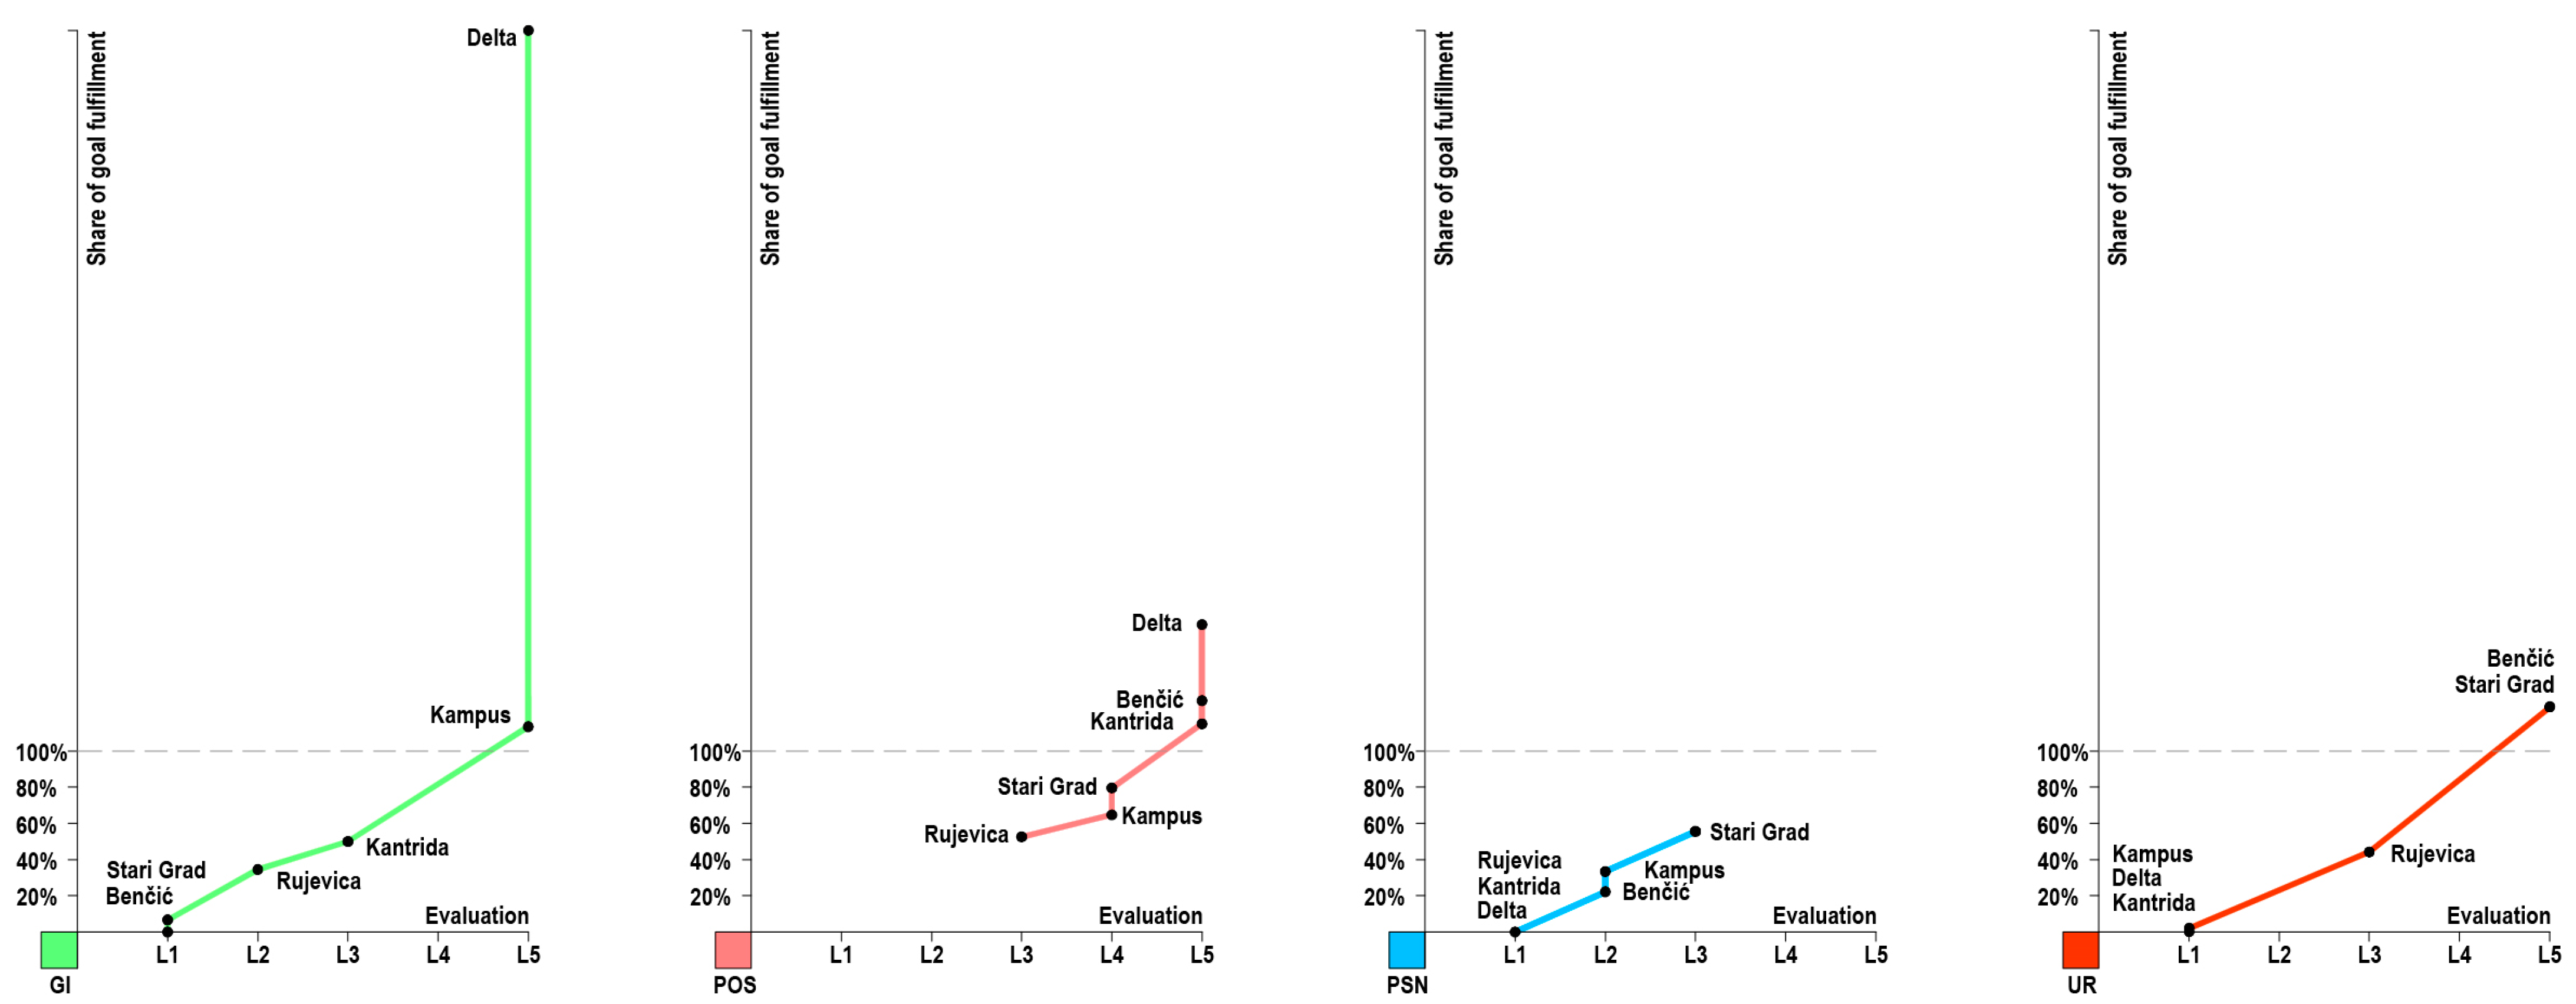
| GI Indicator | Rujevica | Kampus | Stari Grad | Delta | Benčić | Kantrida |
|---|---|---|---|---|---|---|
| PA (ha) | 19.4 | 44.4 | 9.7 | 3.9 | 3.6 | 7.9 |
| TVGI (ha) | 2.9 | 6.7 | 1.5 | 0.6 | 0.5 | 1.2 |
| PVGI (ha) | 1.0 | 7.6 | 0.1 | 3.0 | 0 | 0.6 |
| LGI (%) | 34.5 | 113.4 | 6.7 | 500.0 | 0 | 50.0 |
| Rating (L1–L5) | L2 | L5 | L1 | L5 | L1 | L3 |
| POS Indicator | Rujevica | Kampus | Stari Grad | Delta | Benčić | Kantrida |
|---|---|---|---|---|---|---|
| PA (ha) | 19.4 | 44.4 | 9.7 | 3.9 | 3.6 | 7.9 |
| TVPOS (ha) | 9.7 | 22.2 | 4.9 | 2.0 | 1.8 | 4.0 |
| PVPOS (ha) | 5.1 | 14.5 | 3.9 | 3.4 | 2.3 | 4.6 |
| LPOS (%) | 52.6 | 65.3 | 79.6 | 170.0 | 127.8 | 115.0 |
| Rating (L1–L5) | L3 | L4 | L4 | L5 | L5 | L5 |
| PSN Indicator | Rujevica | Kampus | Stari Grad | Delta | Benčić | Kantrida |
|---|---|---|---|---|---|---|
| TVPSN (n) | 9 | 9 | 9 | 9 | 9 | 9 |
| PVPSN (n) | 0 | 3 | 5 | 0 | 2 | 0 |
| LPSN (%) | 0 | 33.4 | 55.6 | 0 | 22.2 | 0 |
| Rating (L1–L5) | L1 | L2 | L3 | L1 | L2 | L1 |
| UR Indicator | Rujevica | Kampus | Stari Grad | Delta | Benčić | Kantrida |
|---|---|---|---|---|---|---|
| PA (ha) | 19.4 | 44.4 | 9.7 | 3.9 | 3.6 | 7.9 |
| TVUR (ha) | 15.5 | 35.5 | 7.8 | 3.1 | 2.9 | 6.3 |
| PVUR (ha) | 7.0 | 0.7 | 9.7 | 0 | 3.6 | 0 |
| LUR (%) | 44.2 | 2.0 | 124.4 | 0 | 124.4 | 0 |
| Rating (L1–L5) | L3 | L1 | L5 | L1 | L5 | L1 |
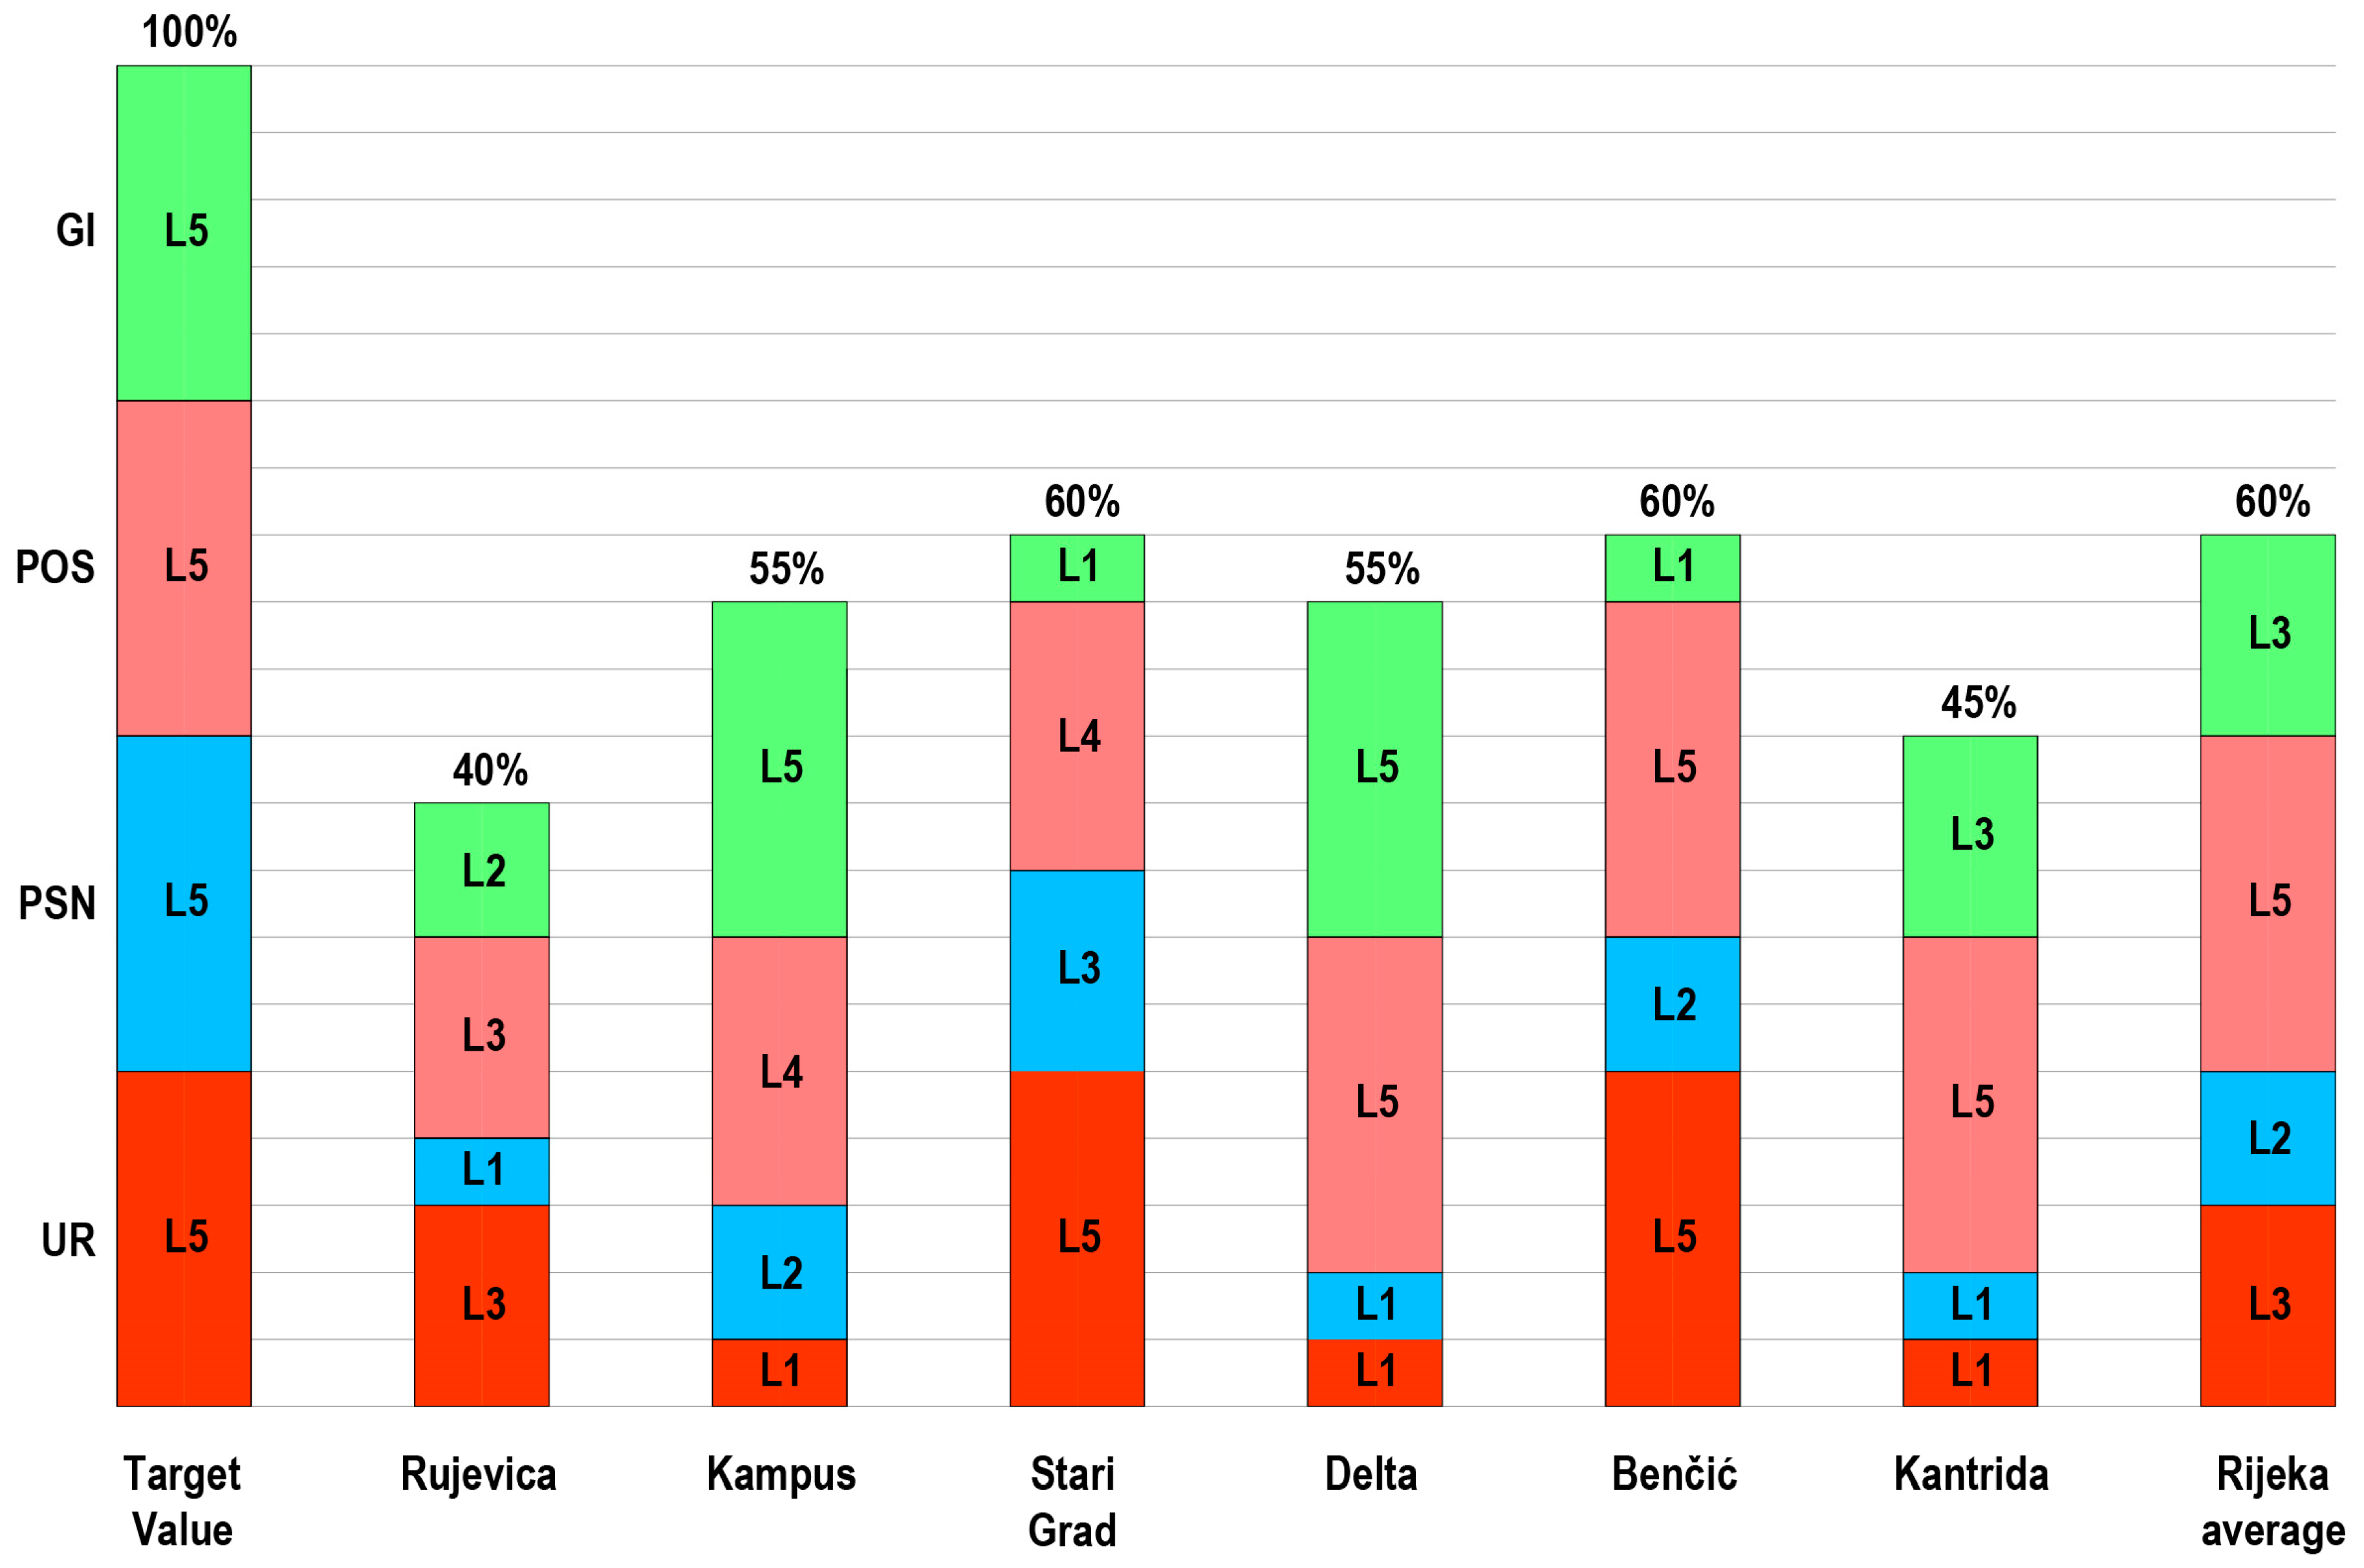
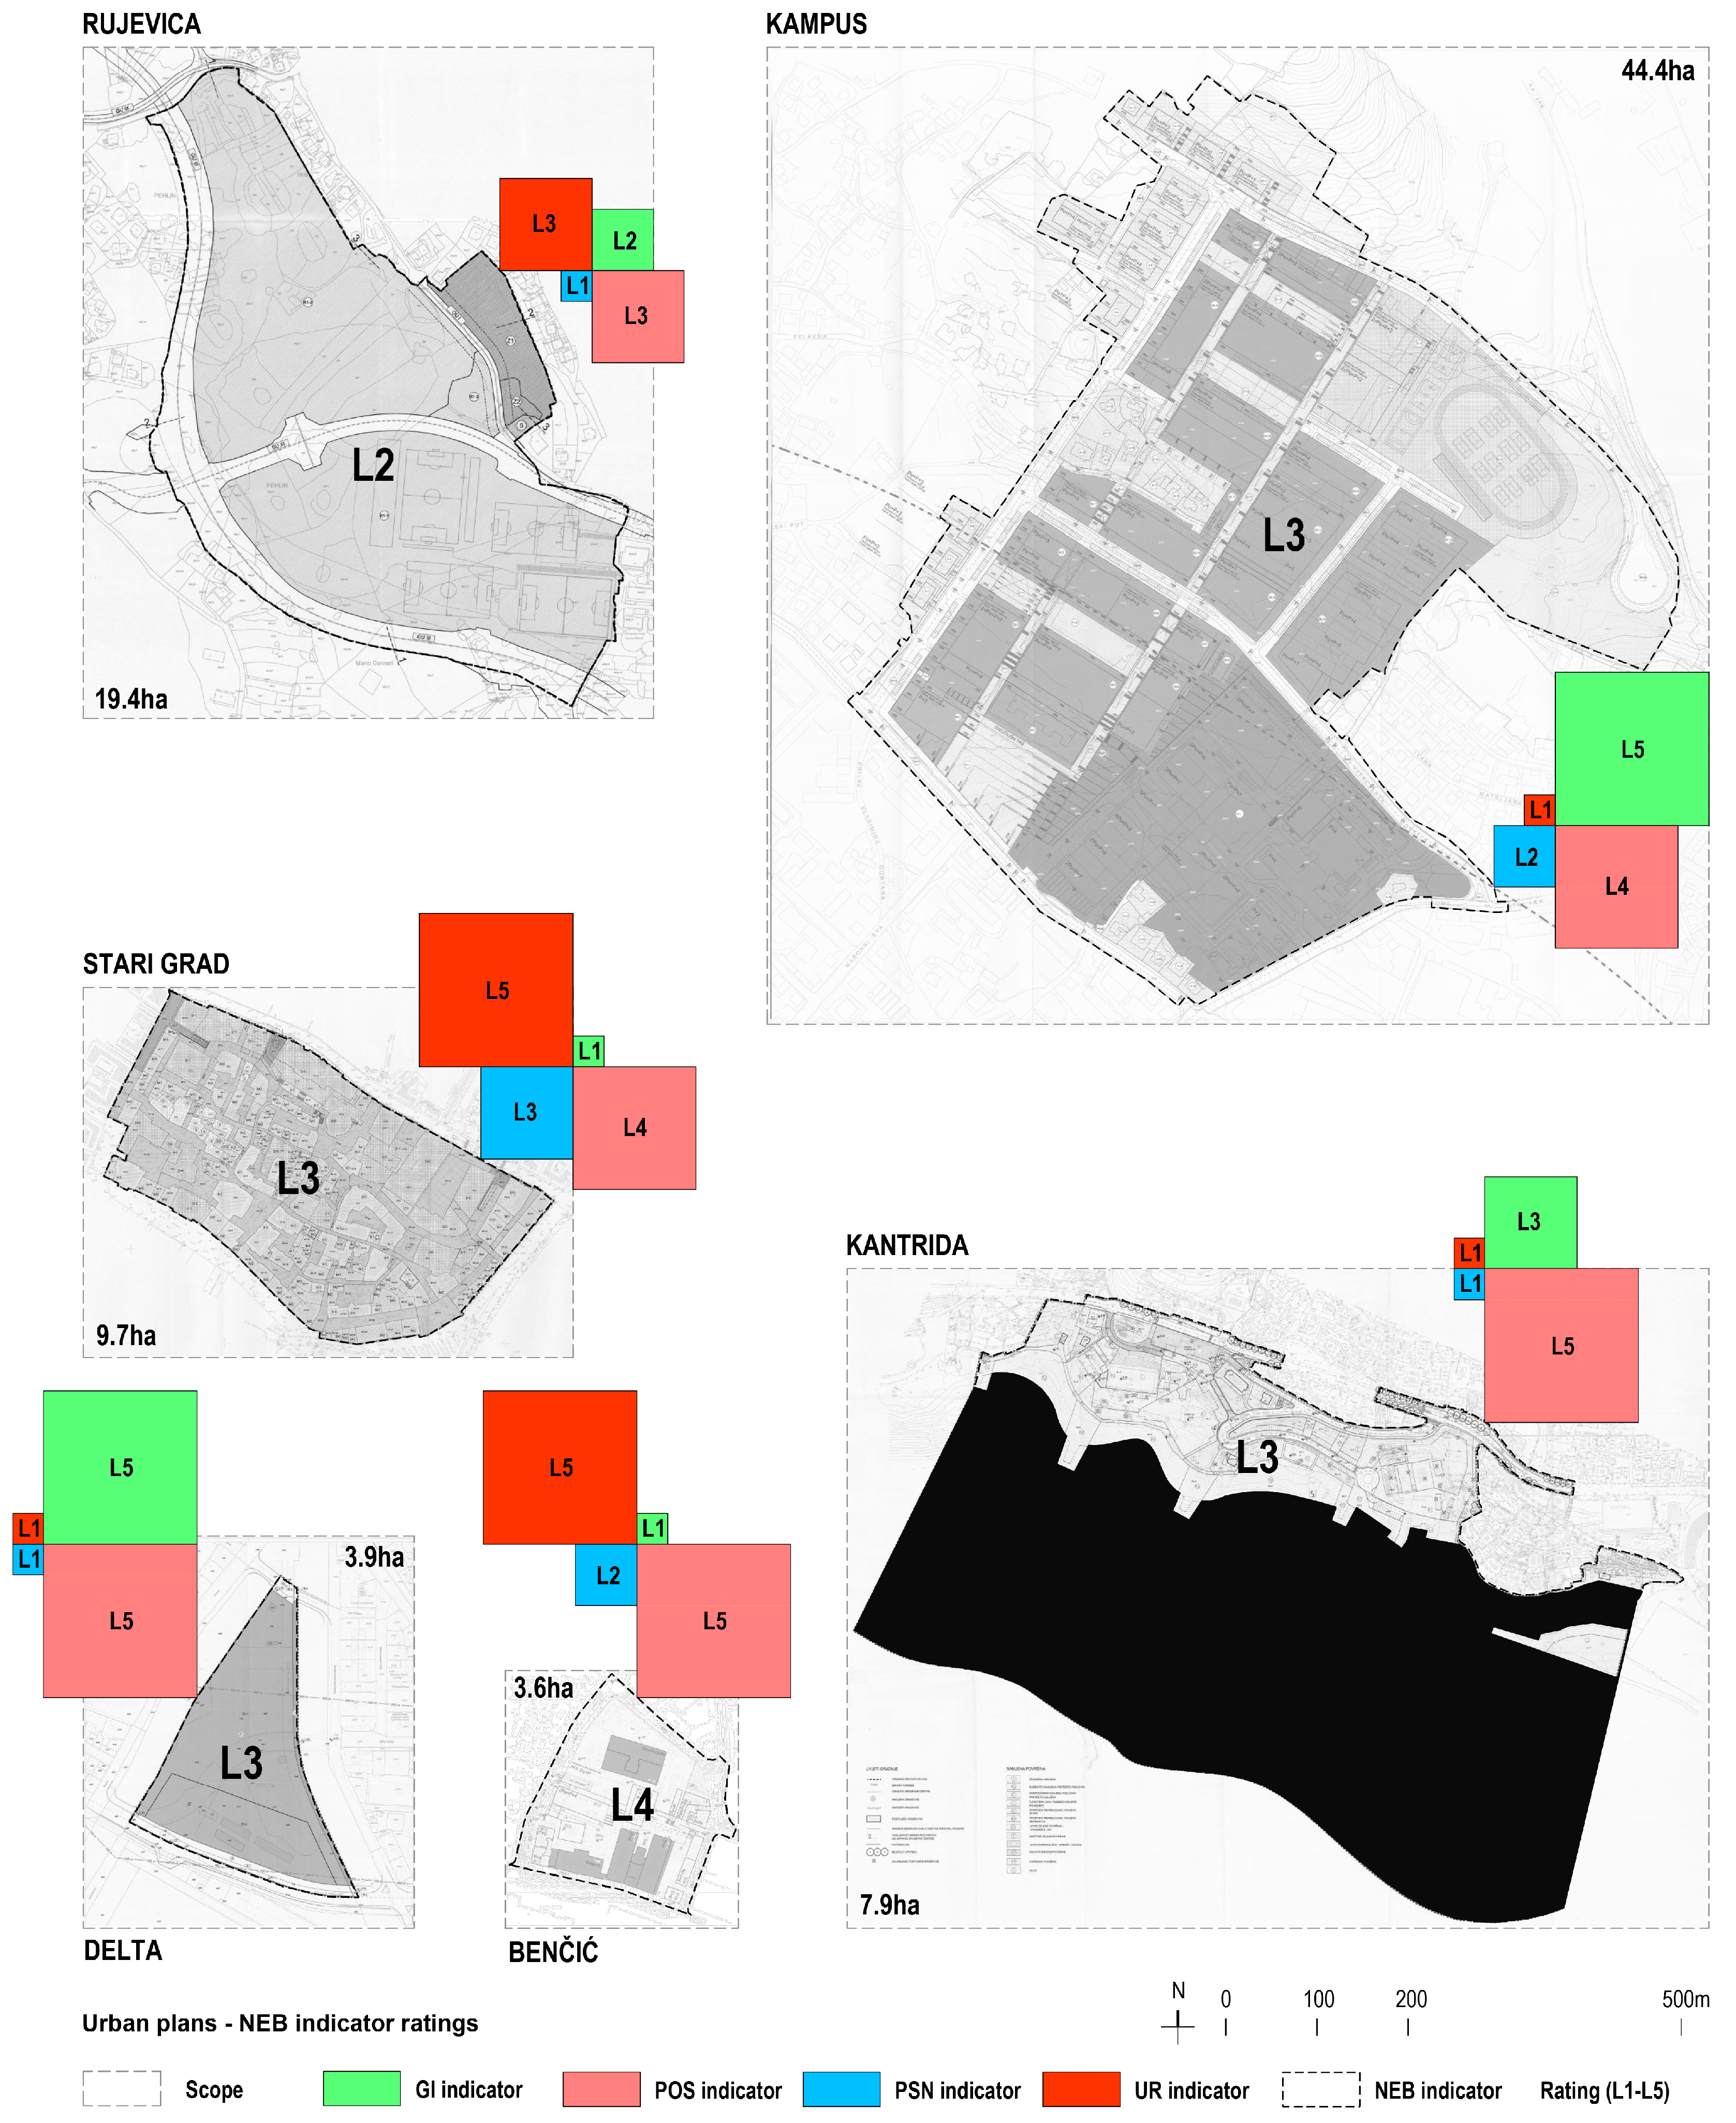
| NEB Indicator | Rujevica | Kampus | Stari Grad | Delta | Benčić | Kantrida |
|---|---|---|---|---|---|---|
| LGI | L2 | L5 | L1 | L5 | L1 | L3 |
| LPOS | L3 | L4 | L4 | L5 | L5 | L5 |
| LPSN | L1 | L2 | L3 | L1 | L2 | L1 |
| LUR | L3 | L1 | L5 | L1 | L5 | L1 |
| Average rating | 2.3 | 3.0 | 3.3 | 3.0 | 3.5 | 2.5 |
| Rating (L1–L5) | L2 | L3 | L3 | L3 | L4 | L3 |
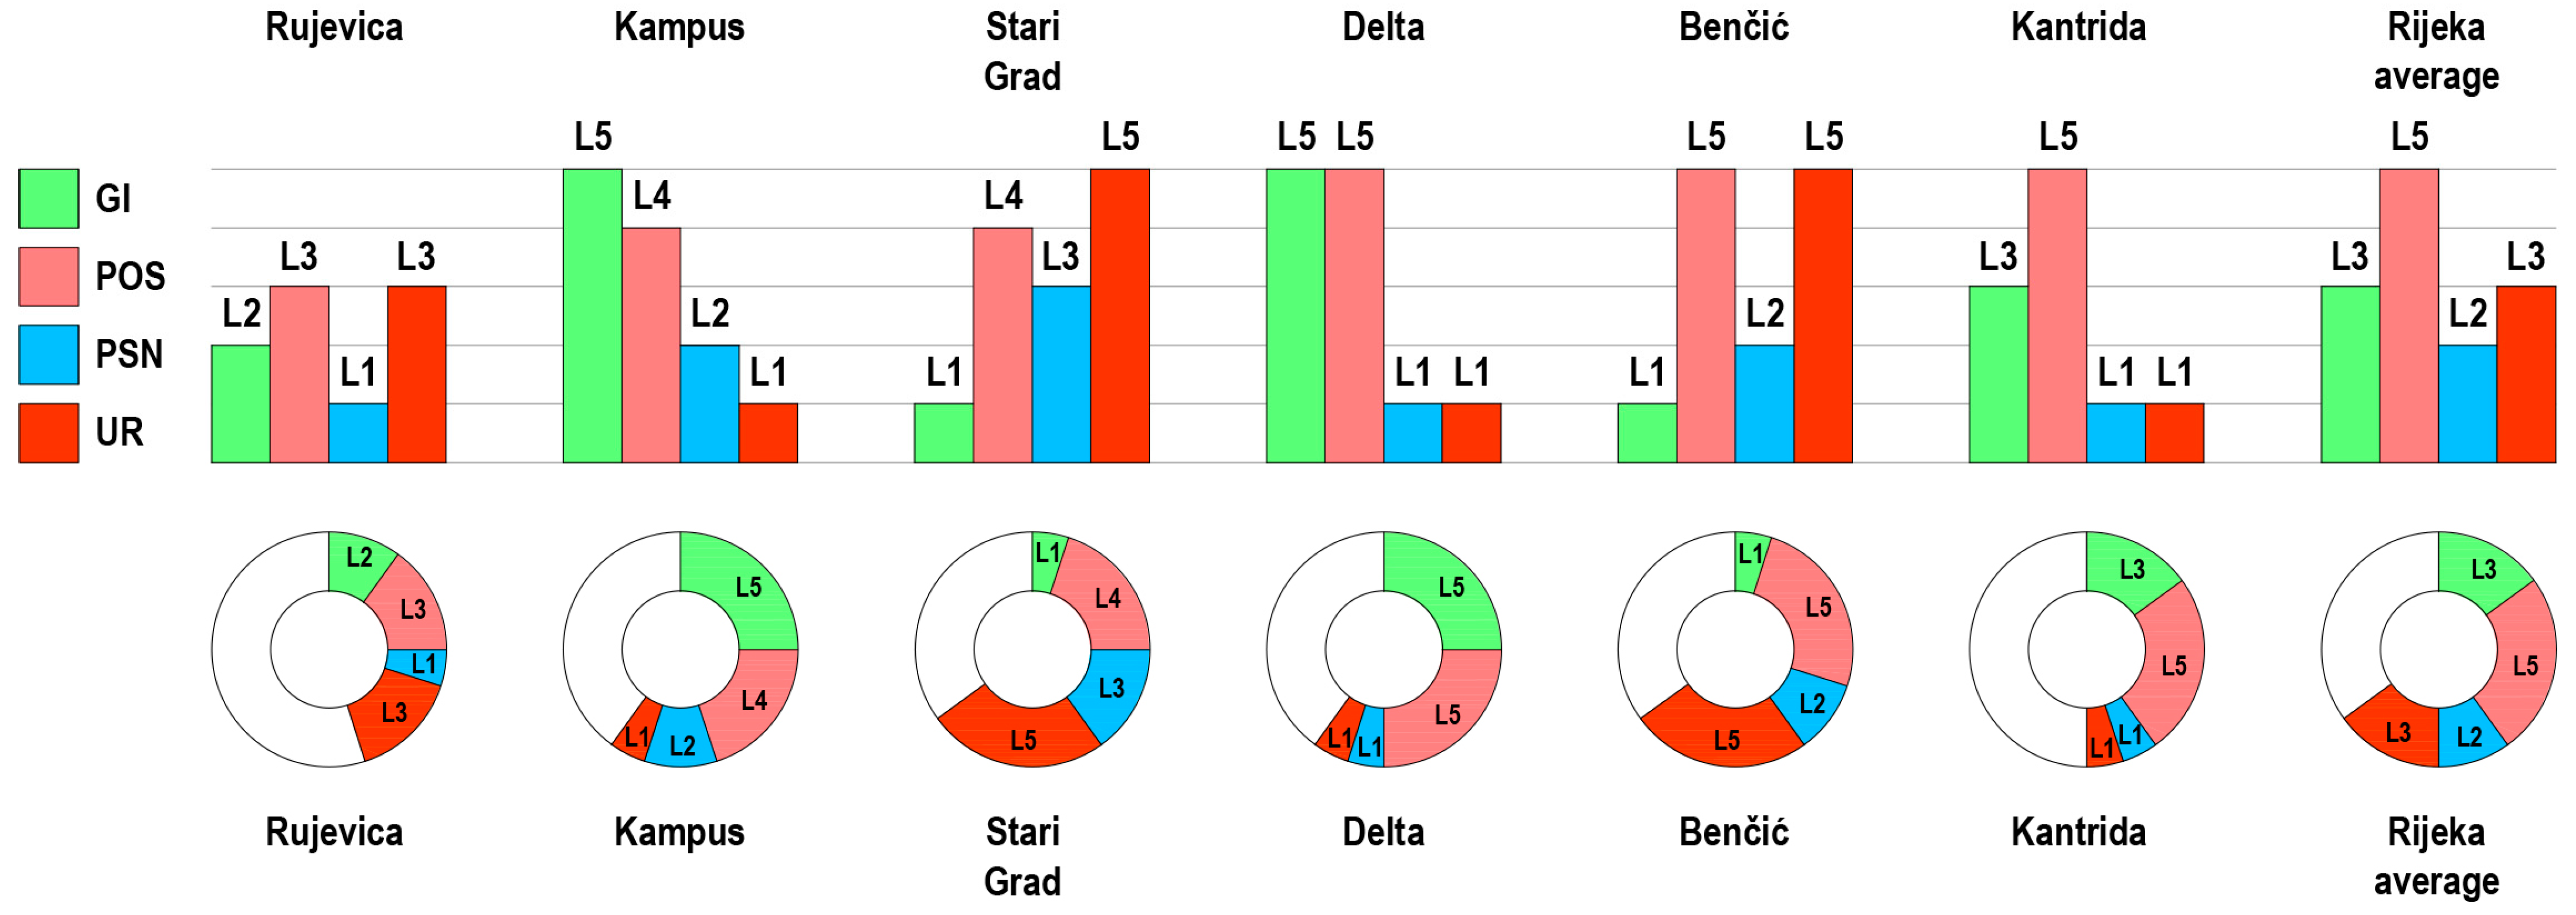
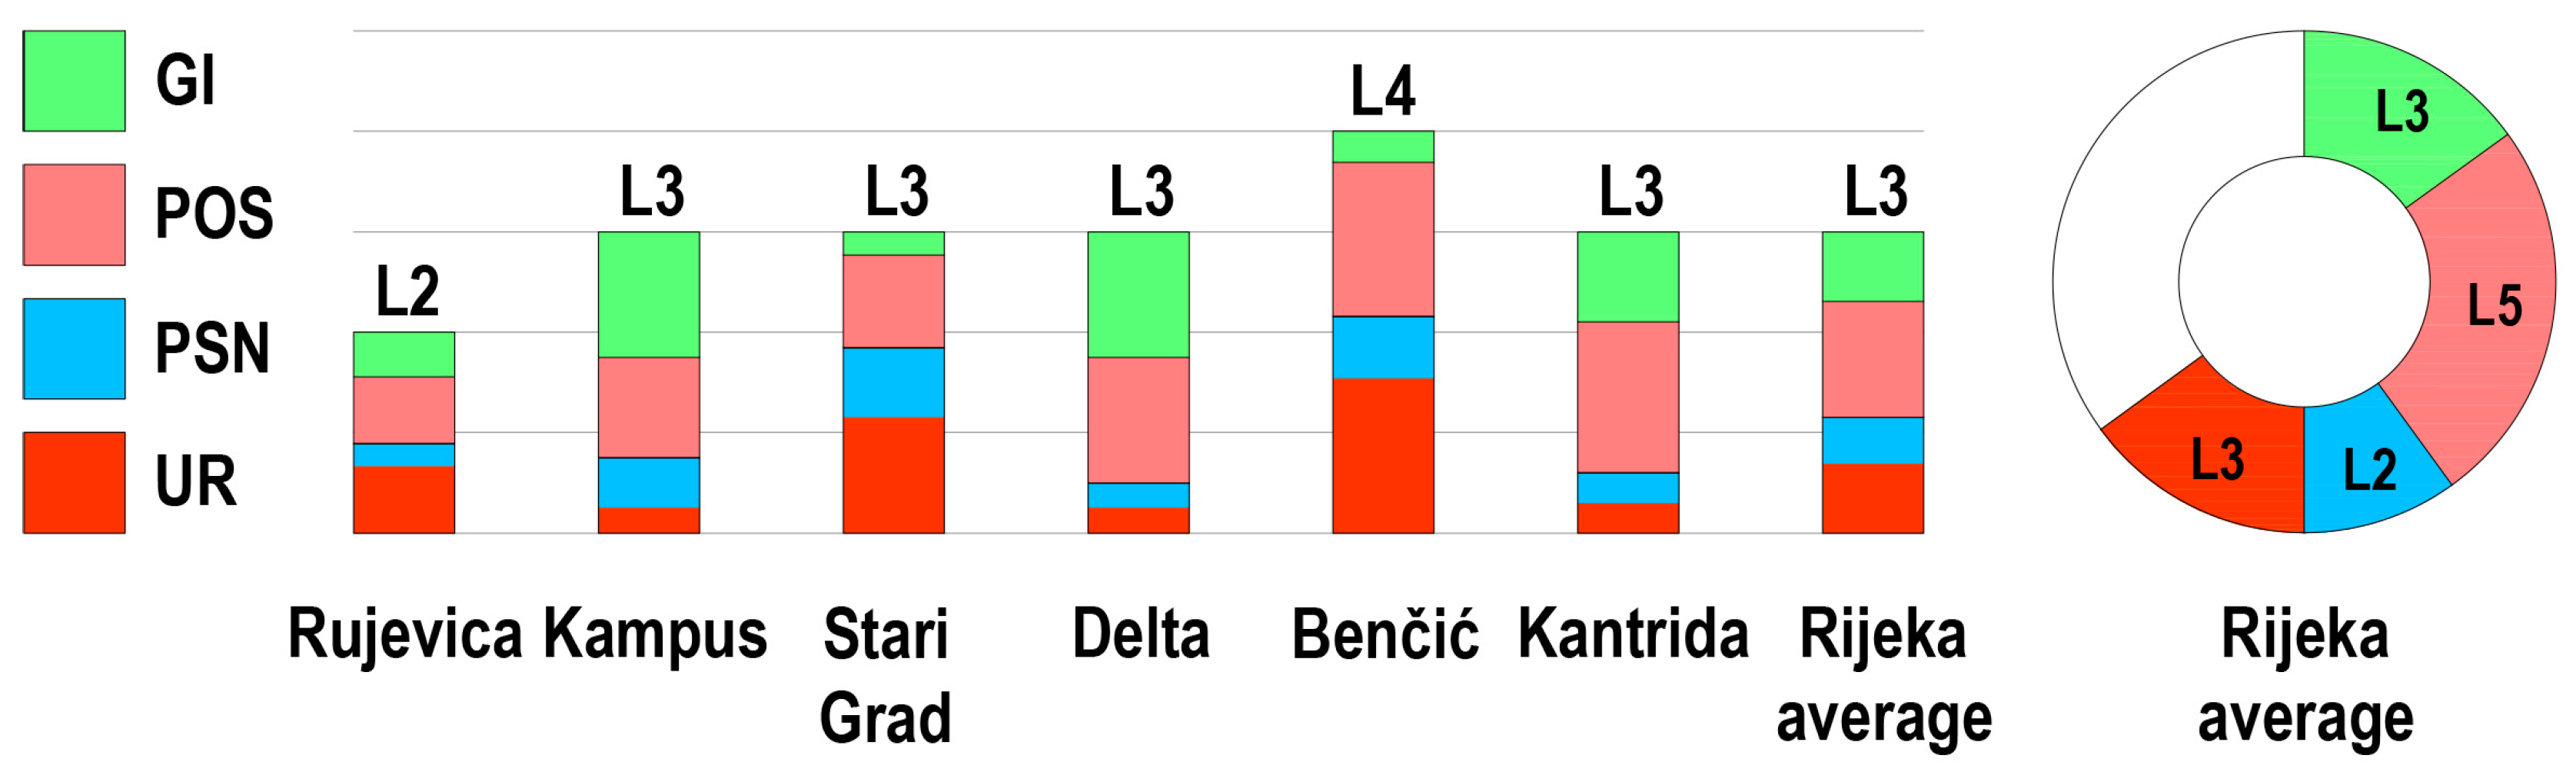
| Ratings | Rujevica | Kampus | Stari Grad | Delta | Benčić | Kantrida | Rijeka Average |
|---|---|---|---|---|---|---|---|
| GI indicator | L2 | L5 | L1 | L5 | L1 | L3 | L3 |
| POS indicator | L3 | L4 | L4 | L5 | L5 | L5 | L5 |
| PSN indicator | L1 | L2 | L3 | L1 | L2 | L1 | L2 |
| UR indicator | L3 | L1 | L5 | L1 | L5 | L1 | L3 |
| NEB indicator | L2 | L3 | L3 | L3 | L4 | L3 | L3 |
Disclaimer/Publisher’s Note: The statements, opinions and data contained in all publications are solely those of the individual author(s) and contributor(s) and not of MDPI and/or the editor(s). MDPI and/or the editor(s) disclaim responsibility for any injury to people or property resulting from any ideas, methods, instructions or products referred to in the content. |
© 2024 by the authors. Licensee MDPI, Basel, Switzerland. This article is an open access article distributed under the terms and conditions of the Creative Commons Attribution (CC BY) license (https://creativecommons.org/licenses/by/4.0/).
Share and Cite
Bilić, B.; Šmit, K. Evaluation of the New European Bauhaus in Urban Plans by Land Use Occurrence Indicators: A Case Study in Rijeka, Croatia. Buildings 2024, 14, 1058. https://doi.org/10.3390/buildings14041058
Bilić B, Šmit K. Evaluation of the New European Bauhaus in Urban Plans by Land Use Occurrence Indicators: A Case Study in Rijeka, Croatia. Buildings. 2024; 14(4):1058. https://doi.org/10.3390/buildings14041058
Chicago/Turabian StyleBilić, Bojan, and Krunoslav Šmit. 2024. "Evaluation of the New European Bauhaus in Urban Plans by Land Use Occurrence Indicators: A Case Study in Rijeka, Croatia" Buildings 14, no. 4: 1058. https://doi.org/10.3390/buildings14041058
APA StyleBilić, B., & Šmit, K. (2024). Evaluation of the New European Bauhaus in Urban Plans by Land Use Occurrence Indicators: A Case Study in Rijeka, Croatia. Buildings, 14(4), 1058. https://doi.org/10.3390/buildings14041058