


Daylight Availability of Living Rooms in Dense Residential Areas under Current Planning Regulations: A Cross-Region Case Study in China


Abstract
:1. Introduction

| Year | Standards | Region | Metric | Date | Time | Sky Model |
|---|---|---|---|---|---|---|
| 2013 | GB 50033-2013 Standard of daylighting design of buildings [14] | China | DF | 10:00–14:00 | Overcast sky | |
| Illuminance | ||||||
| 2016 | CASBEE—New construction (2016 Edition) [18] | Japan | DF | Overcast sky | ||
| 2019 | GB/T 50378-2019 Assessment standard for green building [19] | China | DF | Overcast sky | ||
| DA300 for 60% of the occupied area, four hours per day on average | TMY | |||||
| 2020 | DGNB System—New buildings criteria set 2020 [21] | Germany | DF | Overcast sky | ||
| Color rendering index Ra | ||||||
| Annual relative useful exposure | Annual | 7:00–18:00 | ||||
| 2021 | LEED v4.1 BUILDING DESIGN AND CONSTRUCTION [36] | U.S. | sDA300,50% | Annual | 8:00–18:00 | TMY |
| ASE1000,250 | Annual | 8:00–18:00 | TMY | |||
| Illuminance | Equinox | 9:00–15:00 | Clear sky | |||
| 2021 | BREEAM International New Construction Version 6.0 [15] | U.K. | DF | Overcast sky | ||
| Uniformity | ||||||
| 2022 | EN 17037:2018+A1:2021 Daylight in buildings [16] | Europe | DF | Overcast sky | ||
| Illuminance | Annual | TMY | ||||
| Daylight Glare Probability | Annual | |||||
| 2023 | WELL v2 Q4 2023 [22] | U.S. | sDA300,50% | Annual | 8:00–18:00 | TMY |
- Under local daylight climates, does current local housing estate planning allow the living room to comply with the generic daylight requirements?
- What is the compliance with the current standards of DF and sDA300,50%?
- What is the potential of UDI?
- What is the difference in the variation pattern of daylight availability throughout months under different daylight climates?
- Under local daylight climates, can current local housing estate planning help to satisfy the need for circadian lighting in the living room by daylight only?
2. Materials and Methods
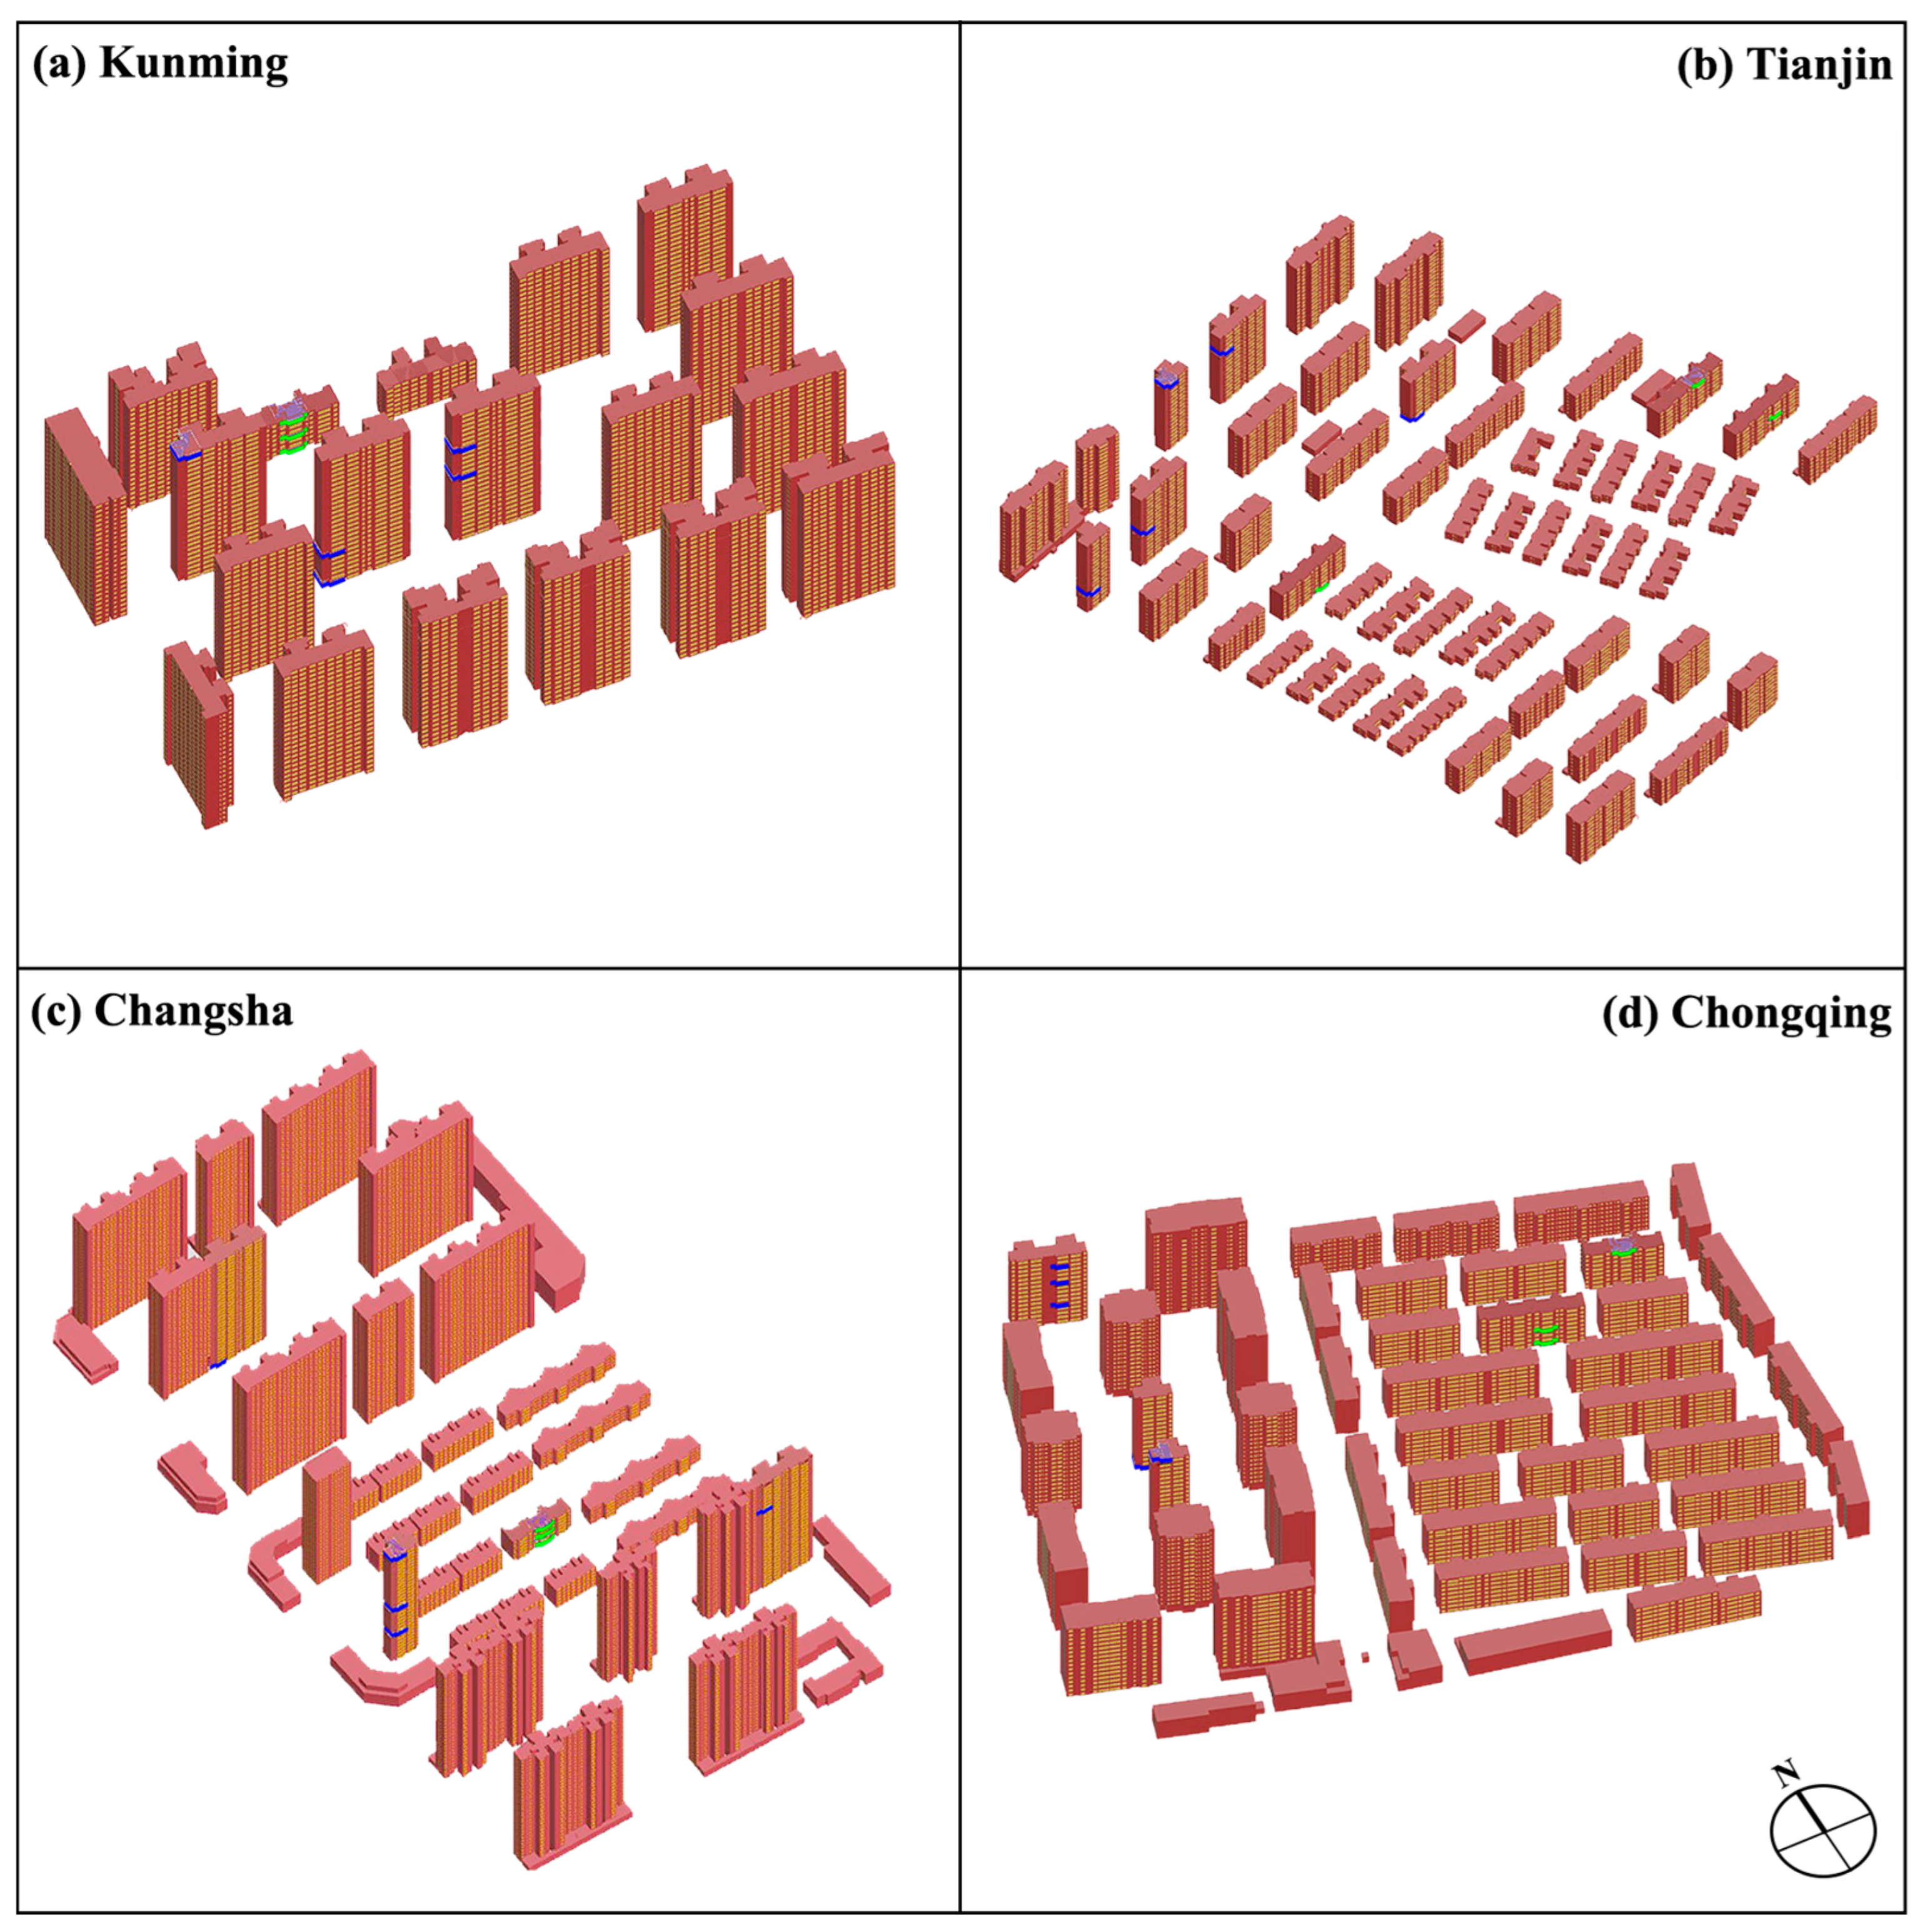
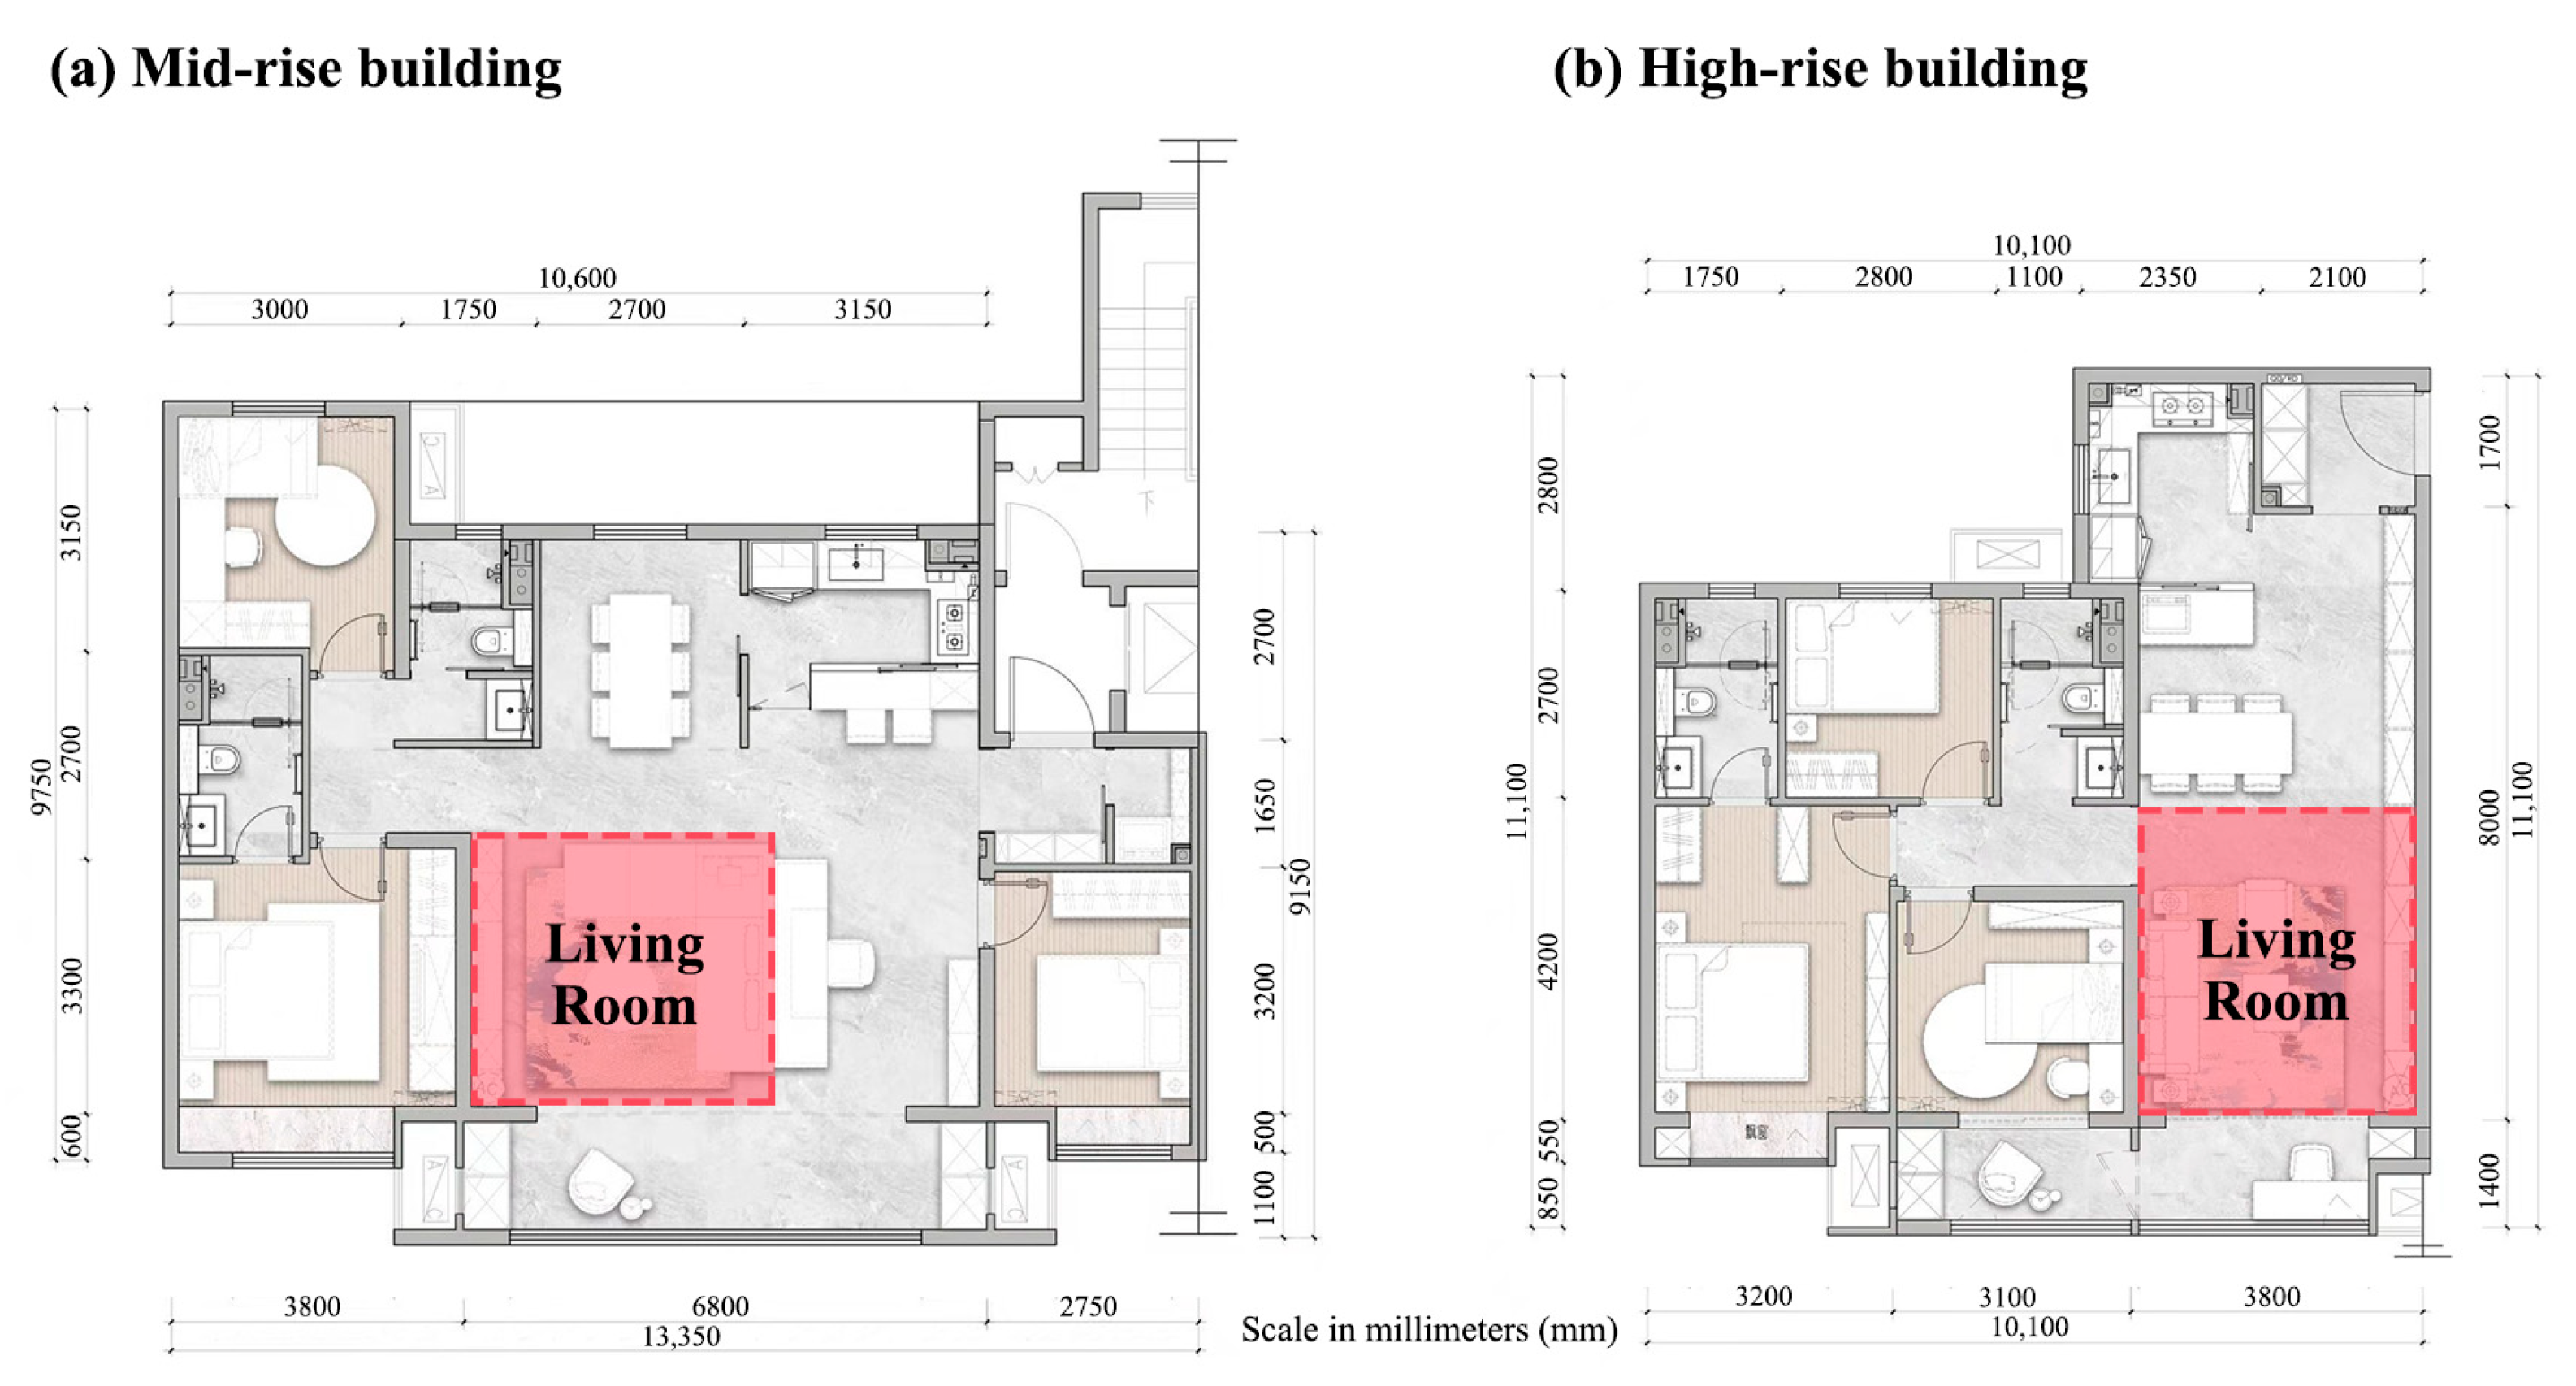
2.1. General Characteristics of Estates’ Bases
2.2. Simulation Models
2.3. Daylight Simulations
3. Results
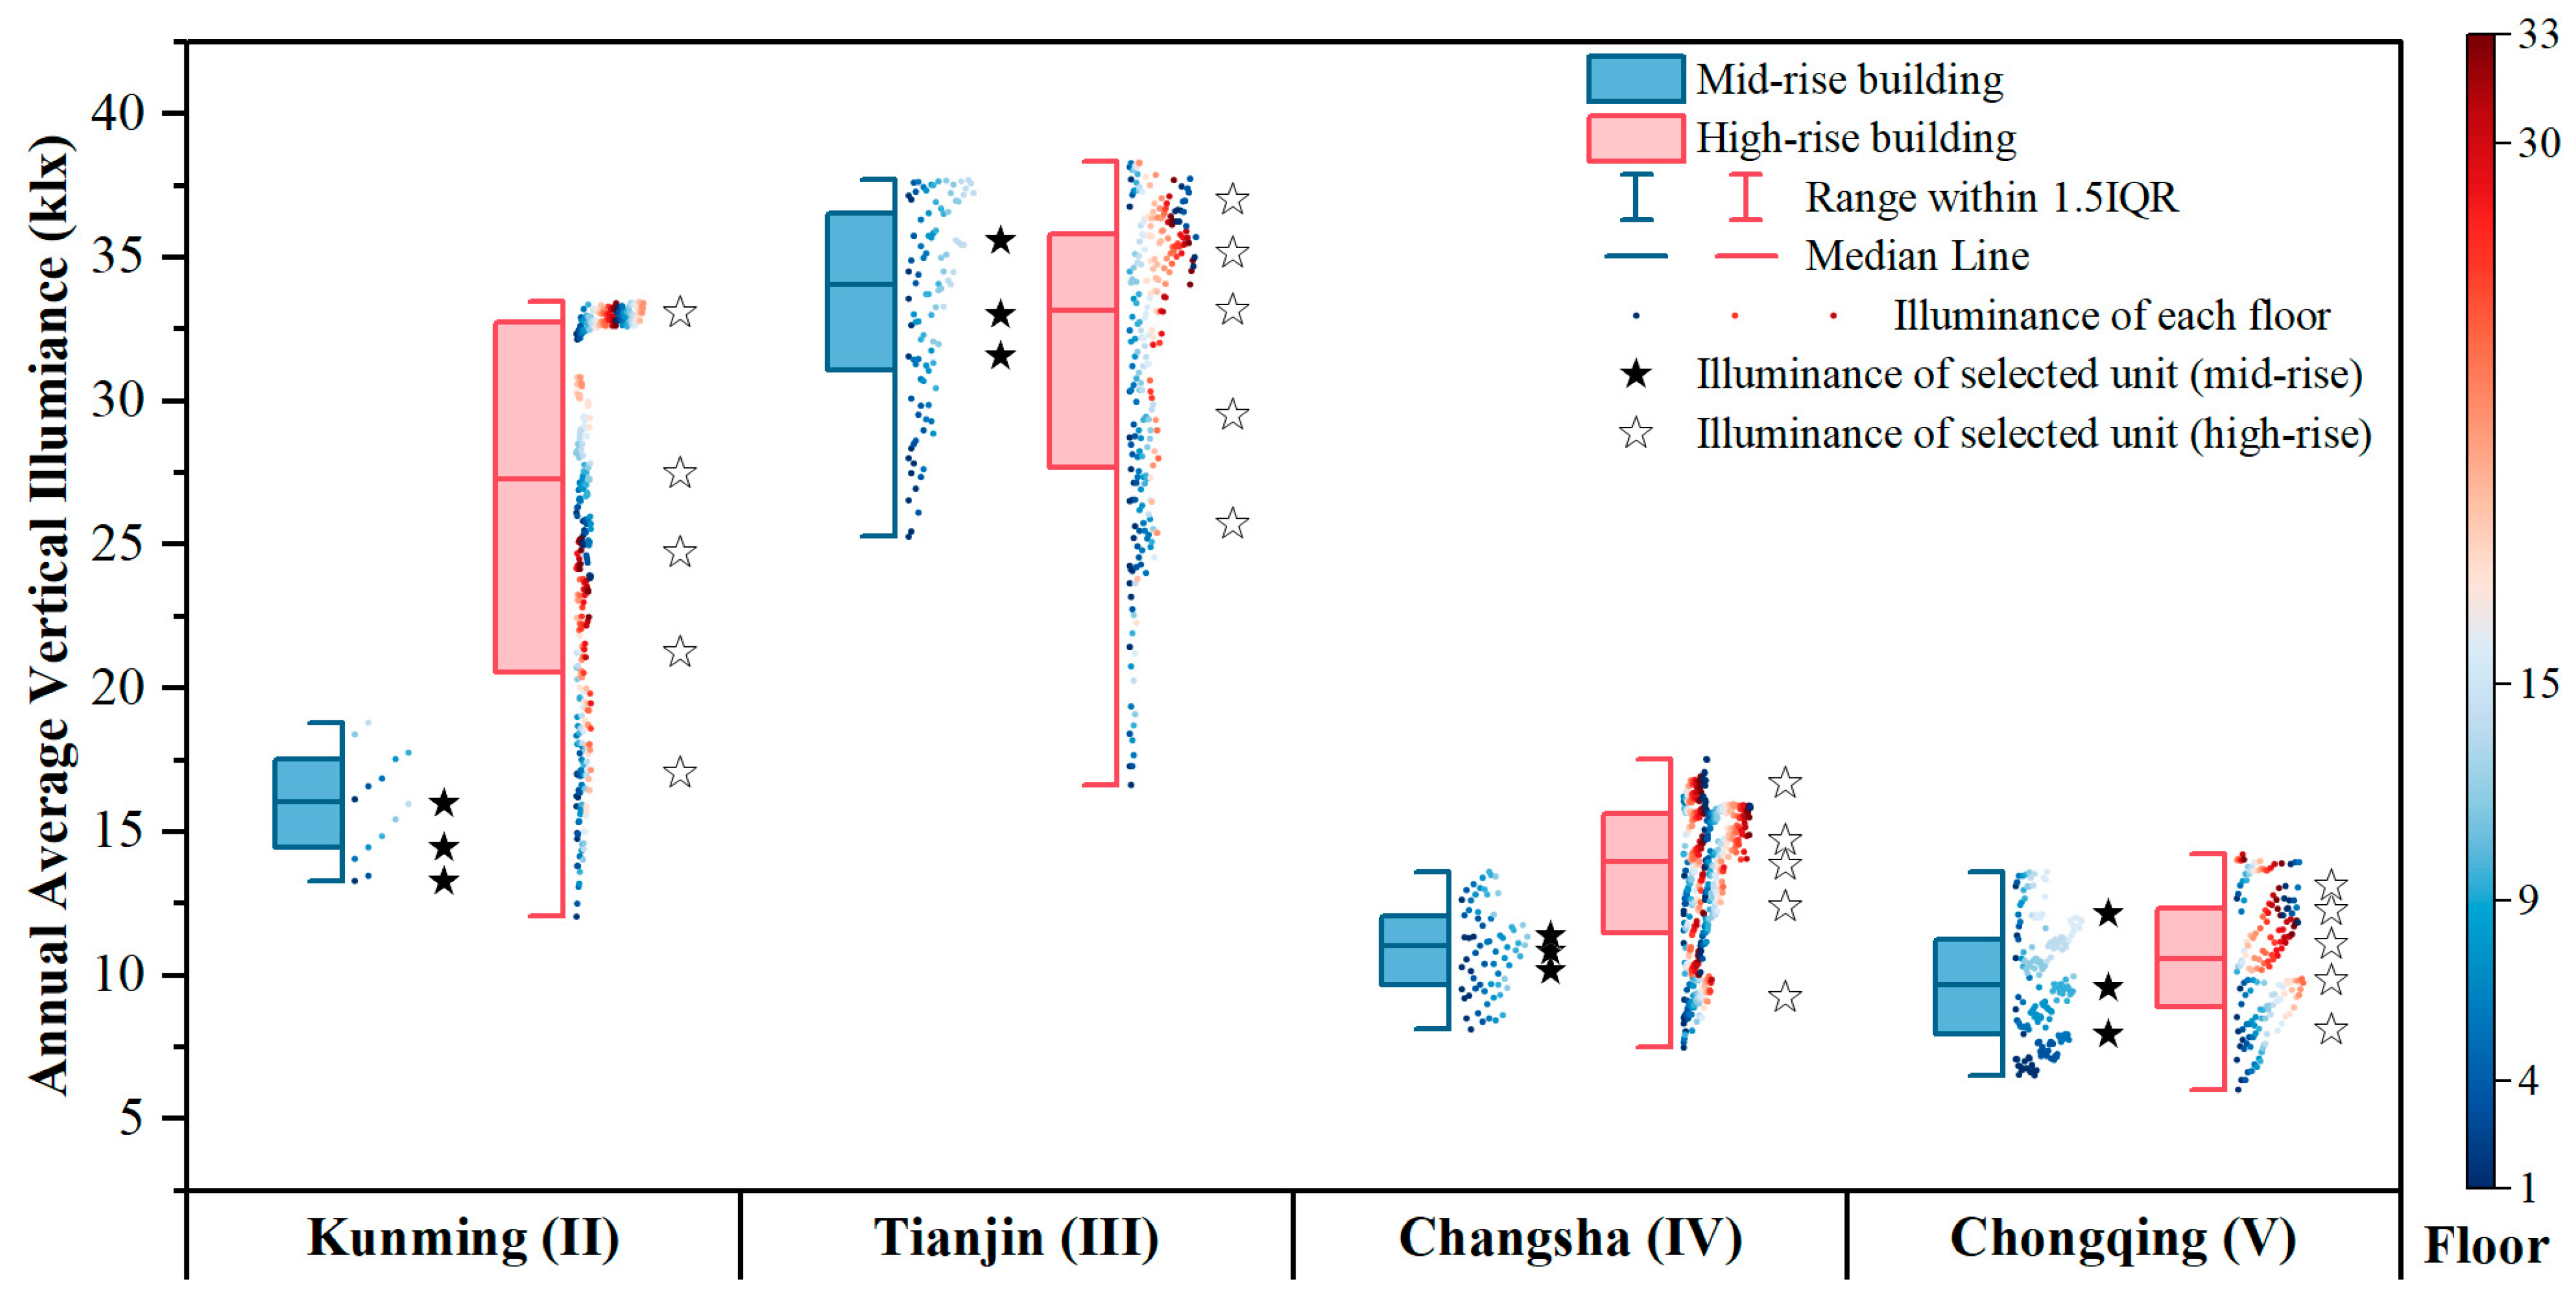
3.1. General Distribution of Daylight Availability within Each Estate
3.2. Daylight Compliance
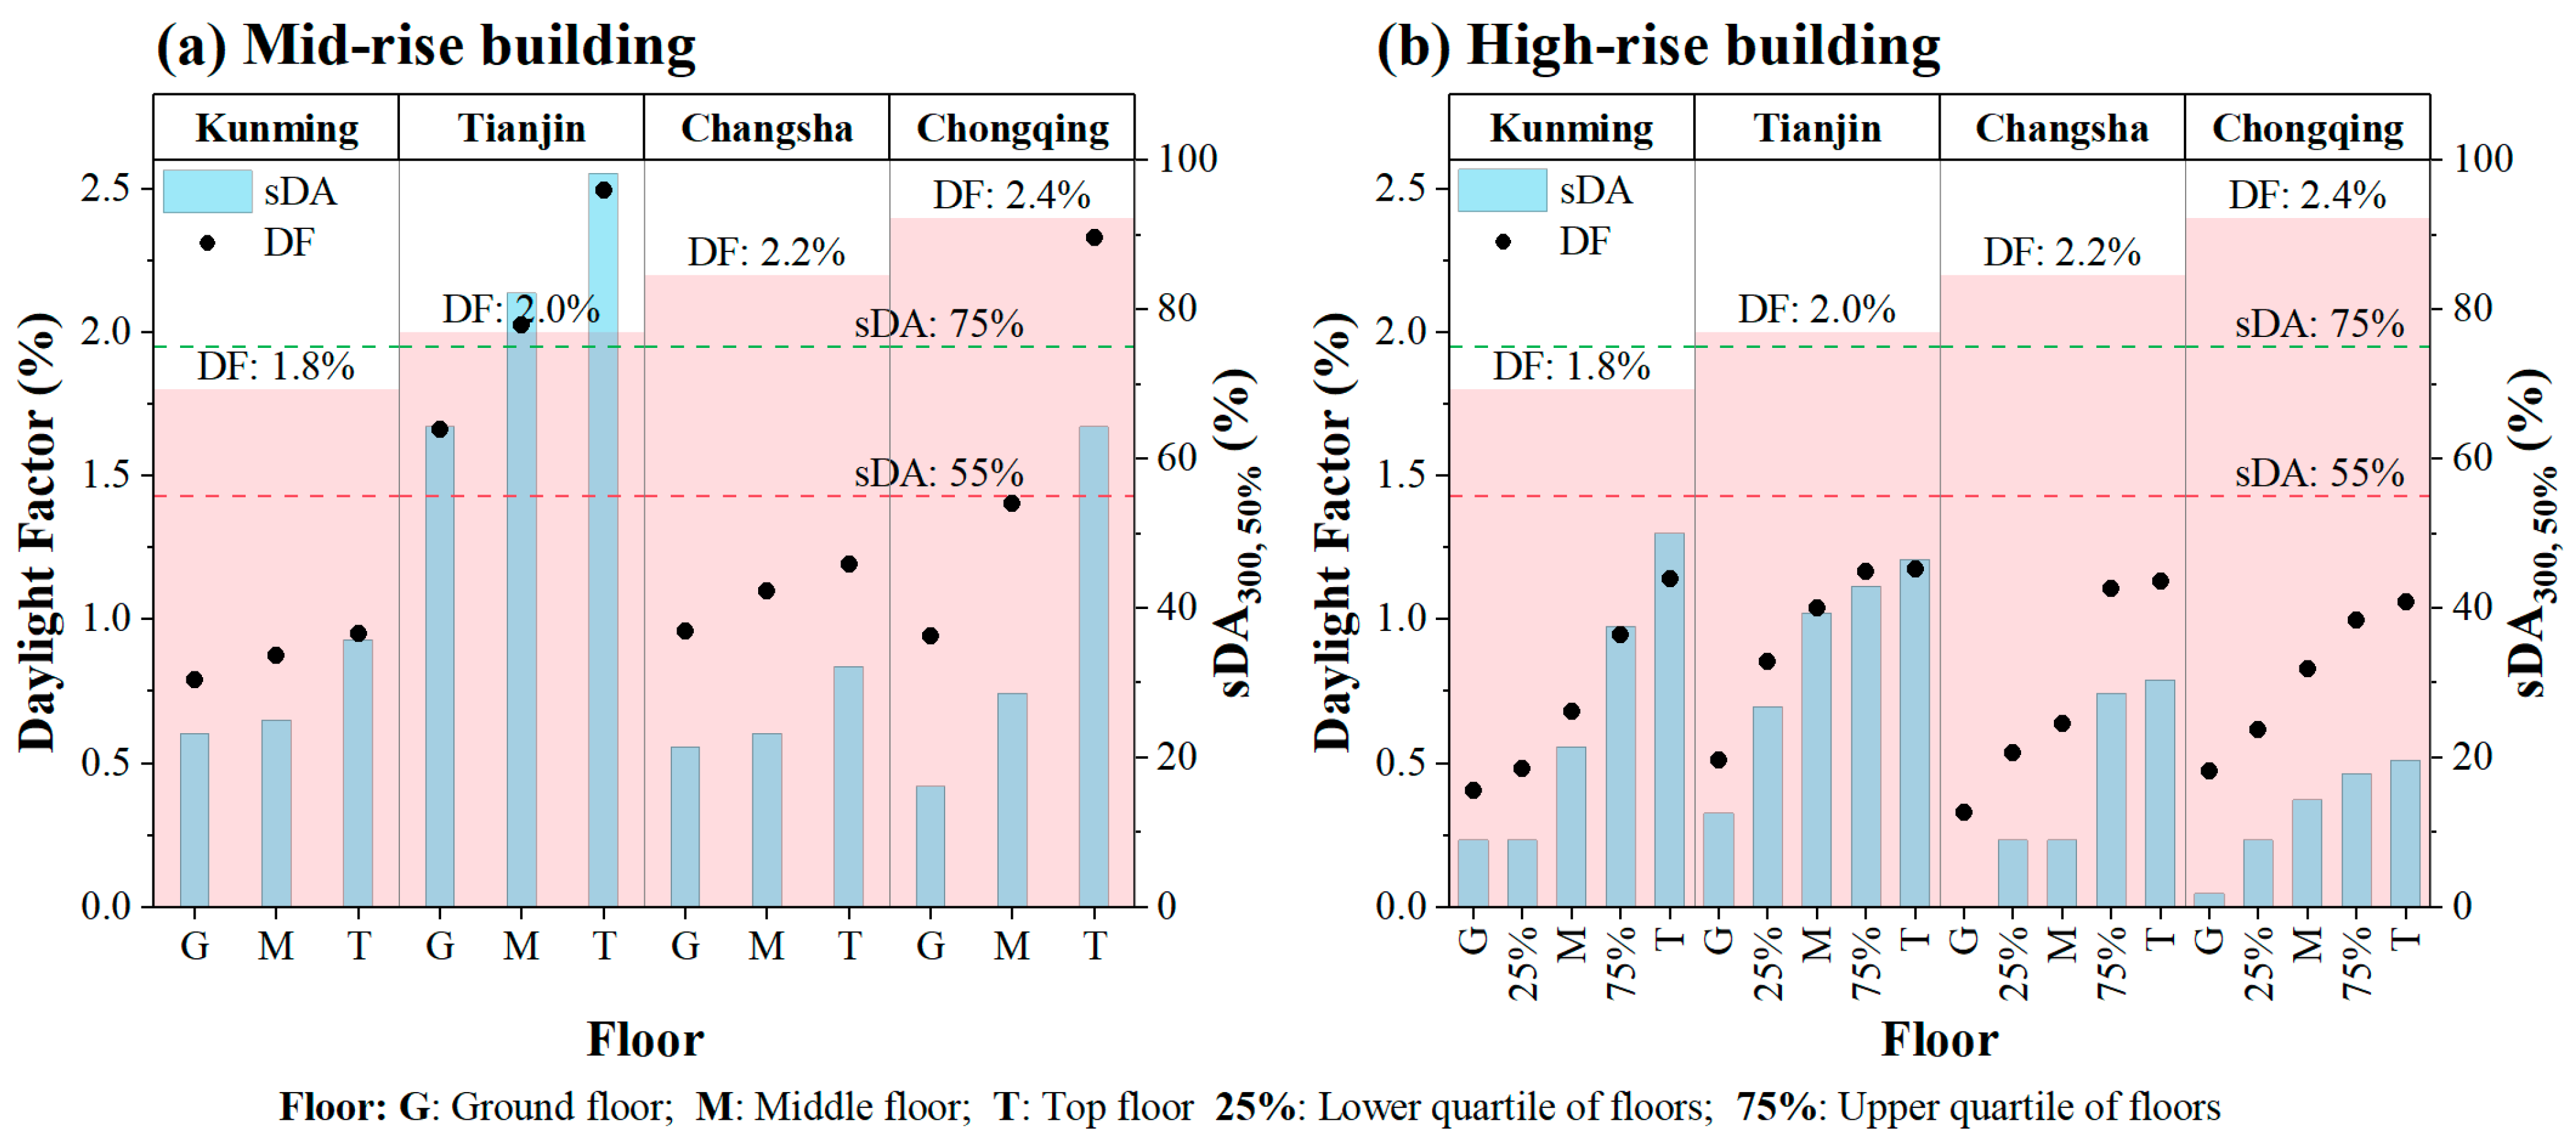
3.2.1. Daylight Compliance with Current Standards
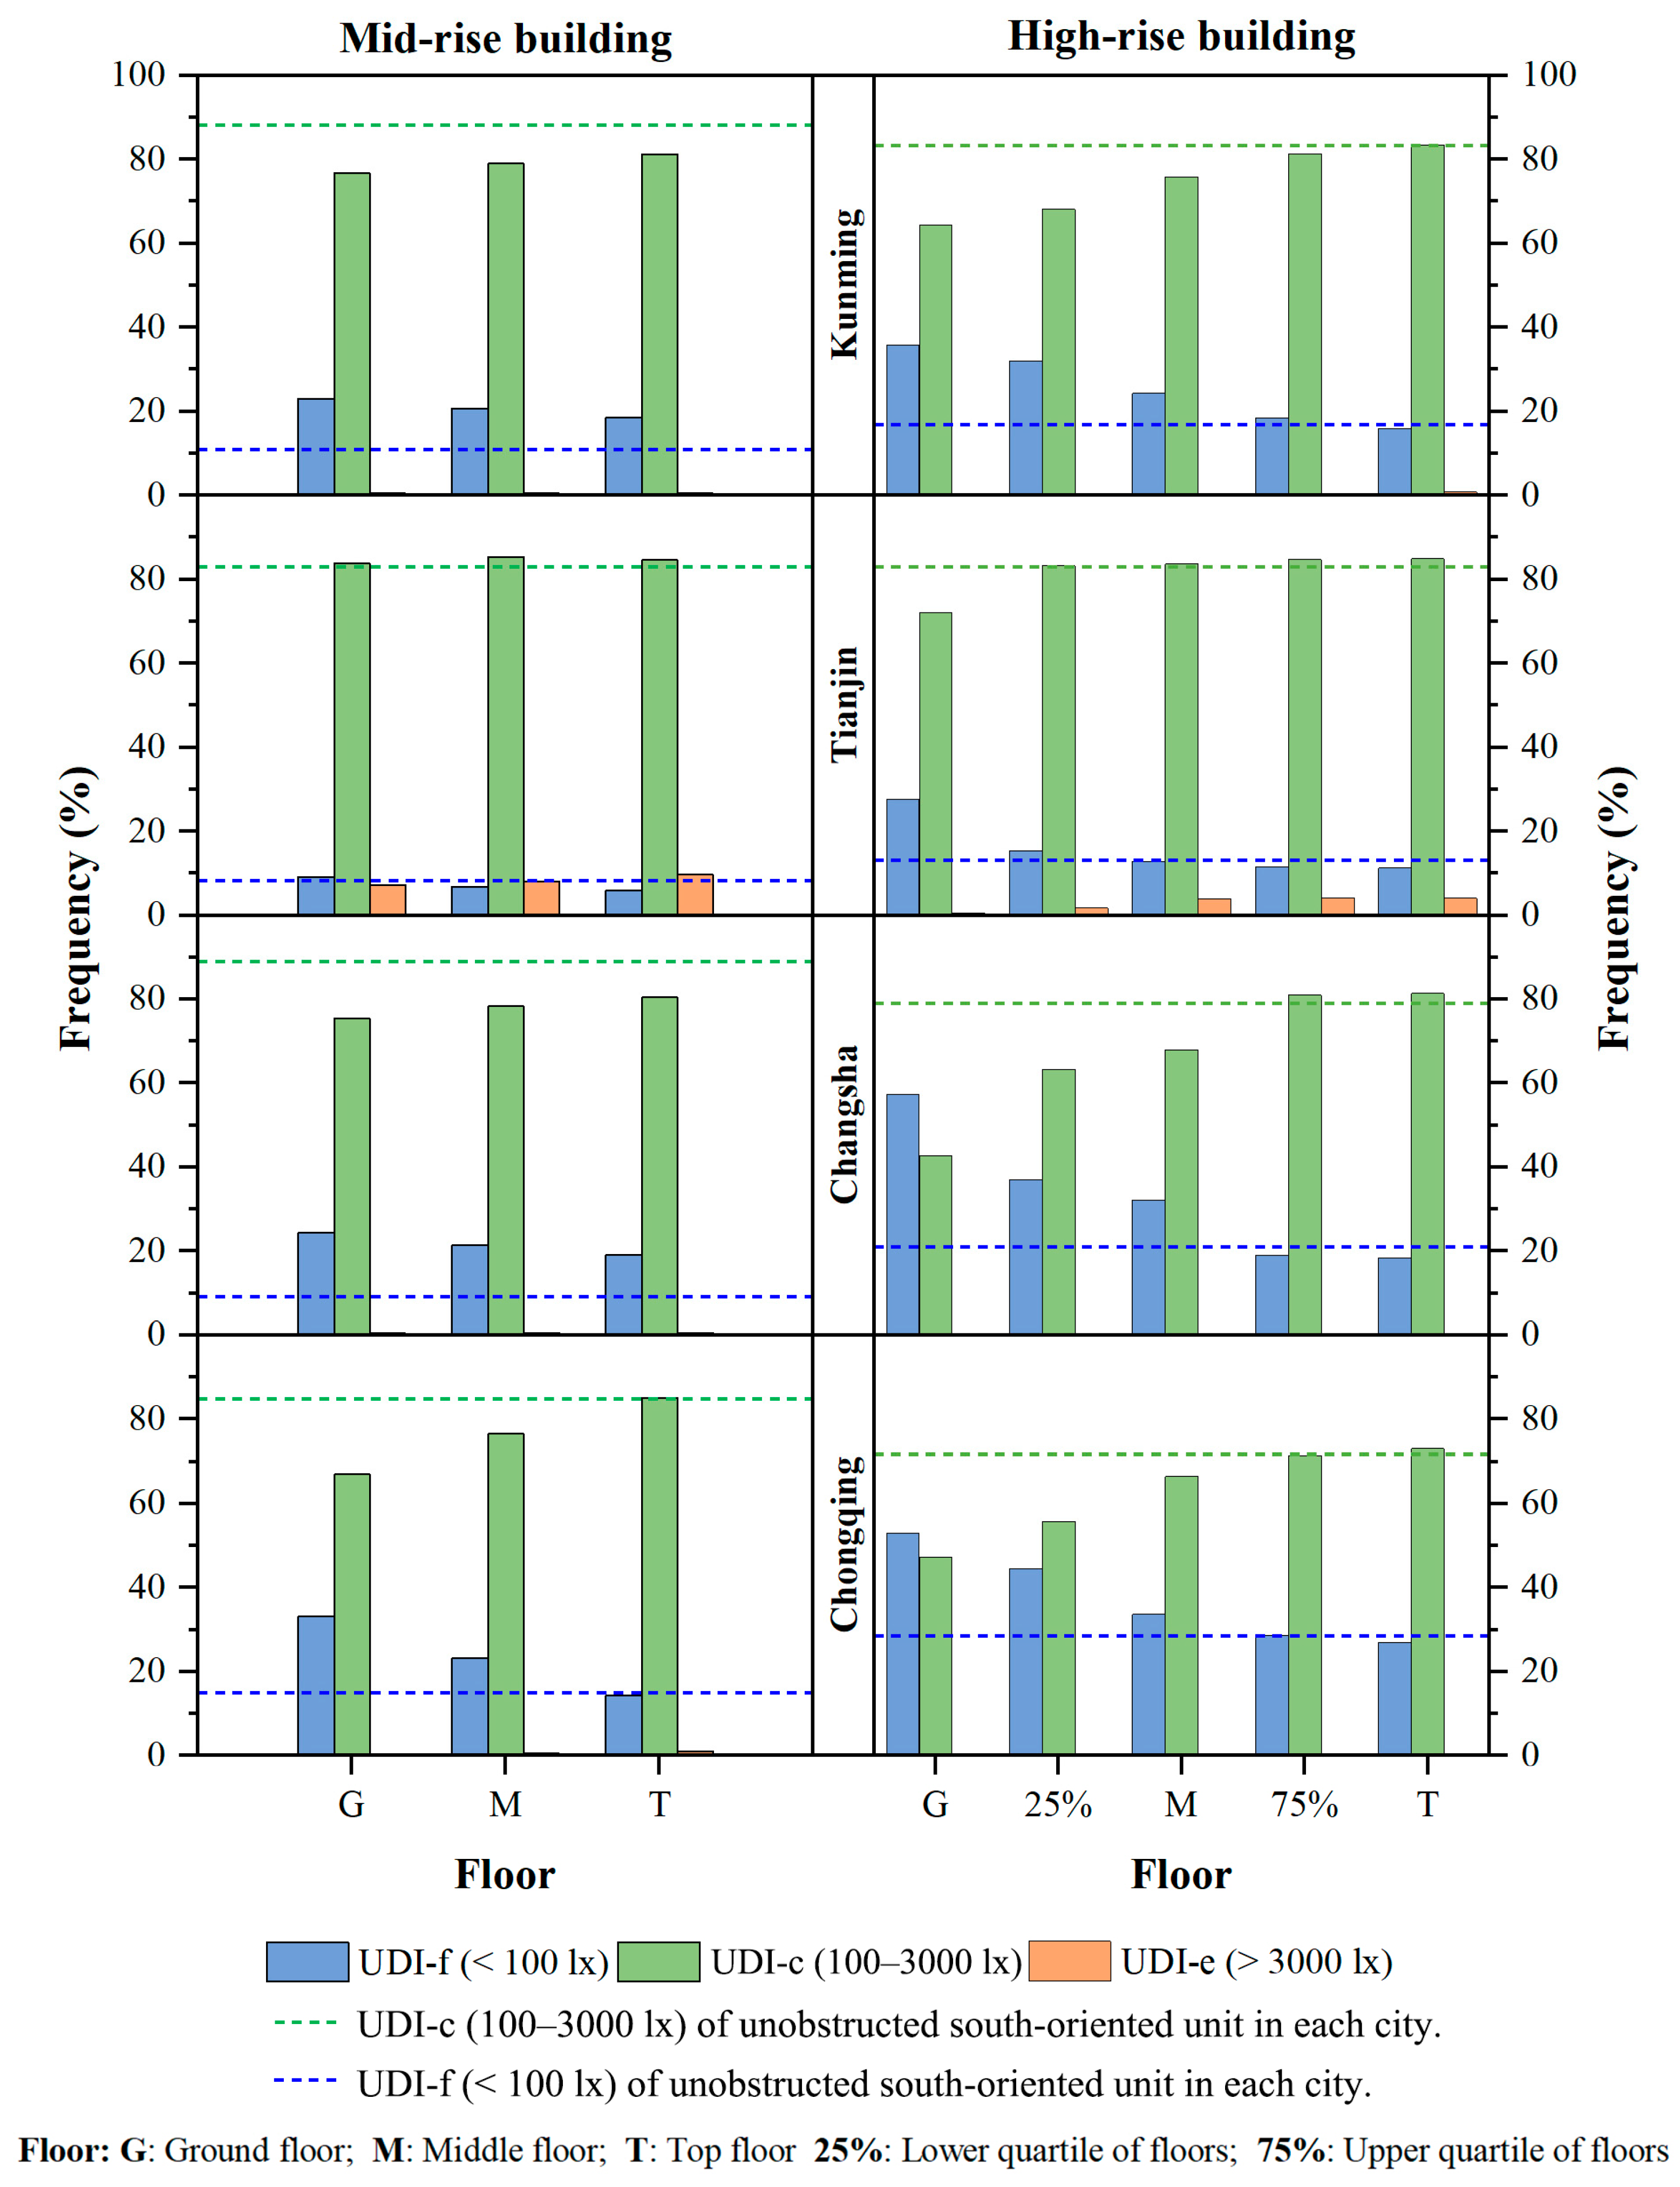
3.2.2. Useful Daylight Illuminance Analysis
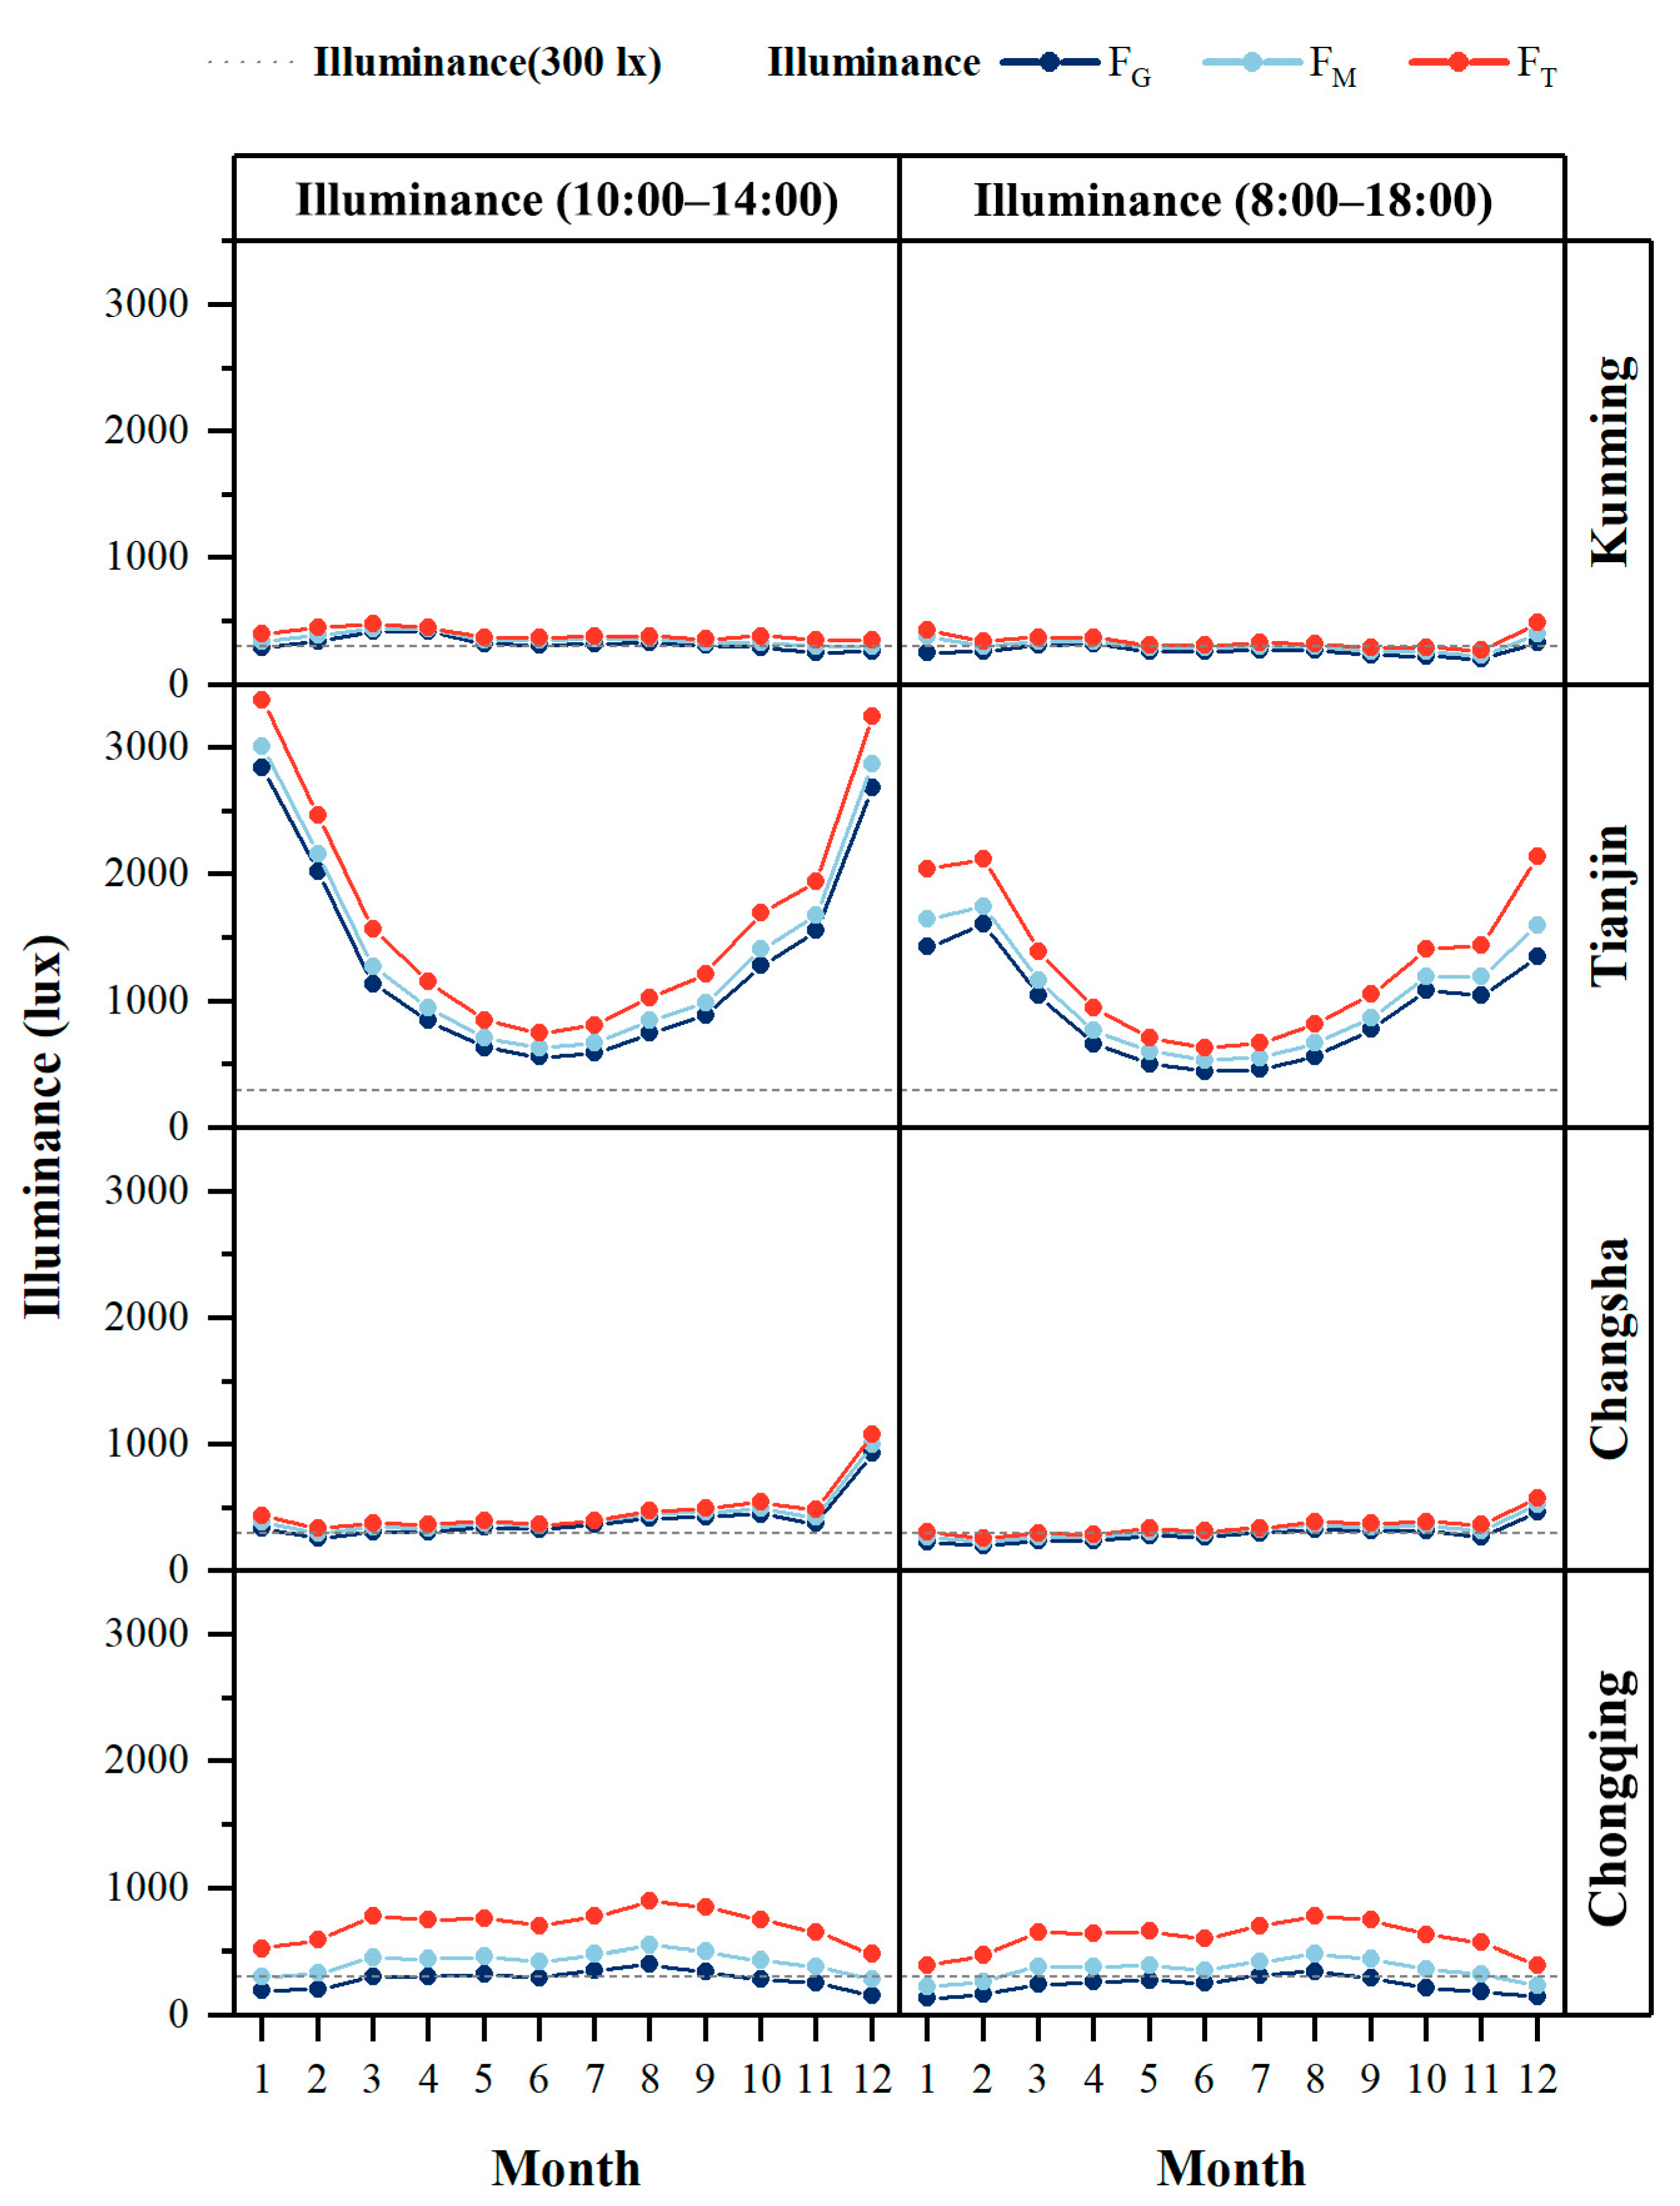
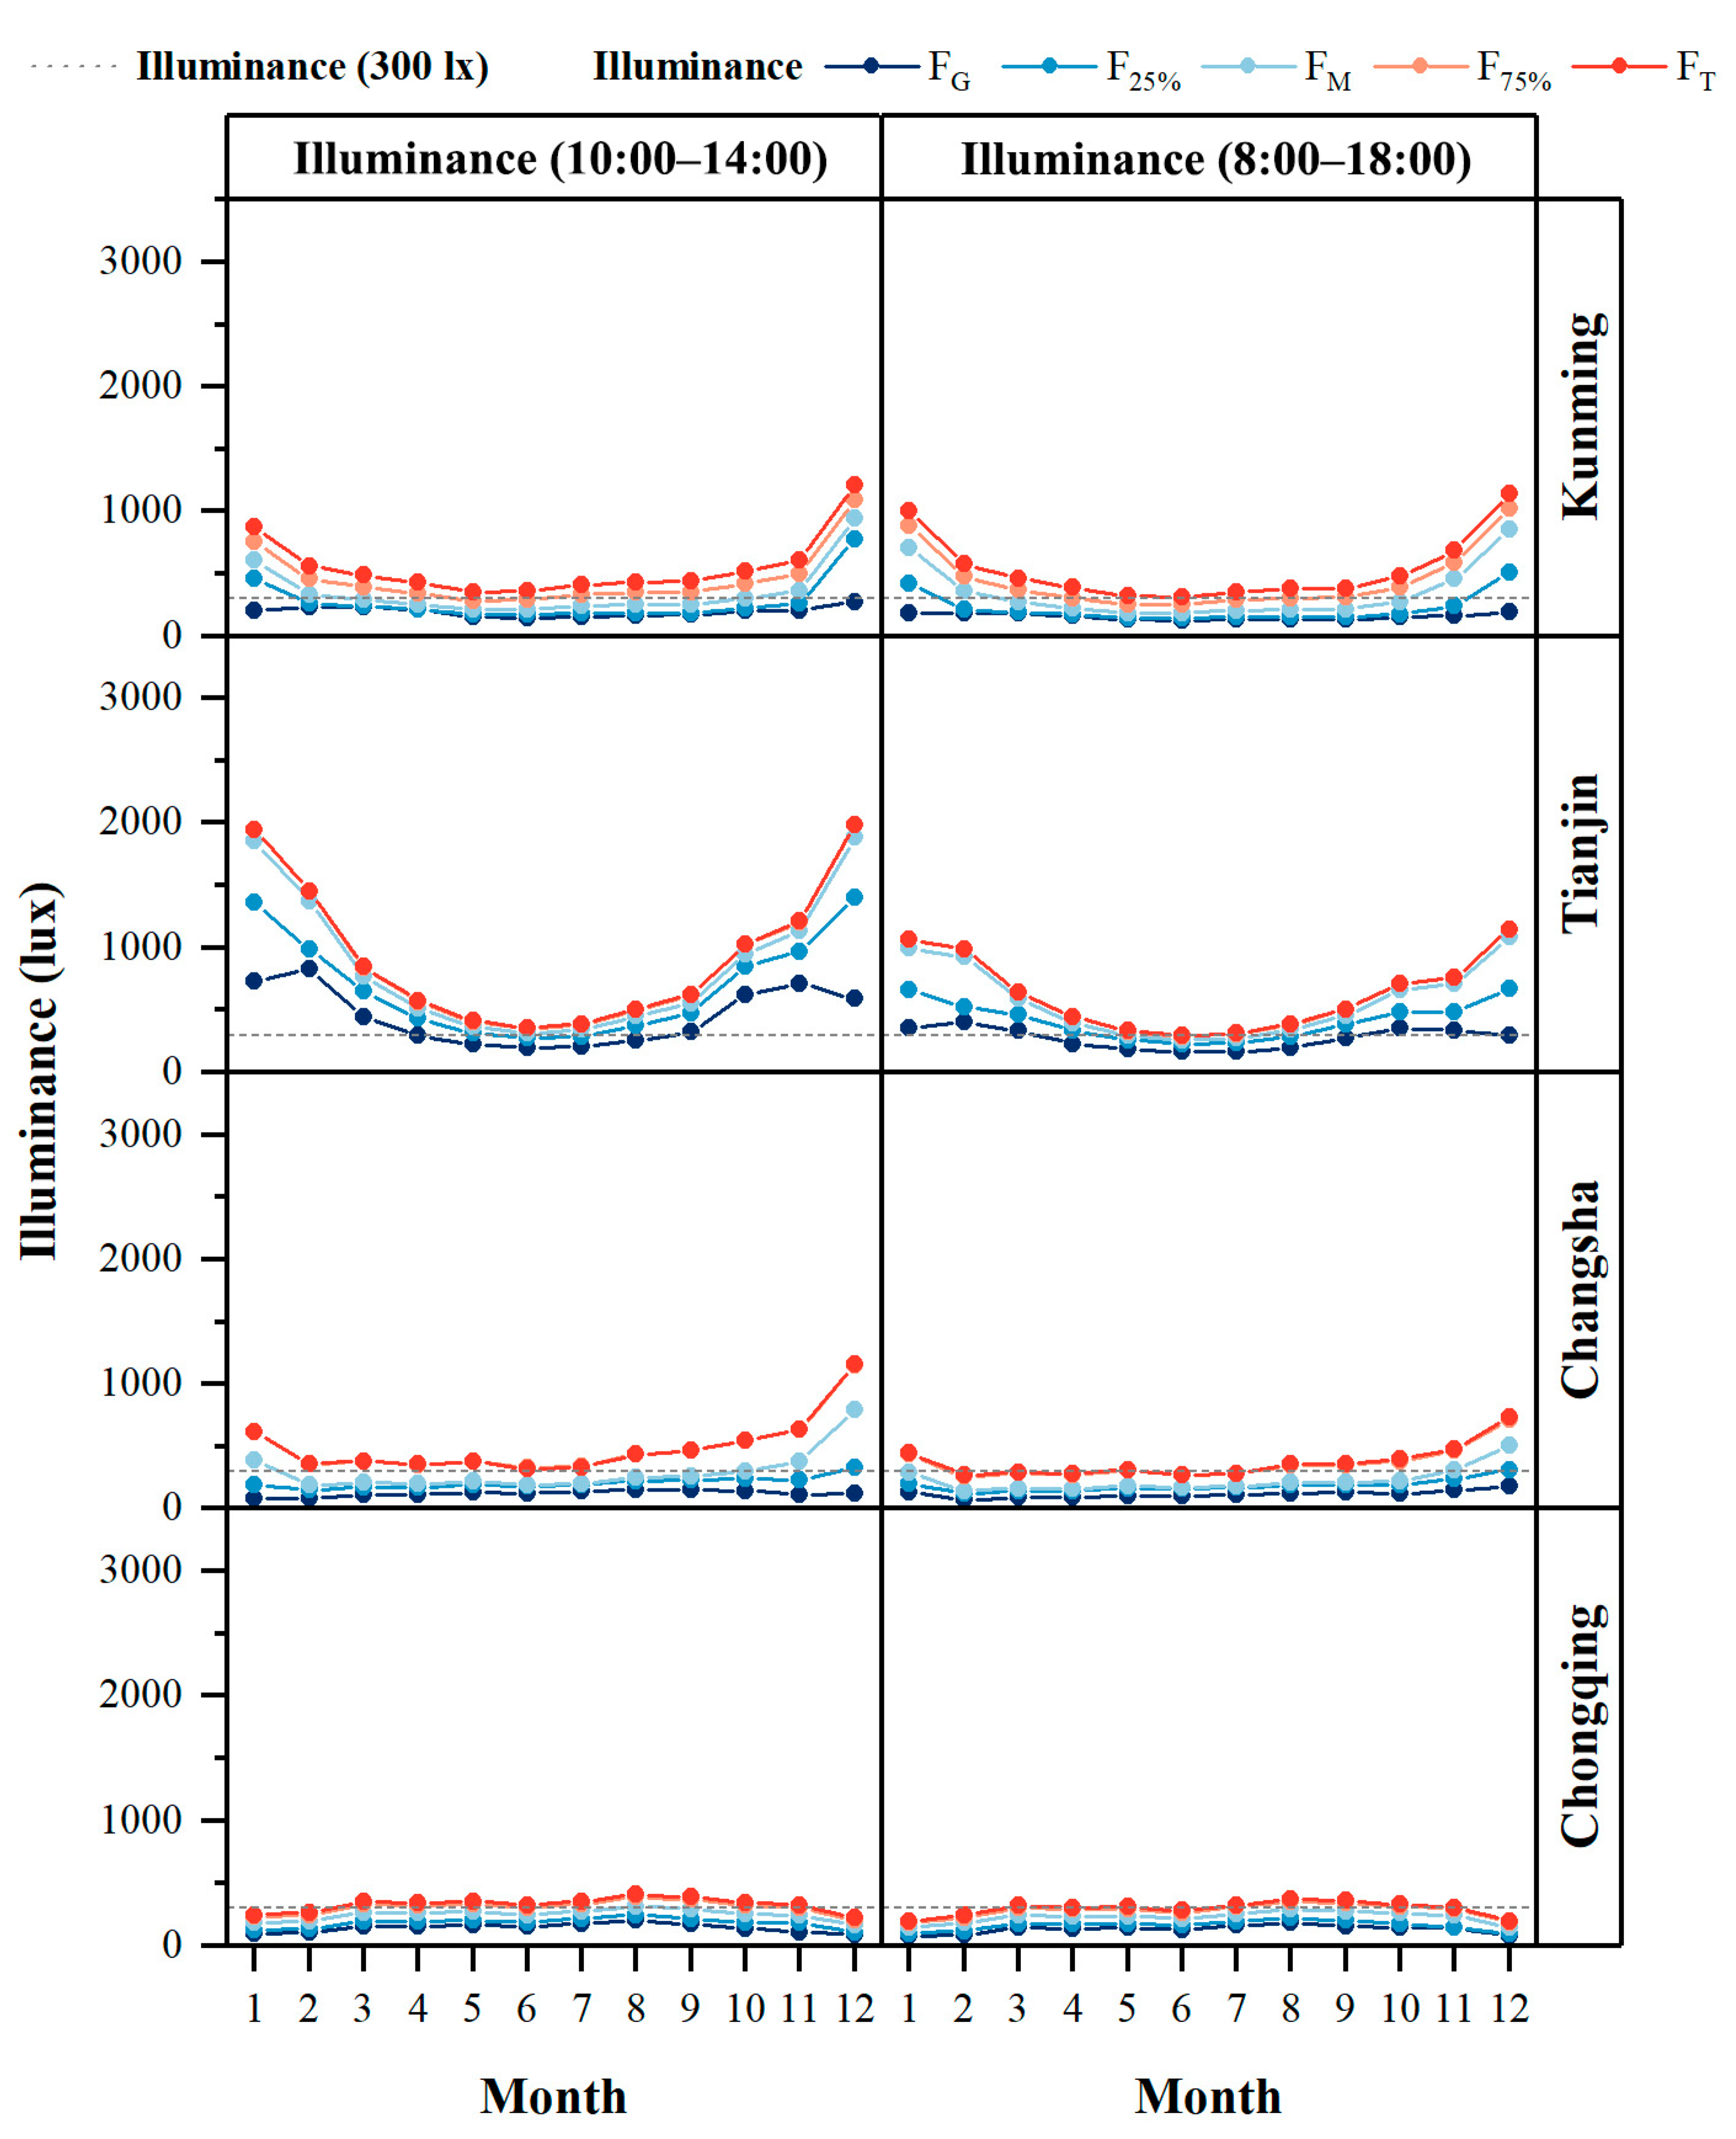
3.2.3. Monthly Analysis
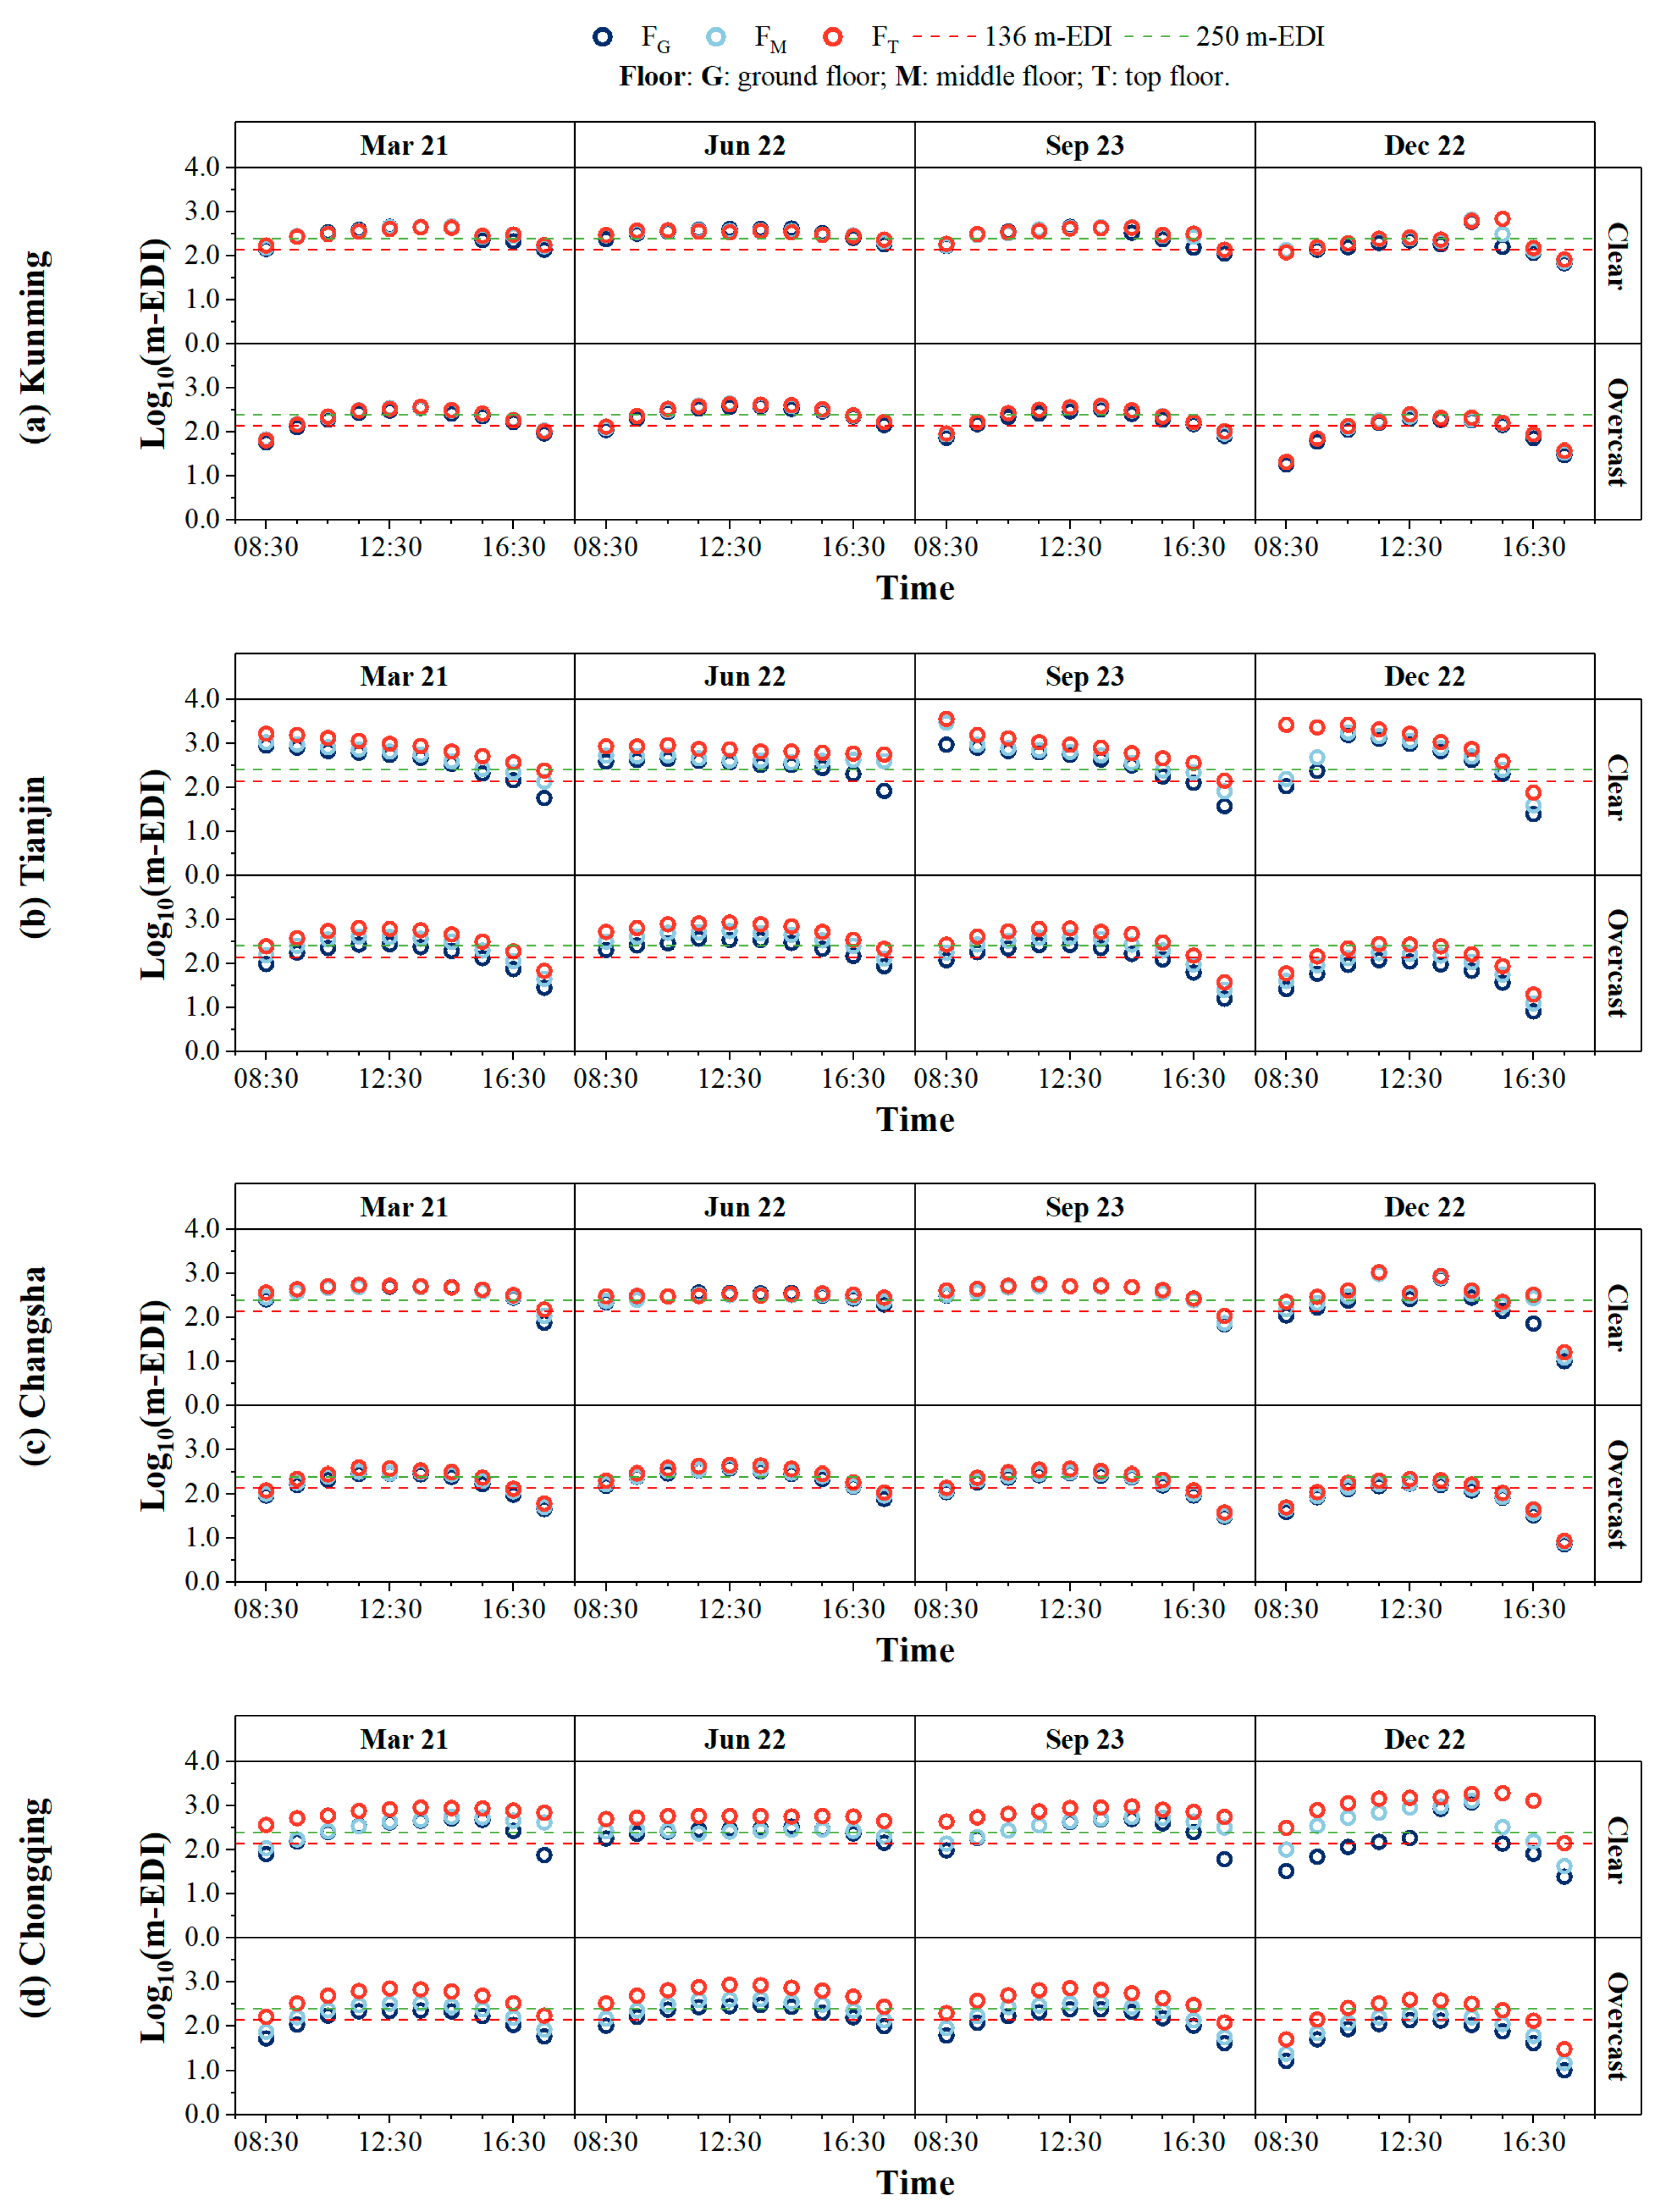
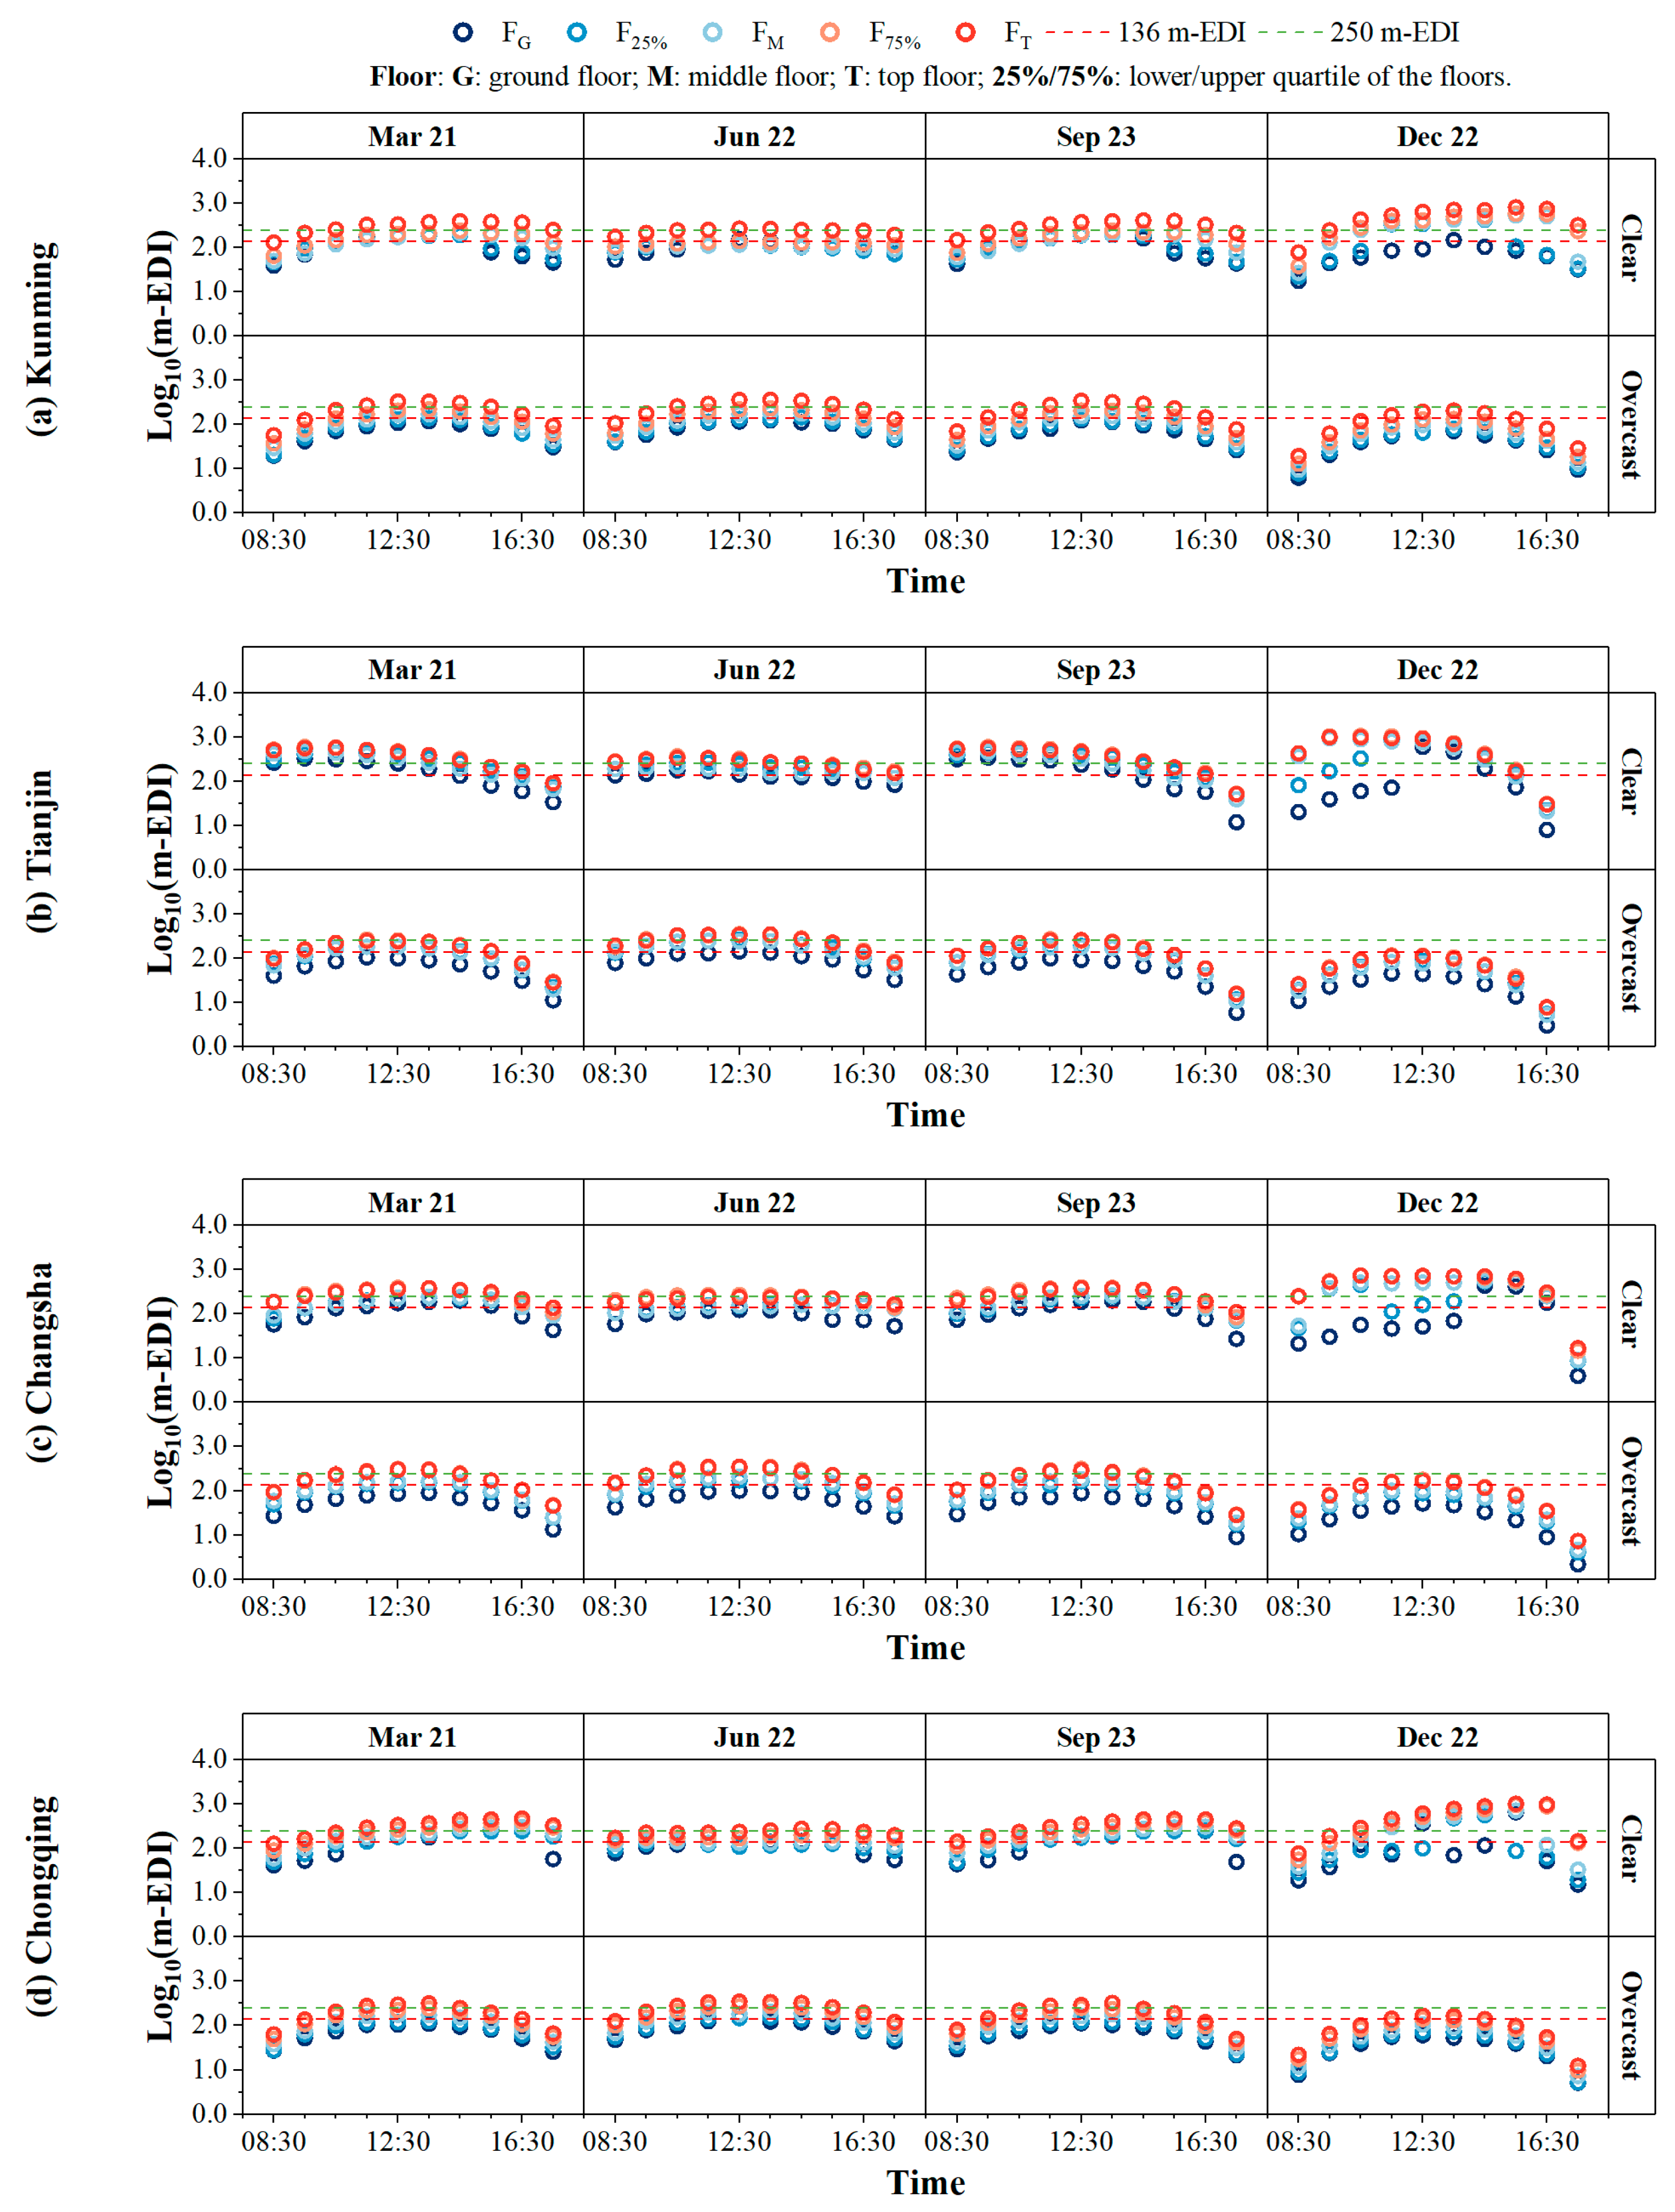
3.3. Circadian Daylighting
4. Discussion
5. Conclusions
Author Contributions
Funding
Data Availability Statement
Acknowledgments
Conflicts of Interest
Glossary
| Group 1: Interior daylighting | |
| ASE | Annual sunlight exposure |
| CBDM | Climate-based daylight modelling |
| CS | Circadian stimulus |
| DCZ | Daylight climate zone |
| DF | Daylight factor |
| EML | Equivalent melanopic illuminance |
| m-EDI | Melanopic equivalent daylight illuminance |
| sDA | Spatial daylight autonomy |
| TMY | Typical meteorological year |
| UDI | Useful daylight illuminance |
| Group 2: Residential Area Planning | |
| FG/M/T/25%/75% | Ground floor; middle floor; top floor; lower quartile and upper quartile of the floors of the building, respectively. |
| Sunlight Duration | The total number of hours on a typical day or during the year in which direct sunlight reaches the room or typical area (e.g., window or windowsill) |
| UVA | Unobstructed vision area |
| VDF | Vertical daylight factor |
| VSA | Visible sky area |
| VSC | Vertical sky component |
References
- Reinhart, C.F. Daylighting Handbook I; Building Technology Press: Cambridge, MA, USA, 2014. [Google Scholar]
- Tregenza, P.; Mardaljevic, J. Daylighting buildings: Standards and the needs of the designer. Light. Res. Technol. 2018, 50, 63–79. [Google Scholar] [CrossRef]
- Boyce, P.R. Light, lighting and human health. Light. Res. Technol. 2022, 54, 101–144. [Google Scholar] [CrossRef]
- Dingel, J.I.; Neiman, B. How many jobs can be done at home? J. Public Econ. 2020, 189, 104235. [Google Scholar] [CrossRef] [PubMed]
- Shimura, A.; Yokoi, K.; Ishibashi, Y.; Akatsuka, Y.; Inoue, T. Remote Work Decreases Psychological and Physical Stress Responses, but Full-Remote Work Increases Presenteeism. Front. Psychol. 2021, 12, 730969. [Google Scholar] [CrossRef] [PubMed]
- Ng, P.M.L.; Lit, K.K.; Cheung, C.T.Y. Remote work as a new normal? The technology-organization-environment (TOE) context. Technol. Soc. 2022, 70, 102022. [Google Scholar] [CrossRef] [PubMed]
- Littlefair, P. Site Layout Planning for Daylight and Sunlight: A Guide to Good Practice (BR 209), 2nd ed.; IHS BRE Press: Berkshire, UK, 2011. [Google Scholar]
- Littlefair, P. Passive solar urban design: Ensuring the penetration of solar energy into the city. Renew. Sustain. Energy Rev. 1998, 2, 303–326. [Google Scholar] [CrossRef]
- Tregenza, P.; Wilson, M. Daylighting: Architecture and Lighting Design; Routledge: New York, NY, USA, 2011. [Google Scholar]
- Mardaljevic, J. The implementation of natural lighting for human health from a planning perspective. Light. Res. Technol. 2021, 53, 489–513. [Google Scholar] [CrossRef]
- Littlefair, P. Daylight, sunlight and solar gain in the urban environment. Sol. Energy 2001, 70, 177–185. [Google Scholar] [CrossRef]
- Ng, E. Studies on daylight design and regulation of high-density residential housing in Hong Kong. Light. Res. Technol. 2003, 35, 178–179. [Google Scholar] [CrossRef]
- Reinhart, C.F.; Mardaljevic, J.; Rogers, Z. Dynamic daylight performance metrics for sustainable building design. Leukos 2006, 3, 7–31. [Google Scholar] [CrossRef]
- GB 50033-2013; Standard of Daylighting Design of Buildings. Ministry of Housing and Urban-Rural Development of the People’s Republic of China (MOHURD): Beijing, China, 2013. (In Chinese)
- Building Research Establishment. BREEAM International New Construction, Version 6.0; Building Research Establishment: Watford, UK, 2021. [Google Scholar]
- EN 17037:2018+A1:2021; Daylight in Buildings. European Committee for Standardization (CEN): Brussels, Belgium, 2022.
- Bournas, I. Daylight compliance of residential spaces: Comparison of different performance criteria and association with room geometry and urban density. Build. Environ. 2020, 185, 107276. [Google Scholar] [CrossRef]
- Institute for Building Environment and Energy Conservation. Comprehensive Assessment System for Built Environment Efficiency—New Construction. 2016. Available online: https://www.jsbc.or.jp/research-study/casbee/tools/cas_nc.html (accessed on 30 November 2021). (In Japanese).
- GB/T 50378-2019; Assessment Standard for Green Building. Ministry of Housing and Urban-Rural Development of the People’s Republic of China (MOHURD): Beijing, China, 2019. (In Chinese)
- U.S. Green Building Council. LEED v4.1 RESIDENTIAL BD+C: MULTIFAMILY HOMES. 2020. Available online: https://www.usgbc.org/leed/v41#residential (accessed on 12 November 2021).
- German Sustainable Building Council. DGNB System—New Buildings Criteria Set 2020. 2020. Available online: https://www.dgnb-system.de/en/buildings/new-construction/criteria/ (accessed on 23 December 2021).
- International WELL Building Institute. The WELL Building Standard™ Version 2. 2023. Available online: https://v2.wellcertified.com/en/wellv2-23q4/overview (accessed on 25 December 2023).
- Mardaljevic, J. Examples of Climate-Based Daylight Modelling. In Proceedings of the CIBSE National Conference 2006: Engineering the Future, Oval Cricket Ground, London, UK, 21–22 March 2006. [Google Scholar]
- Reinhart, C.F.; Walkenhorst, O. Validation of dynamic RADIANCE-based daylight simulations for a test office with external blinds. Energy Build. 2001, 33, 683–697. [Google Scholar] [CrossRef]
- Nabil, A.; Mardaljevic, J. Useful daylight illuminances: A replacement for daylight factors. Energy Build. 2006, 38, 905–913. [Google Scholar] [CrossRef]
- Illuminating Engineering Society of North America (IES). Approved Method: IES Spatial Daylight Autonomy (sDA) and Annual Sunlight Exposure (ASE); IES LM-83-12; Illuminating Engineering Society of North America: New York, NY, USA, 2012. [Google Scholar]
- Dogan, T.; Park, Y.C. A critical review of daylighting metrics for residential architecture and a new metric for cold and temperate climates. Light. Res. Technol. 2019, 51, 206–230. [Google Scholar] [CrossRef]
- Reinhart, C.F.; Weissman, D.A. The daylit area—Correlating architectural student assessments with current and emerging daylight availability metrics. Build. Environ. 2012, 50, 155–164. [Google Scholar] [CrossRef]
- Jakubiec, J.A.; Srisamranrungruang, T.; Kong, Z.; Quek, G.; Talami, R. Subjective and Measured Evidence for Residential Lighting Metrics in the Tropics. In Proceedings of the Building Simulation 2019: 16th Conference of IBPSA, Rome, Italy, 2–4 September 2019; pp. 1151–1159. [Google Scholar] [CrossRef]
- Bauer, C.; Wittkopf, S. Annual daylight simulations with EvalDRC—Assessing the performance of daylight redirection components. J. Facade Des. Eng. 2015, 3, 253–272. [Google Scholar] [CrossRef]
- Lucas, R.J.; Peirson, S.N.; Berson, D.M.; Brown, T.M.; Cooper, H.M.; Czeisler, C.A.; Figueiro, M.G.; Gamlin, P.D.; Lockley, S.W.; O’Hagan, J.B.; et al. Measuring and using light in the melanopsin age. Trends Neurosci. 2014, 37, 1–9. [Google Scholar] [CrossRef]
- Rea, M.S.; Figueiro, M.G. Light as a circadian stimulus for architectural lighting. Light. Res. Technol. 2018, 50, 497–510. [Google Scholar] [CrossRef]
- Al Enezi, J.; Revell, V.; Brown, T.; Wynne, J.; Schlangen, L.; Lucas, R. A “Melanopic” Spectral Efficiency Function Predicts the Sensitivity of Melanopsin Photoreceptors to Polychromatic Lights. J. Biol. Rhythm. 2011, 26, 314–323. [Google Scholar] [CrossRef]
- Andersen, M.; Mardaljevic, J.; Lockley, S.W. A framework for predicting the non-visual effects of daylight—Part I: Photobiology-based model. Light. Res. Technol. 2012, 44, 37–53. [Google Scholar] [CrossRef]
- Mardaljevic, J.; Andersen, M.; Roy, N.; Christoffersen, J. A framework for predicting the non-visual effects of daylight—Part II: The simulation model. Light. Res. Technol. 2014, 46, 388–406. [Google Scholar] [CrossRef]
- U.S. Green Building Council. LEED v4.1 Building Design and Construction. 2021. Available online: https://build.usgbc.org/bd+c_guide (accessed on 12 November 2021).
- Kanters, J.; Gentile, N.; Bernardo, R. Planning for solar access in Sweden: Routines, metrics, and tools. Urban Plan. Transp. Res. 2021, 9, 347–367. [Google Scholar] [CrossRef]
- GB 50180-2018; Standard for Urban Residential Area Planning and Design. Ministry of Housing and Urban-Rural Development of the People’s Republic of China (MOHURD): Beijing, China, 2018. (In Chinese)
- Zhang, H.; Gao, T.; Liu, W.; Lu, Y. Domestic and Foreign Study Progress on Sunlight Control of Residential Plot. Des. Community 2019, 1, 97–102. (In Chinese) [Google Scholar]
- Ministry of Land Infrastructure Transport and Tourism. Uniform Building Code. 2022. Available online: https://elaws.e-gov.go.jp/document?lawid=325AC0000000201 (accessed on 29 March 2023). (In Japanese)
- Lau, K.L.; Ng, E.; He, J.Z. Preferred solar access in high-density, sub-tropical housing. Light. Res. Technol. 2013, 45, 317–330. [Google Scholar] [CrossRef]
- Lu, M.; Du, J.T. Assessing the daylight and sunlight availability in high-density residential areas: A case in North-east China. Archit. Sci. Rev. 2013, 56, 168–182. [Google Scholar] [CrossRef]
- Lau, K.L.; Ng, E.; He, Z.J. Residents’ preference of solar access in high-density sub-tropical cities. Sol. Energy 2011, 85, 1878–1890. [Google Scholar] [CrossRef]
- Hamzah, B.; Lau, S.S.Y. The development of visible sky area as an alternative daylight assessment method for high-rise buildings in high-density urban environments. Archit. Sci. Rev. 2016, 59, 178–189. [Google Scholar] [CrossRef]
- Lu, M.; Du, J.T. Dynamic evaluation of daylight availability in a highly-dense Chinese residential area with a cold climate. Energy Build. 2019, 193, 139–159. [Google Scholar] [CrossRef]
- Wang, J.; Wei, M.C.; Ruan, X.K. Characterization of the acceptable daylight quality in typical residential buildings in Hong Kong. Build. Environ. 2020, 182, 107094. [Google Scholar] [CrossRef]
- Dogan, T.; Park, Y.C. Testing the residential daylight score: Comparing climate-based daylighting metrics for 2444 individual dwelling units in temperate climates. Light. Res. Technol. 2020, 52, 991–1008. [Google Scholar] [CrossRef]
- Ticleanu, C. Impacts of home lighting on human health. Light. Res. Technol. 2021, 53, 453–475. [Google Scholar] [CrossRef]
- Potocnik, J.; Kosir, M. The Necessity for Multi-Spectral Simulations of the Indoor Non-Visual Luminous Environment: A Simplified Annual Approach. Buildings 2023, 13, 1357. [Google Scholar] [CrossRef]
- GB 55016-2021; General Code for Building Environment. Ministry of Housing and Urban-Rural Development of the People’s Republic of China (MOHURD): Beijing, China, 2021. (In Chinese)
- Architectural Design and Research Institute of Tsinghua University Co.; School of Architecture and Urban Planning of Chongqing University. The Sourcebook of Architecture Design, 3rd ed.; China Architecture & Building Press: Beijing, China, 2017; Volume 2. (In Chinese) [Google Scholar]
- Bureau of Natural Resources and Planning of Kunming Municipality. Technical Regulations on Urban and Rural Planning Management in Kunming. 2022. Available online: https://www.km.gov.cn/c/2022-09-30/4566670.shtml?eqid=bef73d280002f9d70000000364892161 (accessed on 7 August 2023). (In Chinese)
- DB12/T 1040-2021; Technical Specifications for Planning Management of Construction Projects. Tianjin Administration for Market Regulation: Tianjin, China, 2021. Available online: https://ghhzrzy.tj.gov.cn/zwgk_143/tzgg/202102/t20210222_5363547.html (accessed on 7 August 2023). (In Chinese)
- The People’s Government of Changsha Municipality. Technical Regulations on Urban Planning Management in Changsha (2018 Revision). 2018. Available online: http://www.changsha.gov.cn/szf/zfgb/2018nian_1202/201809251/201809/t20180918_6089749.html?eqid=ad55660d0232d0bc0000000264531886 (accessed on 7 August 2023). (In Chinese)
- The People’s Government of Chongqing Municipality. Technical Regulations on Urban Planning Management in Chongqing. 2018. Available online: https://www.gov.cn/zhengce/2018-01/23/content_5717667.htm (accessed on 7 August 2023). (In Chinese)
- Ministry of Natural Resources of the People’s Republic of China. Map of China GS(2019)1682. 2019. Available online: http://bzdt.ch.mnr.gov.cn/browse.html?picId=%224o28b0625501ad13015501ad2bfc0272%22 (accessed on 13 December 2023).
- CIE. CIE S 017:2020 ILV: International Lighting Vocabulary, 2nd ed.; CIE Central Bureau: Vienna, Austria, 2020. [Google Scholar]
- China Meteorological Bureau (CMB); Climate Information Centre, Climate Data Office; Department of Building Science and Technology, Tsinghua University. China Standard Weather Data for Analyzing Building Thermal Conditions; China Building Industry Publishing House: Beijing, China, 2005. (In Chinese) [Google Scholar]
- GB 50352-2019; Uniform Standard for Design of Civil Buildings. Ministry of Housing and Urban-Rural Development of the People’s Republic of China (MOHURD): Beijing, China, 2019. (In Chinese)
- Ayoub, M. A review on light transport algorithms and simulation tools to model daylighting inside buildings. Sol. Energy 2020, 198, 623–642. [Google Scholar] [CrossRef]
- Solemma LLC. ClimateStudio. Available online: https://www.solemma.com/climatestudio (accessed on 30 September 2022).
- Solemma LLC. ALFA. Available online: https://www.solemma.com/alfa (accessed on 14 September 2021).
- University of Washington; ZGF Architects LLP. Lark Spectral Lighting. Available online: http://faculty.washington.edu/inanici/Lark/Lark_home_page.html (accessed on 25 September 2023).
- The People’s Government of Kunming Municipality. Master Plan of Kunming (2011–2020, 2016 Edition). 2016. Available online: https://zrzygh.km.gov.cn/c/2020-05-21/3560340.shtml (accessed on 5 February 2024). (In Chinese)
- Tianjin Municipal Bureau of Statistics; Survey Office of the National Bureau of Statistics in Tianjin. Tianjin Statistical Yearbook 2023; China Statistics Press: Beijing, China, 2023. Available online: https://stats.tj.gov.cn/nianjian/2023nj/zk/indexch.htm (accessed on 5 February 2024).
- The People’s Government of Changsha Municipality. Urban Master Plan of Changsha (2003–2020, 2014 Edition). 2014. Available online: http://zygh.changsha.gov.cn/zfxxgk/fdzdgknr/ghxx/zxgh/201902/t20190203_3214855.html (accessed on 5 February 2024). (In Chinese)
- Chongqing Municipal Bureau of Statistics; NBS Survey Office in Chongqing. Chongqing Statistical Yearbook 2023; China Statistics Press: Beijing, China, 2023. [Google Scholar]
- Lo Verso, V.R.M.; Giovannini, L.; Valetti, L.; Pellegrino, A. Integrative Lighting in Classrooms: Preliminary Results from Simulations and Field Measurements. Buildings 2023, 13, 2128. [Google Scholar] [CrossRef]
- CIE. CIE S 026/E:2018 CIE System for Metrology of Optical Radiation for ipRGC-Influenced Responses to Light; CIE Central Bureau: Vienna, Austria, 2018. [Google Scholar]
- GB 50176-2016; Code for Thermal Design of Civil Building. Ministry of Housing and Urban-Rural Development of the People’s Republic of China (MOHURD): Beijing, China, 2016.
- Reinhart, C.F. Tutorial on the Use of Daysim Simulations for Sustainable Design; Institute for Research in Construction, National Research Council Canada: Ottawa, ON, Canada, 2006. [Google Scholar]
- Mardaljevic, J.; Andersen, M.; Roy, N.; Christoffersen, J. Daylighting, Artificial Lighting and Non-Visual Effects Study for a Residential Building. Available online: http://thedaylightsite.com/library-3/research-publications/papers/ (accessed on 1 March 2022).
- CIE. CIE S 011/E: 2003 Spatial Distribution of Daylight—CIE Standard General Sky; CIE Central Bureau: Vienna, Austria, 2004. [Google Scholar]
- Galatioto, A.; Beccali, M. Aspects and issues of daylighting assessment: A review study. Renew. Sustain. Energy Rev. 2016, 66, 852–860. [Google Scholar] [CrossRef]


| Year | Standards | Region | Metric | Date | Time | Sky Model |
|---|---|---|---|---|---|---|
| 2013 | GB 50033-2013 Standard of daylighting design of buildings [14] | China | DF | 10:00–14:00 | Overcast sky | |
| Illuminance | ||||||
| 2016 | CASBEE—New construction (2016 Edition) [18] | Japan | DF | Overcast sky | ||
| 2019 | GB/T 50378-2019 Assessment standard for green building [19] | China | DA300 for 60% of the occupied area, eight hours per day on average | TMY | ||
| 2020 | LEED v 4.1 RESIDENTIAL BD+C MULTIFAMILY HOMES [20] | U.S. | Illuminance | Equinox | 9:00–15:00 | Clear sky |
| 2020 | DGNB System—New buildings criteria set 2020 [21] | Germany | DF | Overcast sky | ||
| Color rendering index Ra | ||||||
| Duration of exposure to daylight | 17 January and equinox | |||||
| 2021 | BREEAM International New Construction Version 6.0 [15] | U.K. | DF | Overcast sky | ||
| Uniformity | ||||||
| 2022 | EN 17037:2018+A1:2021 Daylight in buildings [16] | Europe | Sunlight exposure | 1 February– 21 March | Sun-path diagram | |
| DF | Overcast sky | |||||
| Illuminance | Annual | TMY | ||||
| 2023 | WELL v2 Q4 2023 [22] | U.S. | sDA300,50% | Annual | 8:00–18:00 | TMY |
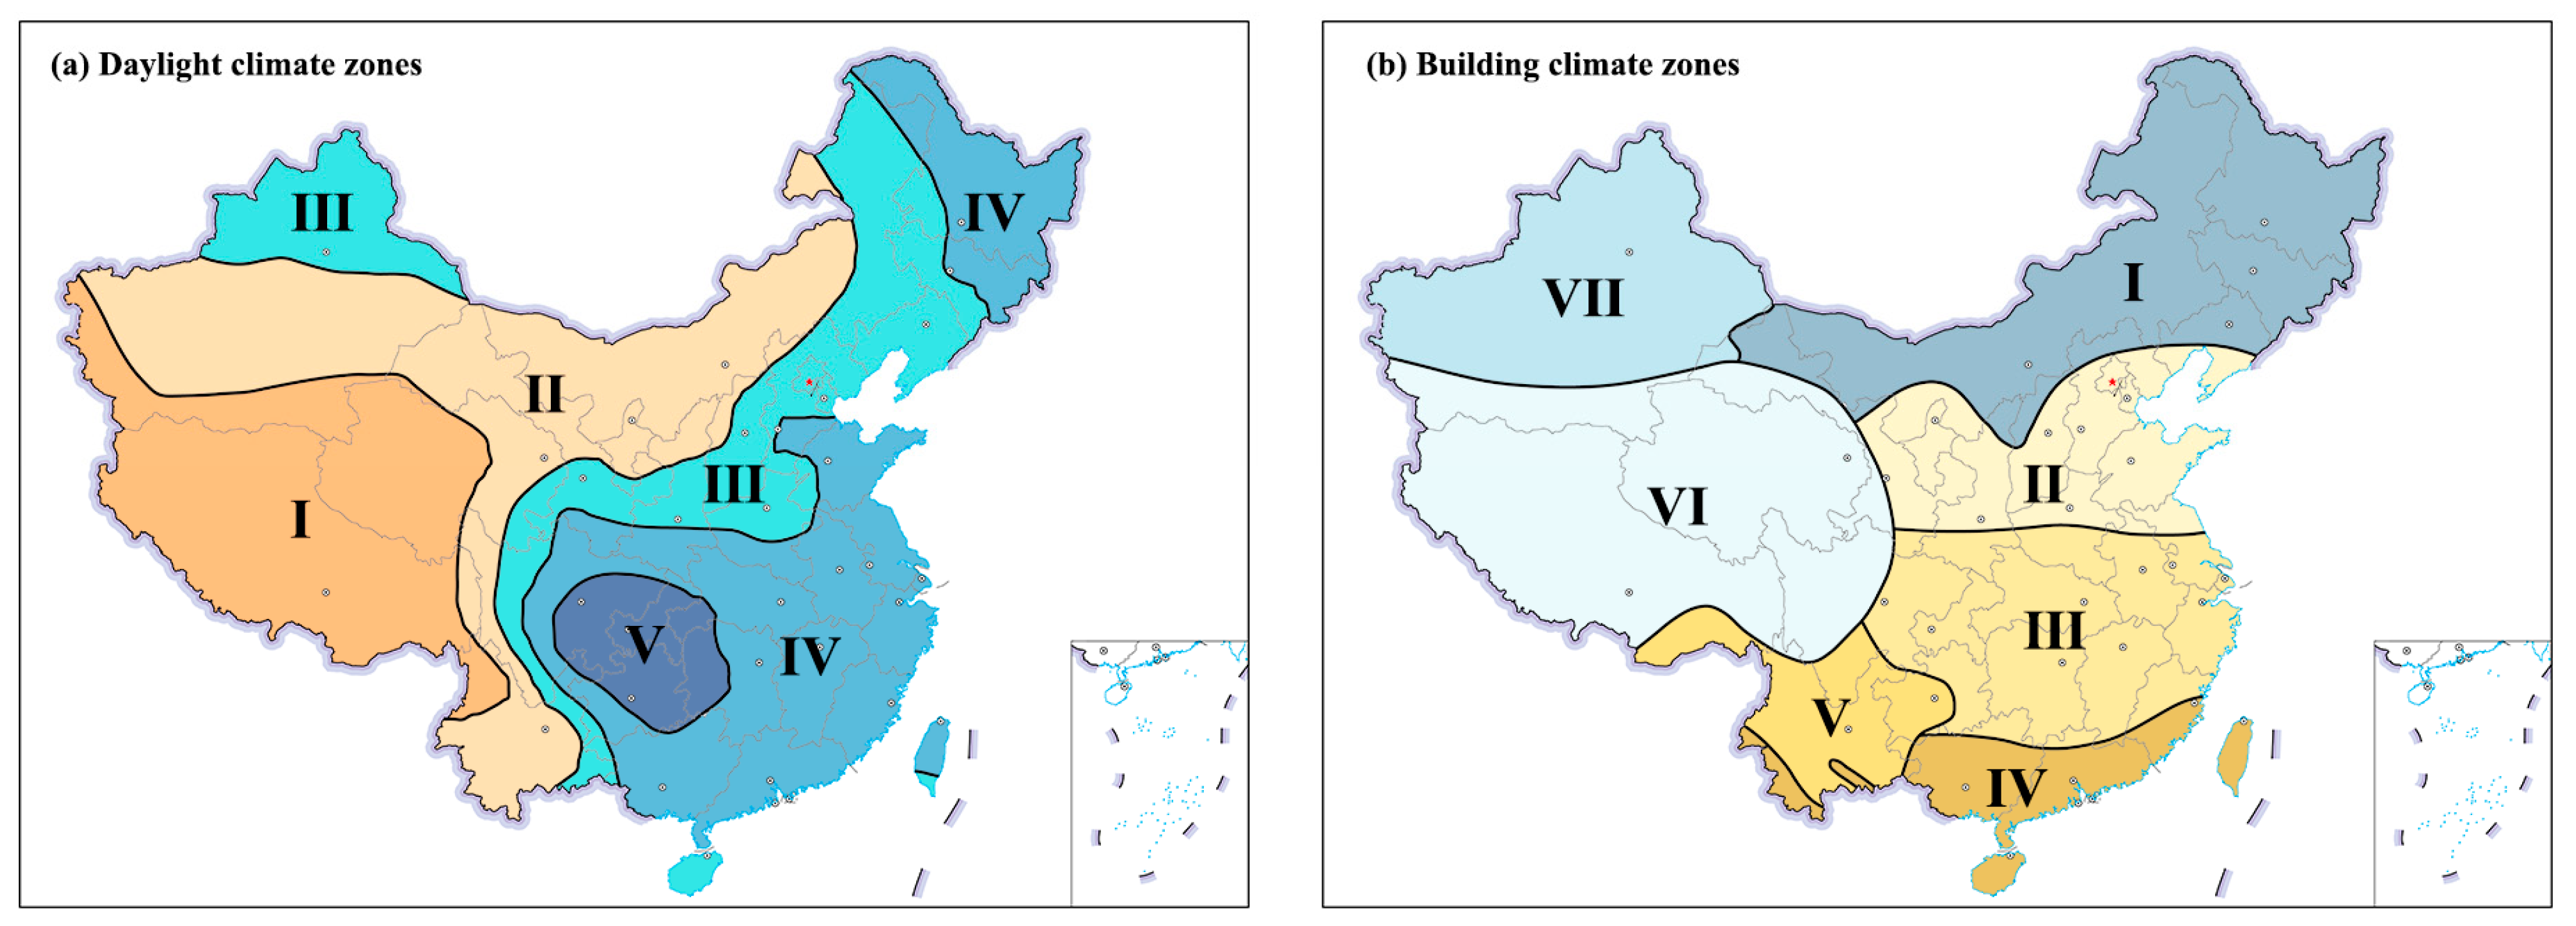
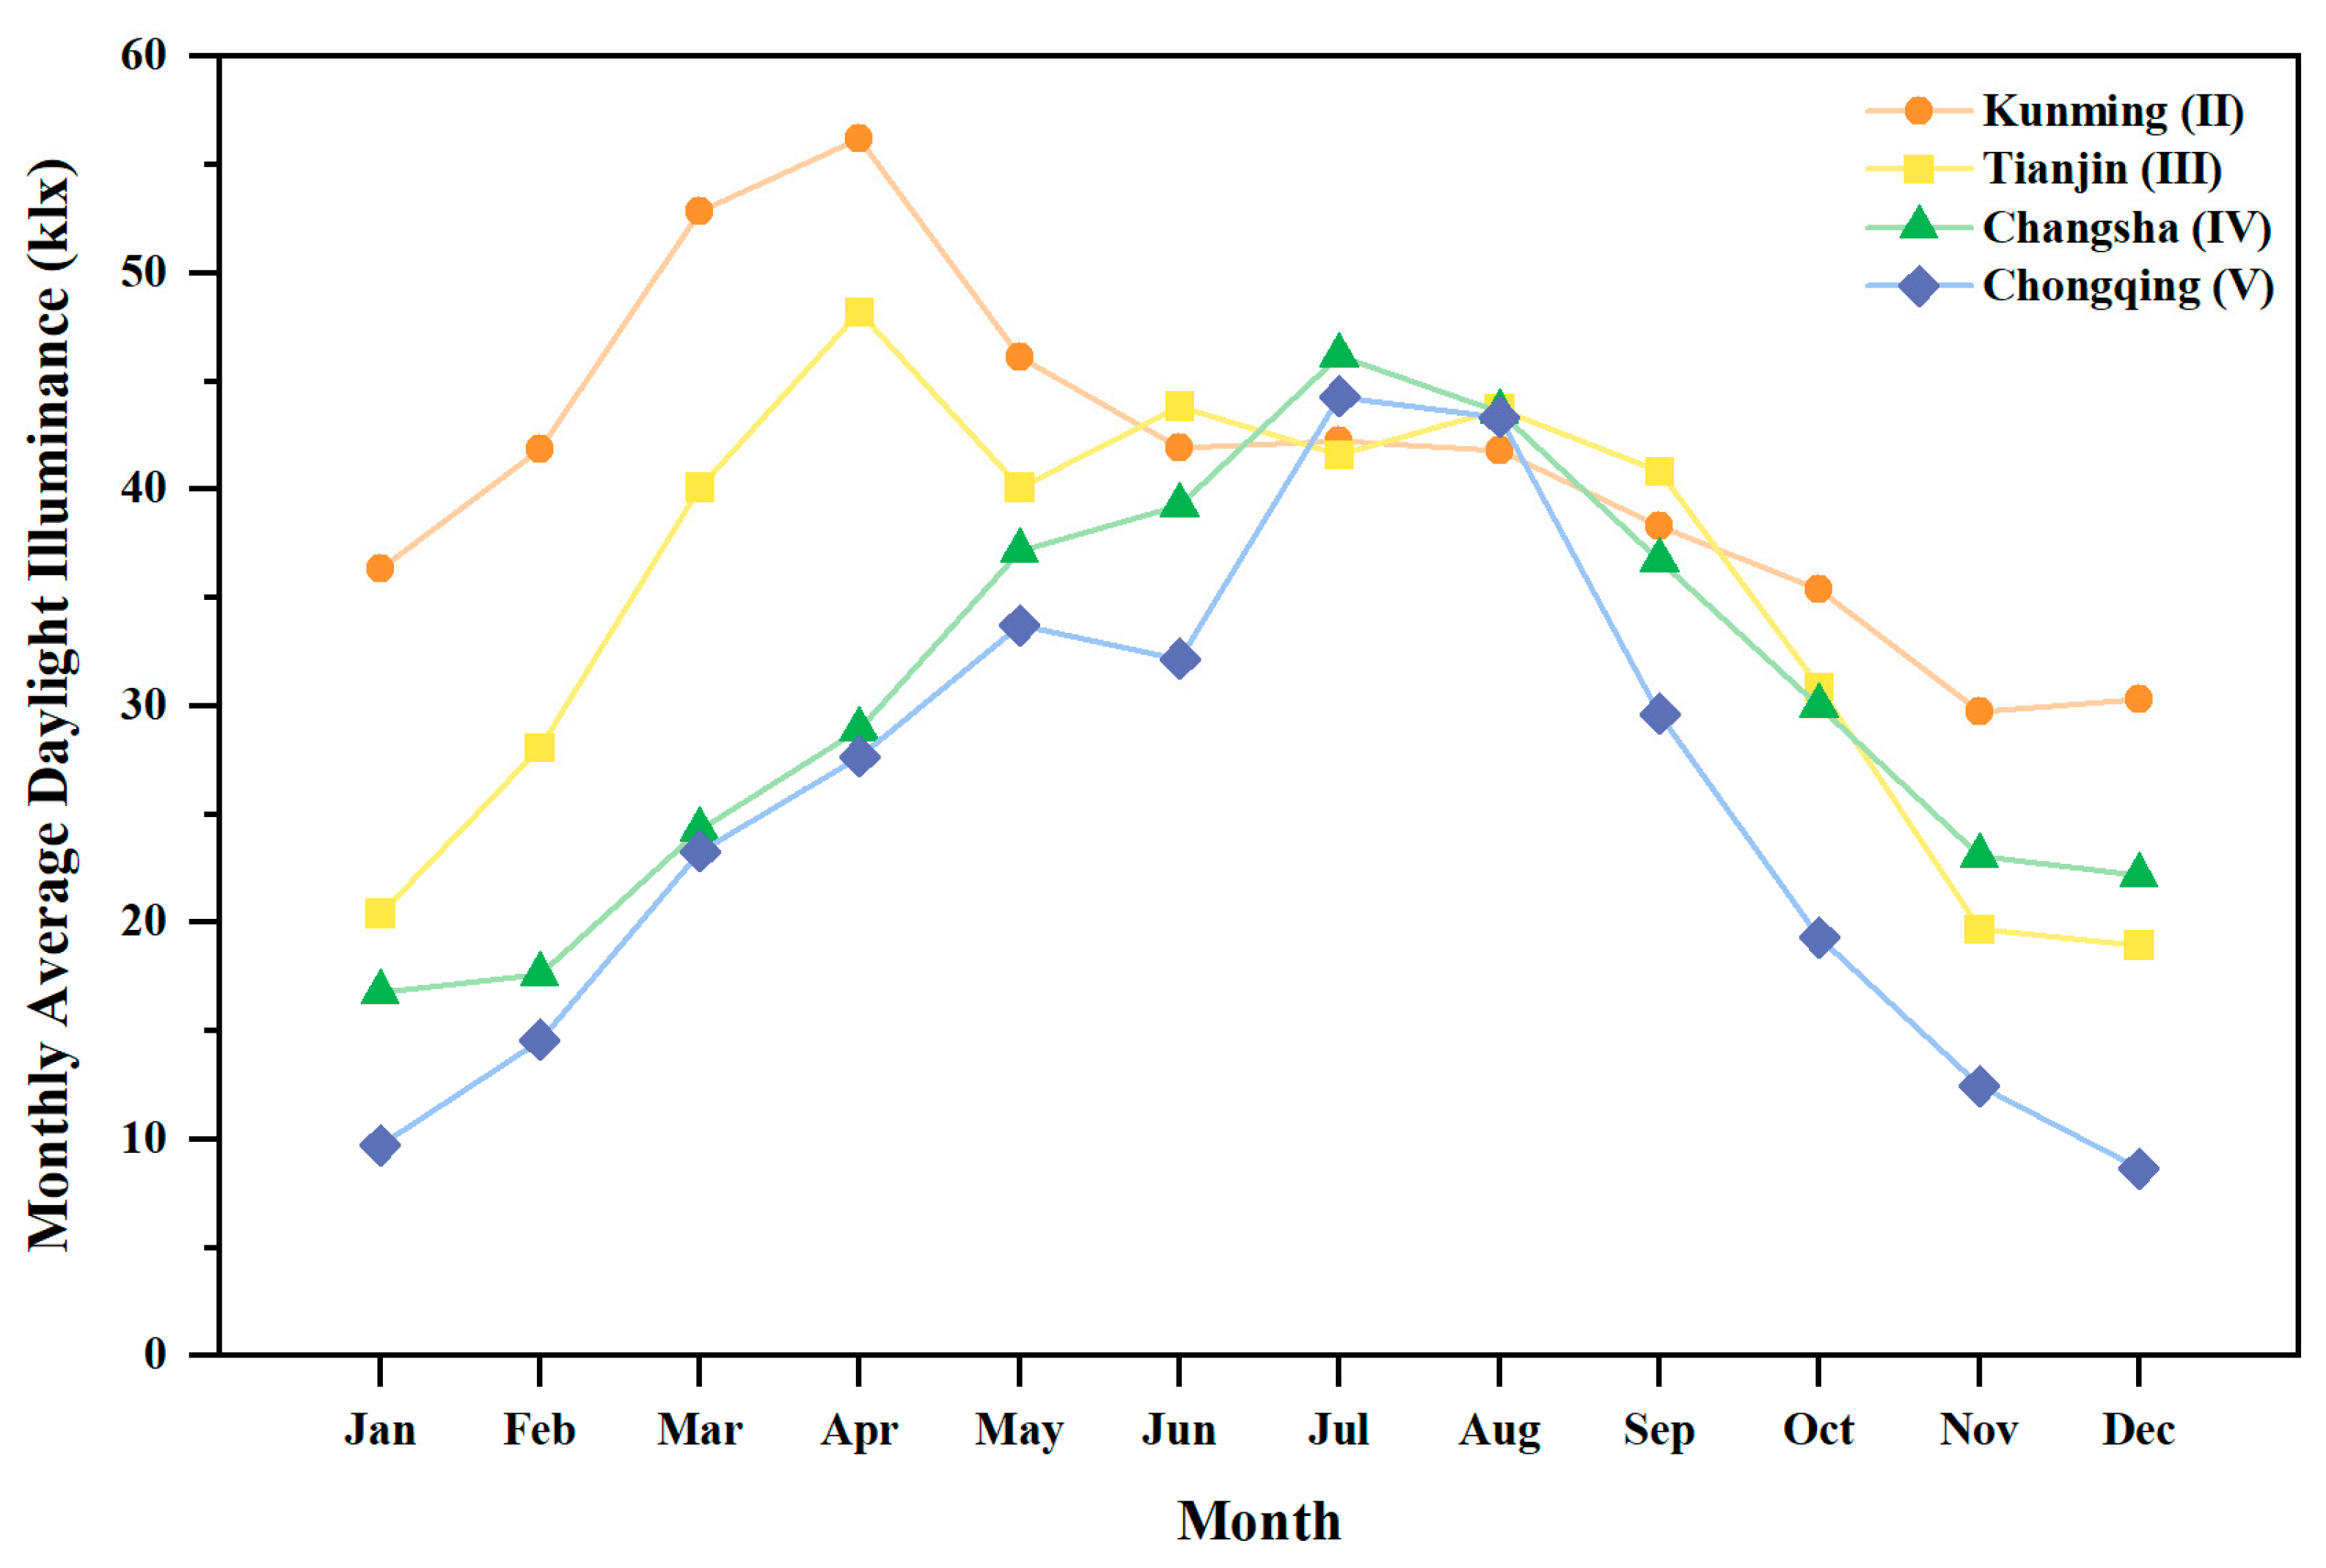
| City | Location | Daylight Climate Zone | Annual Total Solar Irradiation (kWh/m2) | Building Climate Zone | Average Annual Temperature (°C) |
|---|---|---|---|---|---|
| Kunming | 25.02° N, 102.68° E | II | 1530 | V | 15 |
| Tianjin | 39.08° N, 117.07° E | III | 1355 | II | 13 |
| Changsha | 28.22° N, 112.92° E | IV | 1085 | III | 17 |
| Chongqing | 29.58° N, 106.47° E | V | 848 | III | 18 |
| City | Threshold of Plot Ratio 1 | Factors Defining the Spacing–Height Equations | ||||||||
|---|---|---|---|---|---|---|---|---|---|---|
| Obstruction | Obstructed Building | Orientation | Angle between Buildings 4 | |||||||
| Building Height | Building Type 2 | Façade | Building Height | Façade | ||||||
| Type 3 | Width | Type | Width | |||||||
| Kunming | 3.1 | ● 5 | ● | ● | ● | |||||
| Tianjin | 2.9 | ● | ● | ● | ● | ● | ||||
| Changsha | 3.1 | ● | ● | ● | ● | ● | ● | |||
| Chongqing | 3.1 | ● | ● | ● | ● | |||||
| City | Kunming | Tianjin | Changsha | Chongqing |
|---|---|---|---|---|
| Building climate zone | V | II | III | III |
| Reference date | Winter solstice day (22 December) | Dahan day (20 January) | ||
| Sunlight hours (h) | ≥1 | ≥2 | ||
| Time period | 9:00–15:00 | 8:00–16:00 | ||
| Position (for sunlight hours calculation) | Windowsill at the ground floor (or the external façade with a height of 0.9 m above the indoor floor) | |||
| Materials | |||||||
|---|---|---|---|---|---|---|---|
| Position | Material Name | Reflectivity | Transmittance | ||||
| P 1 | M 2 | P | M | ||||
| Ground | Rock 7 | 0.20 | 0.15 | - | - | ||
| Façade | Wall | Old White Street Paint | 0.39 | 0.34 | - | - | |
| Window | Dark Grey Painted Floor | 0.13 | 0.14 | - | - | ||
| Indoor | Wall | Dupont Off White 75 | 0.49 | 0.42 | - | - | |
| Floor | Dark Grey Floor Tiles | 0.20 | 0.19 | - | - | ||
| Ceiling | White Painted Room Ceiling | 0.82 | 0.77 | - | - | ||
| Furniture | Dupont Desaturated White Blue 109 | 0.51 | 0.52 | - | - | ||
| Window | CSO | Clear-Solarban 60 (3) | 0.12 | - | 0.70 | - | |
| ALFA | Double IGU Clear Trivs 70% | 0.11 | 0.11 | 0.70 | 0.70 | ||
| Radiance parameters | |||||||
| -ambient bounces | 7 | -ambient divisions | 1500 | ||||
| -ambient super-samples | 100 | -ambient accuracy | 0.1 | ||||
| -ambient resolution | 300 | ||||||
| Building Type | Sky | Floor 1 | Kunming | Tianjin | Changsha | Chongqing | ||||||||||||
|---|---|---|---|---|---|---|---|---|---|---|---|---|---|---|---|---|---|---|
| 3/21 | 6/22 | 9/23 | 12/22 | 3/21 | 6/22 | 9/23 | 12/22 | 3/21 | 6/22 | 9/23 | 12/22 | 3/21 | 6/22 | 9/23 | 12/22 | |||
| Mid-rise | Clear | G | 3 2 | 3 | 3 | 1 | 3 | 3 | 3 | 3 | 3 | 3 | 3 | 3 | 3 | 3 | 3 | 1 |
| M | 3 | 3 | 3 | 1 | 3 | 3 | 3 | 3 | 3 | 3 | 3 | 3 | 3 | 3 | 3 | 3 | ||
| T | 3 | 3 | 3 | 1 | 3 | 3 | 3 | 3 | 3 | 3 | 3 | 3 | 3 | 3 | 3 | 3 | ||
| Overcast | G | 3 | 3 | 3 | 1 | 1 | 3 | 1 | 0 | 3 | 3 | 1 | 0 | 1 | 3 | 1 | 0 | |
| M | 3 | 3 | 3 | 1 | 3 | 3 | 3 | 0 | 3 | 3 | 3 | 1 | 3 | 3 | 3 | 1 | ||
| T | 3 | 3 | 3 | 1 | 3 | 3 | 3 | 1 | 3 | 3 | 3 | 1 | 3 | 3 | 3 | 3 | ||
| High-rise | Clear | G | 1 | 0 | 1 | 0 | 3 | 1 | 3 | 0 | 1 | 0 | 1 | 0 | 1 | 0 | 1 | 0 |
| 25% | 1 | 0 | 1 | 3 | 3 | 1 | 3 | 3 | 1 | 1 | 1 | 3 | 1 | 0 | 1 | 0 | ||
| M | 1 | 0 | 1 | 3 | 3 | 1 | 3 | 3 | 1 | 1 | 1 | 3 | 1 | 1 | 1 | 3 | ||
| 75% | 1 | 0 | 1 | 3 | 3 | 3 | 3 | 3 | 3 | 3 | 3 | 3 | 1 | 1 | 1 | 3 | ||
| T | 3 | 3 | 3 | 3 | 3 | 3 | 3 | 3 | 3 | 1 | 3 | 3 | 3 | 1 | 3 | 3 | ||
| Overcast | G | 0 | 0 | 0 | 0 | 0 | 0 | 0 | 0 | 0 | 0 | 0 | 0 | 0 | 0 | 0 | 0 | |
| 25% | 0 | 0 | 0 | 0 | 1 | 1 | 1 | 0 | 1 | 1 | 1 | 0 | 0 | 1 | 0 | 0 | ||
| M | 0 | 1 | 0 | 0 | 1 | 1 | 1 | 0 | 1 | 1 | 1 | 0 | 1 | 1 | 1 | 0 | ||
| 75% | 1 | 1 | 1 | 0 | 1 | 3 | 1 | 0 | 3 | 3 | 1 | 1 | 1 | 3 | 1 | 0 | ||
| T | 3 | 3 | 3 | 3 | 1 | 3 | 1 | 1 | 1 | 3 | 1 | 1 | 3 | 3 | 1 | 1 | ||
Disclaimer/Publisher’s Note: The statements, opinions and data contained in all publications are solely those of the individual author(s) and contributor(s) and not of MDPI and/or the editor(s). MDPI and/or the editor(s) disclaim responsibility for any injury to people or property resulting from any ideas, methods, instructions or products referred to in the content. |
© 2024 by the authors. Licensee MDPI, Basel, Switzerland. This article is an open access article distributed under the terms and conditions of the Creative Commons Attribution (CC BY) license (https://creativecommons.org/licenses/by/4.0/).
Share and Cite
Hong, L.; Wang, C.; Zhang, X. Daylight Availability of Living Rooms in Dense Residential Areas under Current Planning Regulations: A Cross-Region Case Study in China. Buildings 2024, 14, 1090. https://doi.org/10.3390/buildings14041090
Hong L, Wang C, Zhang X. Daylight Availability of Living Rooms in Dense Residential Areas under Current Planning Regulations: A Cross-Region Case Study in China. Buildings. 2024; 14(4):1090. https://doi.org/10.3390/buildings14041090
Chicago/Turabian StyleHong, Lishu, Chenxi Wang, and Xin Zhang. 2024. "Daylight Availability of Living Rooms in Dense Residential Areas under Current Planning Regulations: A Cross-Region Case Study in China" Buildings 14, no. 4: 1090. https://doi.org/10.3390/buildings14041090
APA StyleHong, L., Wang, C., & Zhang, X. (2024). Daylight Availability of Living Rooms in Dense Residential Areas under Current Planning Regulations: A Cross-Region Case Study in China. Buildings, 14(4), 1090. https://doi.org/10.3390/buildings14041090