1. Introduction
The Intergovernmental Panel on Climate Change warns that anthropogenic activities have already caused a rise of approximately 1 °C in global warming. Climate change predictions indicate a high probability of a further increase of 1.5 °C in global temperatures between 2030 and 2052 [
1]. Rapid urban development is often accompanied by high-rise and high-density buildings, as in urban canyons, which contribute to higher air temperatures and poorer thermal comfort in the outdoor environment, influencing the livability of outdoor environments, and affecting thermal comfort perceptions and usage patterns [
2].
Thermal comfort describes the degree of satisfaction with the thermal environment [
3]. In the last two decades, several biometeorological indices have been developed to describe human thermal comfort levels by linking them to local microclimatic conditions. Examples include the predicted mean vote (PMV) [
4], physiological equivalent temperature (PET) [
5], and universal thermal climate index (UTCI) [
6]. These steady-state methods are based on the analysis of heat exchange mechanisms, hypothesizing that human exposure to an ambient climatic environment enables them to reach thermal equilibrium through habituation [
7]. This approach integrated meteorological parameters (air temperature, mean radiant temperature, relative humidity, and wind velocity) and personal factors (human activity and clothing levels). The UTCI reflects temporal variations in thermal conditions better than other indices and can represent subtle differences in the intensity of meteorological stimuli [
8]. A comparative analysis of the UTCI and some more popular thermoclimatic indices revealed that other bioclimatic indices can only express bioclimatic conditions under specific meteorological conditions, whereas the UTCI covers a wider range of climates, weather, and locations. This is a broad generalization of the environment [
9]. However, steady-state methods cannot effectively account for the dynamic aspects of human thermal adaptation [
10]. Questionnaires and observations have been used to investigate the impact of microclimate on space usage and human behaviors [
11]. ASHRAE55 provides five or seven subjective judgment scales to describe thermal perception and comfort [
12].
Some studies have focused on the link between outdoor thermal comfort and human behavior. Nikolopou suggested that improved thermal comfort conditions in urban open spaces generally implied that more people used the space; however, there was a large discrepancy between the actual thermal comfort sensation (subjective data from interviews) and the theoretically predicted thermal comfort conditions (objective data from PMV) [
13]. This difference was attributable to psychological factors such as naturalness, experience, perceived control, exposure time, environmental stimulation, and expectations [
14]. However, no quantified relationship regarding the effectiveness of a design alternative has been determined due to the complex interrelationships between various factors [
15]. Zacharias et al. suggested that microclimatic variables (mainly temperature and the sun) affect the presence of people in open spaces. They also noted that the presence of people does not necessarily imply their satisfaction [
15]. Thorsson et al. noted that transient exposure and thermal expectations may significantly influence subjective assessment and satisfaction and that steady-state models such as PMV may not be appropriate for assessing short-term outdoor thermal comfort [
16]. However, the relationship between behavior and sunlit (or shaded) patterns has not been investigated thoroughly [
17]. Human adaptive behaviors to microclimates were attributed to the shading patterns formed by surrounding buildings and vegetation during hot summers [
18]. The use of open spaces was highly correlated with the temperature and average radiation temperature in winter, whereas the main factors affecting the presence of people in open spaces in summer were wind and humidity [
19]. People engaged in static versus dynamic activities showed different sensitivities to thermal environments. User location selection showed a strong dependence on the microclimate rather than on activity-supported facilities in winter cities [
20]. Spaces in sequence do not significantly affect microclimatic variation, but significantly impact the dynamic thermal perception of pedestrians in streets [
21]. However, few studies have quantitatively investigated the relationship between dynamic human activities and microclimatic factors.
Some studies have focused on the link between outdoor thermal comfort and an urban canyon. Similar to a natural canyon, an urban canyon is defined as a geometric configuration in which a public space (mostly a street) is surrounded by buildings [
22]. Urban canyons are units with specific microclimates that contribute to the overall city climate when combined [
23]. Most recent studies assessing thermal comfort and urban canyon microclimates have focused on the impact of urban geometric parameters such as aspect ratio (or height-to-width ratio, H/W), street orientation, and sky view factor (SVF). These geometric factors strongly affect urban microclimates under solar access and shading conditions. Urban canyons with higher H/W aspect ratios have higher wind speeds, shade from buildings, and improved thermal comfort [
22]. A street orientation angle between 30° and 60° with the wind direction and a canyon aspect ratio of 2.5 can reduce the PET (°C) by 5 to 9 °C [
24]. Street orientation and aspect ratio strongly affect the magnitude and duration of thermal peaks at the pedestrian level [
25]. The SVF is an essential physical parameter used to assess urban microclimates and thermal comfort levels in city streets [
25]. The position of the visible sky has a greater influence on meteorological and human thermal comfort conditions in a street than the SVF value [
26]. However, few studies have considered the relationship between behavioral activities and urban canyon.
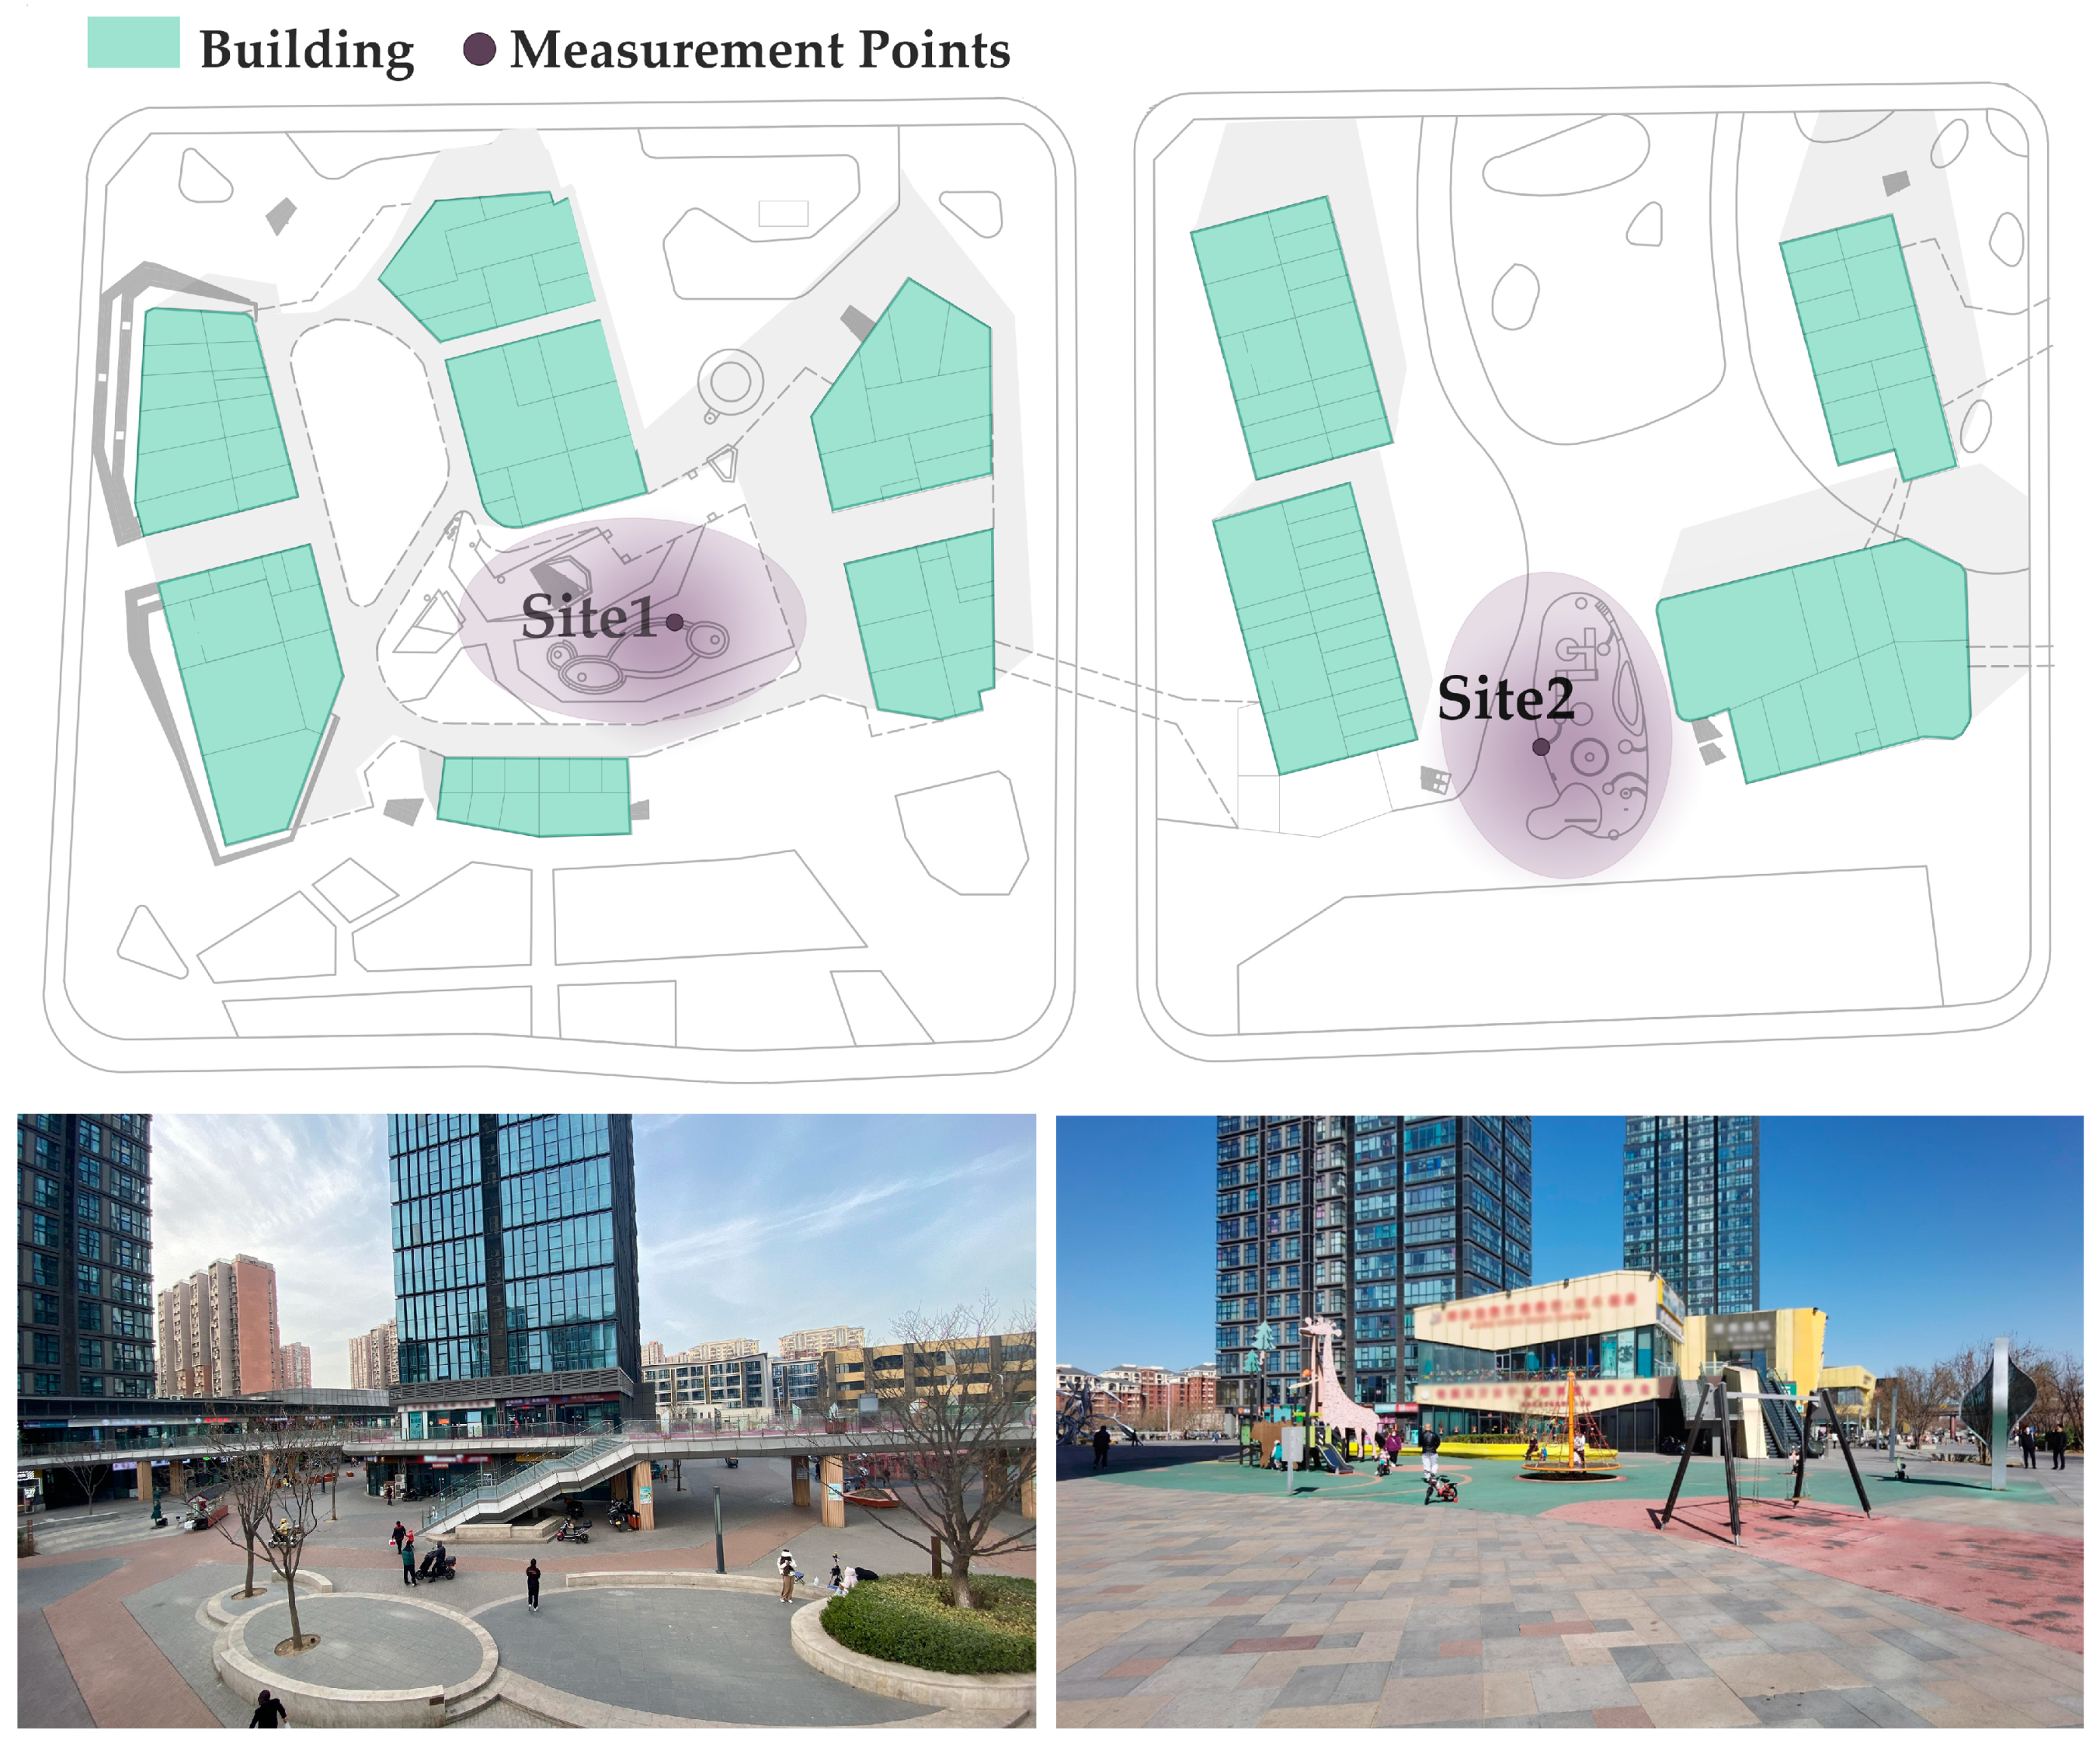
Public spaces in new urban areas are important for many people. However, because new urban areas have predominantly high-rise and high-density buildings, public spaces and their microclimates are more affected by the surrounding buildings. This study aimed to (1) examine the relationship between the microclimate and perception; (2) prove that the thermal comfort of the environment facilitates physical activities; and (3) propose a post-occupancy evaluation to improve the thermal comfort of public spaces using a superior design.
3. Results
3.1. Perception Concerning Exposure Time and Microclimatic Factors
Using the questionnaire survey, we found that the comfortable temperature for people in Beijing in March is between 16–26 °C, which means that people feel cold when the temperature is lower than 16 °C, while UTCI believes that people feel cold when it is lower than 9 °C. This indicated that the temperatures at which people feel comfortable vary across geographies and cultures.
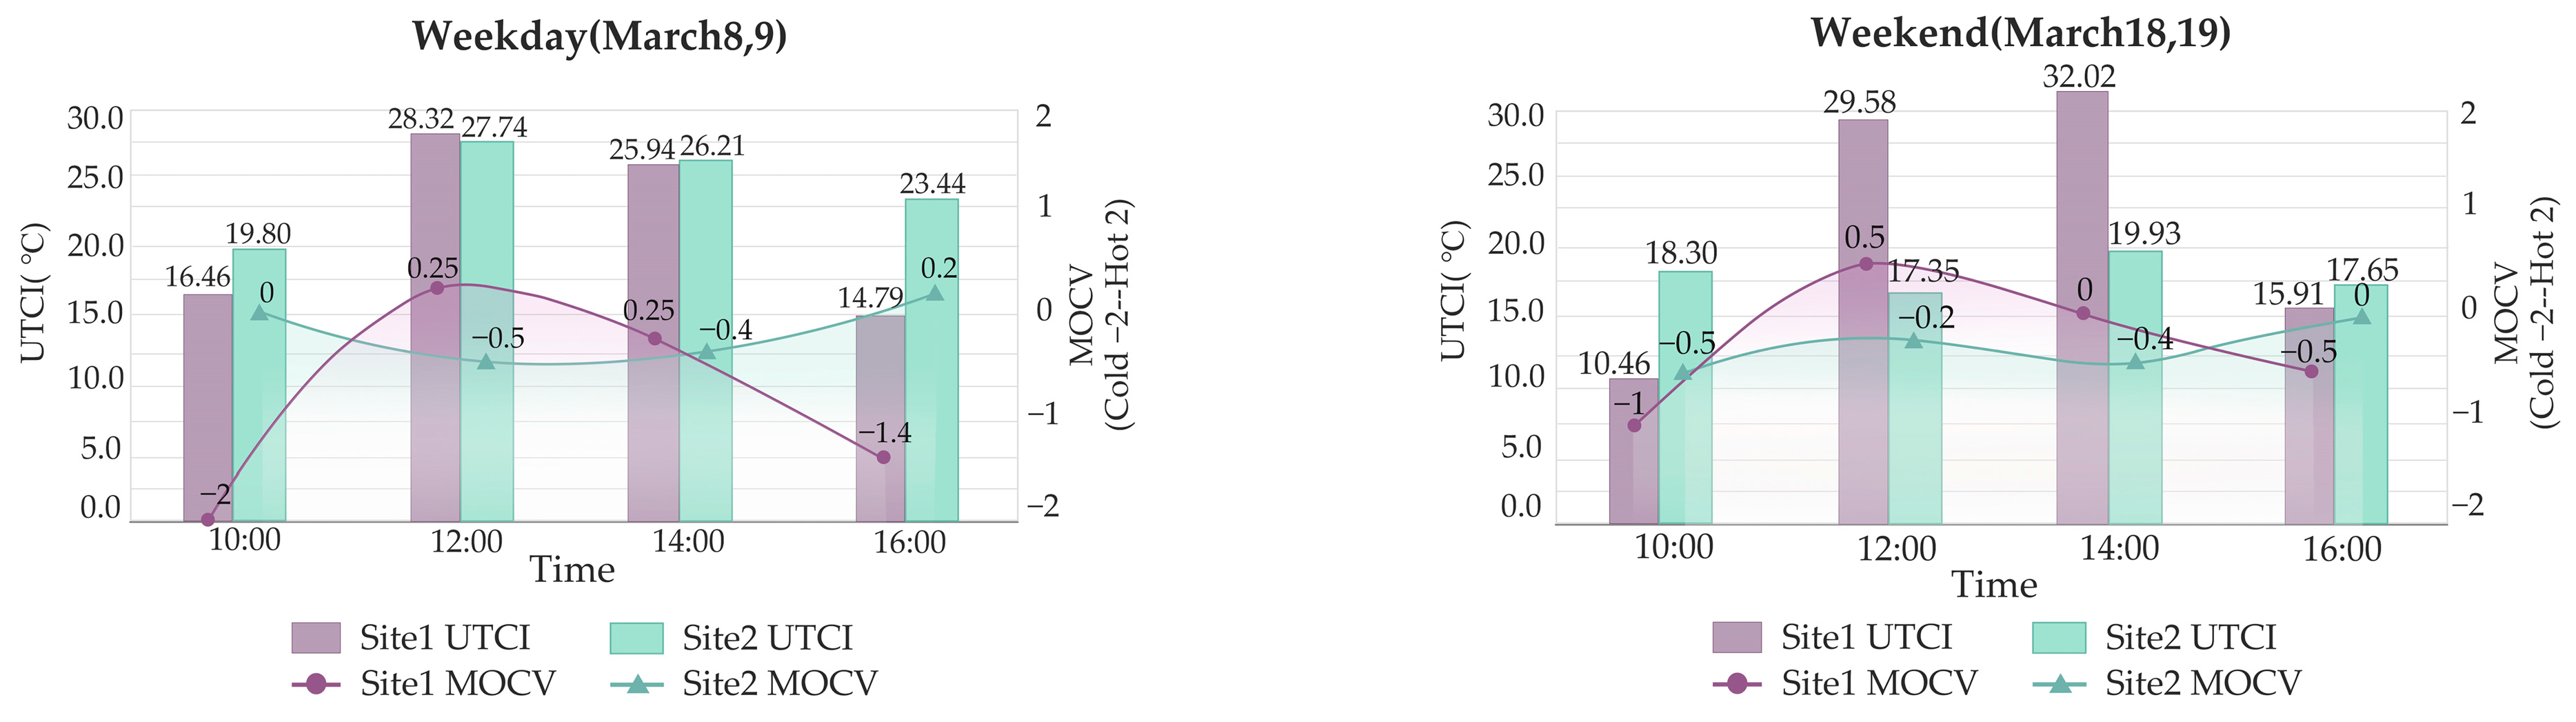
In addition, there was a bias between perceptions of outdoor microclimates and real-time UTCI temperatures. At Site 1, the trends of change in human perceptions were largely consistent with real-time UTCI temperatures, showing pronounced differences in the four selected time points (10:00, 12:00, 14:00, and 16:00) in the day, namely, warmest at 12:00 and 14:00 and colder at 10:00 and 16:00. However, at Site 2, there was an inconsistency between the trends of change in perceptions and real-time UTCI temperatures during the day. The real-time UTCI temperatures did not vary significantly during the day. In addition, the mean overall comfort level voting (MOCV) results from Site 2 were between −0.5 and −0, indicating that people were experiencing cold, even though the real-time UTCI temperatures were over 16 °C (
Figure 3). The selected data were correlated to the objective data through time; i.e., the average of three days (7, 9, and 16 March) were used as the subjective data for Measurement Point 1 on weekdays, the average of two days (11 and 18 March) as the subjective data for weekends, the average of three days (8, 10, and 17 March) as the subjective data for Measurement Point 2 on weekdays, and the average of two days (12 and 19 March) as the subjective data for weekends.
Through on-site observations, we found that perceptions of the outdoor microclimate were related to the time people stayed outdoors. When people were engaged in transient outdoor activities, such as walking a dog or walking to work, their responses to the climate were consistent with the actual weather. However, when people spent more time outdoors, such as sitting, standing, or playing, their responses were colder than the actual temperatures. At Site 1, more people passed by or stayed briefly, and fewer stayed for long periods, so their response to the microclimate was consistent with the actual temperature. At Site 2, more people stayed for long periods and fewer stayed for short periods, so their responses to the microclimate were not consistent with the actual temperature.
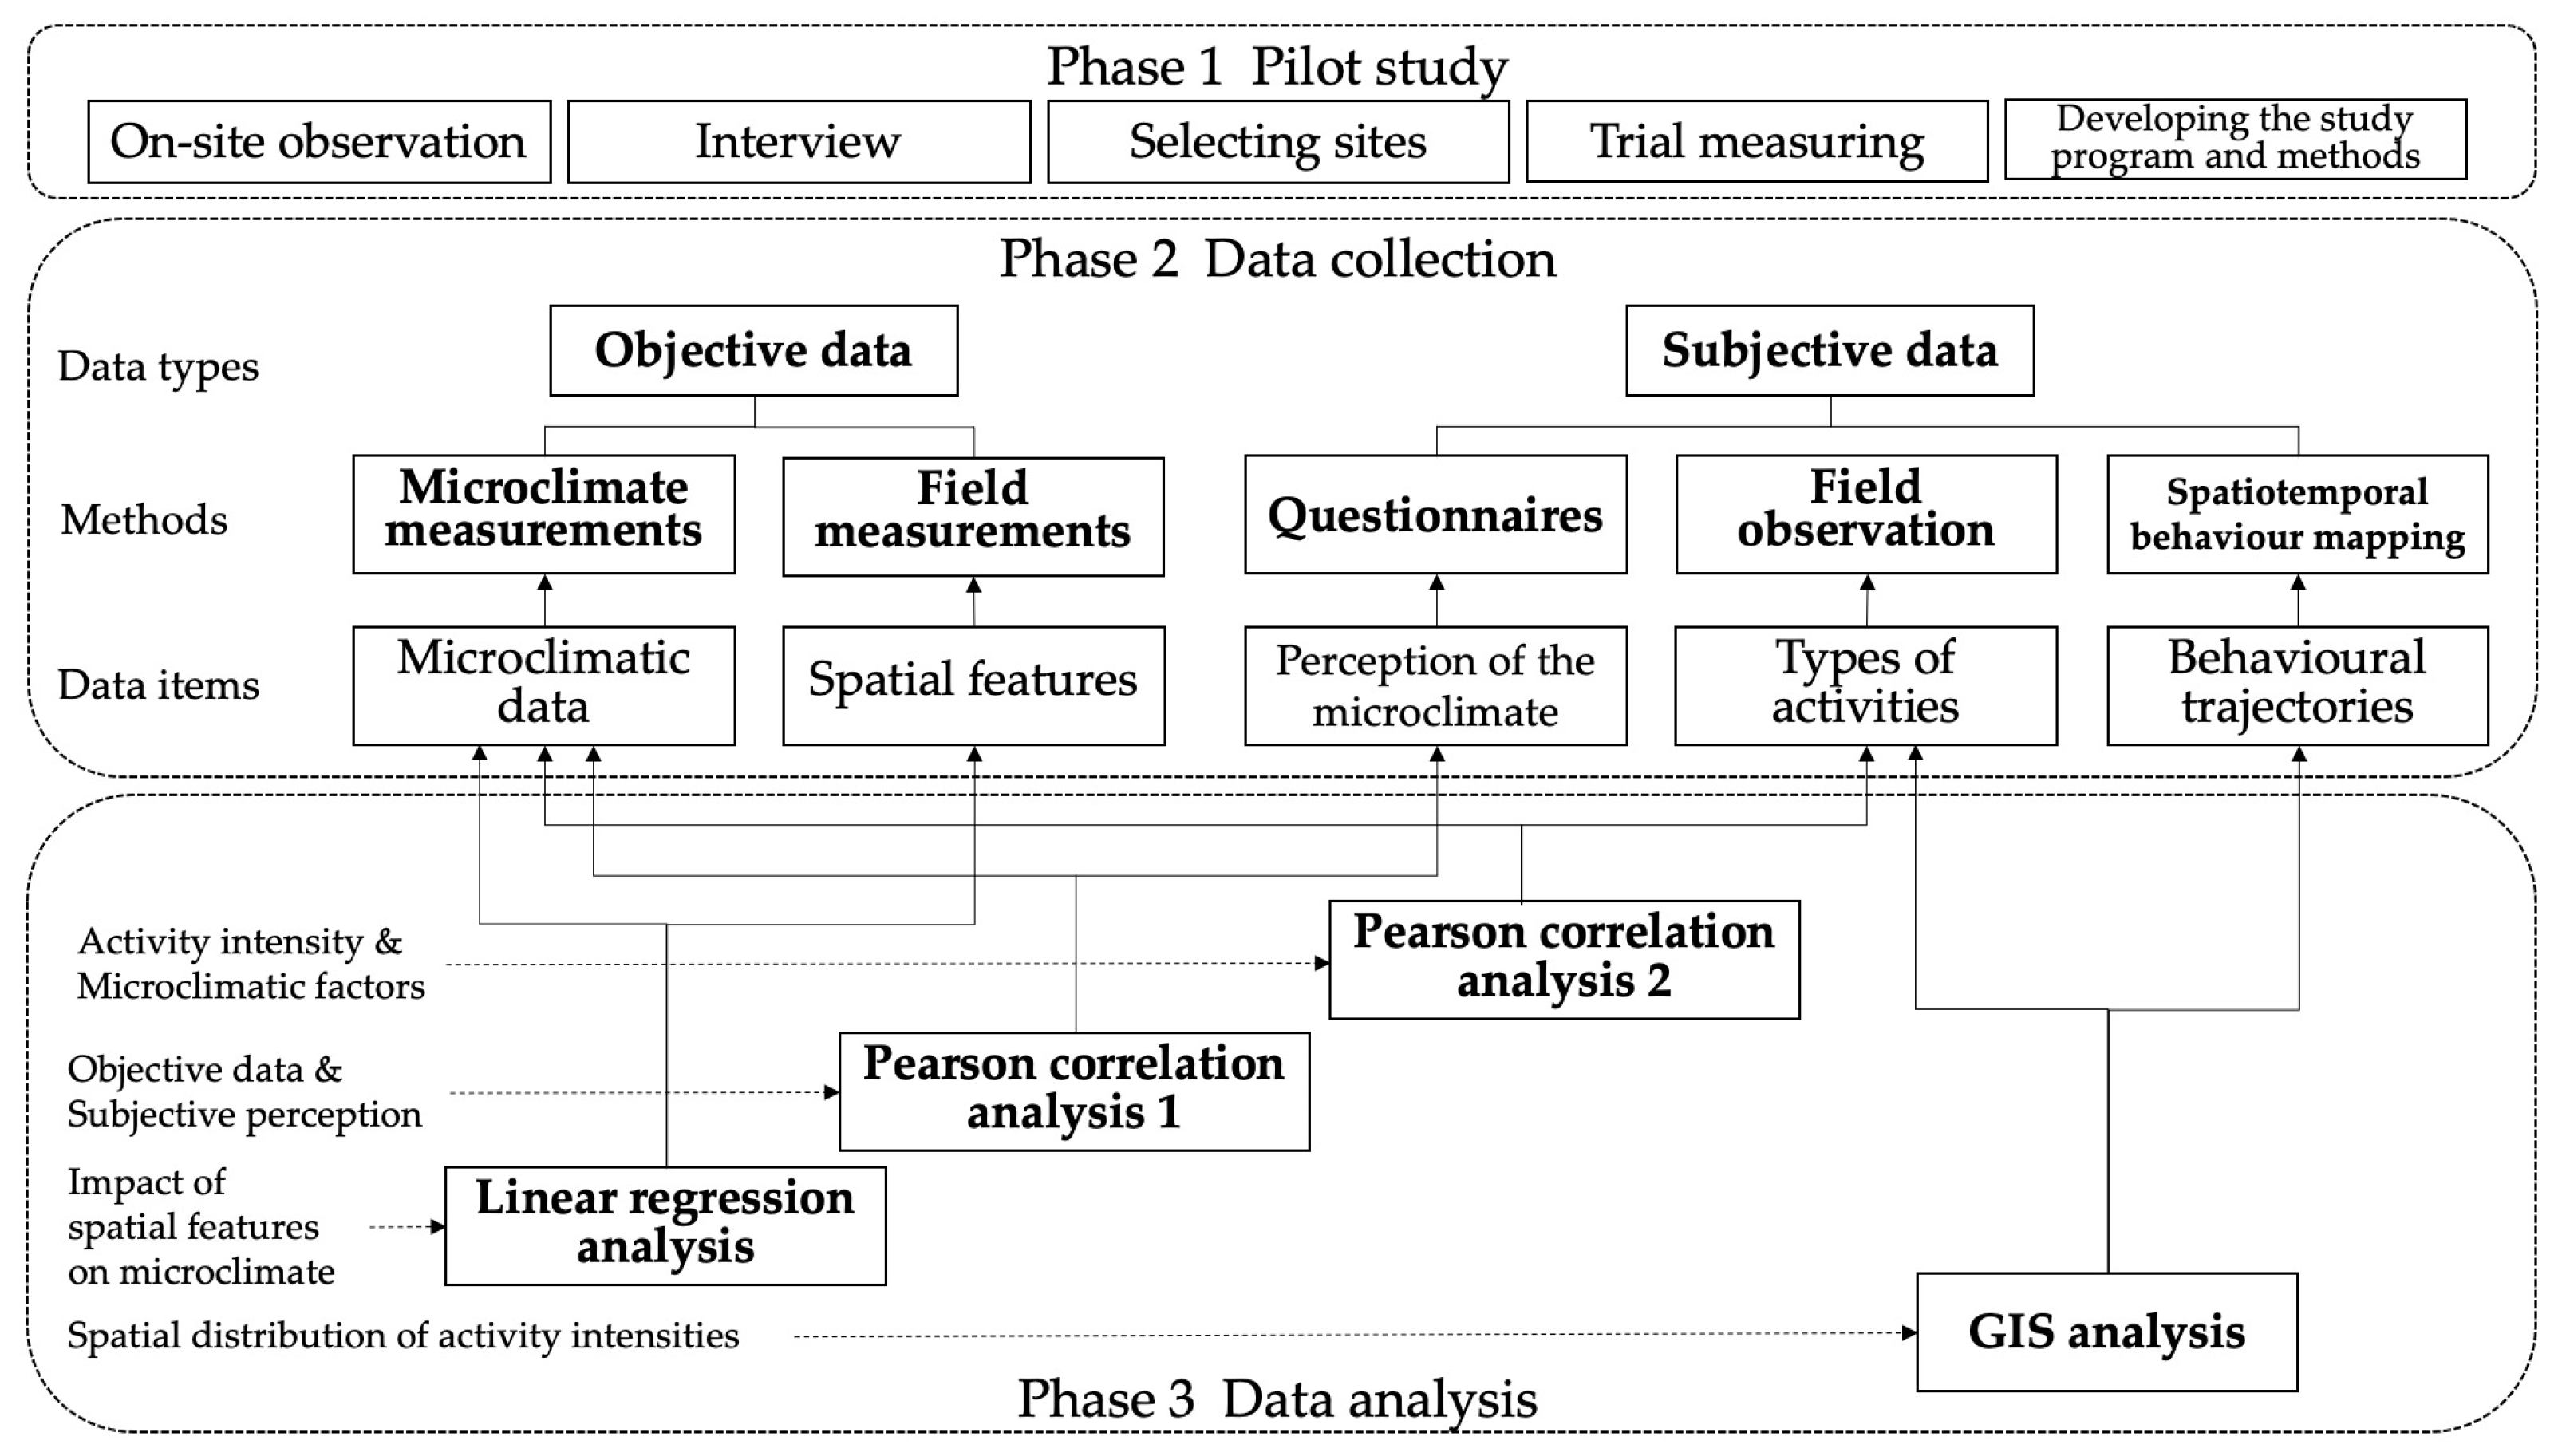
To determine which microclimatic factors were associated with perceptions, we performed a correlation analysis. A normality test was conducted for MOCV and each microclimatic factor. The results showed that MOCV and all the microclimatic factors possessed the quality of normality; therefore, we chose the Pearson correlation analysis method. According to the results, we found that the MOCV in Site 1 was positively correlated with the air temperature (r = 0.985 *,
p = 0.015) and the radiation temperature (r = 0.959 *,
p = 0.041), whereas the MOCV in Site 2 was negatively correlated with the wind (r = −0.983 *,
p = 0.017) (
Table 8). Therefore, the MOCV at Site 1 had a strong linear relationship with the air temperature and radiant temperature; i.e., perceptions were primarily influenced by the air temperature and radiant temperature. The MOCV at Site 2 had a strong linear relationship with wind and a negative influence relationship; i.e., perceptions were mainly affected by wind, and the higher the wind speed was, the colder the subjective experience was.
Therefore, we concluded that the perception of the microclimate was related to the length of their exposure time and various microclimatic factors. The shorter the time people spent outdoors was, the more accurate their response was compared to the actual conditions, and the longer the time people spend outdoors, the more susceptible their response is to personal factors. In addition, the perception of people under the same weather conditions can be influenced by various microclimatic factors. These factors may have different effects at different sites, possibly related to their spatial features.
3.2. Activity Intensity and Trajectories Concerning Microclimatic Factors
Through field observations, we found that human exposure times were related to the type and intensity of the activities performed. Medium-intensity activities were all short-stay activities, such as walking a dog, walking for pleasure, or walking to work or class, and were present on the sites for an average of no more than 30 min. In contrast, both low- and high-intensity activities had longer outdoor exposures. For example, typical low-intensity activities were sitting and standing, and typical high-intensity activities were children walking and playing. Both activities lasted on the sites for more than one hour on average.
To explain the relationship between activity intensity and microclimatic factors, we performed a correlation analysis between the number of people with different activity intensities and various microclimatic factors. A normality test was conducted for the number of people with different activity intensities and each microclimatic factor, and the results showed that activity intensities and all the microclimatic factors possessed the quality of normality; therefore, we chose the Pearson correlation analysis method. Activity intensity had a strong linear relationship with air and radiation temperatures and was negatively correlated with air temperature and positively correlated with radiation temperature (
Table 9).
However, these correlations differed between the sites. At Site 1, we found a negative correlation (r = −0.965 *, p = 0.035) between high-intensity activities and air temperature; i.e., the higher the air temperature, the lower the number of people engaged in high-intensity activities (e.g., children walking and playing). While both low-intensity (r = 0.950 *, p = 0.050) and high-intensity activities (r = 0.997 **, p = 0.003) were positively correlated with radiation temperature, the correlation between high-intensity activities and radiation temperature was even more pronounced; i.e., the sunnier it was, the more active both low- and high-intensity activities were. At Site 2, only low-intensity activities were correlated with microclimatic factors; i.e., they were negatively correlated with air temperature (r = −0.988 *, p = 0.012) and positively correlated with radiation temperature (r = 0.971 *, p = 0.029). The number of low-intensity activities decreased with increasing air and radiation temperatures and that low-intensity activities (sitting and standing) were more likely to occur in sunny locations. Medium-intensity activities were not associated with microclimatic factors at Sites 1 or 2.
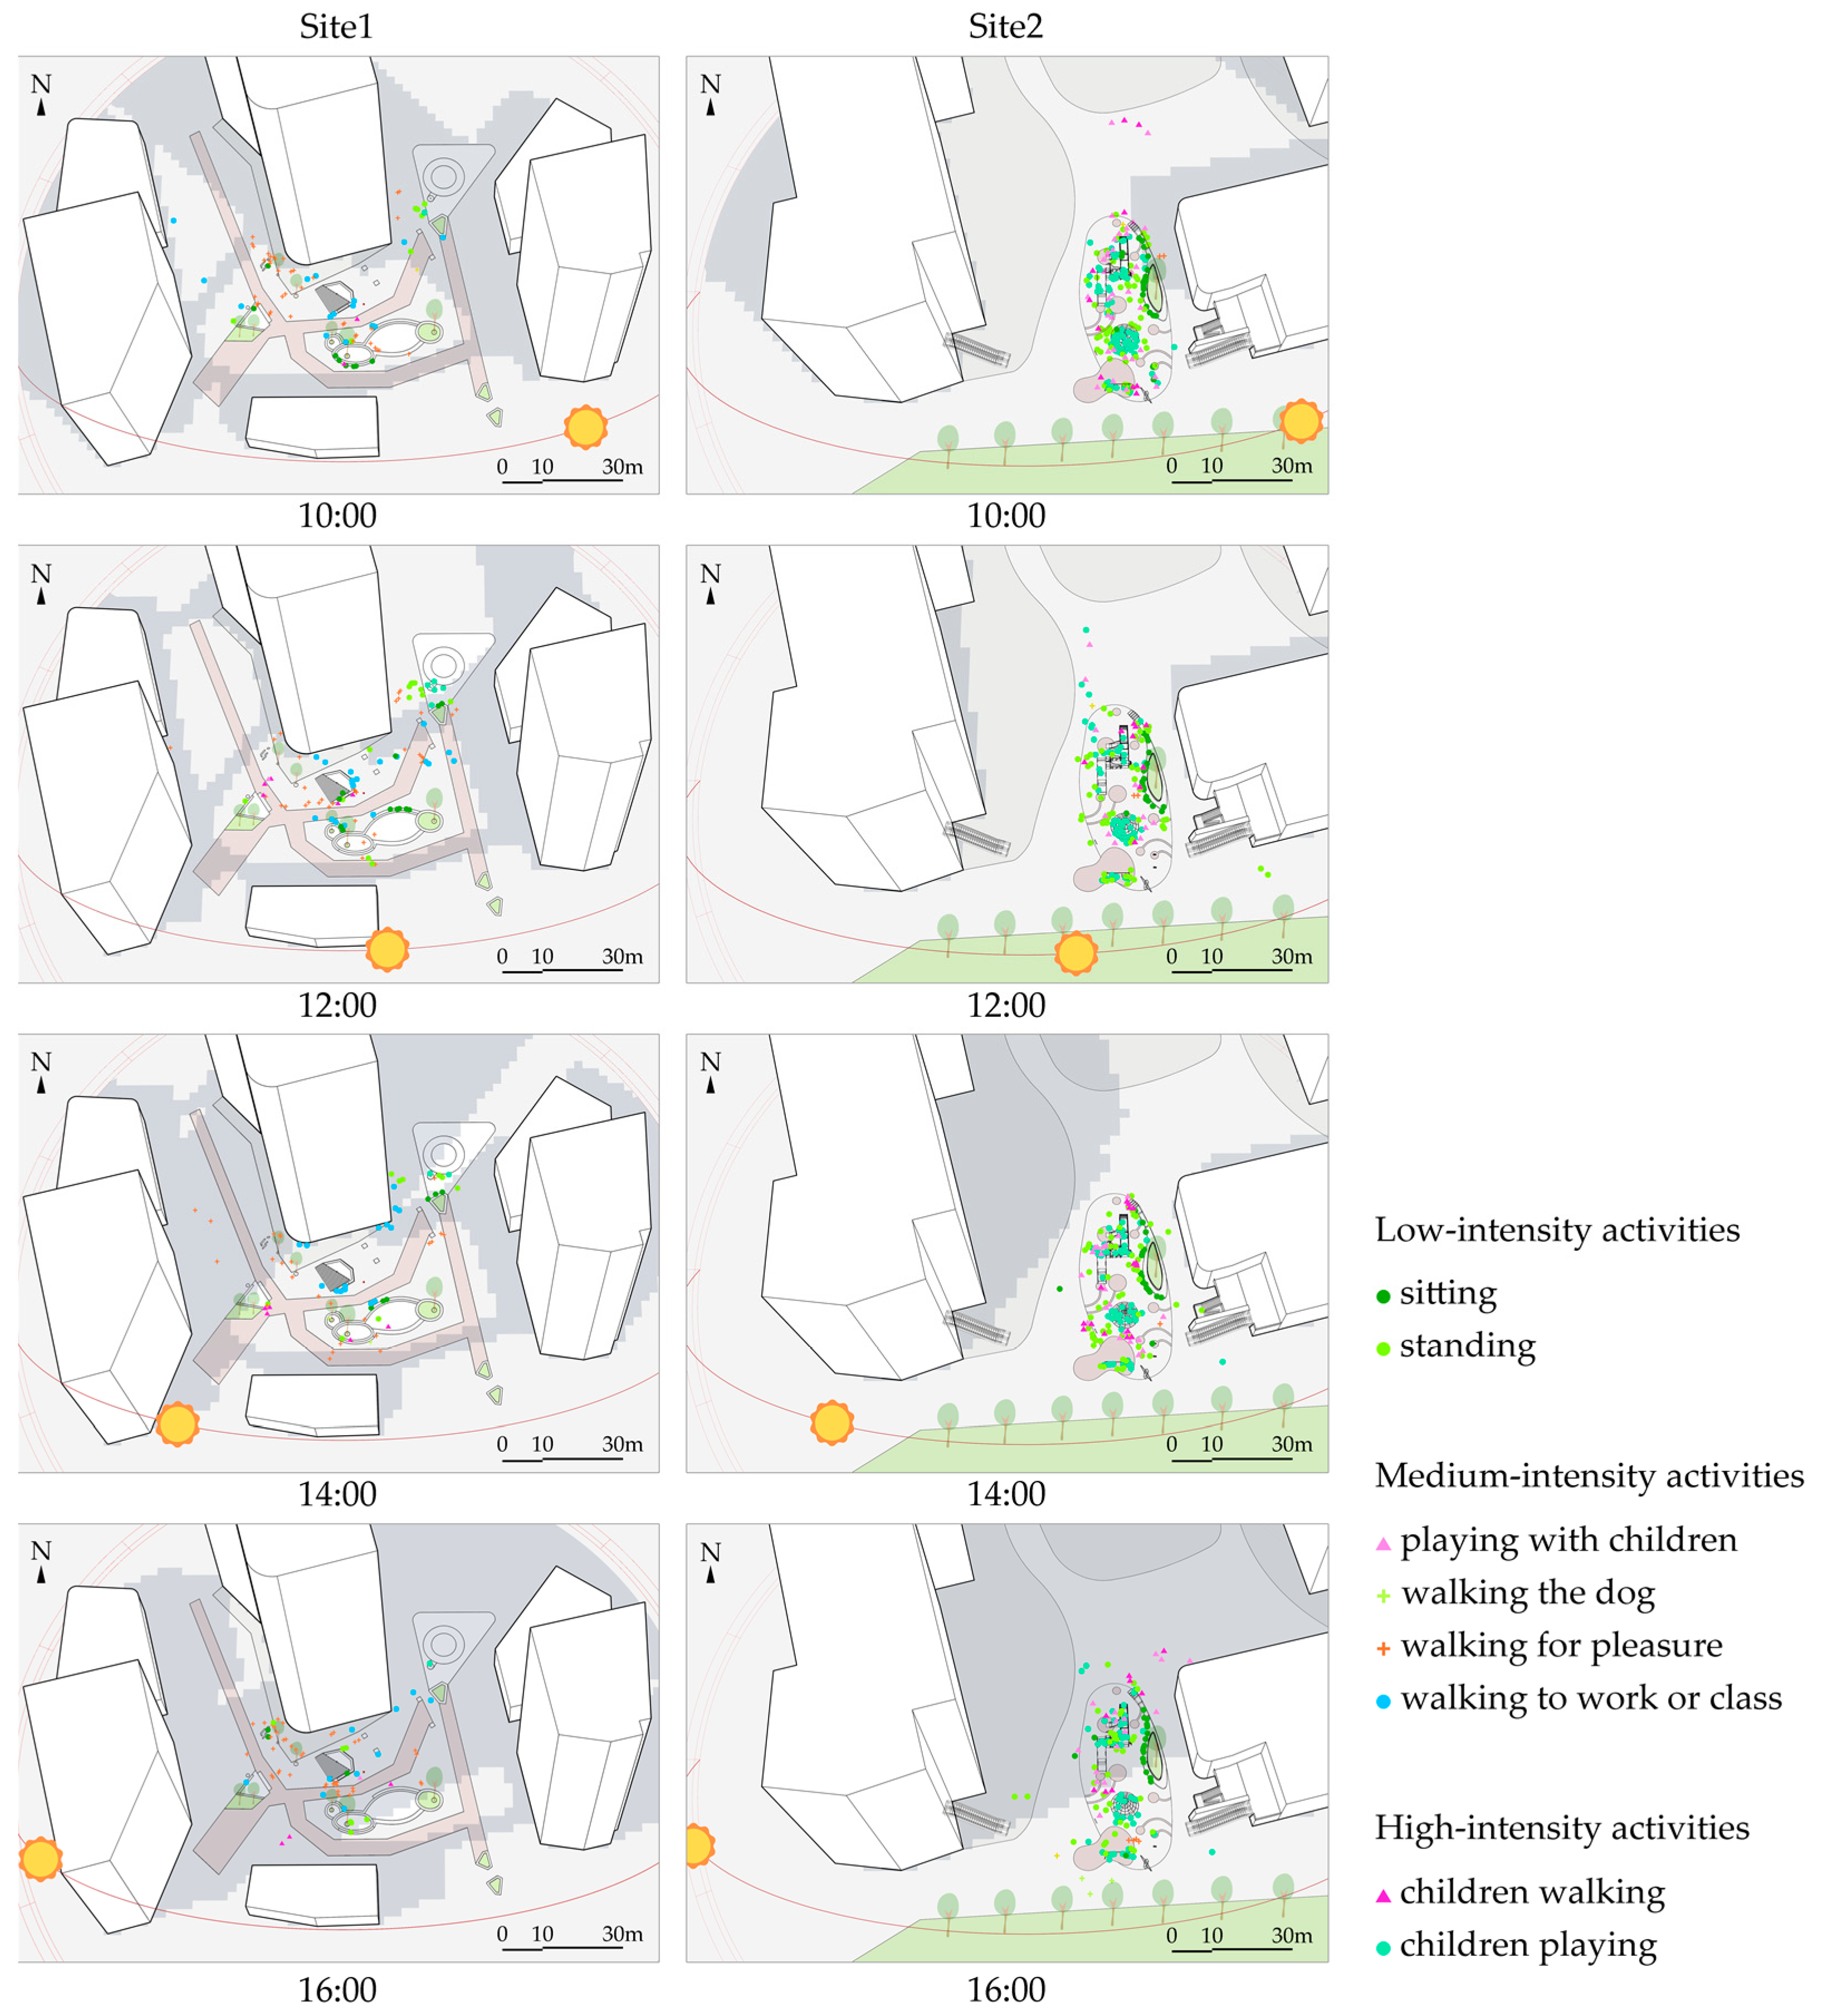
Therefore, we concluded that the microclimate was more likely to affect the types of activities that were performed outdoors for longer periods, such as low- and high-intensity activities, while it did not affect the types of activities that were performed outdoors for shorter periods, such as medium-intensity activities. During the transitional season, air and radiation temperatures were more likely to affect low- and high-intensity activities. Because air and radiation temperatures affect low- and high-intensity activities differently and to different extents at the two sites, we further analyzed the spatial features of the sites where low- and high-intensity activities occurred and related the spatial characteristics to microclimatic factors. We marked human activities on the GIS according to different activity intensities at four selected time points (10:00, 12:00, 14:00, and 16:00) on the day (
Figure 4) obtained by the STBM method.
We observed different activity trajectories for different activity intensities at the two sites. At Site 1, the activity trajectory of low-intensity activities (mainly sitting and standing) varied with the position of the sun; specifically, human faces were always turned back in the direction of the sun. High-intensity activities (mainly children playing) occurred on the northward side of Site 1, a place completely in the shadow of the surrounding buildings at both 10:00 and 16:00. There was a slide for children that attracted both children and responsible adults watching them at this area. The number of people moving around increased with increased solar radiation, and the responsible adults caring for the children moved with the shadows of surrounding buildings and were always in places with optimal sun exposure. This phenomenon is consistent with the results presented in
Table 9.
At Site 2, low-intensity activities (mainly sitting and standing) were concentrated around an area of the playground, which was only affected by the shadows of the surrounding buildings at 16:00. The number of people engaged in low-intensity activities increased with increasing solar radiation, with people concentrated on the south side of the seats at 10:00, 12:00, and 14:00, and on the north side of the seats, in the shadows of the surrounding buildings, at 16:00, when air temperatures were also the highest of the day. In addition, we found that the movement tracks of high-intensity activities varied with wind speed. At 10:00, there was almost no wind, and the children and parents moved closer to the more open southern side of the site. At 12:00, the wind became stronger (v = 1.3), and the children and parents moved their activities to the north side of the site to gain shelter from the surrounding buildings. At 16:00, the wind became lighter (v = 0.8), and the children and parents moved back to the south side of the site to a more open area. As a result, the tracks of high-intensity activities at Site 2 were also influenced by the wind, which is not shown in
Table 10.
We determined that not only that the intensity and duration of activities were related to the microclimate but also that the trajectories of the activities were affected by the microclimate. All these changes were associated with spatial features.
3.3. Spatial Features Concerning Microclimatic Factors
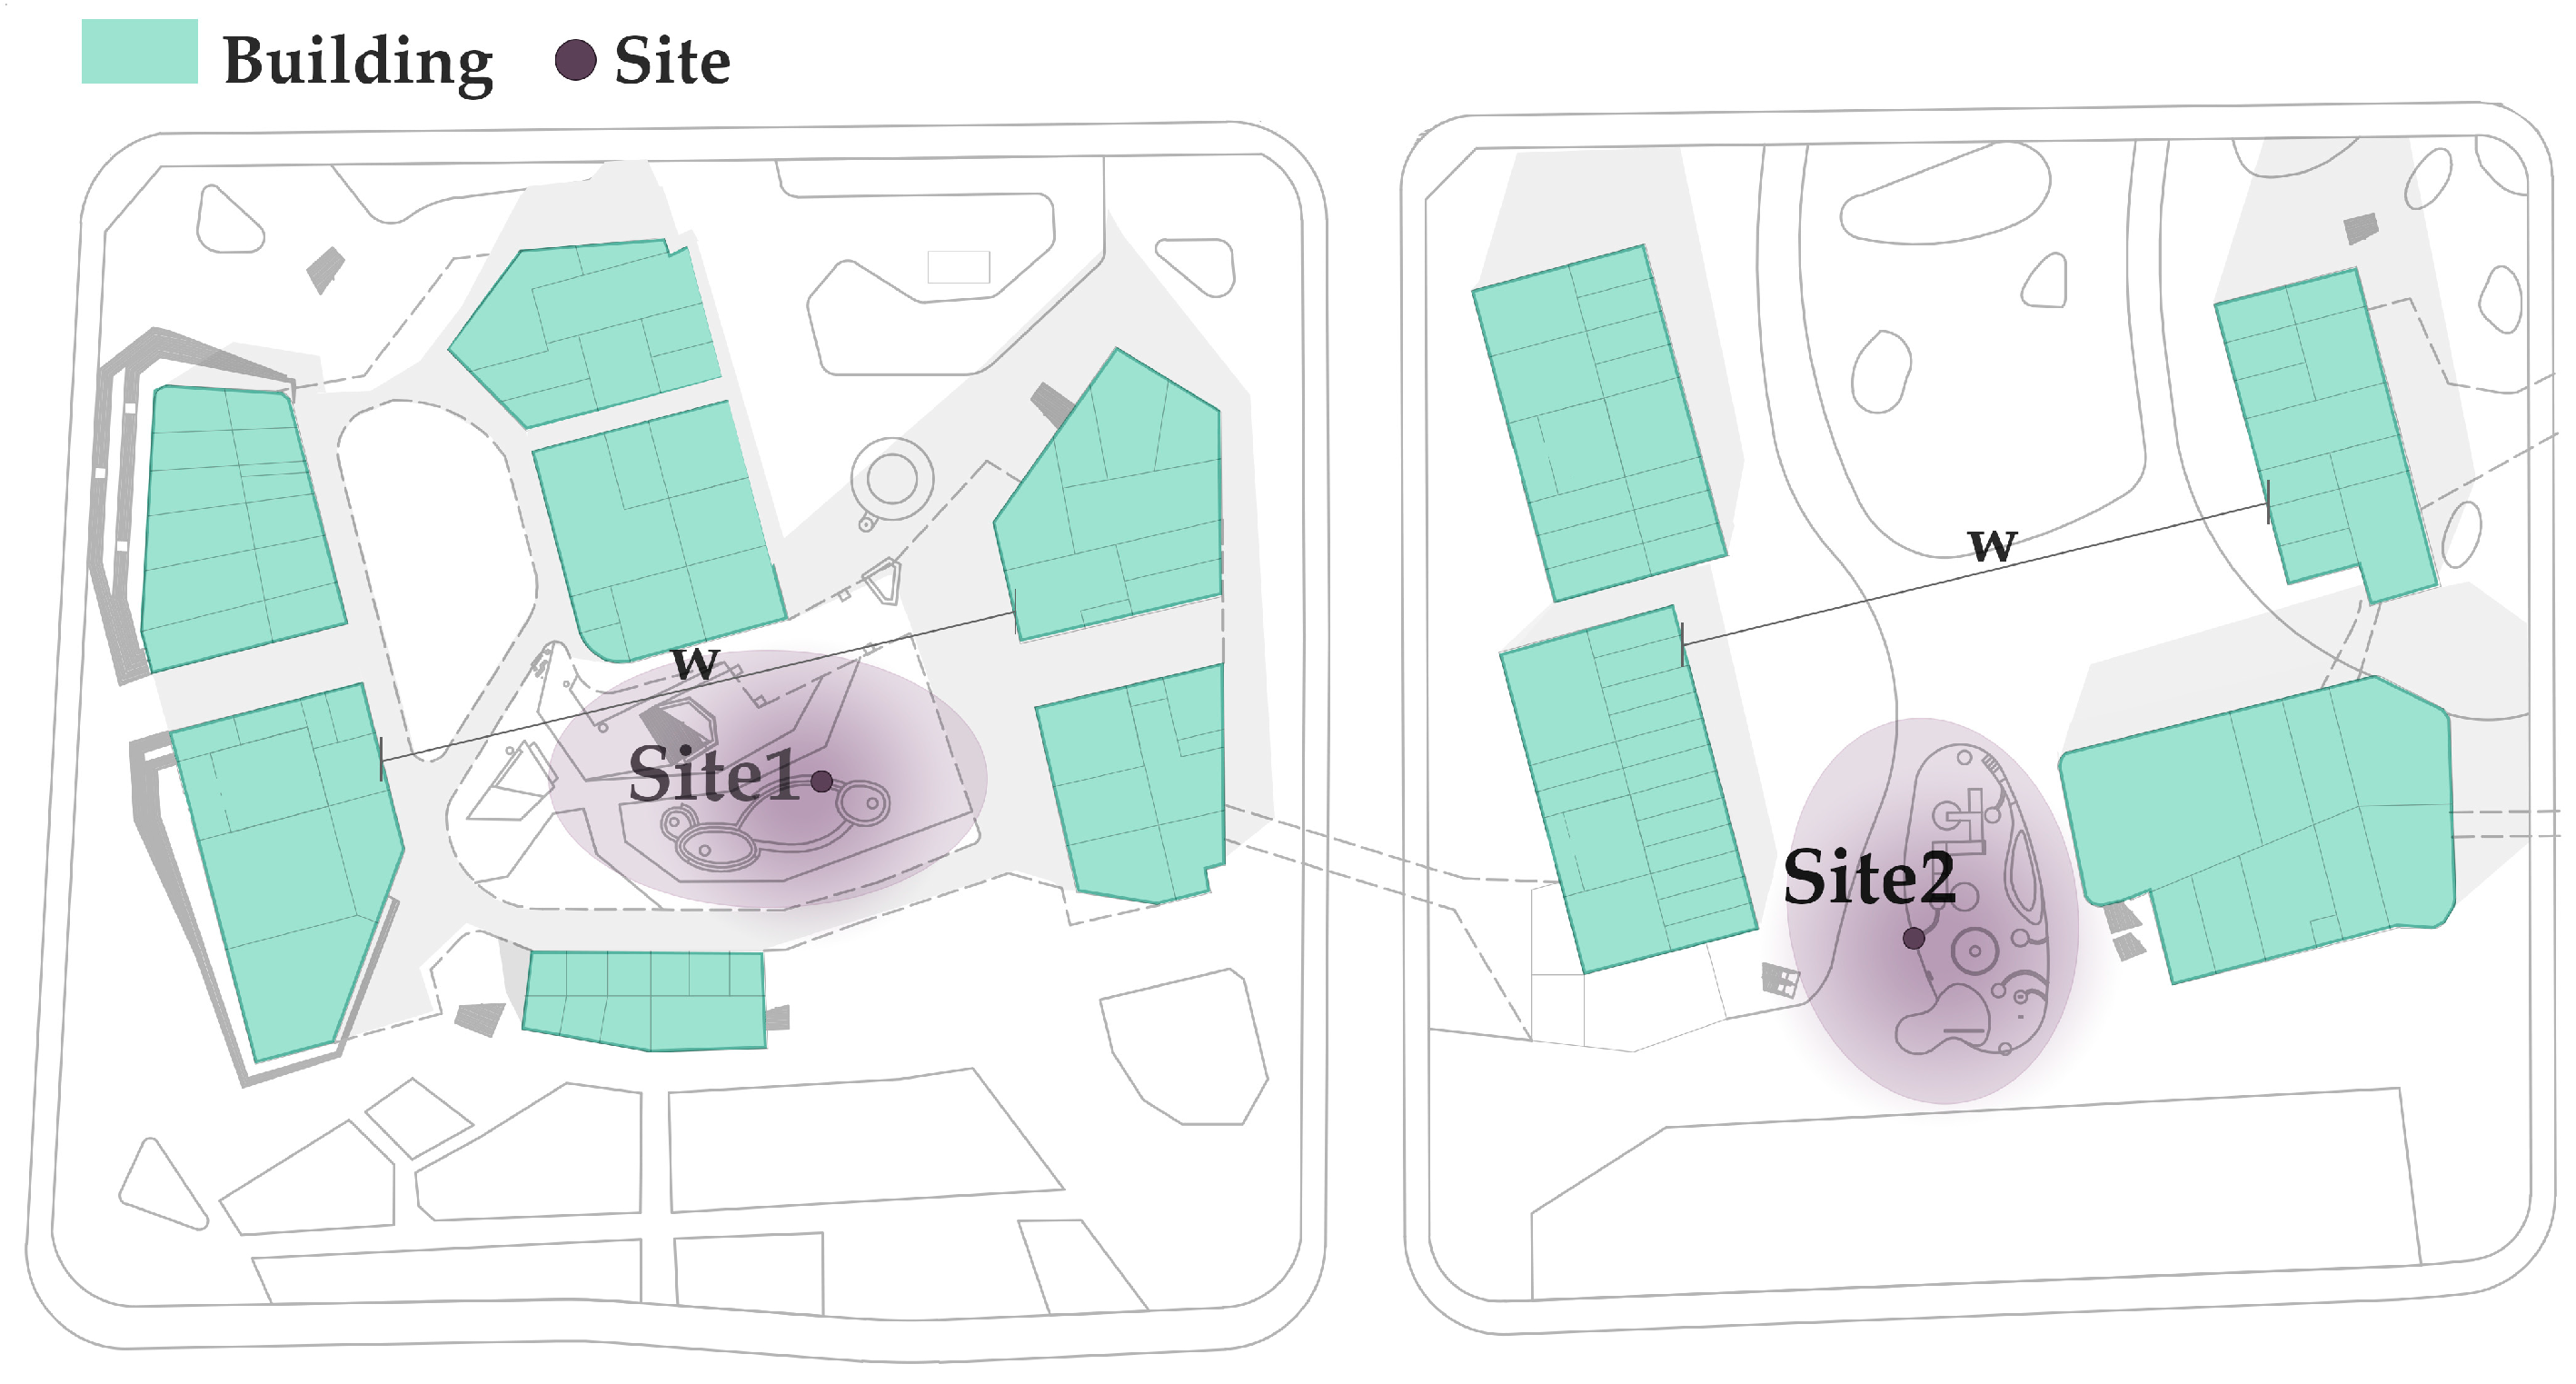
The results of 3.1 and 3.2 revealed that spatial features may influence the microclimate of the sites, the intensity of human activities, and human perceptions of microclimate. Therefore, we conducted a series of analyses to discover potential correlations among these three factors. Three indicators were used to characterize the physical features of the sites: H/W, SVF, and BVF. All three indicators were used to express the degree of spatial openness of the study sites (see
Table 10). We used these three indicators to perform a regression analysis with each factor and the subjective evaluation value of the microclimate to reveal the influence of physical space on the microclimate and human perception. The building layouts at the two sites also exhibited different patterns (
Figure 5).
In this study, we assumed that the spatial features of the buildings would have an impact on the microclimate. Specifically, it was examined whether the sky view factor (SVF) and building view factor (BVF) in the spatial features would have an effect on the UTCI, air temperature, wind speed, relative humidity, and mean radiant temperature in the microclimate (
Table 11 and
Table 12); we applied a linear regression model to analyze the interrelationships between SVF and BVF in the spatial morphology of the microclimate on the elements in the microclimate. The dependent variables are, respectively, UTCI, MOCV, air temperature (T
a), wind speed (V
a), relative humidity (RH), and mean radiant temperature (T
mrt). The independent variables are, respectively, SVF and BVF. We believe that, if there is an impact on the elements of the microclimate, this impact is linear. We used scatter plots to observe the correlation between the independent and dependent variables and analyzed the fit of the model to determine whether there were any covariance problems in the model before performing a linear regression analysis on the data. The scatterplot and fitting analysis proved that the independent and dependent variables have an association and that this association has covariance. Based on the results of the linear regression analysis of the SVF and microclimate, the SVF had a significant negative effect on the UTCI and air temperature. SVF did not affect MOCV or other microclimatic factors. A larger SVF meant more open space, a lower UTCI, and air temperature (
Table 11). Based on the regression analysis of BVF and microclimate, BVF had a significant positive effect on UTCI, air temperature, and mean radiant temperature and had a significant negative relationship with wind speed. The larger the area of buildings people saw, the higher the enclosure of the space; the higher the UTCI, the air temperature, and mean radiant temperature; and the lower the wind speed (
Table 12). H/W did not have any impact on microclimatic factors.
We took the conclusions from the linear regression analysis and compared them to the actual situation at Site 1 and Site 2 and found that the SVF value in Site 2 was higher than in Site 1. While the BVF value in Site 1 was higher than in Site 2, the mean UTCI and the mean air temperature in Site 1 were higher than in Site 2, and the mean wind speed were lower than in Site 2 (
Table 13). This was consistent with the results of the regression analysis described above.
A regression analysis of the microclimate by the spatial features revealed that none of the spatial indicators had an effect on subjective perception. In addition, spatial characteristics did not show an influential relationship with the intensity of the activity.
4. Discussion
4.1. Presence Does Not Mean Satisfaction
In most cases, the UTCI results did not account for the average perception of thermal comfort. Subjective differences in individual thermal comfort depend on human age, clothing, past experiences, and expectations. This study found that outdoor exposure time and environmental stimuli affected subjective assessments of thermal comfort.
At Site 1, people who completed our questionnaire predominantly passed through the site or stopped briefly. Particularly at lunchtime, the first floor of the buildings at Site 1 was dominated by food and drink outlets, and most people moving around at Site 1 were people coming to eat. People in Beijing rarely choose to dine outside, especially in March when the temperatures are still low. The shorter the time people spend outdoors, the more pronounced the environmental stimuli, and the more sensitive they were to thermal comfort. Their assessments of thermal comfort were less correlated with individual differences, past experiences, and expectations. In contrast, most of the people at Site 2 who were surveyed using our questionnaire stayed at the site for a longer period. The main reason for this was the presence of a children’s playground at Site 2 where children and accompanying parents tended to stay outdoors for more than an hour. These individuals have high requirements for both thermal and site comfort. Therefore, the perception of thermal comfort at Site 2 is inconsistent with the UTCI results. As outdoor exposure times increased, their assessments appeared to be on the colder side of the response, even though the UTCI results for that time indicated a comfortable temperature level.
This can be explained by the fact that, when people stay outdoors for a short period, their perception of thermal comfort is consistent with the objective climatic temperature, whereas, when they spend more time outdoors, their perception of thermal comfort is inconsistent with the objective climatic temperature. Their perception of weather is more susceptible to microclimatic factors, meaning that microclimates can impact their thermal comfort when they spend long periods outdoors. Microclimatic factors have different impacts on different sites. In contrast, the presence of more people at a site does not mean that people feel more comfortable there, but rather that a certain amenity at the site is more attractive, and that people are willing to contend with less comfortable climatic conditions to use the urban public space for necessary social and physical activities.
Therefore, the outdoor spaces are not necessarily satisfactory. This may be due to poor thermal comfort, rather than a lack of attractive spaces or facilities, as previously reported.
4.2. Spontaneous Human Behaviour Increases Possibility and Uncertainty
The presence of facilities such as seating and playgrounds is predetermined by the designer of the space, whereas how the place is used depends on the daily users and their spontaneous behaviors.
This study found that the main factor affecting human thermal comfort in Site 1 was the radiant temperature and the activities of people being more low-intensity activities, i.e., sitting and standing which are more dependent on seating facilities. Human choices of where to sit or stand changed according to the position of the sun. In the colder month of March, people were willing to be more exposed to the sun, so they chose to sit or stand in positions where they could be exposed to the sun and kept their backpacks facing the sun rather than their faces. We can assume that, in the warmer summer months, people choose to sit or stand in locations that do not have direct sunlight and try to hide in the shadows of surrounding buildings for a cooler resting place. Therefore, the seating facilities and resting places at Site 1 have more possibilities and uncertainties as the seasons change, and human needs for thermal comfort change from season to season. The main factor affecting people’s thermal comfort at Site 2 was wind, and the main activities were a mix of high- and low-intensity activities involving children playing and parents accompanying their children in the playground located in the core of Site 2. The trajectory of the children playing and the position of the parents sitting and standing changed depending on the wind speed and direction. In March, the wind was from west to east, and, when the wind became stronger, both children and parents moved to the north side of the site, where the surrounding buildings minimized the wind speed. When the wind became lighter, people moved to the south side of the site, where a more open space for activities was available. We speculate that, when summer arrives and the winds are generally from the southeast, people would prefer to be where the wind is blowing; the trajectory of human activities may change. Therefore, this change creates more possibilities and uncertainties in the design of playgrounds and seating facilities at Site 2.
As a result, existing fixed facilities on sites do not promote the better use of places or better experiences. Therefore, flexible and better climate-resilient designs are needed, for example, seats that can be moved flexibly, trees that provide more shade in the summer months, and walls that can block the wind.
4.3. Renewal of Spaces from a Microclimate Perspective to Improve Public Spaces
By analyzing the spatial features, we found that, although the two sites were in proximity, the spatial features of the two sites were different because of the surrounding buildings enclosing each other, resulting in slightly different microclimates. For example, the openness of Site 1 was smaller, the enclosure was higher, and the thermal comfort was more easily affected by the air temperature and radiation temperature. Site 2 was more open, and the thermal comfort was more easily affected by the wind. The H/W ratios of the two sites were sufficiently close that there was no discernible effect on the differences in the microclimate. Although spatial openness did not present a clear relationship of influence with human thermal comfort, they were mentioned in the questionnaire: “It’s got a great view and so I feel comfortable here.” (N45 in Site 2); “I think it’s a little windy here because it’s so open,” (N58 in Site 2); “It was too open, I feel a little cold,” (N77 in Site 2); “I feel comfortable sitting here,” (N32 in Site 1); “I usually like to stand here for a while because it’s warm here,” (N41 at Site 1); and ”I’d rather pass by here on my way to work than that square over there.” (N82 at Site 1). Therefore, we concluded that spatial features affect subjective thermal comfort. However, this impact was greater at the psychological level than on the objective environment.
However, we demonstrated that the aspect ratio and openness of a space can affect thermal comfort, making it difficult to change these indicators in an actual retrofit. Trees have a more pronounced effect on the thermal environment [
34], especially in the summer, when they can reduce the radiant heat in the environment through shading and enhance the thermal comfort of the environment. There was a lack of trees at both sites. At Site 2, hardly any trees or vegetation could be added to the design of trees and vegetation in the subsequent renewal of spaces. In addition, we considered adding small-scale amenities to help improve thermal comfort at the site.
5. Conclusions
Public spaces in the city are important places for human activities and public life; however, although many people use public spaces, they do not necessarily feel comfortable or satisfied but are forced to stay there because they have no alternative. There are often such public spaces in new towns around urban centers that have only been initially developed, but the scale of public spaces is not human-friendly. There is still great potential to design these public spaces further; therefore, deepening the design from a microclimate perspective is a more reasonable basis. From the perspective of improving the current problem, more trees that can survive in winter and have heavy foliage in summer could be placed in Site 1 to provide more shade around the seating facilities in summer and enhance the thermal comfort of people sitting there in summer. In Site 2, depending on the different wind directions in winter and summer, conifers that can block the wind in winter and deciduous trees that can provide shade in summer are arranged in the south-west direction and in the south-east direction, respectively. From the perspective of enhancing the quality of the environment, water features such as small pools and fountains can be added. Water features have the effect of improving the microclimate of local environments, such as filtering dust and lowering local temperatures to form a natural air conditioner. In addition, the sound of water flowing can also have the effect of enhancing mental pleasure, providing a higher level of comfort for people using the site.
From a human perspective, urban public spaces can promote physical activity, which is not limited to physical exercise but should also include people resting outdoors and commuting daily. Physical activities were categorized as low-, medium-, and high-intensity. An ideal public space would simultaneously support all three activity types well. This is an important assessment factor for the post-occupancy evaluation (POE) of outdoor public spaces. This study demonstrated the influence of outdoor thermal comfort on physical activity and showed that microclimatic factors affecting physical activity vary depending on the activity intensity. The modelling and assessment of the microclimate can also be an important method for POE in outdoor public spaces. In addition, the spontaneous activities of people in a place can bring more possibilities and uncertainties, providing more ideas for a redesign, for example, providing more moveable seats so that people can choose where to sit in the shade or where it is windy, and more soft paving instead of the current homogenized hard paving to allow people to make their own choices about where to walk.
The unique contribution of this study was to link microclimates with human perceptions, physical activities, and spatial characterization elements of public spaces in the service of a public space redesign. Previous studies demonstrated that microclimates affect the thermal comfort of the environment. However, this study confirmed that microclimatic factors, such as the radiation temperature and wind, are more capable of influencing the perception of human thermal comfort. In addition, spatial features, such as the openness of a space, can influence the formation of microclimatic differences, but to a lesser extent, and the impact on people is greater at the psychological level. For example, a more open space is psychologically cooler, while a more enclosed space is psychologically warmer. These effects are difficult to determine from an objective data analysis. These results provide policy makers with the means to achieve the goal of bringing existing empty, detail-poor public spaces to a more intimate scale from the perspective of improving local microclimates, and designers with more effective and innovative strategies for deepening design.
One limitation of this study is that the microclimate was not adequately modelled. Only the shadows of the sites were simulated over time and overlaid with human activities, which were used to analyze the influence of building shadows on human behavior. It also lacks a simulation of thermal comfort and wind speed, which influence human behavior, allowing for a more intuitive view of the impact of spatial layout forms, surrounding buildings, facilities, and vegetation on the microclimate and human activities, which can provide more rational design strategies. Another limitation of this study is the lack of modelling of soundscapes. Soundscapes brought about by heavy traffic or those brought about by natural sounds of water, birds, children’s play, etc. have a completely different impact on one’s outdoor experience. For an optimal outdoor experience, all sensory experiences should be considered together [
35].


