Article

Comprehensive Analysis of Mechanical, Economic, and Environmental Characteristics of Hybrid PE/PP Fiber-Reinforced Engineered Geopolymer Composites

1
Guangzhou Power Supply Bureau, Guangdong Power Grid Co., Ltd., China Southern Power Grid Co., Ltd., Guangzhou 510006, China
2
School of Civil and Transportation Engineering, Guangdong University of Technology, Guangzhou 510006, China
*
Author to whom correspondence should be addressed.
Buildings 2024, 14(4), 1094; https://doi.org/10.3390/buildings14041094
Submission received: 9 March 2024 / Revised: 6 April 2024 / Accepted: 10 April 2024 / Published: 14 April 2024
(This article belongs to the Section Building Materials, and Repair & Renovation)

Abstract

:
Engineered Geopolymer Composites (EGCs), known for their excellent tensile properties and lower carbon emissions, have gained widespread attention in the field of fiber-reinforced concrete. However, the high cost of high-performance synthetic fibers, a crucial component of EGCs, limits their practical engineering applications. In this study, by using low-cost PP fibers hybridized with PE fibers and adjusting the fly ash/ground granulated blast furnace slag (FA/GGBS) ratio, cost-effective, high-performing hybrid PE/PP-reinforced engineered geopolymer composites (H-EGCs) were developed. This study conducted axial compressive and tensile tests on H-EGCs with different FA/GGBS ratios (7:3, 6:4, and 5:5) and PP fiber replacement ratios (0%, 25%, 50%, 75%, and 100%), investigated the influence of FA/GGBS and PP fiber replacement ratio on static mechanical behavior, and evaluated the economic and environmental benefits based on mechanical performance indicators. The result indicated that the compressive strength of H-EGCs can reach 120 MPa when the FA/GGBS ratio is 5:5; however, an increase in FA/GGBS and PP fiber replacement ratio leads to a loss in compressive strength and elastic modulus. The incorporation of PP fibers in moderate amounts enhances ultimate tensile strain by reducing crack control ability, and the maximum tensile deformation capacity (7.82–9.66%) was obtained for H-EGCs with a PP fiber replacement ratio of 50%. The optimal economic and environmental benefits of H-EGCs are observed when the FA/GGBS ratio is 5:5 and the PP fiber replacement ratio is set at 50%.

1. Introduction

In the past few decades, intensive infrastructure construction worldwide has led to a sharp increase in the production of ordinary Portland cement. Manufacturing 1 ton of cement typically results in the emission of about 0.6 to 1.0 tons of carbon dioxide [1,2,3], accounting for about 5–8% of the annual global carbon emissions [4,5]. Enhancing structural performance and developing low-carbon building materials are effective measures for addressing this situation [6,7,8]. The continuous advancement of industrialization has led to the accumulation of a large amount of industrial waste, such as fly ash (FA) and blast furnace slag (GGBS) [9]. Meanwhile, due to the predominance of thermal power generation in China’s energy landscape [10], the stockpile of fly ash is expected to continue growing rapidly for a considerable period. In addressing this issue, scholars have endeavored to develop novel gel materials as partial or complete substitutes for Portland cement. In recent years, geopolymer has garnered widespread attention due to its notable characteristics, including high compressive strength, exceptional chemical resilience, and superior fire resistance [11,12,13]. Using silica–alumina-rich volcanic ash as a precursor material (such as metakaolin, FA, and GGBS), and employing alkaline activators (typically NaOH, Na2SiO3, or Na2CO3), the material’s reactivity is enhanced, initiating hydrolysis and polymerization reactions, thereby forming geopolymer materials [14]. Compared to traditional cement, geopolymer can reduce approximately 55% to 75% of carbon emissions and about 36% of energy consumption, making it a promising alternative to cement [15,16,17].
To extend the application of geopolymer in broader fields, Engineered Geopolymer Composites (EGCs) utilizing geopolymer gels have been developed successfully [18,19,20]. Through the microscopic mechanical design of interactions between fibers and the mortar matrix, this material achieves multiple microcrack development and pseudo strain-hardening behavior, resulting in a tensile strain capacity exceeding 3% [19,21,22,23]. Ohno and Li [19] proposed an integrated design approach for Engineered Geopolymer Composites, optimizing the EGC mix proportions, resulting in an increased compressive strength of 43.1 MPa and improved ultimate tensile strain of 4.7%. Moreover, when compared to standard engineered cementitious composites, energy consumption was reduced by 11%, and carbon emissions were decreased by 55%. Kan et al. [23] introduced zeolite into fly ash-based EGCs and successfully increased the tensile ductility to 8.62%. Nguyễn et al. [24] developed fly ash-based EGCs with an ultimate tensile strain of 13.7%.
Currently, high-performance synthetic fibers, such as Polyvinyl Alcohol (PVA) fibers or Ultra-High Molecular Weight Polyethylene (UHMWPE) fibers (referred to as PE fibers), are commonly employed in EGCs to achieve their high tensile performance. However, these high-performance synthetic fibers are generally associated with elevated costs, accounting for 54–70% of the overall material cost for EGCs [25]. Therefore, it is imperative to seek cost-effective alternatives to PE fibers or PVA fibers [26,27,28,29]. Peng et al. [27] developed low-cost EGCs using POM fiber hybridized with PE fiber. The carbon emissions were reduced by 56.8–65.3%, energy consumption was reduced by 24.2–34.2%, and the cost was reduced by 27.8–66.6%, compared to the traditional engineering cementitious composites. Polypropylene (PP) fibers possess high strength and corrosion resistance, and their cost is notably lower compared to that of PE/PVA fibers, making them excellent candidates as reinforcement materials for EGCs. However, the mechanism by which the hybridization of PE/PP fibers currently affects the mechanical properties of EGCs remains unclear.
On the other hand, fly ash-based geopolymer typically does not exhibit a mechanical performance advantage [30]. Due to the relatively low reactivity of fly ash, achieving desirable mechanical properties in fly ash-based geopolymer usually requires measures such as high-temperature curing and elevated alkaline content [29,30,31,32,33]. However, this process results in additional carbon emissions, contradicting the original intention of developing geopolymer concrete. The mechanical properties of fly ash-based geopolymer can be effectively enhanced by introducing GGBS with a higher CaO content [34,35,36]. Gao et al. [37] investigated the influence of the GGBS/FA ratio on reaction kinetics, gel characteristics, and compressive strength, revealing that an increase in slag content not only accelerates the reaction rate but also significantly improves the compressive strength of geopolymer. However, the increased GGBS content may lead to a decrease in flowability [38,39] and a shortened setting time [36], which are also important factors affecting the mechanical properties of geopolymer. Therefore, different FA/GGBS ratios will cause changes in the microstructure and mechanical properties of the EGC internal matrix and the fiber–matrix interface, which will inevitably affect the macroscopic mechanical properties. However, the influence of the FA/GGBS ratio on the mechanical properties of EGCs is currently unclear, and there are few reports on related research.
In order to comprehensively evaluate the mechanical behavior and economic and environmental benefits of hybrid PE/PP fiber-reinforced EGCs (H-EGCs) under different FA/GGBS ratios and PP fiber replacement ratios, this paper investigates three FA/GGBS ratios (7:3, 6:4, and 5:5) and five PP fiber replacement ratios (0% to 100%, with 25% increments) to analyze the axial compressive and axial tensile properties of H-EGC. It also assesses the economic and environmental performance to offer insights for designing cost-effective EGCs. Figure 1 depicts the research process of this paper in the form of a flowchart.

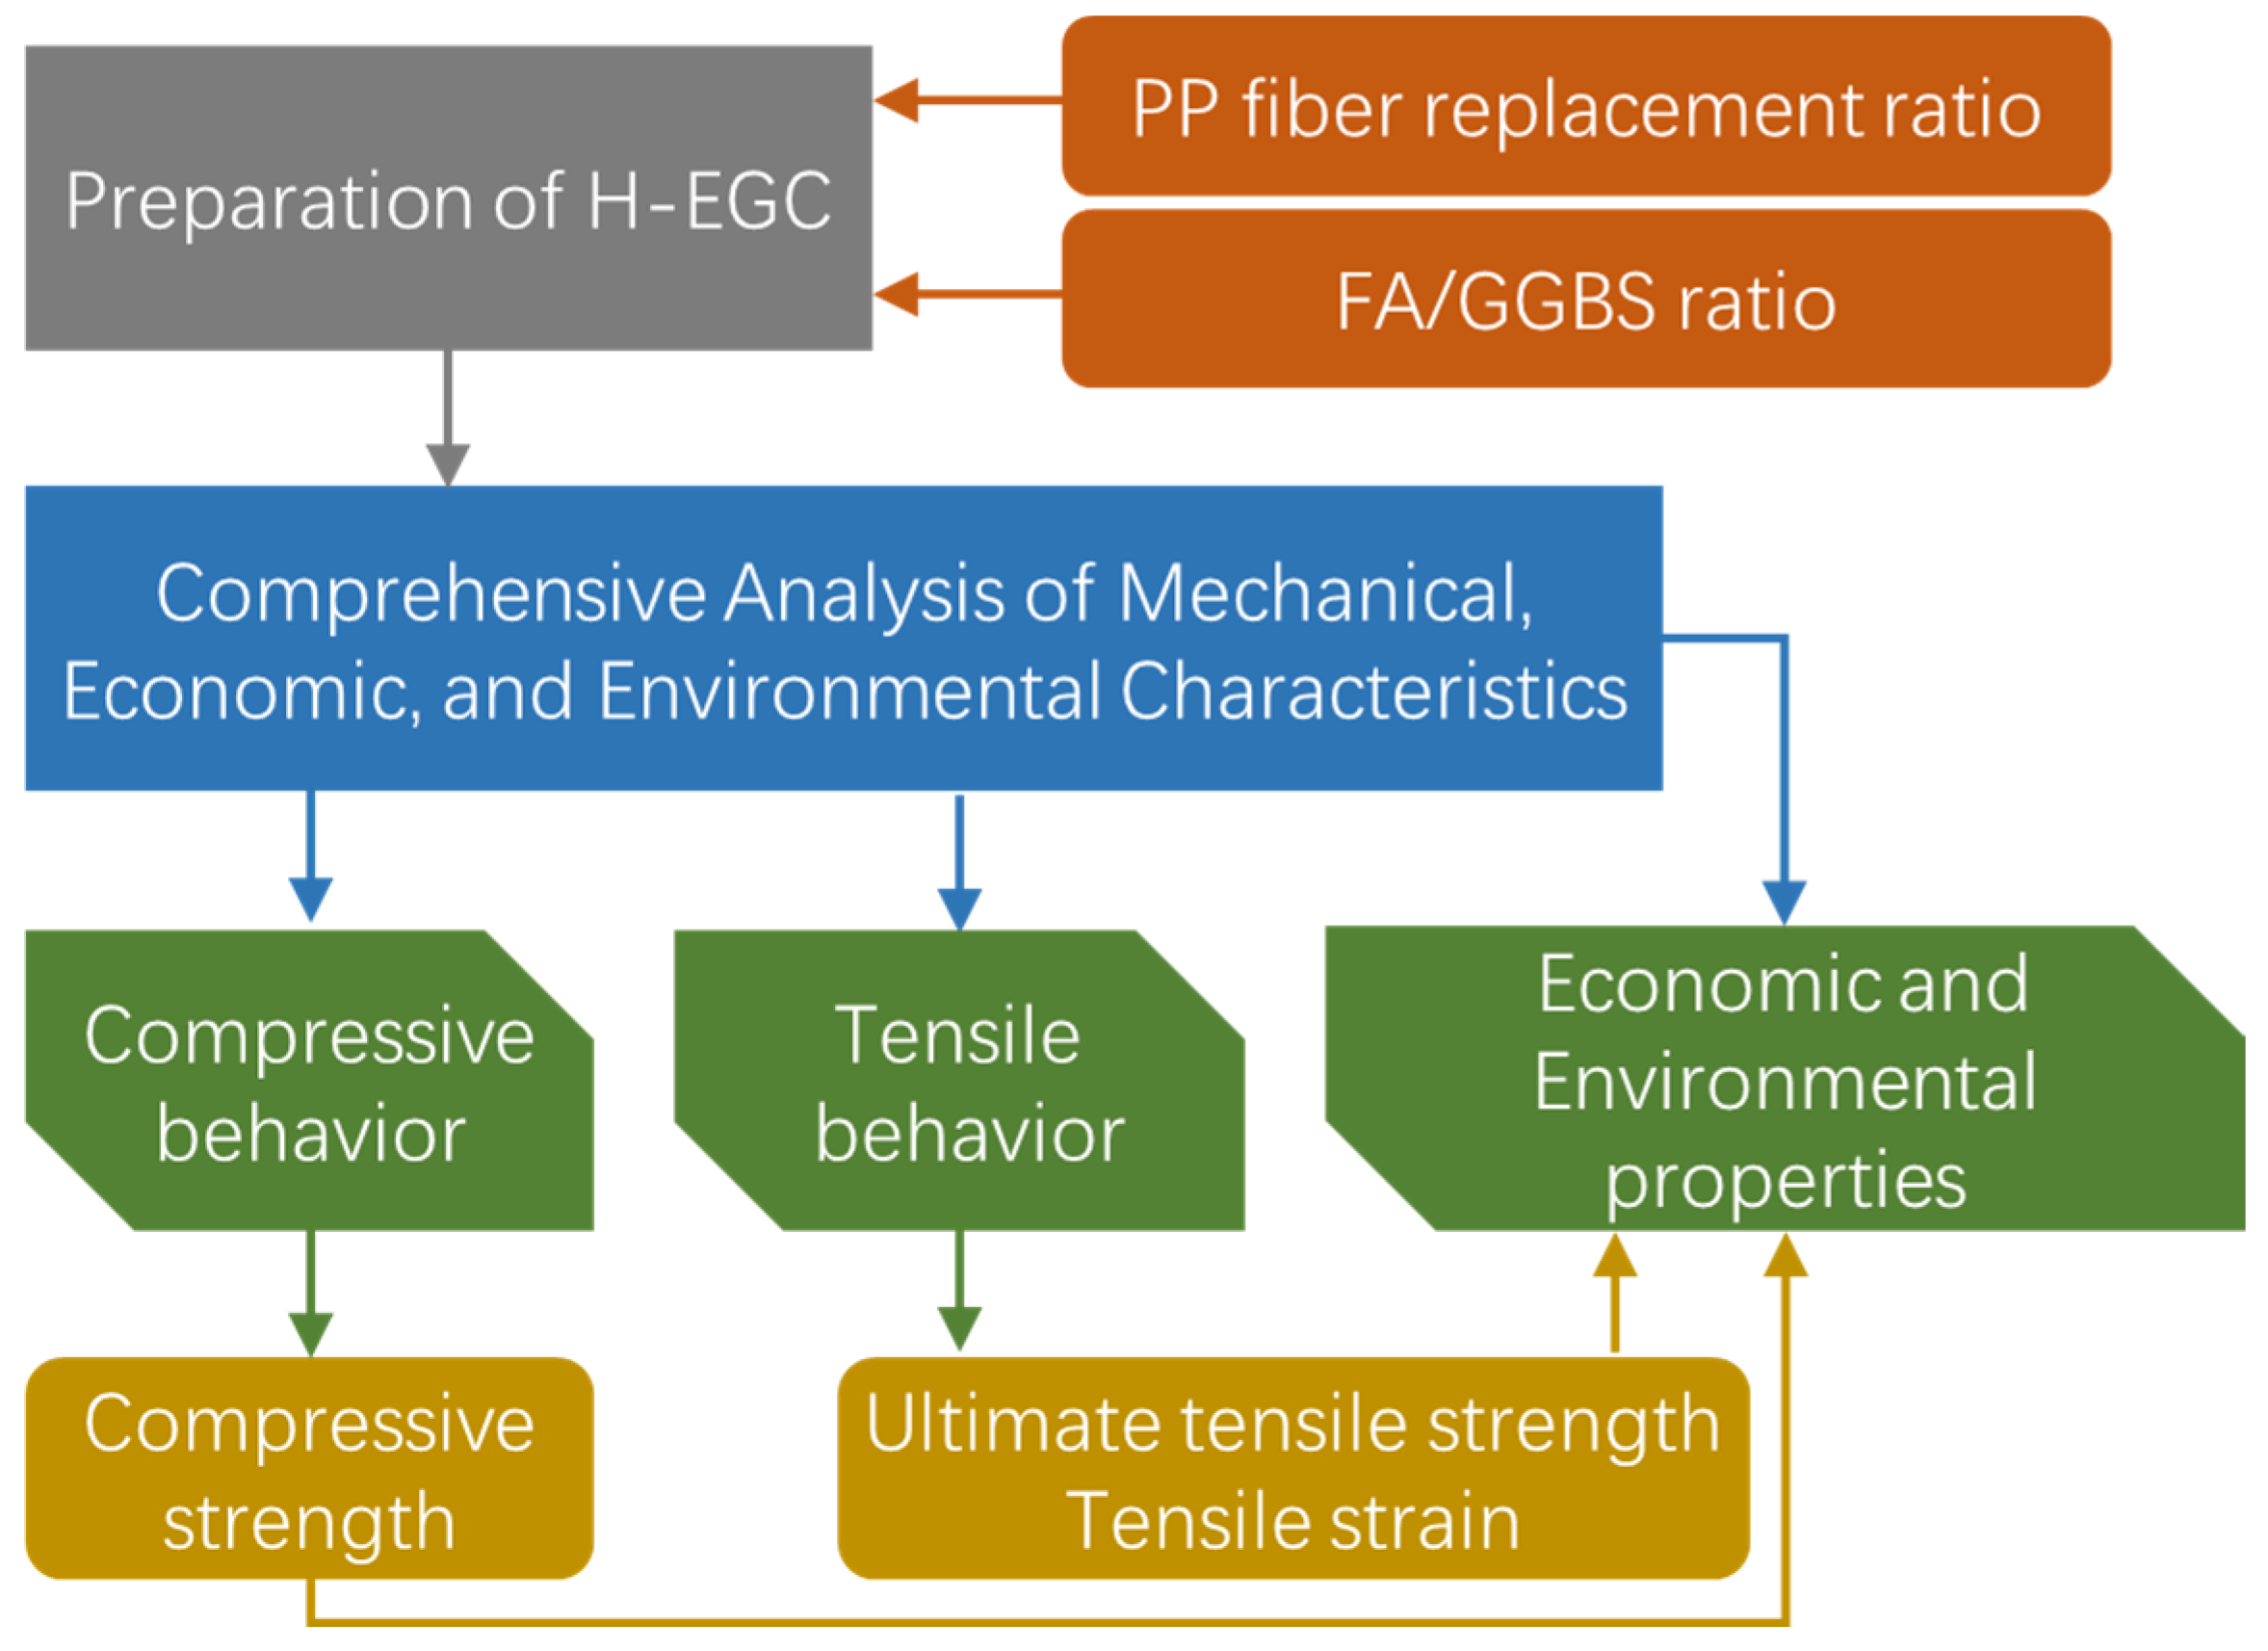
2. Materials and Test Methods
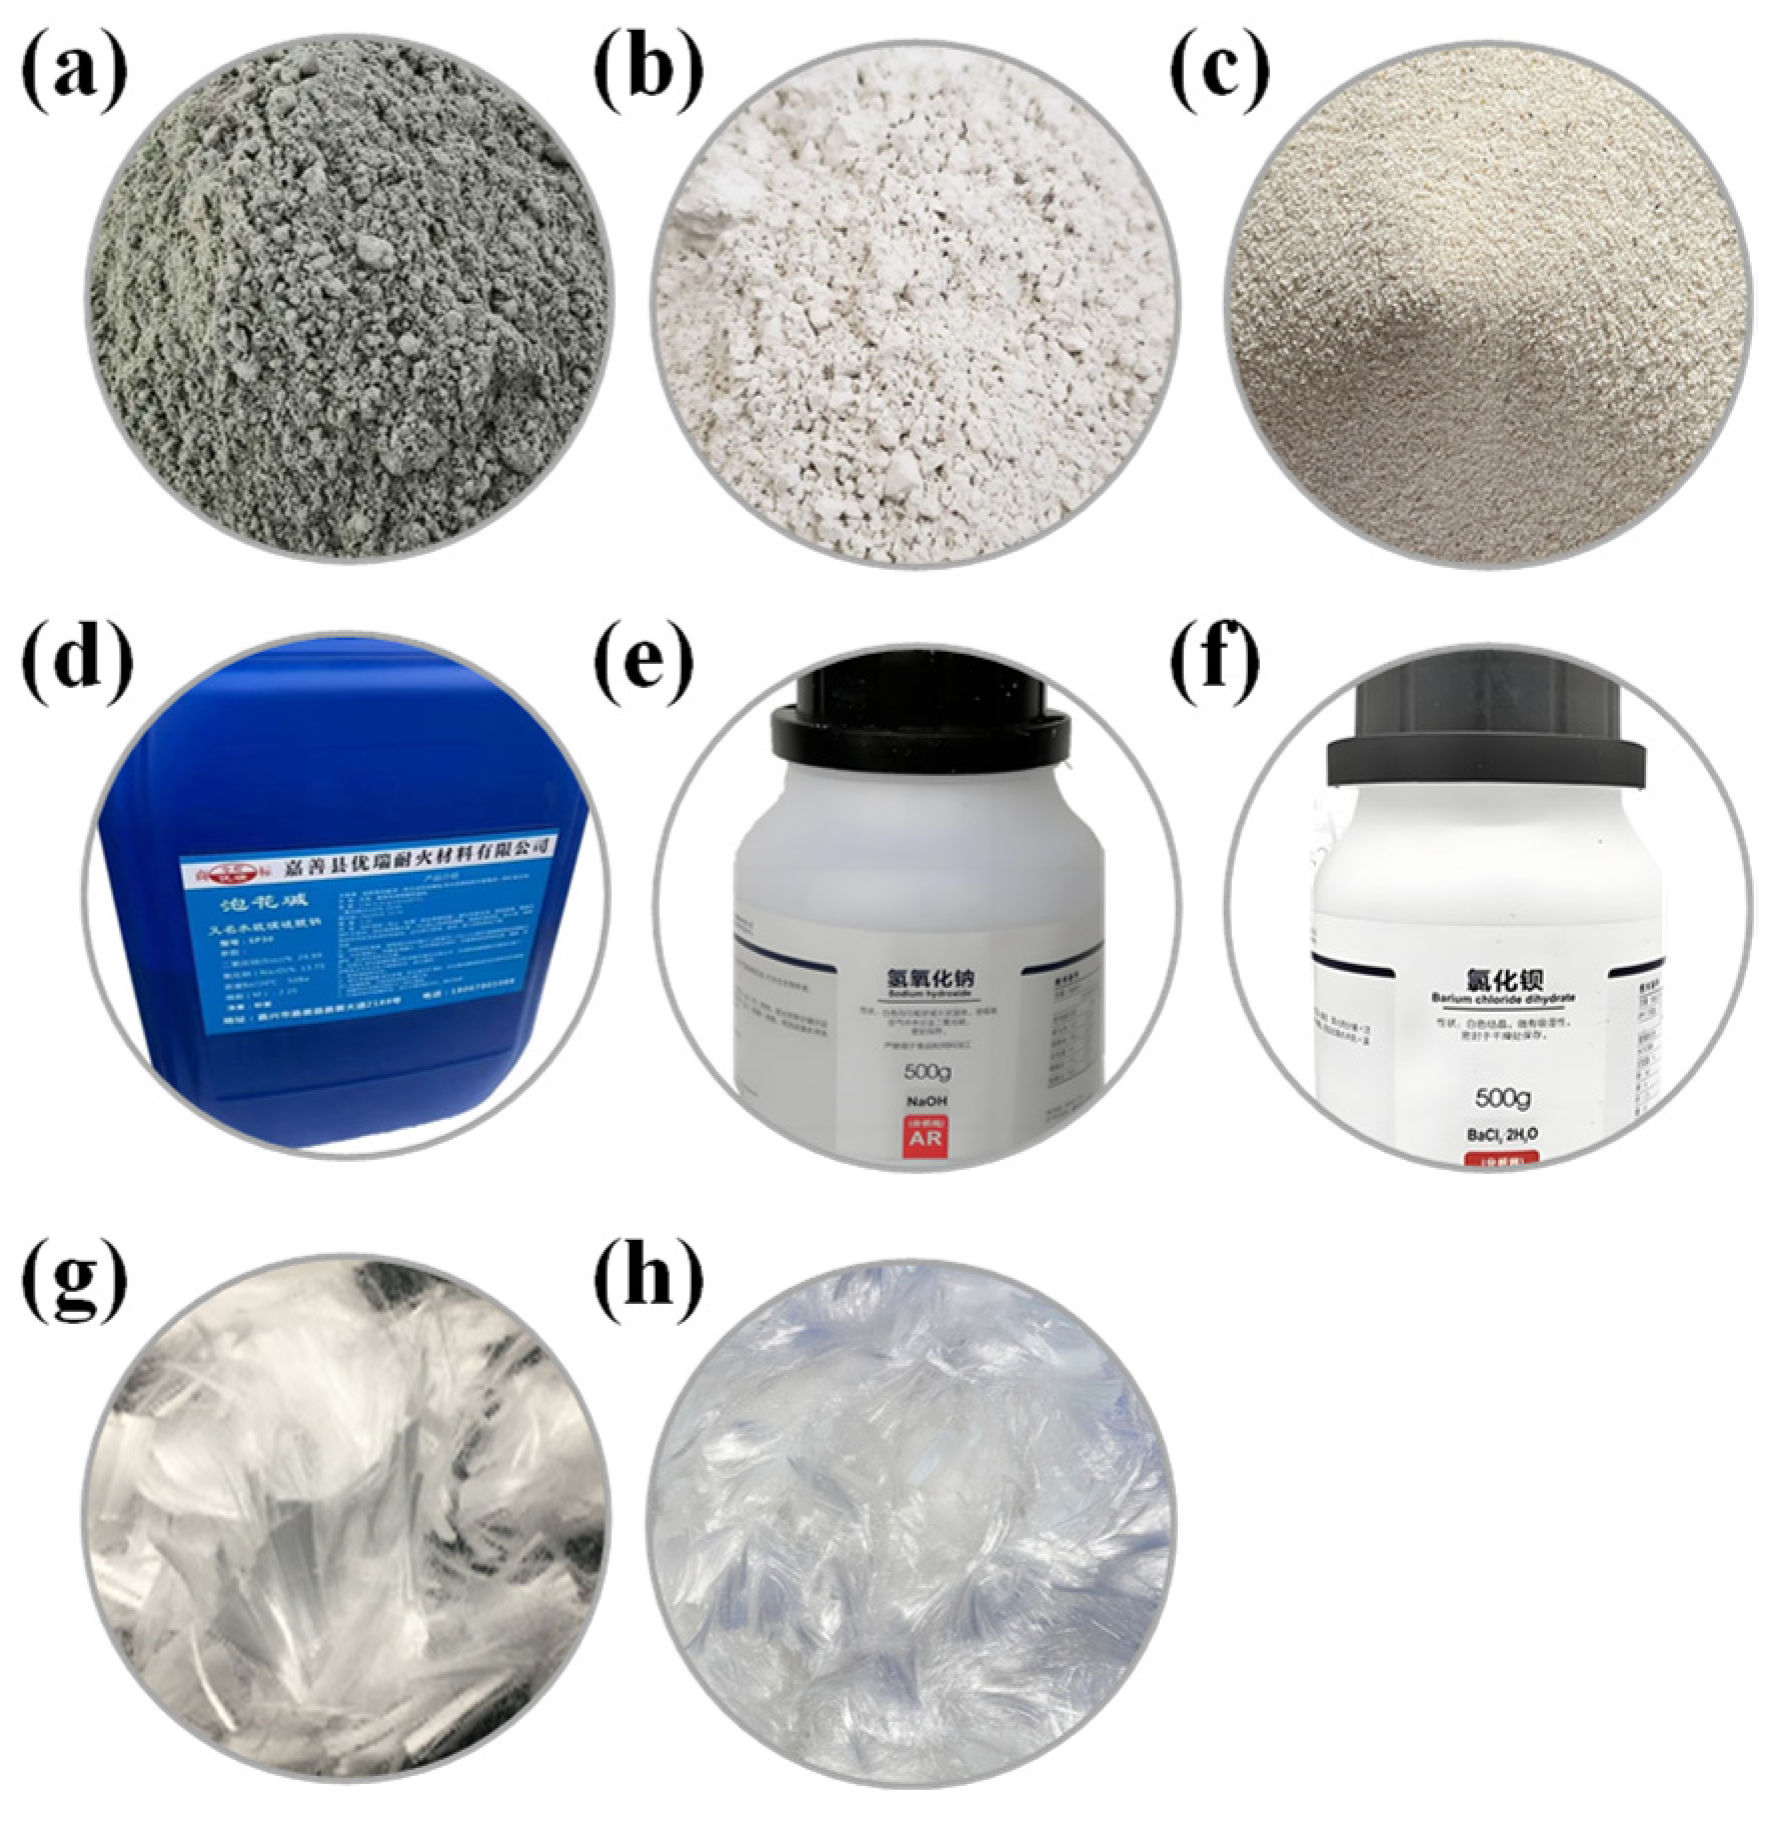
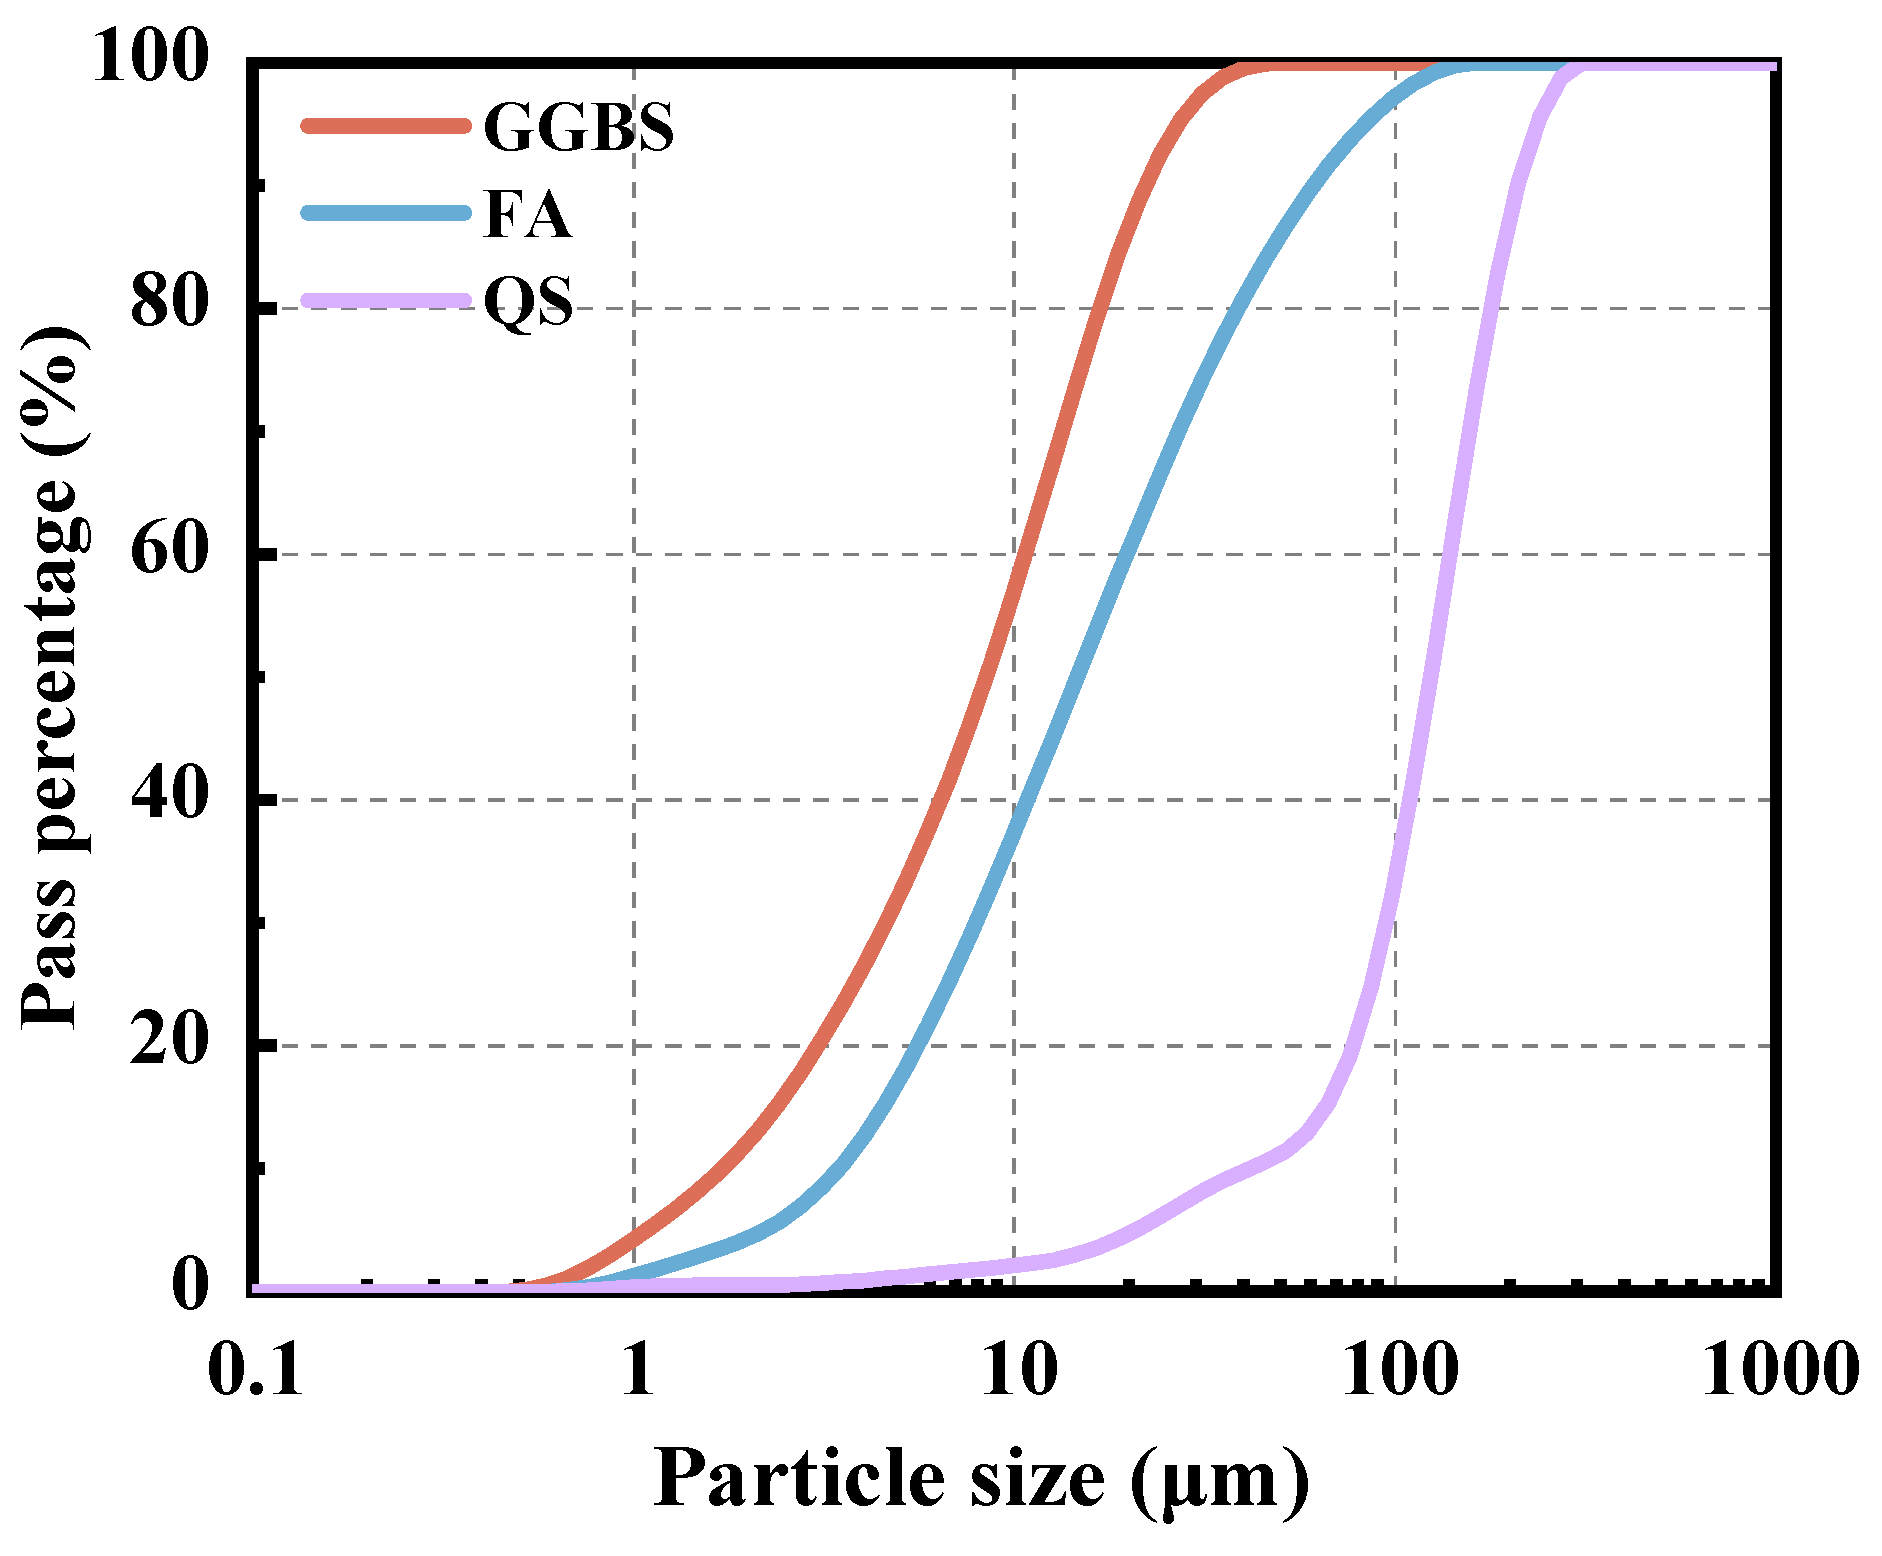
2.1. Raw Materials

The raw materials used for preparing H-EGCs in this study primarily include FA (Class F, grade I [40]), GGBS (S105 grade [41]), quartz sand (QS), sodium hydroxide, waterglass, PE fibers, PP fibers, a retarder (BaCl2), and water, as depicted in Figure 2. The waterglass modulus is 2.25, composed of 29.99 wt% SiO2, 13.75 wt% Na2O, and 56.26 wt% H2O. The varying elemental content within FA and GGBS is represented by their respective proportions of oxide masses, as shown in Table 1. The particle size distribution of FA, GGBS, and QS was determined using a laser particle size analyzer (Mastersizer 3000), and the results are shown in Figure 3. Table 2 provides the physical and mechanical parameters of PE and PP fibers.

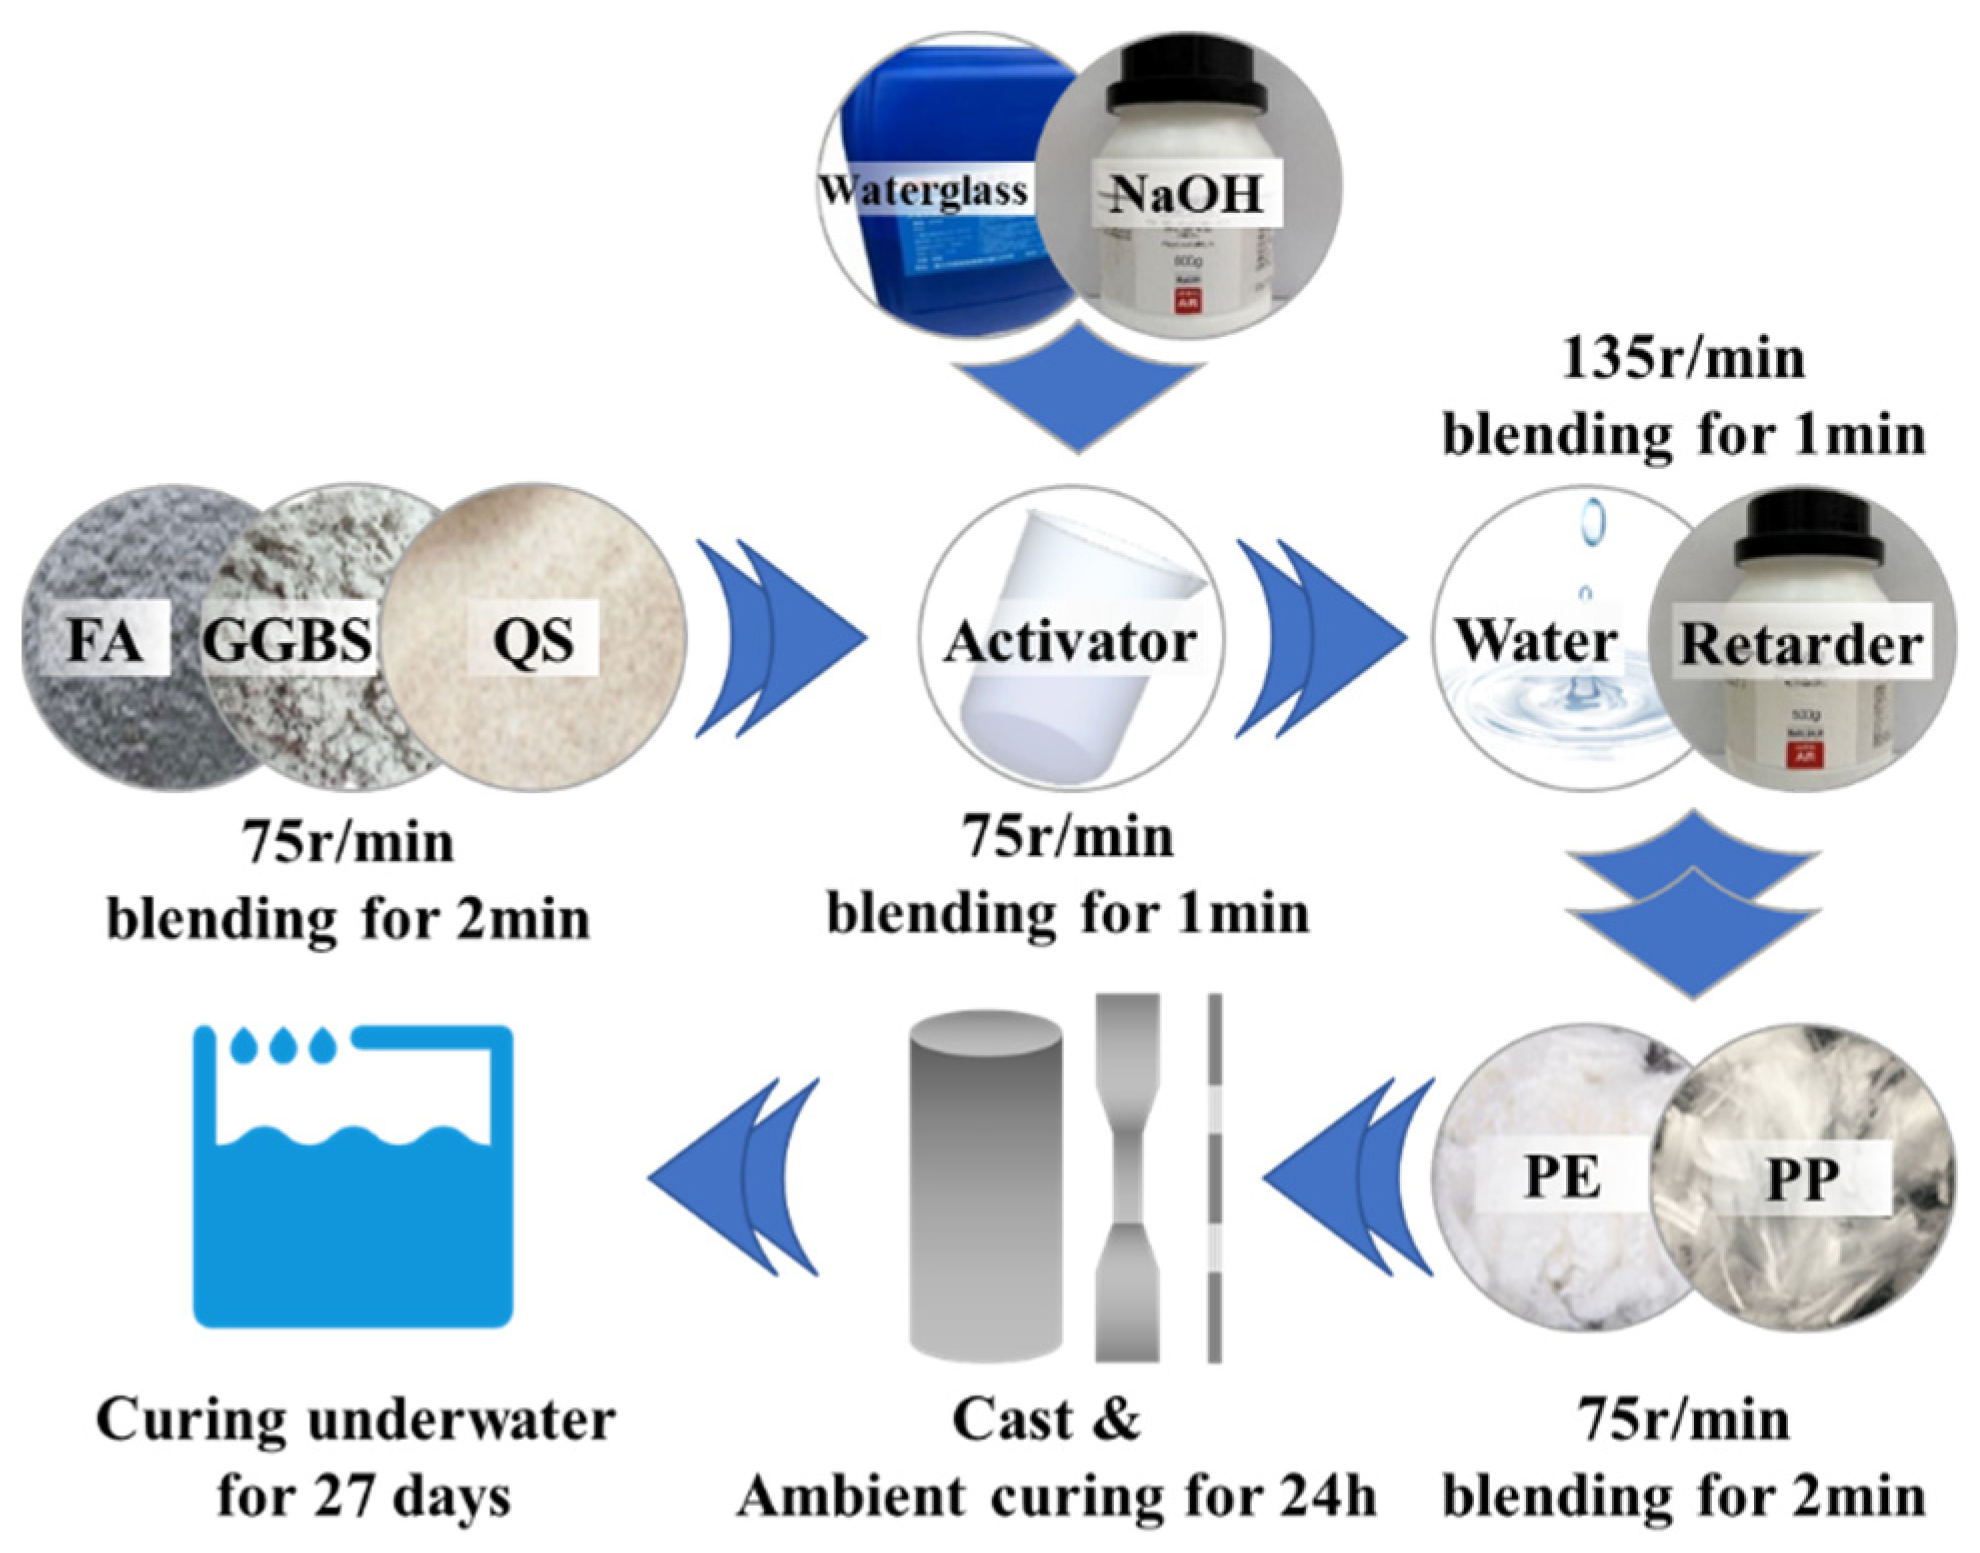
2.2. Mix Proportions and Specimen Preparation

In this study, the FA/GGBS ratios (7:3, 6:4, and 5:5) and PP fiber replacement ratios (0% to 100%, with increments of 25%) were adopted as research variables. Fifteen experimental mix proportions were designed, as outlined in Table 3.
In this study, cylinder and dumbbell-shaped specimens were prepared for axial compressive and axial tensile tests, with the dimensions illustrated in Figure 4. Prior to specimen preparation, the alkali activator needed to be prepared. The alkali activator was obtained by mixing waterglass with a sodium hydroxide solution (10 mol/L) in a mass ratio of 2:1 and then cooling the mixture. The mixing process for the H-EGCs is depicted in Figure 5. Initially, dry materials were added to a planetary mixer and dry blended at a slow speed (75 r/min) for 2 min. Following this, the alkali activator was gradually added to the mixture without halting the machine, and stirring continued at a low speed for 1 min. Afterwards, water and retarder were introduced into the mixture and blended at a rapid speed of (135 r/min) for 1 min. Finally, fibers were added while stirring at a slow speed for 3 min. The entire mixing process took approximately 7–8 min. Upon completion of blending, the mixture was poured into molds for shaping and left to undergo ambient curing for 24 h. Subsequently, the specimens were demolded, immersed in water for 27 days, and mechanical performance tests were conducted at the age of 28 days.

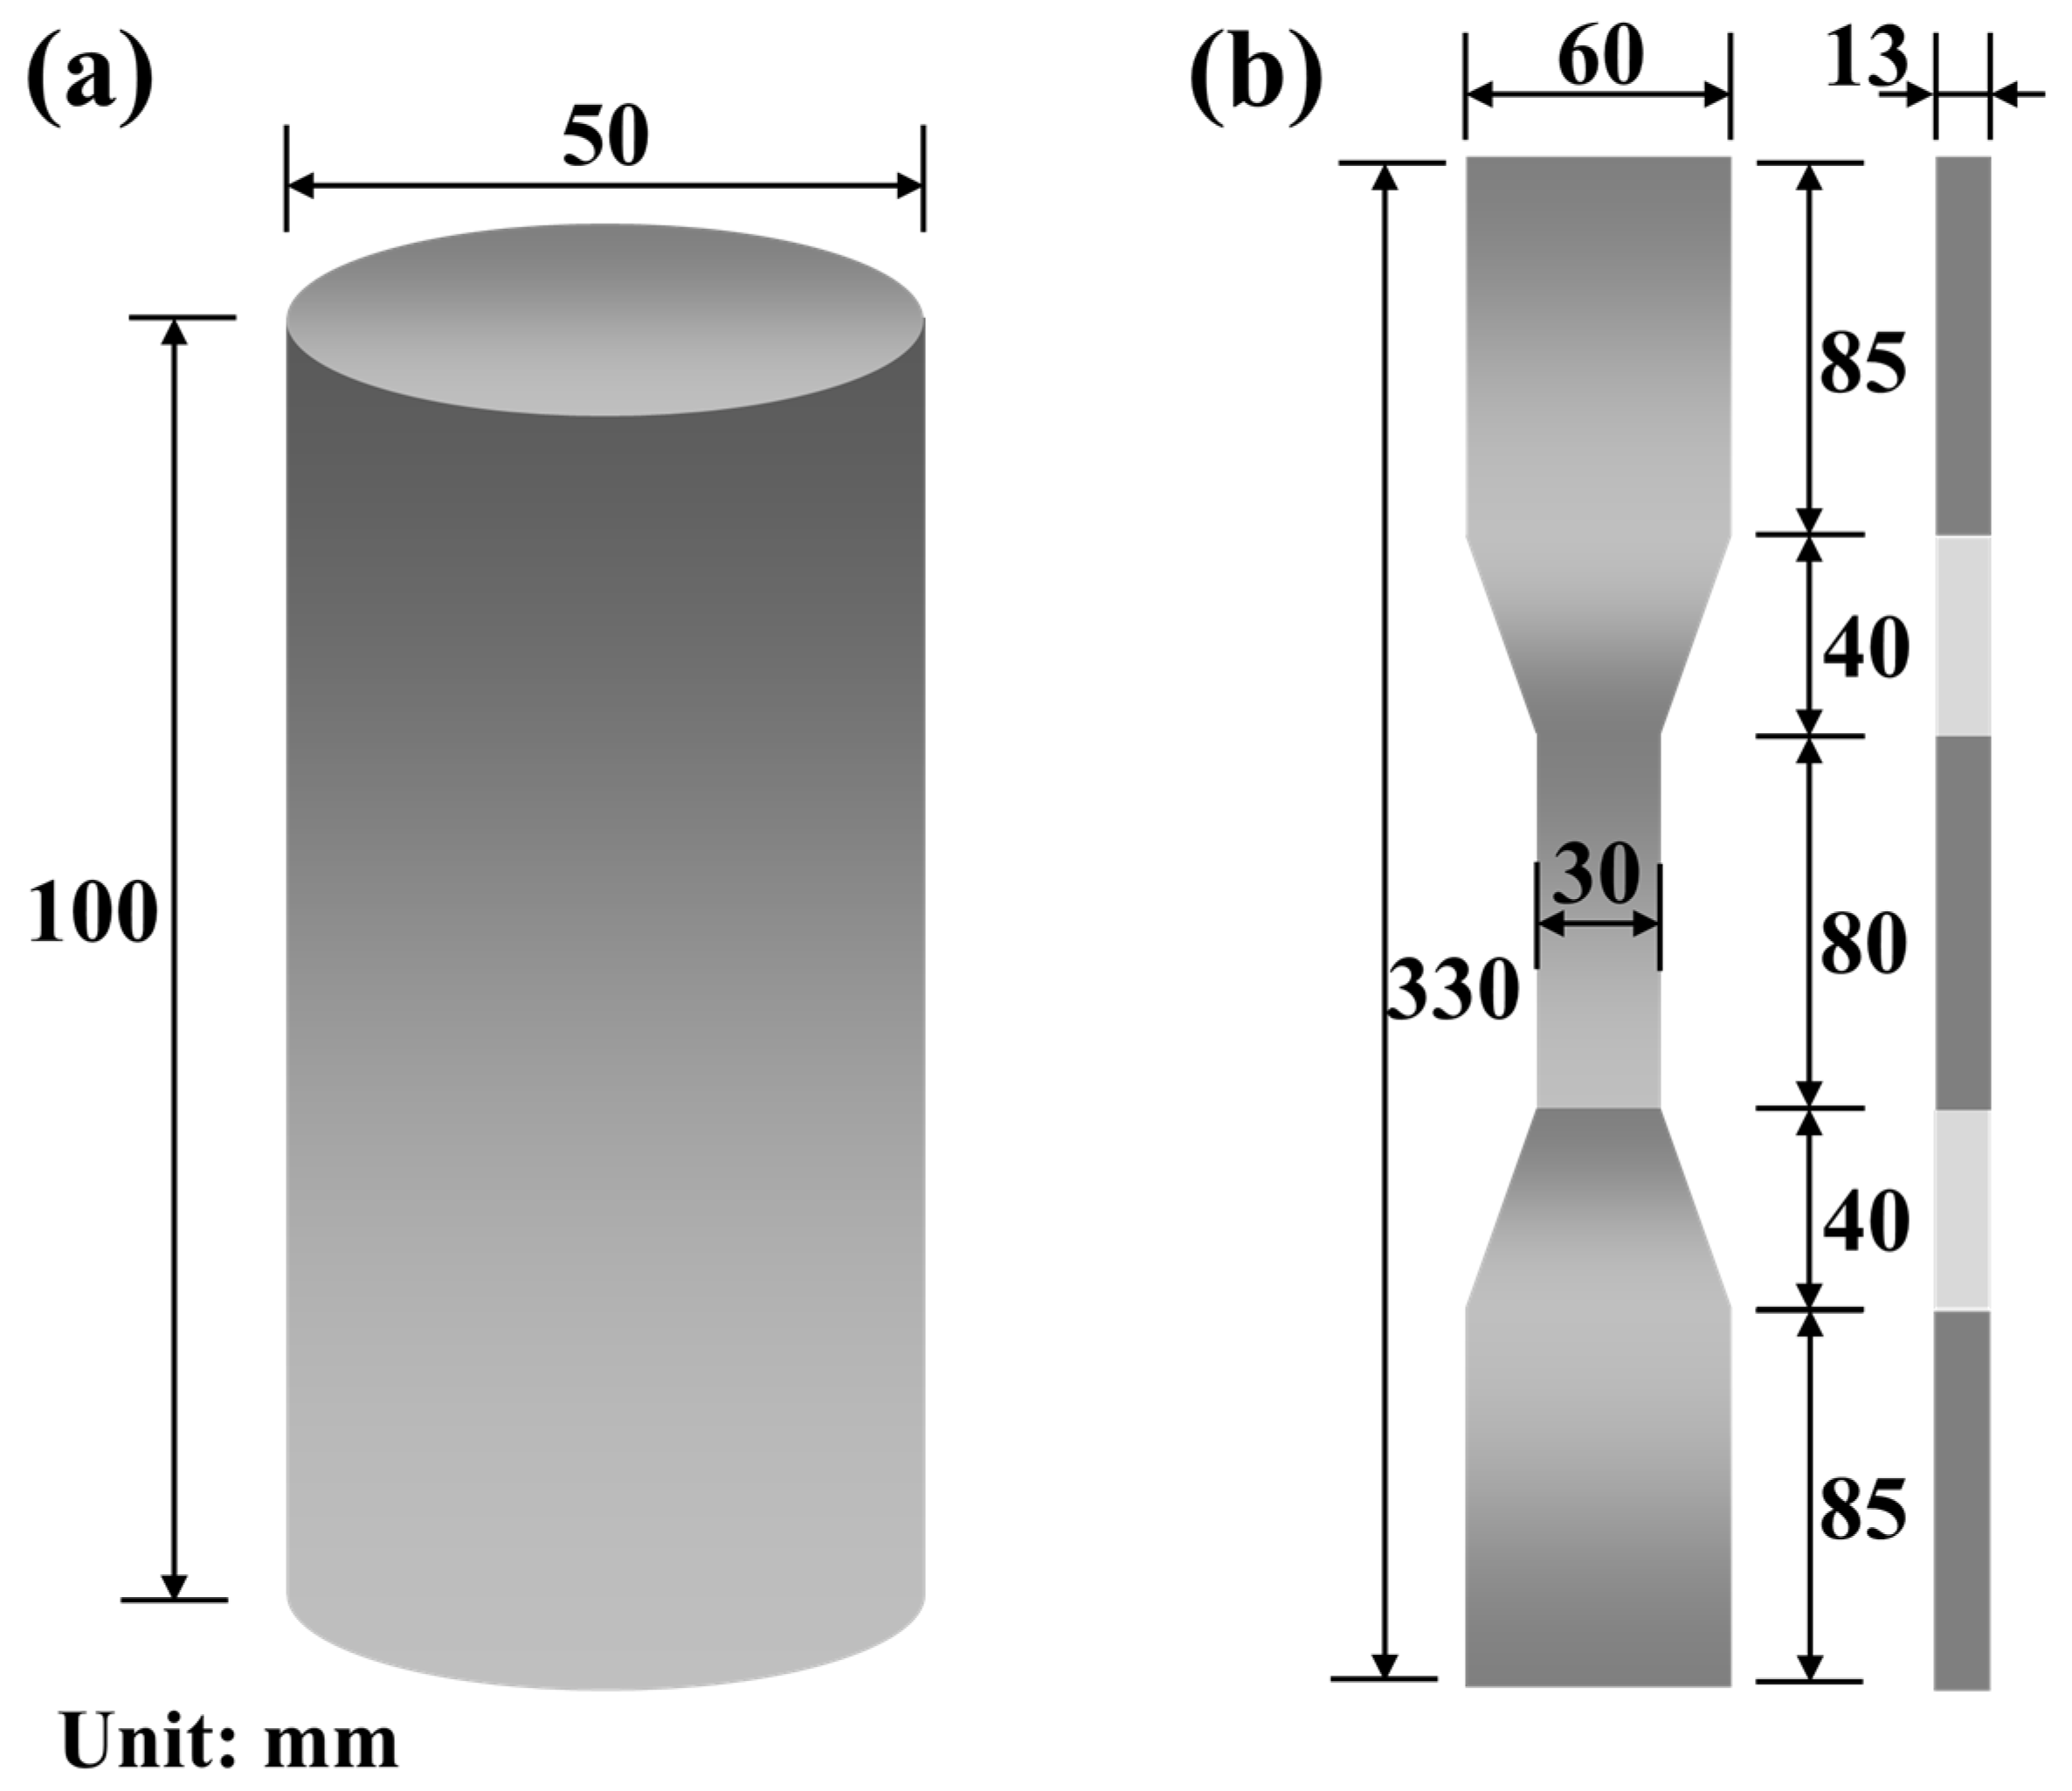
2.3. Test Setup and Loading

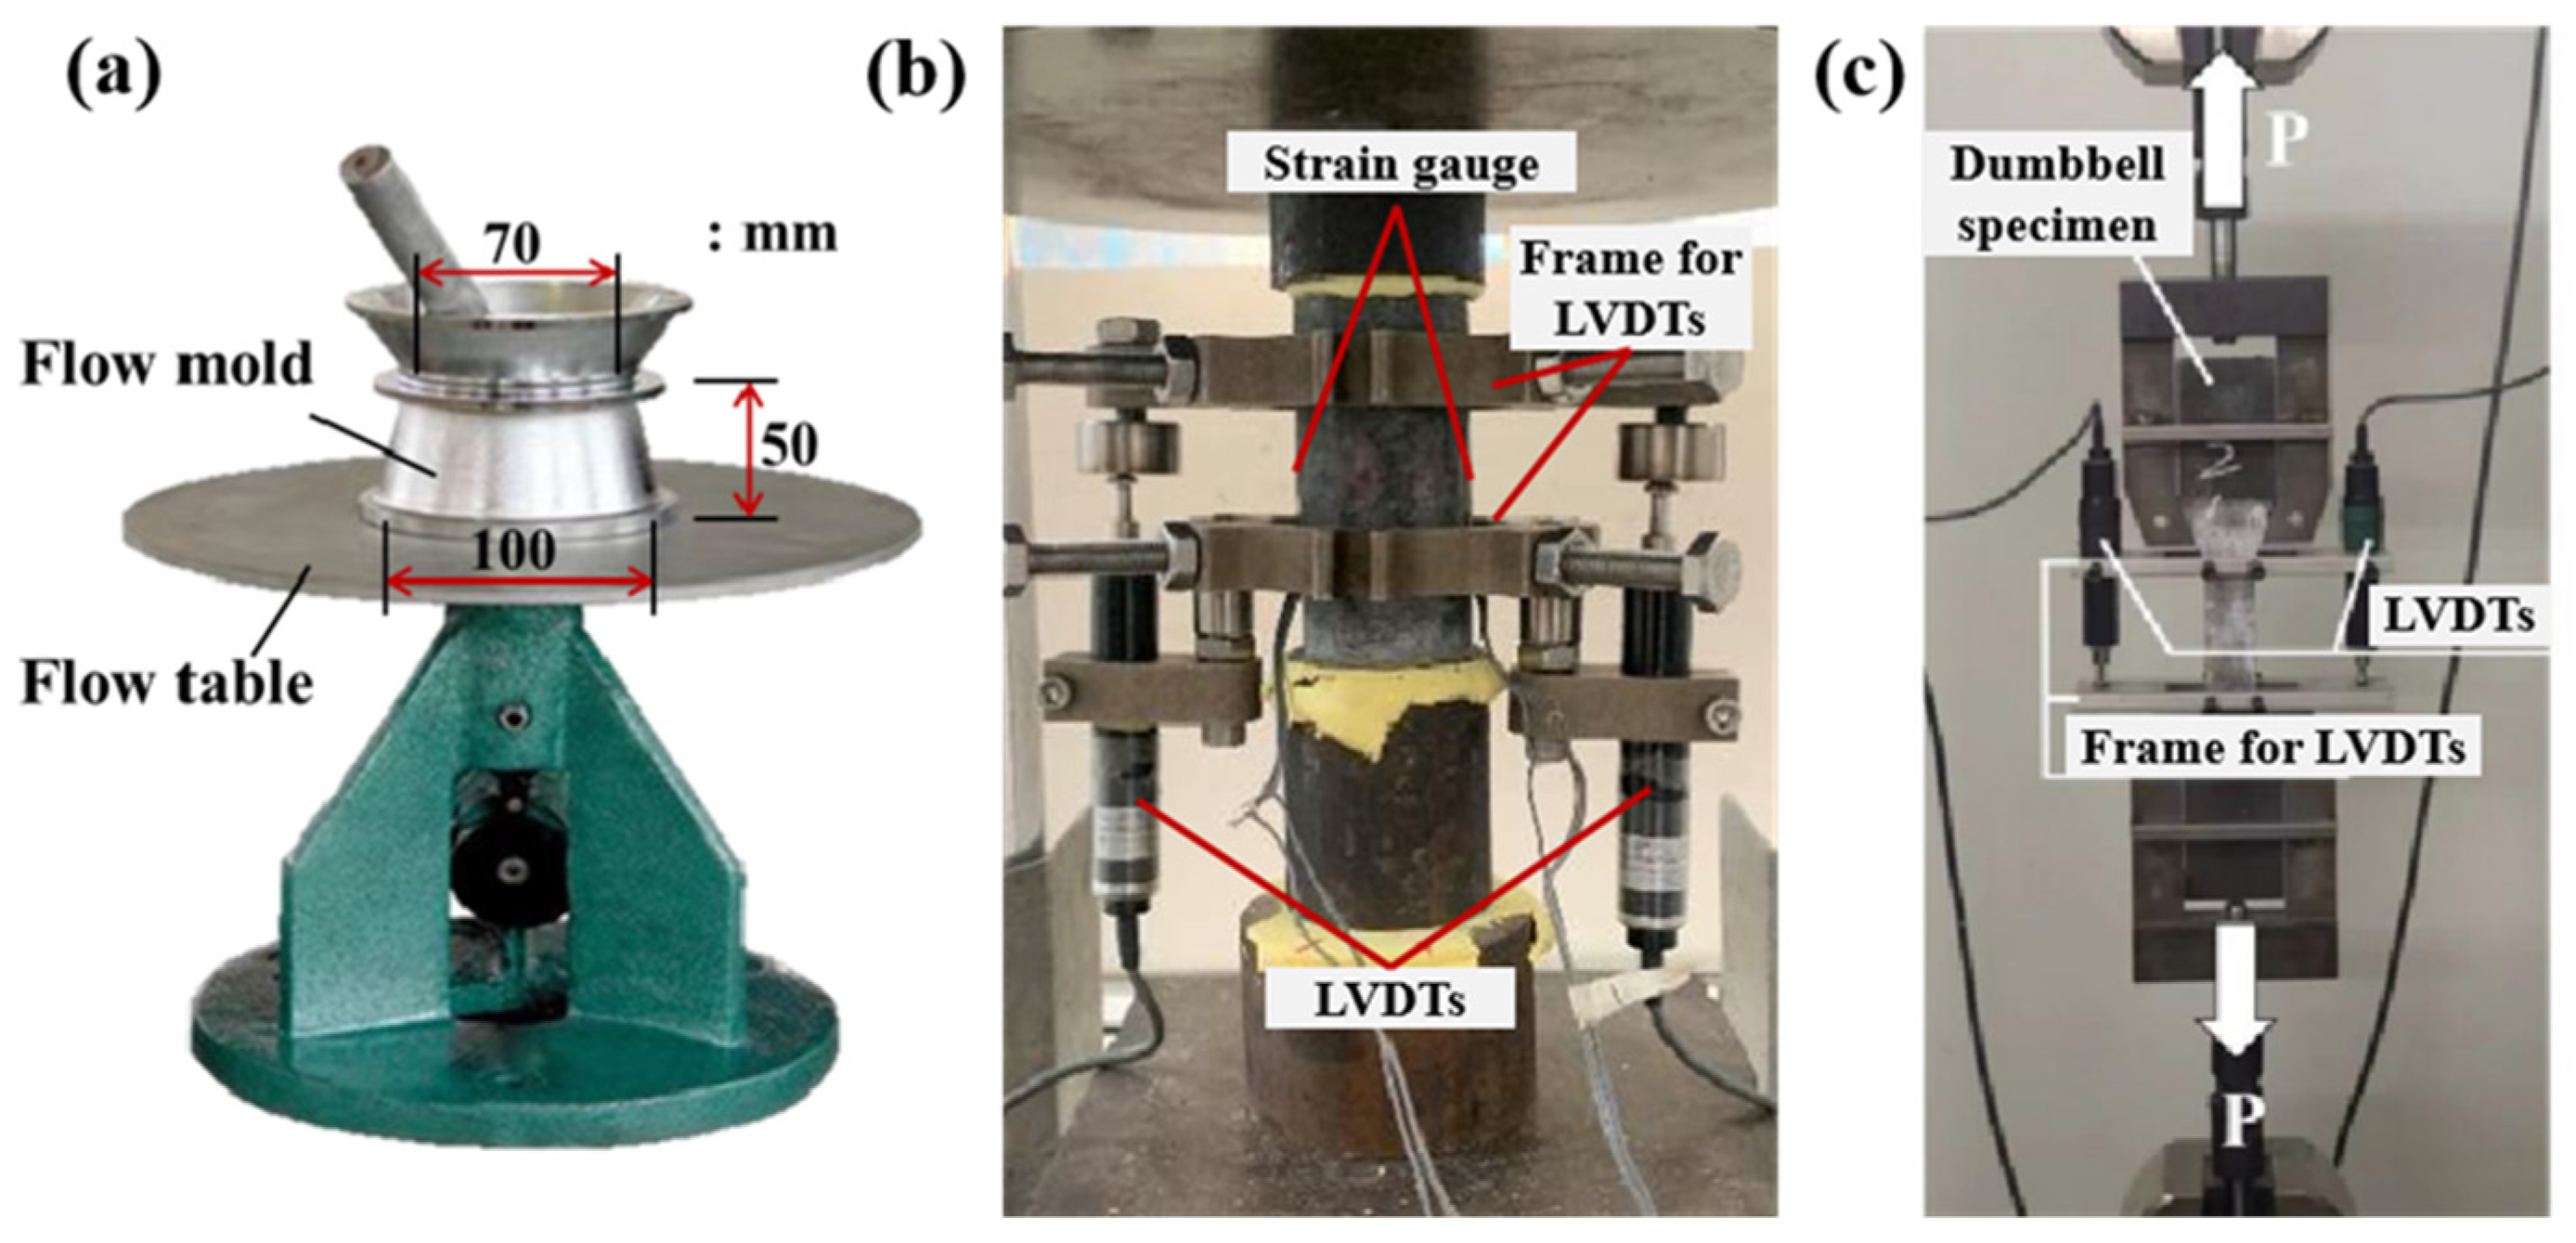
2.3.1. Flowability Test

The flowability test of the H-EGCs was conducted in accordance with the ASTM C1437-15 [42]. The testing apparatus is depicted in Figure 6a. Initially, fresh mortar was poured into a truncated cone-shaped mold. Subsequently, the mold was slowly lifted, and the working table reciprocated, causing it to drop 25 times. The diameter of the mortar was measured using a steel ruler to obtain the spread diameter.

2.3.2. Uniaxial Compressive Test

Following ASTM C109/C109M [43], axial compressive tests were conducted on H-EGCs using the YNS-Y3000 testing machine, Sinotest Equipment Co., Ltd., Changchun, China. The tests were performed in displacement control mode, employing a loading rate of 0.2 mm/min. Two longitudinal strain gauges and Linear Variable Differential Transformers (LVDTs) were symmetrically arranged to measure the axial deformation of the specimens. Load and deformation data were simultaneously collected using a TDS-530 Static Collector. Detailed experimental configurations are illustrated in Figure 6b.

2.3.3. Uniaxial Tensile Test

Tensile tests on H-EGCs were conducted using an electronic universal testing machine. To avoid eccentric tension, as shown in Figure 6c, a universal joint was installed on both sides of the grips. In accordance with JSCE 2008 [44], the tests were conducted in displacement control mode, employing a loading rate of 0.5 mm/min. Additionally, deformations in the middle measurement section of the specimens were collected through LVDTs installed on both sides of the specimens.

3. Results and Discussion

3.1. Flowability

Figure 7 illustrates the flowability of fresh H-EGCs with different FA/GGBS ratios and varying PP fiber replacement ratios. It can be observed that the slump flow of fresh H-EGCs with different FA/GGBS ratios increases with the rise in PP fiber replacement ratios. Among them, the flowability of H-EGCs with a fly ash slag ratio of 7:3 exhibits the most significant enhancement with increasing PP fiber replacement ratios, with a 43.5% increase in slump flow for M73-R100 compared to M73-R0. Factors influencing the flowability of fresh geopolymer mortar with fibers mainly include fiber surface area, surface hydrophilicity, flexibility, etc. [45]. In this scenario, the observed effect is primarily ascribed to the smaller aspect ratio and higher stiffness of PP fibers in comparison to PE fibers. As the PP fiber replacement ratios increase, the occurrence of PE fiber aggregation during matrix mixing can be mitigated., thereby improving the flowability of EGCs and the dispersion of fibers.
However, at the same PP fiber replacement ratio, the content of slag also significantly influences the flowability of EGCs. With an increase in slag content, the flowability exhibits varying degrees of reduction. When the FA/GGBS ratio decreases from 7:3 to 5:5, the slump flow decreases by 6.3% to 10.8%. The potential reason for this phenomenon may be attributed to the regular spherical shape of FA particles, which, compared to the irregular shape of GGBS particles, is more prone to the “ball-bearing effect,” enhancing flowability [39].

3.2. Compressive Performance

3.2.1. Failure Mode

The failure modes of uniaxial compressive specimens of H-EGCs are shown in Figure 7. As shown in Figure 8, inclined primary cracks penetrate the side of the cylinder specimens from top to bottom, indicating a vertical splitting failure with pronounced compressive brittleness behavior [12]. Numerous crack branches originate around the main crack, and there is no apparent spalling on the surface at the time of failure, indicating good integrity and highlighting the effective bridging role of fibers after specimen failure. Furthermore, Figure 8 suggests that the FA/GGBS ratio does not exhibit a significant impact on the compressive failure mode of cylinder specimens, but the PP fiber replacement ratio notably influences the fracture interface inclination. As the PP fiber replacement ratio increases, the angle of fracture interface inclination rises from approximately 60° to around 80°, indicating a more pronounced compressive brittleness. This observation could be attributed to the comparatively smaller aspect ratio and lower elastic modulus of PP fibers when contrasted with PE fibers, leading to a reduction in the bridging effect of fibers and consequently affecting compressive ductility.

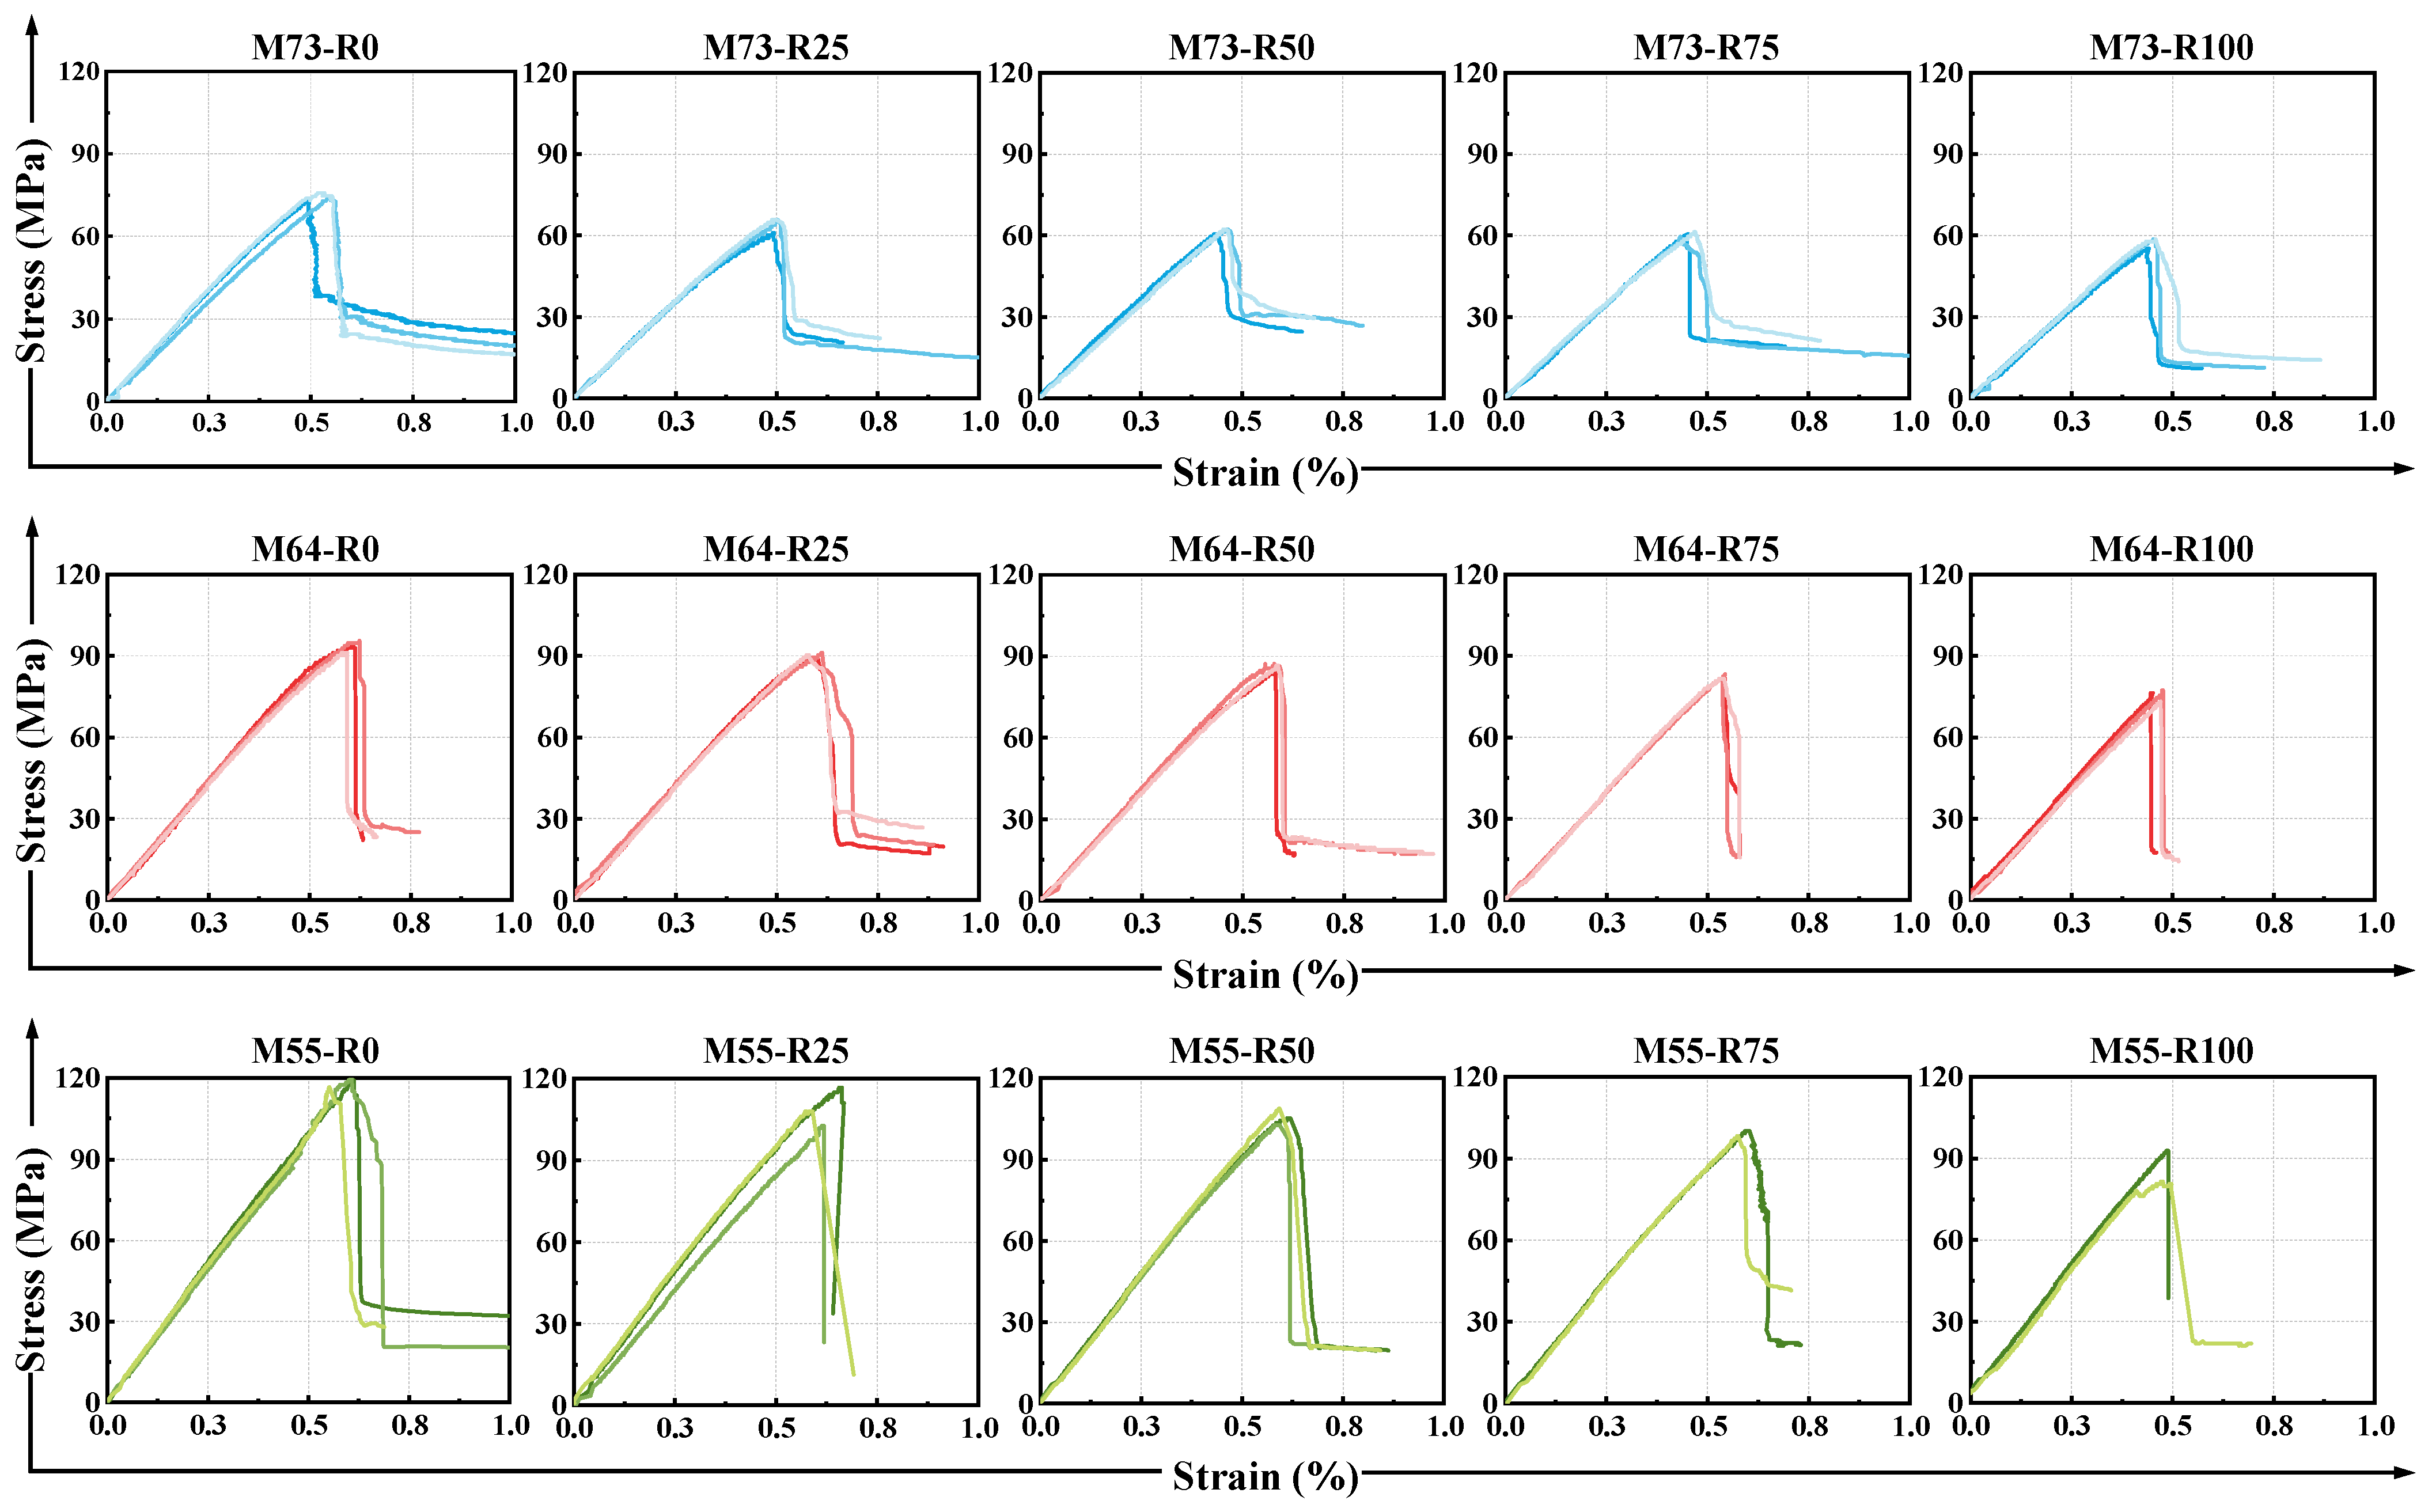
3.2.2. Stress–Strain Behavior under Compression

Figure 9 depicts the compressive stress–strain curves of H-EGCs. The curves exhibit three distinct stages: elastic, stress drop, and plateau. In the elastic stage, the specimen remains uncracked, and the stress–strain relationship is relatively linear. During the stress drop stage, cracking occurs due to the hydrophobic nature of the synthetic fibers, leading to a lack of strong bonding between the fiber and matrix and resulting in a sudden stress redistribution. After the stress drop, an equilibrium is reached between internal stresses and the fiber bridging effect, leading to a plateau in the stress–strain curve. It is evident from the stress–strain curve that H-EGCs lack good post-peak ductility, displaying significant compressive brittleness.

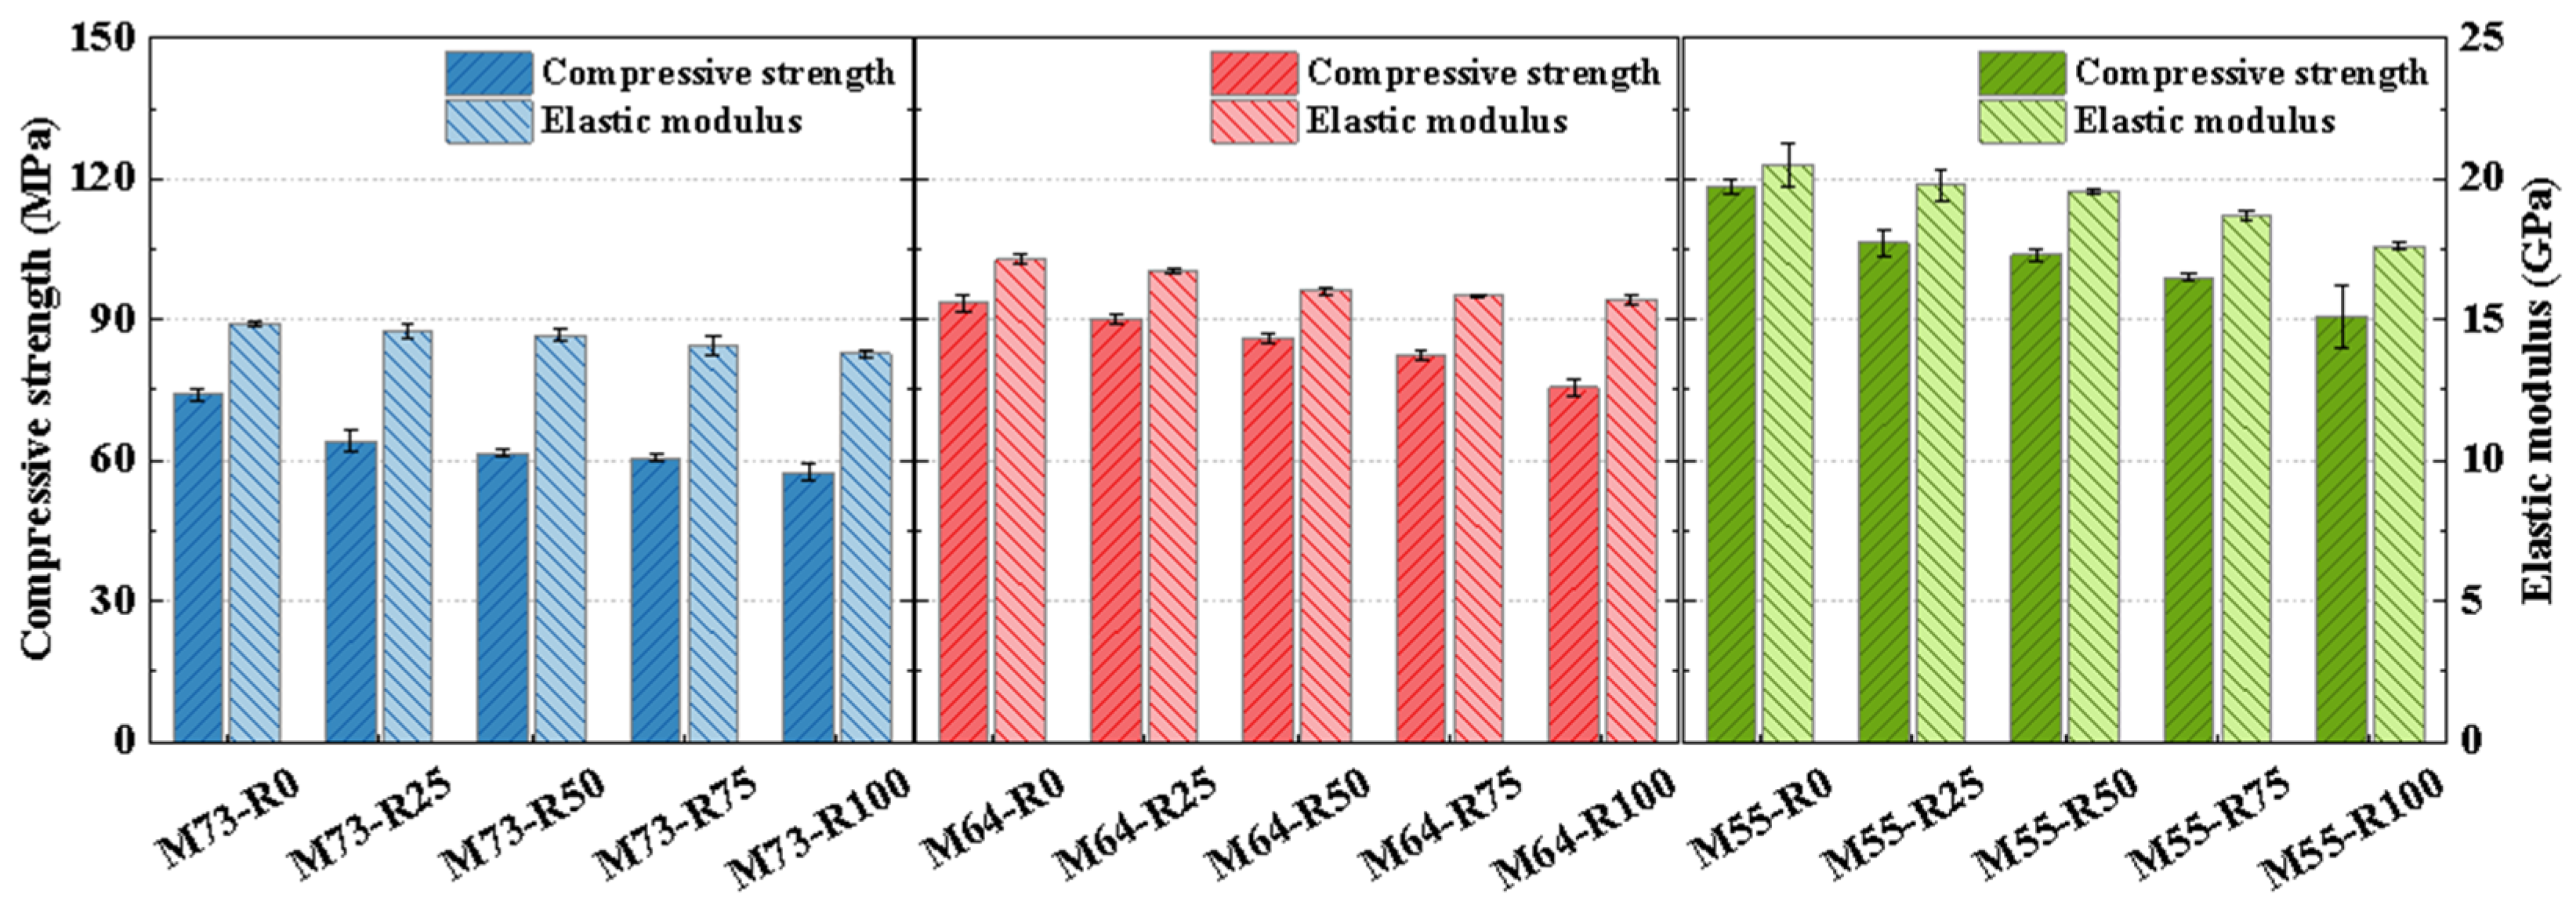
3.2.3. Compressive Strength and Elastic Modulus

The characteristic parameters of compressive strength, peak strain, and elastic modulus for H-EGCs can be derived from the compressive stress–strain curves depicted in Figure 9 and are listed in Table 4. Figure 10 presents the compressive parameters of H-EGC specimens for each group, revealing a significant negative influence of increasing PP fiber replacement ratios on compressive performance. With the rise in PP fiber replacement ratios, both the uniaxial compressive strength and elastic modulus of H-EGCs gradually decrease. When PP fibers completely replace PE fibers, the reduction in elastic modulus reaches 7.2%, 8.3%, and 14.1% under different FA/GGBS ratios, while the reduction in compressive strength reaches 22.4%, 19.3%, and 23.5%, respectively. This is likely attributed to the lower elastic modulus and strength of PP fibers compared to PE fibers. Excessive incorporation of PP fibers is equivalent to introducing voids into the matrix, thereby influencing the compressive performance of the specimens [21].
Additionally, contrasting the compressive mechanical properties of H-EGCs under different FA/GGBS ratios revealed an enhancement in compressive strength and elastic modulus with an increase in GGBS content. This is consistent with the findings of Rafeet et al. [36]. As the GGBS content increased from 30% to 50%, the compressive strength and elastic modulus of M55-R0 achieved values of 118.3 MPa and 20.52 GPa, respectively, representing an improvement of 59.6% and 38.1% compared to M73-R0. The reason for the increase in strength and modulus could be attributed to the higher reactivity of GGBS, which favors the formation of more gel and a denser microstructure [46]. Furthermore, the increase in GGBS content leads to an increase in the Si/Al ratio in the mixture, which in turn has a positive effect on the compressive performance [47].

3.3. Tensile Performance

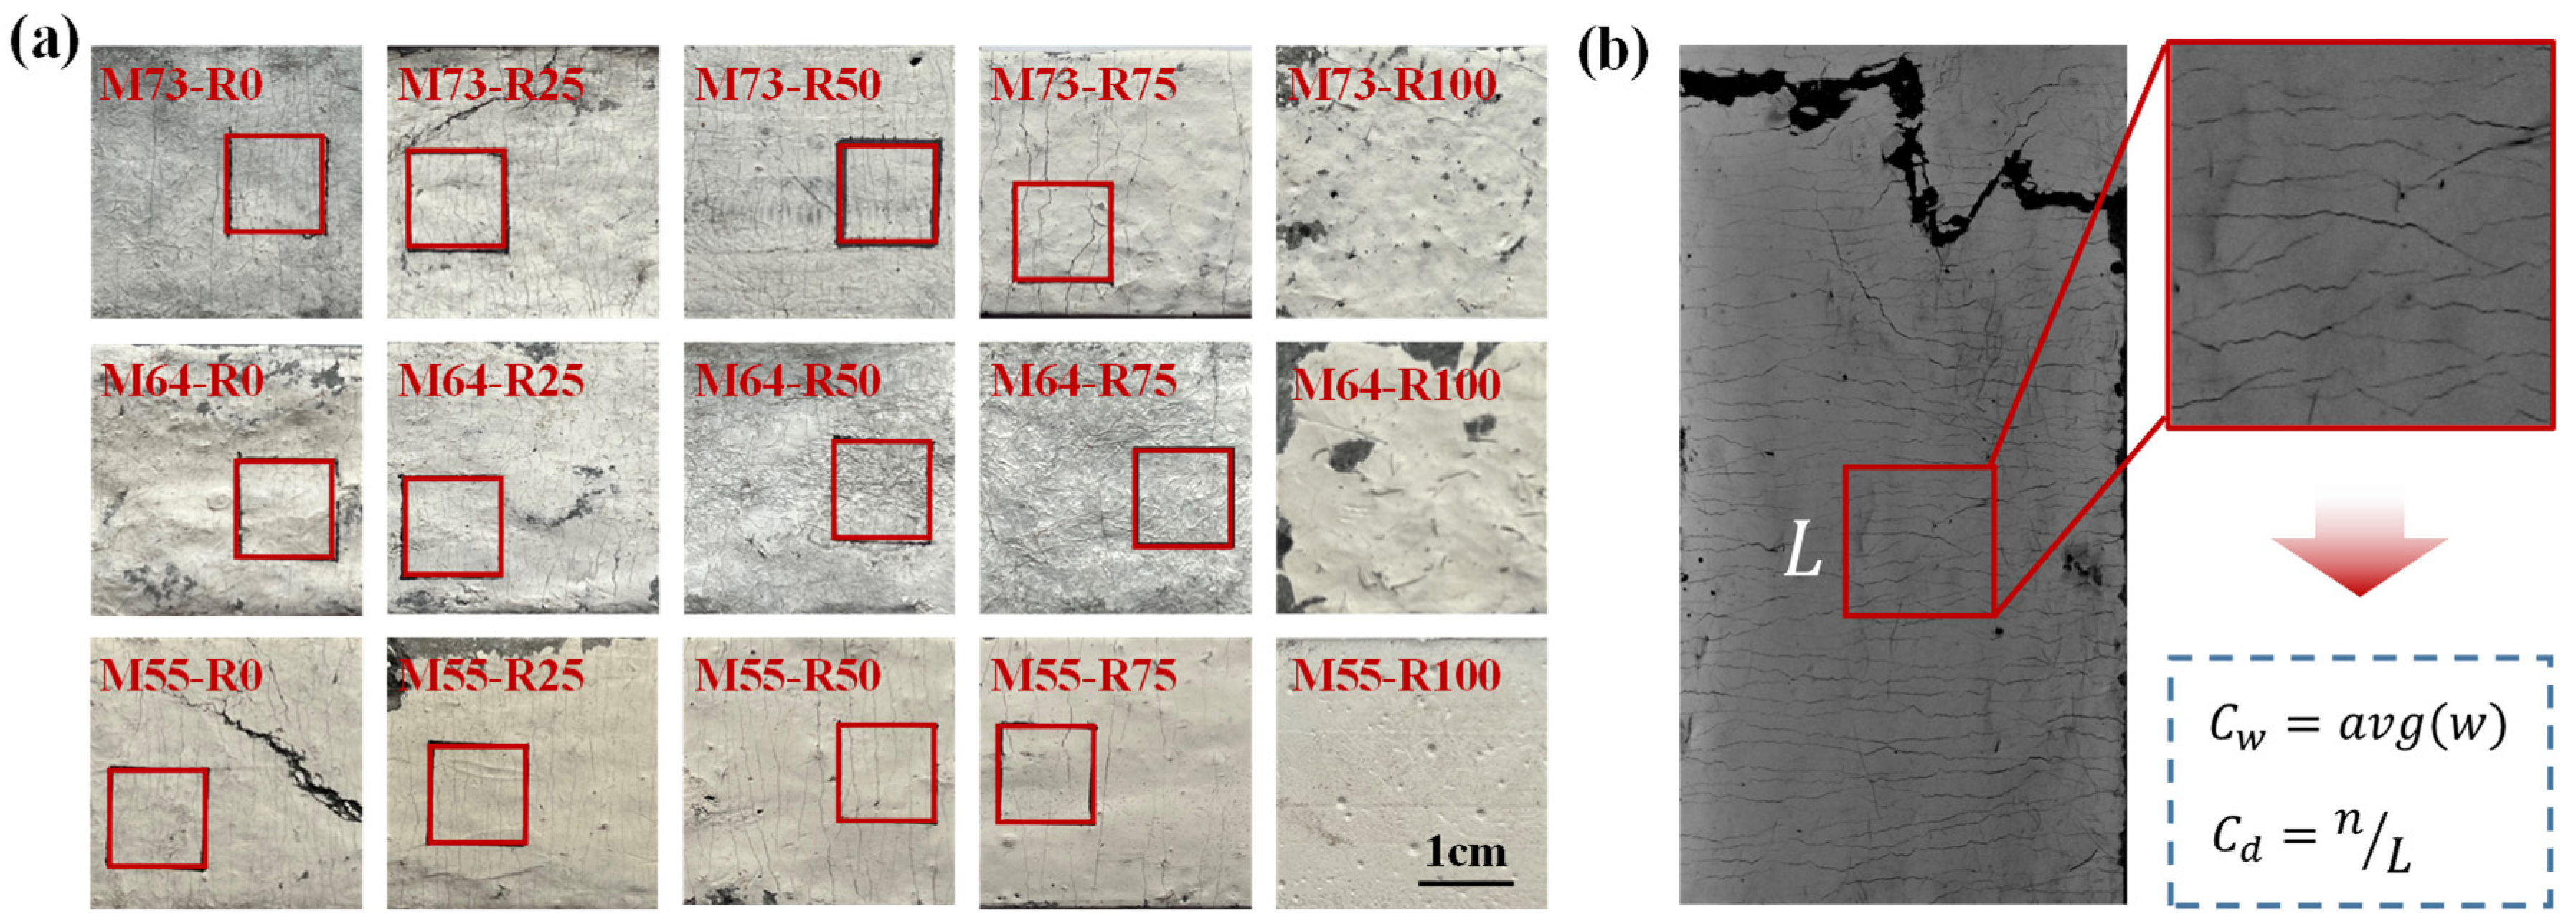
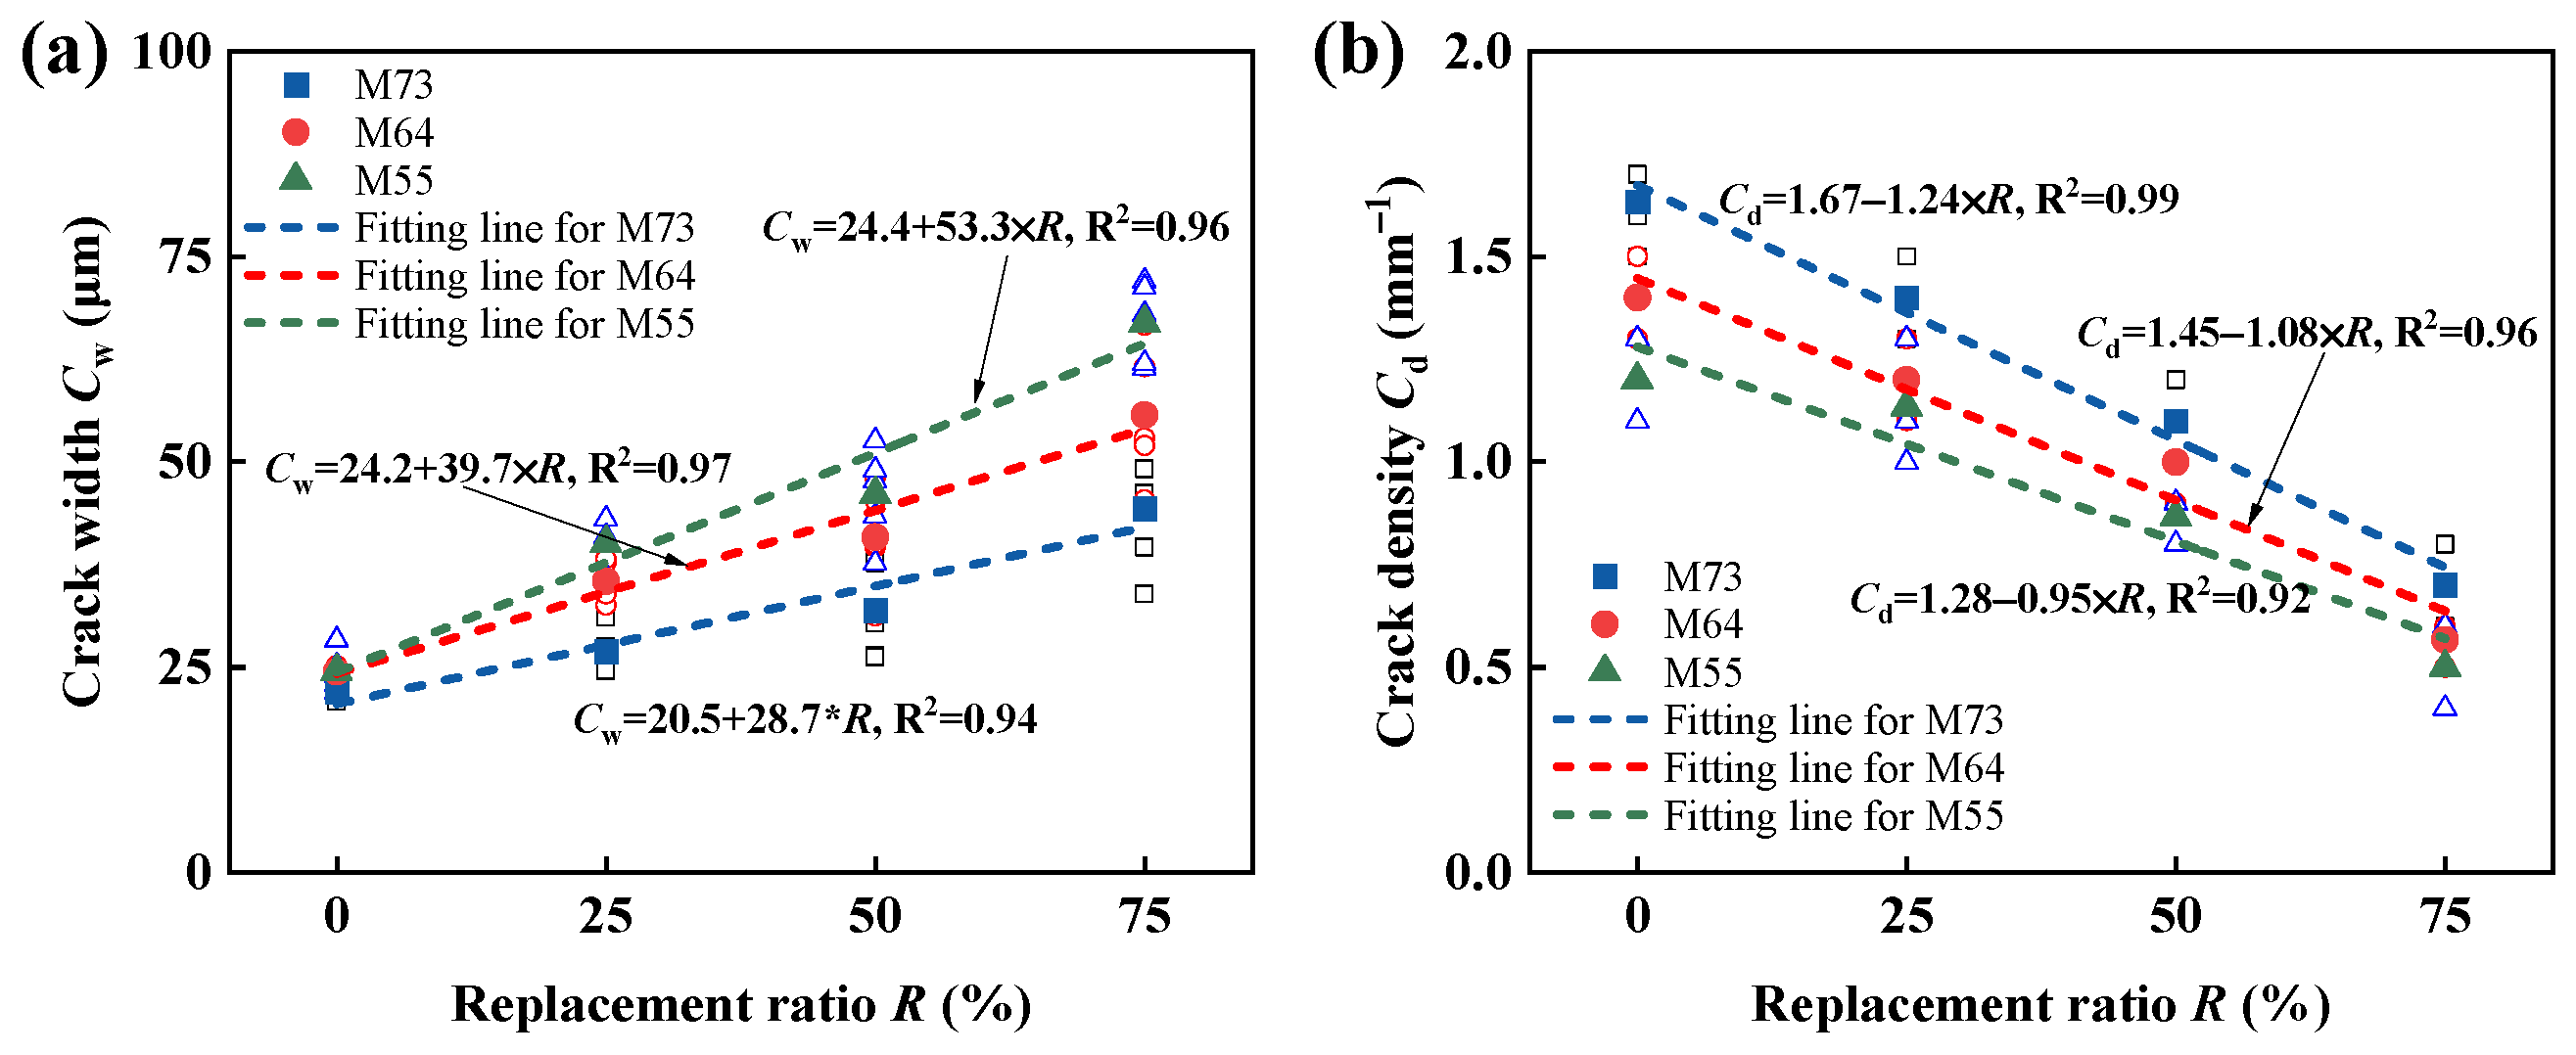
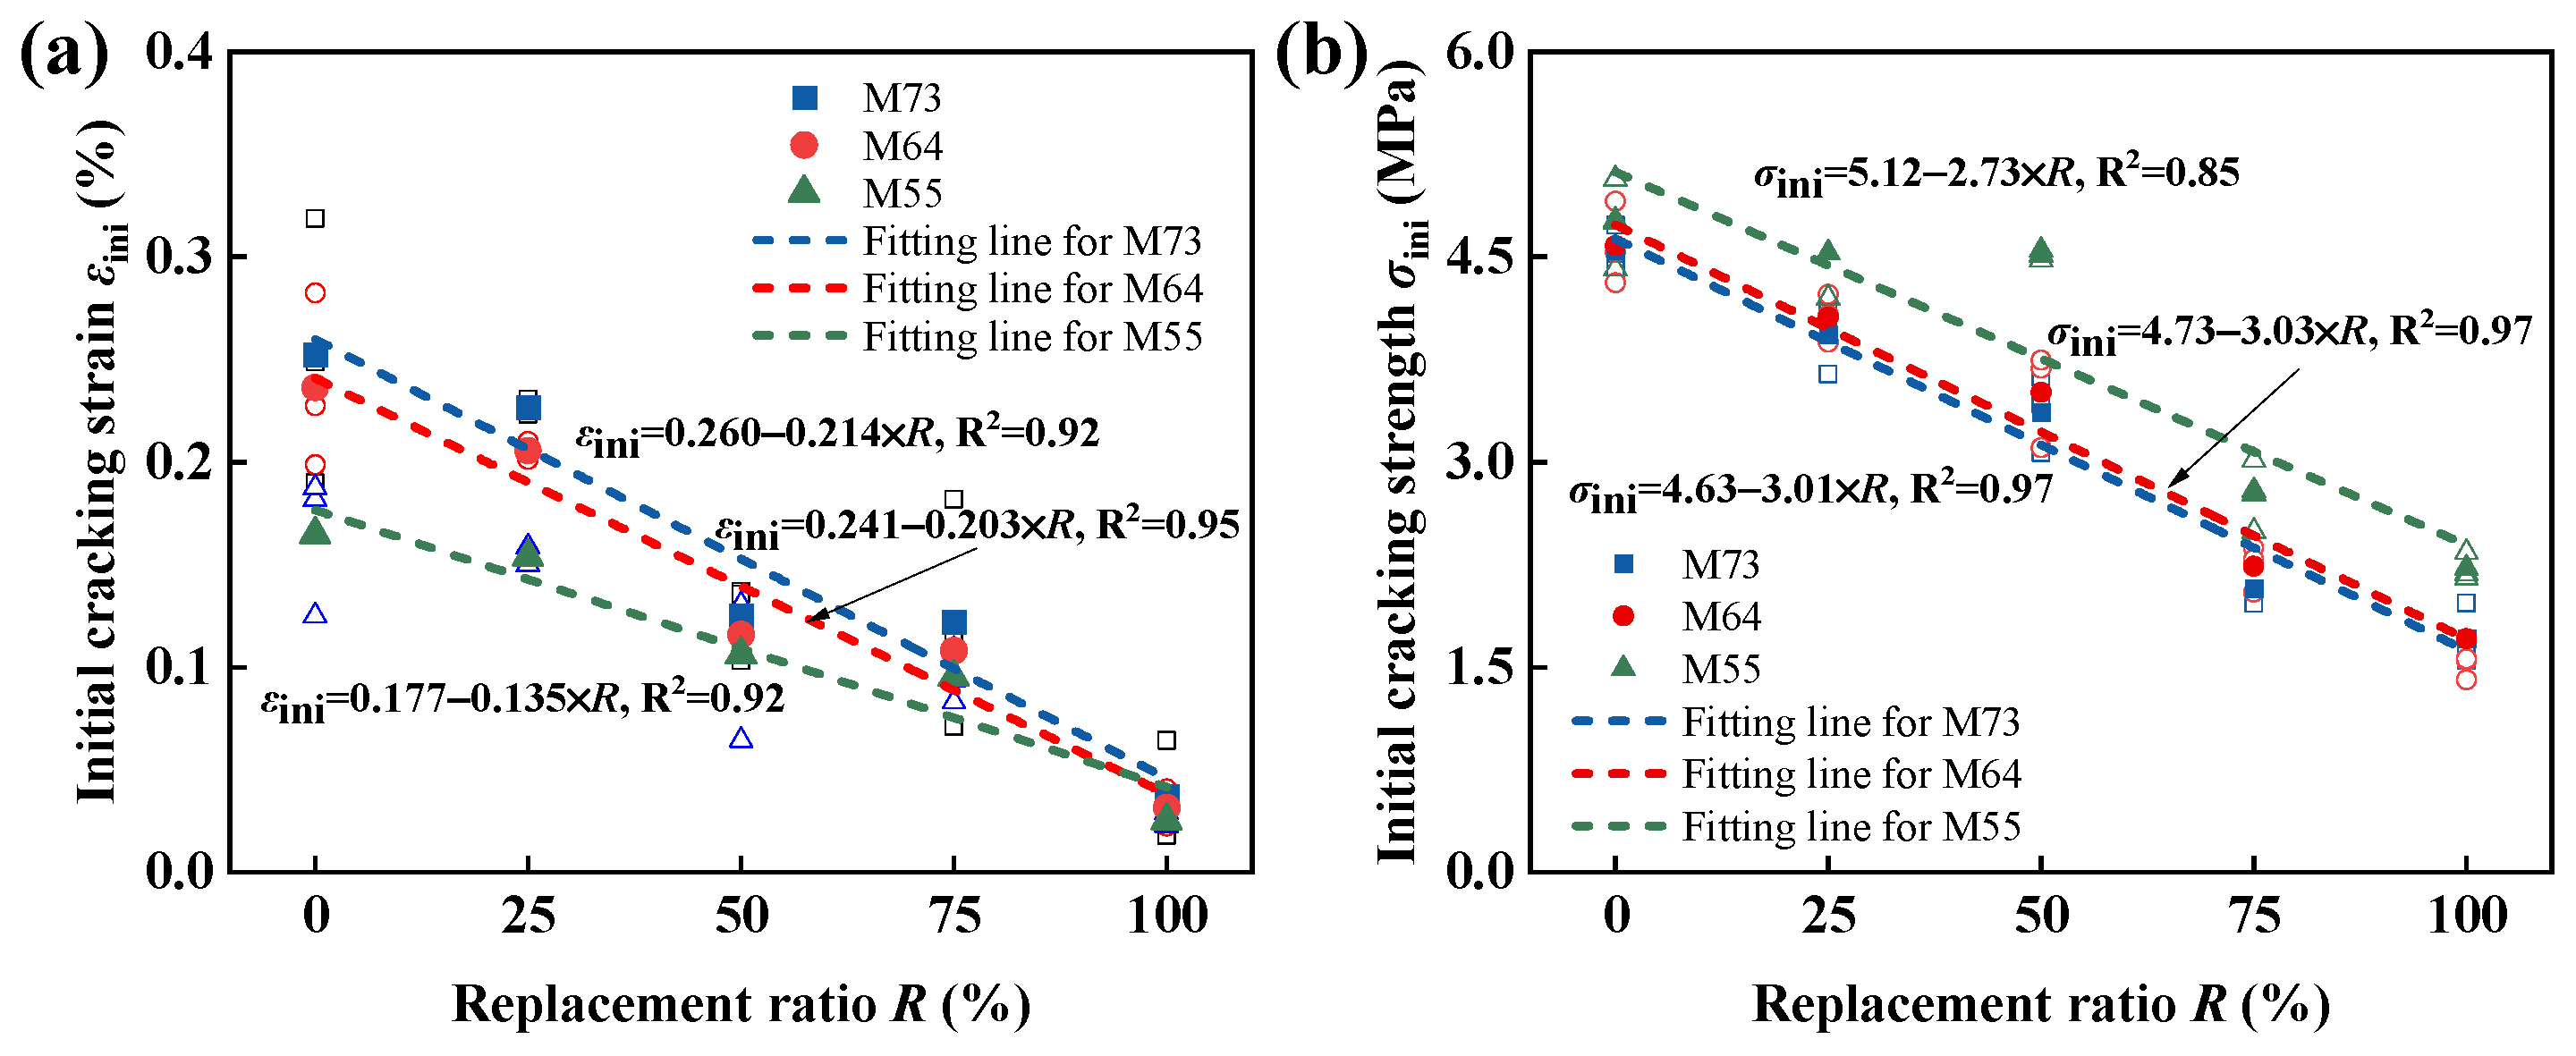
3.3.1. Tensile Cracking Characteristics

Under tensile loading, concrete experiences the formation of small, discontinuous microcracks distributed throughout its interior, which gradually propagate to eventually form macroscopic cracks. In contrast, within EGCs, the internal fibers can provide sufficient bridging action, and under the restraining effect of the fibers, microcracks eventually propagate into stable flattened cracks. As this process repeats, it results in the multi-cracking pattern characteristic of EGCs, as shown in Figure 11a. The crack density, defined as the ratio of the number of cracks to the length of the measuring area, along with the average crack width, were established as characteristic parameters for the tensile cracks observed within the gauge length of the fractured H-EGC dumbbell-shaped specimens [26]. A randomly selected square area of 10 mm within the gauge length was chosen, and crack statistics for this area were conducted using an electron microscope (as shown in Figure 11b), obtaining information on crack density and average crack width for H-EGCs. At a PP fiber replacement ratio of 100%, the specimen displayed brittle failure, and thus, crack characteristics were not analyzed, as depicted in Figure 12. From Figure 12, it is apparent that PE fibers demonstrated superior crack control capabilities in comparison to PP fibers. With an increase in the PP fiber replacement ratio in H-EGCs, the crack density decreased, while the crack width increased upon specimen failure. For the M73 group, as the PP fiber replacement ratio rose from 0% to 75%, the crack width expanded from 21.54 μm to 62.5 μm, representing a 190% increase, while the crack density decreased from 1.2 mm−1 to 0.4 mm−1, indicating a 66.7% reduction. Comparing H-EGCs with different FA/GGBS ratios, an increase in GGBS content effectively restrained crack propagation and reduced crack width. This phenomenon may be related to the high reactivity of GGBS and the denseness of the gel-forming products generated during the reaction. However, crack density decreased with the increase in GGBS content, which could be attributed to the enhanced matrix toughness with higher GGBS content, reducing the saturation cracking capacity of H-EGCs.

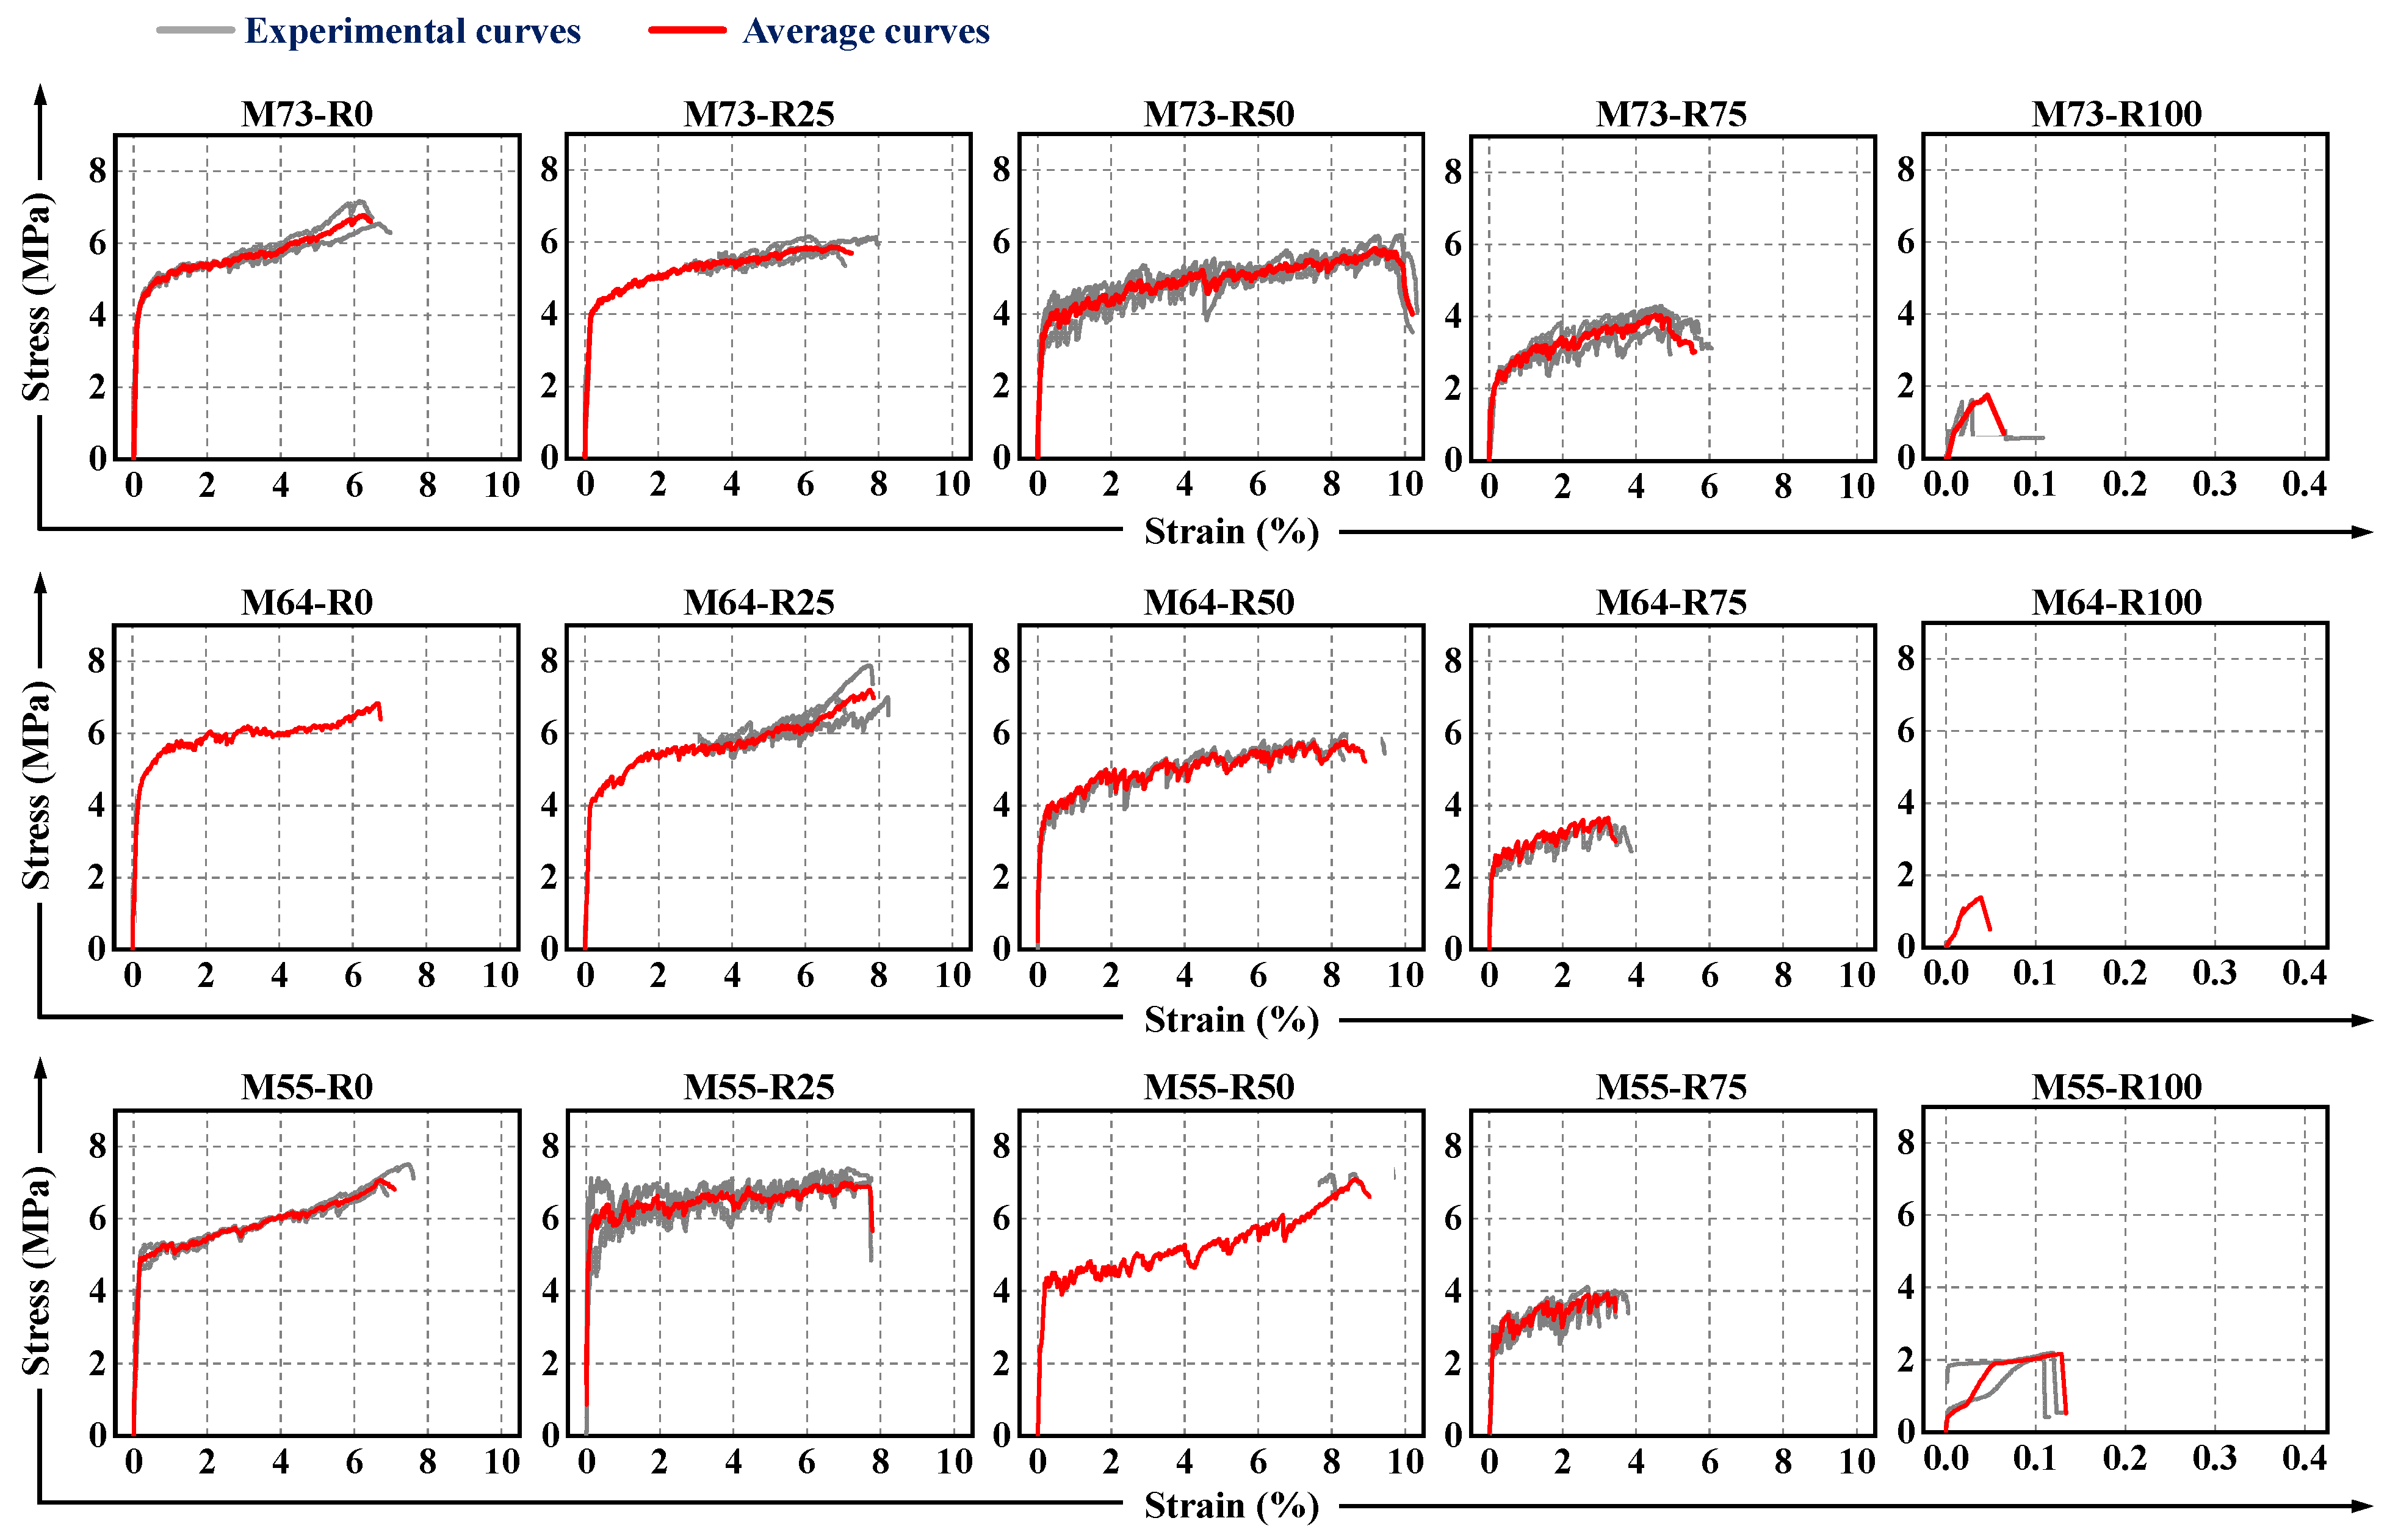
3.3.2. Stress–Strain Behavior under Tension

Figure 13 illustrates the tensile stress–strain curves of H-EGCs. As observed in Figure 13, after cracking, the curve does not exhibit a sharp decline but rather displays pseudo-strain hardening behavior, accompanied by serrated fluctuations due to the initiation of multiple cracks. However, when PP fibers completely replace PE fibers, the stress rapidly decreases after cracking, demonstrating typical brittle fracture. With an increase in the PP fiber replacement ratio, the cracking stress and peak stress of the curve start to decline. Interestingly, at PP fiber replacement ratios of 25% and 50%, the ultimate tensile strain of H-EGCs is notably higher than that of specimens containing only PE fibers. Additionally, it can be seen from Figure 13 that the magnitude of stress reduction generally increases with the addition of PP fibers. This can be attributed to the lower tensile strength of PP fibers and their weaker bridging ability with the matrix, a phenomenon reflected in the crack parameters of H-EGCs. It is noteworthy that Figure 13 shows a noticeable influence of the FA/GGBS ratio on the cracking stress and peak stress in the stress–strain curve, with similar trends in curve variations.

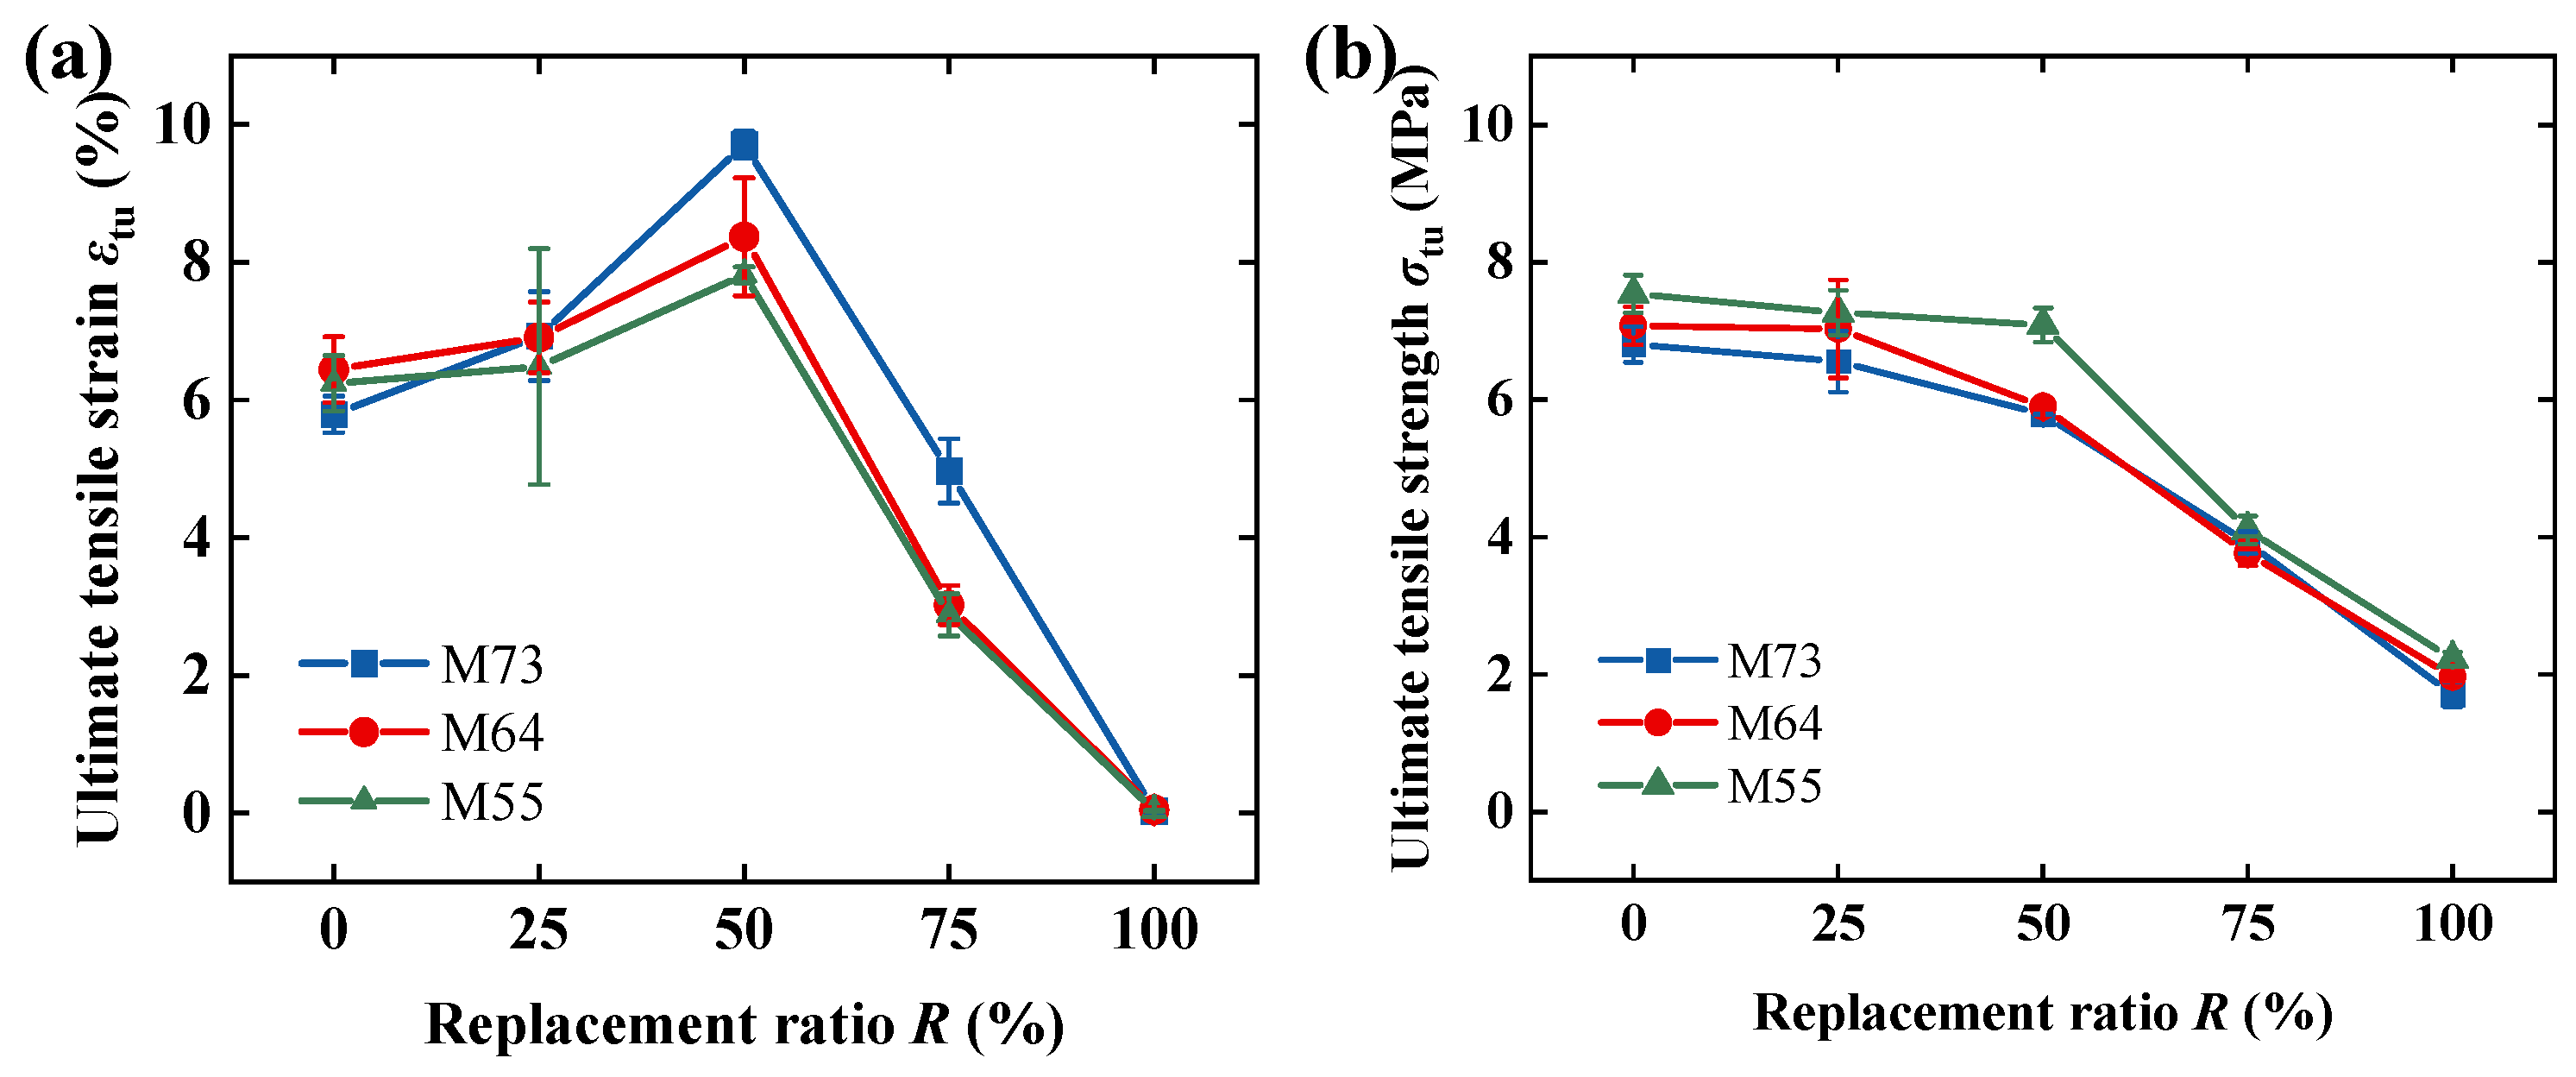
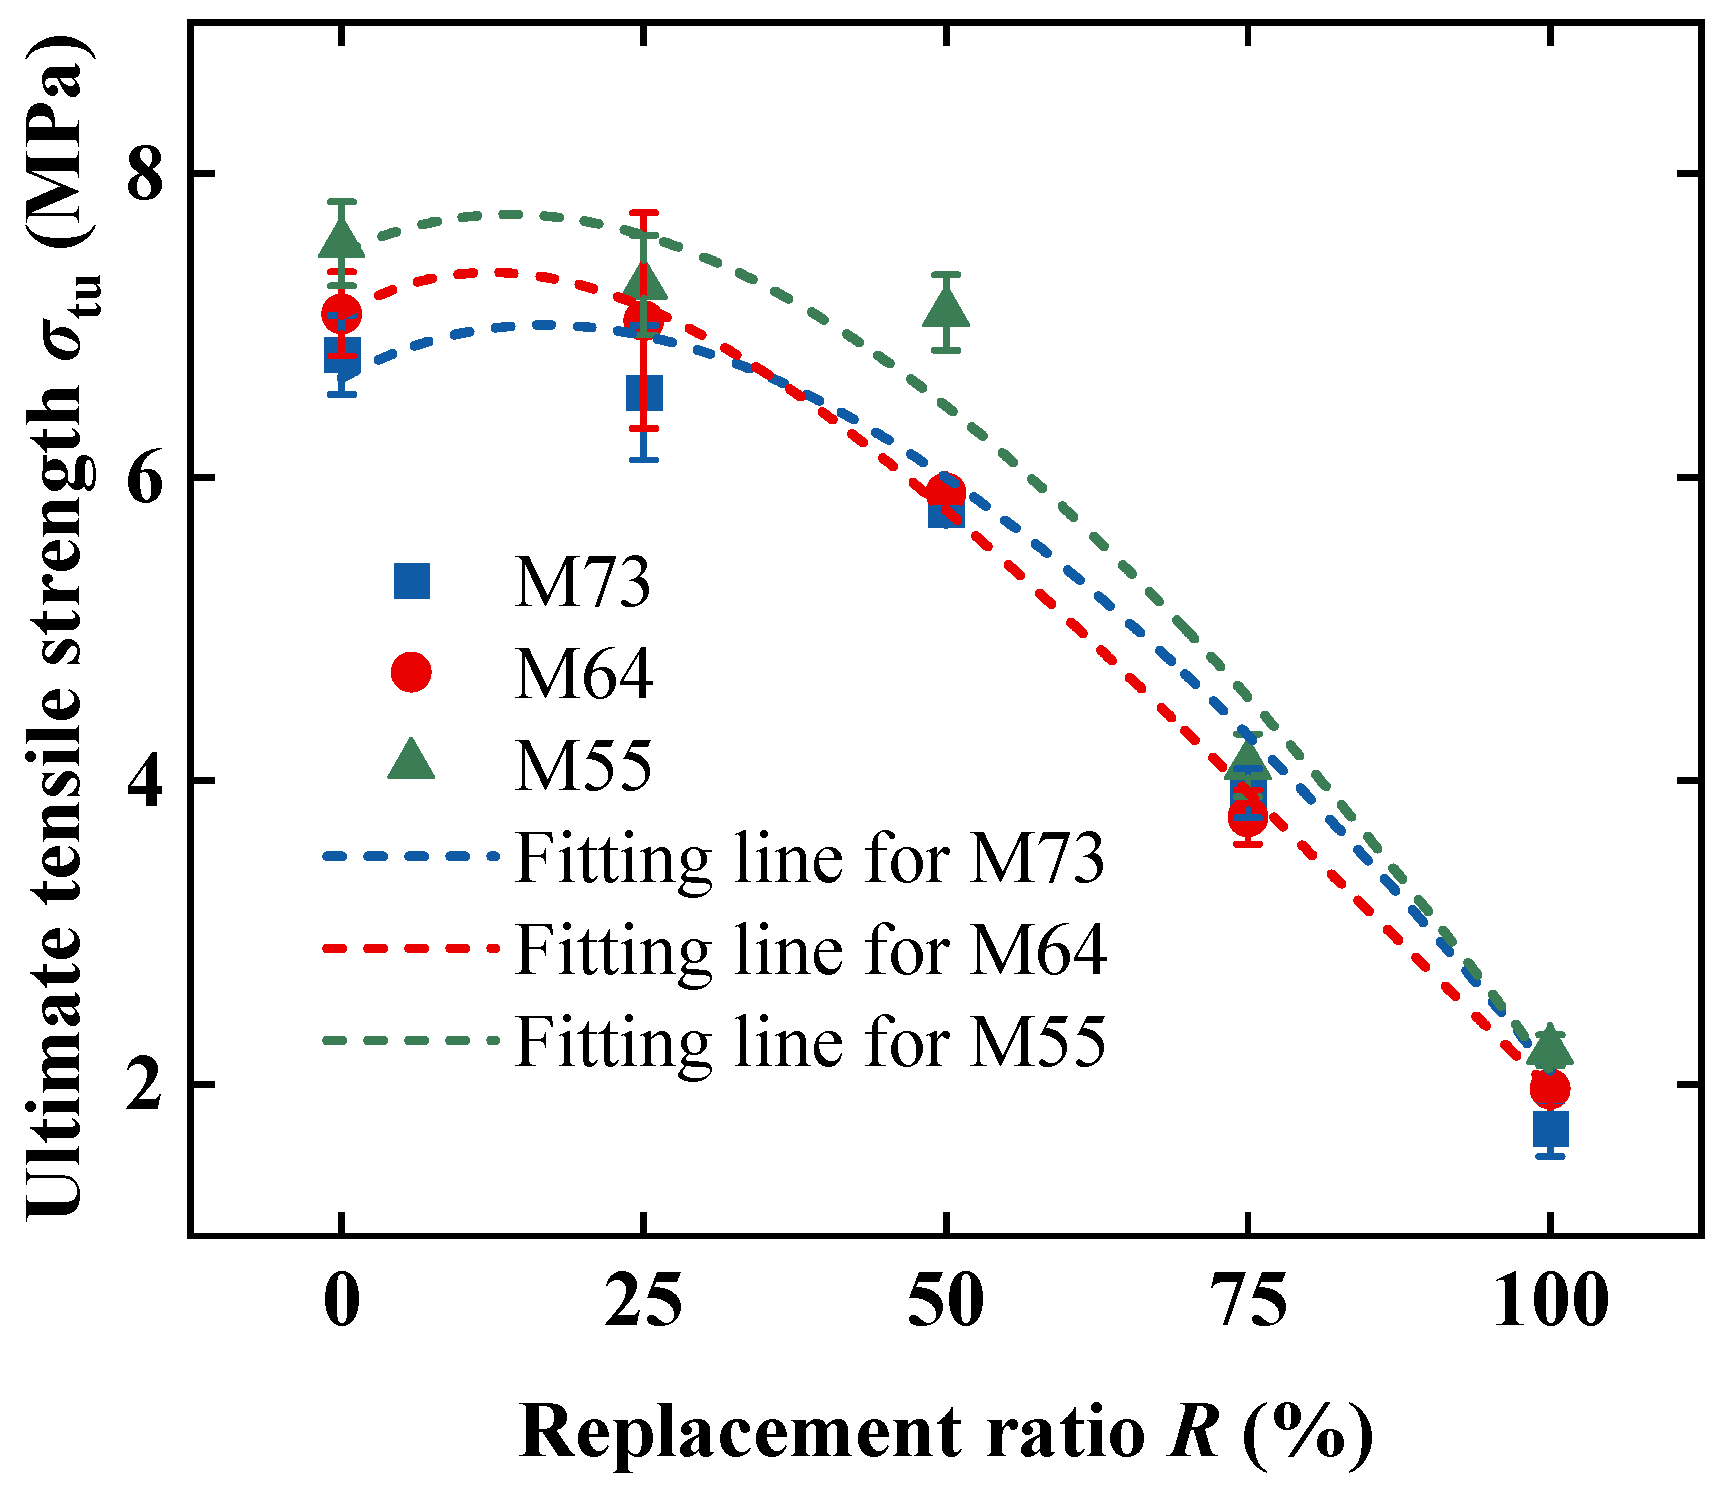
3.3.3. Tensile Characteristic Parameters

The tensile characteristic parameters from the stress–strain curve of H-EGCs in Figure 13 were extracted and are presented in Table 5. Figure 14 illustrates the variation in initial cracking strength and initial cracking strain of H-EGCs with the content of PP fibers. As observed in the figure, at constant matrix strength, increasing the PP fiber replacement ratio leads to varying degrees of decline in both the initial cracking strength and initial cracking strain, showing a linear negative correlation. With the PP fiber replacement ratio increasing from 0% to 100%, the average tensile initial cracking strength of the M73 group drops from 4.57 MPa to 1.51 MPa, representing a reduction of 67%; in the M64 group, the specimen’s initial cracking strength decreases from 4.58 MPa to 1.71 MPa, showing a decrease of 63%; the M55 group also follows a similar trend, experiencing a 53% reduction in average tensile initial cracking strength. Under the condition of insufficient strong bonding, the lower elastic modulus and lower aspect ratio of PP fibers compared to PE fibers result in relatively lower synergistic performance with the matrix before specimen cracking [48]. Consequently, this leads to a decline in both initial cracking strength and strain. Furthermore, from the linear fit curves of initial cracking strength and strain with the PP fiber replacement ratio, it can be observed that H-EGCs with a higher content of GGBS have a larger intercept for initial cracking strength. This implies that as the FA/GGBS ratio decreases, the initial cracking strength increases. The reason for this phenomenon is attributed to the densification of the microstructure of geopolymer induced by GGBS [49].
Figure 15 illustrates the relationship between the tensile strength and ultimate tensile strain of H-EGCs with varying PP fiber replacement ratio. As shown in the figure, with the PP fiber replacement ratio increasing from 0% to 100%, the ultimate tensile strength of the M73 group drops from 6.81 MPa to 1.71 MPa, representing a reduction of 75%; in the M64 group, the tensile strength of the specimen drops from 7.21 MPa to 2.00 MPa, showing a decrease of 72%; the M55 group also follows a similar trend, experiencing reductions of 69% in both average tensile initial cracking strength and ultimate tensile strength. Notably, the tensile strength of the M55 group with a higher content of GGBS is generally higher than the other groups. From Figure 15a, it can also be observed that the tensile strain capacity of H-EGCs with different FA/GGBS ratios shows a trend of initially increasing and then decreasing with the increase in PP fiber replacement ratio, reaching a peak when half of the fibers are replaced with PP fibers. When the PP fiber replacement ratio exceeds 50%, the insufficient fiber bridging effect fails to meet the micro-mechanical design criteria for high-ductility concrete [50]. Overall, H-EGCs with lower GGBS ratios exhibit higher ultimate tensile strain, consistent with their higher crack density.
The tensile strength of H-EGCs is primarily dependent on the fiber characteristics. According to previous studies [26], the tensile strength can be calculated by the following equation:
σ u = α 1 L f , p e d f , p e 1 R V f + α 2 L f , p p d f , p p R V f
where α 1 and α 2 represent parameters considering the influence of fiber hybrid ratio on fiber orientation, distribution, and bonding properties, which can be expressed using Equation (2); V f denotes the volume fraction of fibers; L f and d f , respectively, stand for fiber length and diameter.
α i = a i e b i R , i = 1 , 2
By substituting experimental data into Equation (1) and performing fitting, the values of parameters α 1 and α 2 for H-EGCs at different FA/GGBS ratios are obtained as shown in Table 6:
The tensile strength of H-EGCs at different FA/GGBS ratios (7:3, 6:4, 5:5) can be calculated using Equations (3)–(5), respectively. The fitting results of the equations are depicted in Figure 16.
σ u , 7 : 3 = 6.67 e 0.87 R · 1 R + 0.67 e 0.87 R · R ;   R 2 = 0.91
σ u , 6 : 4 = 7.06 e 0.18 R · 1 R + 13.2 e 1.9 R · R ;   R 2 = 0.99
σ u , 5 : 5 = 7.46 e 0.26 R · 1 R + 9.36 e 1.5 R · R ;   R 2 = 0.98

4. Environmental and Economic Properties

Using PP fibers can effectively reduce the carbon emissions and economic costs of H-EGCs. On the other hand, altering the FA/GGBS ratio can achieve higher mechanical performance with relatively small economic costs. Therefore, this paper conducts a quantitative analysis of the carbon emissions and costs of H-EGCs. The material costs and carbon emission factors of the components of H-EGCs are shown in Table 7, with each material cost computed using market prices in China. For a more intuitive comparison, assuming the cost and carbon emissions per unit volume of M73-R0 are both 1, the costs and carbon emissions of other ratios are calculated based on the mix proportions in Table 3 and the costs and carbon emission factors of each raw material in Table 7. It is worth noting that the scope of the life cycle assessment (LCA) involved in this study is “Cradle to Gate”, only considering the processes from raw material extraction to production, while disregarding the costs and carbon emissions generated from transportation, use, and disposal processes. In addition, in order to analyze the effects of different PP fiber replacement ratios and FA/GGBS ratios on the economics and carbon emissions of H-EGCs, this paper uses the ratios of important tensile parameters (tensile strength, ultimate tensile strain) as well as the ratio of compressive strength to cost/carbon emissions as the economic/environmental indices to conduct a comprehensive evaluation of the economics and environmental protection of H-EGCs, and the results are shown in Table 8.
Table 8 shows that the use of PP fibers effectively reduces costs. With a PP fiber replacement ratio of 100%, the cost of H-EGCs is reduced by approximately 59.8% to 61%. However, the impact of PP fibers on carbon emissions can be neglected. Additionally, it can be observed from the data in the table that the influence of different FA/GGBS ratios on cost and carbon emissions is negligible. However, when mechanical performance indicators are taken into consideration, it is evident that the PP fiber replacement rate and FA/GGBS ratio have a significant impact on the economic and environmental benefits. Figure 17 and Figure 18 represent three-dimensional radar charts assessing economic and environmental performance, and it can be visually observed that when the PP fiber replacement ratio is 50%, the enveloped area of the radar chart is maximized, indicating the most significant economic and environmental benefits. At the same time, H-EGCs with higher GGBS content show prominent economic indicators and a larger enveloped area. Therefore, M55-R50 exhibits the best economic and environmental benefits. However, for different application scenarios, there should be a selective emphasis on the H-EGC mix proportion. For instance, in scenarios where higher compressive strength is required, it is necessary to choose a lower FA/GGBS ratio and PP fiber replacement rate. Conversely, in scenarios where higher tensile strength and tensile ductility are required, the PP fiber replacement rate should not exceed 50%.

5. Conclusions

This study examined the mechanisms through which the FA/GGBS ratio and PP fiber replacement ratio influence the mechanical behavior of H-EGCs. Additionally, a comprehensive evaluation of the environmental and economic benefits of H-EGCs was conducted. The conclusions can be summarized as follows:
(1)
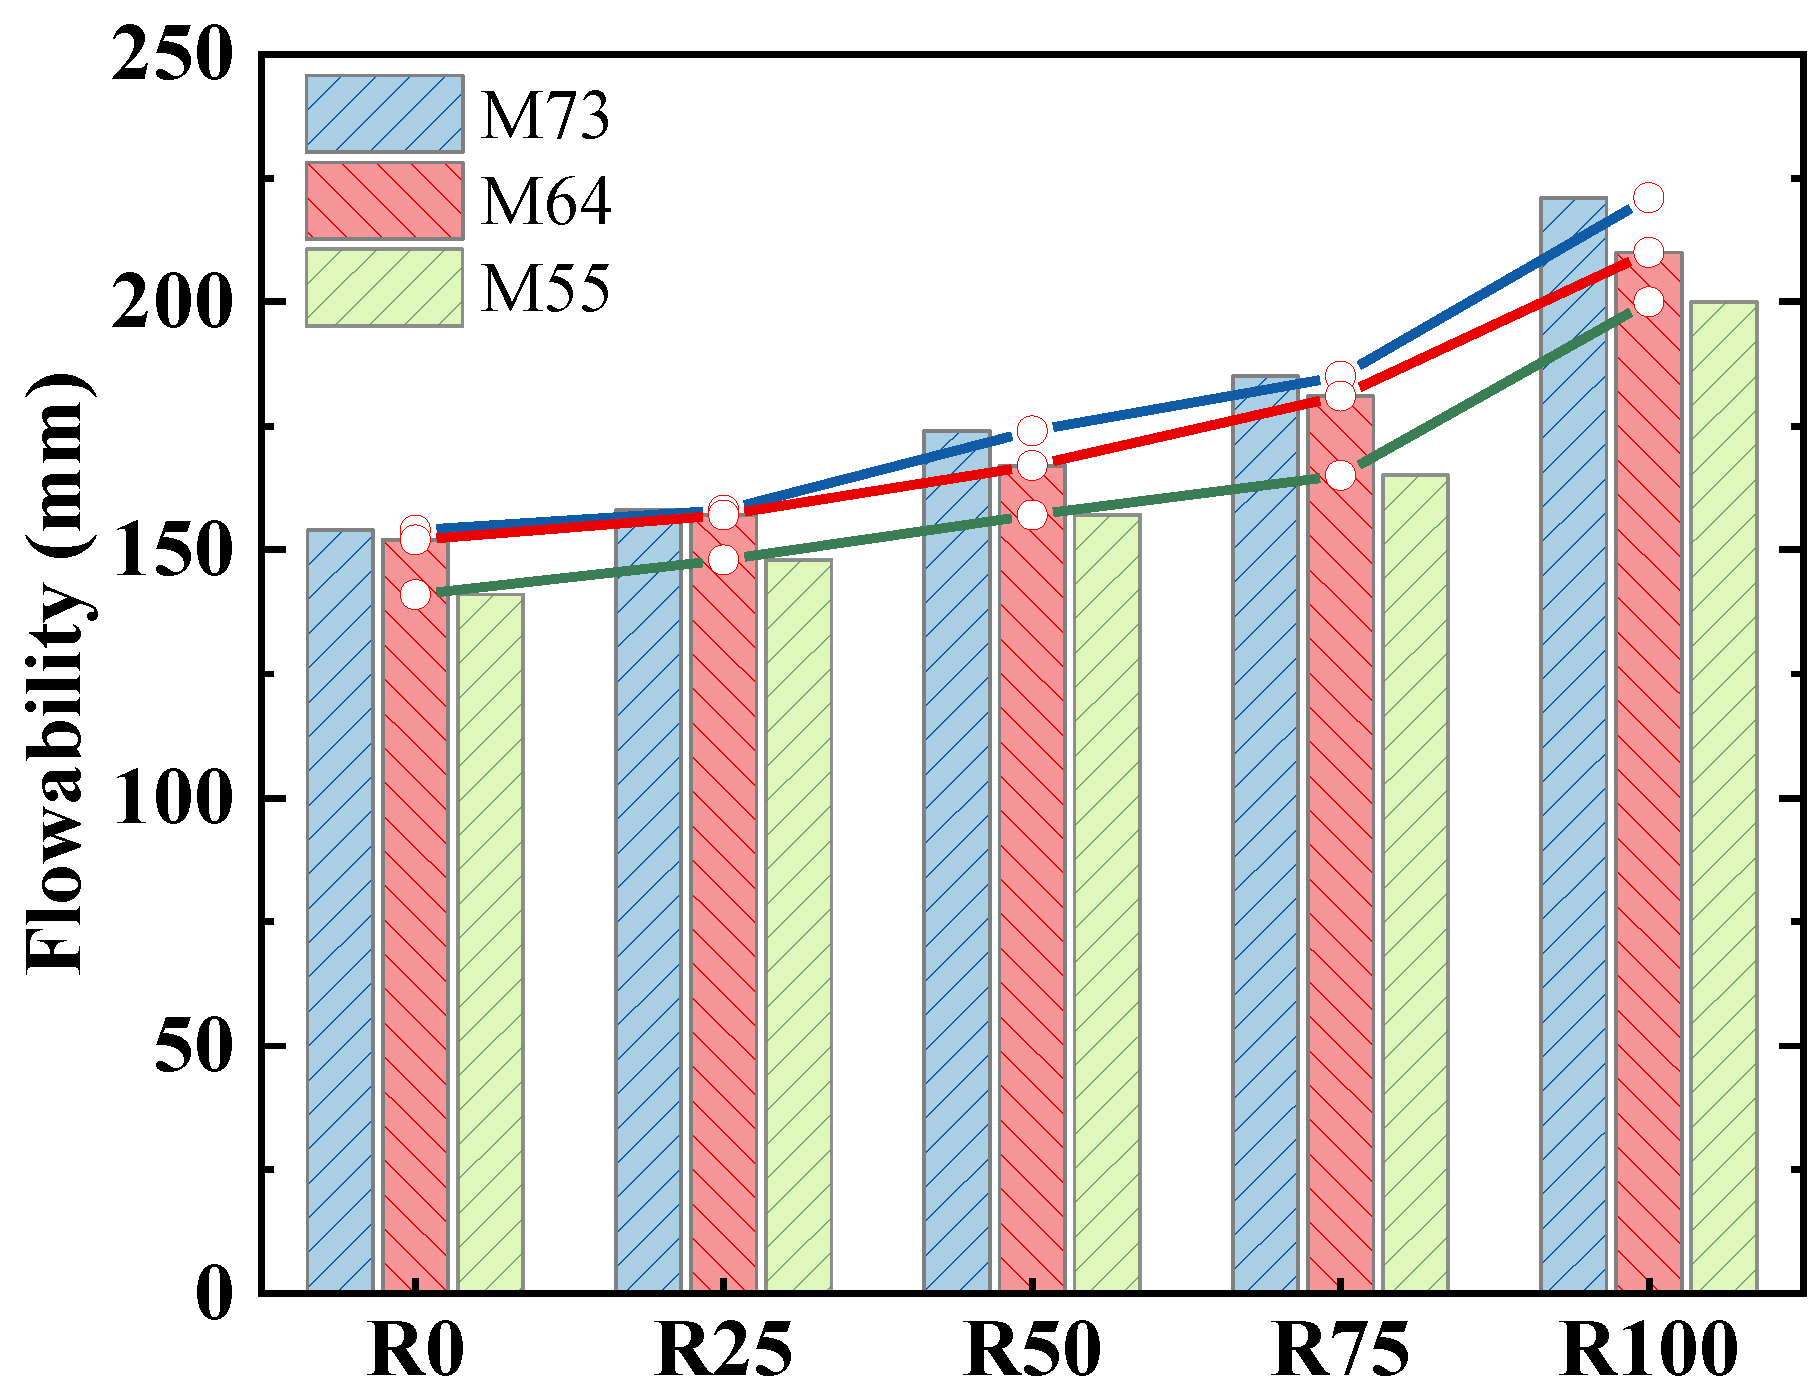
The smaller aspect ratio and higher stiffness of PP fibers alleviate fiber agglomeration during the mixing process in H-EGCs, particularly with an increased PP fiber replacement ratio. This enhancement improves the flowability of fresh H-EGCs, as evidenced by an increase in slump flow from 38.2% to 43.5% when PP fibers fully replace PE fibers. Moreover, the “rolling ball effect” of fly ash contributes to superior flowability in H-EGCs with a higher FA/GGBS ratio, even at the same PP fiber replacement ratio.
(2)
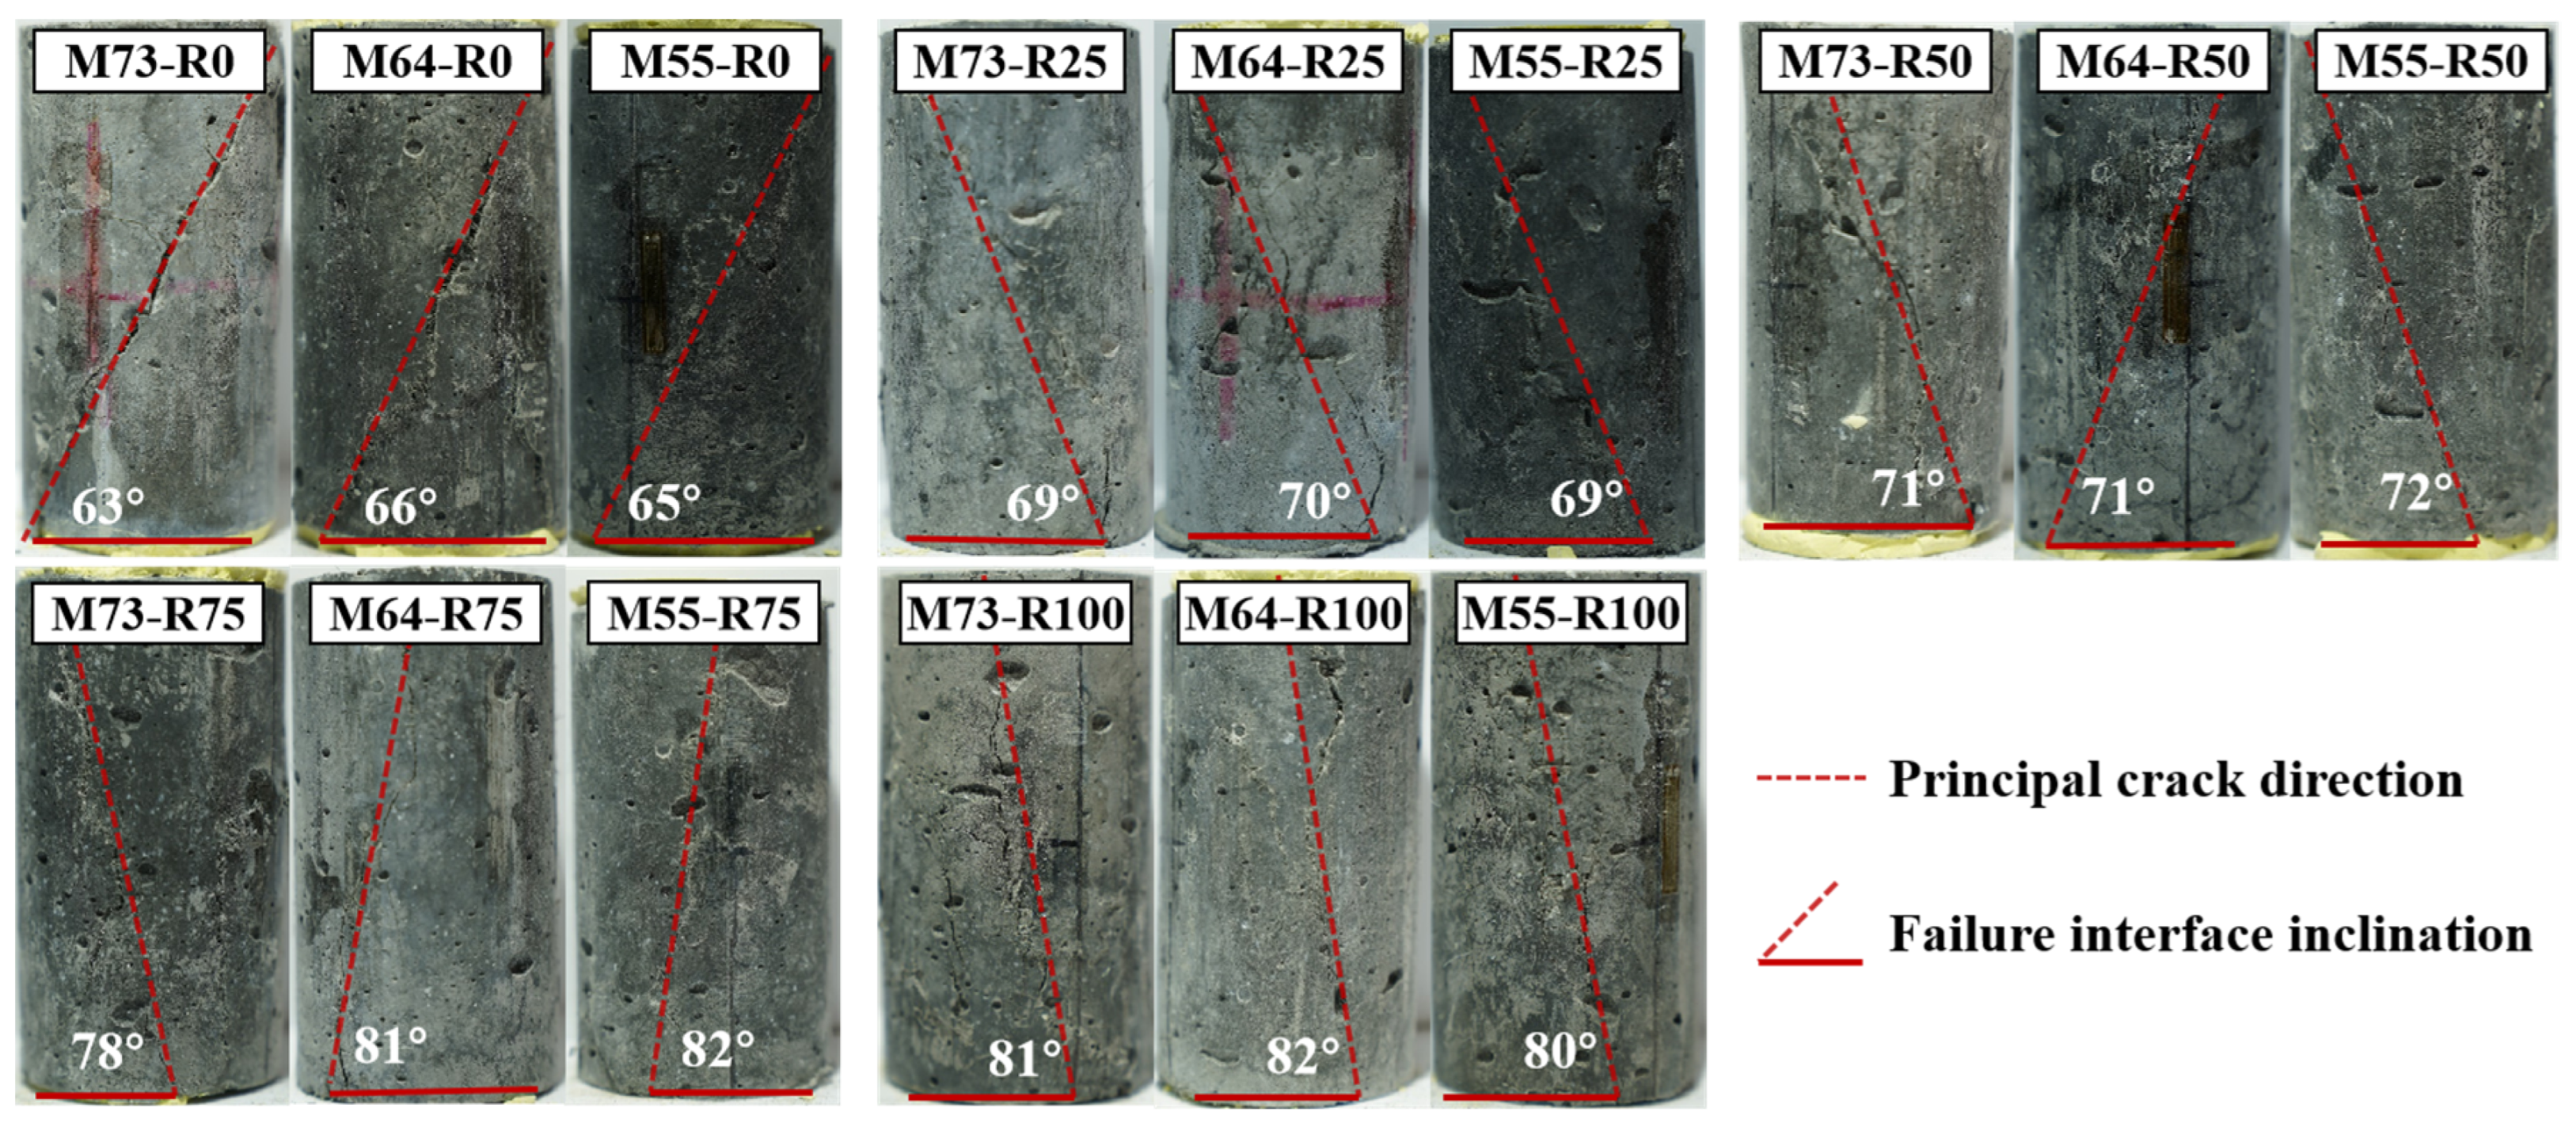
H-EGCs demonstrate a vertical splitting pattern upon compressive failure, indicating significant compressive brittleness. The introduction of PP fibers, which possess lower elastic modulus and strength, effectively creates voids within the matrix, thereby diminishing the compressive performance of the specimens. When PP fibers completely replace PE fibers, both the compressive strength and elastic modulus decrease by 19.3% to 23.5% and 7.2% to 14.1%, respectively. Moreover, the increased GGBS content enhances the densification of the cementitious microstructure, resulting in a substantial improvement in the compressive strength and elastic modulus of H-EGCs.
(3)
The incorporation of PP fibers reduces the tensile strength and crack control capability of H-EGCs. However, at a PP fiber replacement ratio of 50%, H-EGCs achieve the highest tensile strain capacity (9.66%). Comparing H-EGCs with different FA/GGBS ratios, a higher GGBS content increases the ductility of the matrix, decreasing the ultimate tensile strain but enhancing the tensile strength of H-EGCs.
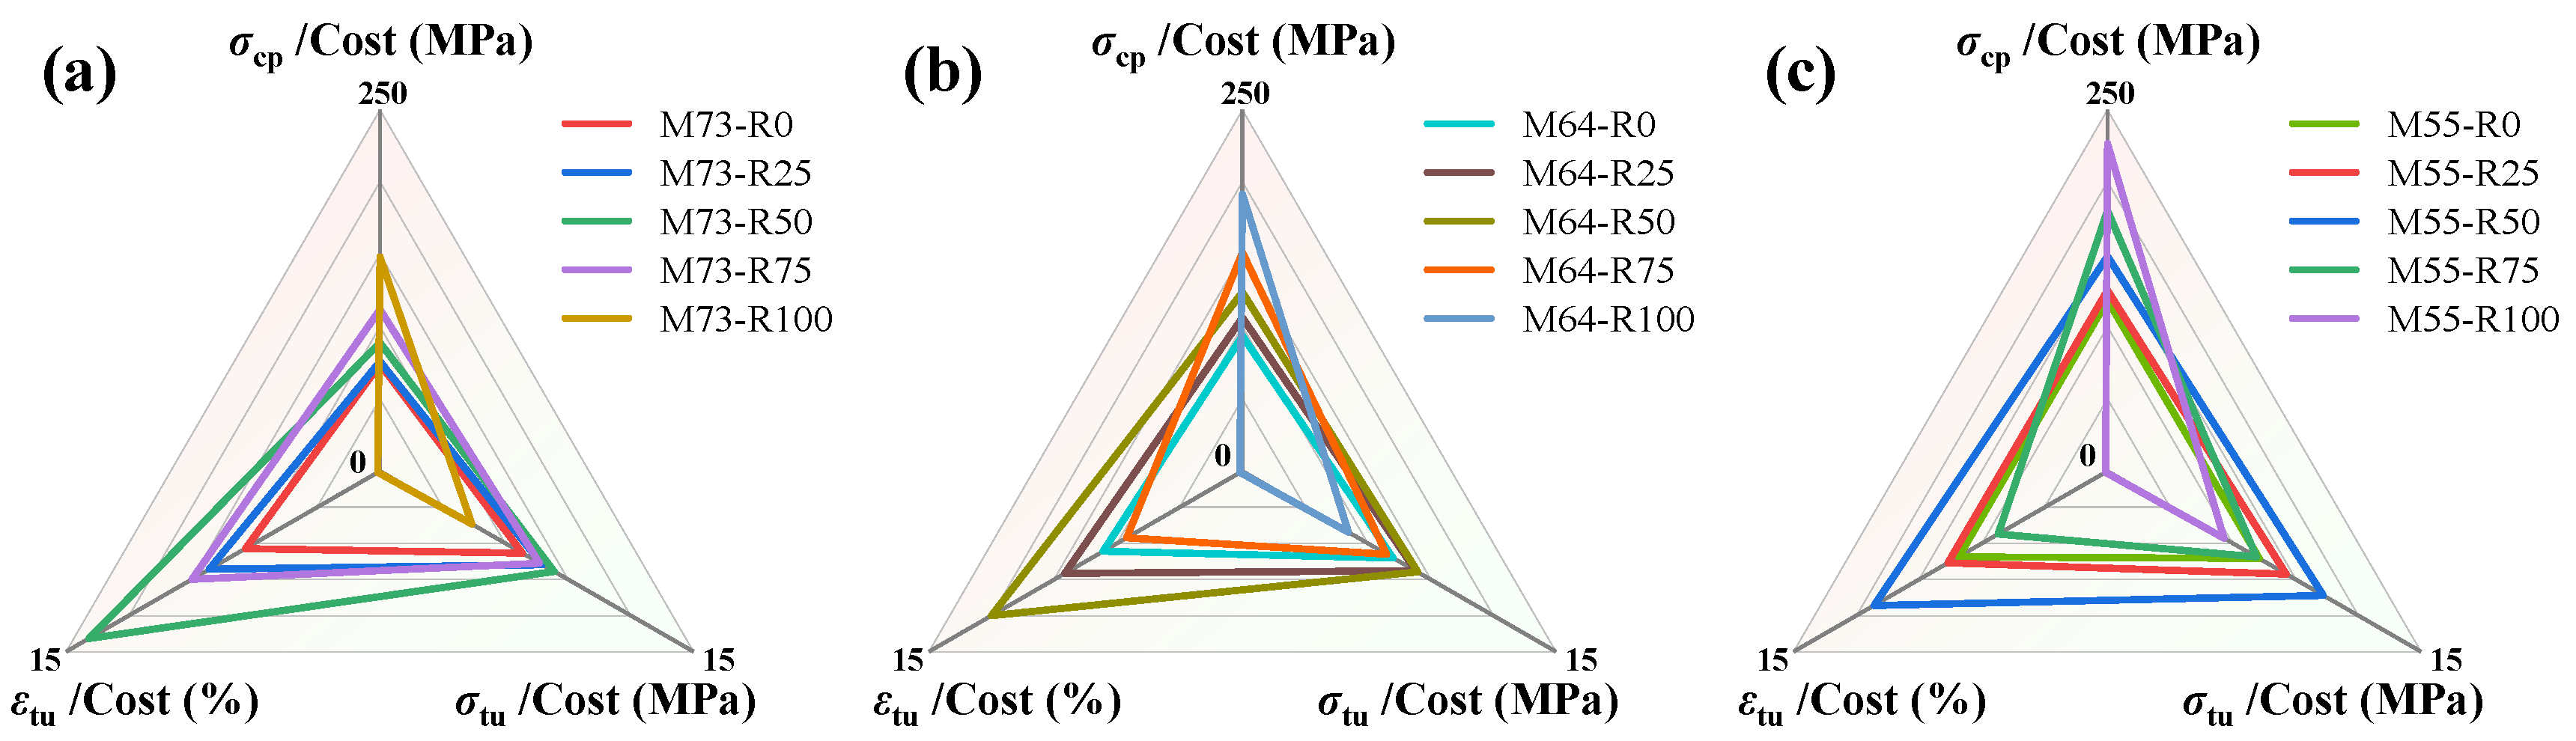
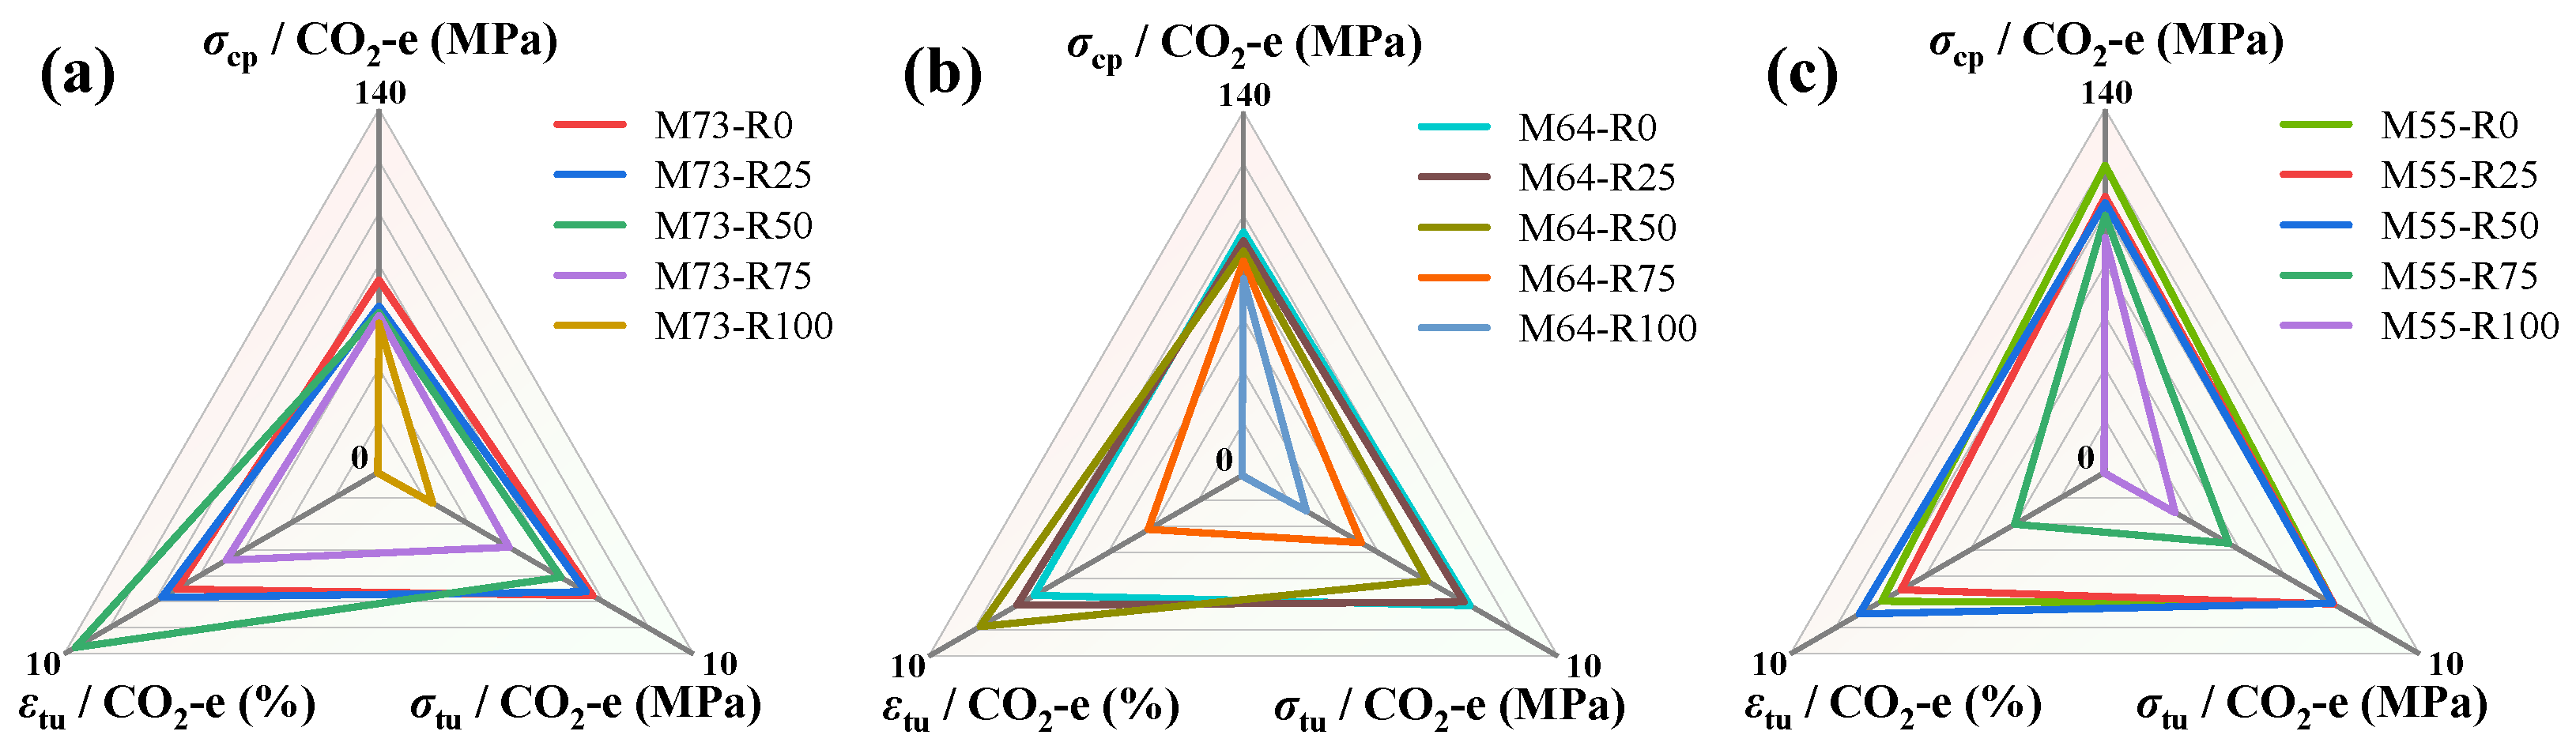
(4)
Through a comprehensive assessment of the cost, carbon emissions, and mechanical properties of H-EGCs, it is found that increasing the GGBS content and incorporating an appropriate amount of PP fibers are beneficial for enhancing the environmental and economic performance of H-EGCs, with M55-R50 being the optimal combination.
For EGCs with different FA/GGBS ratios, the partial replacement of PE fibers with PP fibers effectively enhances the tensile performance. Although some loss in strength occurs, considering cost and carbon emissions, the hybrid fiber method proves to be an effective approach to improve the economic and environmental benefits of H-EGCs. This paper suggests that the replacement ratio of PP fibers should not exceed 50%. The testing at the micro level in this study is still lacking. In the future, advanced microscopic testing methods need to be employed to further investigate the internal microstructure and fiber–matrix interface properties of H-EGCs. Additionally, further research is required to study the macroscopic mechanical response of H-EGCs under impact and fatigue loading, providing a theoretical basis for its application in various practical environments.

Author Contributions

Conceptualization, X.Z.; methodology, X.Z.; formal analysis, Y.L. and H.L.; investigation, Y.L. and Y.W. (Yingchang Wang); resources, Y.W. (Yanwei Wu) and Y.W. (Yingchang Wang); data curation, Z.C. and Y.W. (Yingchang Wang); writing—original draft preparation, X.Z.; writing—review and editing, Y.L., Y.W. (Yanwei Wu) and Z.C.; visualization, H.L. and Y.W. (Yingchang Wang); project administration, Z.C.; funding acquisition, Z.C. All authors have read and agreed to the published version of the manuscript.

Funding

This research was funded by Guangzhou Power Supply Bureau, Guangdong Power Grid Co., Ltd., China Southern Power Grid Co., Ltd. grant number 0301002023030103XG00073.

Data Availability Statement

The data presented in this study are available on request from the corresponding author. The data are not publicly available due to confidentiality issues.

Conflicts of Interest

Authors Xiafei Zhang, Yu Ling, and Yanwei Wu were employed by the company Guangzhou Power Supply Bureau, Guangdong Power Grid Co., Ltd., China Southern Power Grid Co., Ltd., Guangzhou, China. The remaining authors declare that the research was conducted in the absence of any commercial or financial relationships that could be construed as a potential conflict of interest.

References

  1. Mohajerani, A.; Suter, D.; Jeffrey-Bailey, T.; Song, T.; Arulrajah, A.; Horpibulsuk, S.; Law, D. Recycling waste materials in geopolymer concrete. Clean Technol. Environ. Policy 2019, 21, 493–515. [Google Scholar] [CrossRef]
  2. Hasanbeigi, A.; Menke, C.; Price, L. The CO2 abatement cost curve for the Thailand cement industry. J. Clean. Prod. 2010, 18, 1509–1518. [Google Scholar] [CrossRef]
  3. Assi, L.N.; Carter, K.; Deaver, E.; Ziehl, P. Review of availability of source materials for geopolymer/sustainable concrete. J. Clean. Prod. 2020, 263, 121477. [Google Scholar] [CrossRef]
  4. Jindal, B.B. Investigations on the properties of geopolymer mortar and concrete with mineral admixtures: A review. Constr. Build. Mater. 2019, 227, 116644. [Google Scholar] [CrossRef]
  5. Benhelal, E.; Zahedi, G.; Shamsaei, E.; Bahadori, A. Global strategies and potentials to curb CO2 emissions in cement industry. J. Clean. Prod. 2013, 51, 142–161. [Google Scholar] [CrossRef]
  6. Fang, Z.; Wu, J.; Xu, X.; Ma, Y.; Fang, S.; Zhao, G.; Jiang, H. Grouped rubber-sleeved studs–UHPC pocket connections in prefabricated steel–UHPC composite beams: Shear performance under monotonic and cyclic loadings. Eng. Struct. 2024, 305, 117781. [Google Scholar] [CrossRef]
  7. Fang, Z.; Wu, J.; Xian, B.; Zhao, G.; Fang, S.; Jiang, H. Shear performance and design recommendations of single embedded nut bolted shear connectors in prefabricated steel-UHPC composite beams. Steel Compos. Struct. 2024, 50, 319–336. [Google Scholar] [CrossRef]
  8. Lin, J.-X.; Luo, R.-H.; Su, J.-Y.; Guo, Y.-C.; Chen, W.-S. Coarse synthetic fibers (PP and POM) as a replacement to steel fibers in UHPC: Tensile behavior, environmental and economic assessment. Constr. Build. Mater. 2024, 412, 134654. [Google Scholar] [CrossRef]
  9. Xie, J.; Wang, J.; Rao, R.; Wang, C.; Fang, C. Effects of combined usage of GGBS and fly ash on workability and mechanical properties of alkali activated geopolymer concrete with recycled aggregate. Compos. Part B Eng. 2018, 164, 179–190. [Google Scholar] [CrossRef]
  10. Li, R.; Tang, B.-J.; Shen, M.; Zhang, C. Low-carbon development pathways for provincial-level thermal power plants in China by mid-century. J. Environ. Manag. 2023, 342, 118309. [Google Scholar] [CrossRef]
  11. Hassan, A.; Arif, M.; Shariq, M. A review of properties and behaviour of reinforced geopolymer concrete structural elements—A clean technology option for sustainable development. J. Clean. Prod. 2020, 245, 118762. [Google Scholar] [CrossRef]
  12. Chen, G.; Zheng, D.-P.; Chen, Y.-W.; Lin, J.-X.; Lao, W.-J.; Guo, Y.-C.; Chen, Z.-B.; Lan, X.-W. Development of high performance geopolymer concrete with waste rubber and recycle steel fiber: A study on compressive behavior, carbon emissions and economical performance. Constr. Build. Mater. 2023, 393, 131988. [Google Scholar] [CrossRef]
  13. Temuujin, J.; van Riessen, A.; MacKenzie, K. Preparation and characterisation of fly ash based geopolymer mortars. Constr. Build. Mater. 2010, 24, 1906–1910. [Google Scholar] [CrossRef]
  14. Zhuo, K.-X.; Chen, G.; Luo, R.-H.; Chen, Y.-W.; Li, D.-H.; Lin, J.-X. Effect of Na2CO3 Replacement Quantity and Activator Modulus on Static Mechanical and Environmental Behaviours of Alkali-Activated-Strain-Hardening-Ultra-High-Performance Concrete. Buildings 2024, 14, 681. [Google Scholar] [CrossRef]
  15. Yang, K.-H.; Song, J.-K.; Song, K.-I. Assessment of CO2 reduction of alkali-activated concrete. J. Clean. Prod. 2013, 39, 265–272. [Google Scholar] [CrossRef]
  16. Nematollahi, B.; Sanjayan, J.; Qiu, J.; Yang, E.-H. Micromechanics-based investigation of a sustainable ambient temperature cured one-part strain hardening geopolymer composite. Constr. Build. Mater. 2017, 131, 552–563. [Google Scholar] [CrossRef]
  17. Zhang, Z.; Provis, J.L.; Reid, A.; Wang, H. Geopolymer foam concrete: An emerging material for sustainable construction. Constr. Build. Mater. 2014, 56, 113–127. [Google Scholar] [CrossRef]
  18. Ohno, M.; Li, V.C. A feasibility study of strain hardening fiber reinforced fly ash-based geopolymer composites. Constr. Build. Mater. 2014, 57, 163–168. [Google Scholar] [CrossRef]
  19. Ohno, M.; Li, V.C. An integrated design method of Engineered Geopolymer Composite. Cem. Concr. Compos. 2018, 88, 73–85. [Google Scholar] [CrossRef]
  20. Kan, L.-L.; Wang, W.-S.; Liu, W.-D.; Wu, M. Development and characterization of fly ash based PVA fiber reinforced Engineered Geopolymer Composites incorporating metakaolin. Cem. Concr. Compos. 2020, 108, 103521. [Google Scholar] [CrossRef]
  21. Pan, H.; Xie, Z.; Chen, G.; Su, J.; Zhuo, K.; Chen, Z.; Lin, J.; Feng, C.; Guo, Y. Dynamic compressive behavior of high-strength engineered geopolymer composites. J. Build. Eng. 2023, 80, 108036. [Google Scholar] [CrossRef]
  22. Cai, J.; Pan, J.; Han, J.; Lin, Y.; Sheng, Z. Low-energy impact behavior of ambient cured engineered geopolymer composites. Ceram. Int. 2021, 48, 9378–9389. [Google Scholar] [CrossRef]
  23. Kan, L.; Zhang, L.; Zhao, Y.; Wu, M. Properties of polyvinyl alcohol fiber reinforced fly ash based Engineered Geopolymer Composites with zeolite replacement. Constr. Build. Mater. 2020, 231, 117161. [Google Scholar] [CrossRef]
  24. Nguyễn, H.H.; Lương, Q.-H.; Choi, J.-I.; Ranade, R.; Li, V.C.; Lee, B.Y. Ultra-ductile behavior of fly ash-based engineered geopolymer composites with a tensile strain capacity up to 13.7%. Cem. Concr. Compos. 2021, 122, 104133. [Google Scholar] [CrossRef]
  25. Zhong, H.; Zhang, M. Effect of recycled tyre polymer fibre on engineering properties of sustainable strain hardening geopolymer composites. Cem. Concr. Compos. 2021, 122, 104167. [Google Scholar] [CrossRef]
  26. Lin, J.-X.; Chen, G.; Pan, H.-S.; Wang, Y.-C.; Guo, Y.-C.; Jiang, Z.-X. Analysis of stress-strain behavior in engineered geopolymer composites reinforced with hybrid PE-PP fibers: A focus on cracking characteristics. Compos. Struct. 2023, 323, 117437. [Google Scholar] [CrossRef]
  27. Peng, Y.-Q.; Zheng, D.-P.; Pan, H.-S.; Yang, J.-L.; Lin, J.-X.; Lai, H.-M.; Wu, P.-Z.; Zhu, H.-Y. Strain hardening geopolymer composites with hybrid POM and UHMWPE fibers: Analysis of static mechanical properties, economic benefits, and environmental impact. J. Build. Eng. 2023, 76, 107315. [Google Scholar] [CrossRef]
  28. Khan, S.U.; Ayub, T. PET Fiber–Reinforced Engineered Geopolymer and Cementitious Composites. J. Mater. Civ. Eng. 2022, 34, 06021010. [Google Scholar] [CrossRef]
  29. Lu, C.; She, P.; Chu, H.; Yao, Y.; Leung, C.K.Y. An investigation on the performance enhancement and cost reduction of engineered cementitious composites developed with local PVA and PET fibers. J. Sustain. Cem. Mater. 2022, 12, 1020–1032. [Google Scholar] [CrossRef]
  30. Kumar, S.; Kumar, R.; Mehrotra, S.P. Influence of granulated blast furnace slag on the reaction, structure and properties of fly ash based geopolymer. J. Mater. Sci. 2010, 45, 607–615. [Google Scholar] [CrossRef]
  31. Junaid, M.T.; Kayali, O.; Khennane, A.; Black, J. A mix design procedure for low calcium alkali activated fly ash-based concretes. Constr. Build. Mater. 2015, 79, 301–310. [Google Scholar] [CrossRef]
  32. Bakharev, T. Geopolymeric materials prepared using Class F fly ash and elevated temperature curing. Cem. Concr. Res. 2005, 35, 1224–1232. [Google Scholar] [CrossRef]
  33. Palomo, A.; Grutzeck, M.W.; Blanco, M.T. Alkali-activated fly ashes: A cement for the future. Cem. Concr. Res. 1999, 29, 1323–1329. [Google Scholar] [CrossRef]
  34. Li, N.; Shi, C.; Zhang, Z.; Zhu, D.; Hwang, H.-J.; Zhu, Y.; Sun, T. A mixture proportioning method for the development of performance-based alkali-activated slag-based concrete. Cem. Concr. Compos. 2018, 93, 163–174. [Google Scholar] [CrossRef]
  35. Keulen, A.; Yu, Q.; Zhang, S.; Grünewald, S. Effect of admixture on the pore structure refinement and enhanced performance of alkali-activated fly ash-slag concrete. Constr. Build. Mater. 2018, 162, 27–36. [Google Scholar] [CrossRef]
  36. Rafeet, A.; Vinai, R.; Soutsos, M.; Sha, W. Guidelines for mix proportioning of fly ash/GGBS based alkali activated concretes. Constr. Build. Mater. 2017, 147, 130–142. [Google Scholar] [CrossRef]
  37. Gao, X.; Yu, Q.; Brouwers, H. Reaction kinetics, gel character and strength of ambient temperature cured alkali activated slag–fly ash blends. Constr. Build. Mater. 2015, 80, 105–115. [Google Scholar] [CrossRef]
  38. Luga, E.; Atis, C.D. Optimization of heat cured fly ash/slag blend geopolymer mortars designed by “Combined Design” method: Part 1. Constr. Build. Mater. 2018, 178, 393–404. [Google Scholar] [CrossRef]
  39. Yang, T.; Zhu, H.; Zhang, Z.; Gao, X.; Zhang, C.; Wu, Q. Effect of fly ash microsphere on the rheology and microstructure of alkali-activated fly ash/slag pastes. Cem. Concr. Res. 2018, 109, 198–207. [Google Scholar] [CrossRef]
  40. ASTM-C618; Annual Book of ASTM Standards. ASTM: West Conshohocken, PA, USA, 2012.
  41. GB/T-18046; Mortar and Concrete. China Architecture and Building Press: Beijing, China, 2017. (In Chinese)
  42. ASTM-C1437; Annual Book of ASTM Standards. ASTM: West Conshohocken, PA, USA, 2015.
  43. ASTM-C109/C109M; Annual Book of ASTM Standards. ASTM: West Conshohocken, PA, USA, 2020.
  44. Yokota, H.; Rokugo, K.; Sakata, N. JSCE Recommendations for Design and Construction of High Performance Fiber Reinforced Cement Composite with Multiple Fine Cracks; JSCE: Tokyo, Japan, 2007. [Google Scholar]
  45. Fang, G.; Ho, W.K.; Tu, W.; Zhang, M. Workability and mechanical properties of alkali-activated fly ash-slag concrete cured at ambient temperature. Constr. Build. Mater. 2018, 172, 476–487. [Google Scholar] [CrossRef]
  46. Nath, P.; Sarker, P.K. Flexural strength and elastic modulus of ambient-cured blended low-calcium fly ash geopolymer concrete. Constr. Build. Mater. 2017, 130, 22–31. [Google Scholar] [CrossRef]
  47. Nath, P.; Sarker, P.K. Effect of GGBFS on setting, workability and early strength properties of fly ash geopolymer concrete cured in ambient condition. Constr. Build. Mater. 2014, 66, 163–171. [Google Scholar] [CrossRef]
  48. Wille, K.; El-Tawil, S.; Naaman, A. Properties of strain hardening ultra high performance fiber reinforced concrete (UHP-FRC) under direct tensile loading. Cem. Concr. Compos. 2014, 48, 53–66. [Google Scholar] [CrossRef]
  49. Ling, Y.; Wang, K.; Li, W.; Shi, G.; Lu, P. Effect of slag on the mechanical properties and bond strength of fly ash-based engineered geopolymer composites. Compos. Part B Eng. 2019, 164, 747–757. [Google Scholar] [CrossRef]
  50. Li, V.C.; Leung, C.K.Y. Steady-State and Multiple Cracking of Short Random Fiber Composites. J. Eng. Mech. 1992, 118, 2246–2264. [Google Scholar] [CrossRef]
  51. Shi, Y.; Long, G.; Ma, C.; Xie, Y.; He, J. Design and preparation of ultra-high performance concrete with low environmental impact. J. Clean. Prod. 2019, 214, 633–643. [Google Scholar] [CrossRef]
  52. Wu, Z.; Shi, C.; Khayat, K.H. Investigation of mechanical properties and shrinkage of ultra-high performance concrete: Influence of steel fiber content and shape. Compos. Part B Eng. 2019, 174, 107021. [Google Scholar] [CrossRef]
  53. Turner, L.K.; Collins, F.G. Carbon dioxide equivalent (CO2-e) emissions: A comparison between geopolymer and OPC cement concrete. Constr. Build. Mater. 2013, 43, 125–130. [Google Scholar] [CrossRef]
  54. Zhang, D.; Yu, J.; Wu, H.; Jaworska, B.; Ellis, B.R.; Li, V.C. Discontinuous micro-fibers as intrinsic reinforcement for ductile Engineered Cementitious Composites (ECC). Compos. Part B Eng. 2020, 184, 107741. [Google Scholar] [CrossRef]
Figure 1. Flowchart of the research.
Buildings 14 01094 g001
Figure 2. Raw materials for H-EGCs. (a) FA; (b) GGBS; (c) QS; (d) waterglass; (e) NaOH; (f) BaCl2; (g) PE fibers; (h) PP fibers.
Buildings 14 01094 g002
Figure 3. Particle size distribution of FA, GGBS, and QS.
Buildings 14 01094 g003
Figure 4. Specimen dimensions. (a) Uniaxial compressive specimen; (b) uniaxial tensile specimen.
Buildings 14 01094 g004
Figure 5. Preparation process of H-EGCs.
Buildings 14 01094 g005
Figure 6. Test setup. (a) Flowability test; (b) uniaxial compressive test; (c) uniaxial tensile test.
Buildings 14 01094 g006
Figure 7. Flowability of fresh H-EGCs.
Buildings 14 01094 g007
Figure 8. Compressive failure mode.
Buildings 14 01094 g008
Figure 9. Compressive stress–strain curves of H-EGCs.
Buildings 14 01094 g009
Figure 10. Compressive strength and elastic modulus of H-EGCs.
Buildings 14 01094 g010
Figure 11. (a) The crack morphology of H-EGCs; (b) method for statistical analysis of tensile crack characteristics. w represents the crack width; n represents the number of cracks; L represents the length of the measuring zone.
Buildings 14 01094 g011
Figure 12. Tensile crack characteristics. (a) Crack width; (b) crack density.
Buildings 14 01094 g012
Figure 13. Tensile stress-strain curve.
Buildings 14 01094 g013
Figure 14. Tensile crack initiation characteristics. (a) Initial cracking strain; (b) Initial cracking strength.
Buildings 14 01094 g014
Figure 15. Tensile ultimate point characteristics. (a) Ultimate tensile strain; (b) initial cracking strength.
Buildings 14 01094 g015
Figure 16. Tensile strength fitting curves of H-EGCs.
Buildings 14 01094 g016
Figure 17. Radar chart of economic indices. (a) M73; (b) M64; (c) M55.
Buildings 14 01094 g017
Figure 18. Radar chart of environmental indices. (a) M73; (b) M64; (c) M55.
Buildings 14 01094 g018
Table 1. Chemical composition (wt%) of FA and GGBS.
OxideGGBSFA
CaO34.04.01
SiO234.554.0
Al2O317.731.2
SO31.642.20
Fe2O31.034.16
MgO6.011.01
TiO2/1.13
Other5.122.37
Table 2. Parameter list of fiber.
Fiber TypeDensity
(g/cm3)
Strength
(MPa)
Elastic Modulus
(GPa)
Length
(mm)
Diameter
(um)
Elongation at Break
(%)
PE0.97280012012183.70
PP0.91314.84.081210026.80
Table 3. Mix proportions of H-EGCs.
Mix IDsMatrix (kg/m3)Volume Fraction (%)
FAGGBSQSActivatorExtra WaterRetarderPE FiberPP Fiber
M73-R0849.7364.1242.8485.572.812.120
M73-R251.50.5
M73-R5011
M73-R750.51.5
M73-R10002
M64-R0736.3490.9245.4490.973.612.320
M64-R251.50.5
M64-R5011
M64-R750.51.5
M64-R10002
M55-R0620.3620.3248.1496.274.312.420
M55-R251.50.5
M55-R5011
M55-R750.51.5
M55-R10002
Note: The notation MX-RY represents the FA/GGBS ratio as X and the PP fiber replacement ratio as Y. For example, M73-R25 signifies an FA/GGBS ratio of 7:3 and a PP fiber replacement ratio of 25%.
Table 4. Characteristic parameters of compressive.
Mix IDsPeak Strain εcp (%)Peak Strength σcp (MPa)Elastic Modulus E (GPa)
M73-R00.428 (0.009)57.5 (1.650)13.79 (0.114)
M73-R250.450 (0.016)60.5 (0.735)14.07 (0.358)
M73-R500.453 (0.009)61.6 (0.801)14.43 (0.217)
M73-R750.497 (0.005)64.1 (2.216)14.60 (0.287)
M73-R1000.527 (0.021)74.1 (1.281)14.86 (0.078)
M64-R00.607 (0.012)93.5 (1.862)17.14 (0.190)
M64-R250.573 (0.020)90.1 (0.817)16.72 (0.080)
M64-R500.580 (0.008)86.2 (0.974)16.04 (0.129)
M64-R750.540 (0.015)82.4 (0.850)15.84 (0.035)
M64-R1000.463 (0.009)75.5 (1.837)15.72 (0.159)
M55-R00.610 (0.008)118.3 (1.451)20.52 (0.761)
M55-R250.553 (0.009)106.3 (2.707)19.77 (0.579)
M55-R500.547 (0.036)103.9 (1.350)19.55 (0.079)
M55-R750.535 (0.035)99.0 (0.900)18.68 (0.186)
M55-R1000.513 (0.012)90.5 (6.624)17.63 (0.150)
Table 5. Tensile characteristic parameters of H-EGCs.
Mix IDsInitial Cracking
Strain εini (%)
Ultimate Tensile
Strain εtu (%)
Initial Cracking
Strength σini (MPa)
Tensile Strength
σtu (MPa)
M73-R00.253 (0.053)6.427 (0.267)4.569 (0.164)6.806 (0.261)
M73-R250.227 (0.004)6.911 (0.647)3.932 (0.205)6.586 (0.445)
M73-R500.125 (0.016)9.659 (0.196)3.368 (0.227)5.786 (0.006)
M73-R750.122 (0.046)4.863 (0.467)2.079 (0.158)4.140 (0.161)
M73-R1000.037 (0.020)0.037 (0.020)1.508 (0.069)1.709 (0.185)
M64-R00.236 (0.035)6.663 (0.478)4.584 (0.246)7.214 (0.278)
M64-R250.206 (0.004)7.204 (0.512)4.060 (0.143)7.032 (0.711)
M64-R500.116 (0.007)8.370 (0.853)3.512 (0.289)5.847 (0.022)
M64-R750.108 (0.001)3.023 (0.284)2.238 (0.138)3.761 (0.179)
M64-R1000.032 (0.009)0.048 (0.025)1.709 (0.185)2.000 (0.069)
M55-R00.165 (0.028)7.106 (0.402)4.751 (0.269)7.259 (0.238)
M55-R250.154 (0.005)6.487 (1.712)4.530 (0.335)7.266 (0.327)
M55-R500.106 (0.030)7.818 (0.117)4.514 (0.029)7.230 (0.006)
M55-R750.095 (0.011)2.878 (0.309)2.767 (0.212)3.917 (0.168)
M55-R1000.025 (0.003)0.036 (0.003)2.225 (0.083)2.225 (0.083)
Table 6. The fitting parameters for each experimental group are as follows.
Mix IDs a 1 b 1 a 2 b 2
M730.50−0.870.28−0.87
M640.530.185.51.9
M550.56−0.263.91.5
Table 7. Cost and carbon emission factors of raw materials (¥/kg).
Raw MaterialsCost
(¥/kg)
Carbon Emission Factor
(kg CO2-e/kg)
References
FA1.900.009[48]
GGBS2.400.019[51]
QS0.400.010[52,53]
NaOH20.01.915[53]
Waterglass3.01.514[53]
PE fiber4002.0[54]
PP fiber13.52.0[54]
Table 8. Environmental and economic indices.
Mix IDsCostCO2-eσcp/Cost
(MPa)
σtu/Cost
(MPa)
εtu/Cost
(%)
σcp/CO2-e
(MPa)
σtu/CO2-e
(MPa)
εtu/CO2-e
(%)
M73-R01.001.0074.16.816.4374.16.816.43
M73-R250.851.0075.77.788.1664.16.596.91
M73-R500.691.0088.78.3413.9161.65.799.66
M73-R750.541.00111.87.658.9860.54.144.86
M73-R1000.391.00148.04.400.1057.51.710.04
M64-R01.011.0292.77.156.6091.37.046.50
M64-R250.861.02105.28.218.4188.06.867.03
M64-R500.701.02122.68.3211.9084.25.718.17
M64-R750.551.02149.76.835.4980.53.672.95
M64-R1000.401.02189.95.030.1373.71.950.05
M55-R01.021.05116.27.136.98112.86.926.78
M55-R250.871.05122.88.407.50101.36.936.19
M55-R500.711.05145.810.1510.9899.16.897.46
M55-R750.561.05176.97.015.1594.43.742.75
M55-R1000.411.05222.55.480.1086.32.130.04
Disclaimer/Publisher’s Note: The statements, opinions and data contained in all publications are solely those of the individual author(s) and contributor(s) and not of MDPI and/or the editor(s). MDPI and/or the editor(s) disclaim responsibility for any injury to people or property resulting from any ideas, methods, instructions or products referred to in the content.

