Article

Analytical Solution for the Deformation of Pipe Galleries Adjacent to Deep Excavation

1
Department of Civil Engineering, Nanchang Institute of Technology, Nanchang 330099, China
2
Jiangxi Zhengde Engineering Testing Co., Ltd., Nanchang 330072, China
3
Department of Civil Engineering, University of Shanghai for Science and Technology, Shanghai 200093, China
4
Department of Engineering Geology and Hydrogeology, RWTH Aachen University, 50264 Aachen, Germany
5
Department of Civil Engineering, Linyi University, Linyi 276000, China
*
Author to whom correspondence should be addressed.
Buildings 2024, 14(4), 1103; https://doi.org/10.3390/buildings14041103
Submission received: 4 February 2024 / Revised: 29 March 2024 / Accepted: 3 April 2024 / Published: 15 April 2024

Abstract

:
Deep excavations clearly impact adjacent existing properties and threaten their operational safety. Predicting the deformation of existing infrastructure induced by nearby underground construction is the main concern of urban underground development. This paper presents an analytical calculation method for predicting underground pipe gallery deformations induced by adjacent deep excavations. First, the authors assume the existing pipe gallery to be nonexistent in the soil and propose a solution to calculate the excavation-induced vertical movements of the soil at the position of the existing pipe gallery. Thereafter, the authors simplify the existing pipe gallery as an elastic beam on a Winkler foundation to calculate its deformation. Finally, the method is verified by the good agreement found between the calculated result and the field measurement of the construction of the Shanghai Hongqiao CBD project. The proposed analytical method of this work can provide accurate evaluation results for similar engineering projects.

1. Introduction

With the development of urbanization, more and more high-rise buildings and underground structures are being constructed in cities. This process inevitably requires a large number of underground constructions. At the same time, deep excavations near existing infrastructures are unavoidable because of the limited available space in urban areas [1,2,3,4,5,6,7]. The presence of adjacent urban underground pipe galleries has become a necessary consideration for the construction of a deep foundation pit. The excavation of a pit can lead to displacements of its surrounding strata, potentially impacting the functionality of the nearby urban underground pipe gallery and disrupting its normal operations. Understanding the interaction mechanism between the displacement of the surrounding strata of a foundation pit and the nearby underground pipe gallery, as well as analyzing the deformation behavior of the pipe gallery during the construction of its adjacent foundation pit, is a pressing challenge and requirement in current research [8,9,10].
In recent years, emphasis has been placed on the study of responses of existing properties to deep excavations. Several commonly used techniques to investigate deformation behaviors and the corresponding environmental effects of braced excavations are FEM analyses based on numerical tools [11,12,13,14,15,16], empirical/semiempirical methods based on field measurements [17,18,19,20,21,22]; or a published database [23,24,25,26], analytical solutions [27,28,29,30,31,32], and model tests [33,34]. In addition, machine learning (ML), artificial intelligence (AI), and artificial neural network (ANN) algorithms are becoming increasingly accurate and reliable in predicting elastic fields of soil around retaining walls under various scenarios of wall movements [35,36,37,38,39,40,41]. Of these methods, numerical methods are most widely used to investigate the interaction between new excavations and existing properties because they can consider most of the factors in practice. For example, Huang et al. [42] presented a finite element parametric study to investigate tunnel behavior caused by nearby deep excavation in Shanghai. This study researched the effects of several factors (e.g., the relative position of the tunnel to the foundation pit, the diameter of the tunnel, the dimension of the pit, and several tunnel protection measures) that may affect the tunnel response. Yang et al. [15] analyzed the influence of a top-down excavation on an adjacent elevated road as well as a simultaneously constructed foundation pit based on a verified 3D FE model, in which the responses both of ground and underground properties to the top-down excavation were studied. These previous studies prove the effectiveness of FE methods. However, the establishment of a numerical model always includes many hypothetical parameters that need to be defined, and very limited constitutive models are available for different soils, making numerical simulations inconvenient [32]. Another effective technique to study the influences of deep excavations is laboratory tests [33,34]. For example, Choudhury et al. [17] performed a series of centrifuge models to investigate pile responses to deep excavations in sands with various relative densities, and valuable results were obtained. Laboratory tests have many advantages, e.g., the variables are controllable, and the results are relatively reliable. Nevertheless, equipment for these tests is so prohibitive and laboratories are so limited that only very few projects can have access to model tests.
Analytical solutions can provide quick and relatively accurate predictions if the calculation conditions are appropriately simplified [30,43,44,45,46]. In addition, analytical methods are clear and simple, making them available to most researchers and engineers. Moreover, once an analytical solution is developed and verified, it can effectively predict the performance of similar projects. At present, a widely applied analytical method is the two-step method. The method calculates the displacement of the greenfield soil or the vertical load induced by the excavation at the desired position and then applies the obtained displacement or load to the target property to determine its responses. The effectiveness of the method has been verified by various researchers. A typical example is as follows: based on the traditional two-step method, Zhang et al. (2016) [43] developed and verified a new analytical method for predicting tunnel responses caused by upside excavation. In addition, this verified method also considered the role of dewatering in the interaction between the excavation and the tunnel.
Previous studies mostly focused on the deformation of nearby buildings, underground pipelines, and tunnels caused by deep excavations. However, studies on the excavation-induced deformation of comprehensive pipe galleries are missing. In fact, pipe galleries are extremely vulnerable to the movements of the surrounding soil. In addition, resembling blood vessels in the human body, pipe galleries play crucial roles in urban functions. Therefore, it is necessary to make clear the potential impact of an underground project on its adjacent underground pipe galleries before construction to ensure the normal life of urban residents. Once the interaction mechanism between excavation-induced ground movements and the displacements of underground pipe galleries is understood, proper construction measures can be proposed. This work, based on the traditional two-stage method, develops a new method to calculate the displacements of pipe galleries caused by adjacent deep excavations. The establishment of the new method can be described as follows: (1) based on the control equation of the elastic plane strain problem, the displacement distribution of the soil outside the wall is calculated using the separation of variables method; (2) the developed two-dimensional solution is then extended to obtain a spatial distribution expression of the displacement of the soil behind the diaphragm wall; (3) the deformation of the pipe galleries under certain soil displacements is calculated using a simplified interaction model between the pipe gallery and soil. Finally, the method is checked by comparing the calculated results to the field measurements of a typical deep excavation project in Shanghai. Based on this verified method, several influencing factors are further analyzed to provide valuable references for practical engineering.

2. Basic Solution to Elastic Plane Strain Problems

The theoretical analysis method in this article has four assumptions: (1) soil is assumed to be elastic without considering the pore water pressure; (2) deep excavation problems are generally simplified as plane strain problems; (3) soil is saturated; and (4) pipe galleries are assumed as Winkler subgrade moduli.

2.1. Mechanical Model for Elastic Plane Strain Problems

When the body forces are not considered, the equilibrium equation for elastic plane strain problems can be described as
σ x x + τ z x z = 0 σ z z + τ x z x = 0
where σx and σz are the normal stresses along the x and z directions, respectively, and 𝜏zx and 𝜏xz are the shear stresses along the x and z directions, in which, according to the Shearing Stress Theorem, τ z x = τ x z .
The geometric equation for elastic plane strain problems is
ε x = u x ε z = w z γ x z = u z + w x
where u and w are the displacements along the x and z directions, respectively; ε x and ε z are the normal strains along the x and z directions, respectively; and γ x z is the shear strain in the x-z direction.
The physical equation with Lame constants is
σ x = ( λ + 2 G ) ε x + λ ε z σ z = ( λ + 2 G ) ε z + λ ε x τ x z = G γ x z
where λ = E ν ( 1 + ν ) ( 1 2 ν ) , G = E 2 ( 1 + ν ) .
Substituting Equations (2) and (3) into Equation (1) yields the basic equation for plane strain problems as
( λ + 2 G ) 2 u x 2 + G 2 u z 2 + ( λ + G ) 2 w x z = 0 ( λ + 2 G ) 2 w z 2 + G 2 w x 2 + ( λ + G ) 2 u x z = 0

2.2. Method of Separation of Variables for Plane Strain Problems

According to Equation (2), the volume strain, θ , and rigid body rotation angle, ω , can be expressed as
θ = u x + w z ω = 1 2 w x u z
Using Equations (4) and (5), we have
2 θ = 0
2 ω = 0
where 2 = 2 x 2 + 2 z 2 .
According to the boundary conditions of the model, the strain of the soil at infinity is zero, and we have θ | x = + = 0 . Using the method of separation of variables to solve Equation (6), its general solution can be obtained as
u = 1 α K 1 cos α z + K 2 sin α z A + α x e α x d α
Similarly, we can obtain the general solution of Equation (7) as
w = 1 α K 2 cos α z + K 1 sin α z A λ + 3 G λ + G + α x e α x d α
Noting that τ x z = G u z + w x , τ x z z = 0 = 0 ; thus, K 2 = 0 . Therefore, we can rewrite Equations (8) and (9) as
u = 1 α K 1 cos α z A + α x e α x d α w = 1 α K 1 sin α z A λ + 3 G λ + G + α x e α x d α
Letting K 3 = K 1 A , we can obtain
u = 1 α cos α z K 3 + K 1 α x e α x d α w = 1 α sin α z K 3 K 1 λ + 3 G λ + G + K 1 α x e α x d α
Assuming that the back of the diaphragm wall is smooth, i.e., τ x z x = 0 = 0 , we have
K 3 = λ + 2 G λ + G K 1

3. Analytical Solution of Excavation-Induced Ground Movement

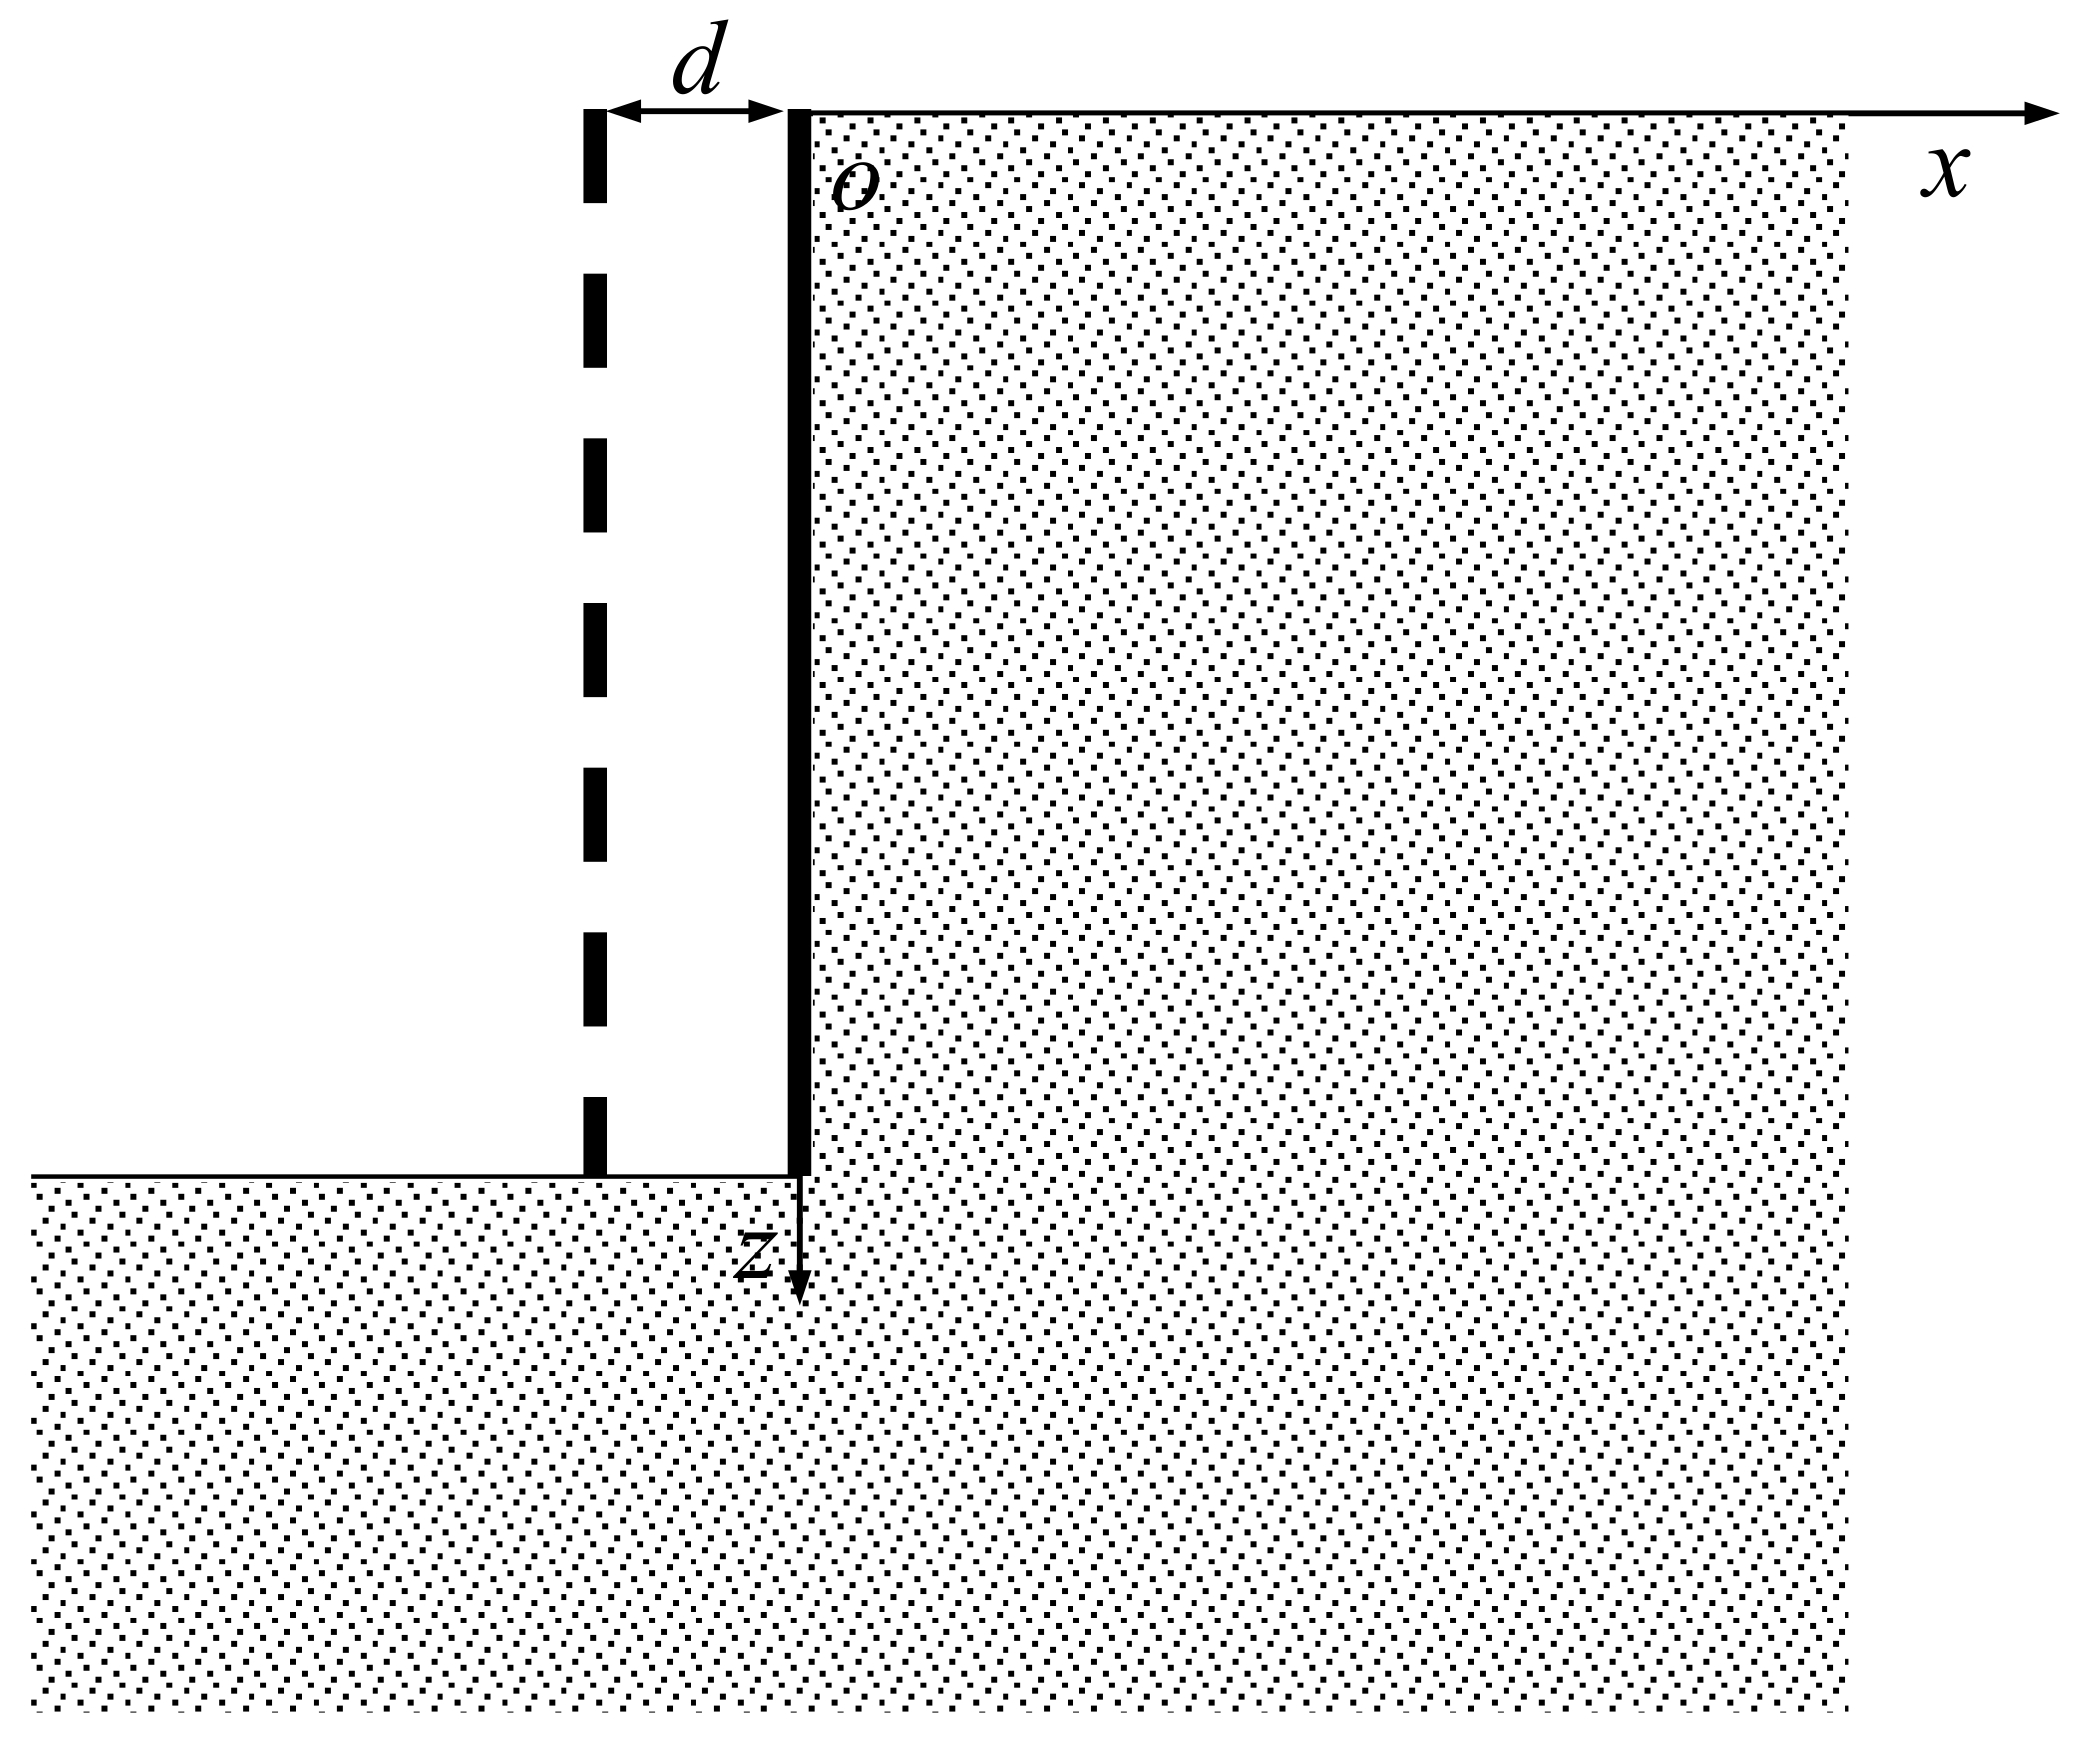
3.1. The Translation Mode of the Wall Movement

When the retaining wall develops inward translation movement, as shown in Figure 1, the corresponding boundary condition of the model is 0 z H , u 0 , z = d . According to Equation (11), we have
u = 1 α K 3 cos α z d α = d
Using a Fourier transform on variable d, we can obtain
d = 2 d π sin H α α cos α z d α
Comparing Equation (13) with Equation (14), it is easy to find that
K 3 = 2 d π sin H α
Substituting Equations (12) and (15) into Equation (11), the following is obtained:
u = 2 d π 0 1 α cos α z 1 + λ + G λ + 2 G x α sin H α e α x d α w = 2 d π 0 1 α sin α z 1 + λ + G λ + 2 G x α λ + 3 G λ + G sin H α e α x d α
Thus, we can obtain the vertical movement and the normal stress at the ground surface as
w z = 0 = 0
σ z z = 0 = d H H 2 x 2 β π H 2 + x 2 2
where
β = 1 μ 2 E
In other words, the ground surface settlement is zero, and there is a stress with a magnitude represented by Equation (18) distributed on the ground surface. Therefore, the wall-translation-induced settlement is equivalent to the displacement caused by the following load being applied to the ground surface:
F x = d H H 2 x 2 β π H 2 + x 2 2
Assuming that the settlement is zero when x = x r e f , according to the Boussinesq–Flamant solution, the ground surface settlement caused by F is
w = 2 β F π ln s ρ
in which F is the concentrated load, s is the distance between where we want to obtain the settlement and the reference point x r e f , and ρ is the distance between where we want to obtain the settlement and the concentrated load F. The three variables can be represented by
ρ = ξ x s = ξ x r e f F ξ = d H H 2 ξ 2 β π ξ 2 + H 2 2
Combining Equations (20)–(22), we have
w = 2 d H π 2 + ξ 2 H 2 ξ 2 + H 2 2 ln ξ x ξ x r e f d ξ
The wall’s inward translation can be obtained as
w = 2 d H 2 π 2 1 x 2 + H 2 1 x ref 2 + H 2

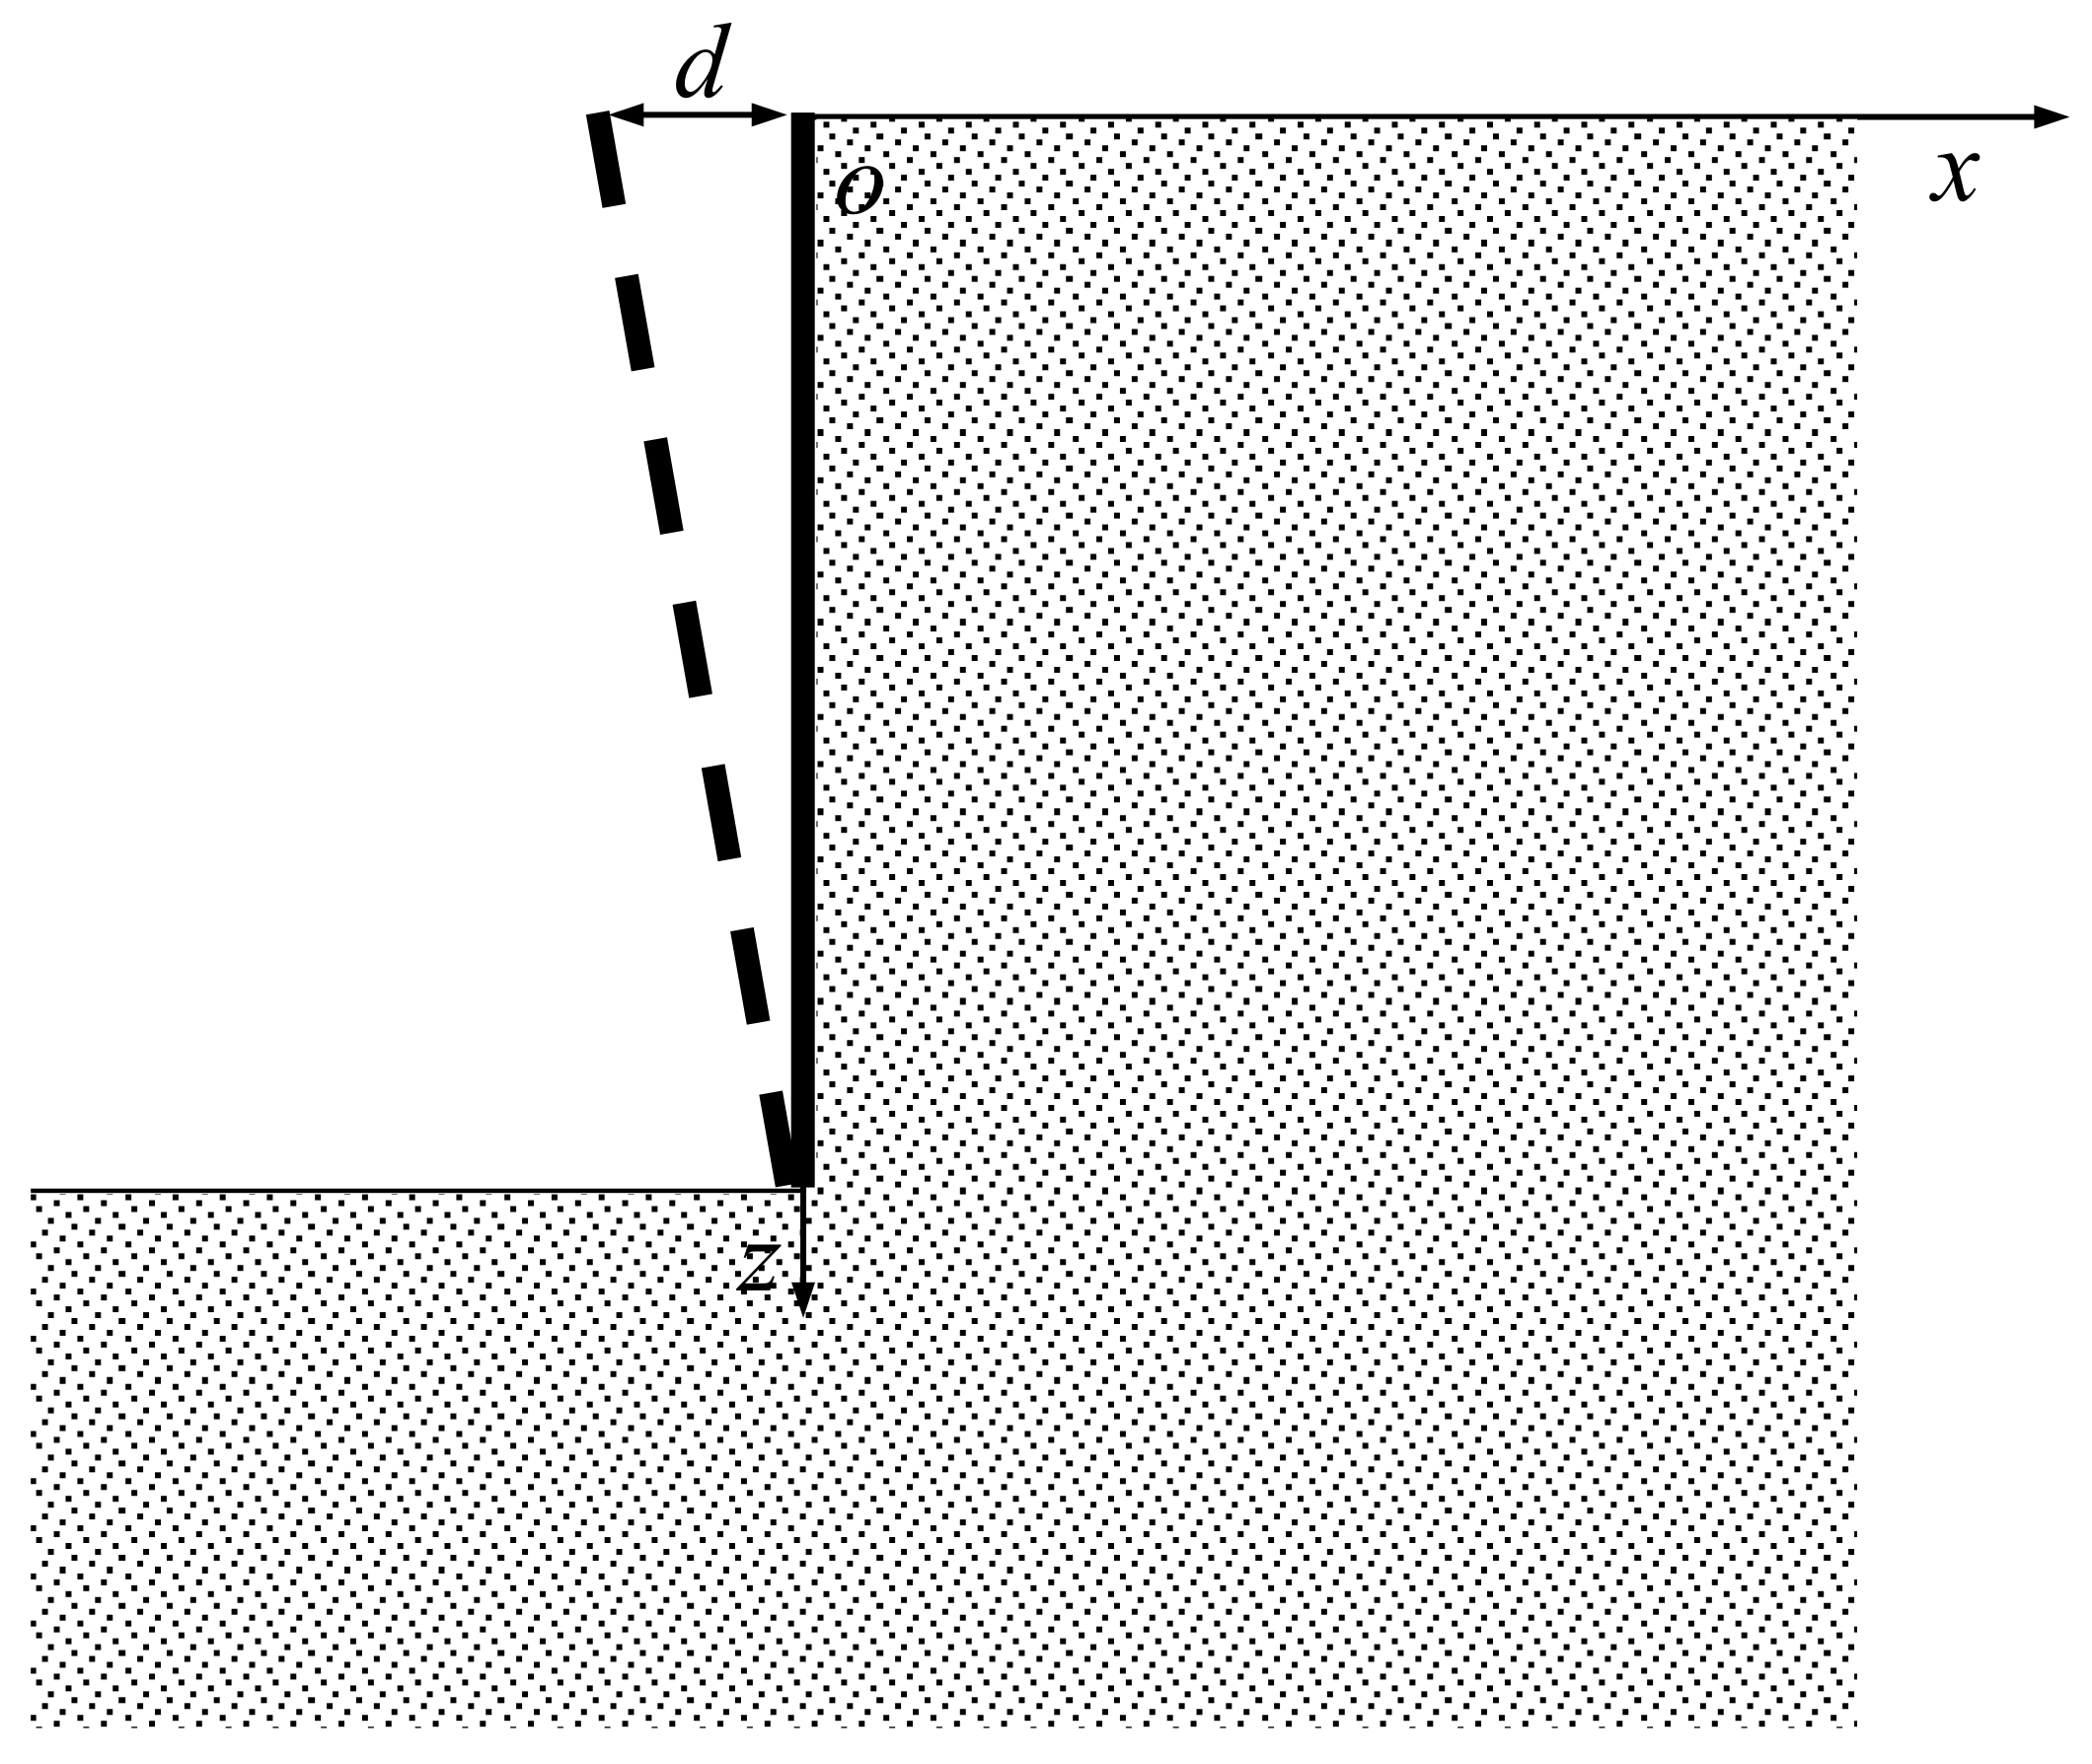
3.2. The Rotating Mode of the Wall Movement

When the retaining wall rotates around the corner at the bottom of the pit, as shown in Figure 2, the boundary condition of the model is 0 z H , u 0 , z = z H d d . According to Equation (11), it can be obtained that
u = 0 1 α K 3 cos α z d α = z H d d
Performing a Fourier transform on u 0 , z = z H d d , we obtain
z H d d = 2 d π H 0 cos H α 1 α 2 cos α z d α
Comparing Equation (25) with Equation (26), we can obtain
K 3 = 2 d π H cos H α 1 α
Similar to the derivation of Equations (17) and (18), the boundary conditions at the ground surface of this model are
w z = 0 = 0
σ z z = 0 = d H β π 1 x 2 + H 2 1 4 d π H β x 4 x 2 + H 2 2
In other words, the ground settlement caused by wall rotation is equivalent to the displacement caused by the following load acting on the ground surface:
F x = d H β π 1 x 2 + H 2 + 1 4 d π H β x 4 x 2 + H 2 2
Substituting Equation (30) into Equation (21), we obtain
w = 2 d π 2 + H ξ 2 + H 2 + 1 2 H ln ξ 2 ξ 2 + H 2 ln ξ x ξ x r e f d ξ

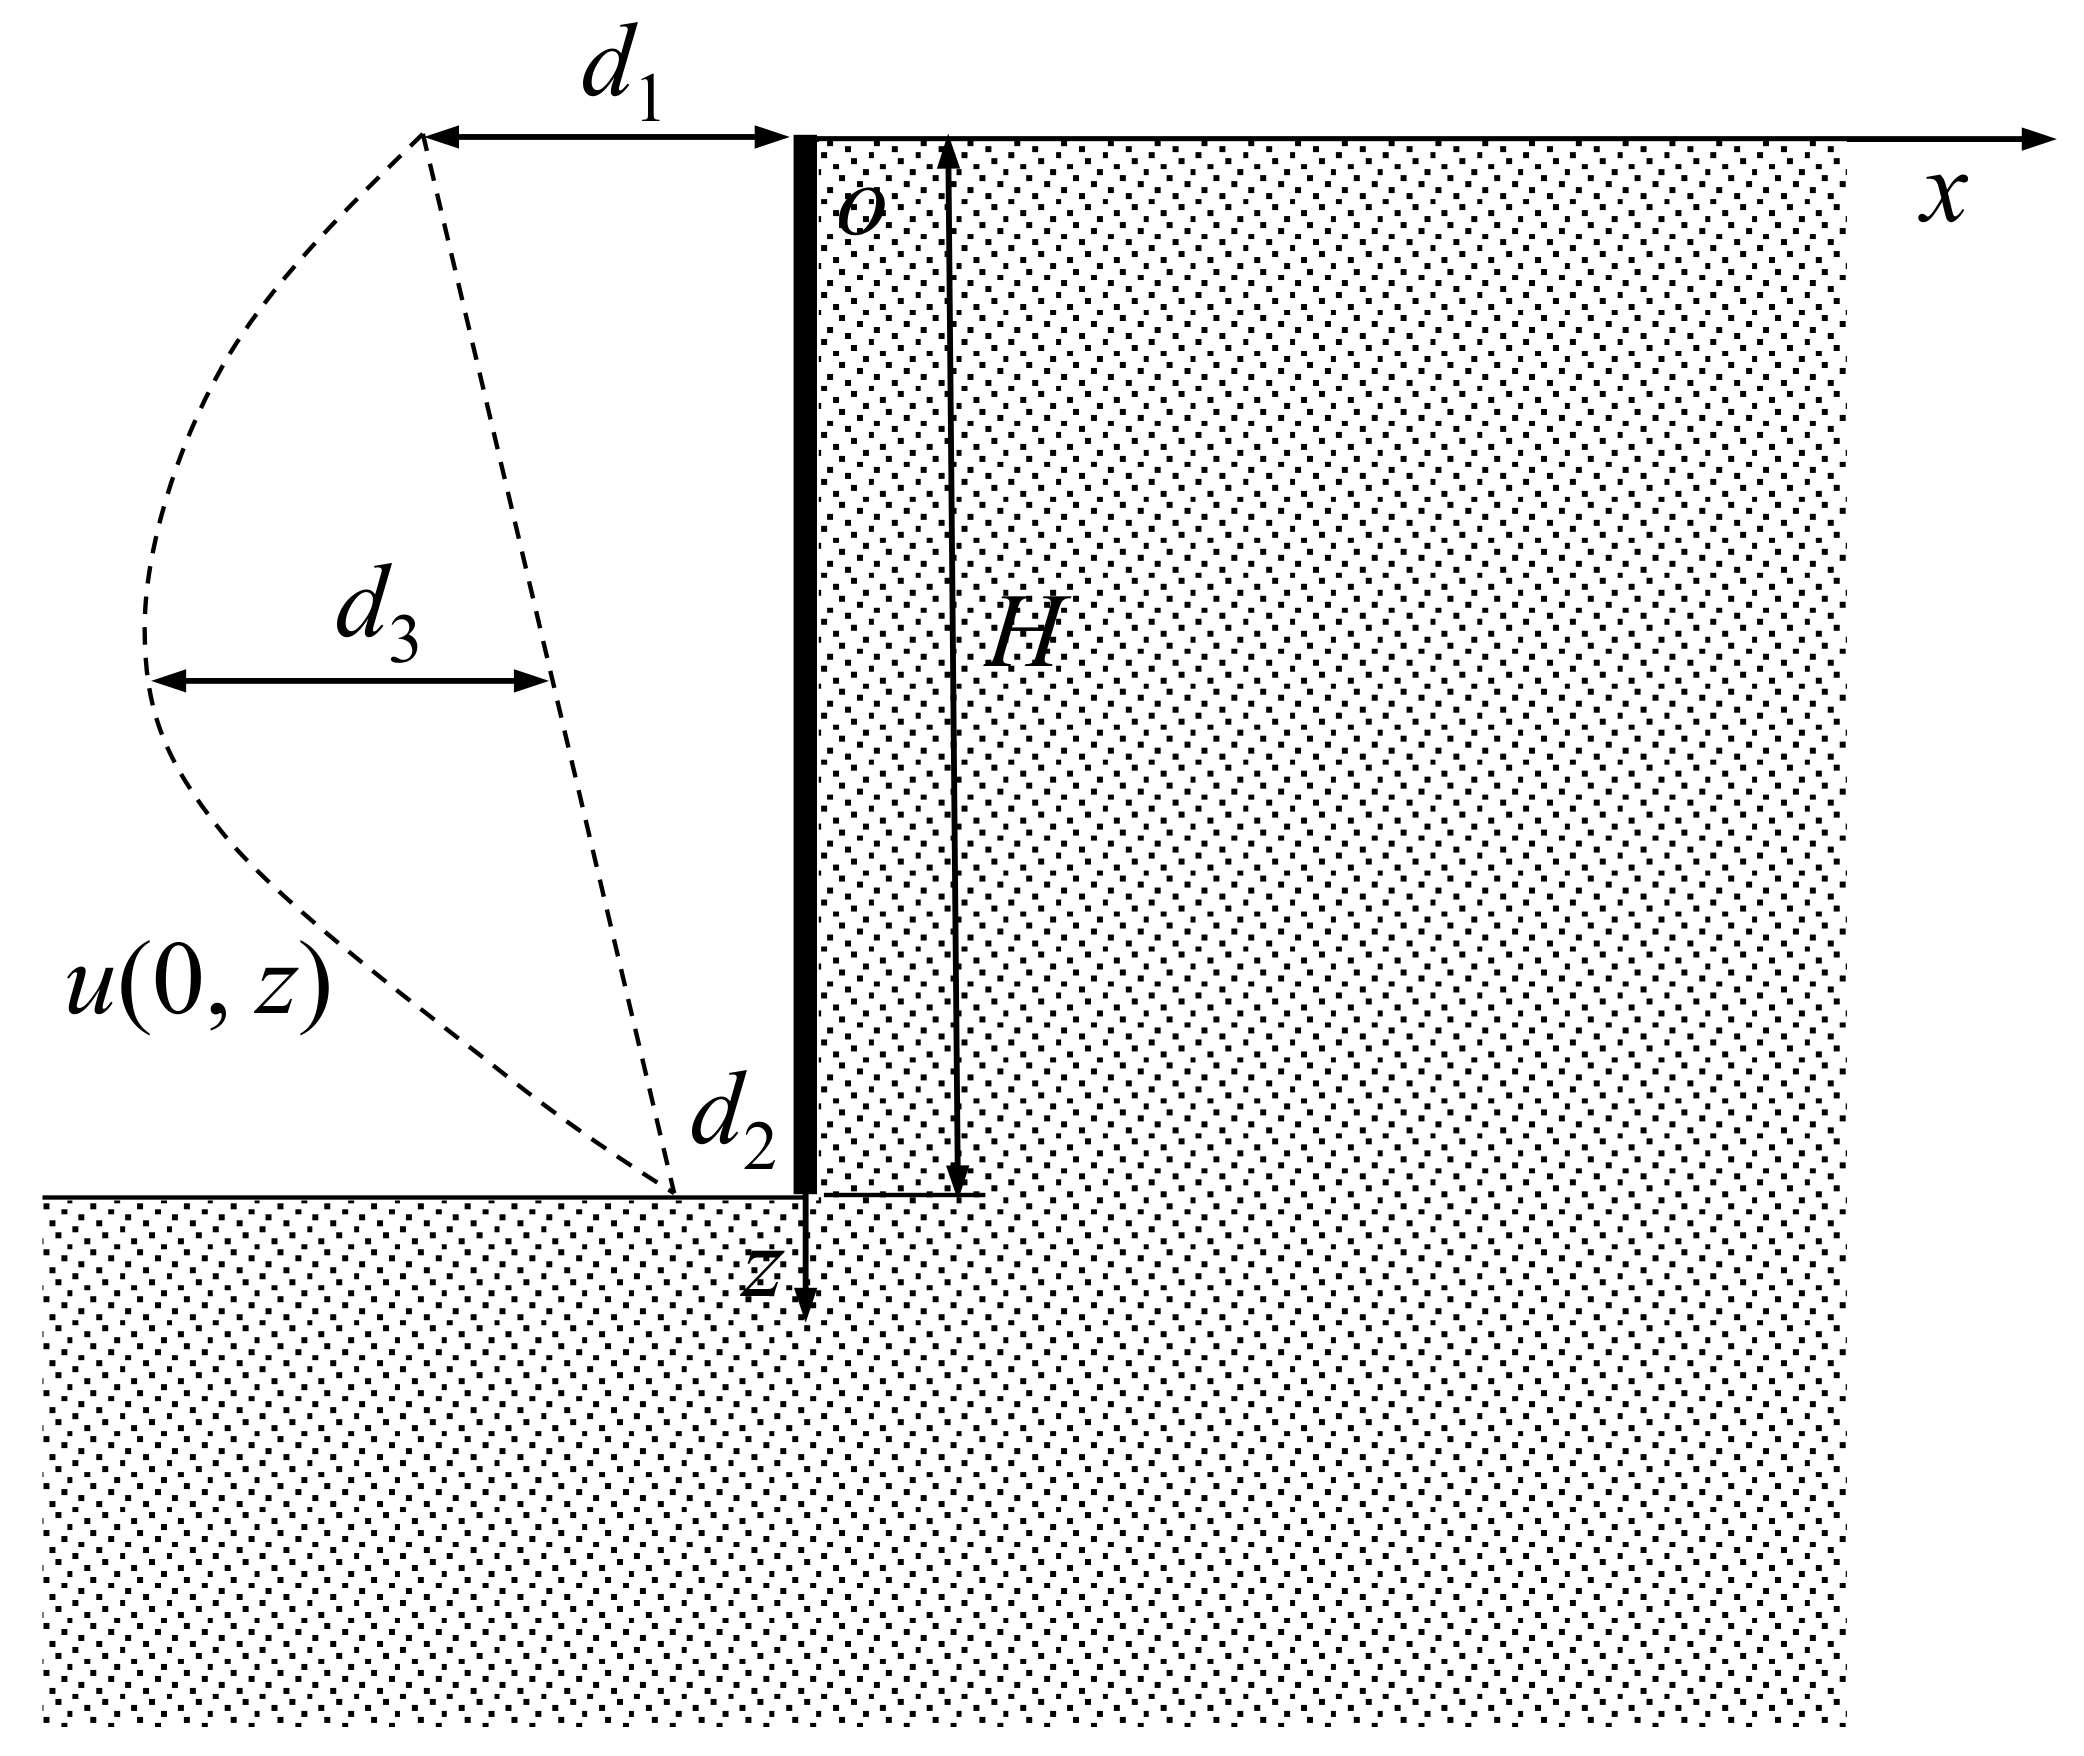
3.3. The Triangle Mode of the Wall Movement

When the retaining wall develops triangle-type movement, the boundary conditions of the model are shown in Figure 3. Assuming that the inward movement of the retaining wall at a depth of H / 2 is −d, the movement can be regarded as the difference between two rotation-type movements, as described in Figure 3, which can be represented by
w = w 1 w 2
where w1 and w2 are the movements of the retaining wall with depths of H and H/2, and lateral movements of −2d at the ground surface, when they develop rotation-type movements. The solution of the ground settlement behind the retaining wall caused by the wall’s triangle-type displacement is
w = 4 d π 2 H + 1 2 ln ξ 2 + H 2 4 2 ξ 2 ξ 2 + H 2 2 H 2 4 ξ 2 + H 2 + H 2 ξ 2 + H 2 ln ξ x ξ x r e f d ξ

3.4. The Parabolic Mode of the Wall Movement

The retaining wall may also develop parabolic-pattern movement, as shown in Figure 4. In such a scenario, the model’s boundary condition is 0 z H , u 0 , z = 4 d H 2 z z H . According to Equation (11), we have
u = 0 1 α K 3 cos α z d α = 4 d H 2 z z H
Performing a Fourier transform on u 0 , z = 4 d H 2 z z H , we obtain
4 d H 2 z z H = 1 π 0 8 d 1 + cos α H α 2 H 16 d sin α H α 3 H 2 cos α z d α
Comparing Equation (34) with Equation (35), we obtain
K 3 = 8 d π H 2 H 1 + cos α H α 2 sin α H α 2
Similar to the derivation of Equation (17), and Equation (18), the boundary conditions at the ground surface of this model are
w z = 0 = 0
σ z z = 0 = 4 d E β π H 2 H 2 ln x 2 x 2 + H 2 + 3 H + H x 2 x 2 + H 2 4 x arctan H x
In such conditions, the ground settlement caused by wall movement is equivalent to the displacement caused by the following load acting on the ground surface:
F x = 4 d E β π H 2 H 2 ln x 2 x 2 + H 2 + 3 H + H x 2 x 2 + H 2 4 x arctan H x
Using Equations (21) and (39), it can be obtained that when the retaining wall develops parabolic-type movement, the ground settlement behind the wall is
w = 8 d π 2 H 2 + H 2 ln ξ 2 ξ 2 + H 2 + 3 H + H ξ 2 ξ 2 + H 2 4 ξ arctan H ξ ln ξ x ξ x ref d ξ

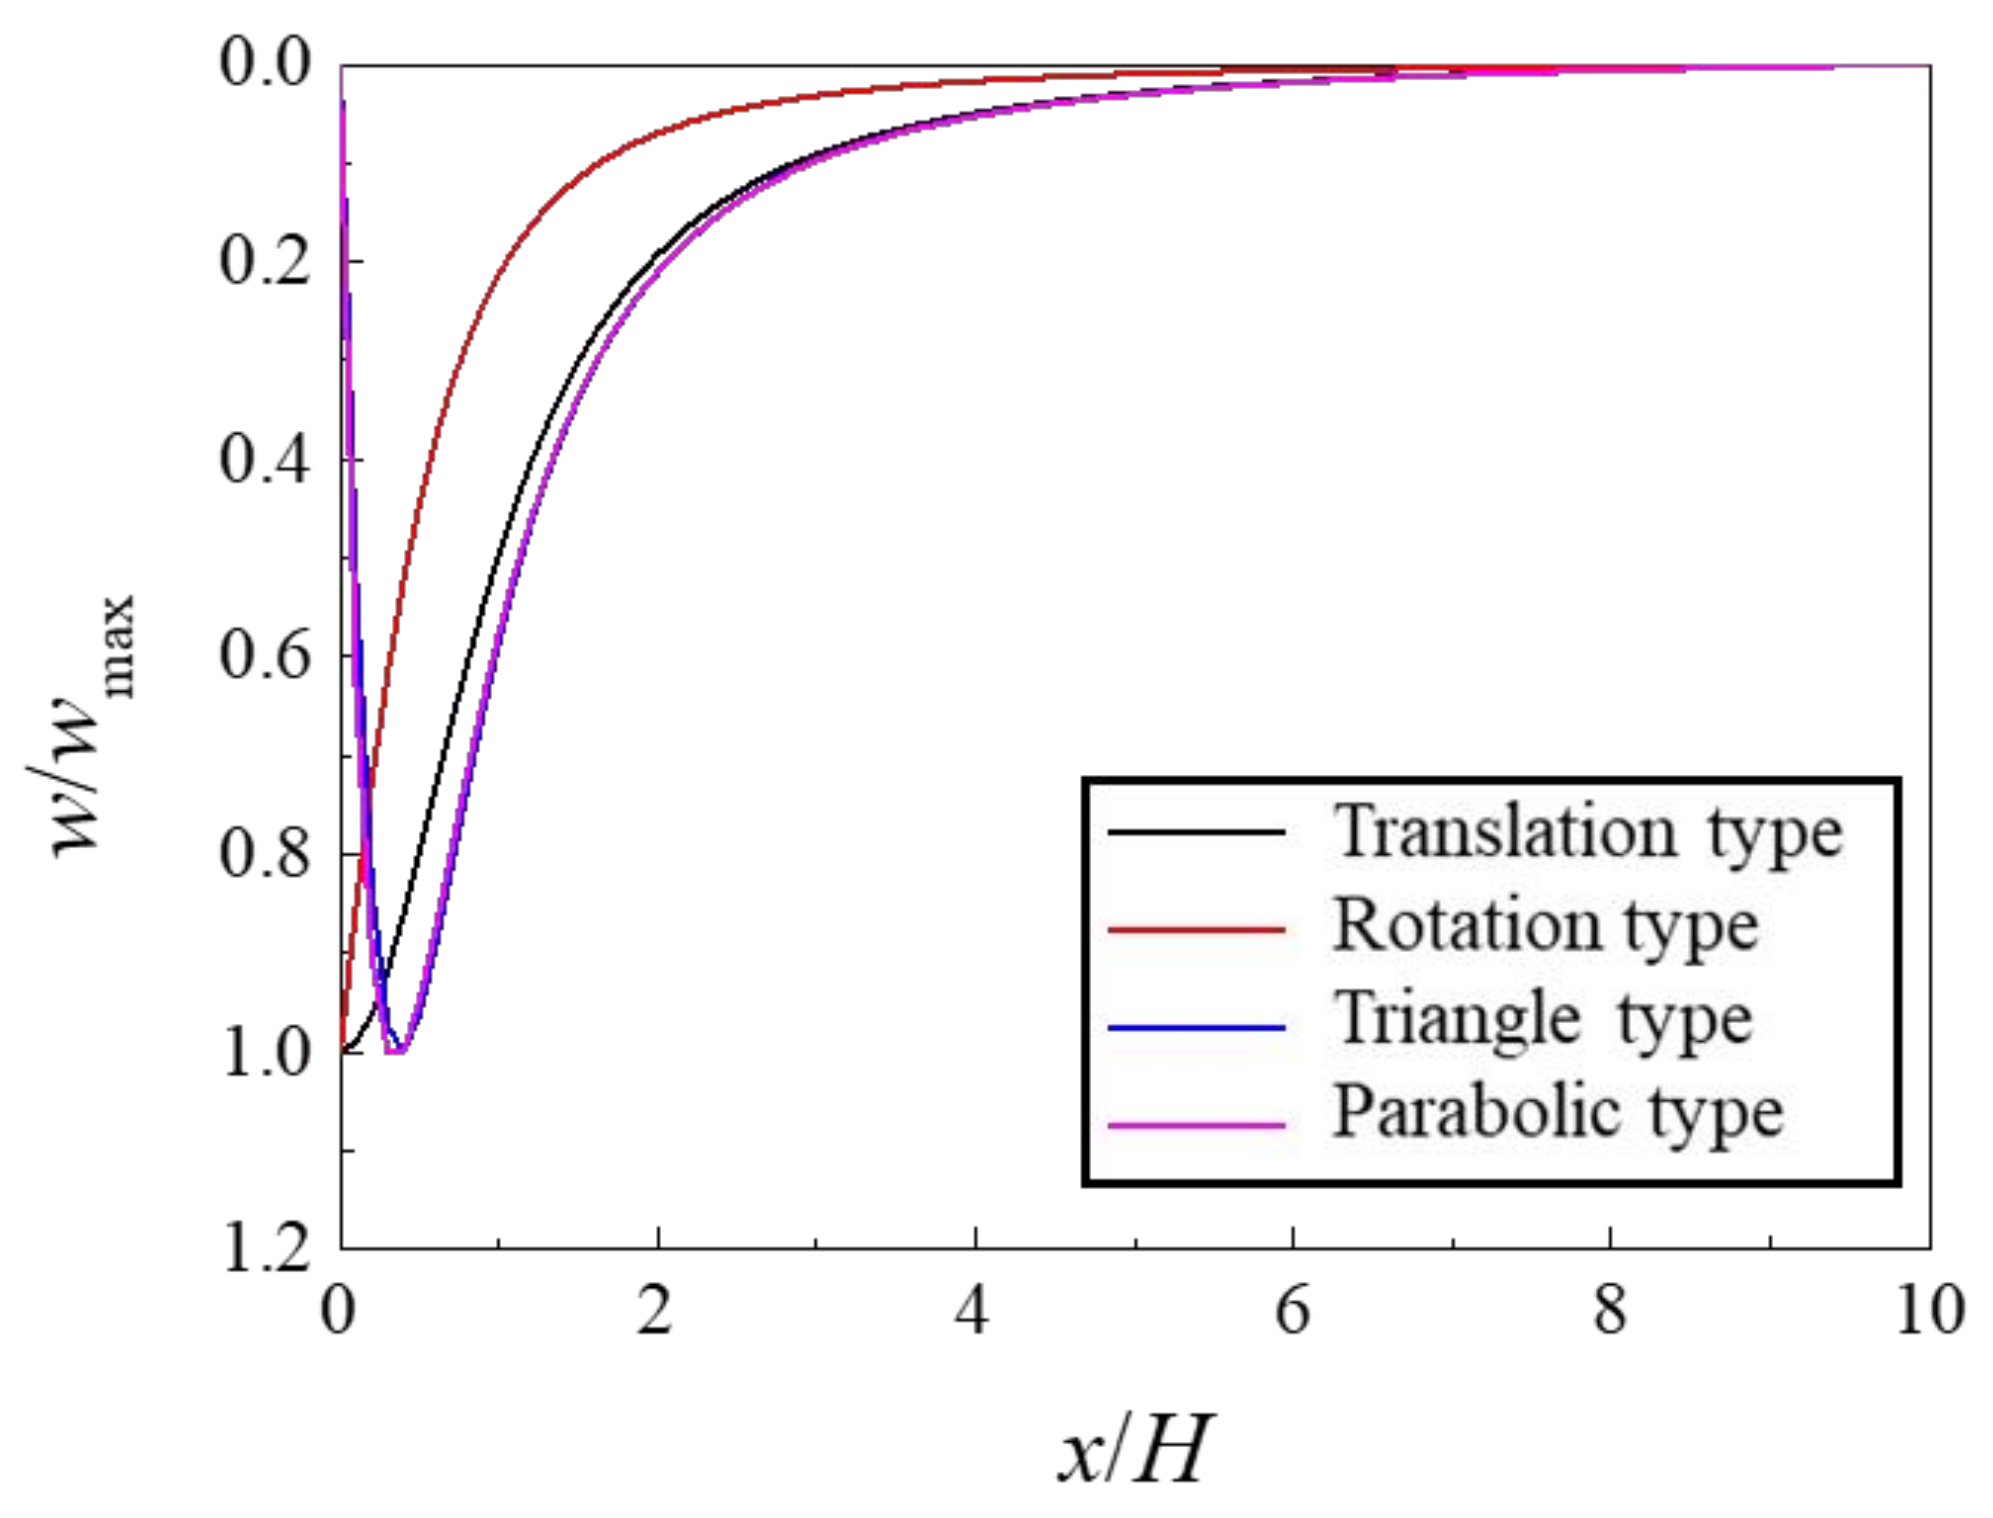
3.5. Distribution Patterns of Ground Surface Settlement under Different Wall Movement Types

In order to analyze the distribution patterns of ground surface settlement under various wall movement types, a hypothetic model with a wall depth of H = 10 m is developed. Taking x r e f = 10 H and d = 0.5 % H , the normalized ground settlements of different wall movement cases are drawn in Figure 5. According to the figure, two settlement patterns (i.e., arc shoulder distribution and trough distribution) are generally observed. The ground surface settlements caused by the translation and rotation types of wall movement are arch shoulder types, characterized by the maximum settlements appearing immediately behind the wall, and the settlements gradually decrease to zero with increasing distance to the retaining wall. In the triangular and parabolic types of wall movement models, the grounds behind the wall develop trough settlements. Typical characteristics of trough settlements are that the maximum settlements occur at a certain distance behind the wall, and the settlements gradually decrease to zero with increasing distance to the wall. According to previous studies [14,18,21,23,47], ground settlements caused by triangle-type wall movements and parabolic-type wall movements are in accordance with realistic responses of the ground to deep excavations.

4. The Excavation-Induced Settlement of the Pipe Gallery behind the Retaining Wall

4.1. Method Description

Existing theoretical predictions of excavation-induced performance have generally been limited to simplified two-dimensional models (i.e., plane-strain, half-sections) that are assumed to generate worst-case scenarios for wall deflections and ground deformations. However, it is readily apparent that the distribution and magnitude of excavation-induced deformations around the perimeter of the site have strong spatial effects. Accordingly, it is also necessary to consider the spatial characteristics of excavation-induced displacements when studying the responses of surrounding pipelines, subway tunnels, pipe galleries, and other facilities to excavation projects.
For rectangular excavations, as shown in Figure 6, ground movements behind the retaining wall can generally expressed as
w ( x , y ) = w max f ( x ) g ( y )
where f(x) is the distribution function of ground settlements along the direction perpendicular to the side of the pit, and g(y) is the distribution function of ground settlements along the direction parallel to the retaining wall.
The analytical formula of wmaxf(x) can be derived from the theoretical solution in previous sections of this paper. In terms of the distribution function of ground settlements along the direction parallel to the retaining wall, g(y), it is affected by various factors and so, unfortunately, has no accurate theoretical solution. Therefore, the calculations in this section adopt empirical expressions obtained from field measurements.
Zhang et al. (2012) [48] summarized the collected data in Shanghai and obtained a distribution function of ground settlements along the direction parallel to the retaining structures as
g ( y ) = e π y A 2 , A = L 2 0.069 ln H e L + 1.03
in which A is the influence radius of the displacement, and L and H are the longitudinal length and the excavation depth of the pit, respectively.
An alternative expression was developed by Finno and Calvello (2005) [49]. Based on experimental studies on excavation projects in Chicago, they proposed that the surface settlement distribution along the direction parallel to the retaining wall can be corrected using a correction function erfc(y):
w ( y ) = w max g ( y ) = w max 1 1 2 erfc 2.8 { y + L [ 0.015 + 0.035 ln ( H e / L ) ] } 0.5 L L [ 0.015 + 0.035 ln ( H e / L ) ]
The correction function erfc(y) in Equation (43) is expressed as
erfc ( y ) = 0 y e u 2 d u
where y is the projection length of the distance between the desired point to the corner of the pit on the y-axis, and y < L/2.
After obtaining the spatial distribution of ground movements using the solution presented in previous sections of this paper, the interaction between the soil and the pipe galleries can be analyzed using the two-stage method. Thereafter, excavation-induced displacements of the pipe galleries can be calculated.
The first step of the two-stage method is to deduce the ground settlement, d, at the position of the pipe gallery, in which the stiffness of the gallery should first be neglected. In this step, the current work involves two formulas to deduce the soil movement (i.e., Equations (42) and (43)). Therefore, both formulas are used, and their results are compared later in this paper.
In the second step, the obtained settlement at the position of the pipe gallery is then treated as an additional displacement exerted on the pipe gallery, while the pipe gallery is modeled as an elastic foundation beam. Then, the mechanical responses of the pipe gallery under the addition displacement can be calculated using the Winkler foundation model, which can be expressed as
E t I t 4 w y 4 + k D w = k D d
where the parameter k can be obtained using the Vesic formula [50]:
k = 0.65 E s D 4 E t I t 12 E s ( 1 ν s 2 ) D
where EtIt is the bending stiffness of the pipe gallery; Es and νs are Young’s modulus and Poisson’s ratio of the soil foundation, respectively; and D is the outer diameter of the gallery.
The boundary condition of Equation (45) is that the excavation-induced additional displacement of the gallery is zero at an infinite distance from the middle of the pit. The differential equation given by Equation (45) can be solved using the difference method to obtain the pipe gallery’s deformation under a given addition displacement of the soil at the corresponding position.

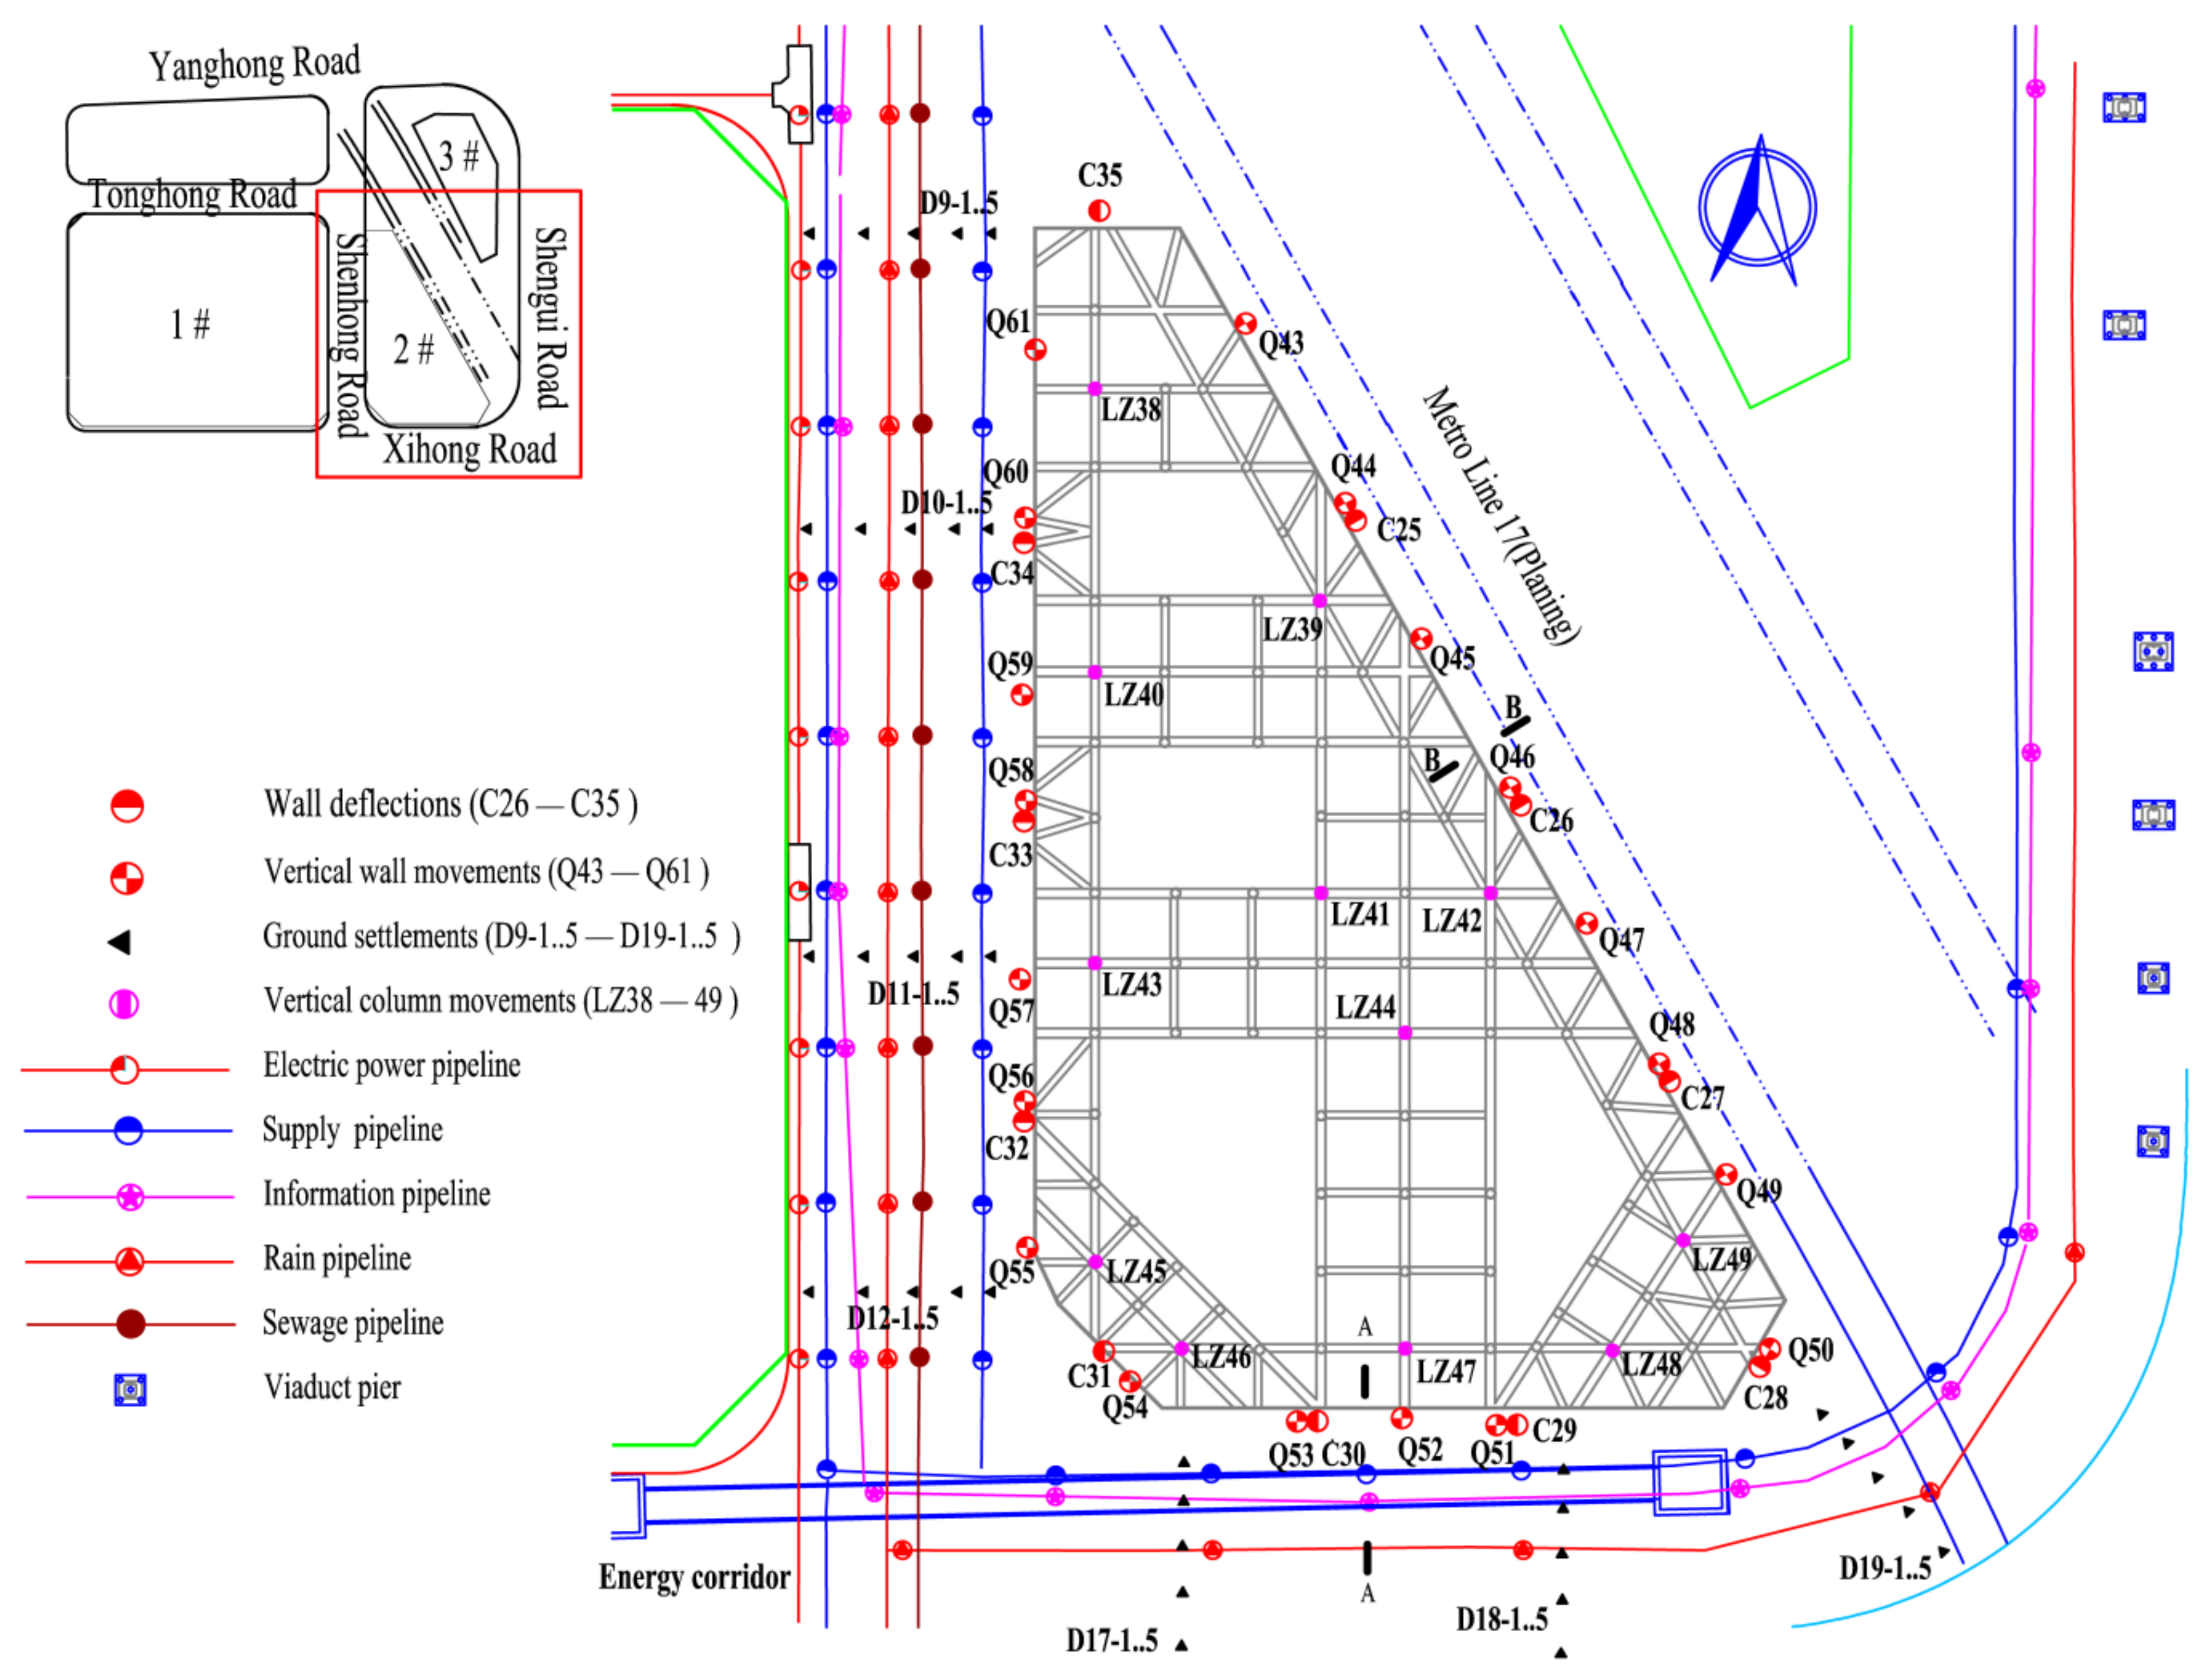
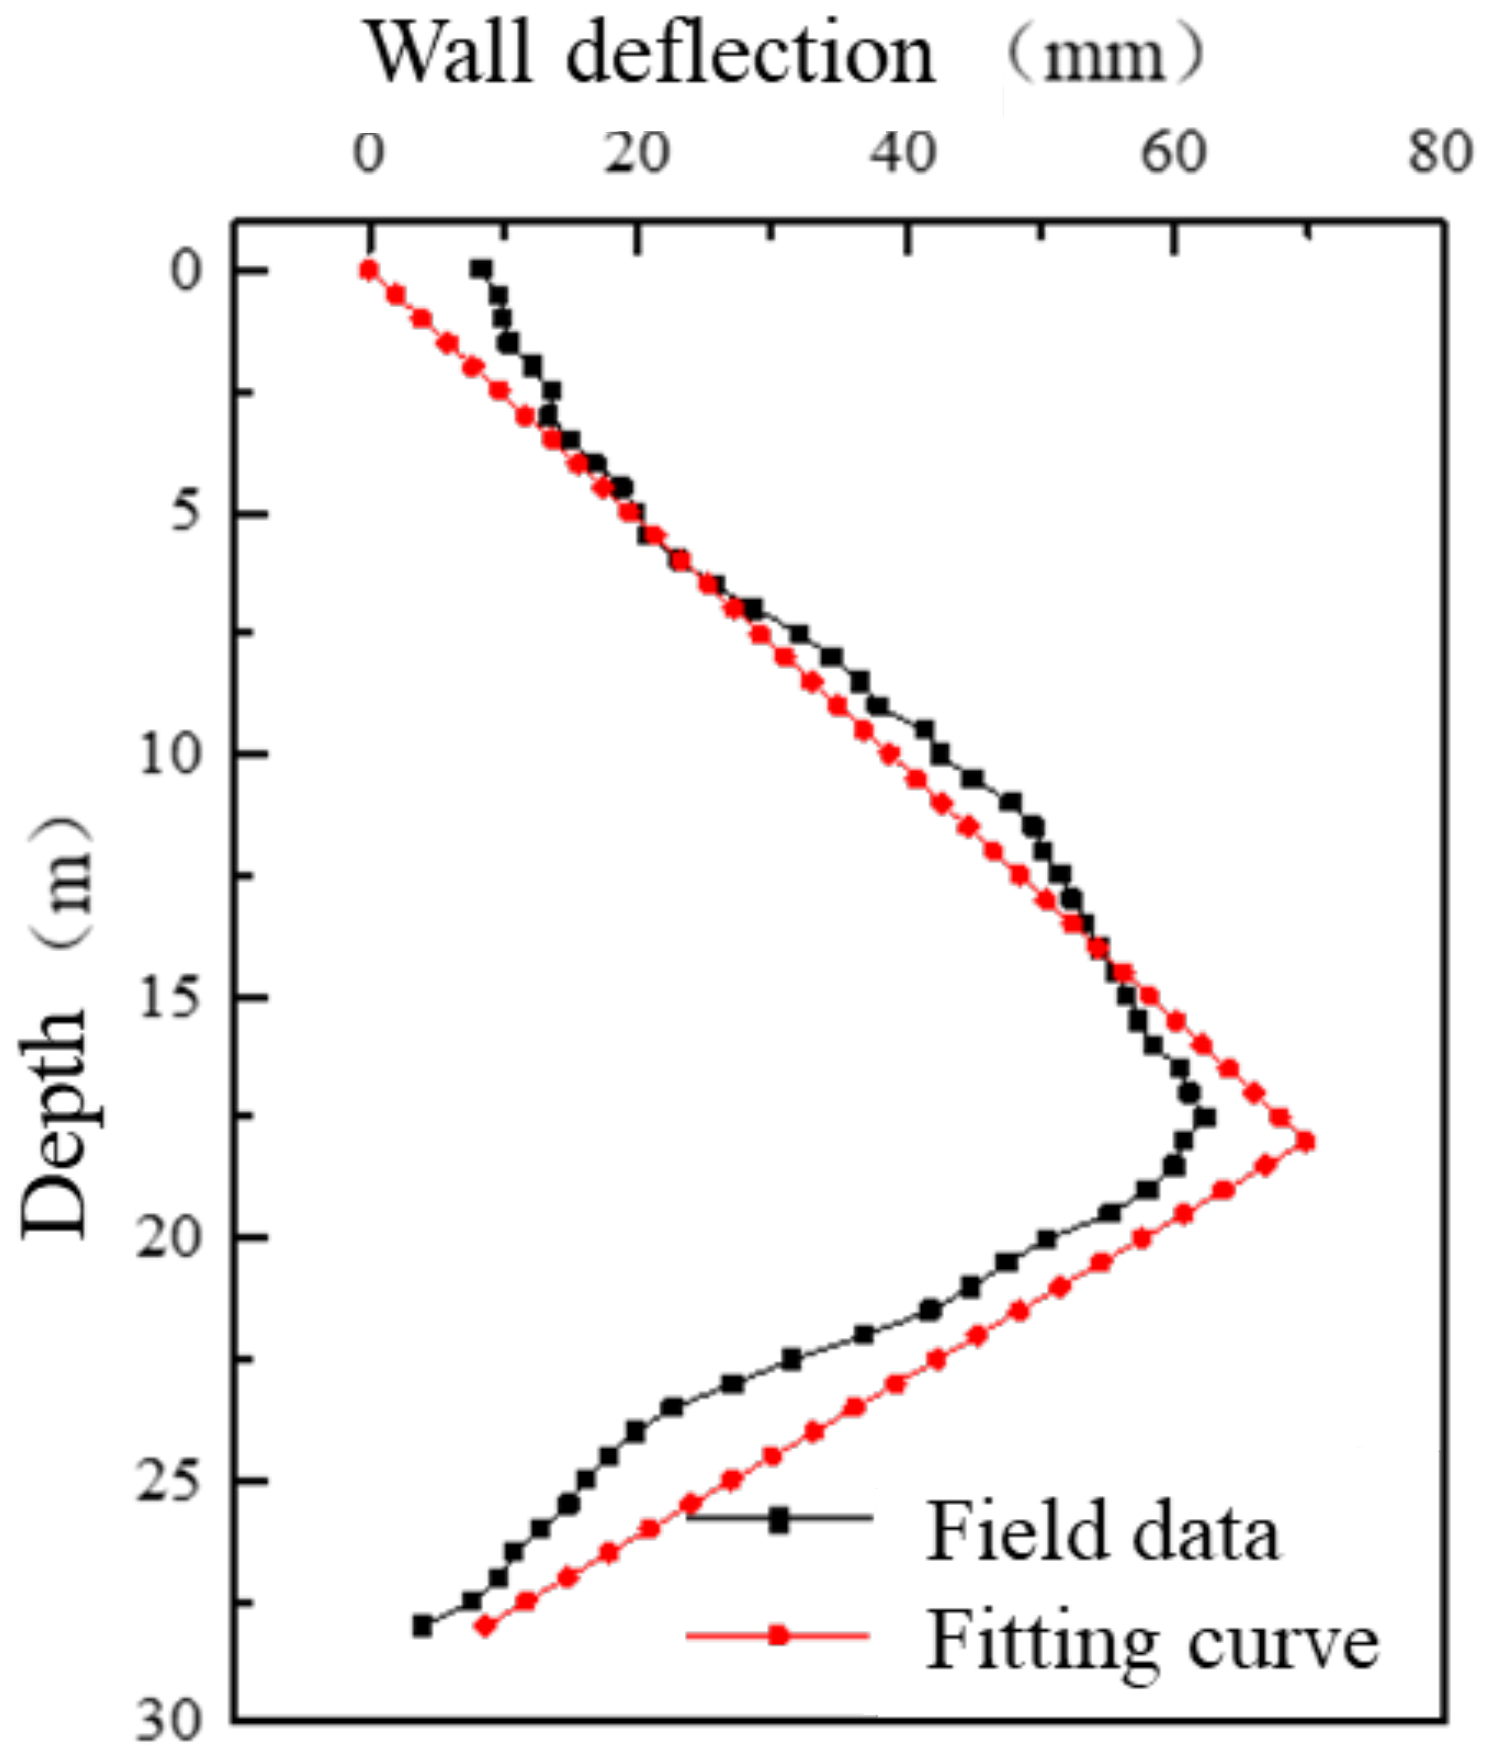
4.2. Verification of the Method by Field Measurements

The Hongqiao CBD project is located in downtown Shanghai. This study focuses on the response of the energy pipe gallery on the south side of the pit to the excavation. The excavation has a depth of 18.4 m and is supported by an 800 mm thick and 36 m deep diaphragm wall. As described in Figure 7, the pipe gallery, buried 8–10 m below the ground surface, is located on the south side of the pit, with a distance of 3.6 m from the retaining wall. During the excavation process of the foundation pit, the settlements of the pipe gallery were extensively monitored. In the calculations, the soil is assumed to be homogeneous and exhibit elastic characteristics with Young’s modulus of Es = 10 MPa. The material of the pipe gallery is C30 concrete with Young’s modulus of Et = 30 GPa. The inertia moment of the pipe gallery can be obtained as It = 17 m4.
Figure 8 presents the monitored deflections of the diaphragm wall in the middle of the pit boundary. Based on the displacement mode proposed in Section 3, the wall deflection can be fitted using a triangular-type displacement. In this perspective, the ground surface behind the retaining wall performs a settlement pattern as shown in Figure 9. Clearly, the ground surface presents a spoon-shape settlement. Specifically, as the distance from the diaphragm wall increases, the settlement first increases rapidly and then gradually decreases. In addition, soil at an infinite distance from the pit is barely influenced by the excavation.
Using the method proposed in this paper, combined with the two distribution formulas given by Zhang et al. (2012) [48] and Finno and Calvello (2005) [49], the authors deduce the ground settlement at the position of the pipe gallery and denote the results as the Z-result and F-result, respectively.
The two results are presented and compared in Figure 10. The Z-result suggests that the soil at the pipe gallery develops the most settlement at the middle point of the pit. With increasing distance from the middle, the ground settlement decreases rapidly. According to the F-result, on the other hand, the maximum ground settlement is maintained within a certain range near the middle of the pit, in which the size of the range is determined by Equation (42). Obviously, the F-result is more in accordance with realistic engineering performance.
Figure 11 compares the calculated pipe gallery deformations (i.e., Z-result and F-result) with the field data to verify the ability of the method proposed in this paper in predicting the responses of pipe galleries to excavations. The figure shows that the deformation patterns of the pipe gallery obtained using the two methods are basically consistent, with the maximum deformation occurring in the middle and then decreasing gradually towards the corners of the pit. On the other hand, the F-result undergoes a larger deformation than the Z-result because the maximum ground settlement of the F-result is maintained within a certain range near the middle of the pit. The comparison shows that the F-result is more reliable. This indicates that the solution proposed in this article combined with Finno’s (Finno and Calvello 2005) [49] empirical formula, i.e., Equation (43), can provide ideal predictions for excavation-induced deformations of pipe galleries.

5. Parametric Studies on Excavation-Induced Pipe Gallery Settlements

The analyses in Section 4 proved the capability of the proposed method to reproduce the displacement of pipe galleries adjacent to deep excavations. Based on this verified solution, two additional parametric studies are carried out in this section to explore the impacts of two key factors, i.e., the distance of the pipe gallery to the pit and the stiffness of the pipe gallery. Because the combination of the proposed solution of this article and Finno’s (Finno and Calvello 2005) [49] empirical formula is more reliable, it is applied to carry out the parametric studies in this section.

5.1. Distance to The Pit

When considering the effects of the distance of the pipe gallery to the excavation, four values are compared. These distances are 0.5, 1, 1.5, and 2 times the excavation depth, while other parameters are assumed to be the same as the model in Section 4. Figure 12 and Figure 13 present the ground settlement at the position of the pipe gallery and the deformation of the pipe gallery, respectively.
Figure 12 shows that the results of 0.5H and 1.0H are very close to each other, which is because, for the current case, the ground settlement reaches its maximum within a range of 0.5–1.0 times the excavation depth. At the same time, according to Figure 12, the result of 1.5H is much smaller than those of 0.5H and 1.0H (i.e., the settlement of the 1.5H scenario is 15.4 mm, decreasing by 15.8% compared with the 1.0H scenario), and the result of 2.0H is smallest among the calculated scenarios (i.e., the settlement of the 2.0H scenario is 10.2 mm, decreasing by 33.8% compared with the 1.0H scenario and 44.3% compared with the 2.0H scenario). The result indicates that the ground settlement gradually decreases with increasing distance to the wall after its maximum, which is in accordance with the summarized spoon-shape settlement pattern of the ground settlement behind retaining structures in engineering practice. In fact, the excavation-induced ground settlement will finally reach a negligible value when the distance to the diaphragm is sufficiently large.
The calculated pipe gallery deformations of different scenarios are presented and analyzed in Figure 13. In accordance with the distribution of the ground settlement, the deformation of the pipe gallery also shows an increasing-then-decreasing trend with increasing distance from the pit. The maximum pipe gallery deformation of the 1.5H scenario is 15.9 mm, decreasing by 15.8% from the 1.0H scenario (i.e., 18.9 mm), and the maximum gallery deformation of the 2.0H scenario is 10.5 mm, decreasing by 34.0% from the 1.5H scenario and 44.4% from the 1.0H scenario. Therefore, it is recommended to control the designed foundation pit to twice its excavation depth away from nearby pipe galleries. Otherwise, reinforcement measures should be taken for the surrounding soil.

5.2. The Stiffness of the Pipe Gallery

Keeping other parameters the same as the case in Section 4.2, the authors further calculate the pipe galley deformations under changing gallery stiffness. Four cases with different gallery stiffness are analyzed, in which Young’s moduli of the gallery are 750, 1500, 3000, and 6000 times the soil modulus, denoted as Et/Es = 750, Et/Es = 1500, Et/Es = 3000, and Et/Es = 6000, respectively. The pipe gallery deformations of the four cases, as well as the calculated ground settlement at the position of the gallery, are presented in Figure 14.
Clearly, the calculated pipe gallery deformations of all four cases share the same deformation pattern. In terms of the influence of the gallery stiffness, it can be seen that the maximum gallery deformation (occurs near the middle of the pit), from a magnitude close to the soil settlement, decreases with increasing gallery stiffness. On the contrary, the gallery near the corners of the pit tends to develop larger displacement when its stiffness increases. It can be seen that properly increasing the stiffness of the pipe gallery can be beneficial for resisting deformation caused by displacements of surrounding soil layers.

6. Conclusions

This work first proposes a new solution to determine the displacement distribution of the ground behind the retaining wall using the control equation of the elastic plane strain problem combined with the method of separation of variables. Then, the deduced 2D solution is extended to 3D problems to obtain the spatial distribution expression of the ground settlement. Afterward, the authors, by simplifying the soil–pipe gallery interaction to the Winkler foundation–Beam model, calculate the excavation-induced pipe gallery displacement using the two-stage method. After being verified by a realistic case in Shanghai, the proposed solution is applied to explore the potential influence of various factors on the excavation-induced displacement of pipe galleries. The following results are drawn:
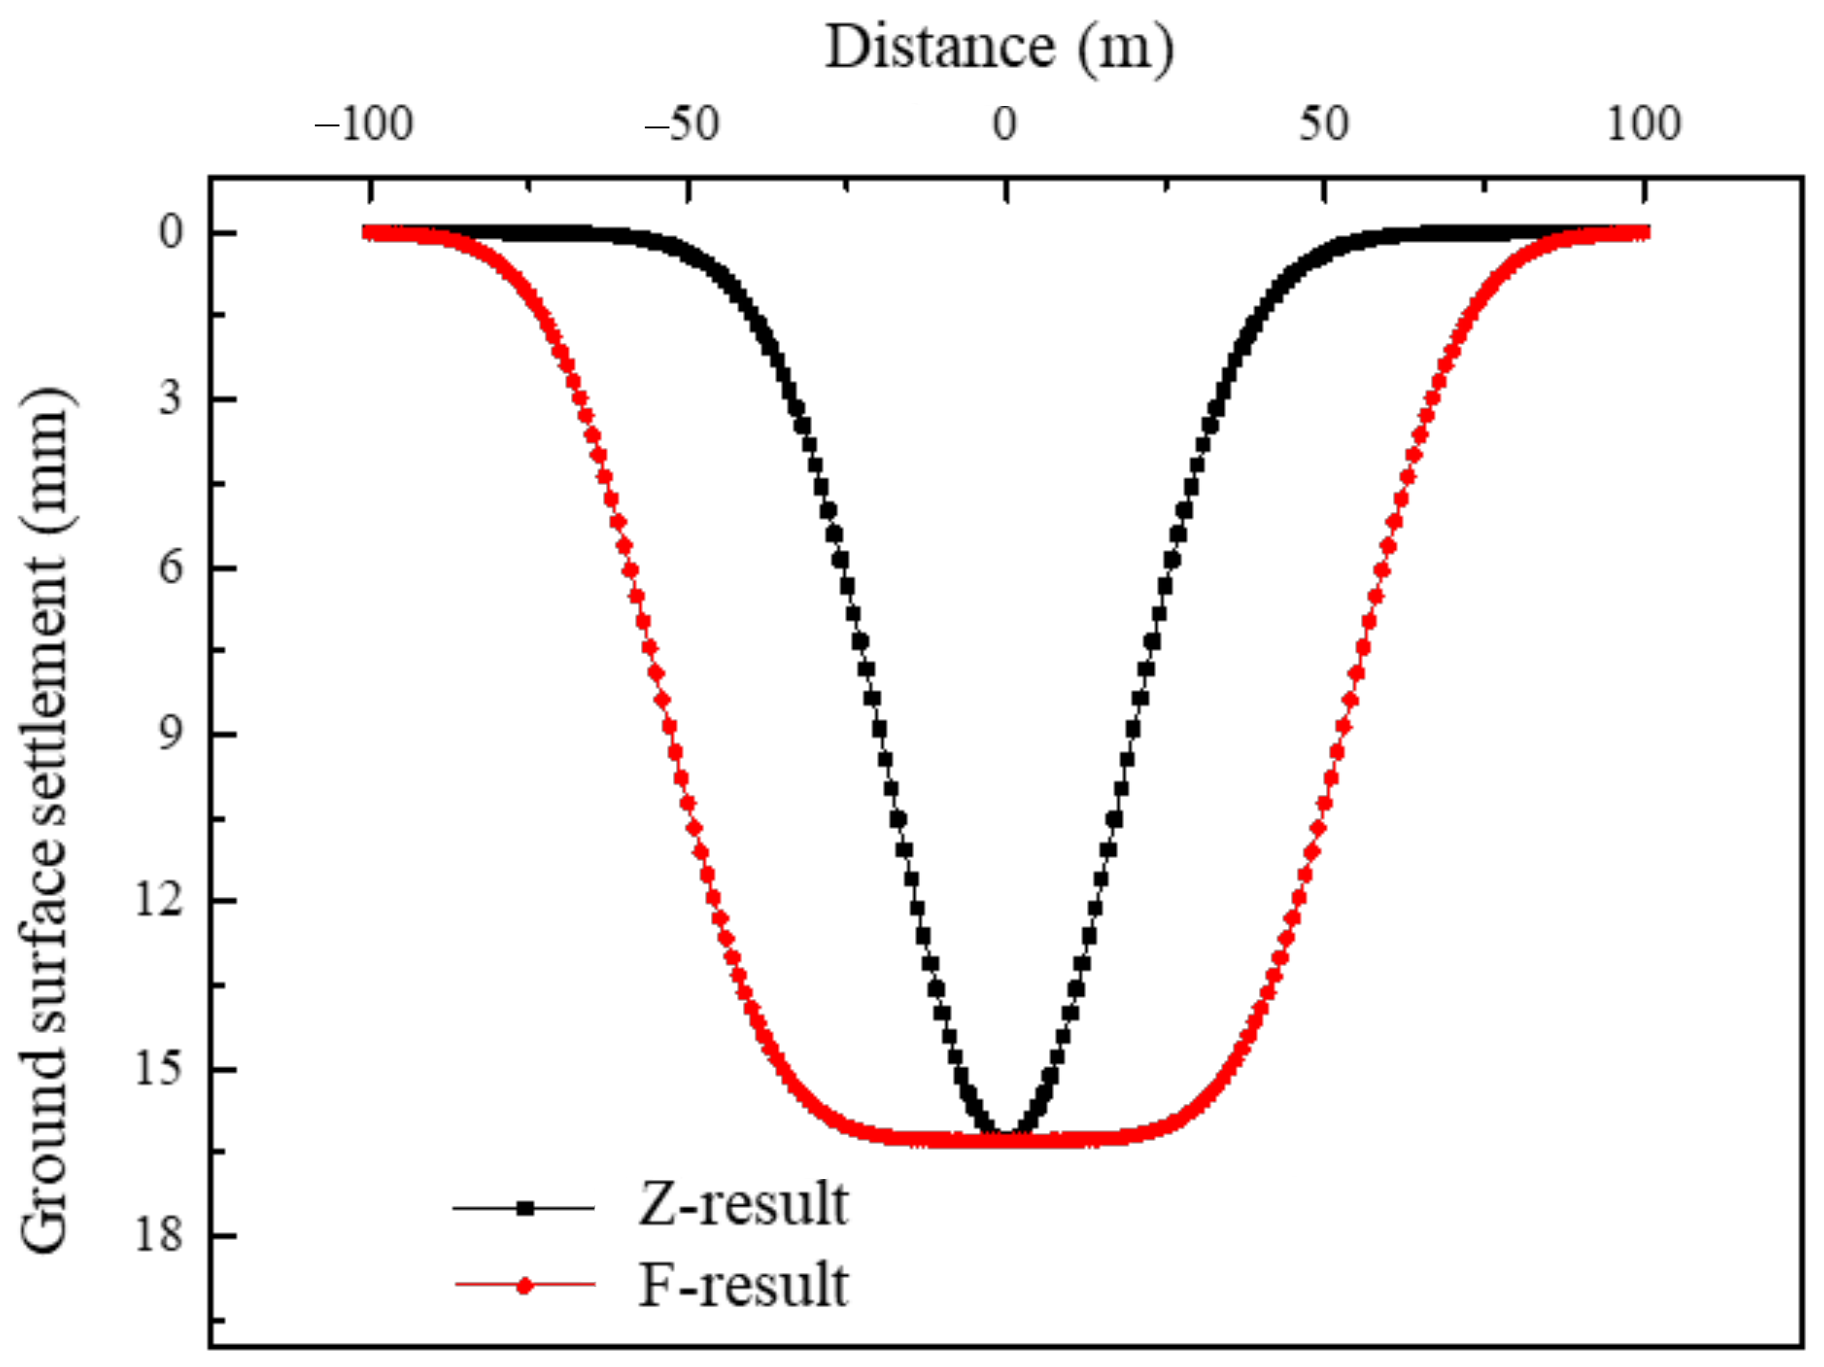
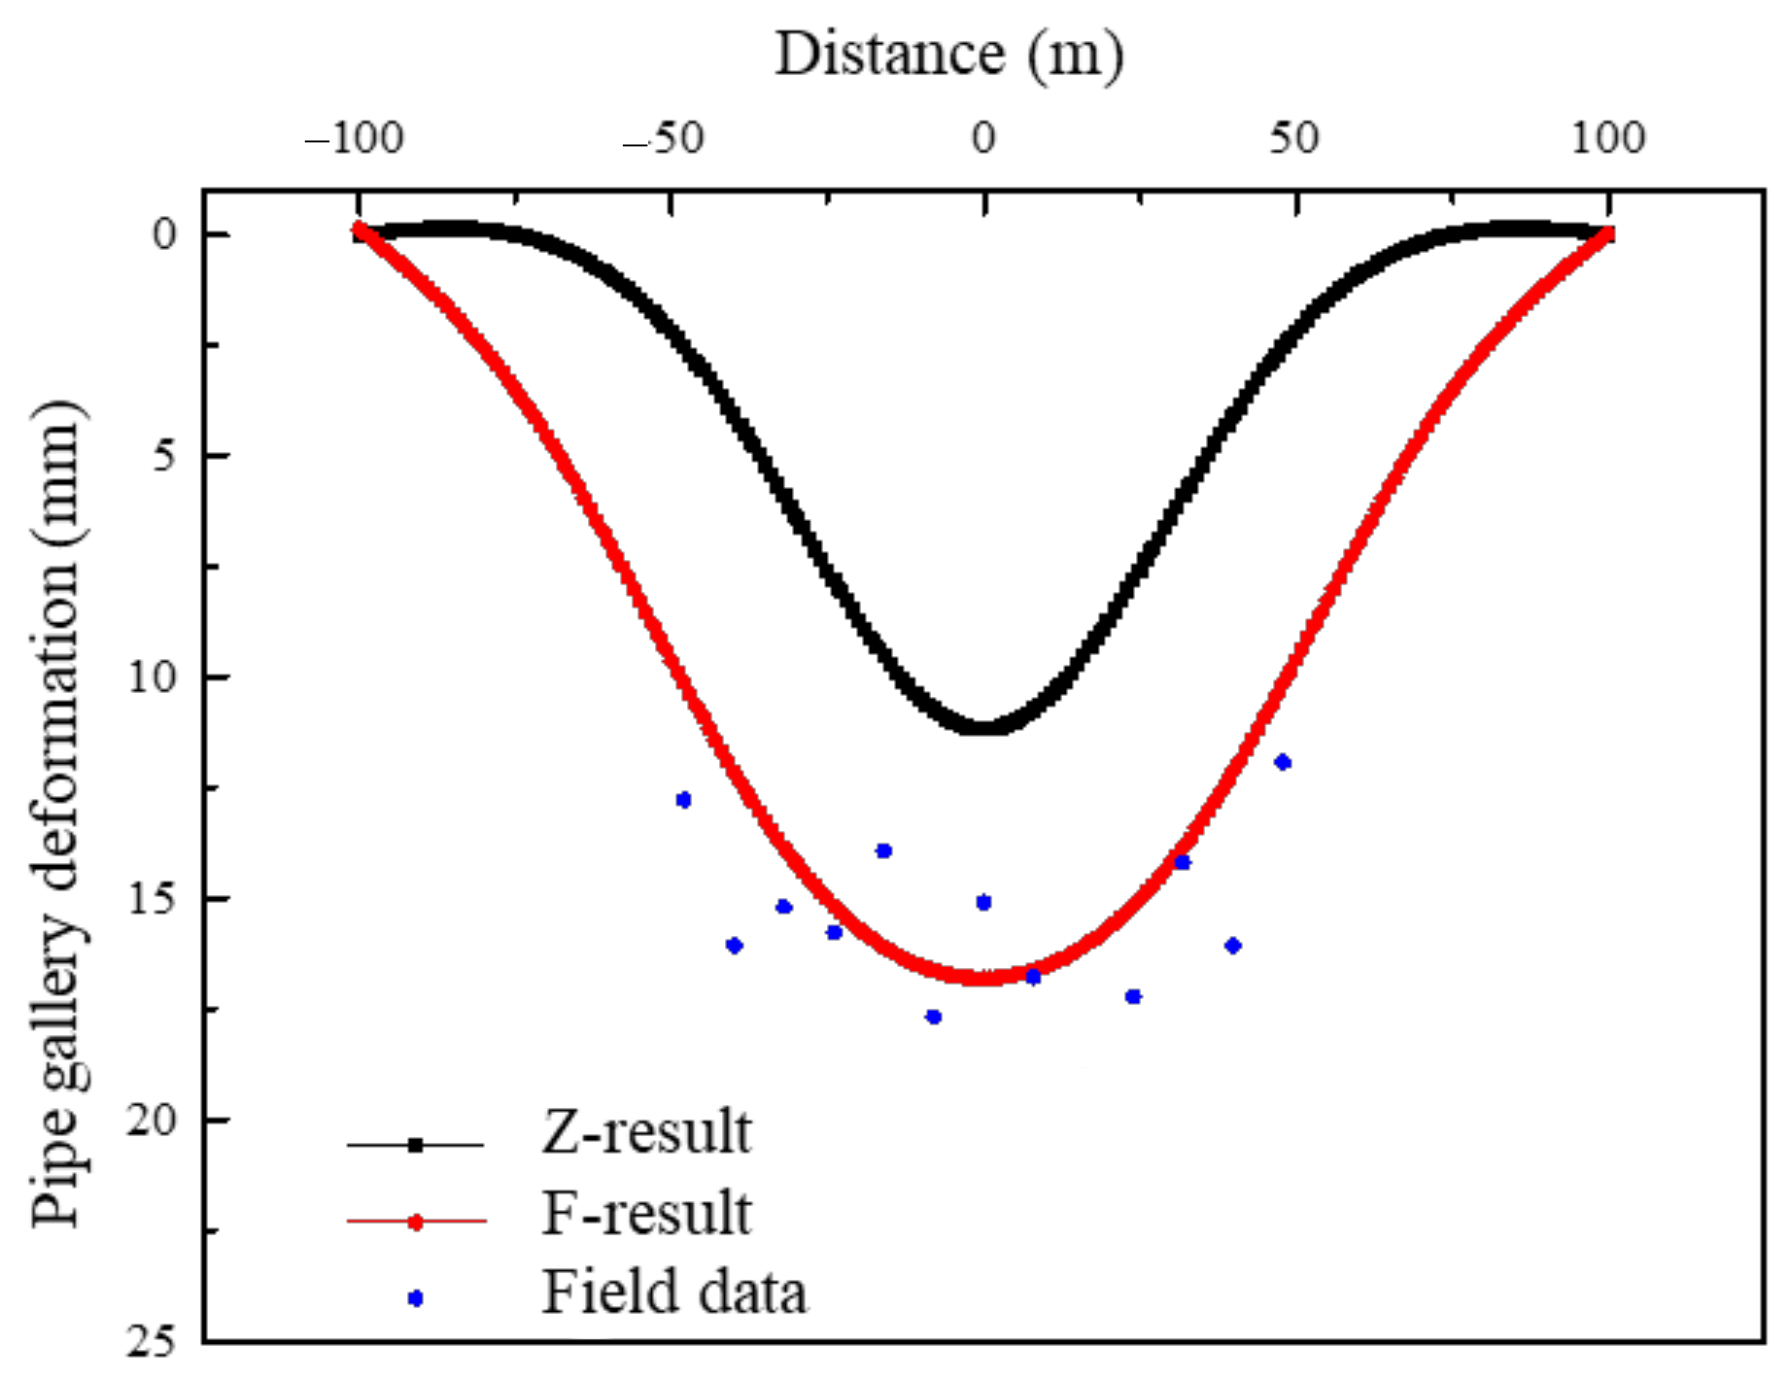
  • During the extension from 2D to 3D of the proposed solution in this work, two experimental formulas of the ground settlement distribution along the longitudinal direction of retaining structures (i.e., Zhang’s formula and Finno’s formula) are used and evaluated. The comparison with field data shows that the proposed solution of this work combined with Finno’s formula provides more desirable results, while Zhang’s formula tends to provide overconservative pipe gallery deformation.
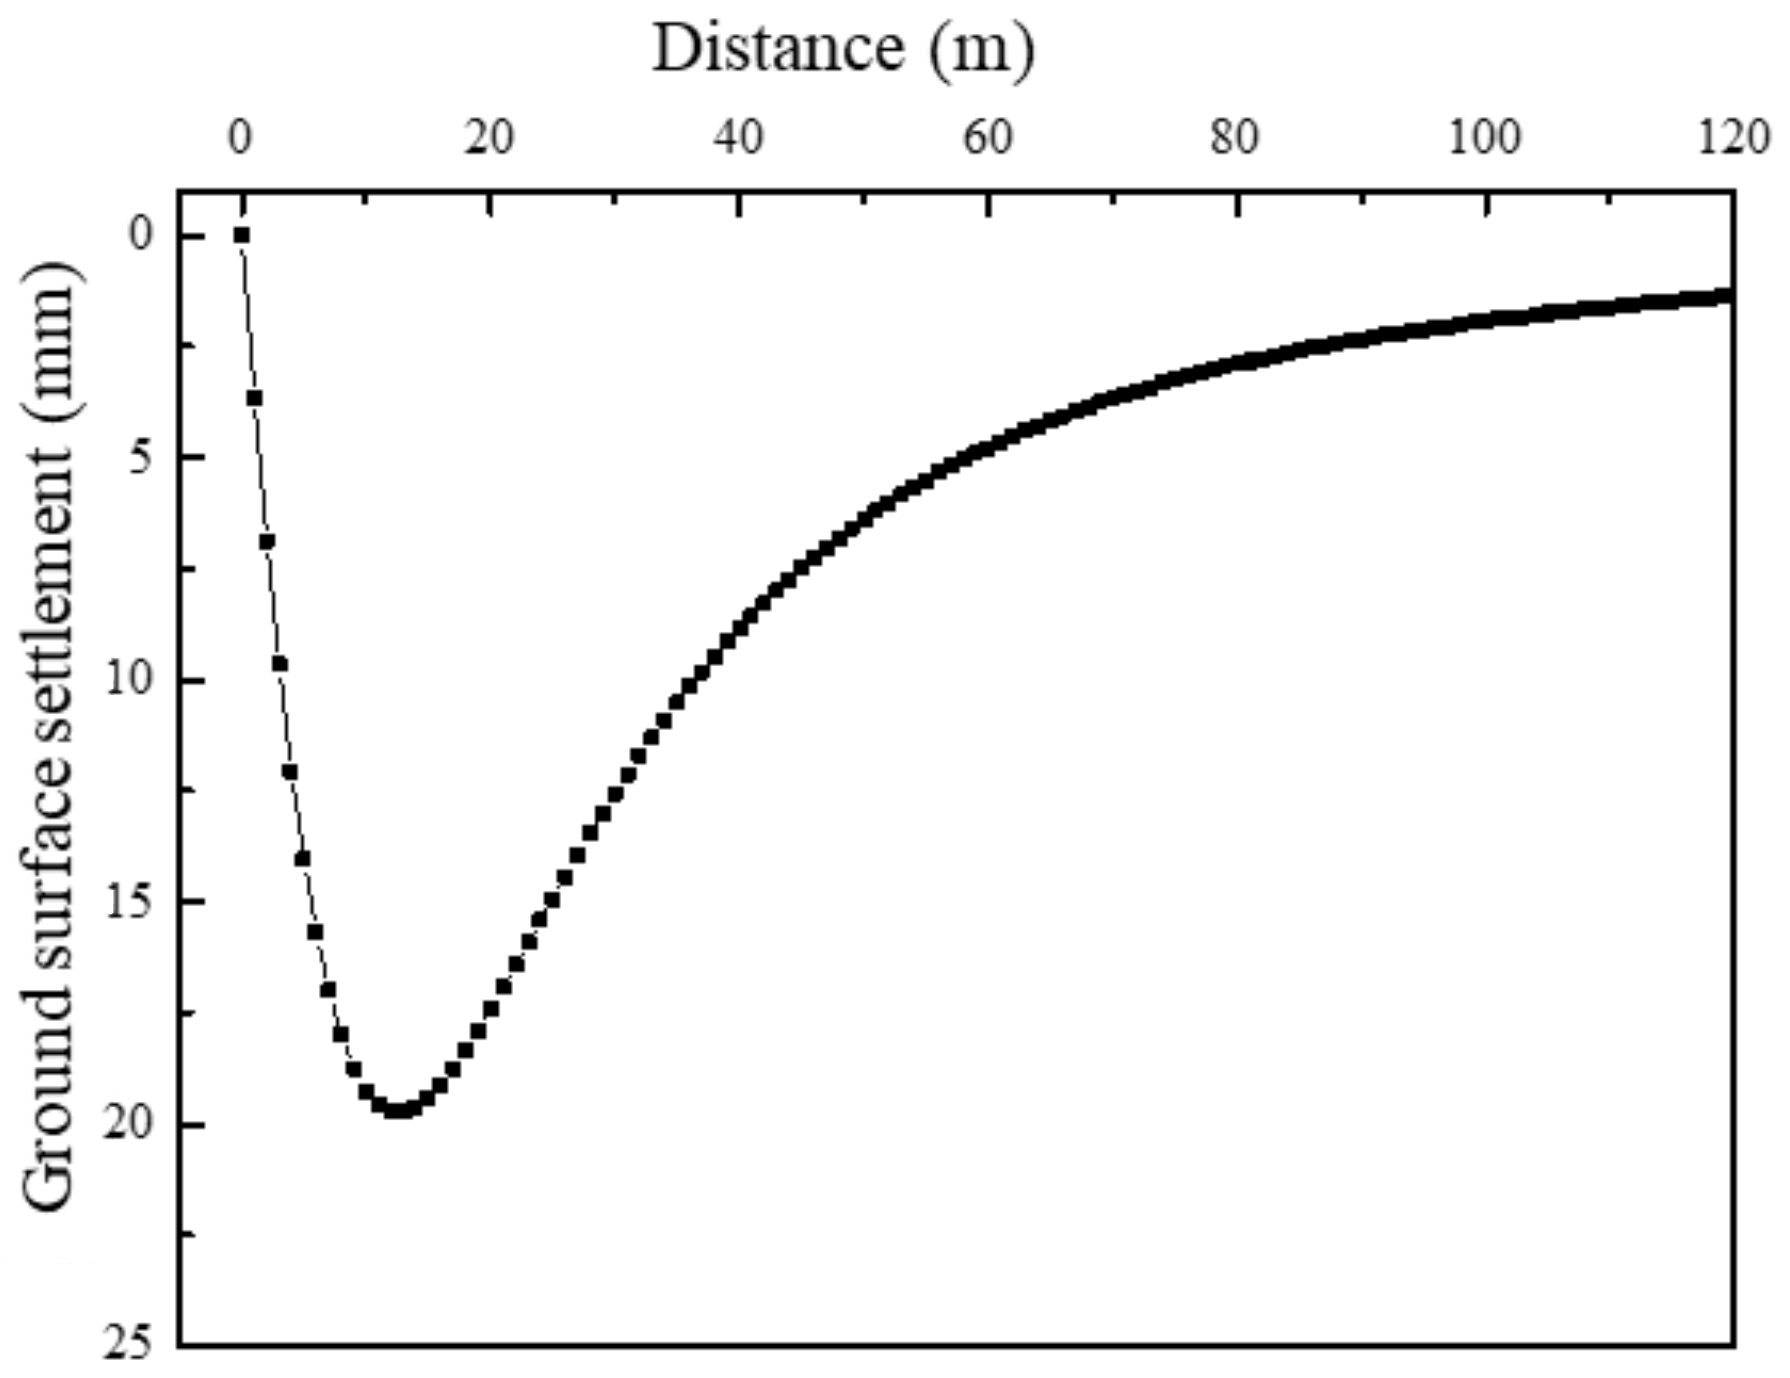
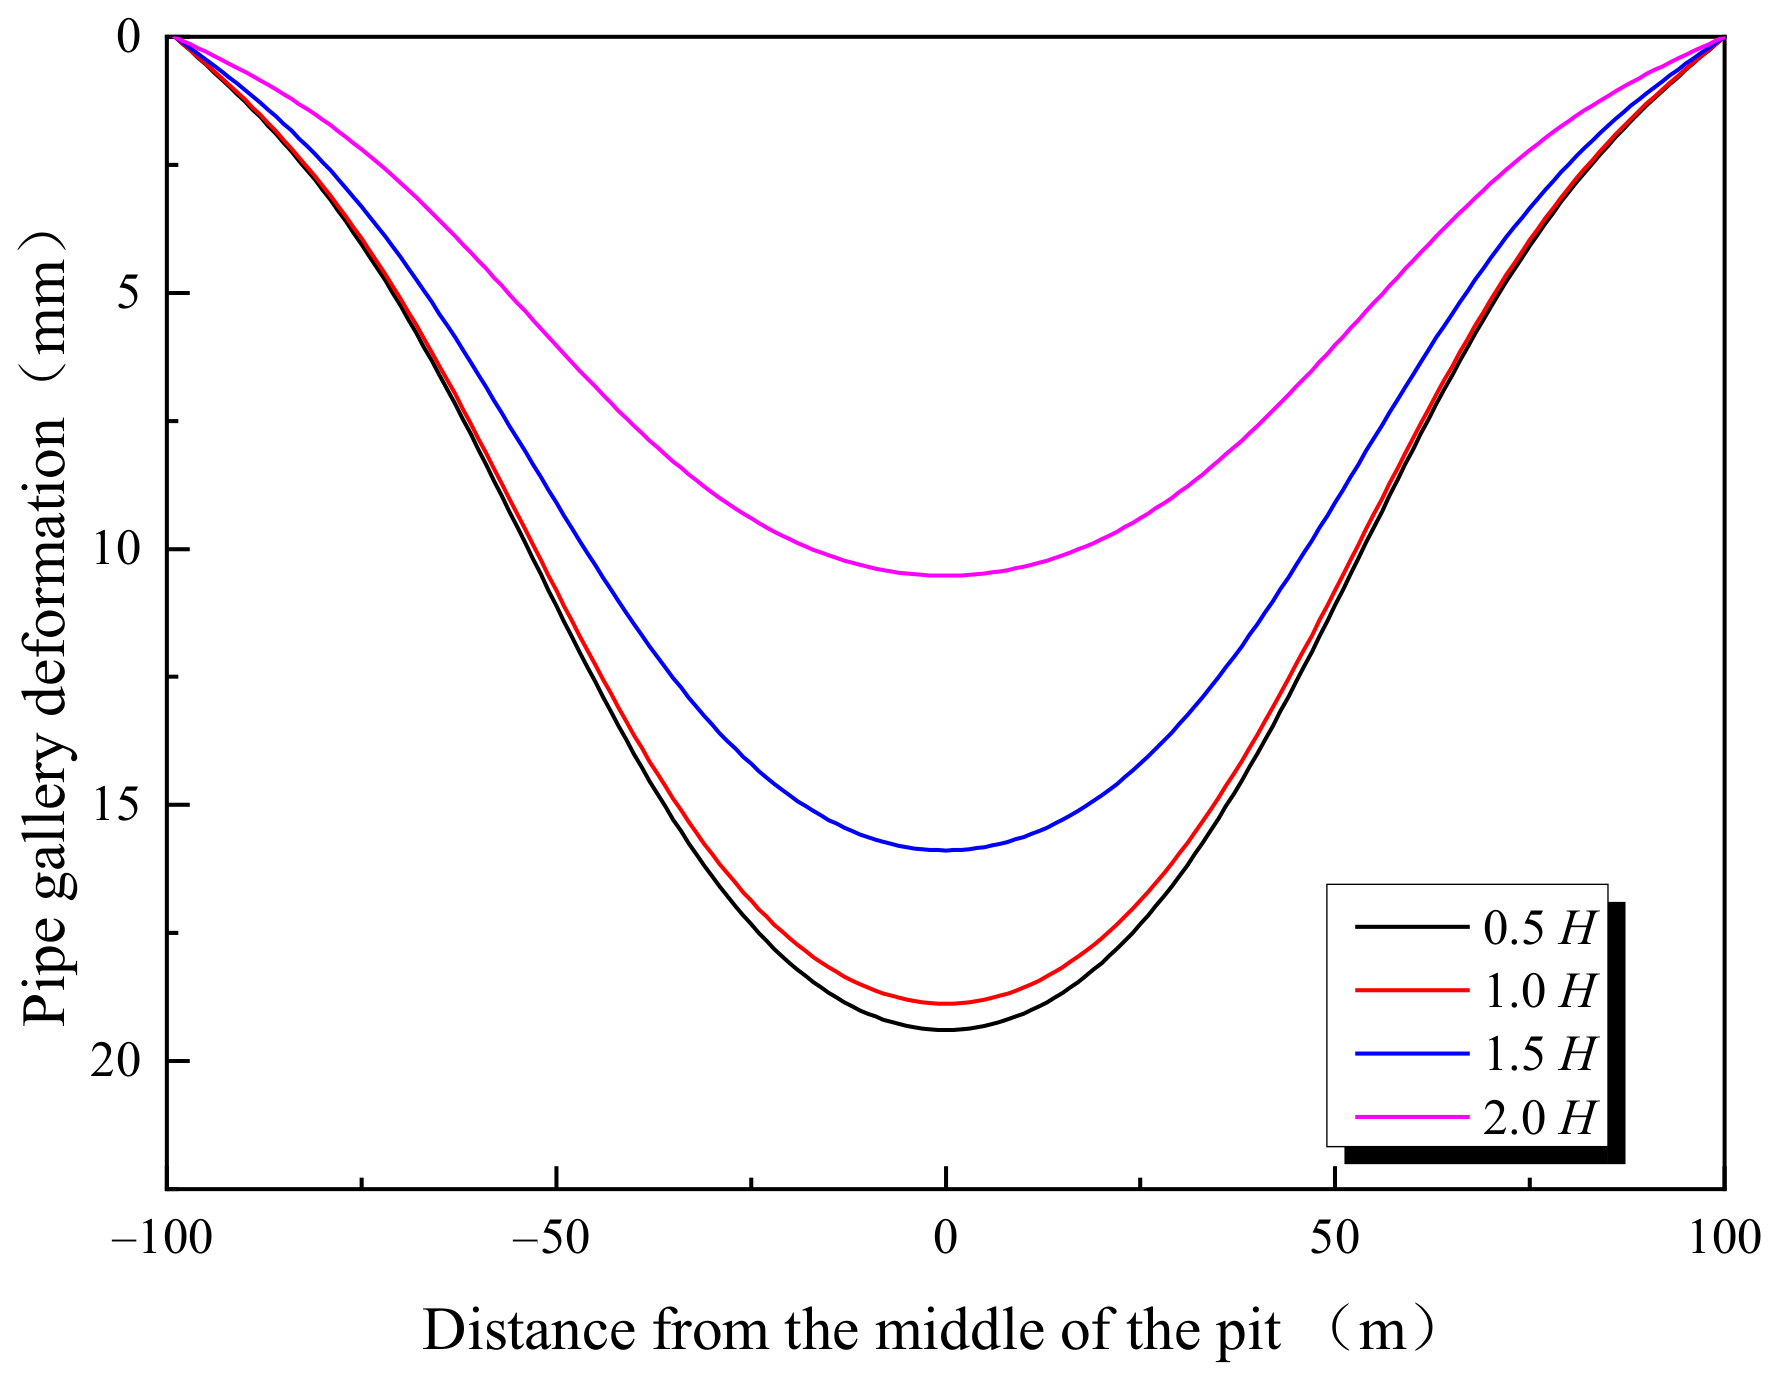
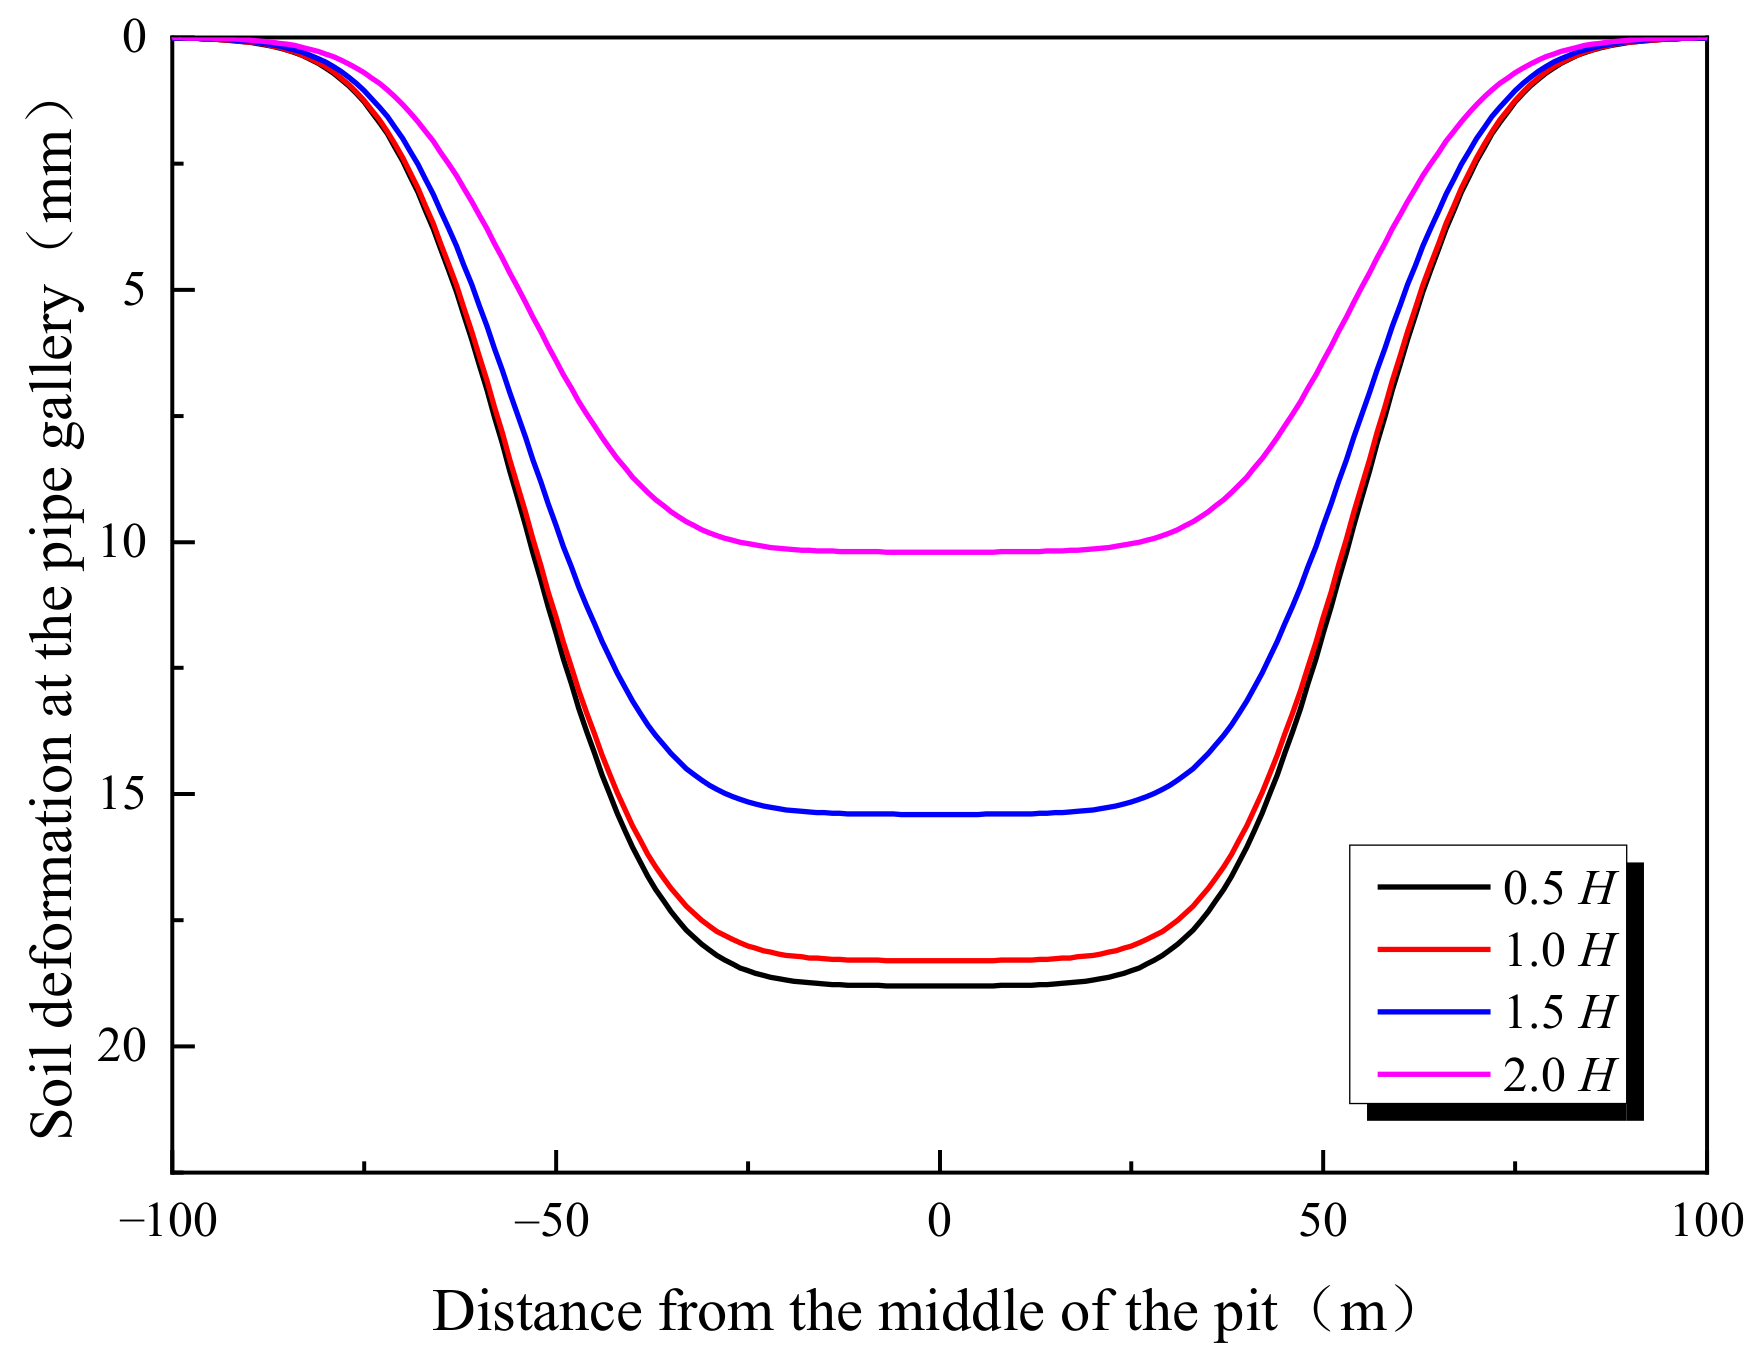
  • The ground settlement behind the retaining structure follows a spoon-shape pattern, i.e., the settlement first increases with the increase in distance from the pit until its maximum value; then, the settlement gradually decreases to a negligible value. The deformation distribution of the pipe gallery is closely in accordance with the distribution of ground settlement at the corresponding location.
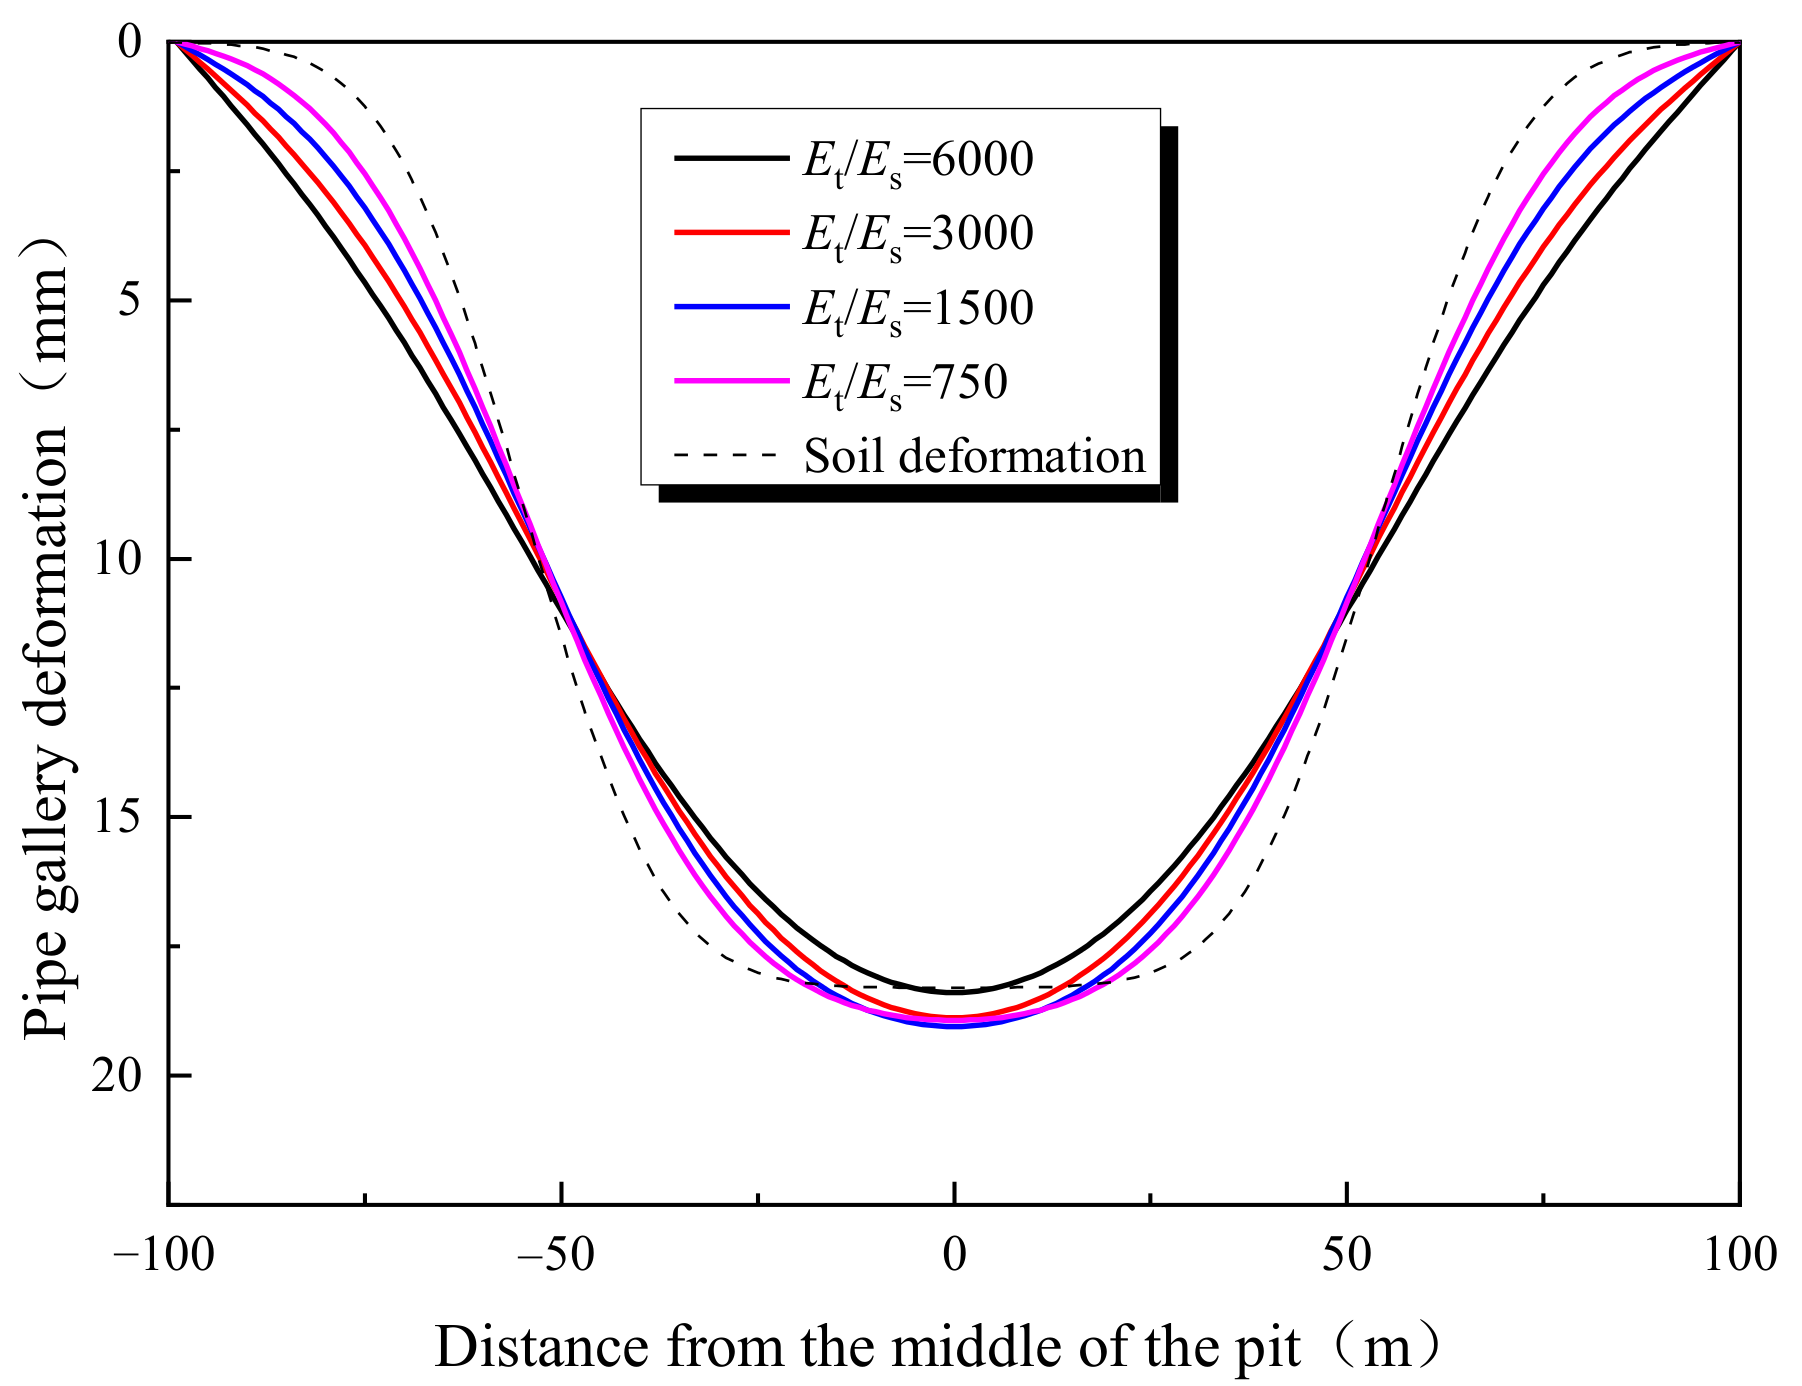
  • From a magnitude close to the ground settlement at the corresponding position, the maximum deformation of the pipe gallery decreases with increasing stiffness.

Author Contributions

Conceptualization, B.X. and Y.L.; methodology, Y.L. and J.C.; software, B.X.; formal analysis, Y.L.; investigation, J.C.; resources, Z.Y.; data curation, Y.L.; writing—original draft preparation, B.X. and Y.L.; writing—review and editing, J.C. and Z.Y. All authors have read and agreed to the published version of the manuscript.

Funding

This research was funded by the National Natural Science Foundation of China (Grant 52108328).

Data Availability Statement

The data are contained within the article.

Conflicts of Interest

Author Binhui Xiang was employed by Jiangxi Zhengde Engineering testing Co. Ltd. The remaining authors declare that the research was conducted in the absence of any commercial or financial relationships that could be construed as a potential conflict of interest.

References

  1. Wang, C.; Liang, F.; Yu, X. A review of bridge scour: Mechanism, estimation, monitoring and countermeasures. Nat. Hazards 2017, 87, 1881–1906. [Google Scholar] [CrossRef]
  2. Rehman, Z.; Zhang, G. Three-dimensional elasto-plastic damage model for gravelly soil-structure interface considering the shear coupling effect. Comput. Geotech. 2021, 129, 103868. [Google Scholar] [CrossRef]
  3. Gallikova, Z.; ur Rehman, Z. Appraisal of the hypoplastic model for the numerical prediction of high-rise building settlement in neogene clay based on real-scale monitoring data. J. Build. Eng. 2022, 50, 104452. [Google Scholar] [CrossRef]
  4. Rao, P.; Feng, W.; Ouyang, P.; Cui, J.; Nimbalkar, S.; Chen, Q. Formation of plasma channel under high-voltage electric pulse and simulation of rock-breaking process. Phys. Scr. 2023, 99, 015604. [Google Scholar] [CrossRef]
  5. Shao, W.; Qin, F.; Shi, D.; Soomro, M.A. Horizontal bearing characteristic and seismic fragility analysis of CFRP composite pipe piles subject to chloride corrosion. Comput. Geotech. 2024, 166, 105977. [Google Scholar] [CrossRef]
  6. Shao, W.; Li, Q.; Zhang, W.; Shi, D.; Li, H. Numerical modeling of chloride diffusion in cement-based materials considering calcium leaching and external sulfate attack. Constr. Build. Mater. 2023, 401, 132913. [Google Scholar] [CrossRef]
  7. Cui, J.; Jin, Y.; Jing, Y.; Lu, Y. Elastoplastic Solution of Cylindrical Cavity Expansion in Unsaturated Offshore Island Soil Considering Anisotropy. J. Mar. Sci. Eng. 2024, 12, 308. [Google Scholar] [CrossRef]
  8. Attewell, P.B.; Yeates, J.; Selby, A.R. Soil Movements Induced by Tunnelling and Their Effects on Pipelines and Structures; Methuen, Inc.: New York, NY, USA, 1986. [Google Scholar]
  9. Fang, K.; Zhang, Z.; He, J.; Liu, X. Pipelines Deformation Control for Double-Row Supported Excavation; ICPTT 2011; American Society of Civil Engineers: Reston, VA, USA, 2011; pp. 440–447. [Google Scholar]
  10. Jia, X.; Zhang, H.; Wang, C.; Liang, F.; Chen, X. Influence on the lateral response of offshore pile foundations of an asymmetric heart-shaped scour hole. Appl. Ocean. Res. 2023, 133, 103485. [Google Scholar] [CrossRef]
  11. Liu, H.; Lv, S.; Jia, J. Numerical Analysis of the Influence of Foundation Pit Excavation on Many Underground Pipelines Nearby; ICPTT 2011; American Society of Civil Engineers: Reston, VA, USA, 2011; pp. 1358–1364. [Google Scholar]
  12. Wang, Y.; Shi, J.; Ng, C.W.W. Numerical modeling of tunneling effect on buried pipelines. Can. Geotech. J. 2011, 48, 1125–1137. [Google Scholar] [CrossRef]
  13. Wang, Z.Z.; Whittle, A.J. Effects of Movement Induced by Ground Improvement on the Performance of an Excavation Support System in Underconsolidated Clay. J. Geotech. Geoenviron. Eng. 2024, 150, 5023008. [Google Scholar] [CrossRef]
  14. Yang, Z.; Chen, Y.; Azzam, R.; Yan, C. Performance of a top-down excavation in shanghai: Case study and numerical exploration. Eur. J. Environ. Civ. Eng. 2021, 26, 7932–7957. [Google Scholar] [CrossRef]
  15. Yang, Z.; Chen, Y.; Yan, C.; Azzam, R. Numerical Evaluation of Isolation Walls in Modifying Excavation-Induced Displacement Field. Arab. J. Sci. Eng. 2022, 48, 12693–12708. [Google Scholar] [CrossRef]
  16. Yao, A.; Xu, T.; Zeng, X.; Jiang, H. Numerical Analyses of the Stress and Limiting Load for Buried Gas Pipelines under Excavation Machine Impact. J. Pipeline Syst. Eng. Pract. 2013, 6, A4014003. [Google Scholar] [CrossRef]
  17. Choudhury, D.; Shen, R.; Leung, C.; Chow, Y. Centrifuge Model Study on Pile Responses Due to Adjacent Excavation. Foundation Analysis and Design; American Society of Civil Engineers: Reston, VA, USA, 2006; pp. 145–151. [Google Scholar]
  18. Cui, J.; Yang, Z.; Azzam, R. Field measurement and numerical study on the effects of under-excavation and over-excavation on ultra-deep foundation pit in coastal area. J. Mar. Sci. Eng. 2023, 11, 219. [Google Scholar] [CrossRef]
  19. Hsieh, P.-G.; Ou, C.-Y. Shape of ground surface settlement profiles caused by excavation. Can. Geotech. J. 1998, 35, 1004–1017. [Google Scholar] [CrossRef]
  20. Li, Y.; Wang, Z. Study of Influence of Subway Station Excavation on Existing Metro Deformation; ICCTP 2009; American Society of Civil Engineers: Reston, VA, USA, 2009; pp. 1–7. [Google Scholar]
  21. Tan, Y.; Huang, R.; Kang, Z.; Bin, W. Covered semi-top-down excavation of subway station surrounded by closely spaced buildings in downtown Shanghai: Building response. J. Perform. Constr. Facil. 2016, 30, 4016040. [Google Scholar] [CrossRef]
  22. Tan, Y.; Wei, B.; Diao, Y.; Zhou, X. Spatial Corner Effects of Long and Narrow Multipropped Deep Excavations in Shanghai Soft Clay. J. Perform. Constr. Facil. 2013, 28, 4014015. [Google Scholar] [CrossRef]
  23. Clough, G.G.; O’Rourke, T.T. Construction Induced Movements of Insitu Wall, Design and Performance of Earth Retaining Structure; American Society of Civil Engineers: Reston, VA, USA, 1990; pp. 292–308. [Google Scholar]
  24. Long, M. Database for retaining wall and ground movements due to deep excavations. J. Geotech. Geoenviron. Eng. 2001, 127, 203–224. [Google Scholar] [CrossRef]
  25. Ou, C.-Y.; Hsieh, P.-G.; Chiou, D.-C. Characteristics of ground surface settlement during excavation. Can. Geotech. J. 1993, 30, 758–767. [Google Scholar] [CrossRef]
  26. Wang, L.; Luo, Z.; Khoshnevisan, S.; Juang, C. Robust Design of Braced Excavations Using Multiobjective Optimization-Focusing on Prevention of Damage to Adjacent Buildings; Geo-Congress 2014 Technical Papers; American Society of Civil Engineers: Reston, VA, USA, 2014; pp. 3178–3187. [Google Scholar]
  27. Xu, Y.S.; Ma, L.; Du, Y.J.; Shen, S.L. Analysis of urbanisation-induced land subsidence in Shanghai. Nat. Hazards 2012, 63, 1255–1267. [Google Scholar] [CrossRef]
  28. Calvello, M.; Finno, R.J. Selecting parameters to optimize in model calibration by inverse analysis. Comput. Geotech. 2004, 31, 411–425. [Google Scholar] [CrossRef]
  29. Cui, J.; Ouyang, P.; Zhang, J.; Yang, Z. Theoretical Analysis of Deformation and Internal Forces of Used Piles Due to New Static-Pressure Pile Penetration. Appl. Sci. 2023, 13, 2714. [Google Scholar] [CrossRef]
  30. Kingshuk, D.; Bikas, S.R. Estimation of Ground Movement and Wall Deflection in Braced Excavation by Minimum Potential Energy Approach. Int. J. Geomech. 2018, 18, 4018068. [Google Scholar]
  31. Li, D.; Xiao, M.; Zeng, Q. Impact of Deep Excavations on Adjacent Buried Pipelines. In New Pipeline Technologies, Security, and Safety; American Society of Civil Engineers: Reston, VA, USA, 2003; pp. 1116–1125. [Google Scholar]
  32. Schuster, M.; Kung, G.; Juang, C.; Hashash, Y. Simplified Model for Evaluating Damage Potential of Buildings Adjacent to a Braced Excavation. J. Geotech. Geoenviron. Eng. 2009, 135, 1823–1835. [Google Scholar] [CrossRef]
  33. Chen, R.; Yin, X.; Tang, L.; Chen, Y. Centrifugal model tests on face failure of earth pressure balance shield induced by steady state seepage in saturated sandy silt ground. Tunn. Undergr. Space Technol. 2018, 81, 315–325. [Google Scholar] [CrossRef]
  34. Zheng, G.; Wei, S.W.; Peng, S.Y.; Diao, Y.; Ng, C.W.W. Centrifuge modeling of the influence of basement excavation on existing tunnels. In Physical Modelling in Geotechnics, Two Volume Set; Zheng, G., Wei, S.W., Peng, S.Y., Eds.; CRC Press: Boca Raton, FL, USA, 2010; pp. 549–554. [Google Scholar]
  35. Geng, P.; Yang, X.; Zhang, Y.; Huang, X.M. Research on prediction method of pipe gallery environment based on lstm circular convolution neural network. Int. Core J. Eng. 2020, 6, 340–346. [Google Scholar]
  36. Zhang, R.; Meng, R.; Sang, J.; Hu, Y.; Li, X.; Zheng, C. Modelling individual head-related transfer function(hrtf)based on anthropometric parameters and generic hrtf amplitudes. CAAI Trans. Intell. Technol. 2023, 8, 364–378. [Google Scholar] [CrossRef]
  37. Zhang, Y.; Hu, Y.; Gao, X.; Gong, D.; Guo, Y.; Gao, K.; Zhang, W. An embedded vertical-federated feature selection algorithm based on particle swarm optimisation. CAAI Trans. Intell. Technol. 2023, 8, 734–754. [Google Scholar] [CrossRef]
  38. Katkade, S.N.; Bagal, V.C.; Manza, R.R.; Yannawar, P.L. Advances in real-time object detection and information retrieval: A review. Artif. Intell. Appl. 2023, 1, 139–144. [Google Scholar] [CrossRef]
  39. Yi, T.; Shi, M.; Shang, W.; Zhu, H. A privacy-preserving method for publishing data with multiple sensitive attributes. CAAI Trans. Intell. Technol. 2023, 9, 222–238. [Google Scholar] [CrossRef]
  40. Groumpos, P.P. A critical historical overview of artificial intelligence: Issues, challenges, opportunities, and threats. Artif. Intell. Appl. 2023, 1, 197–213. [Google Scholar]
  41. Luo, C.T.; Luo, C. A kernel-embedded local learning for data-intensive modeling. Artif. Intell. Appl. 2024, 2, 38–44. [Google Scholar] [CrossRef]
  42. Huang, X.; Schweiger, H.; Huang, H. Influence of Deep Excavations on Nearby Existing Tunnels. Int. J. Geomech. 2011, 13, 170–180. [Google Scholar] [CrossRef]
  43. Zhang, X.; Ou, X.; Yang, J.; Fu, J. Deformation Response of an Existing Tunnel to Upper Excavation of Foundation Pit and Associated Dewatering. Int. J. Geomech. 2016, 17, 4016112. [Google Scholar] [CrossRef]
  44. Boscardin, M.; Cording, E. Building Response to Excavation-Induced Settlement. J. Geotech. Eng. 1989, 115, 1–21. [Google Scholar] [CrossRef]
  45. Osman, A.; Bolton, M. Ground Movement Predictions for Braced Excavations in Undrained Clay. J. Geotech. Geoenviron. Eng. 2006, 132, 465–477. [Google Scholar] [CrossRef]
  46. Zhou, H.; Kong, G.; Liu, H. A semi-analytical solution for cylindrical cavity expansion in elastic–perfectly plastic soil under biaxial in situ stress field. Géotechnique 2016, 66, 584–595. [Google Scholar] [CrossRef]
  47. Hwang, R. Performance of Deep Excavations in the Taipei Basin. Earth Retention Conference 3; American Society of Civil Engineers: Reston, VA, USA, 2010; pp. 55–68. [Google Scholar]
  48. Zhang, C.; Yu, J.; Huang, M. Deformation controlling criterion of effect on underground pipelines due to foundation pit excavation. Rock Soil Mech. 2012, 33, 8. (In Chinese) [Google Scholar]
  49. Finno, R.J.; Calvello, M. Supported excavations: Observational method and inverse modeling. J. Geotech. Geoenviron. Eng. 2005, 131, 826–836. [Google Scholar] [CrossRef]
  50. Kalinli, A.; Acar, M.C.; Gündüz, Z. New approaches to determine the ultimate bearing capacity of shallow foundations based on artificial neural networks and ant colony optimization. Eng. Geol. 2011, 117, 29–38. [Google Scholar] [CrossRef]
Figure 1. Inward translation of the retaining wall.
Buildings 14 01103 g001
Figure 2. Retaining wall’s rotation around its toe.
Buildings 14 01103 g002
Figure 3. The triangle-pattern movement of the retaining wall.
Buildings 14 01103 g003
Figure 4. The parabolic mode of the wall movement.
Buildings 14 01103 g004
Figure 5. Normalized ground settlements behind the wall under different wall movement types.
Buildings 14 01103 g005
Figure 6. Spatial distribution of the excavation-induced settlement.
Buildings 14 01103 g006
Figure 7. The plane view and instrumentation of the project.
Buildings 14 01103 g007
Figure 8. Wall deflection.
Buildings 14 01103 g008
Figure 9. Ground surface settlement behind the wall.
Buildings 14 01103 g009
Figure 10. Ground settlements at the position of the pipe gallery.
Buildings 14 01103 g010
Figure 11. Pipe gallery deformations.
Buildings 14 01103 g011
Figure 12. Ground settlements at the position of the pipe gallery.
Buildings 14 01103 g012
Figure 13. Pipe gallery deformations.
Buildings 14 01103 g013
Figure 14. The influence of pipe gallery stiffness.
Buildings 14 01103 g014
Disclaimer/Publisher’s Note: The statements, opinions and data contained in all publications are solely those of the individual author(s) and contributor(s) and not of MDPI and/or the editor(s). MDPI and/or the editor(s) disclaim responsibility for any injury to people or property resulting from any ideas, methods, instructions or products referred to in the content.

