Article

Bond–Slip Performance of Steel–Fiber-Reinforced Polymer Composite Bars (SFCBs) and Glass Fiber with Expansion-Agent-Reinforced Seawater Sea-Sand Concrete (GF-EA-SSSC) under Freezing–Thawing Environment

1
School of Civil Engineering, Guangdong Construction Polytechnic, Guangzhou 510440, China
2
School of Civil and Transportation Engineering, Guangdong University of Technology, Guangzhou 510006, China
3
Guangdong Yonghe Construction Group Co., Ltd., Guangzhou 510330, China
*
Author to whom correspondence should be addressed.
Buildings 2024, 14(4), 1121; https://doi.org/10.3390/buildings14041121
Submission received: 6 March 2024 / Revised: 8 April 2024 / Accepted: 15 April 2024 / Published: 17 April 2024
(This article belongs to the Special Issue New Concrete Materials: Performance Analysis and Research)

Abstract

:
The combined application of steel–FRP composite bars (SFCBs) and seawater sea-sand concrete (SSSC) in marine engineering not only solves the problem of resource scarcity and reduces the construction cost but also avoids the problems of chloride corrosion of steel reinforcement in seawater sea-sand concrete and the lack of ductility of FRP bars. At the same time, the addition of glass fiber (GF) and expansion agent (EA) in appropriate amounts improves the crack resistance and seepage resistance of concrete. However, the durability of SFCB with GF- and EA-reinforced SSSC in freezing–thawing environment remains unclear, which limits its potential application in cryogenic marine engineering. This study investigates the bonding properties between SFCB and GF-EA-SSSC interfaces using eccentric pullout experiments under different thicknesses of concrete protective cover and a number of freezing–thawing cycles. The results showed that the compressive strength and dynamic elastic modulus of SSSC decrease, while the mass loss increases with an increasing number of freezing–thawing cycles. Additionally, the bond strength and stiffness between SFCB and SSSC decrease, leading to an increase in relative slip. However, the rate of bond strength and stiffness loss decreases with an increase in the thickness of the concrete protective cover. Furthermore, formulas for bond strength, relative slip, and bond stiffness are established to quantify the effects of the thickness of the concrete protective cover and the number of freezing–thawing cycles. The experimental values obtained verify the accuracy of these formulas, with a relative error of less than 5%. Moreover, a bond stress–slip constitutive model is developed for SFCB and GF-EA-SSSC, and the fitting results closely resemble the experimental values, demonstrating a high level of model fit.

1. Introduction

In recent years, the rapid development of infrastructure construction in coastal cities and island areas, coupled with the acceleration of urbanization, has led to an increasing demand for concrete [1,2]. However, the production process of concrete requires the consumption of a significant amount of natural resources, such as fresh water and river sand [3,4,5]. The excessive exploitation and use of these resources have resulted in a severe shortage and significant damage to the natural environment. Moreover, the transportation cost of traditional building materials is higher in construction projects located in coastal and island areas. In response to these challenges, researchers have proposed the use of seawater and sea sand as alternatives to freshwater and river sand in the production of concrete structures [6,7,8]. Sea sand has the advantages of large resource reserves and wide distribution, and the physical properties are similar to river sand, but the grading is slightly different. Existing research indicates that the mechanical properties of seawater sea-sand concrete (SSSC) are comparable to those of ordinary concrete [9,10]. Consequently, SSSC presents not only substantial economic benefits but also satisfactory working performance, making it highly promising for widespread application. However, the high concentration of chloride ions in seawater and sea sand introduces a significant challenge, as it accelerates the corrosion of steel reinforcement, leading to potentially severe safety hazards. Therefore, there are difficulties in popularizing the application of SSSC.
In order to promote the application of SSSC and address the issue of steel bar corrosion, researchers have proposed the utilization of fiber-reinforced polymer bar (FRP bar) as a replacement for steel bars, in combination with SSSC in building structures [11,12,13,14,15]. With advancements in technology and process refinement, the use of FRP bars has become more streamlined, cost-effective, and widespread in building and bridge structures. This has garnered increasing attention from scholars, who have begun to focus on the research regarding the application of FRP reinforcement [16,17,18,19,20]. FRP bars are used in concrete as reinforcing steel bars, which have the advantages of chloride ion corrosion resistance, high tensile strength, lightweight properties, and fatigue resistance [21,22,23,24]. Therefore, the adoption of FRP bars instead of traditional steel bars plays an important role in resolving the issue of chloride corrosion in seawater sea sand. However, FRP bars tend to have low stiffness in concrete structures, large structural deflection in the use phase, easy to brittle damage, as well as high price and other shortcomings, making it difficult to be widely promoted in engineering applications. To address these challenges, steel–FRP composite bars (SFCBs) are a new type of reinforced composite material with steel reinforcement as the core and fiber layer as the outer layer. SFCB combines the favorable characteristics of both steel bars and FRP bars, including a high modulus of elasticity, stable secondary stiffness, excellent corrosion resistance, and a lower price point [25,26]. The application of SFCB in SSSC offers a theoretical solution to the problems associated with steel reinforcement erosion caused by chloride ions and the lack of ductility observed in FRP bars.
The substitution of SFCB for steel addresses two key problems, steel corrosion and the lack of ductility in FRP bars. A large number of previous studies have demonstrated the favorable bonding properties between FRP bars and concrete, resulting in a synergistic effect that enhances the integrity and safety of FRP-reinforced concrete [27,28,29]. However, it is imperative to investigate whether SFCB exhibits similar bonding properties with concrete and creates a beneficial synergy. Moreover, building structures must not only perform well in comfortable environments but also withstand the impact of aggressive conditions such as freezing and thawing, high temperatures, seawater erosion, and wet–dry cycles. Scholars have already conducted relevant studies on the bonding performance between SFCB and concrete [25,30]. However, these studies have mostly focused on conventional environments, wet–dry cycles, and seawater immersion, with fewer investigations conducted on bond performance during freezing–thawing cycles, which present extreme conditions [31,32,33]. Freezing–thawing environments have diverse and multifaceted effects on building structures. They can induce spalling, expansion cracking of concrete, interface cracking between different materials, accelerated carbonation of concrete, and increased sulfate corrosion, all of which contribute to a decline in structural performance [34,35,36]. Therefore, ensuring the durability of the interfacial bond is crucial for maintaining the overall integrity of a building structure over a prolonged period under freezing–thawing conditions. Investigating the interfacial bonding properties between SFCB and SSSC under freezing–thawing cycles is imperative for the successful application of SFCB in such environments.
A substantial body of research has explored the durability of concrete in freezing–thawing environments, with scholars proposing various theories regarding the deterioration mechanism of concrete under such conditions [37,38,39]. Freezing–thawing damage is commonly divided into two stages. The initial stage involves the solidification and expansion of internal liquid water, leading to crack formation and characterized by a loss of dynamic modulus and concrete strength. The subsequent stage involves the disintegration of the cement paste body, resulting in the shedding of surface mortar. This stage is characterized by mass loss and partial or complete destruction of the concrete structure. Considering this two-stage perspective, improving the cracking and permeability resistance of concrete can enhance its ability to withstand freezing–thawing losses, consequently improving the durability of the bond between reinforcement and concrete in freezing–thawing environments. To enhance the frost resistance of concrete, glass fiber plays a crucial role by limiting the extension of vertical cracks and promoting the bonding of parallel cracks. This optimization of the internal structure of concrete improves its crack resistance [40]. The incorporation of an expansion agent in concrete contributes to the formation of expansion mineral crystals through a reaction with Ca(OH)2, a product of cement hydration. This reaction slows down the cement hydration rate, generating expansion stress within the concrete. This stress helps resist part of the tensile stress resulting from drying contraction, inhibiting concrete deformation, and reducing cracks. Furthermore, an appropriate amount of expansion agent can enhance the seepage resistance of concrete. According to our previous studies [41,42], there is evidence of a synergistic effect when combining an appropriate amount of expansion agent with glass fiber. The concrete mixed with glass fiber and expansion agent can not only inhibit crack development but also improve the concrete compressive strength, flexural strength and toughness, and other aspects of performance [8,41,42,43]. Therefore, in this study, the incorporation of a suitable amount of glass fiber and expansion agent aims to enhance the crack resistance and seepage resistance of SSSC, ultimately improving its ability to resist freezing and thawing losses.
To ensure the frost resistance of building structures, it is crucial to examine the durability of the bond between reinforcement and concrete in freezing–thawing environments. Previous studies have focused on the bond durability between FRP bars and concrete, primarily through axial pullout tests [25,33]. However, these tests were conducted with a concrete cover thickness greater than 75 mm and a ratio of concrete cover thickness c to FRP reinforcement diameter d greater than 5, which does not align with the recommendation in ACI 440.1R-2015 stating that c/d should not exceed 3.5 [44]. Consequently, the use of axial pullout tests may result in specimens with an inconsistent concrete protective layer thickness, leading to an overestimation of the bond durability between stressed reinforcement and concrete under freezing–thawing conditions. To address this issue, an eccentric pullout test is employed in this study to investigate the bond performance of the SFCB and SSSC interface under varying concrete protective layer thicknesses and freezing–thawing cycles. This approach allows for the consideration of the impact of concrete protective layer thickness on the frost durability of the bonded interface, while also being more representative of the actual engineering situation.
This study addresses the issues of chloride corrosion in traditional steel bars submerged in seawater sea-sand concrete and the limited ductility of FRP bars by introducing a novel composite steel bar known as SFCB. To enhance the crack resistance and seepage resistance of SSSC, an appropriate amount of glass fiber and expansion agent are incorporated. Consequently, the frost resistance of the concrete is improved. To assess the impact of the concrete protective layer thickness on the frost durability of the bonded interface, eccentric pullout experiments were conducted to replicate the actual engineering situation. Furthermore, the bonding performance of SFCB and GF-EA-SSSC interfaces was examined under varying concrete protective layer thicknesses and a number of freezing–thawing cycles. These investigations aim to promote the advancement and widespread application of seawater sea-sand concrete.

2. Experimental Program
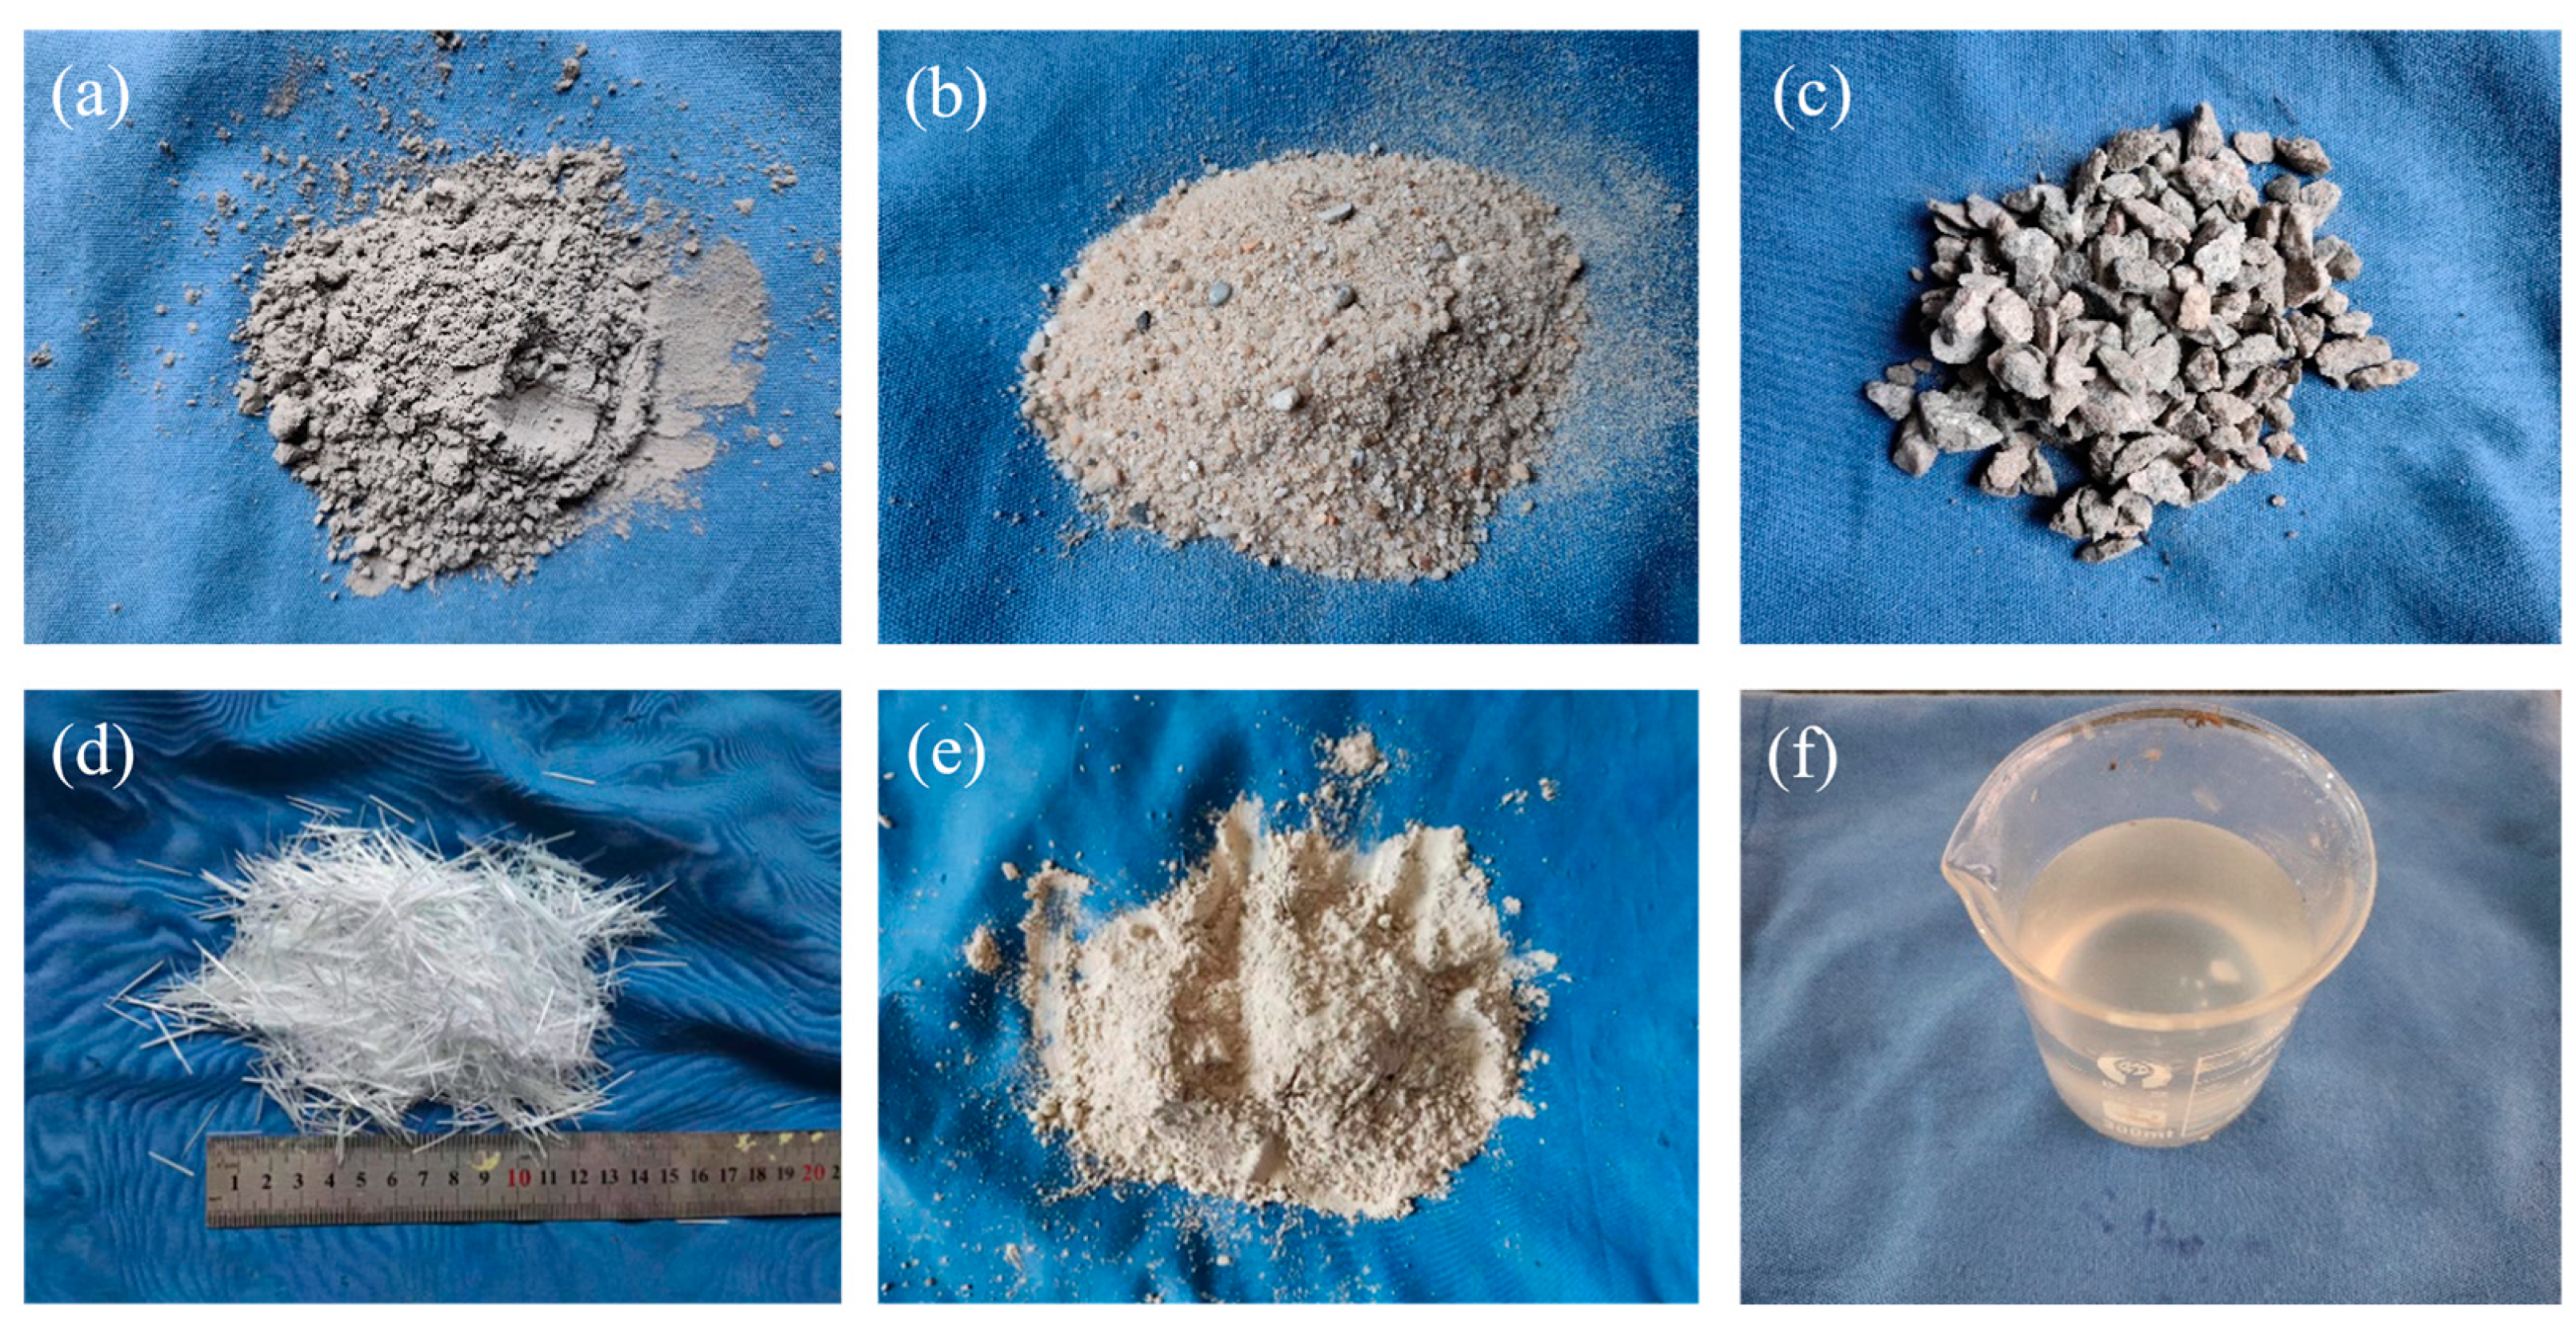
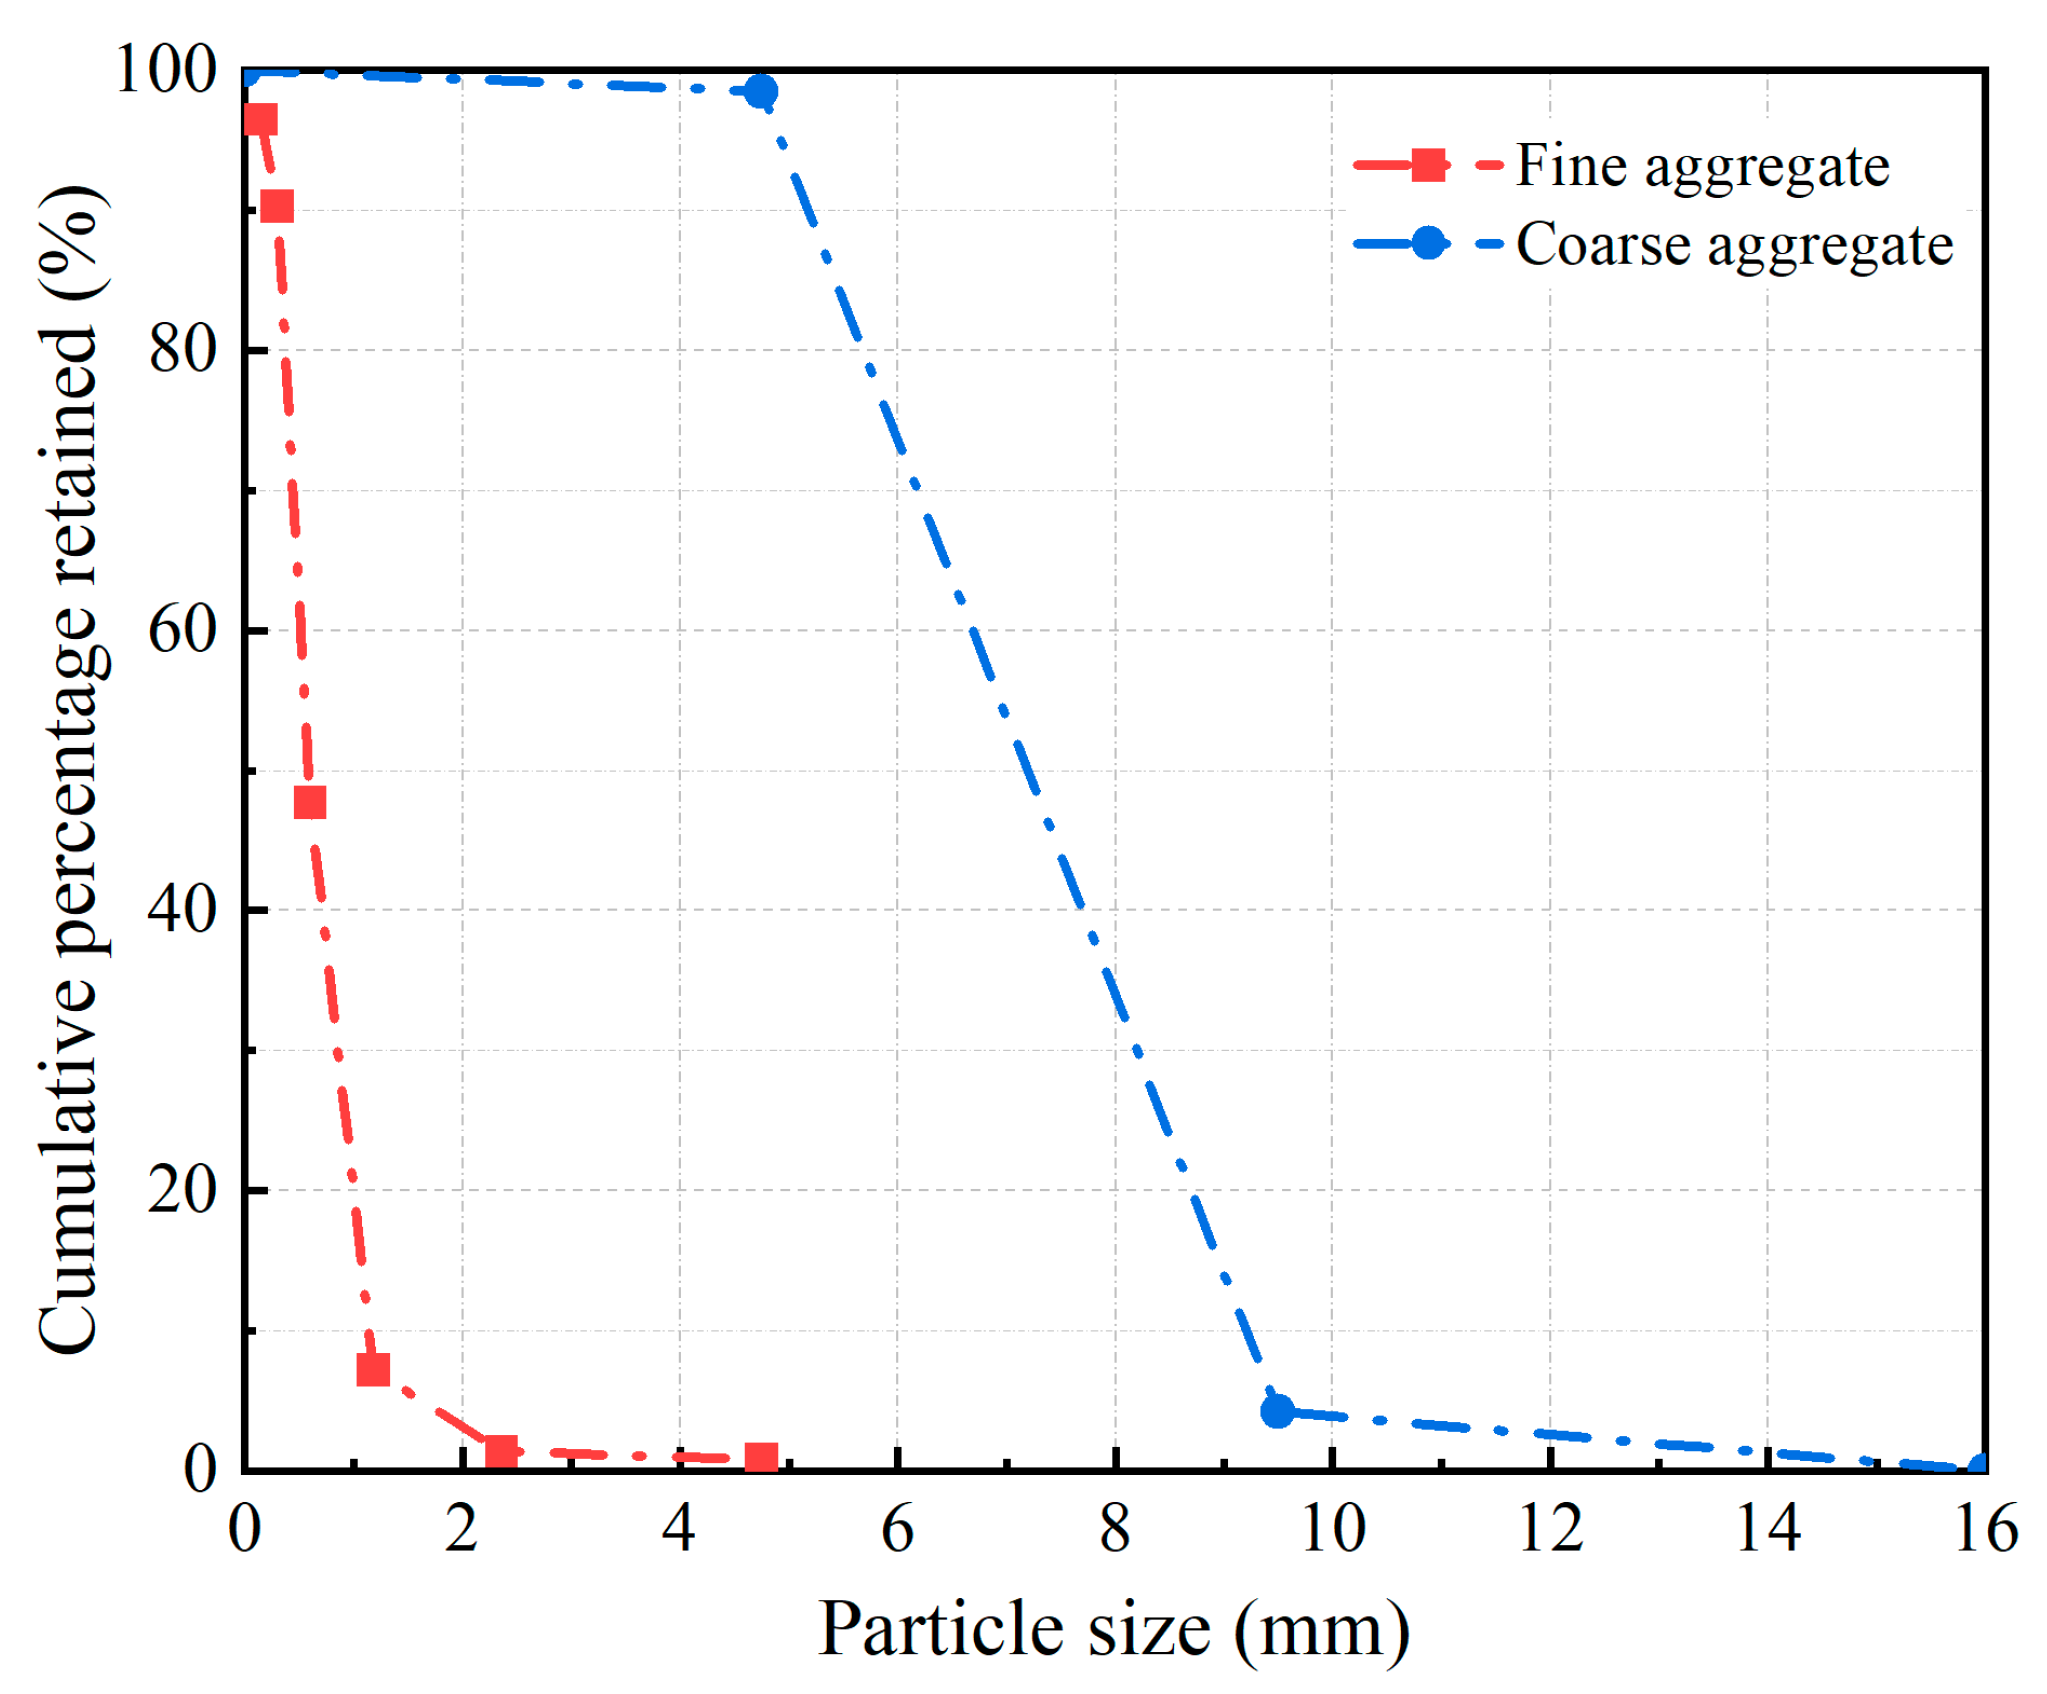
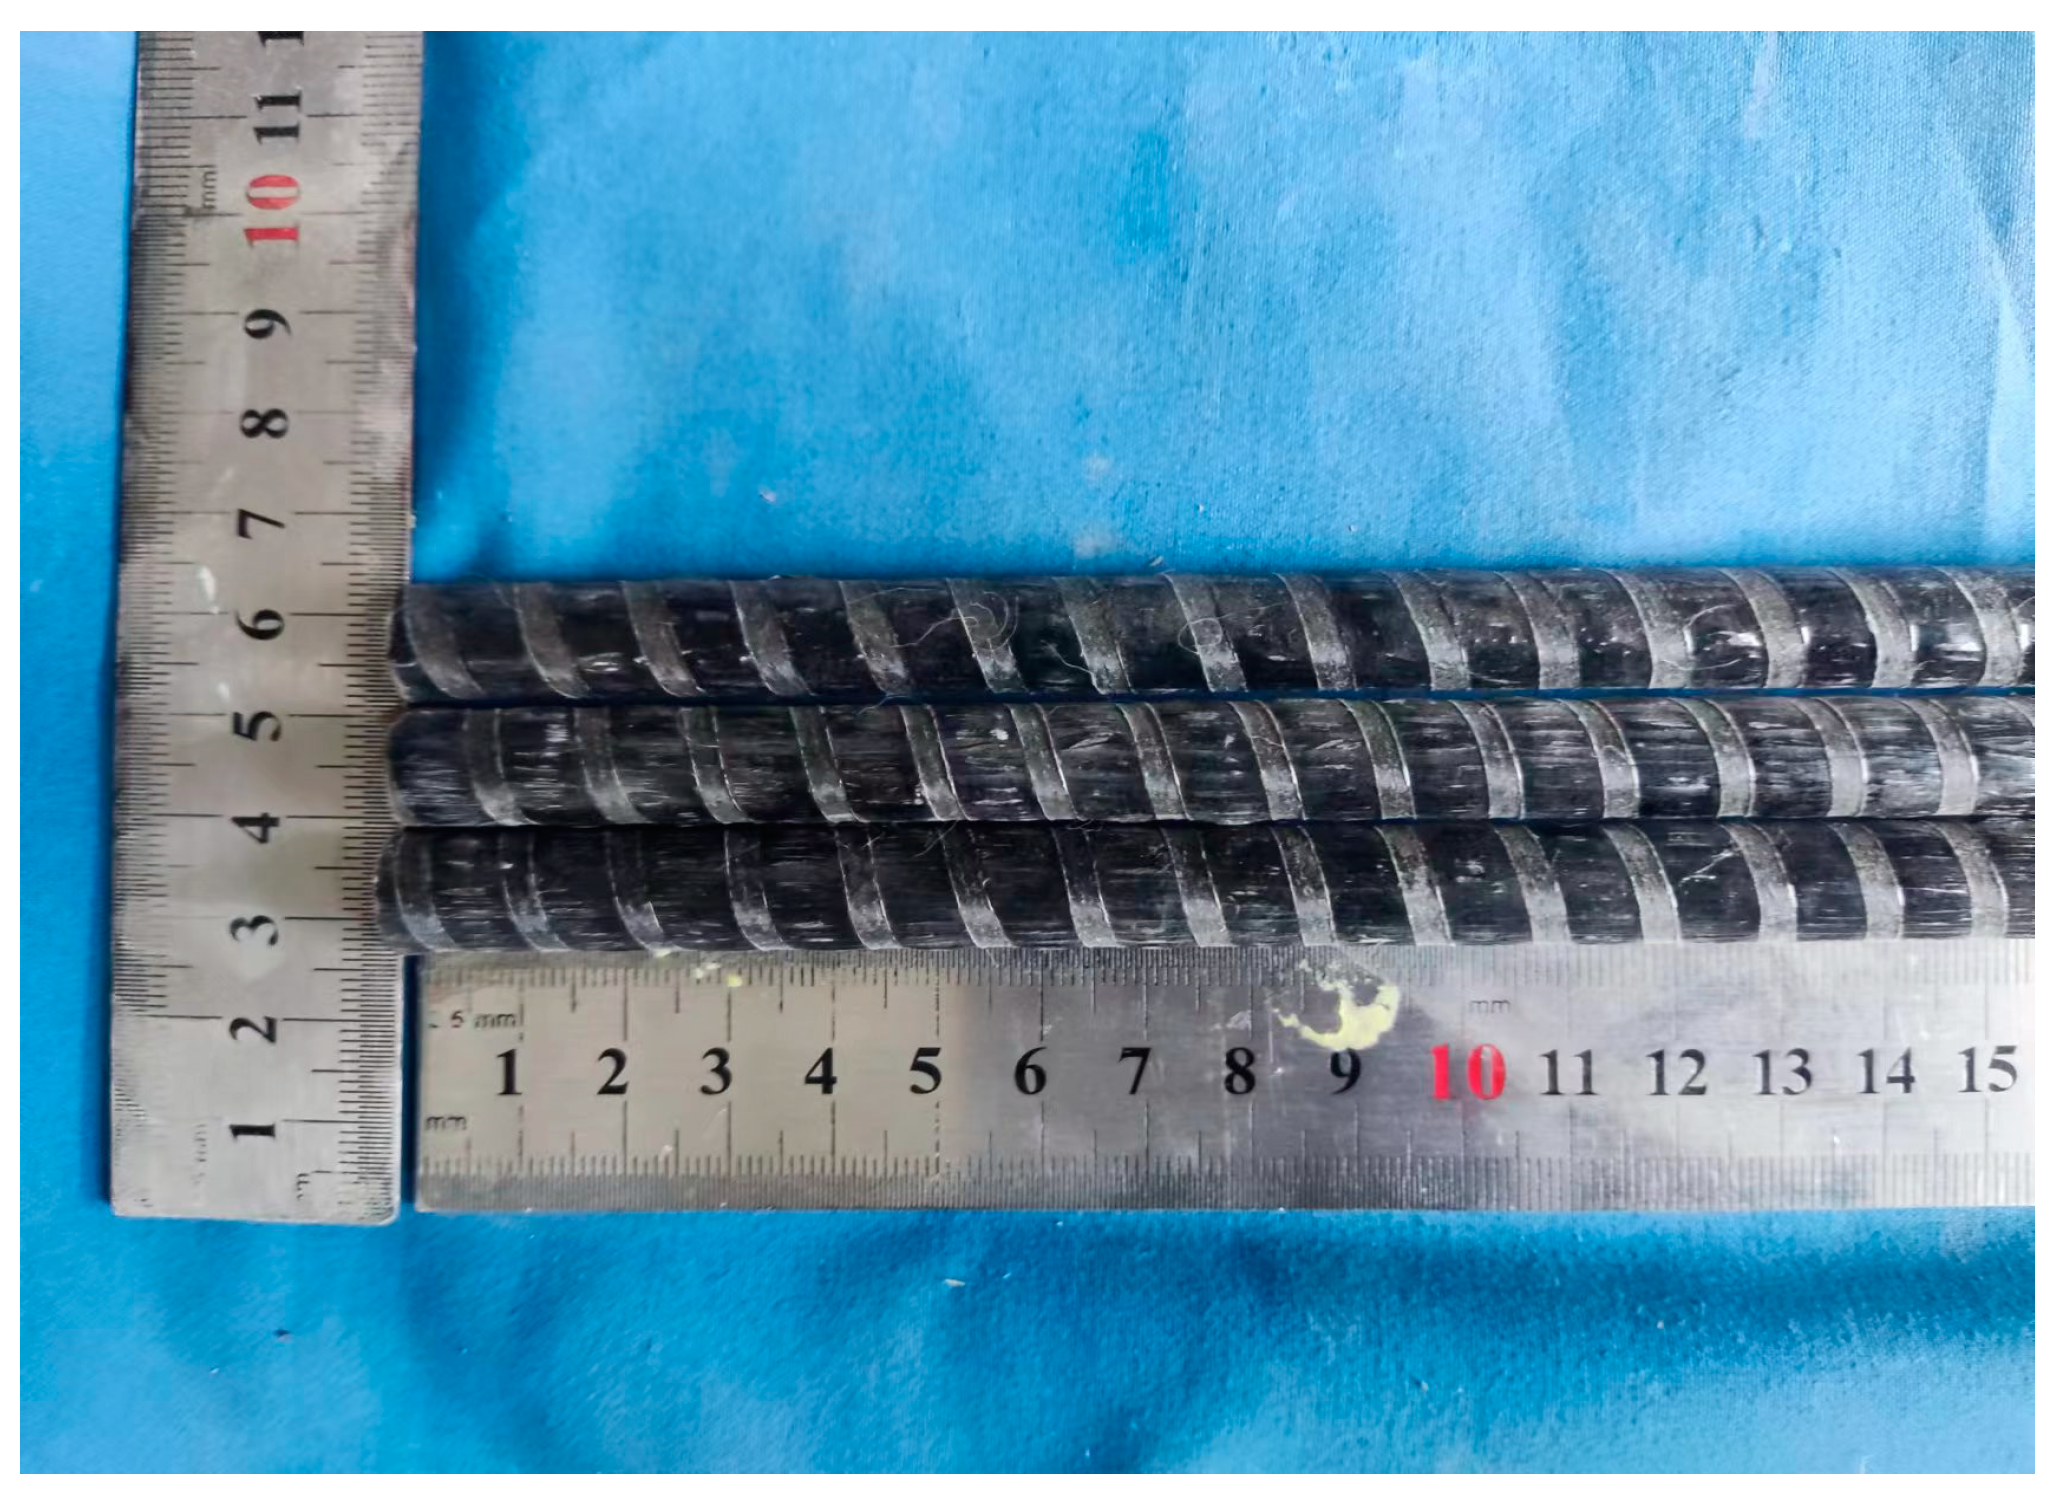
2.1. Materials

Each raw material utilized in preparing seawater sea-sand concrete is shown in Figure 1. Ordinary silicate cement (P.O 42.5R, with an apparent density of 3114.6 kg/m3) served as the cementitious material for concrete mixing, the chemical properties as shown in Table 1. The artificial seawater, formulated in accordance with ASTM D1141 [45], had a chemical composition comprising 16.26 g/L Cl, 1.88 g/L SO42−, 1.83 g/L Na+, 0.21 g/L Mg2+, 0.069 g/L K+, and 0.124 g/L Ca2+. Sea sand, characterized by an apparent density of 2617 kg/m3, water content of 1.55%, water absorption of 3.26%, mud content of 0.98%, and a fineness modulus of 2.41, was employed as the fine aggregate. Granite gravel, with a particle size distribution of 5–10 mm and an apparent density of 2689 kg/m3, served as the coarse aggregate. The granite gravel had a water content of 1.56%, water absorption of 1.84%, and mud content of 1.55%. The particle size distribution of both fine and coarse aggregates is illustrated in Figure 2. The glass fiber used in the study had a length of 18 mm, a monofilament diameter of 13 µm, a density of 2730 kg/m3, a tensile strength of 1.7 GPa, a modulus of elasticity of 75 GPa, an elongation at break of 2.1%, and a water content of less than 0.1%. The calcium sulfoaluminate–calcium oxide composite expansion agent employed had a magnesium oxide content of 4.8%, water content of 2.5%, total alkali content of 0.7%, chloride ion content of 0.04%, and a specific area of 250 m2/kg. Additionally, a water-reducing agent was chosen as the aqueous solution of a polycarboxylic acid-based mixture.
The SFCB employed in this study possessed a nominal diameter of 12 mm, an inner core diameter of 8 mm, and a strength grade of HRB400-threaded steel bar. The outer layer featured a wrapped GFRP with a thickness of 4 mm, adopting a threaded surface form, as shown in Figure 3. To assess mechanical properties, five randomly selected SFCB samples underwent testing according to ASTM D7205/D7205M [46]. The equivalent diameter of SFCB was determined using the drainage method. The average equivalent diameter of the SFCB was measured to be 11.6 mm. The average tensile strength and modulus of elasticity were found to be 816.93 MPa and 72.7 GPa, as shown in Table 2.

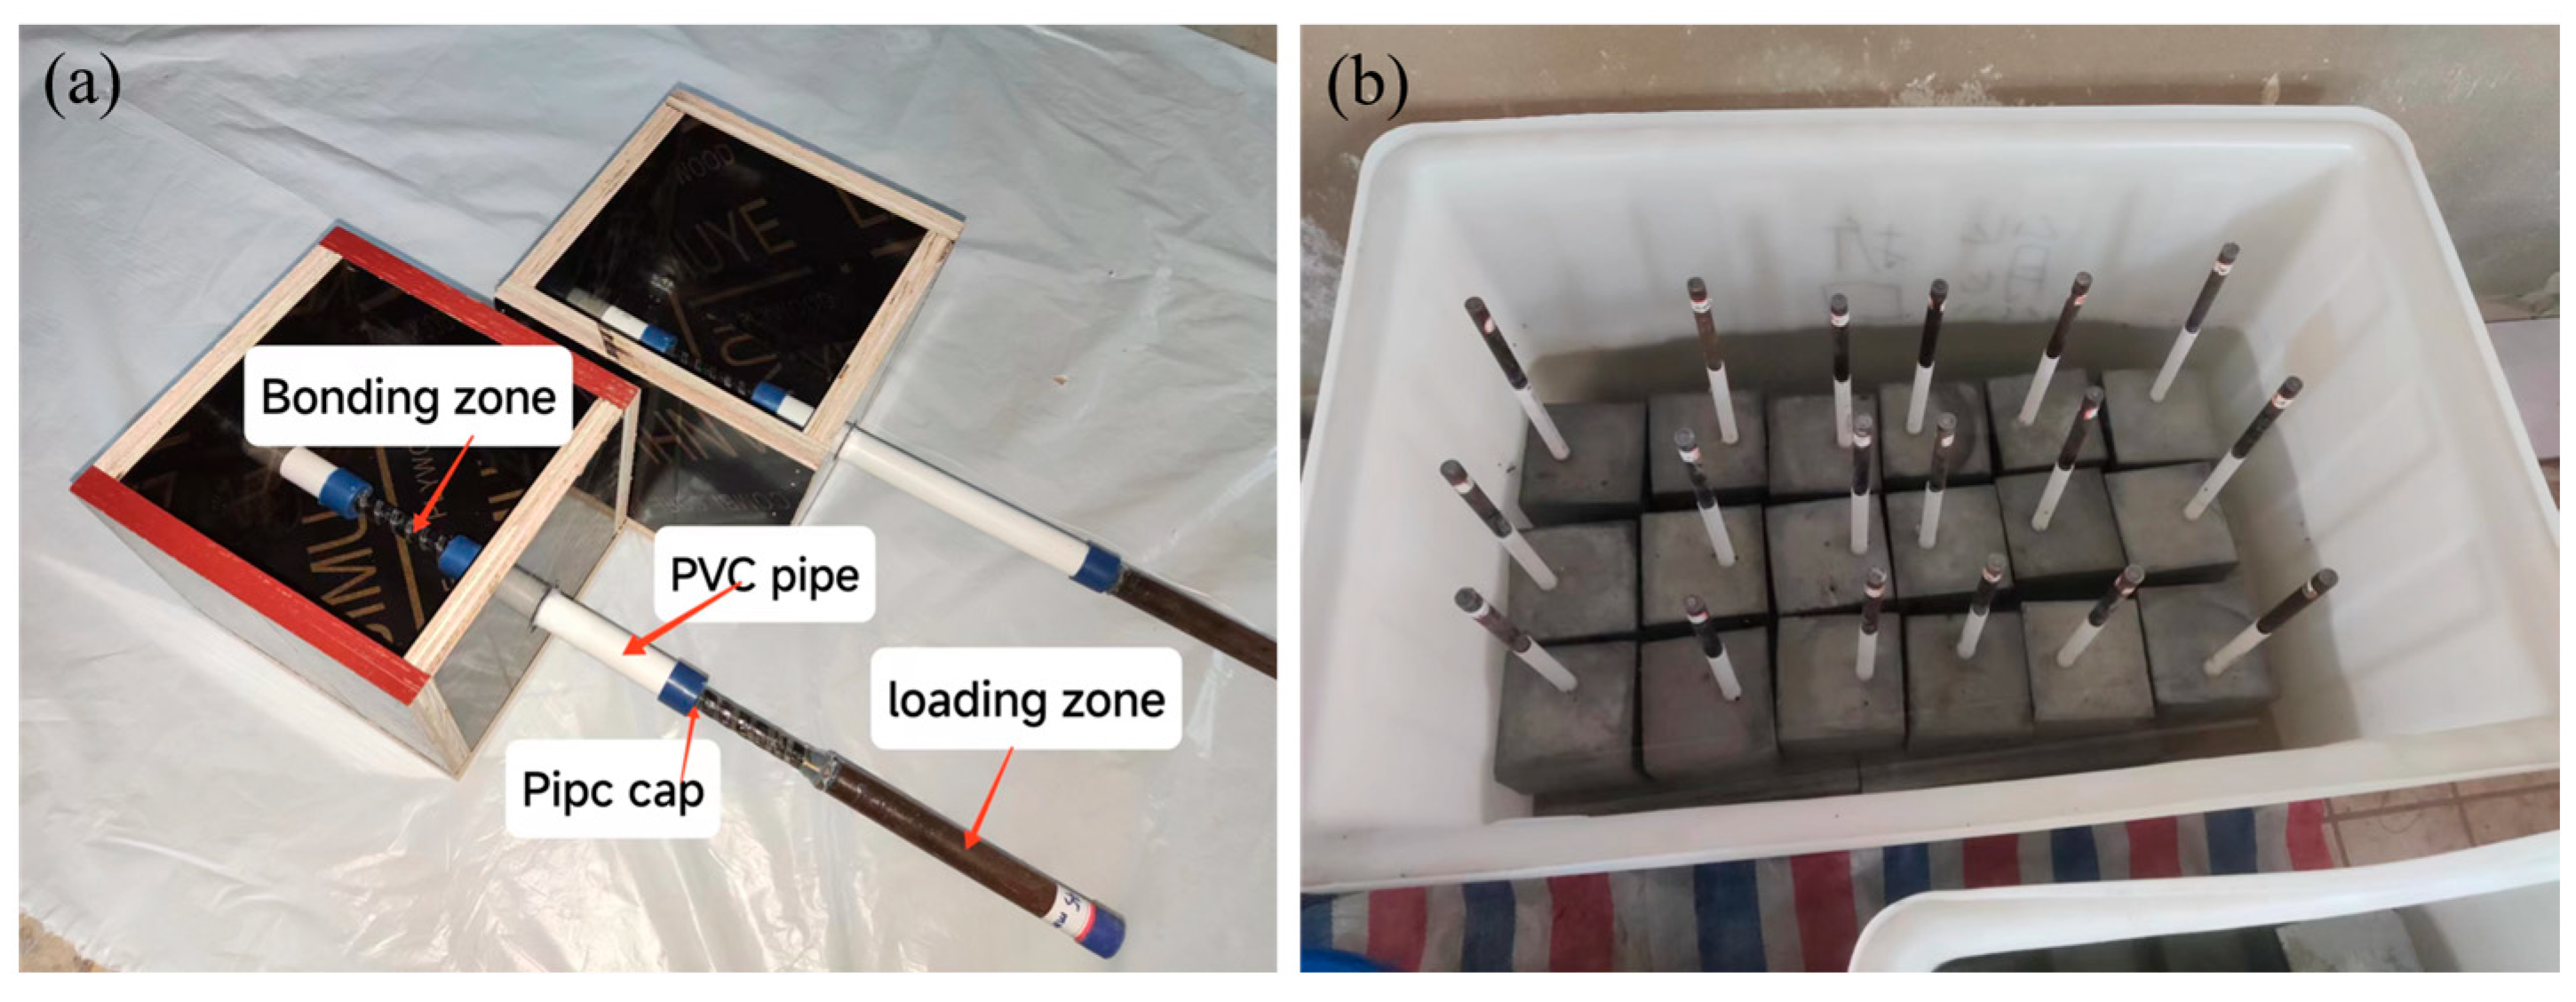
2.2. Specimen Preparation
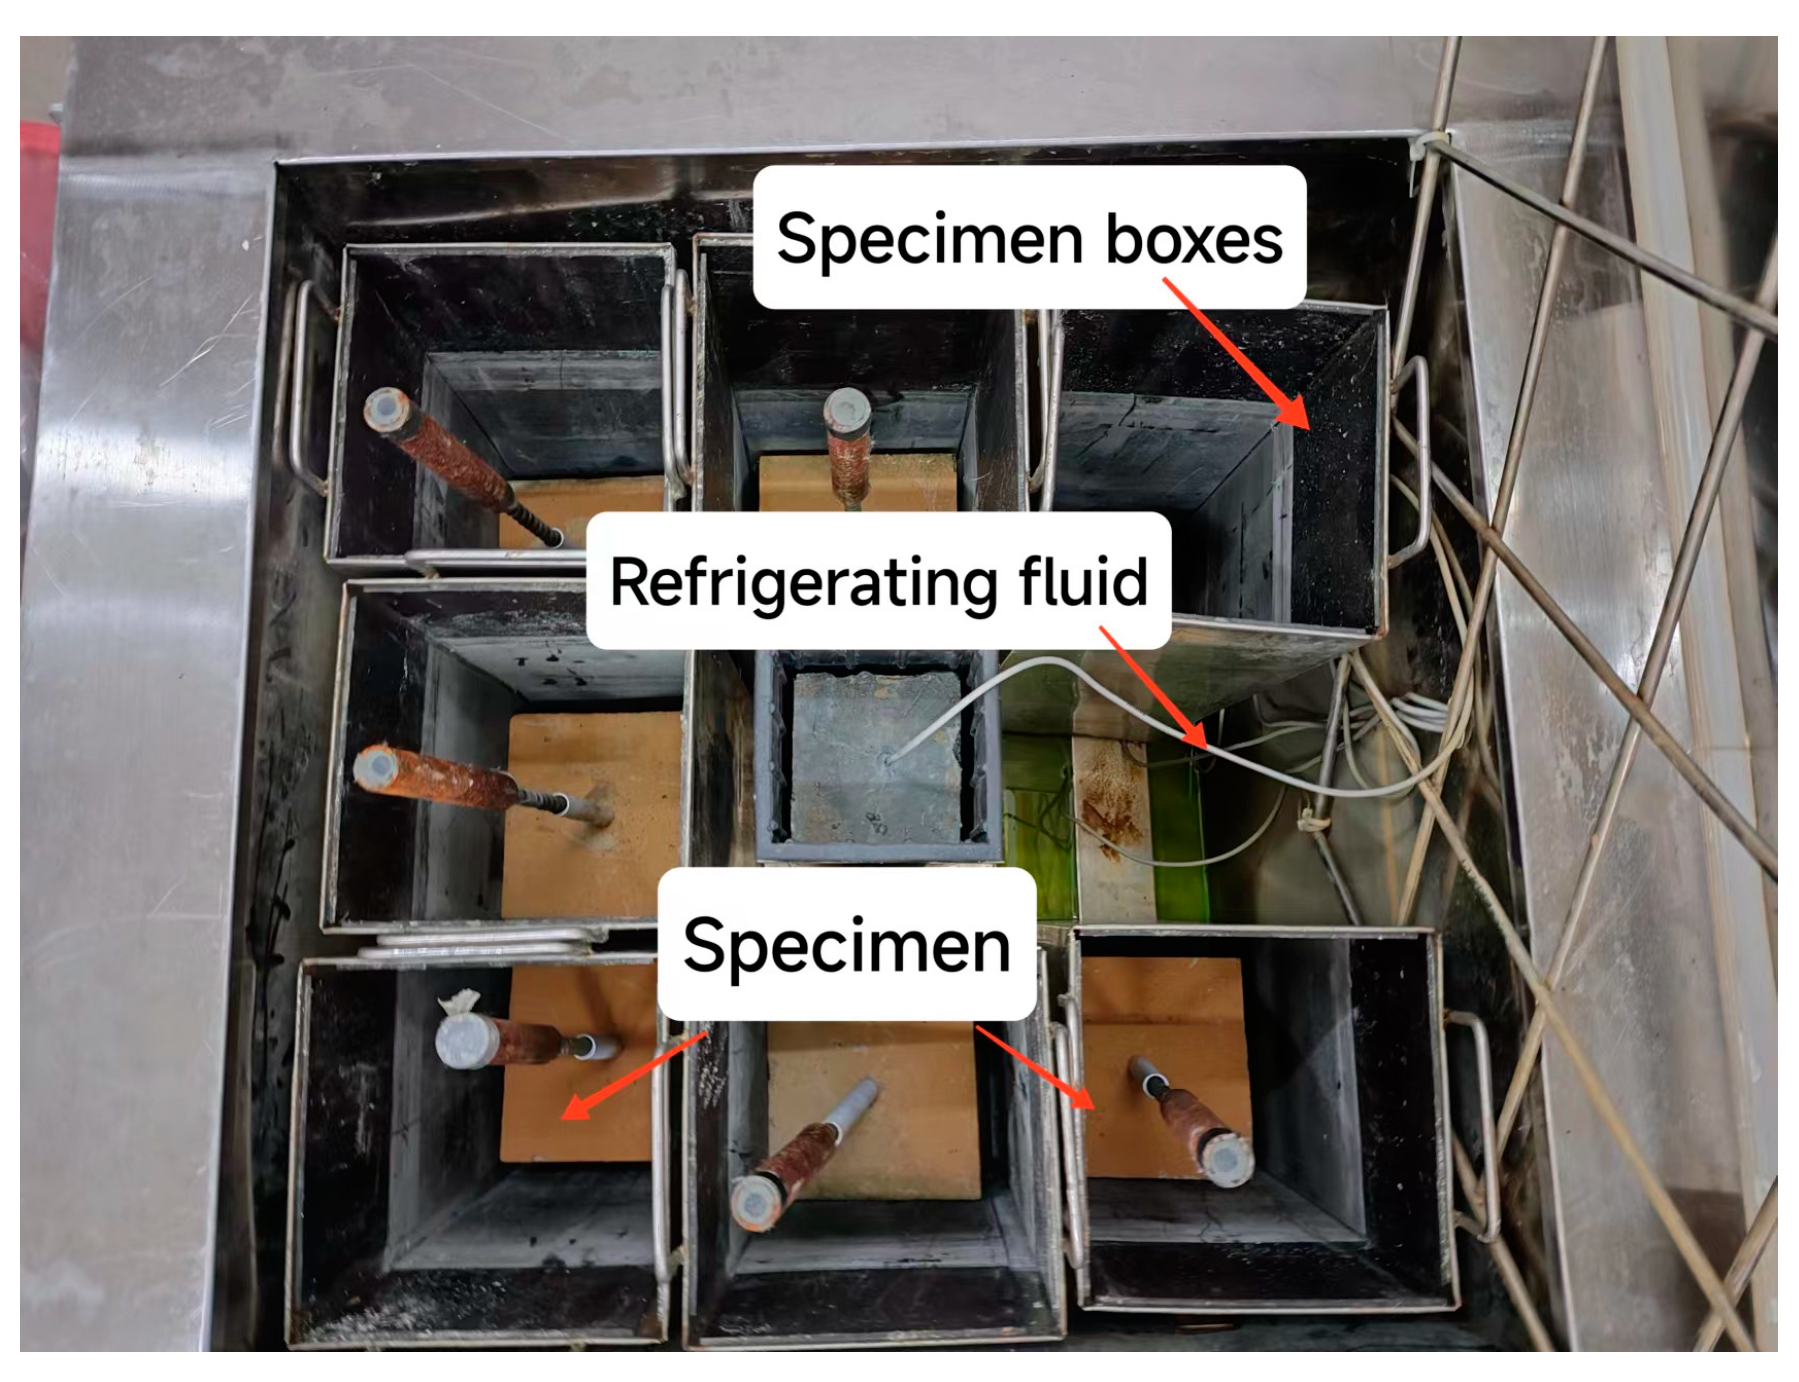
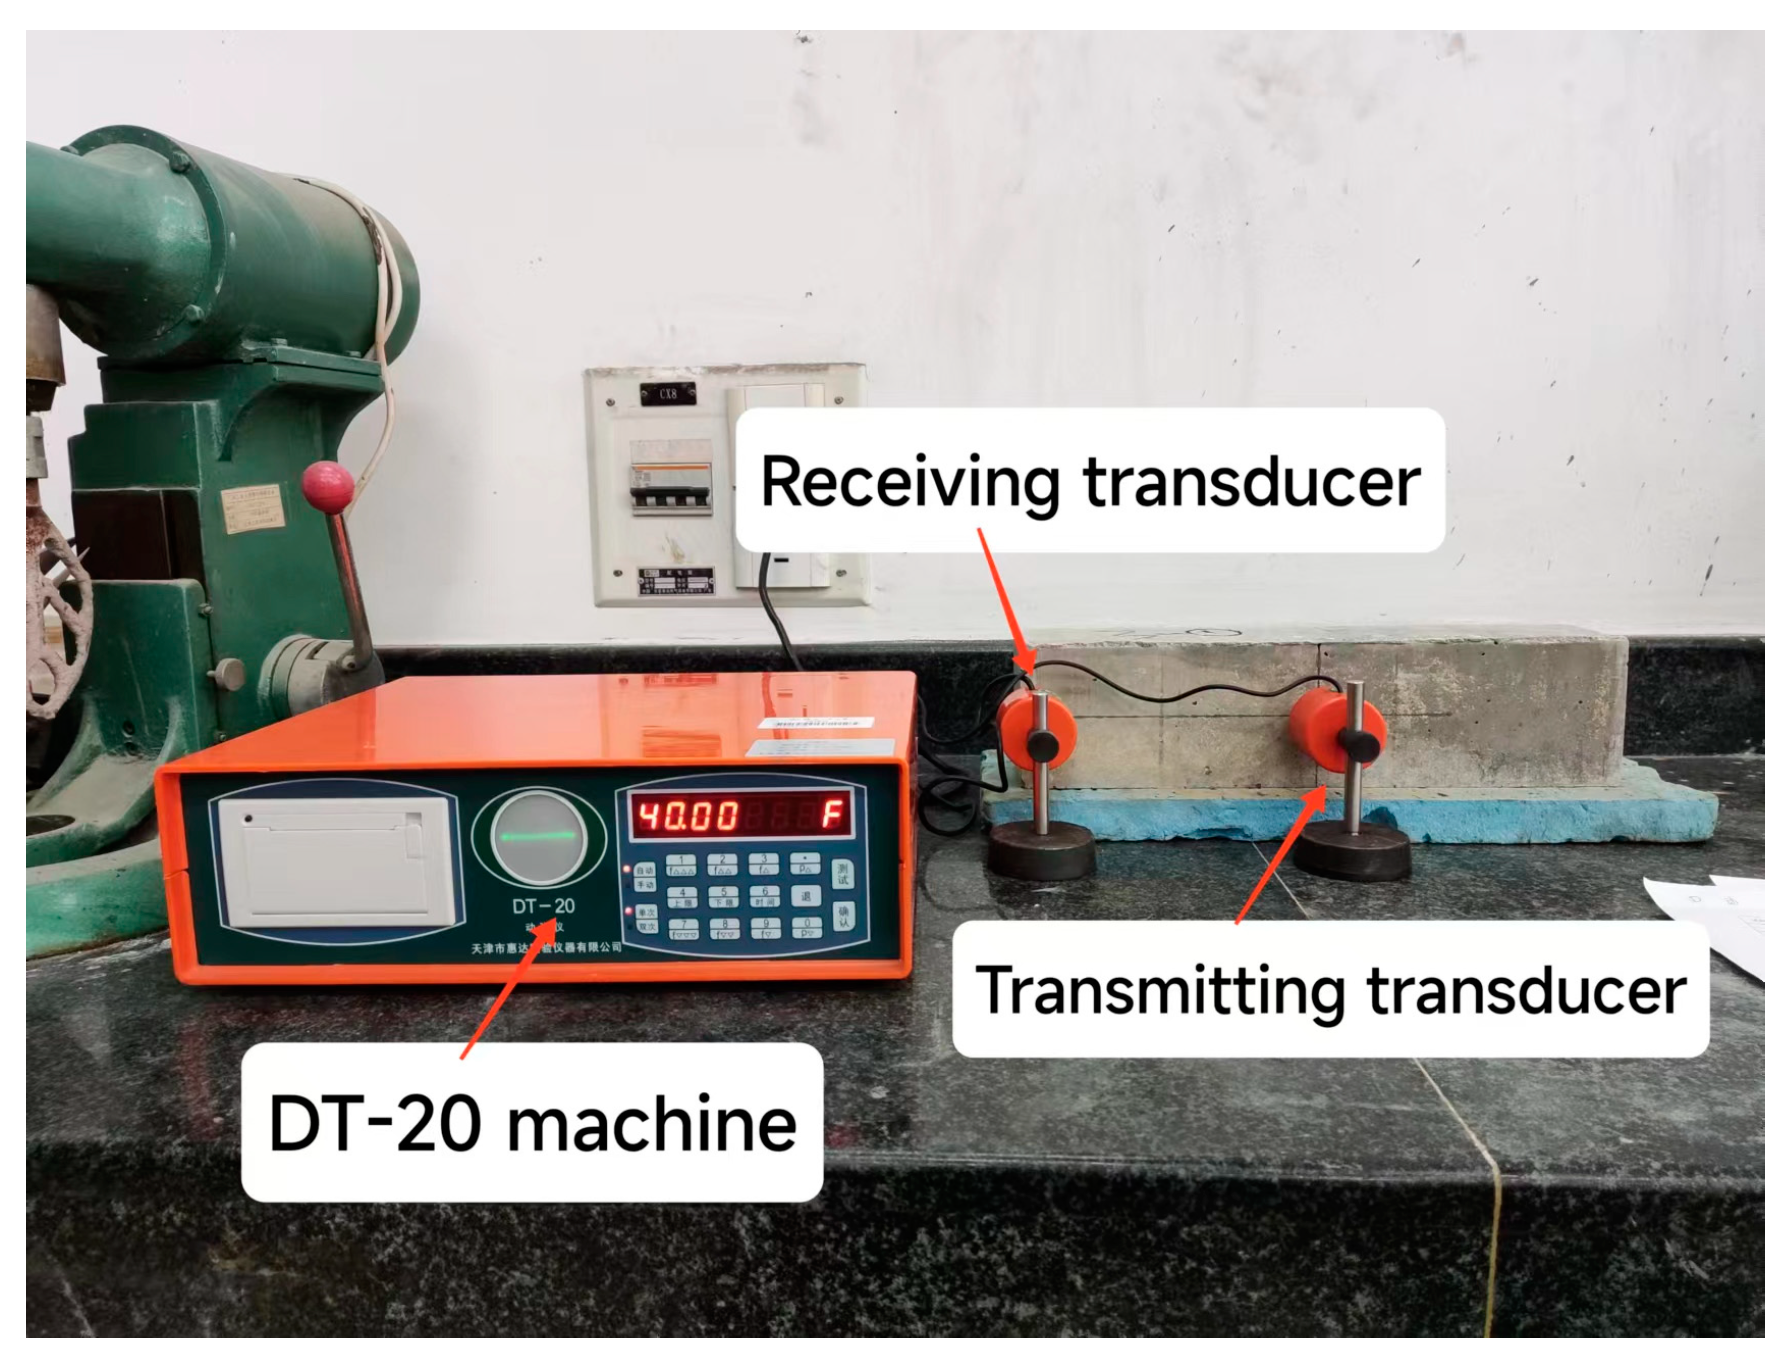
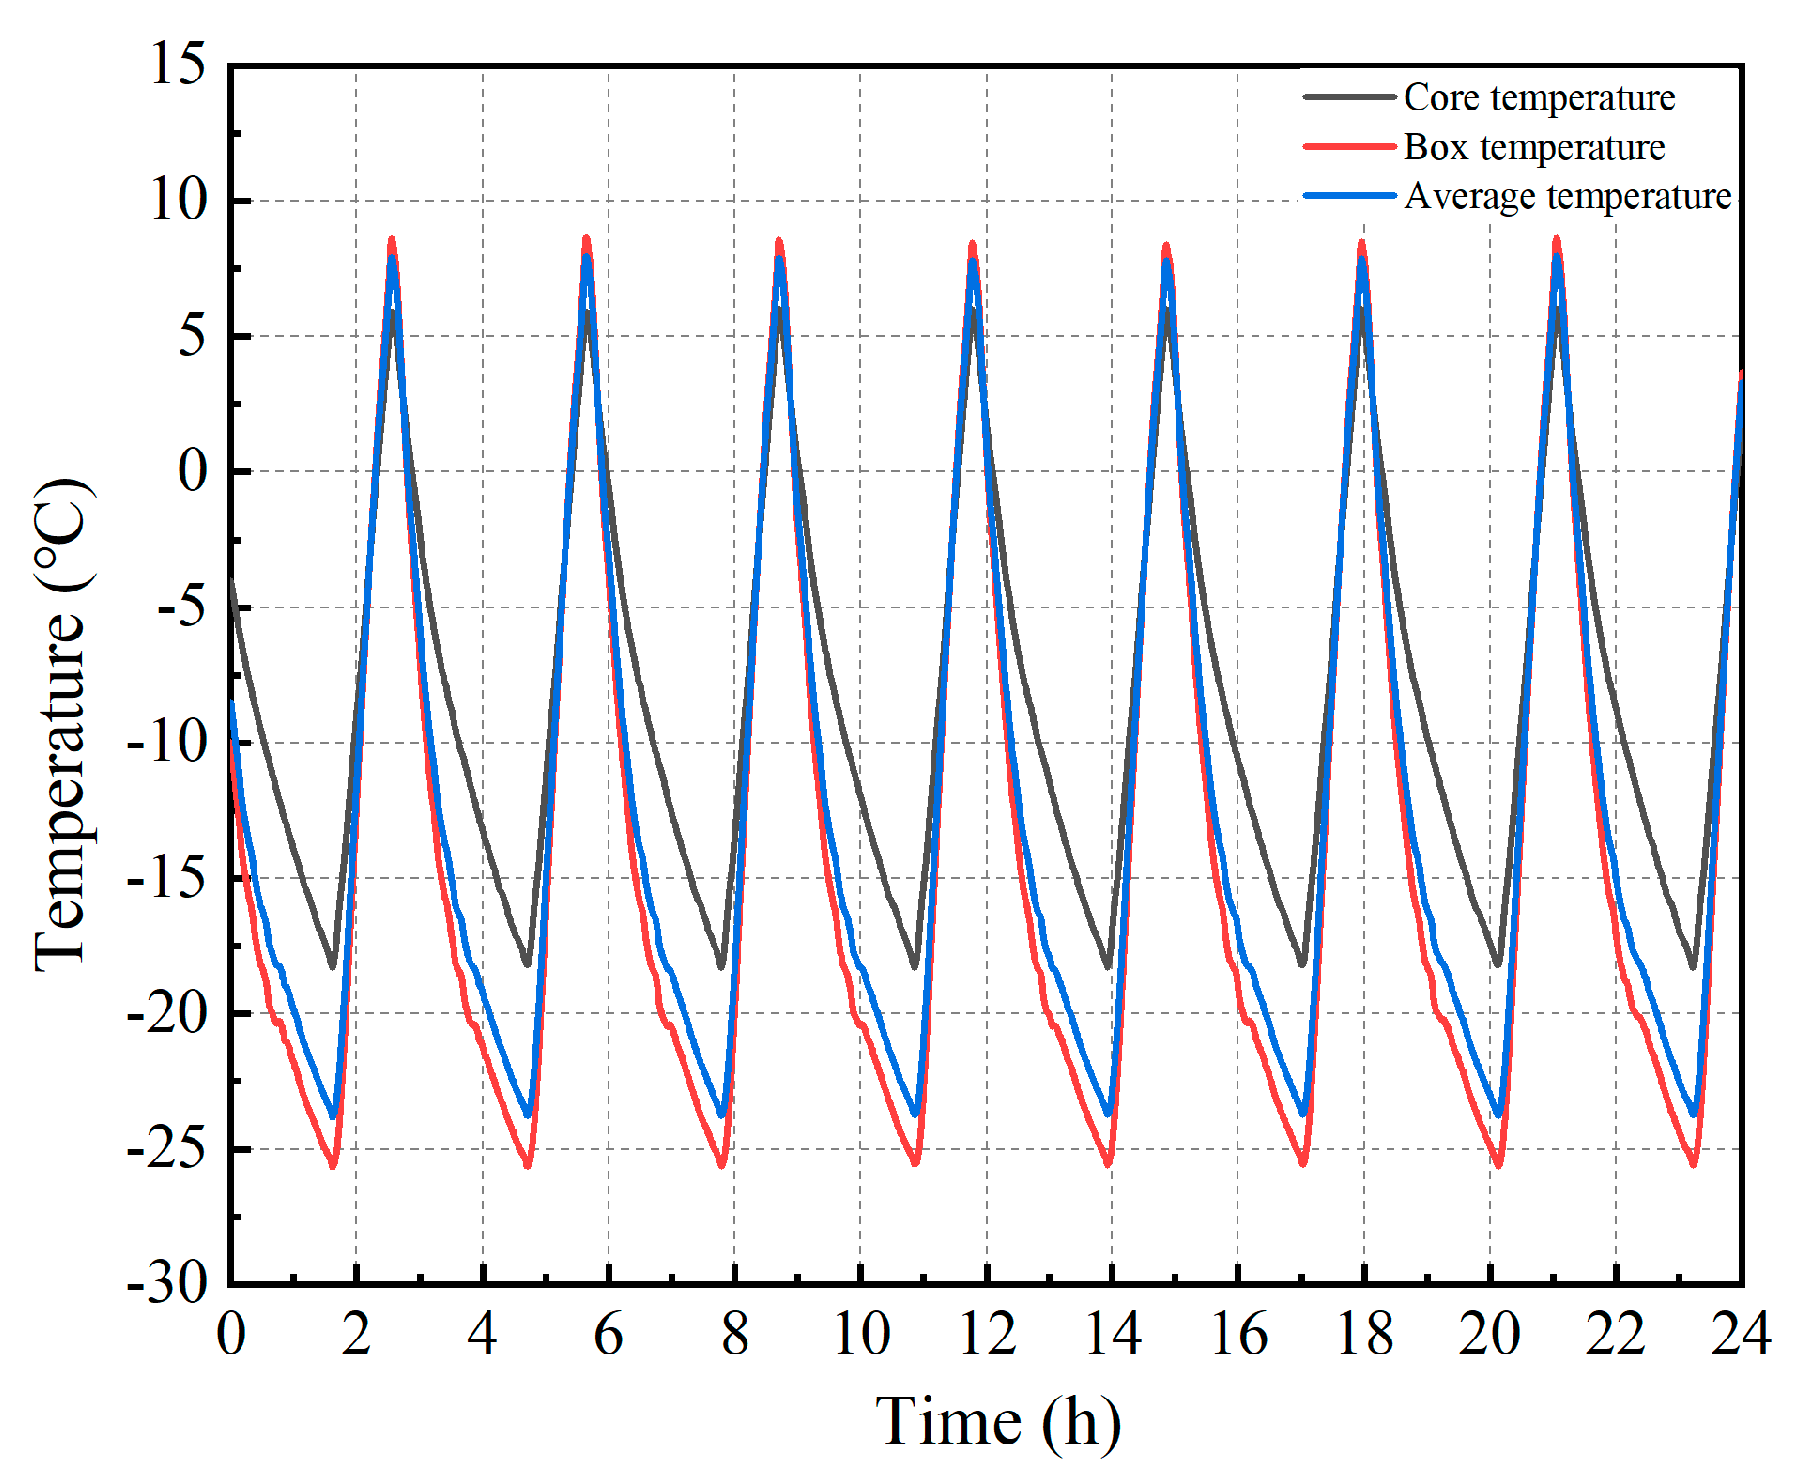
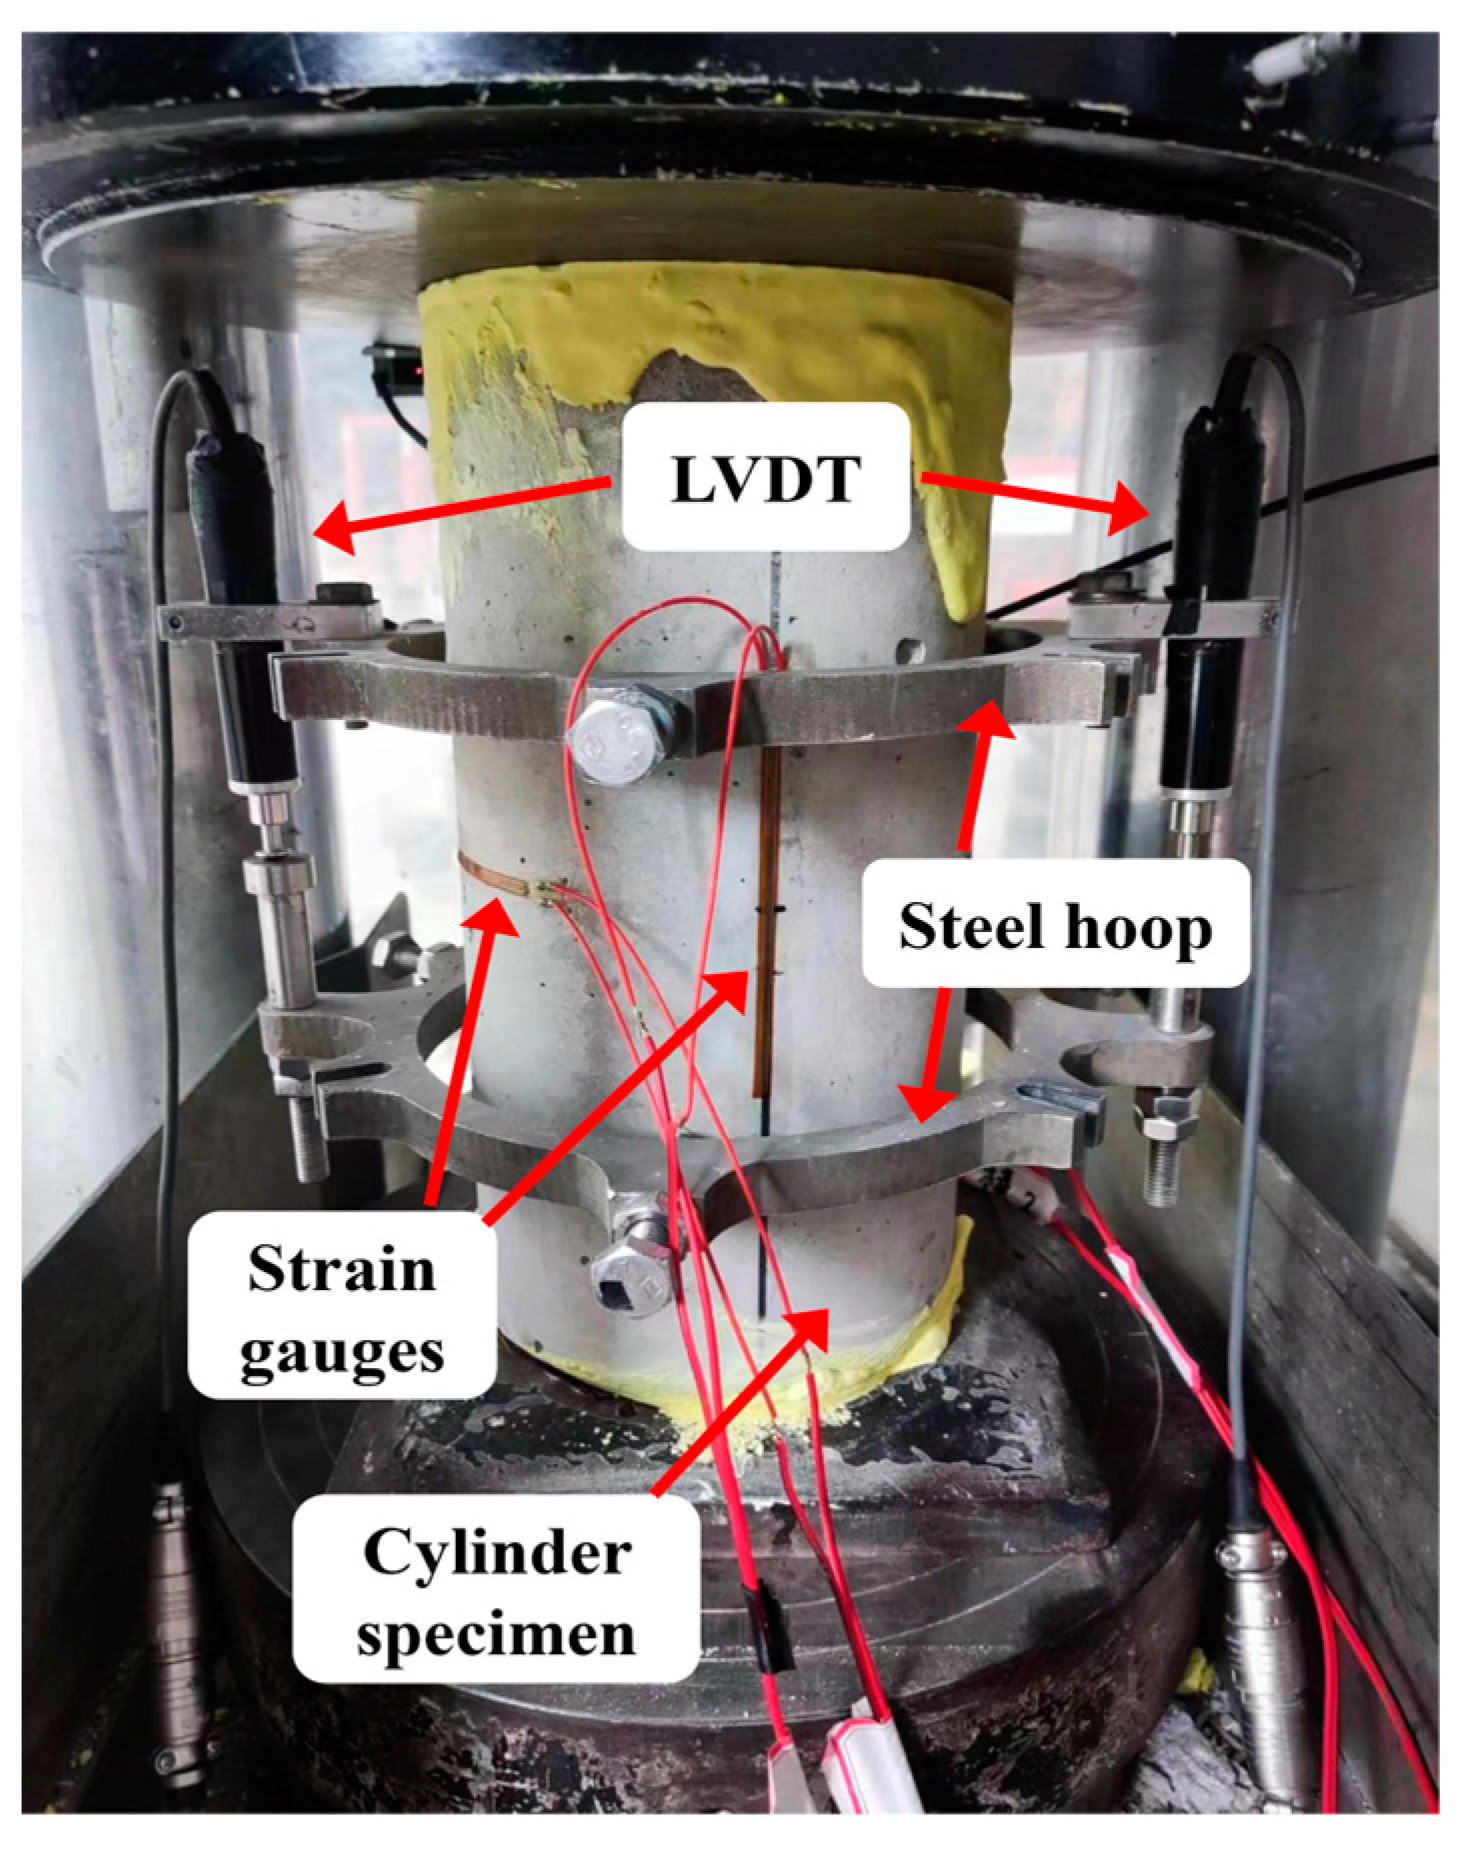
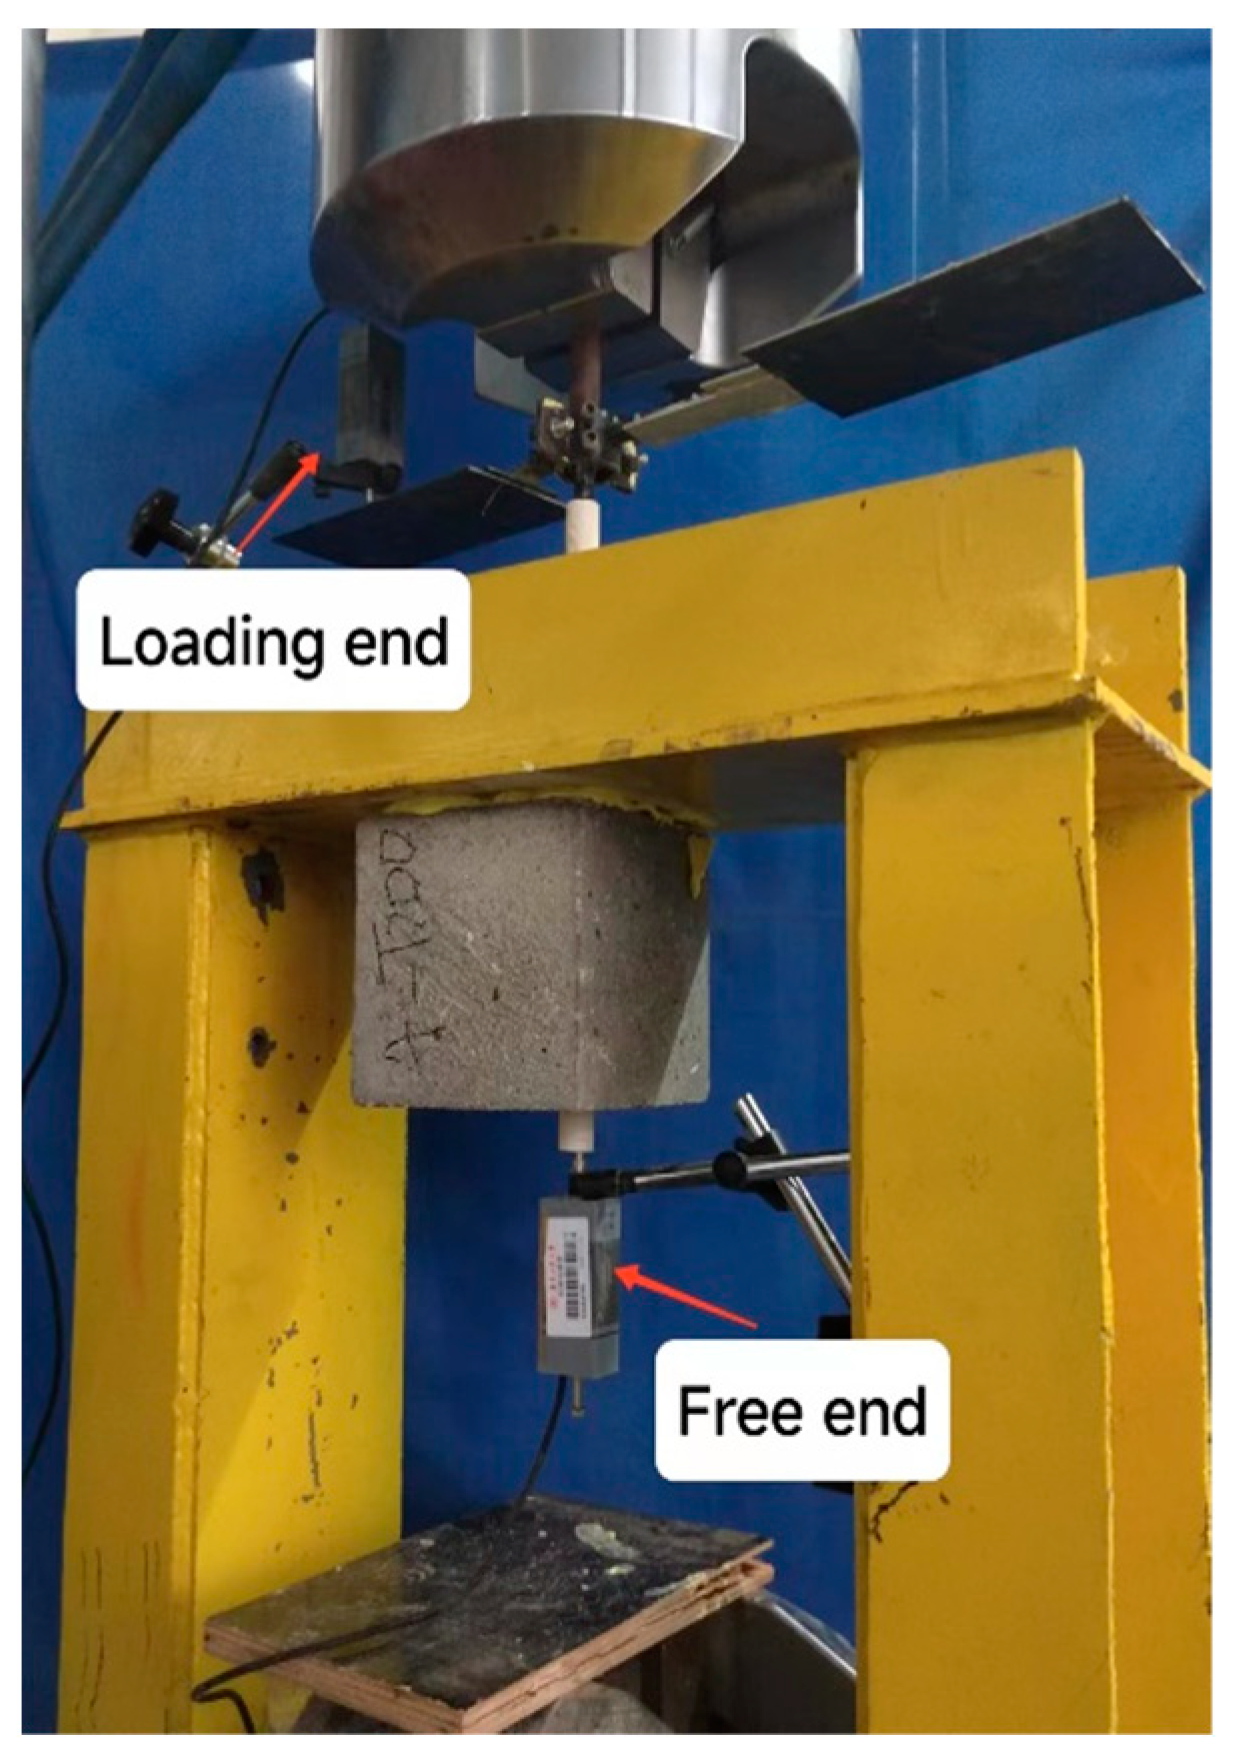
In this study, glass fiber and expansion agent were mixed into seawater sea-sand concrete to investigate their impact on the frost resistance of the concrete. The mixture components of the seawater sea-sand concrete are represented by F-EA, where F0 and F0.3 denote the glass fiber admixture of 0 and 0.3%, respectively (referring to the volume of glass fiber as a percentage of the total volume of sea-sand). Similarly, EA0 and EA1 represent the expansion agent admixture of 0 and 1%, respectively (referring to the volume of the expansion agent as a percentage of the total volume). The specified proportions included a water–cement ratio of 0.42, a slurry volume ratio of 40%, and a fine aggregate to coarse aggregate volume ratio of 1, as shown in Table 3.
Five different numbers of freezing–thawing cycles T (0, 50, 100, 150, and 200) and four different thicknesses of the concrete protective layer c (30 mm, 35 mm, 40 mm, and 45 mm) were used as the two research variables. This resulted in a total of 13 experimental groups, with three samples for each group, totaling 39 eccentric drawing specimens. The experimental protocol is detailed in Table 4. The eccentric drawing specimens were composed of 150 mm × 150 mm × 150 mm concrete cubes and 500 mm long SFCB. The bond length was set at 60 mm, equivalent to 5 times the nominal diameter.
In Figure 4a, the mold of the eccentric drawn specimen is illustrated, with the length of the bonded area controlled by the PVC pipe and cap. Following the molding process, the specimens underwent a standard curing procedure in a chamber with a temperature of 20 ± 2 °C and relative humidity exceeding 95% for a duration of 24 days, as shown in Figure 4b. To protect the specimen inside the PVC pipe from direct erosion by freezing–thawing damage, the PVC pipe was filled with paraffin. Subsequently, the specimen was immersed in water at a temperature of 20 ± 5 °C for 4 days, ensuring the water surface was 20 mm higher than the specimen. This step aimed to achieve a heavily saturated state for the SSSC. After completing the freezing–thawing cycles, the loading zone of the specimens was anchored using seamless steel pipes.
Fifteen cylindrical specimens with dimensions Ø 150 mm × 300 mm were prepared to investigate the impact of the number of freezing–thawing cycles on compressive strength. Additionally, 15 rectangular specimens with dimensions 100 mm × 100 mm × 400 mm were prepared specifically to study the effect of the number of freezing–thawing cycles on the dynamic modulus of elasticity.

2.3. Test Methods

The freeze–thaw test in this study employed the rapid freeze–thaw method. As shown in Figure 5, the rapid freeze–thaw testing machine TDRF-II was utilized to subject the drawing specimen to freeze–thaw cycle actions. The thawing temperature was maintained at 5 ± 2 °C, and the freezing temperature was set at −18 ± 2 °C. Every single freezing–thawing cycle lasted for 3–4 h, with the cooling time (the process of the inner core of specimen temperature decreasing from 5 °C to −18 °C) being greater than the freezing time by 1/2. The warming time (the process of the inner core of specimen temperature increasing from −18 °C to 5 °C) was also greater than 1/2 of the thawing time. The freezing and thawing conversion time was kept below 10 min. The temperature–time curve for the freezing and thawing cycle process is illustrated in Figure 6.
The axial compression test of SSSC was conducted using the MATEST universal testing machine. The deformation in the axial compression region of the cylindrical specimen was measured using collars and linear displacement testers (LVDTs), as depicted in Figure 7. The dynamic modulus of elasticity of SSSC was carried out using a DT-20 dynamic modulus of elasticity tester, and the fundamental vibration frequency was measured and determined by the resonance method as shown in Figure 8. Furthermore, the eccentric pullout test was carried out using the MTS322 testing machine with displacement loading, as illustrated in Figure 9.

3. Results and Discussion

3.1. Mechanical Properties of SSSC in Freezing–Thawing Environment

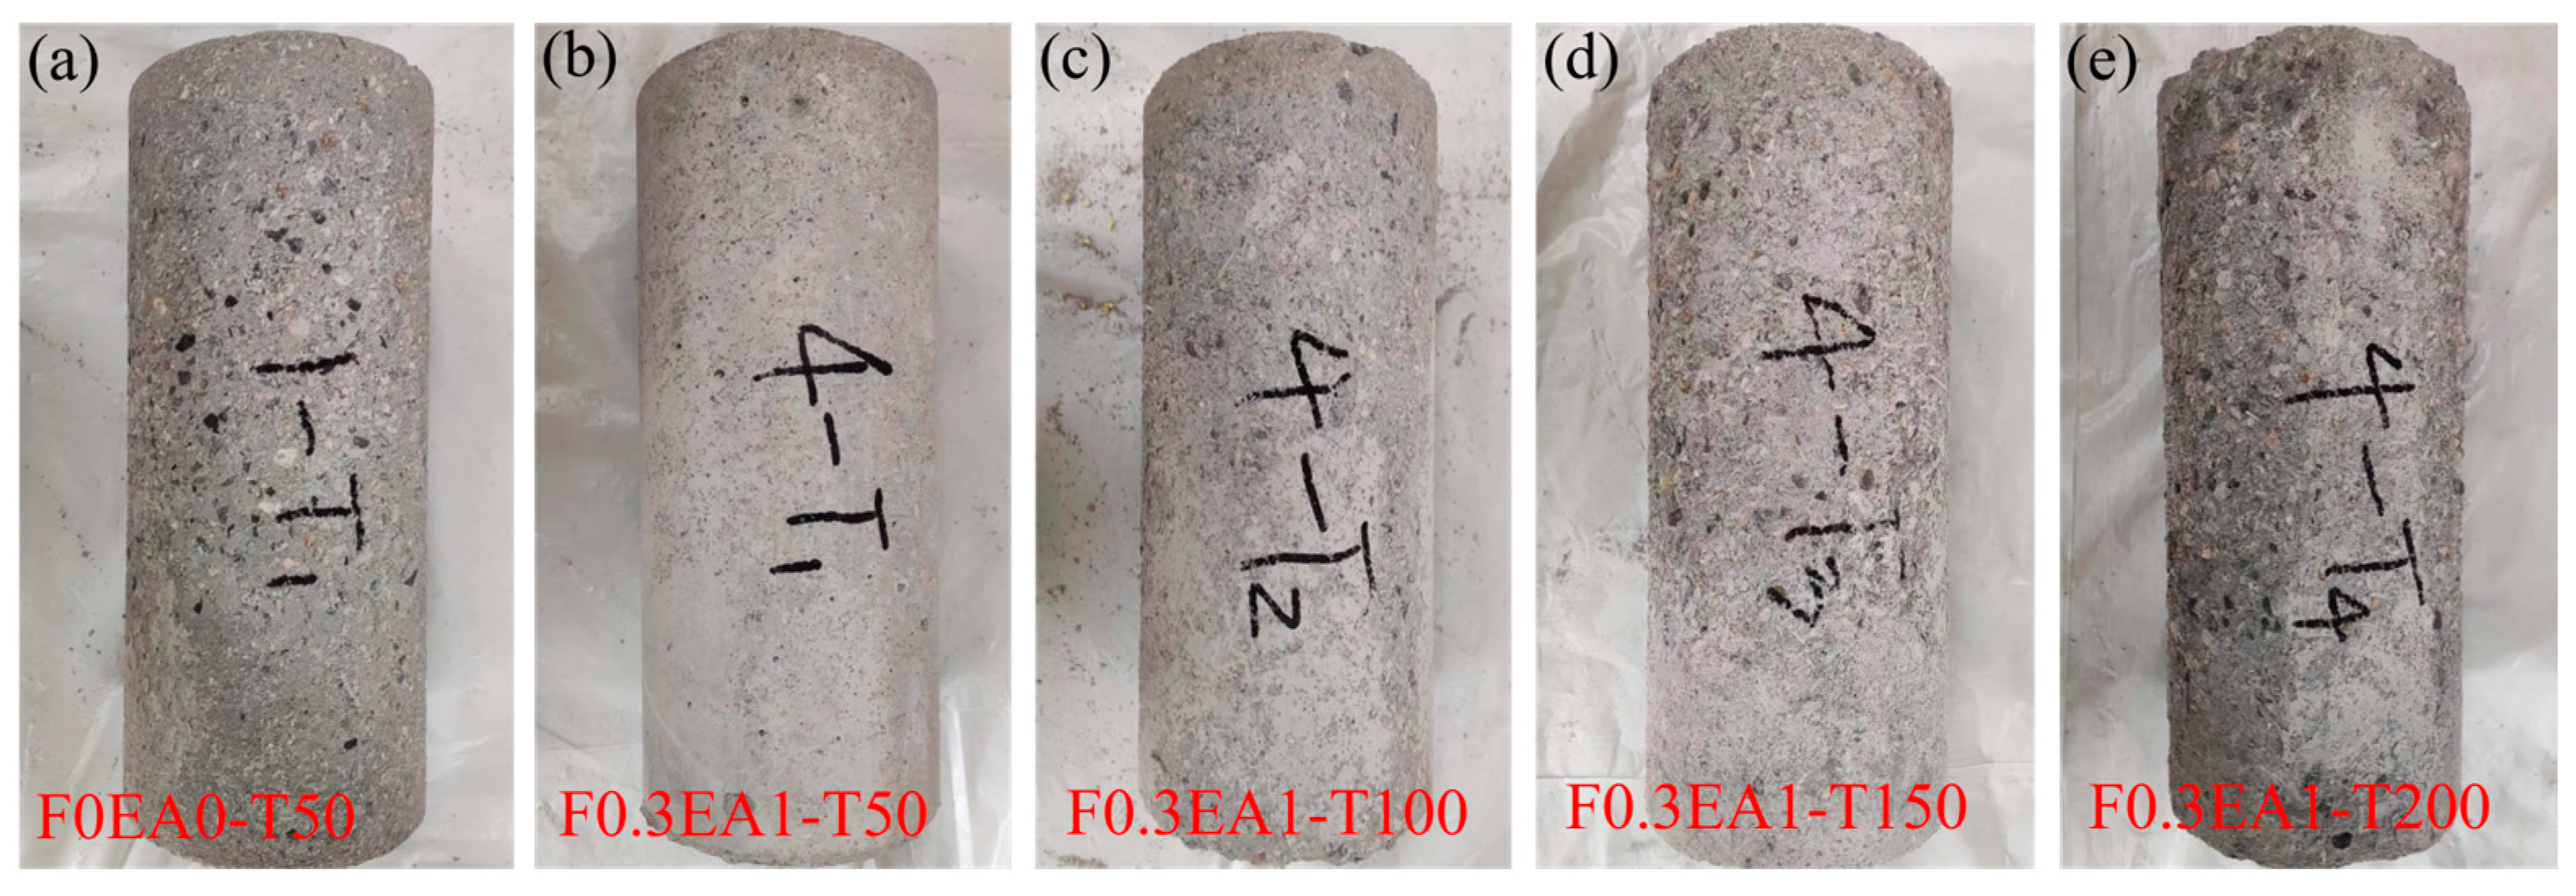
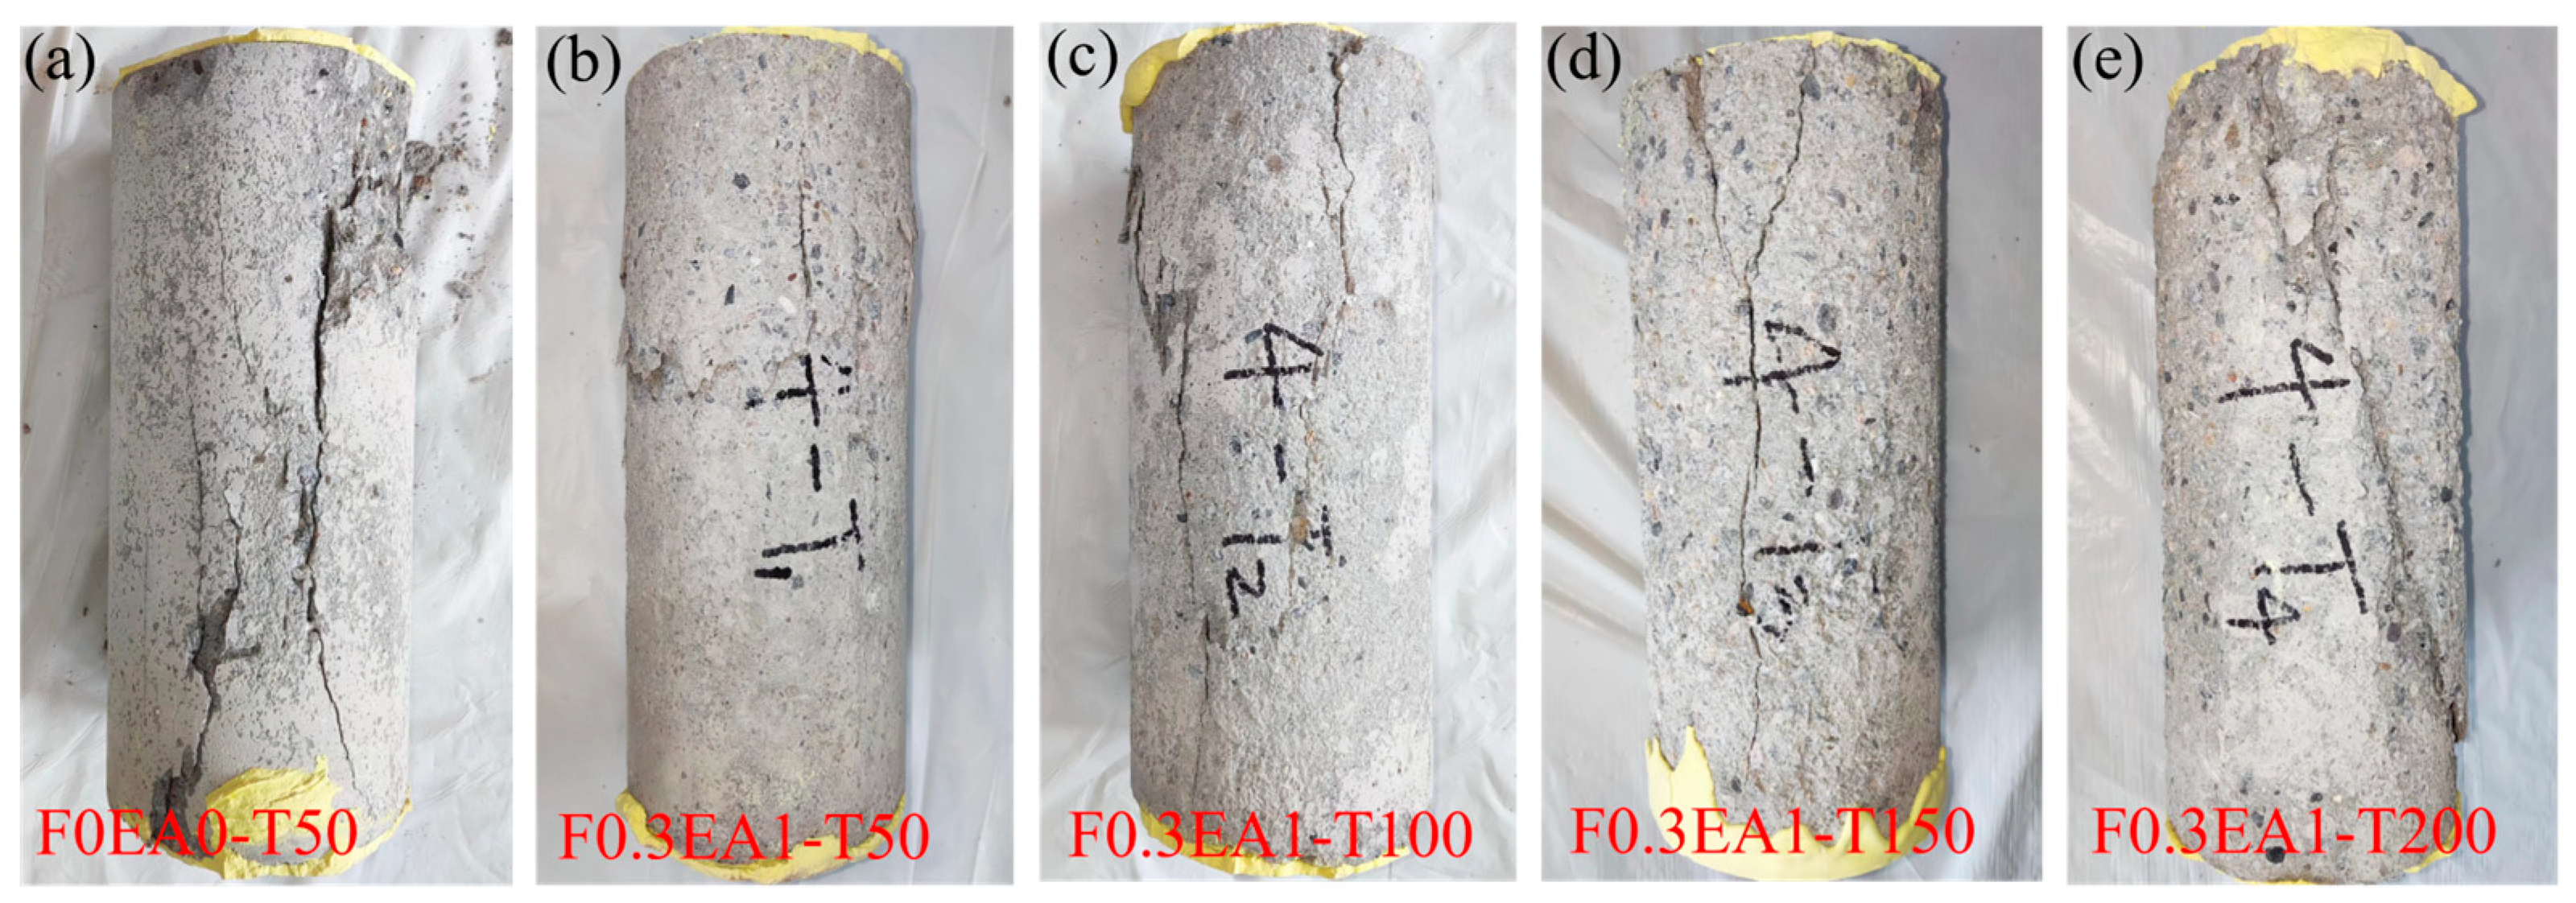
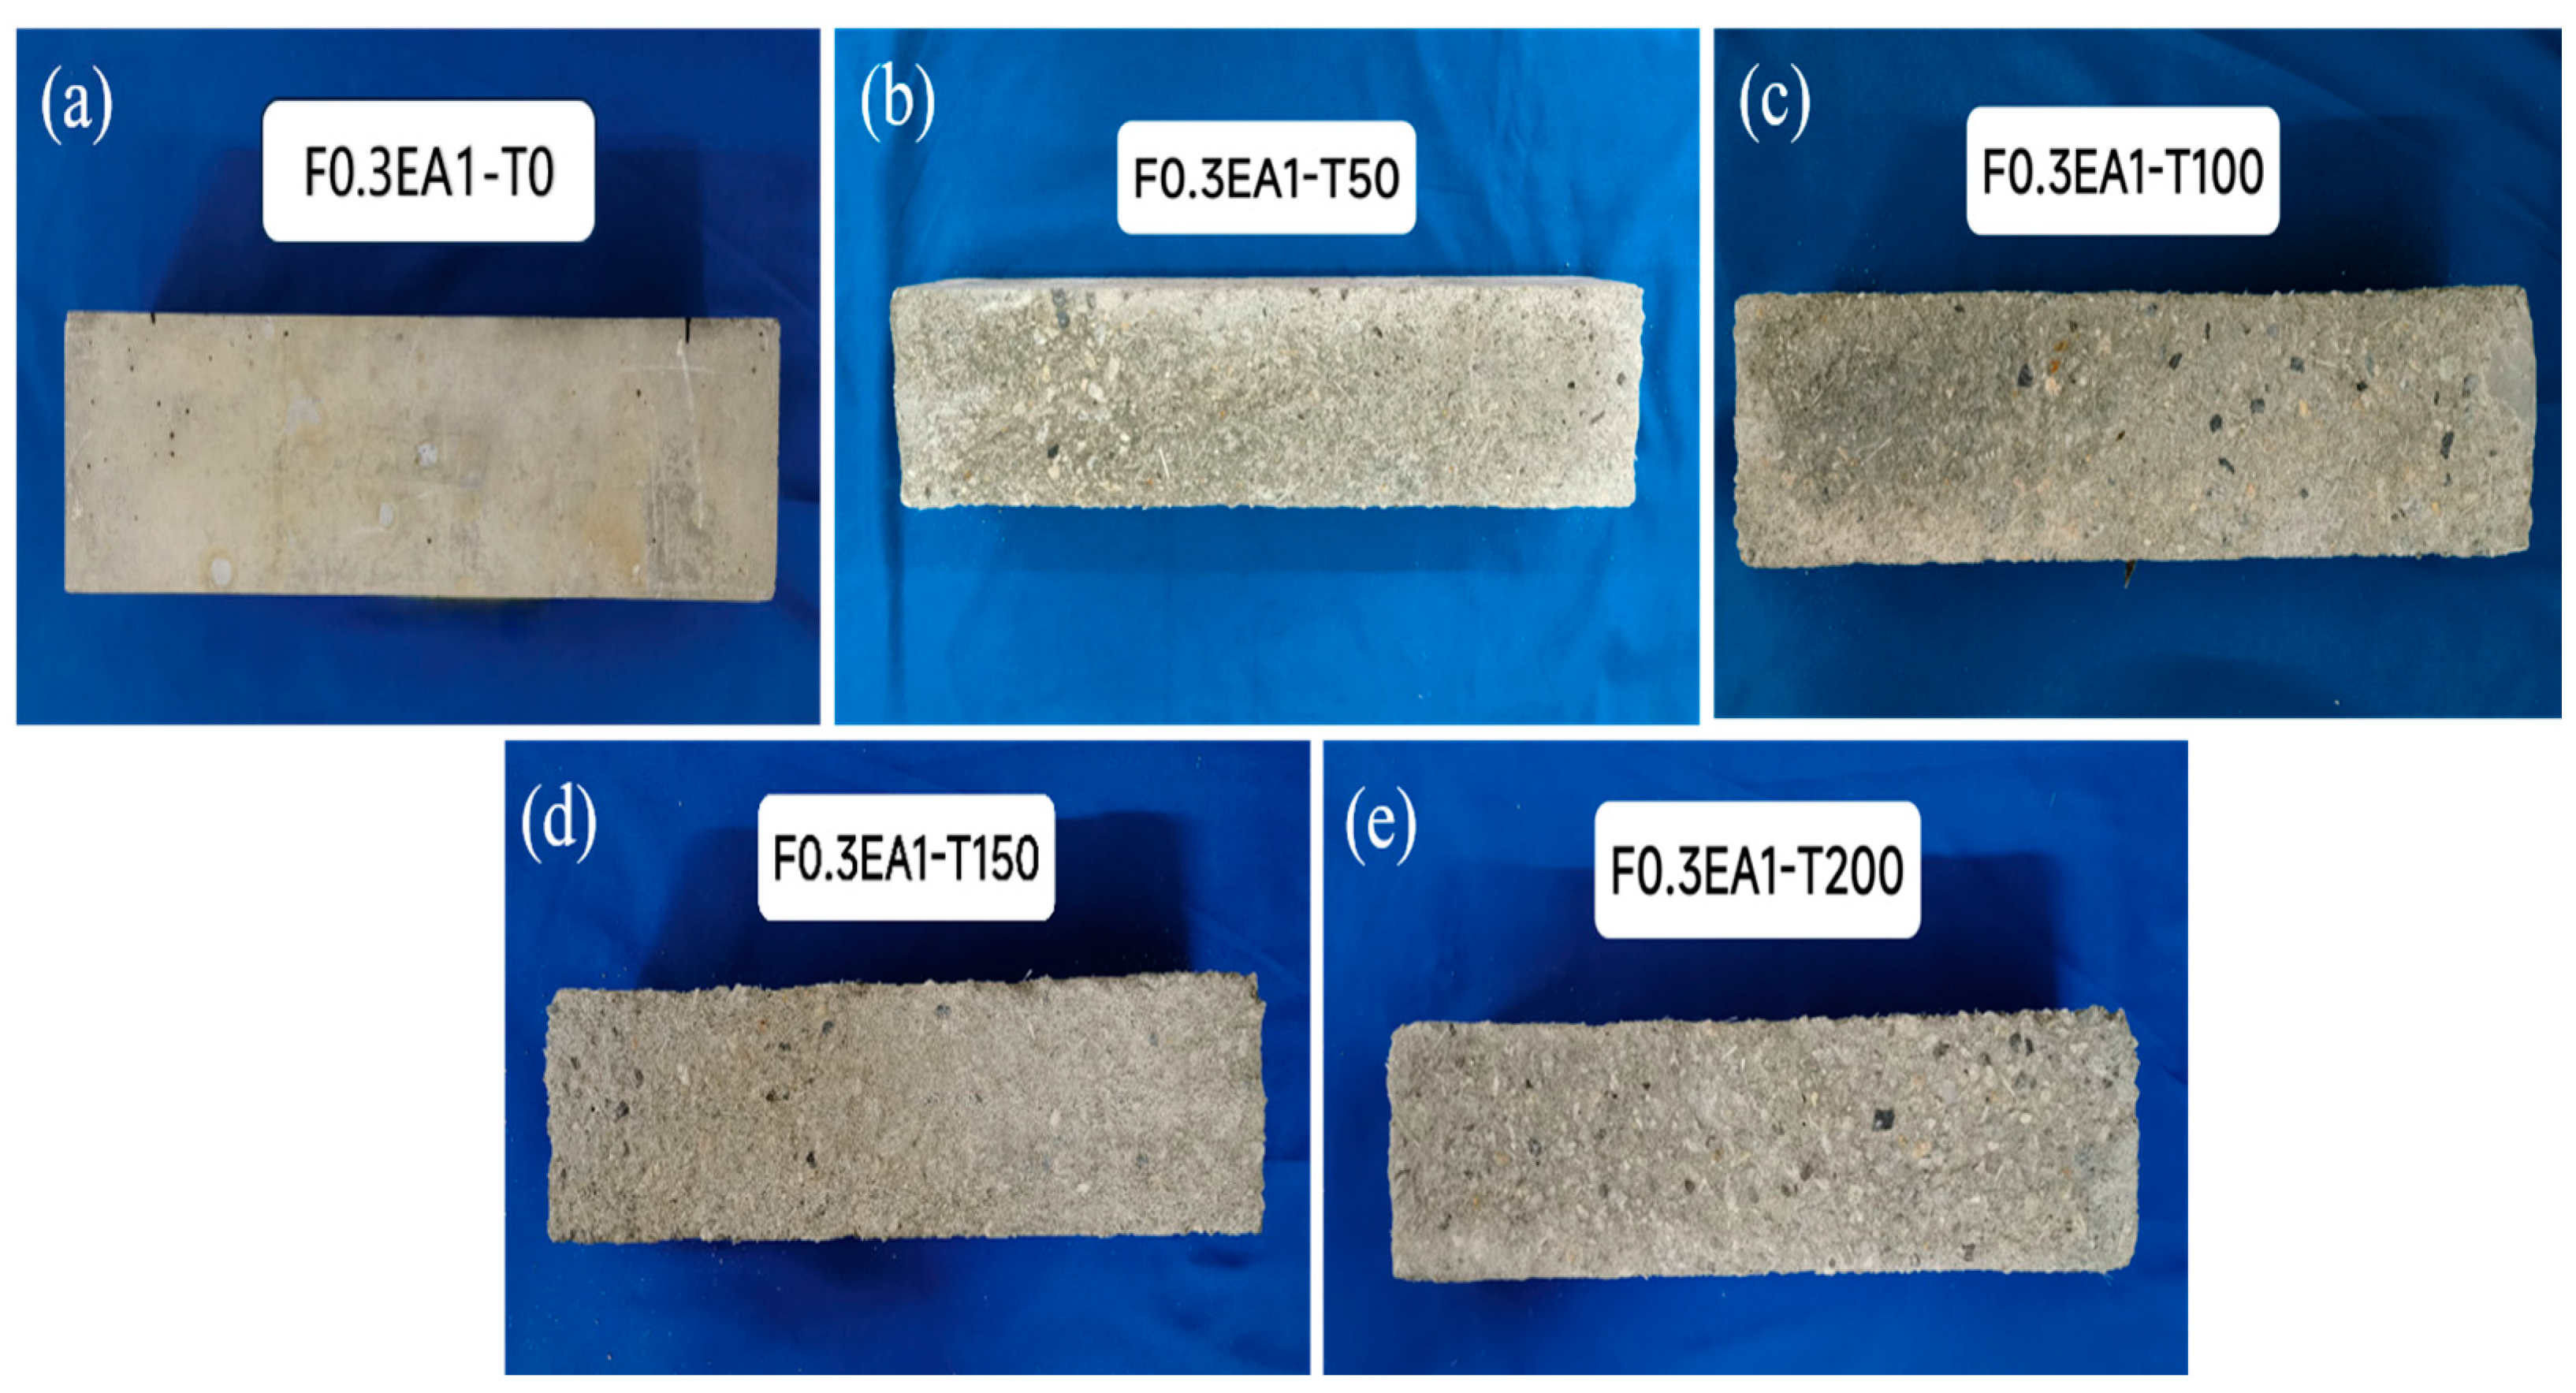
3.1.1. Failure Modes

Figure 10 shows the surface morphology of the specimens subjected to varying numbers of freezing–thawing cycles. In F0.3EA1 after 50 freezing–thawing cycles, there is no discernible change in the morphology, implying that the freezing and thawing effects are limited at this stage, and the concrete surface remains unaffected. However, after 100 freezing–thawing cycles, the surface mortar begins to detach, and microcracks become evident. Subsequently, after 150 freezing–thawing cycles, extensive spalling of the surface mortar and exposure of coarse aggregates occur. Furthermore, after 200 freezing–thawing cycles, noticeable spalling of the coarse aggregates is observed, resulting in evident surface damage. The freezing–thawing damage initiates from the outer layer and gradually progresses toward the inner layers. Under the repeated influence of hydrostatic pressure and osmotic pressure, the cracks and pores in the specimen progressively propagate from the exterior to the interior. As concrete exhibits internal structure heterogeneity, freezing–thawing damage initially affects the weakest points, leading to crack development [38]. As the cracks and pores continue to propagate and accumulate, spalling of the concrete surface commences. Consequently, the freezing–thawing damage expands from the weak points, ultimately resulting in an enlargement of the spalled concrete area. Compared to seawater sea-sand concrete, the incorporation of glass fiber and expansion agents enhances the ability of concrete to resist freezing–thawing damage.
Compressive tests were conducted on the specimens after 50–200 freezing–thawing cycles, and the damage pattern is illustrated in Figure 11. As the number of freezing–thawing cycles increased, the development of cracks and pores persisted, resulting in a notable deterioration of the mechanical properties of the concrete. Notably, within the range of 50–100 freezing–thawing cycles, the trend of crack deterioration exhibited a more gradual increase. Initially, cracks emerged from weak areas of the specimens, extending in narrow strips toward the center, gradually enlarging and generating new microcracks. Concrete blocks were predominantly dislodged and broken. Following 150 cycles of freezing and thawing, severe damage due to freezing and thawing was observed at both ends of the specimen, with significant exposure of coarse aggregate and spalling of fine aggregate. The unevenness on the surface of both ends necessitated multiple applications of gypsum leveling to rectify. The incremental trend of crack deterioration continued to increase, dislodged concrete debris accumulated, the dislodged area expanded, and broken glass fibers were visible within the cracks. After 200 freezing–thawing cycles, the trend of crack deterioration escalated sharply, accompanied by a substantial increase in the volume of dislodged concrete pieces. The specimen as a whole exhibited diagonal cut damage, with exposed aggregates and a substantial amount of dislodged glass fibers and aggregates. In the freezing–thawing environment, the inclusion of admixed glass fiber and expansion agent demonstrated the ability to delay crack expansion during the compression process of SSSC. However, as the number of freezing–thawing cycles increased, the effectiveness of the glass fiber and expansion agent gradually diminished, and the damage mode shifted from tensile damage to diagonal cut damage.

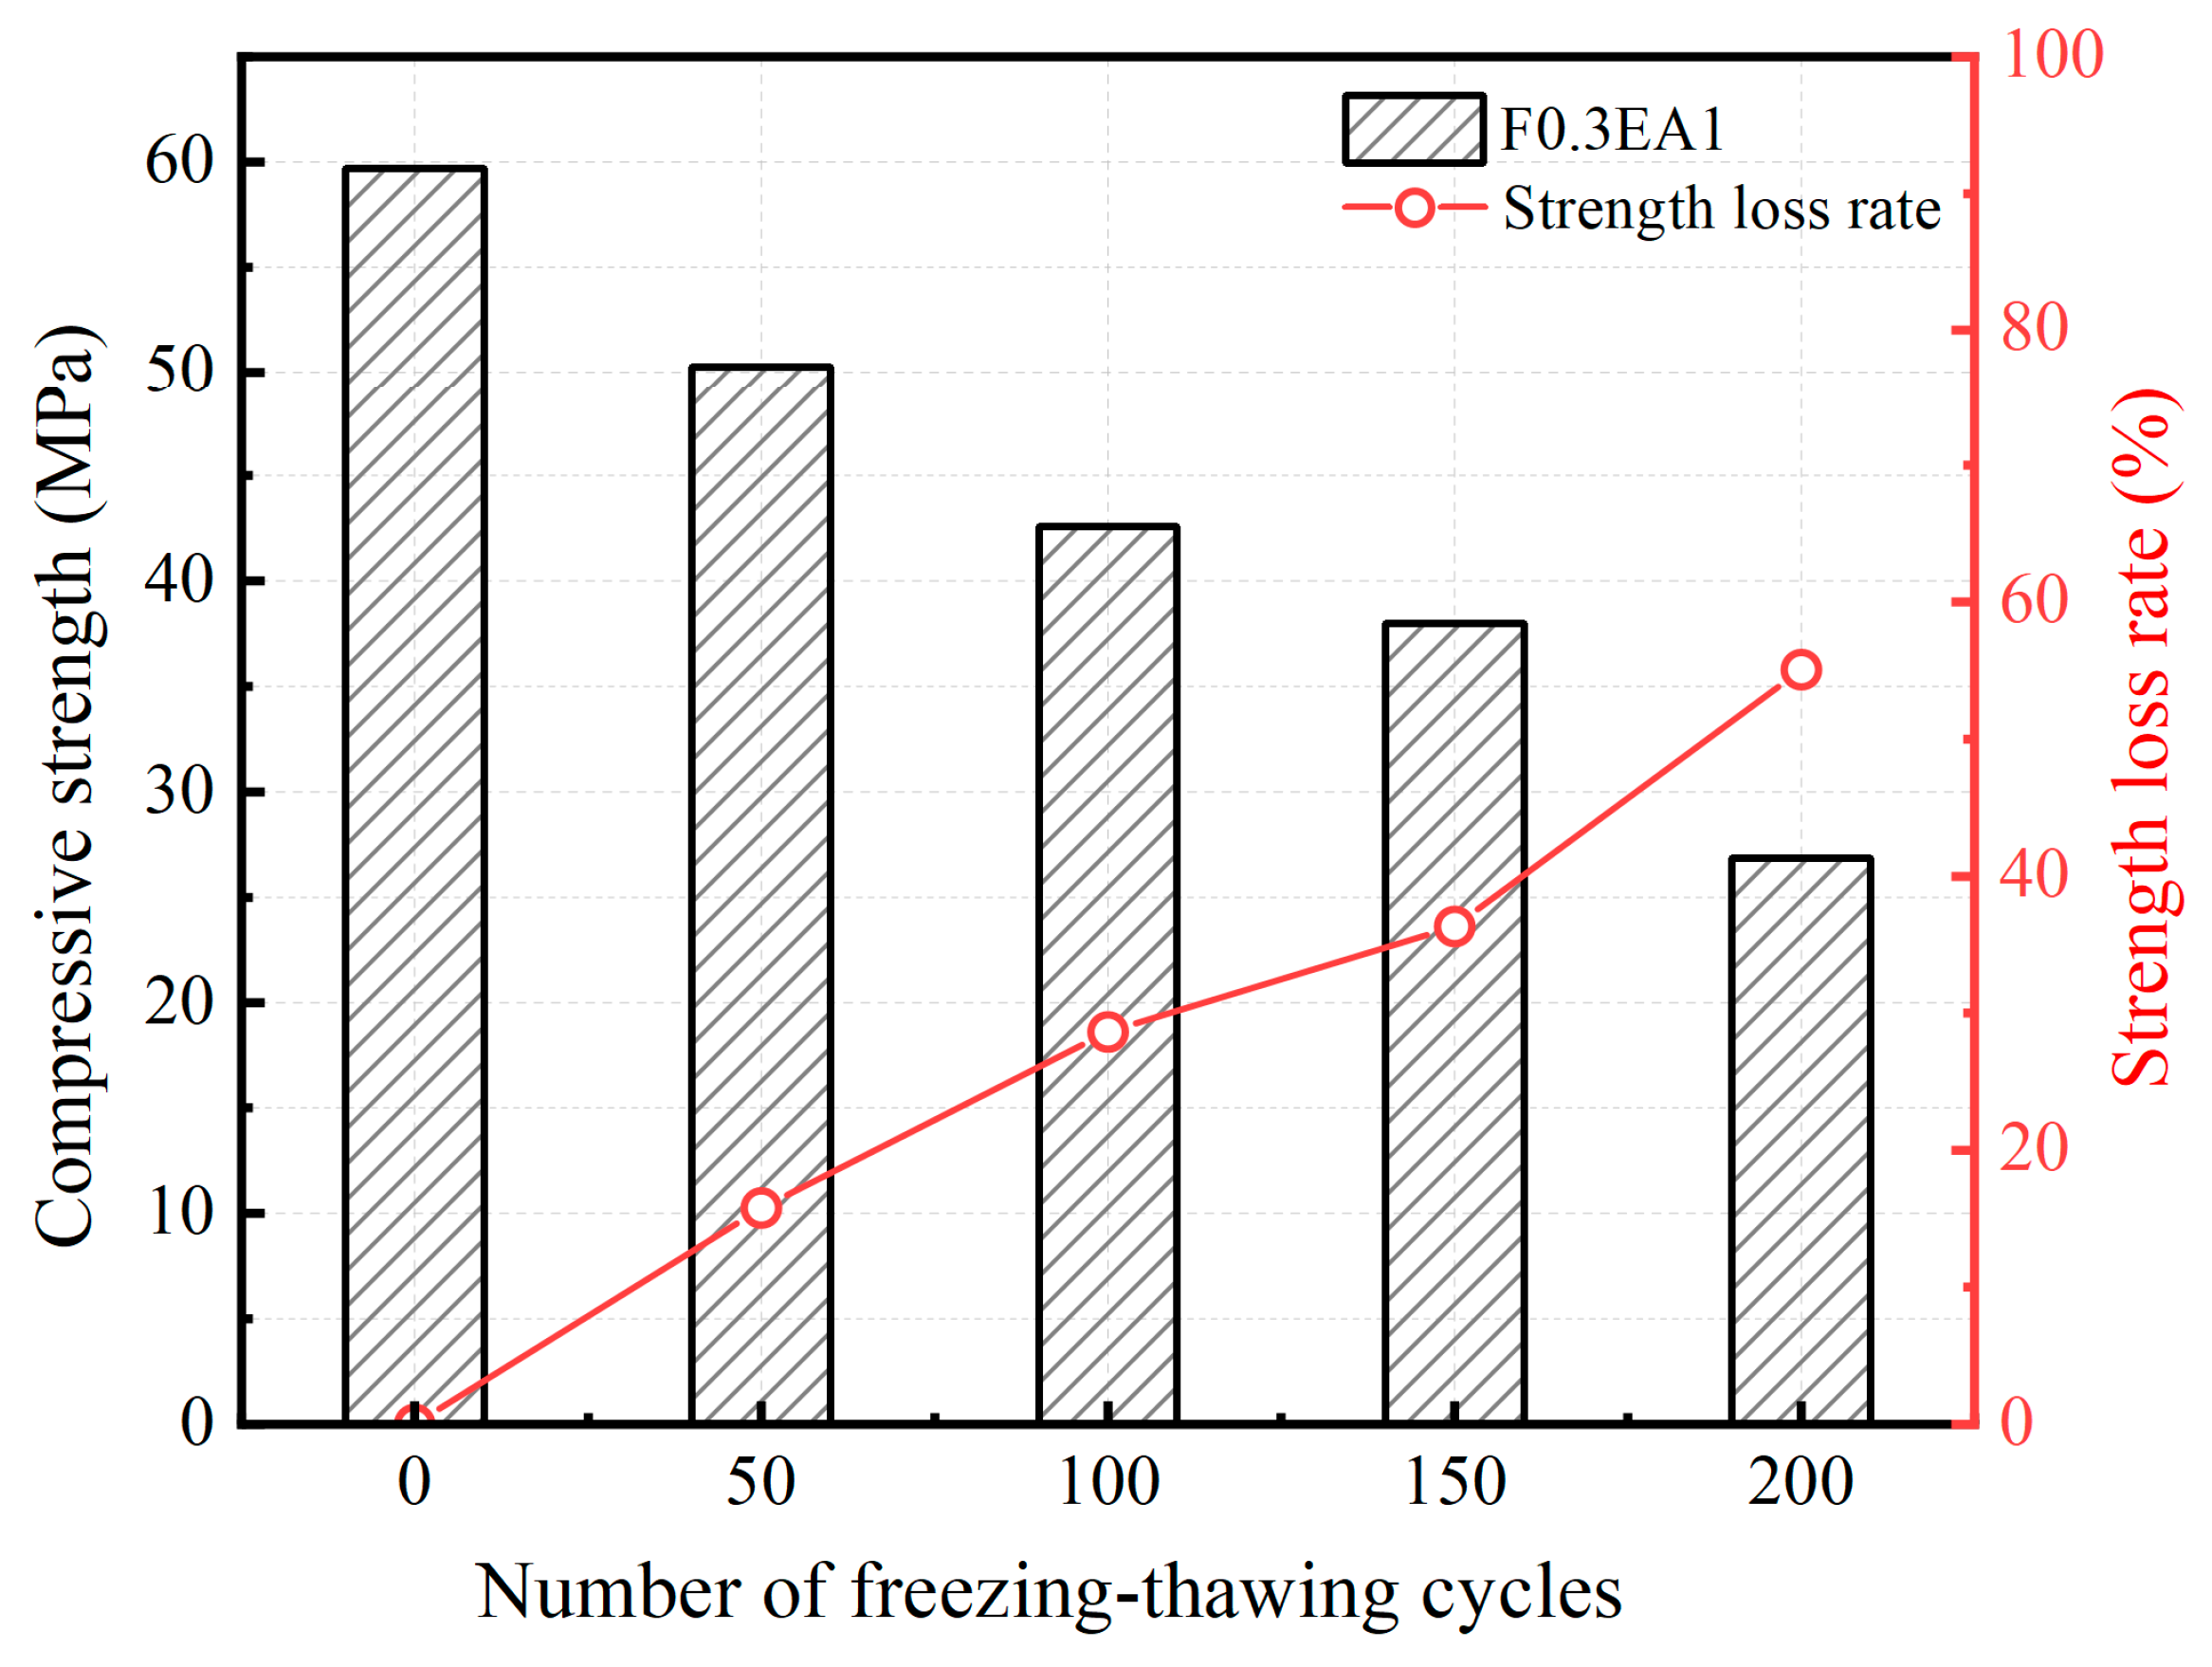
3.1.2. Compressive Strength Degradation

The uniaxial compressive strength plays a crucial role in assessing the mechanical properties of concrete, serving as an indicator of its degradation under freezing–thawing cycles. Figure 12 shows the variations in compressive strength of SSSC as a function of the number of freezing–thawing cycles. With the increase in the number of freezing and thawing cycles, the repeated freezing and thawing action of water in the internal pores and cracks of concrete makes the number of internal pores and cracks of concrete increase, the diameter increases, and the mechanical properties continue to decrease. Initially, during the first 50 freezing–thawing cycles, a slight reduction in compressive strength was observed. This decrease primarily stemmed from the freezing of liquid water within the pore medium, resulting in a volumetric expansion of 9% [47]. Nonetheless, independent closed pores exist within the SSC, which partially alleviate the expansion stress induced by water freezing, thereby slowing down crack formation and growth. Consequently, when the number of freezing–thawing cycles is low, the detrimental impact of microcracks on compressive strength remains negligible.
As the number of freezing–thawing cycles increases, the number of microcracks and pores caused by freezing–thawing losses also increases. During the thawing phase, these microcracks and pores are filled with water again. During the freezing stage, the volume expansion caused by water freezing is greater, and the microcracks in the SSSC start connecting with each other, leading to the formation of macrocracks and a decreasing trend in compressive strength. When the number of freezing–thawing cycles reaches more than 100 times, the freezing–thawing damage accumulates, causing an increase in pore crack size, a stable morphology, and a change in the internal structure of concrete from dense to loose. This results in a continuous decrease in compressive strength, which is consistent with the results obtained by previous studies [37]. At 200 freezing–thawing cycles, the loss of compressive strength reaches 55.05%.

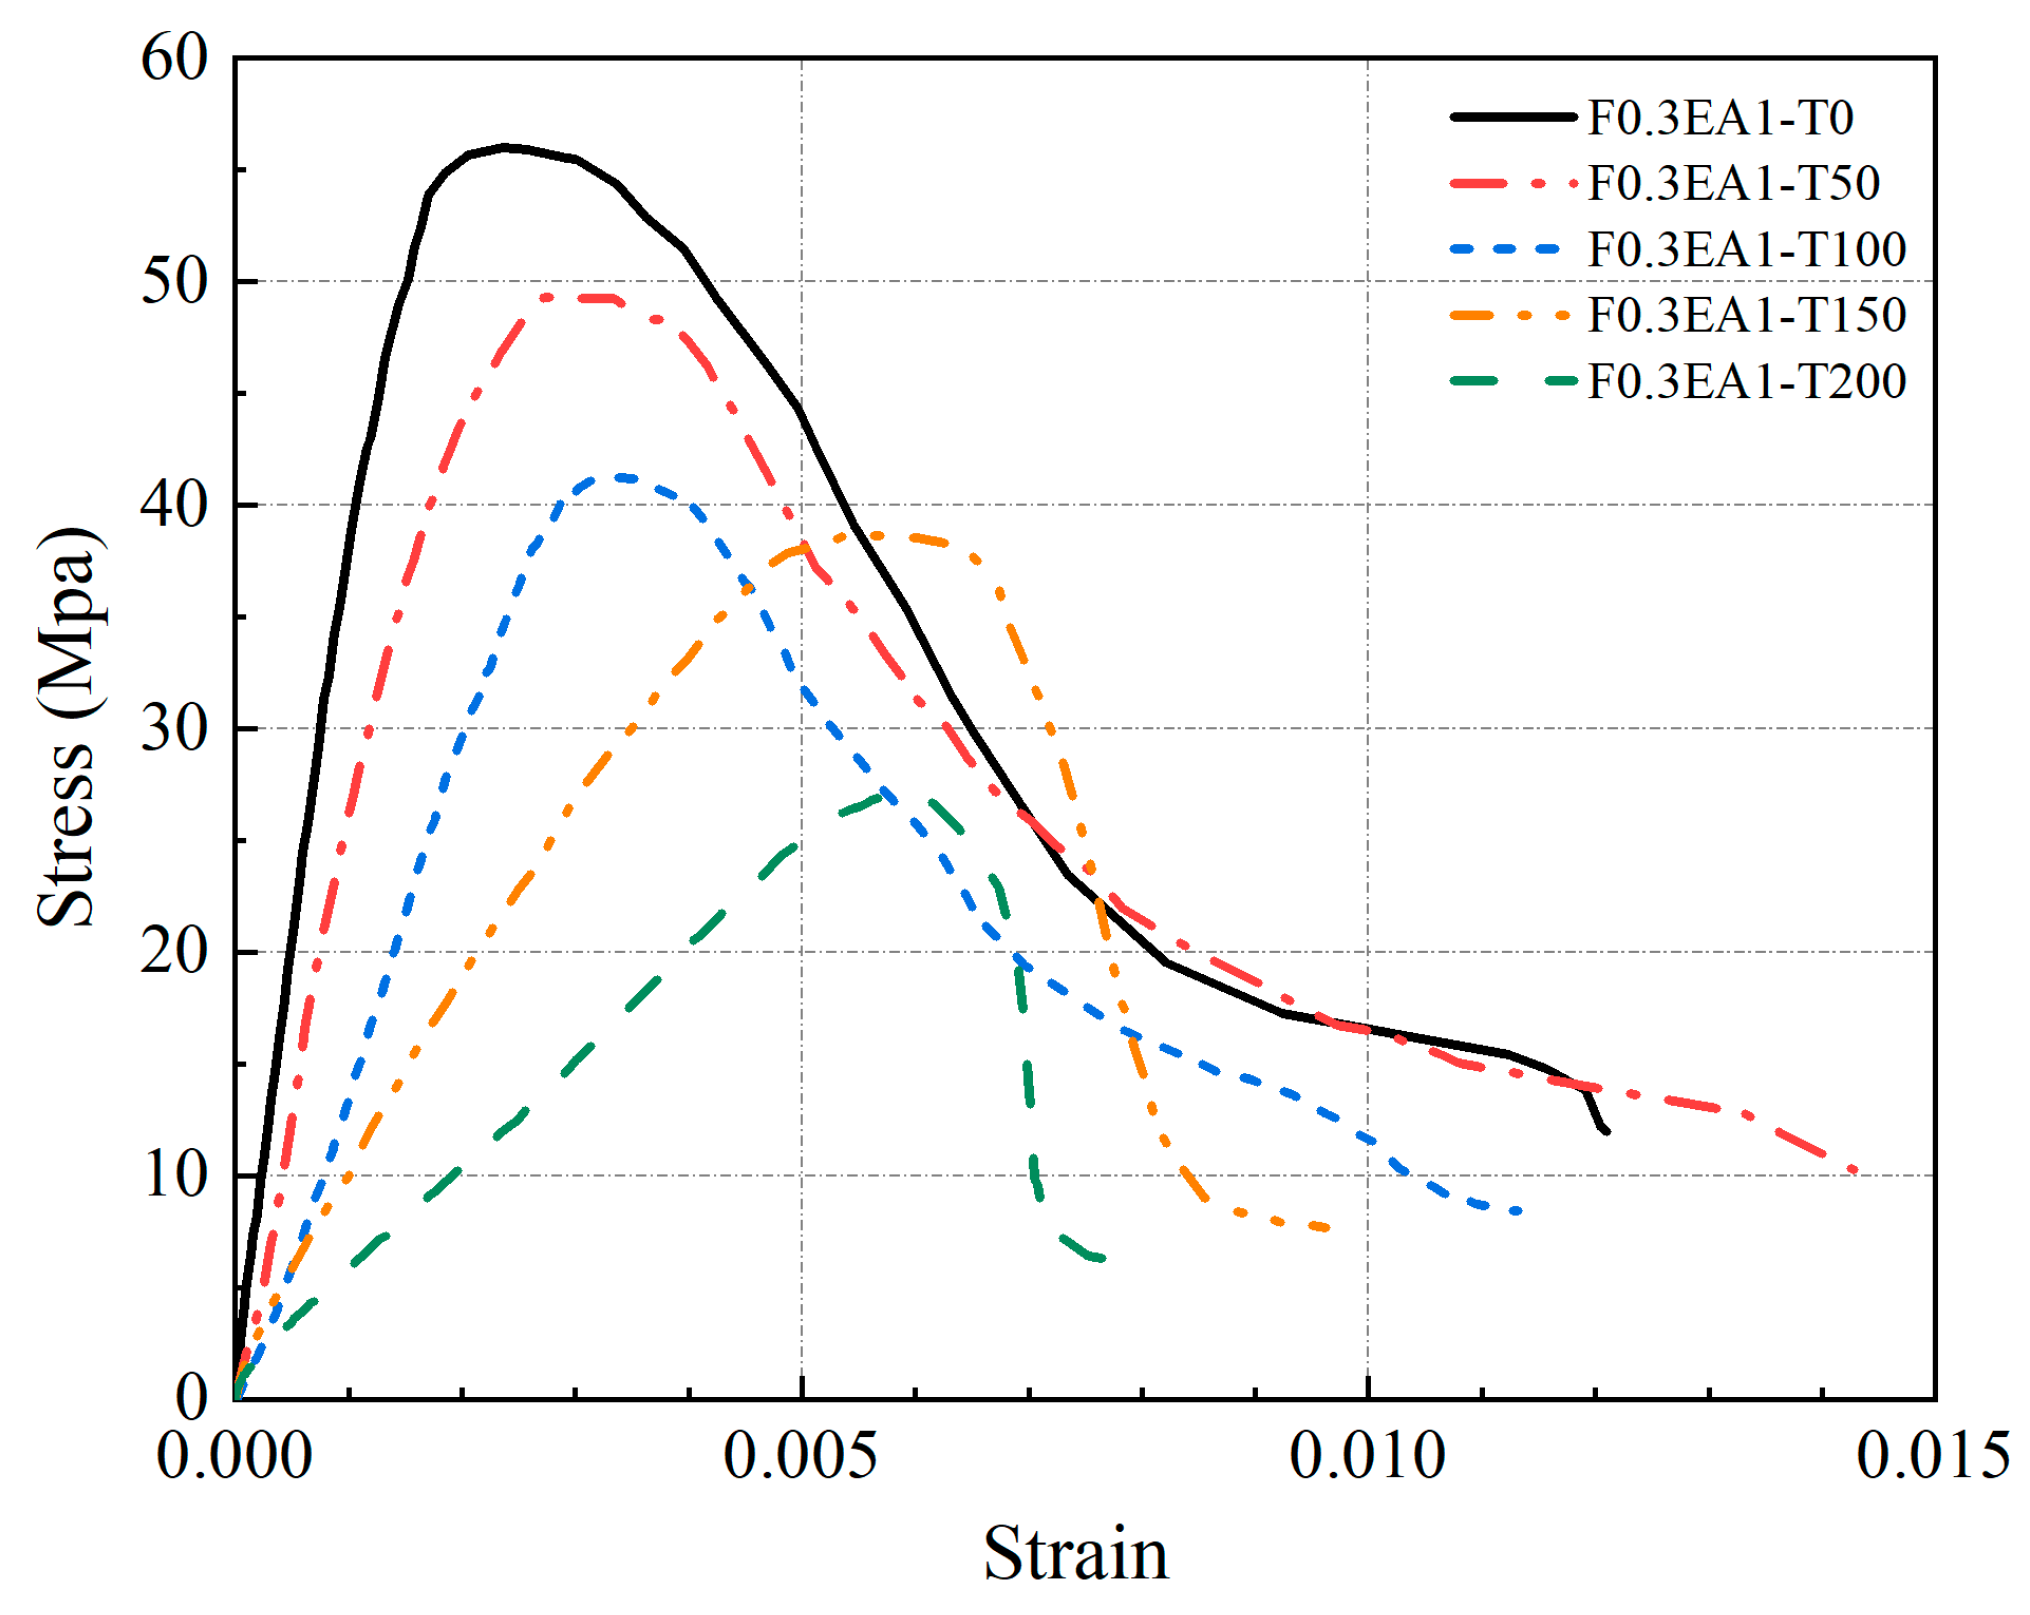
3.1.3. Stress–Strain Relationships

The stress–strain curves for all specimens exhibited a similar pattern, consisting of a linear rising stage, a nonlinear rising stage, and a falling stage. Specifically, the stress–strain curves for the specimens in group F0.3EA1 are displayed in Figure 13. In the absence of freezing–thawing cycles, the descending phase curves appeared relatively smooth and exhibited good ductility. However, as the number of freezing–thawing cycles increased, several notable changes were observed. Firstly, the compressive strength of the specimens decreased, accompanied by an increase and subsequent decrease in peak strain. Additionally, the stress–strain curves exhibited a sharp decline after reaching the peak point. These findings suggest that freezing–thawing cycles contribute to the brittleness of the SSSC [48]. Moreover, the ductility of the SSSC, as represented by the envelope area of the curve, decreased with an increasing number of freezing–thawing cycles [49].
During the initial 100 freezing–thawing cycles, the water in the concrete internal pores and cracks underwent repeated icing expansion. However, the independent closed pores within the concrete partially alleviated the expansion stress caused by water icing, thereby slowing down the formation and progression of cracks. Consequently, the damage stage of the curve appeared relatively smooth and exhibited ductile characteristics. Nevertheless, when the number of freezing–thawing cycles reached 150–200, the concrete experienced an increased number and size of pores and cracks, resulting in significant inhomogeneous damage. This result is consistent with the results obtained by previous studies [49]. Consequently, the destruction stage of the curve appeared steeper, highlighting the brittle characteristics of the concrete.

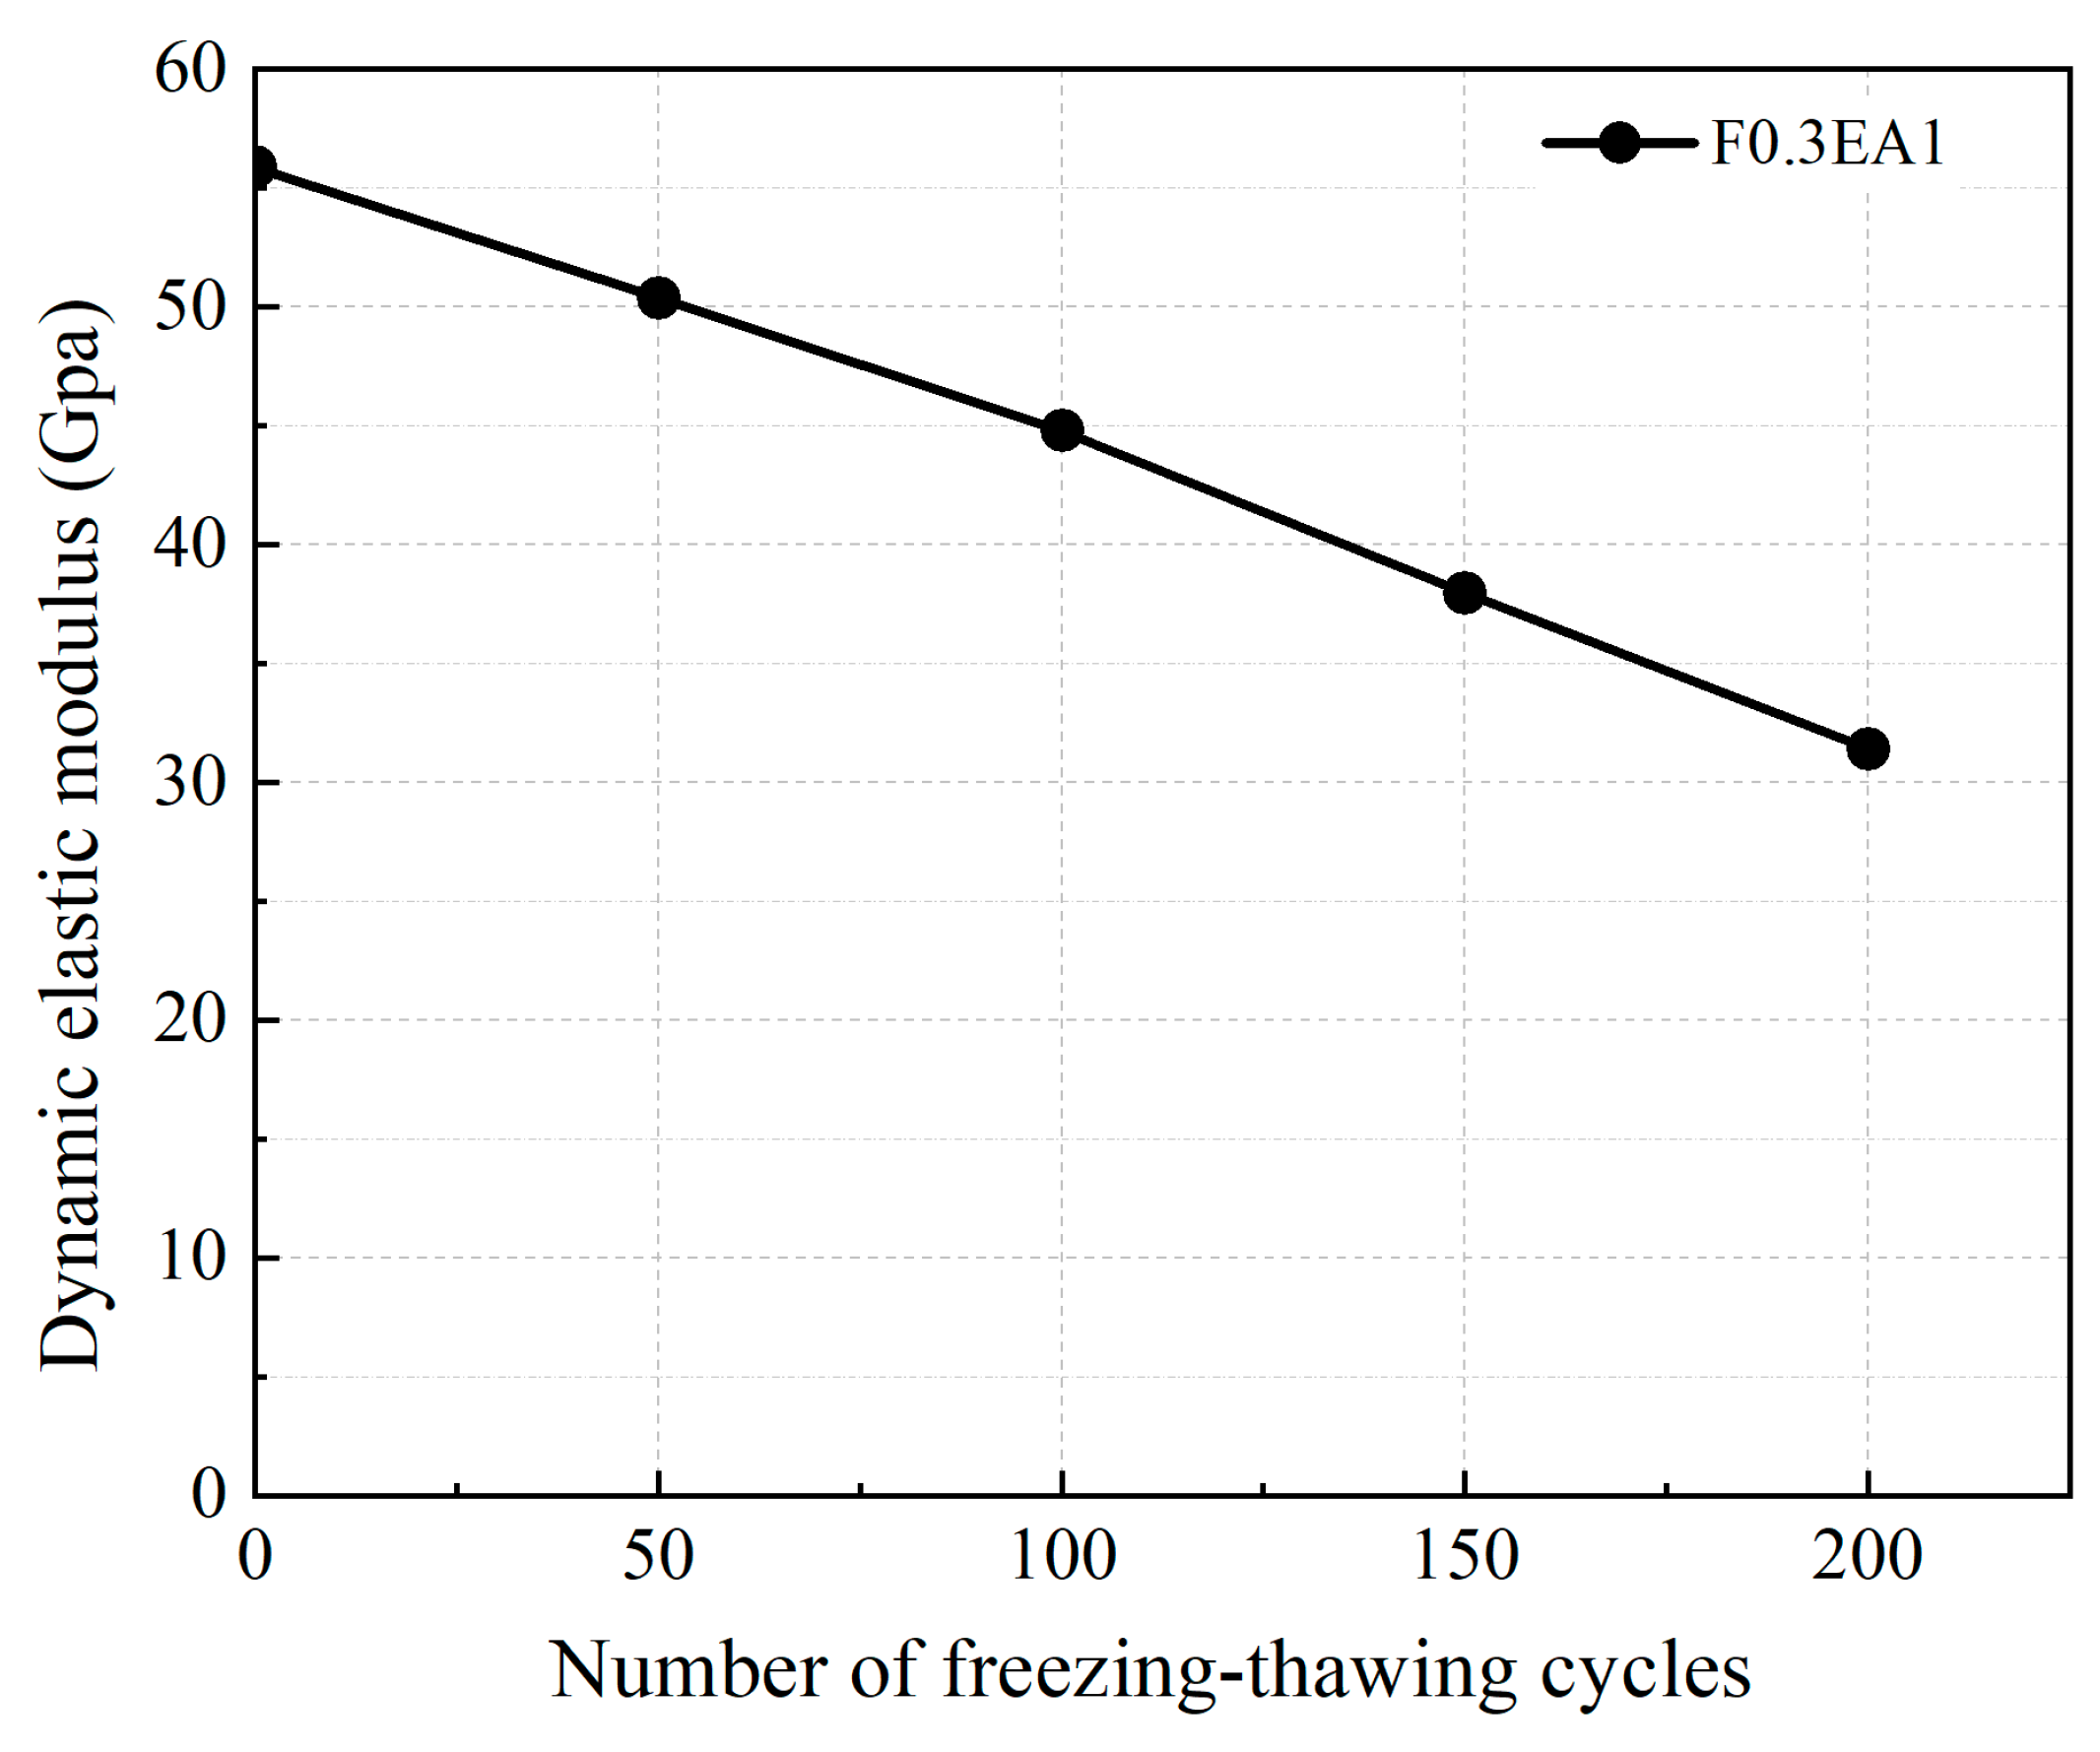
3.1.4. Dynamic Elastic Modulus
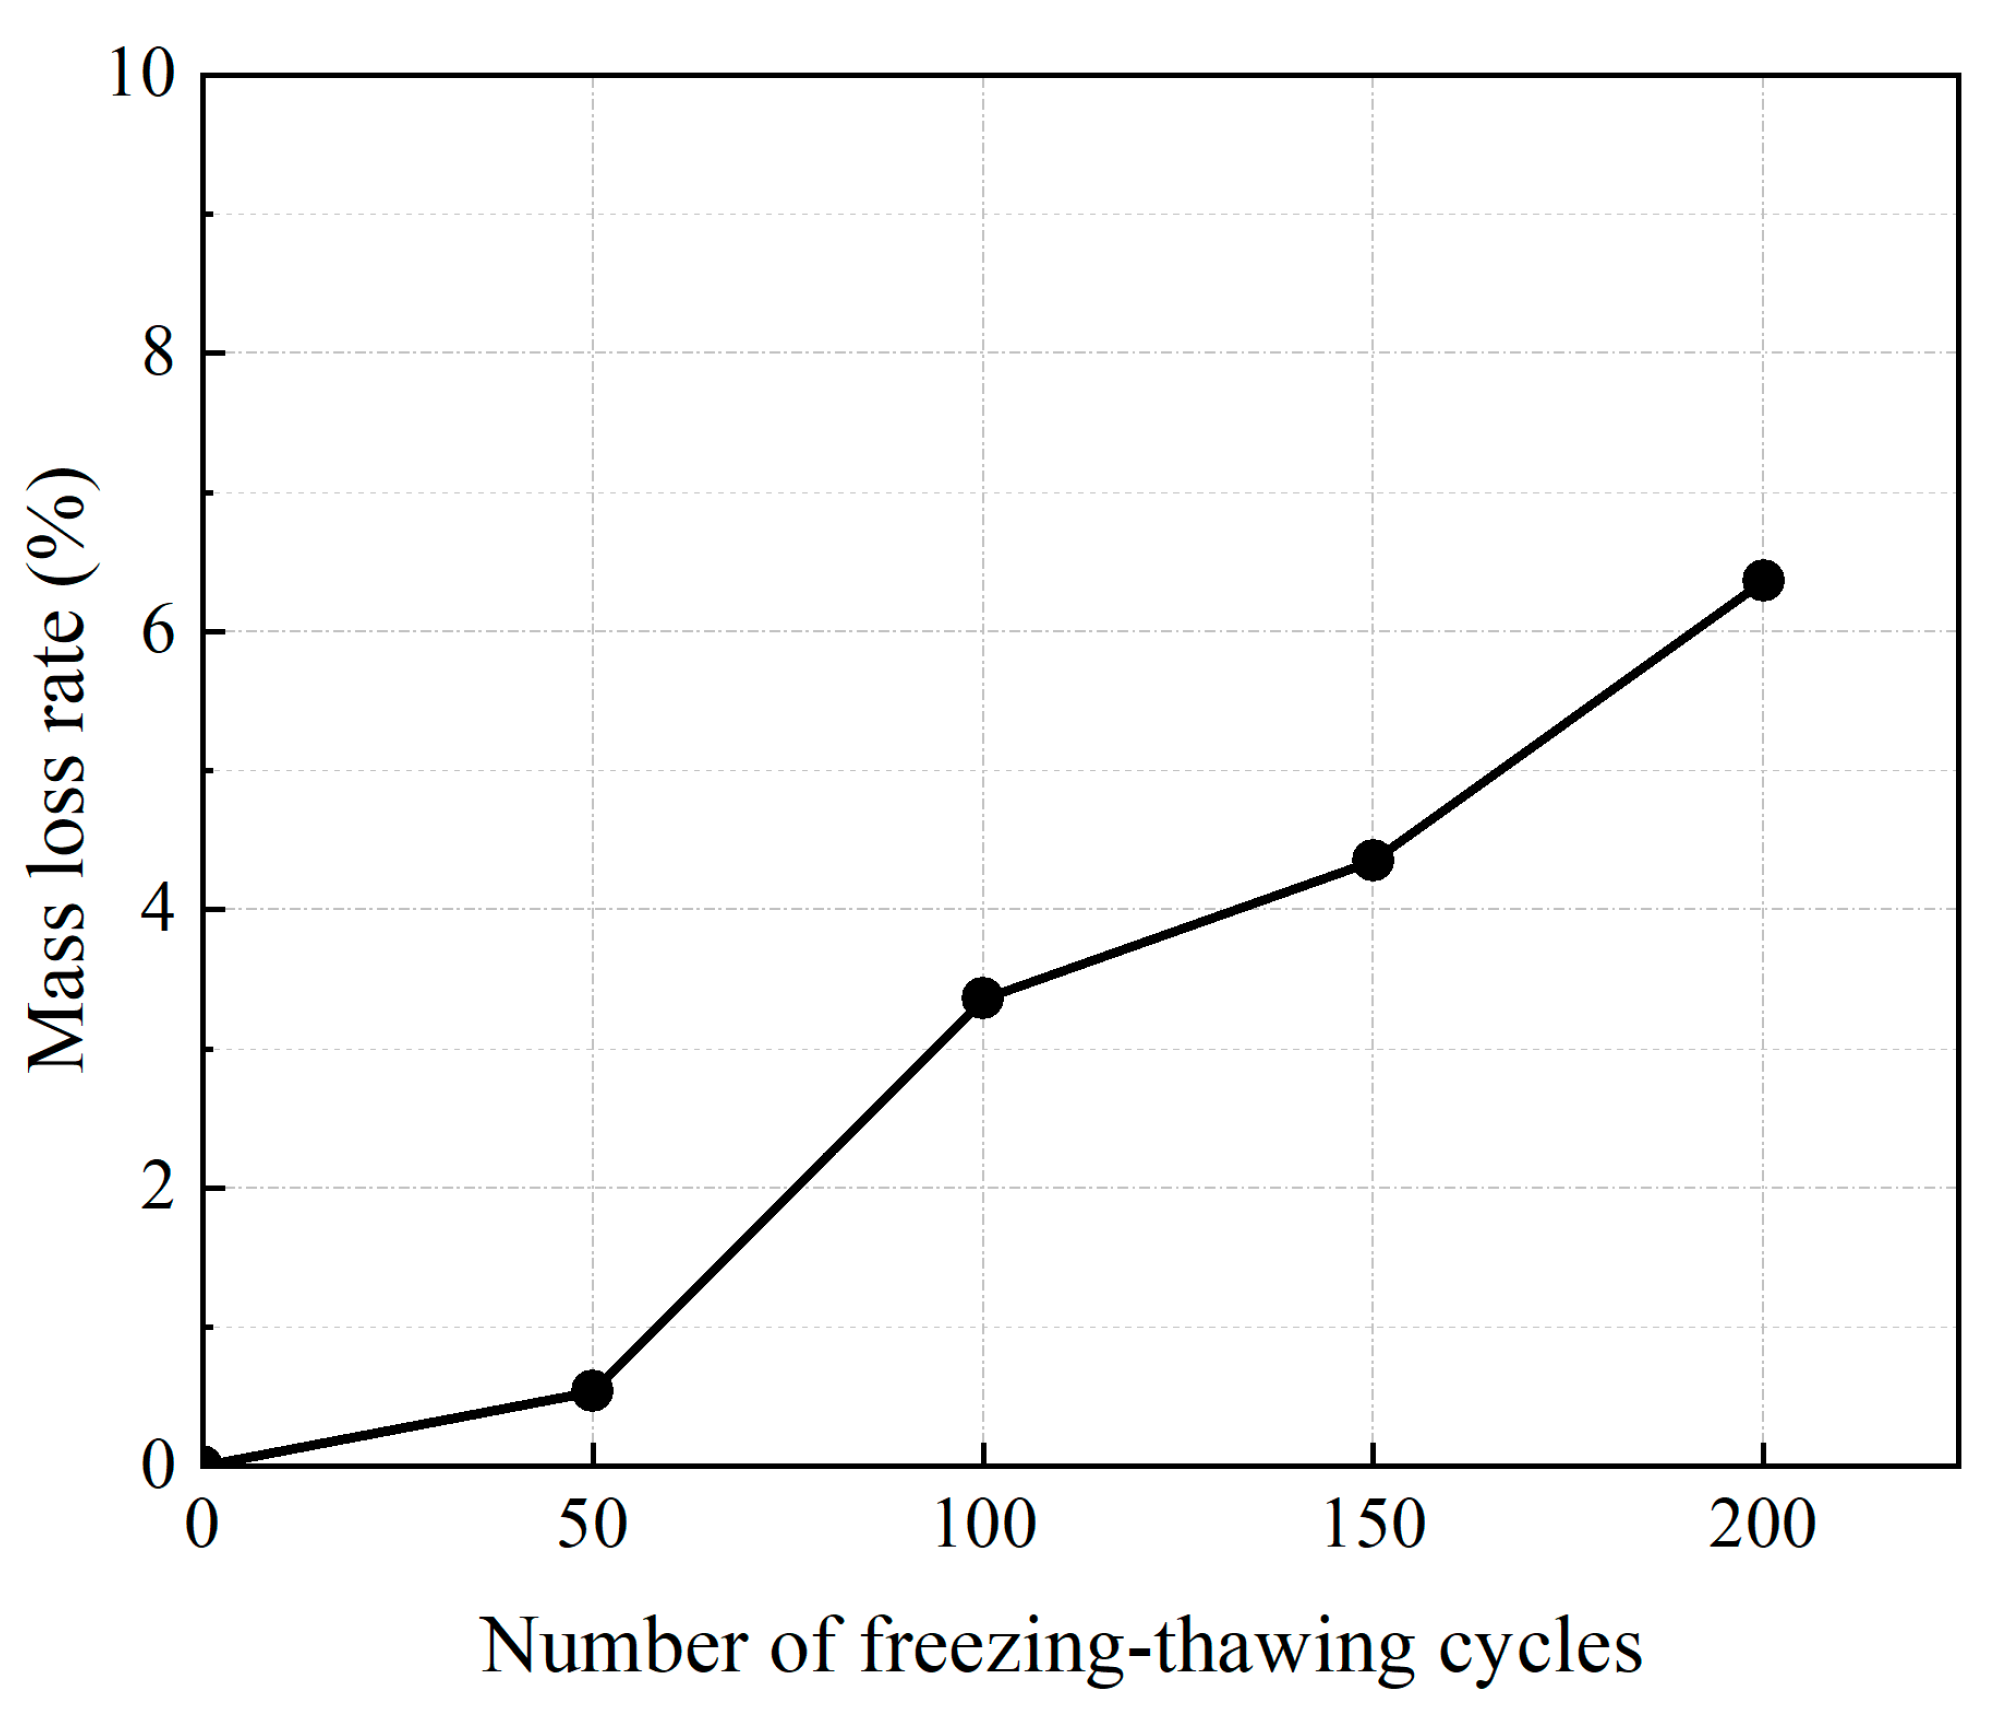
The dynamic modulus of elasticity refers to the modulus of elasticity when subjected to dynamic loading conditions. It is closely linked to the level of internal structure compactness within the specimen and serves as an indicator of crack and pore development within the concrete. According to GB/T 50082-2009 [50], the dynamic modulus of elasticity can be calculated by Equation (1).
E d = 13.244 × 10 4 × W L 3 f 2 a 4
where Ed is the modulus of dynamic elasticity of concrete (GPa), a is the side length of the square cross-section of the specimen (mm), L is the length of the specimen (mm), W is the mass of the specimen (kg, to the nearest 0.01 kg), and f is the fundamental frequency of vibration of the specimen during transverse vibration (Hz).
Figure 14 illustrates the variation in the dynamic elastic modulus of the F0.3EA1 group across different numbers of freezing–thawing cycles. It can be observed that the dynamic elastic modulus exhibits a decline as the number of freezing–thawing cycles increases. Initially, during the early stages of freezing–thawing cycles, the kinetic elastic modulus experiences a gradual decrease. However, as the number of freezing–thawing cycles continues to rise, the rate of decline in the kinetic elastic modulus accelerates. This phenomenon can be attributed to the expansion stresses generated throughout the repeated freezing process, causing the cracks and pores within the SSC to expand. It is worth noting that the impact of freezing–thawing cycles on concrete damage gradually progresses from the outer layers toward the inner layers. Consequently, the extent of freezing–thawing damage within the specimen is directly related to the volume of freezing–thawing damaged concrete present.
In the initial 100 freezing–thawing cycles, the freezing–thawing damage primarily impacts the outermost layer of the concrete specimen. Cracks and pore development predominantly occur in this outer layer, although their influence on the overall mechanical properties of the specimen is minor. As the number of freezing–thawing cycles increases to 150–200, the freezing–thawing damage progressively penetrates from the outer concrete toward the inner layers. The cracks and pores within the concrete gradually deepen, while the inner concrete exerts a more pronounced effect on the mechanical properties of the entire specimen. This effect manifests as a reduction in compressive strength and a decrease in the basic vibration frequency of the specimen, ultimately resulting in a decline in the dynamic modulus of elasticity.

3.1.5. Mass Loss

Mass loss is an important parameter to characterize the performance of concrete under a freezing–thawing environment. The surface morphology of specimens with varying numbers of freezing–thawing cycles is illustrated in Figure 15. In the absence of any freezing–thawing cycles, the specimen exhibits a smooth and intact surface. However, after 50 freezing–thawing cycles, some portions of the mortar begin to flake off, although the overall integrity of the specimen remains uncompromised. With the progression of 100 freezing–thawing cycles, a significant amount of mortar flakes off, resulting in a roughened surface that gradually exposes the outline of the coarse aggregate. Subsequent to 150–200 freezing–thawing cycles, the surface mortar experiences spalling, commencing from the inner layers and extending towards the outer surface. This process leads to complete spalling of the surface mortar, accompanied by substantial loss of mortar. Additionally, the surface coarse aggregate becomes distinctly visible, displaying signs of peeling off. A considerable number of fractured glass fibers can be observed on the surface of the specimen. The mass loss rate of SSSC can be calculated according to Equation (2).
M = M 0 M n M 0 × 100 %
where M is the mass loss rate, M0 is the initial mass of the concrete specimen before the freezing–thawing cycle, and Mn is the mass of the concrete specimen after n freezing–thawing cycles.
Figure 16 shows the mass loss rate of specimens in group F0.3EA1 at varying numbers of freezing–thawing cycles. As the number of freezing–thawing cycles increases, the mass loss rate of the specimens also increases. This can be attributed to the expansion stresses generated during the repeated freezing process, which leads to the formation of microcracks in the SSSC. Moisture continuously infiltrates these microcracks, causing further development and expansion of cracks and pores within the concrete. Consequently, the concrete spalls from the outer surface to the inner layers, resulting in a decrease in concrete quality. The SSSC becomes loose and prone to peeling off, and the overall structure gradually transitions from dense to porous.

3.2. SFCB-SSSC Bonding Behavior

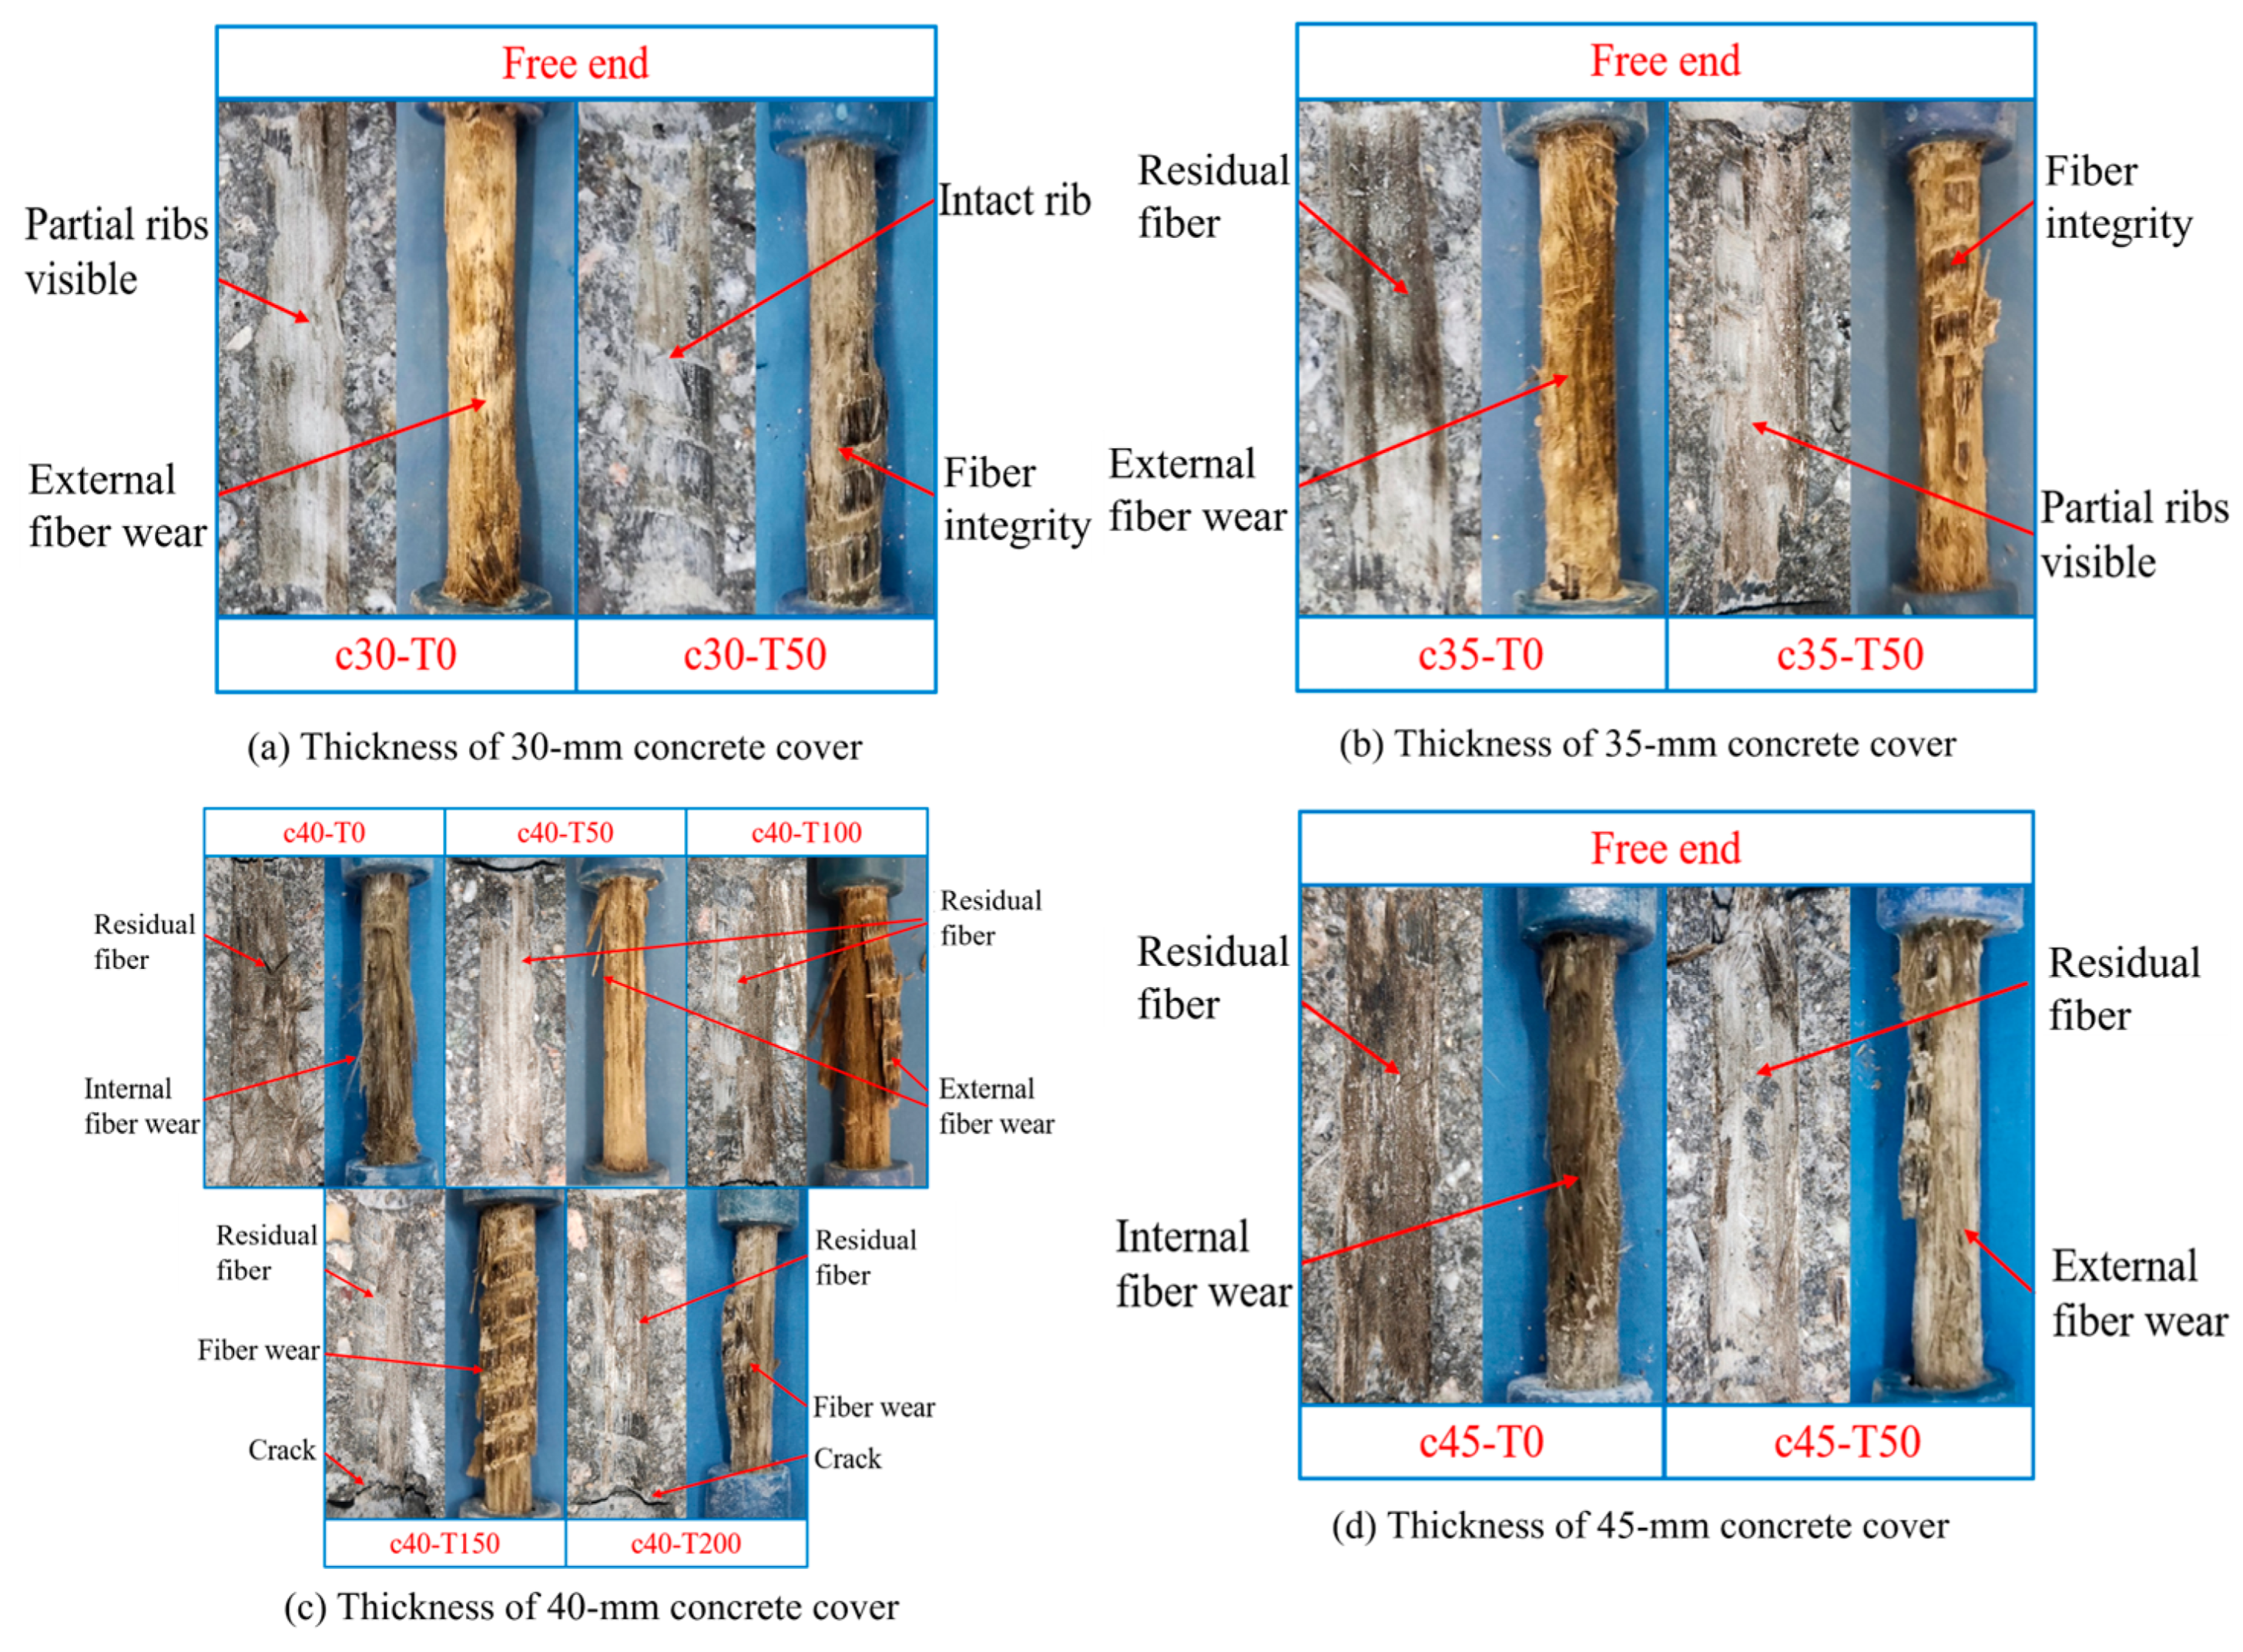
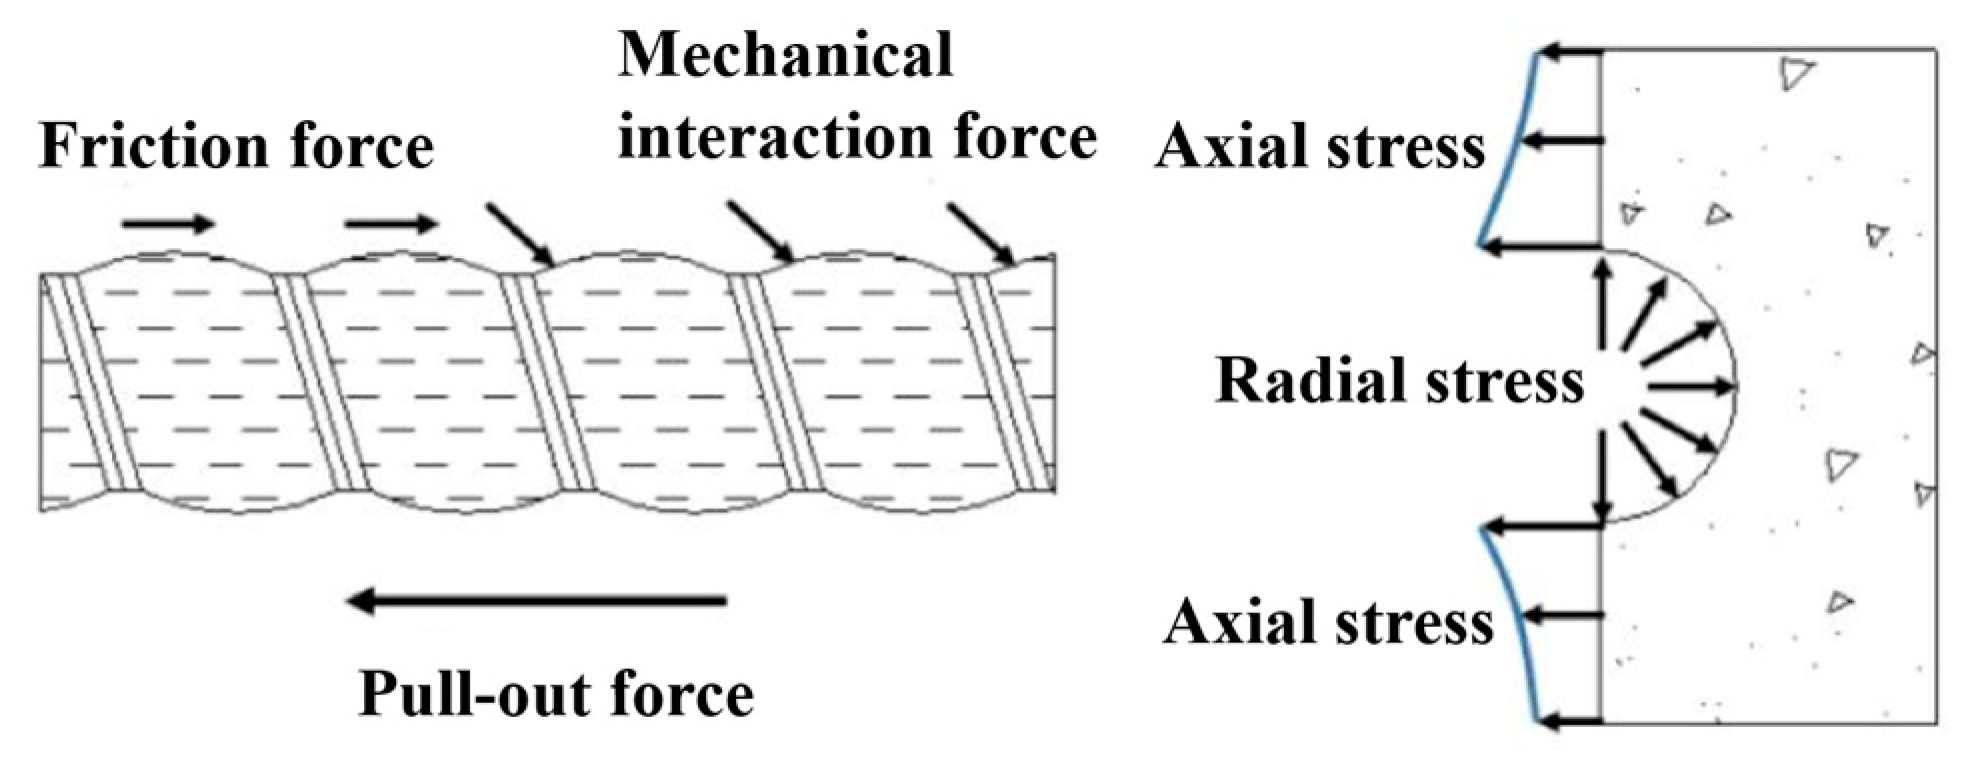
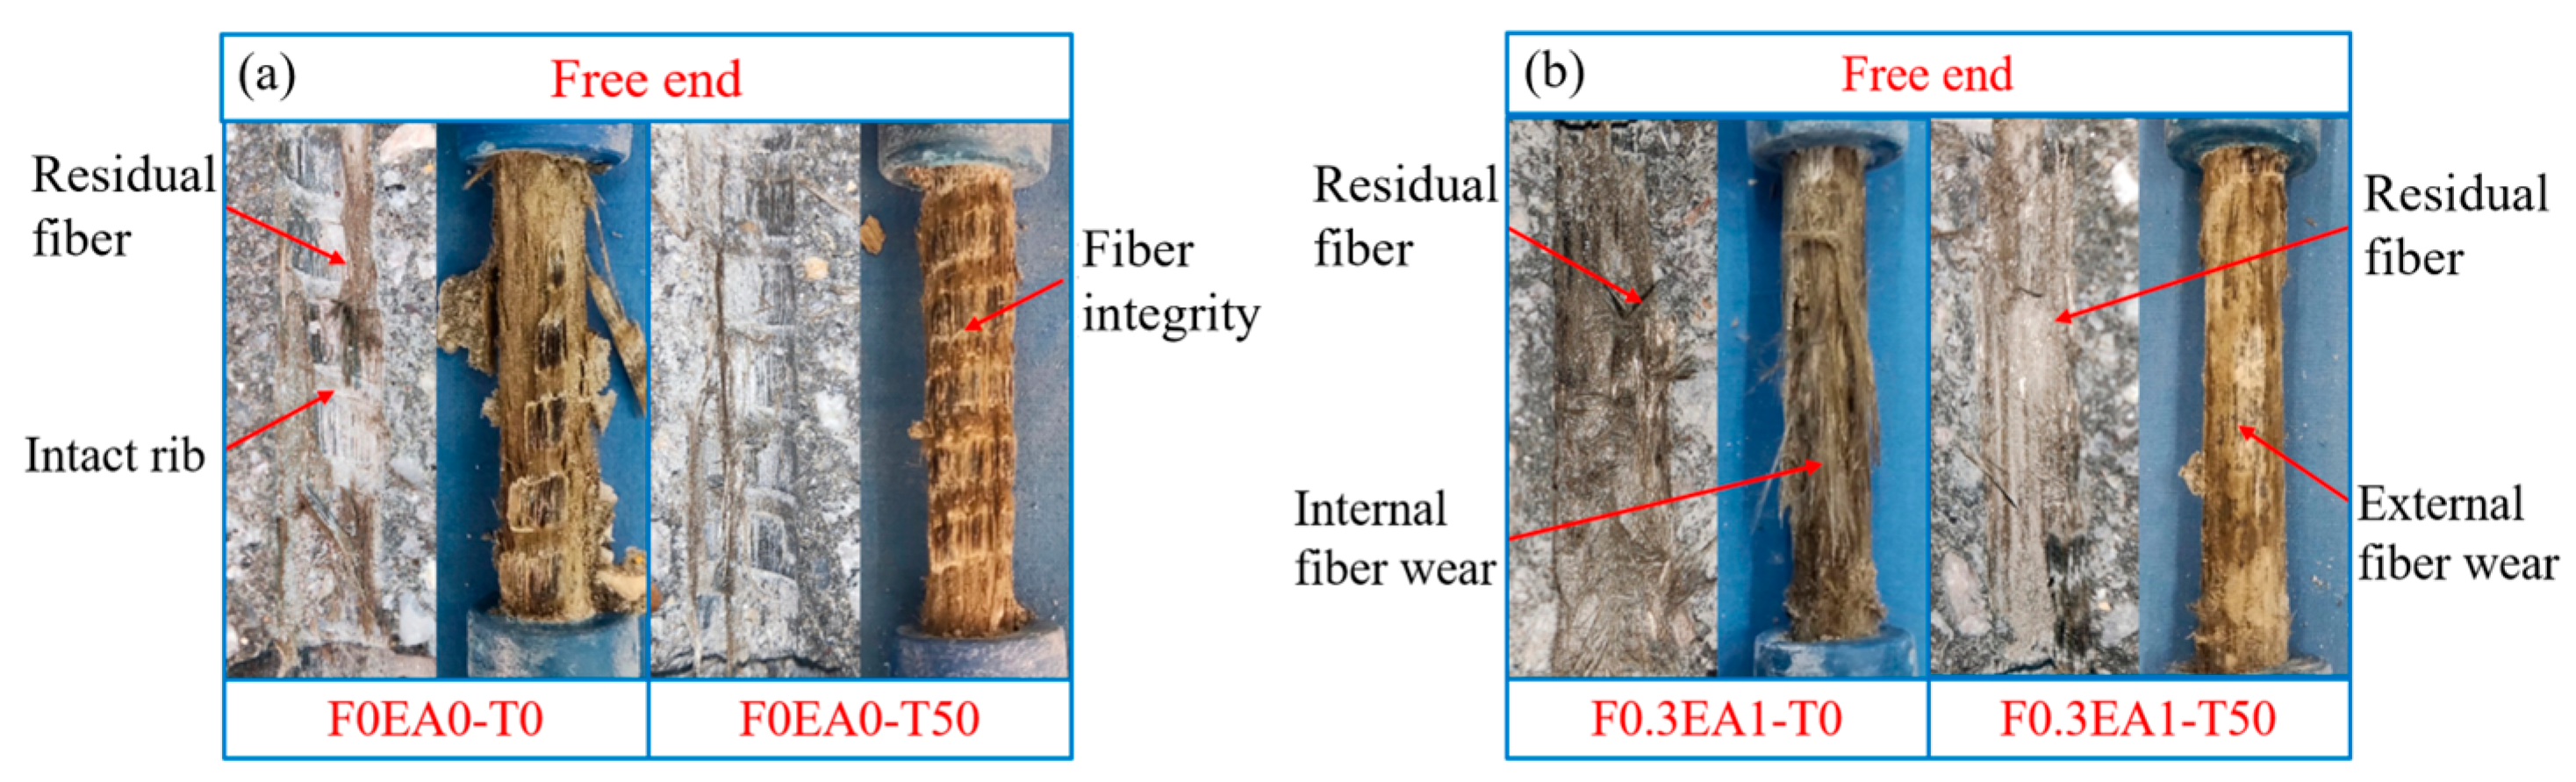
3.2.1. Bond Interfaces

In this study, the pullout tests revealed two primary modes of damage under freezing–thawing cycles, rebar pullout damage and concrete splitting damage [35]. The majority of pullout specimens experienced rebar pullout damage during the test. However, in cases where the thickness of the concrete protective layer was small, concrete splitting damage occurred. The bond between SFCB and SSSC was primarily composed of chemical adhesion and friction when there was no or minimal slip. When a slip occurred, the mechanical occlusal force and friction force became the dominant factors in the bond. Figure 17 illustrates the interaction force between SFCB and SSSC. The mechanical occlusion force acting on the SFCB can be further broken down into axial and radial stresses along the SFCB. These radial stresses then produce circumferential tensile stresses in the concrete surrounding the SFCB [51]. In cases where the thickness of the concrete protective layer is thin and the circumferential tensile stress exceeds the tensile strength of the concrete, cracking occurs from the inside, progressing from the surface of the SFCB to the surface of the specimen. Therefore, the thickness of the concrete protective layer has a significant impact on the durability of the freeze bond. To investigate this effect, an eccentric pullout test was conducted in this study to examine the bond interface of the specimens in the freezing–thawing environment with varying thicknesses of the concrete protective layer.
To observe the damaged sample of the bonded interface, after the pullout test, the pullout specimen was split and the interface damage was observed. As shown in Figure 18, different phenomena were observed under varying protective layer thicknesses and different numbers of freezing–thawing cycles. The increase in the thickness of the concrete protective layer was found to offer effective confinement for SFCB. Therefore, there was an observable increase in the wear of the concrete interface and the presence of adherent flocculent fibers on the concrete surface with the increase in the protective layer thickness. Under unfrozen and thawed conditions, intact ribs were observed at the c30 concrete interface and the entangled fibers fractured. This observation indicates that adequate mechanical anchorage between SSSC and SFCB did not occur when relative slip occurred between them. The surface damage pattern of SFCB revealed a concentration of force at the bond interface during the pullout process. As the thickness of the concrete protective layer increased, the damage pattern of the entangled fibers transitioned from fracture to spalling, and then from spalling to abrasion, resulting in a flocculent shape. The rib surface at the concrete interface suffered severe abrasion, with a significant number of entangled fibers attached. This observation suggests that the concrete exerts a certain binding force on the reinforcement, and increasing the thickness of the concrete protective layer not only enhances the interfacial bond strength but also influences the damage pattern at the bond interface. In the freezing–thawing environment, the attached flocculent fibers at the concrete interface decreased, and the damage to the SFCB entangled fibers slowed down, leading to different damage patterns. This indicates a reduction in bond strength in the freezing–thawing environment, accompanied by alterations in bond behavior. Following freezing–thawing cycles, complete ribs were observed at the concrete interface of c30, while partial traces of ribs were noted at c35, and fiber remnants were still present at the concrete interfaces of c40 and c45. This suggests that the protective concrete layer thickness of c40 and c45 provides effective protection for the bond interface.
When the thickness of the protective layer remained constant (c = 40 mm), the damage to the bond interface of F0.3EA1 was compared under different freezing–thawing conditions. As shown in Figure 18c, a large number of flocculent fibers were observed attached to the concrete interface when it was not subjected to freezing–thawing cycles. Moreover, there was evident abrasion on the rib and reinforcement surfaces of the concrete. As the number of freezing–thawing cycles increased, the residue of fibers at the concrete interface gradually decreased, and the extent of wear on the fiber layer at the SFCB interface diminished. Among them, after 50 freezing–thawing cycles, the internal wear of the fiber layer transitioned to external wear. Subsequently, after 100 freezing–thawing cycles, the fiber layer experienced partial wear instead of complete wear. After 150 freezing–thawing cycles, the surface of the fiber layer appeared more intact. As the number of freezing–thawing cycles increased, the damage at the bond interface gradually diminished, with the concrete interface shifting from bond–slip damage to freezing–thawing damage, and minimal damage occurred on the surface of the steel reinforcement caused by freezing and thawing.
As can be seen in Figure 19, before freeze–thawing, the F0EA0 specimen exhibited a minimal amount of fiber residue at the concrete interface, with distinct rib traces. After 50 freezing–thawing cycles, complete ribs were visible at the concrete interface, indicating poor bonding performance and insufficient adhesion between the SFCB and concrete. In contrast, the F0.3EA1 specimen, with the inclusion of glass fiber and expansion agent, showed the highest fiber residue at the concrete interface prior to freezing–thawing. The internal fiber layer at the SFCB interface exhibited filamentation damage. Following 50 freezing–thawing cycles, the amount of fiber residue at the concrete interface decreased, and slight rib traces could be observed. This suggests that the presence of GF and EA can enhance the bond performance between SFCB and SSSC, with a more pronounced synergistic effect.

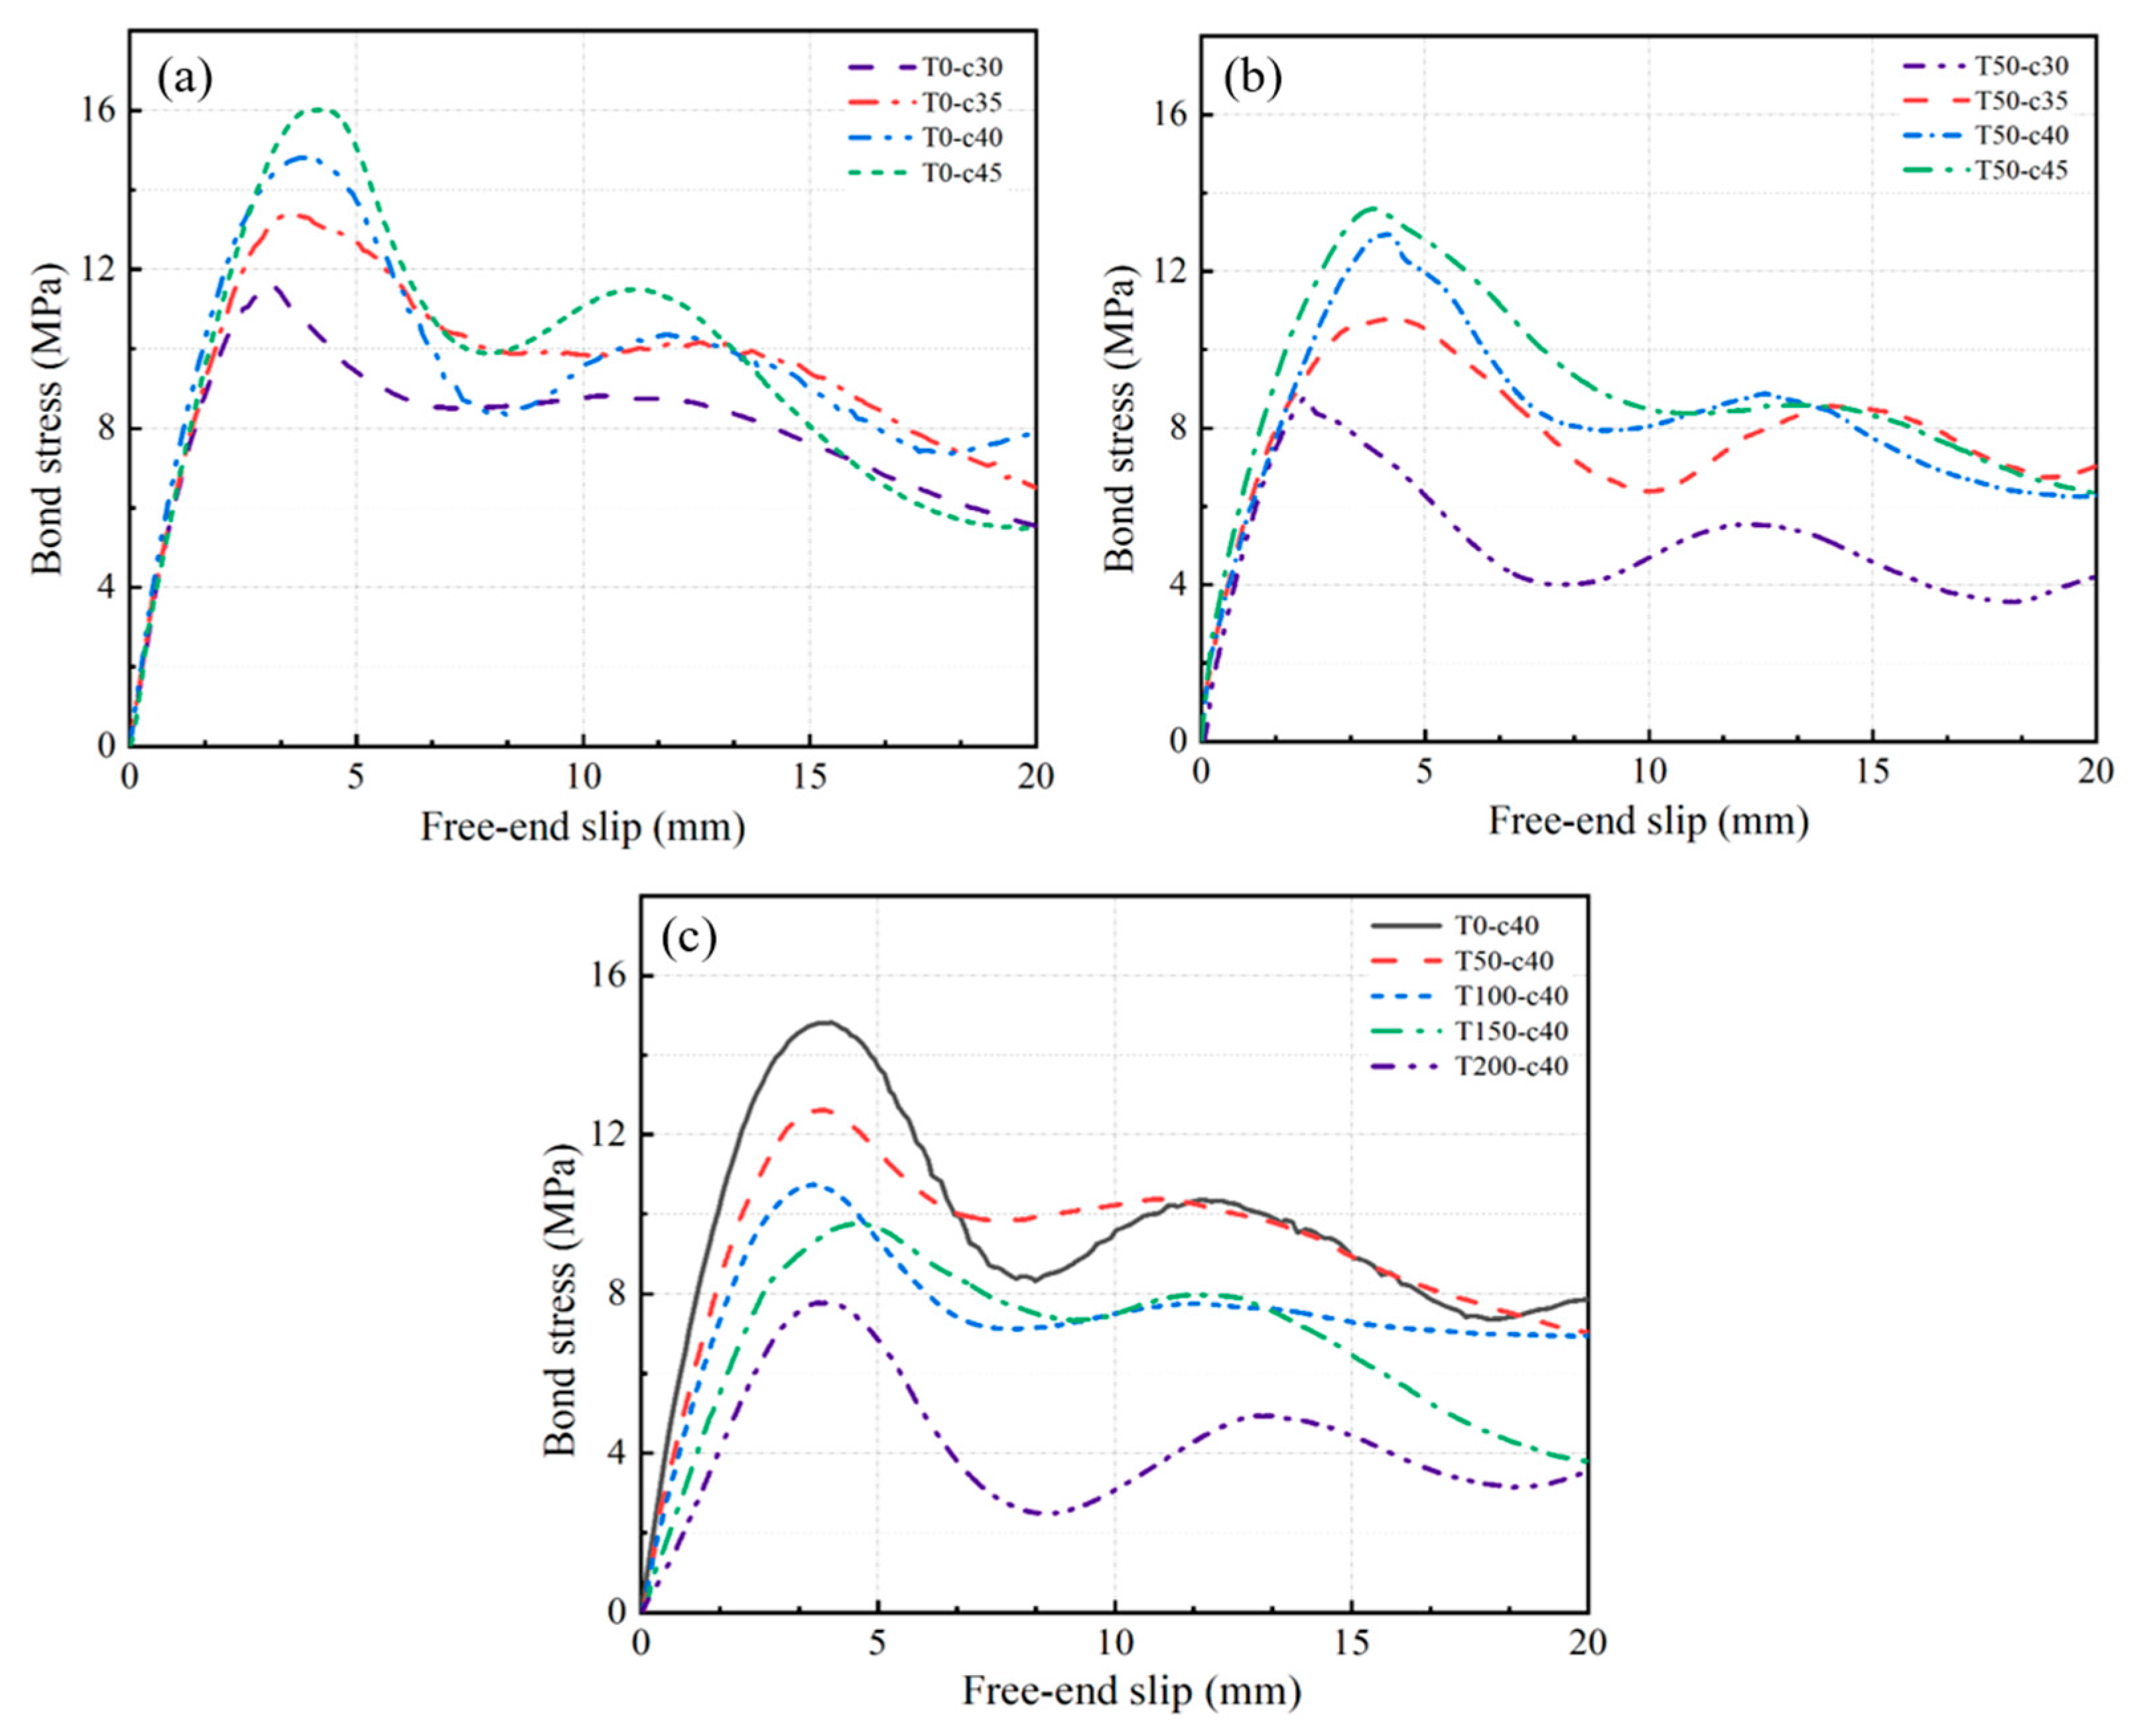
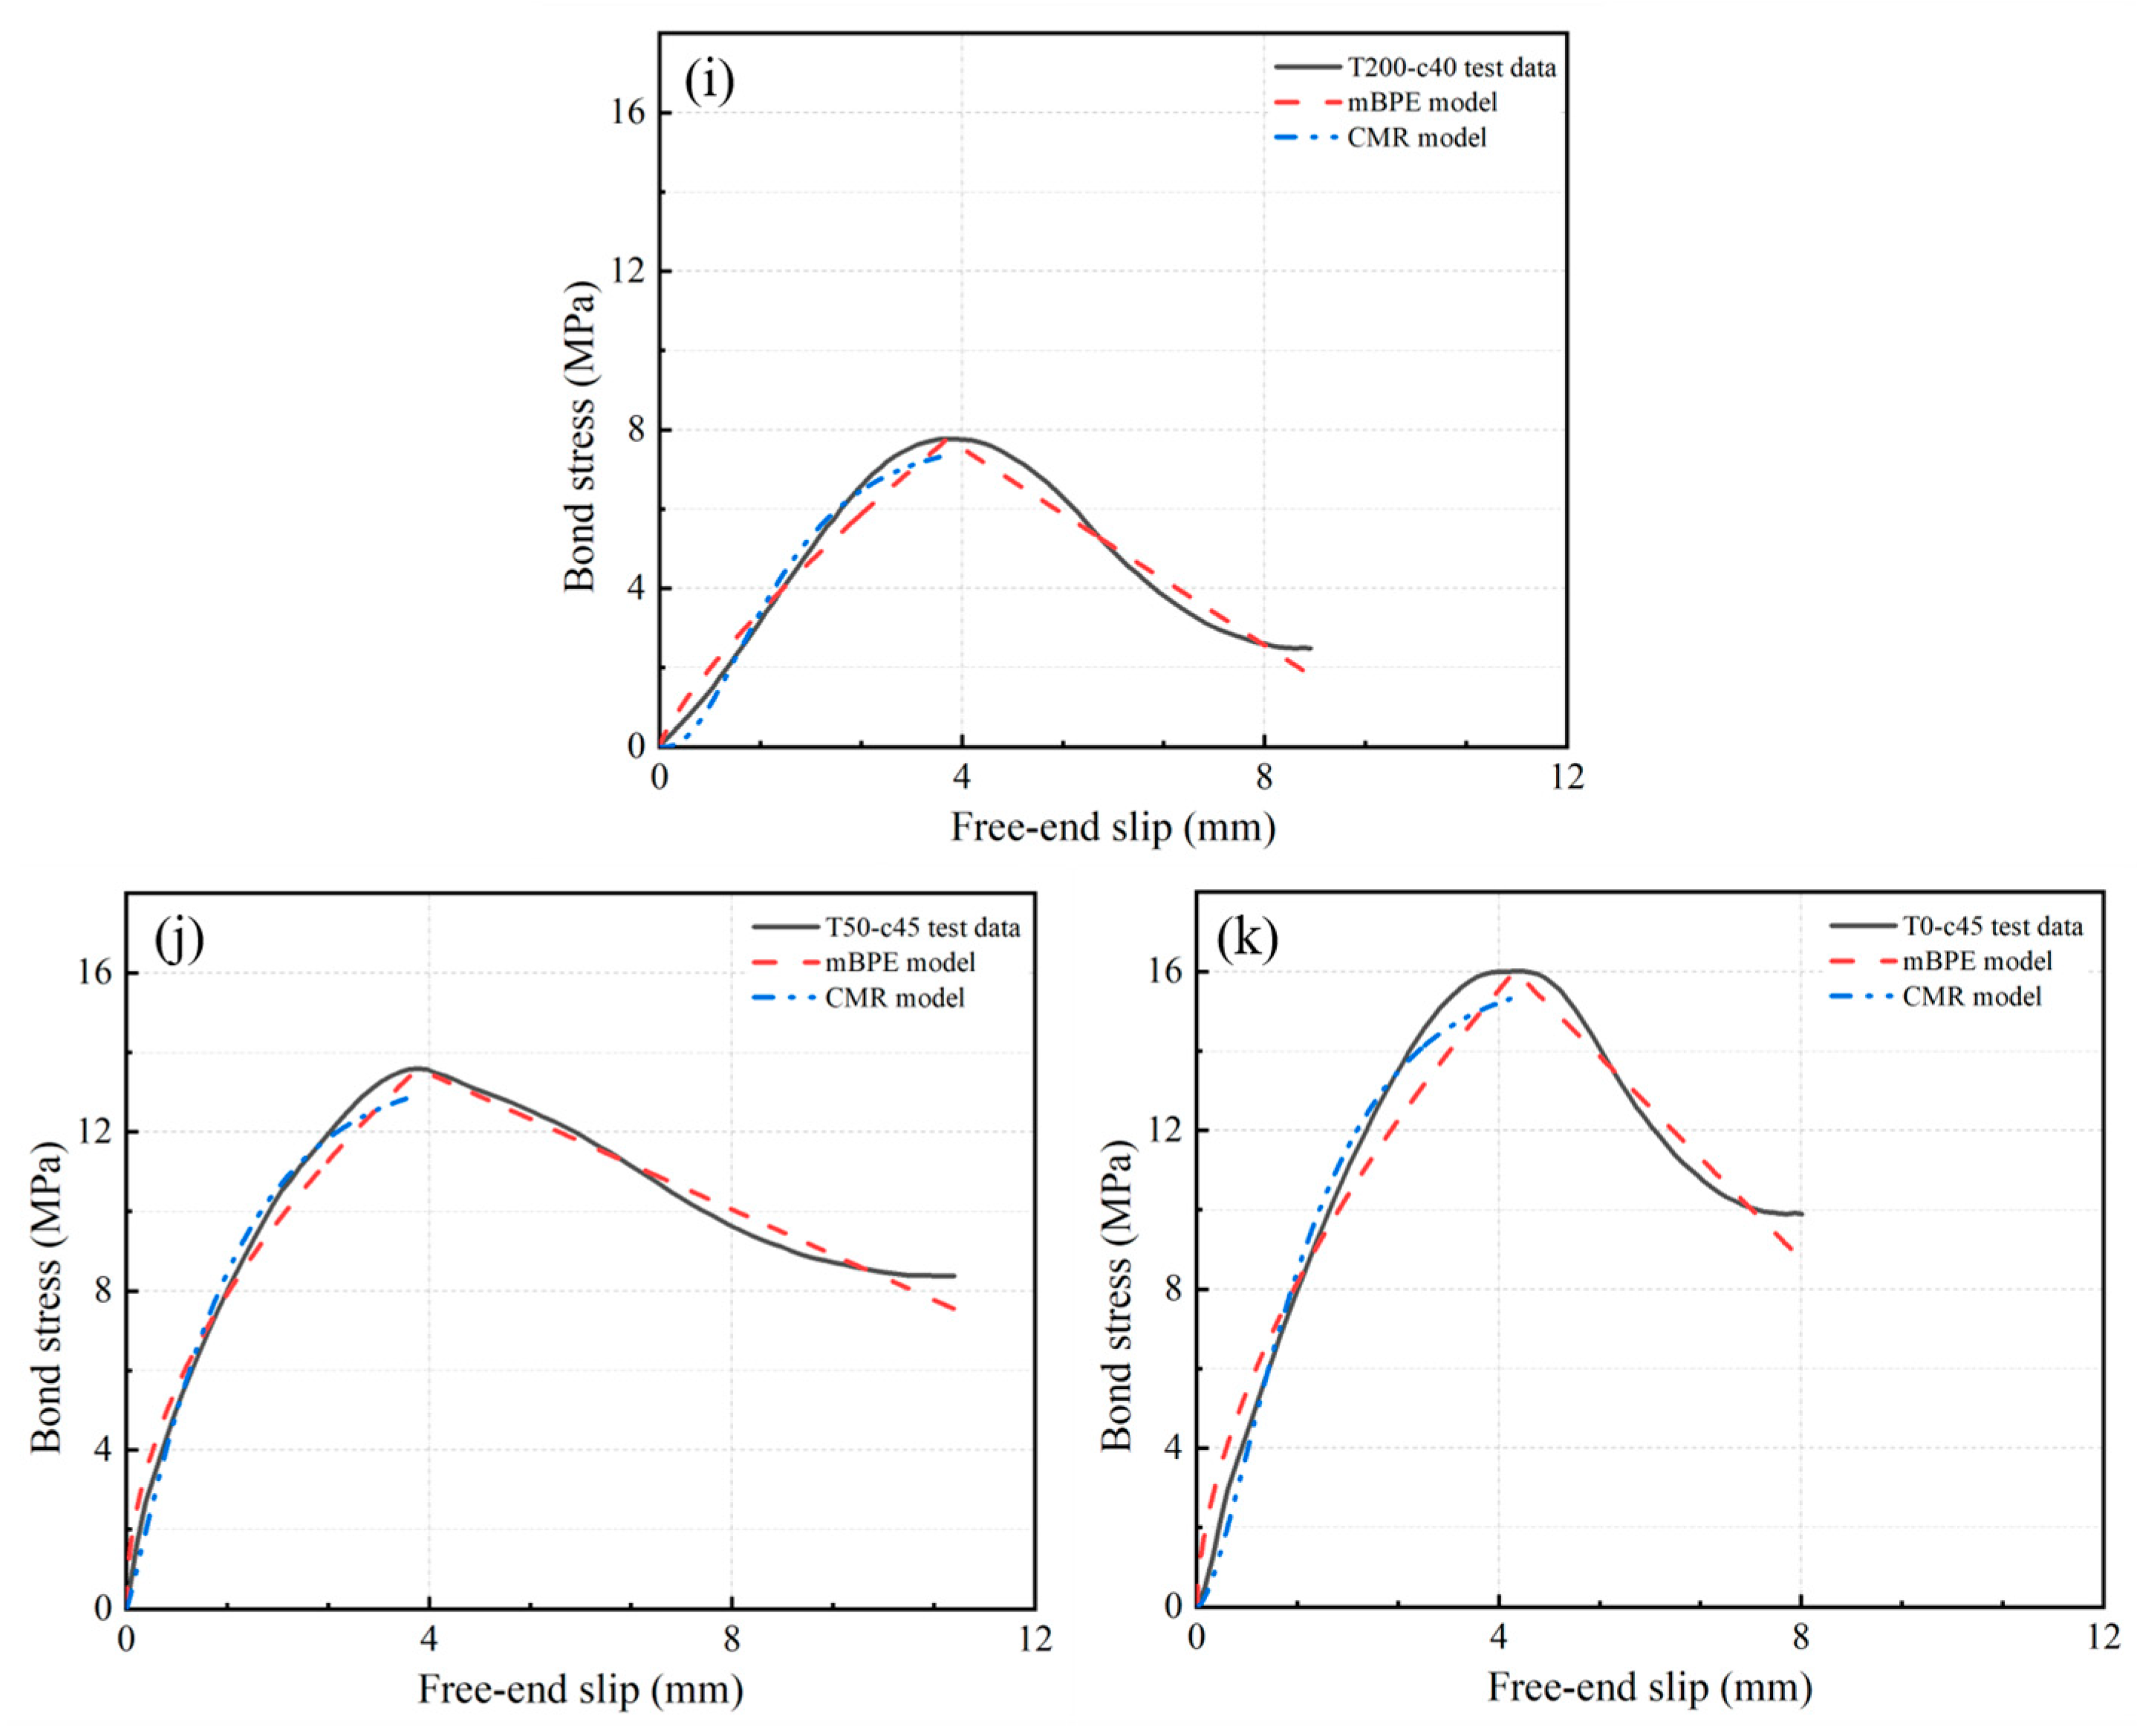
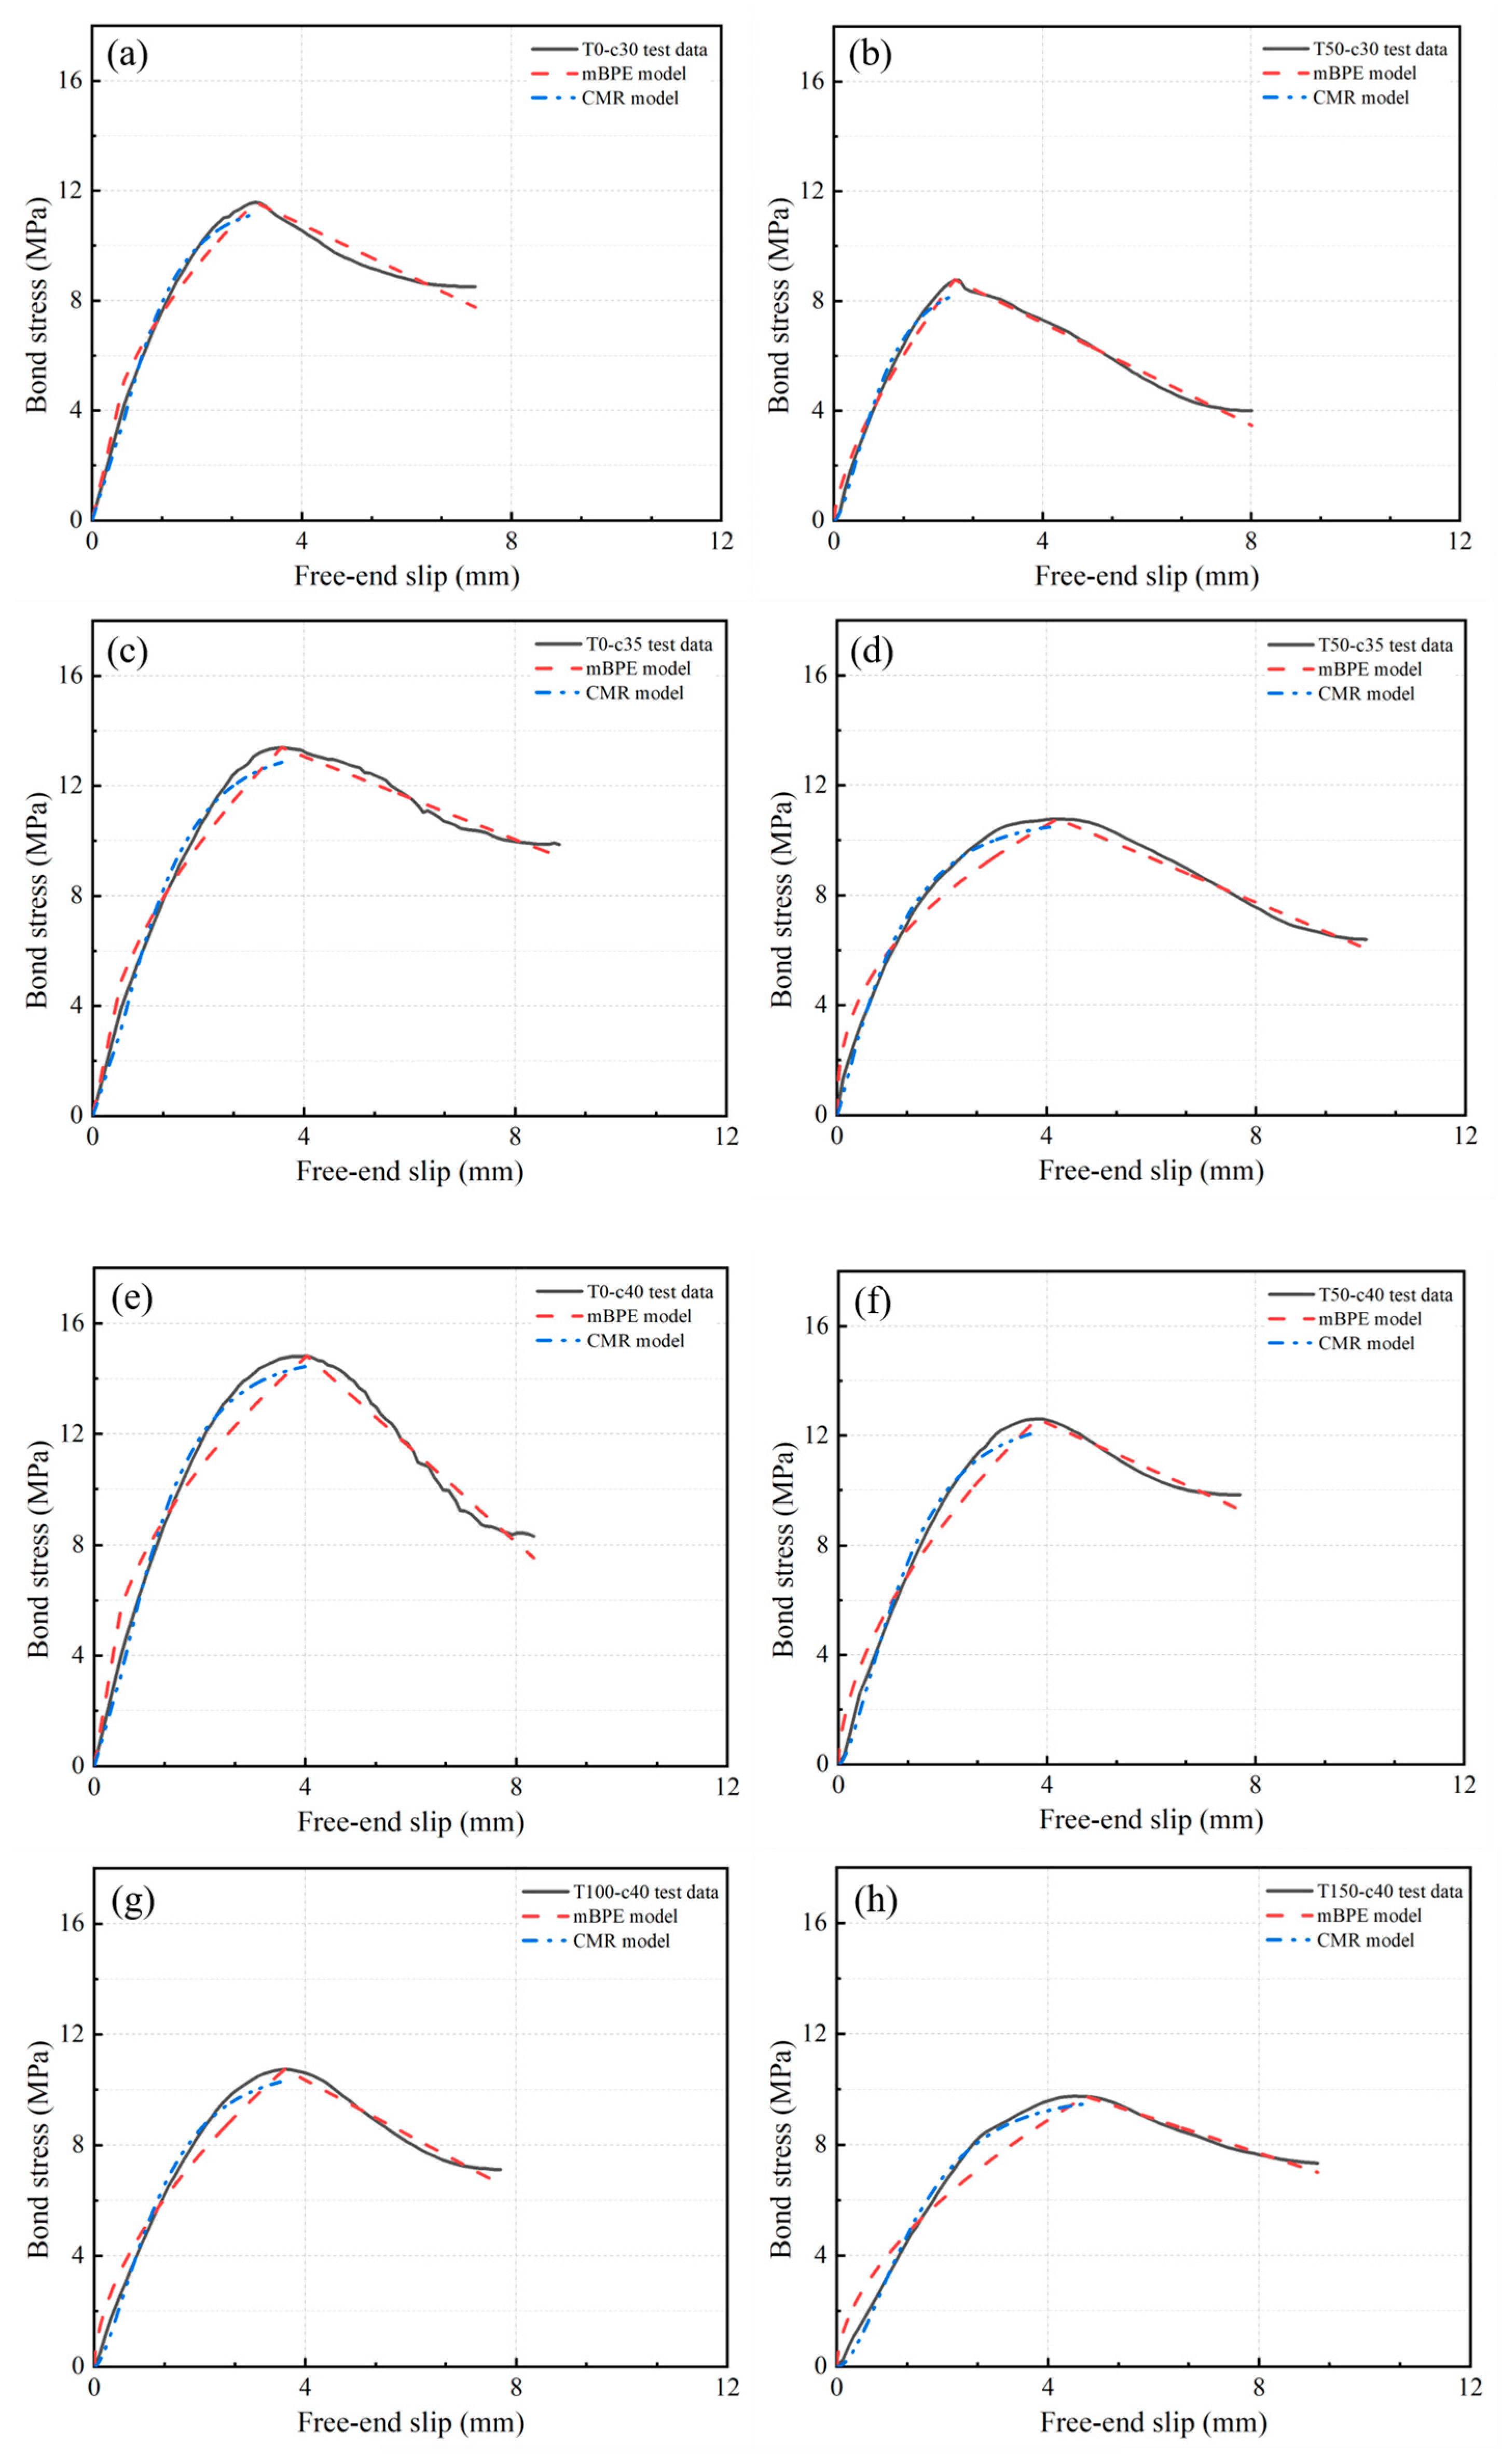
3.2.2. Bond Stress–Slip Relationships

Figure 20 illustrates bond stress–slip curves for specimens featuring various concrete protective layer thicknesses and different numbers of freezing–thawing cycles. The bond stress–slip relationship can be delineated into two distinct types, one for split-damaged specimens and the other for pullout-damaged specimens [52]. In this study, the bond stress–slip curve pertains to specimens exhibiting pullout damage. These curves can be primarily segmented into three stages, the first stage (ascending section), the second stage (descending section), and the third stage (residual section).
The first stage of the bond stress–slip curve is characterized by linear growth during the initial loading phase. In this phase, the curve ascends with a consistent slope, displaying elastic characteristics in the bond stress between SFCB and concrete. As slip increases, damage becomes evident in the ribs connecting SFCB and concrete, leading to a decline in bonding effectiveness. Simultaneously, circumferential tensile stress rises with the growing load. Once this stress surpasses the tensile strength of the protective concrete layer, the curve transitions to a descending stage. During this descending stage, the interconnected ribs sustain damage, resulting in a decreasing trend in bond stress. However, stress unconcentration introduces variations in the descending segments of the curve. As the slip continues to rise, the SFCB at the free end engages with the bond interface, generating a new mechanical anchorage force. Consequently, the bond stress begins to rise again, marking the curve entry into the residual stage. With the increase in slip, the curve attains a new stress peak. Nevertheless, the pullout process inflicts damage upon the SFCB and concrete, leading to cumulative damage. Therefore, the peak stress in the residual stage is significantly smaller than that observed in the first stage.
The bond stress–slip curves for SFCB and SSSC exhibited multiple peaks before and after freezing and thawing. The peaks gradually increased with the thickness of the concrete protective layer, indicating an enhancement in the bond between concrete and steel reinforcement. Conversely, an increase in the number of freezing–thawing cycles resulted in a decrease in the peak value of the curve, signaling a decline in the bond between concrete and reinforcement. The second peak was consistently smaller than the first peak. This discrepancy arises from the destruction of the bond interface during the ascending stage of bond stress. This observation underscores the ductile nature of pullout damage, revealing its resilience in the face of structural stress.

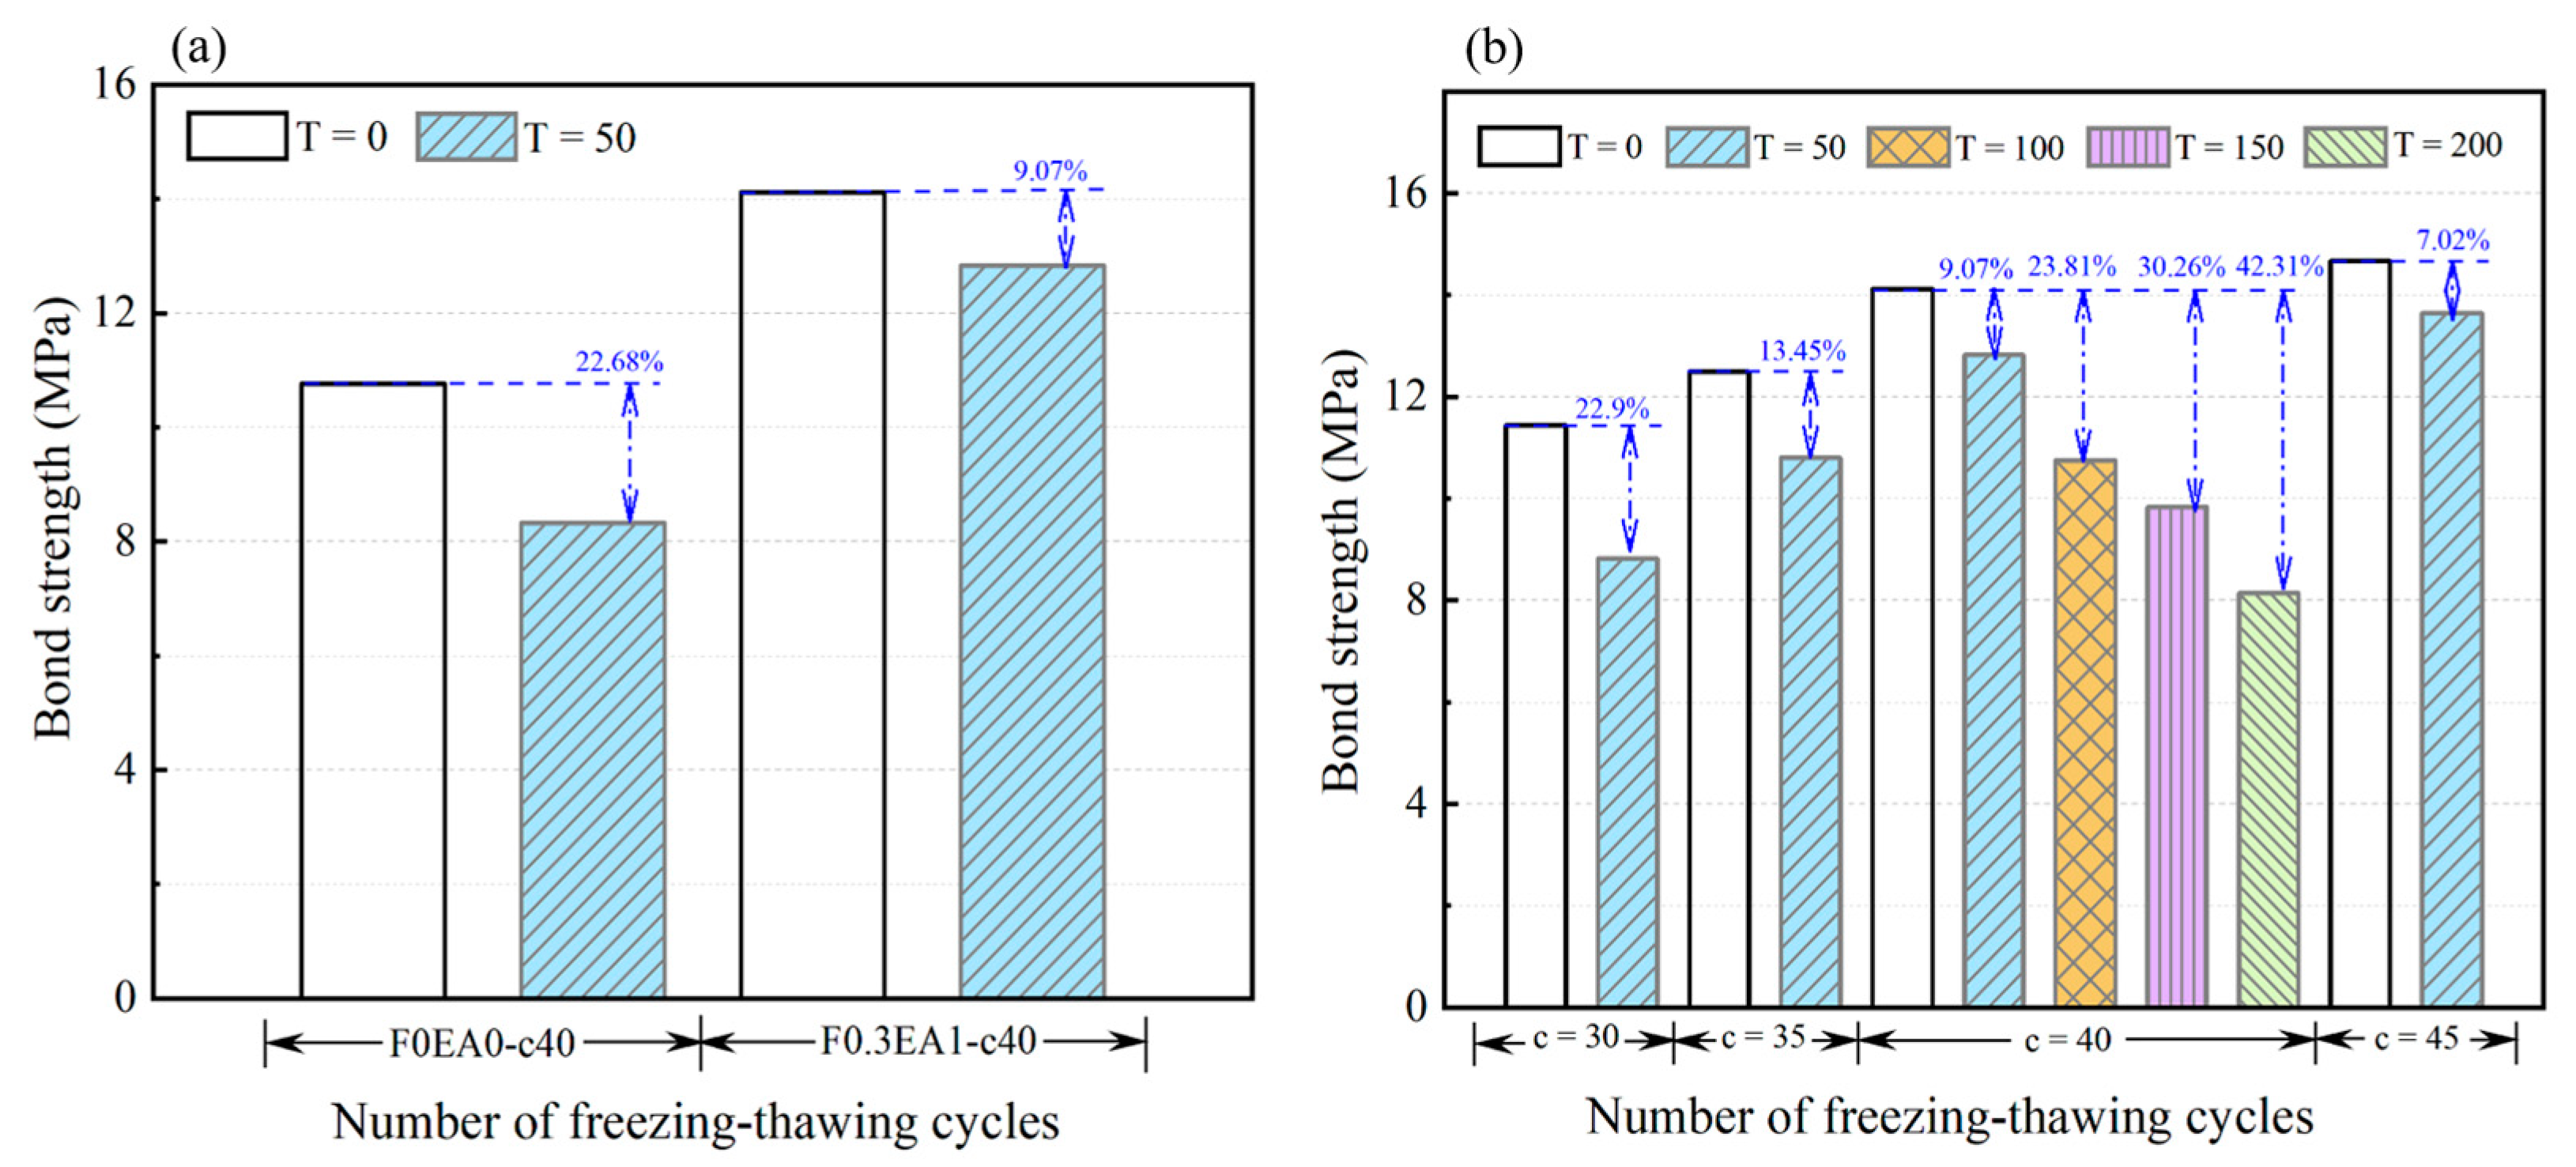
3.2.3. Bond Strength

In this study, bond strength τu, relative slip su, and bond stiffness k were chosen to evaluate bond performance. Pullout damage was observed as the prevalent damage mode in all groups, with complete damage occurring between bond interfaces, as detailed in Table 4. Figure 21 illustrates the evolving trend of interfacial bond strength between SFCB and SSSC under varying concrete protective layer thicknesses and freezing–thawing cycles. In Figure 21a, the F0.3EA1 group, incorporating GF and EA, demonstrated a significant enhancement in the anti-freezing bond durability of SSSC compared to the F0EA0 group. The bond strength loss rate decreased from 22.68% to 9.07% after 50 freezing–thawing cycles. In Figure 21b, the bond strength exhibited an upward trajectory with increasing concrete protective layer thickness. In case of an increase in the thickness of the protective layer, the ability of concrete to restrain the reinforcement is strengthened, and the reinforcement is elongated by tensile force; hence, the bond strength increases, which is similar to the conclusion reached by the previous authors [53,54]. However, at a certain thickness of the concrete protective layer, the bond strength of the specimens all decreased after freezing–thawing cycles.
Following 50 freezing–thawing cycles, the specimens exhibited varying degrees of bond strength degradation. After 200 freezing–thawing cycles, the bond strength of F0.3EA1 decreased by 42.31% compared to the unfrozen condition. The decline in bond strength correlates with the damage status of the bond interface, which deteriorates as freezing–thawing cycles increase. The freezing–thawing cycle action induces loosening and spalling of SSSC, accompanied by the appearance of cracks and pores at the concrete interface. Internal cracks expand over time, and the freezing–thawing damage shifts progressively from the external to the internal structure. These factors collectively contribute to the observed decrease in bond strength. Additionally, the higher coefficient of thermal expansion in SFCB than in SSSC, especially at lower temperatures, causes greater contraction in SFCB. This contraction creates gaps between the interfaces, resulting in a loss of bond performance.
However, a large number of previous studies have suggested that the freezing–thawing cycling action minimally impacts the bond strength between stressed reinforcement and concrete [55,56]. These conclusions may be nuanced, as the experiments in those studies utilized center-drawn specimens, resulting in a thicker concrete protective layer than typically found in the actual project. This deviation from actual project conditions prompted our study to employ eccentric drawing tests. In this study, the bond strength of F0.3EA1-c40 significantly degraded after 200 freezing–thawing cycles. The larger the thickness of the concrete protective layer, the smaller the rate of bond strength loss under the same number of freezing–thawing cycles. This suggests a notable influence of concrete protective layer thickness on bond durability between SFCB and concrete in freezing–thawing environments. The existing studies may overestimate the bond durability between the stressed reinforcement and concrete under a freezing–thawing environment. Thus, considering both the number of freezing–thawing cycles and the concrete protective layer thickness, we propose the following formula for τu:
τ u = A + B
A = 5.8731 + 0.8024 c 0.1087 n
B = 0.0077 c 2 + 2.766 × 10 6 n 2 + 0.00198 c n
where A is primarily related to the concrete protective layer thickness (c) and the number of freezing–thawing cycles (n), while B is a secondary formula considering the same parameters. Table 5 presents a comparison between theoretical values and experimental data, with the relative error (RE) staying within 5%.
Analysis of Table 5 reveals a substantial decrease in relative slip (su) with an increasing number of freezing–thawing cycles, aligning with findings from previous studies [57,58]. To account for the impacts of freezing–thawing cycles and concrete protective layer thickness on relative slip, we propose the following formula for su:
s u = C + D
C = 4.0755 + 0.3625 c 0.0357 n
D = 0.00386 c 2 + 7.651 × 10 6 n 2 + 7.058 × 10 4 c n
where C is the primary formula connected to concrete protective layer thickness (c) and freeze–thaw cycles (n), while D is a secondary formula considering the same parameters. The comparison of theoretical values with test data in Table 4 indicates a relative error (RE) within 5%.

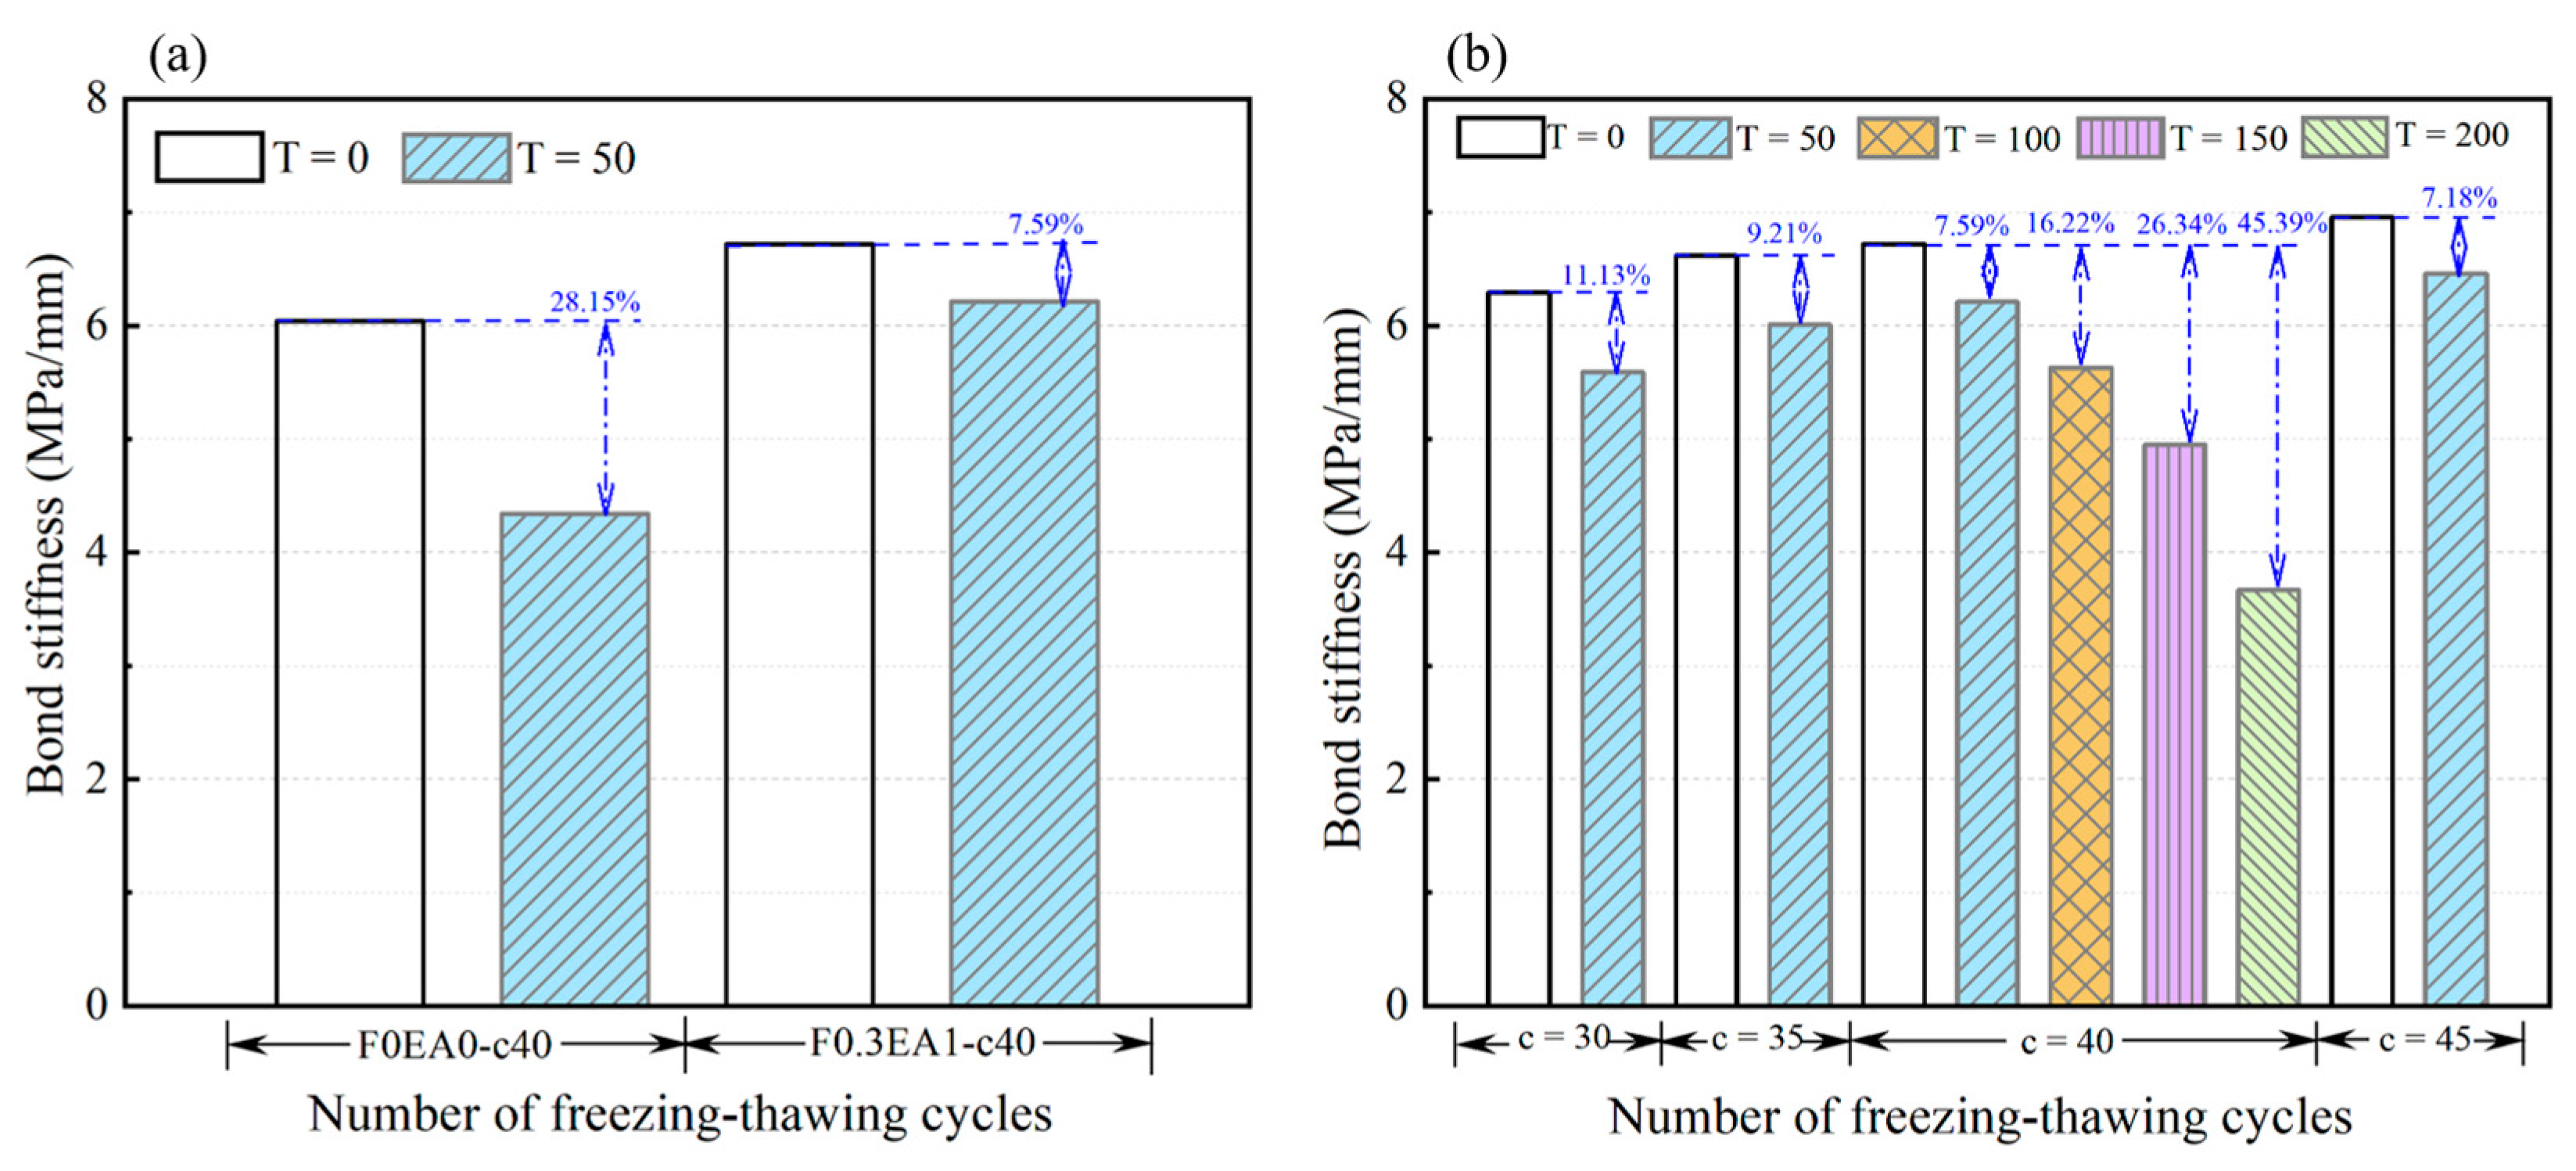
3.2.4. Bond Stiffness

Figure 22 illustrates the impact of varying concrete protective layer thicknesses and freezing–thawing cycles on bond stiffness. According to the previous study [59], bond stiffness (k) is defined as the slope of the cut line in the bond stress–slip curve at a slip of 0.5 mm.
From Figure 22a, it can be found that the specimens of the F0.3EA1 group have an inhibitory effect on the freezing–thawing degradation of bond stiffness due to the incorporation of GF and EA, in contrast to the F0EA0 group. At room temperature, the bond stiffness of the GF- and EA-doped specimens closely resembles that of the F0EA0 group. However, after 50 freezing–thawing cycles, the bond stiffness loss rate increases from 28.15% to 7.59%. From Figure 22b, an observable trend is the increase in bond stiffness with the augmentation of the protective layer thickness. A thicker protective layer in concrete enhances the restraining effect on SGFCB bar pullout, leading to a reduced rate of bond stiffness loss with increasing layer thickness. Specifically, when the protective layer thickness escalates from 30 mm to 45 mm, the bond stiffness loss rate decreases from 11.13% to 7.18% after 50 freezing–thawing cycles. It is noteworthy that bond stiffness decreases as the number of freezing–thawing cycles increases, holding the thickness of the concrete protective layer constant.
During the initial 50 freezing–thawing cycles, freezing–thawing damage primarily accumulated on the thinner side of the concrete, resulting in a relatively small bond stiffness loss rate in the specimens. However, with a growing number of freezing–thawing cycles, the damage extended from the outer concrete layer of SFCB to the inner layers, leading to a gradual increase in the bond stiffness loss rate. After 200 freezing–thawing cycles, this rate can escalate to 45.39%. The mechanism behind the bond stiffness loss parallels that of bond strength. The freezing–thawing cycle action causes the expansion of pores and cracks in SSSC, elevating porosity. This contributes to a reduction in the clamping force of SSSC on SFCB, making it easier for SFCB to be pulled out.
To account for the impact of freezing–thawing cycles and the thickness of the protective concrete layer on bond stiffness (k), we establish the following formula for k:
k = 2.2493 + 0.1861 c 0.00844 n 0.00181 c 2 3.362 × 10 5 n 2
where c is the thickness of the protective layer with concrete, and n is the number of freezing–thawing cycles. The comparison of theoretical values with experimental data is shown in Table 5, with the relative error (RE) found to be within 5%.

4. Calibration of Constitutive Models

The bond stress–slip principal model, as the key to bond research, offers a comprehensive depiction of the bond interaction between reinforcement and concrete. Currently, a large number of models reflecting the bond–slip behavior of reinforced concrete have been developed, leading scholars to establish FRP bar-concrete stress–slip constitutive models, primarily the BPE model and CMR model [60,61,62]. However, the ontological model for the stress–slip relationship between SFCB and concrete remains imperfect. Notably, existing models do not account for the effects of the freezing–thawing environment and the thickness of the concrete protective layer on bond performance. Therefore, it is necessary to extend the bond stress–slip ontological model of SFCB with concrete to more accurately depict the bonding performance between SFCB and SSSC. Given the enhanced frost durability of SSSC with the incorporation of GF and EA, the effects of the number of freezing–thawing cycles and the thickness of the concrete protective layer are also considered. In this study, the commonly used modified Bertero–Eligehausen–Popov (mBPE) model and Cosenza–Manfredi–Realfonzo (CMR) model are used as references to establish the bond stress–slip ontological model about SFCB and GF-EA-SSSC.
Among them, the bond stress–slip relationship of the mBPE model can be expressed as follows:
τ = τ u s / s u a 0     s     s u τ u 1 p s s u 1 s u   <   s   s r τ r s   >   s r
where a and p are empirical parameters, and τr and sr are the bond stress and slip at the intersection of the descending and residual stages, respectively.
However, the mBPE model employs a horizontal straight line to approximate the residual segment curve, resulting in an inadequate prediction of the residual stage. In this study, only the ascending and descending segments of the mBPE model were fitted, disregarding the residual stage.
On the other hand, the CMR model primarily focuses on describing the ascending phase of the curve and does not fully capture the entire bond stress–slip curve. The bond stress–slip relationship in the CMR model is expressed as follows:
τ = τ u 1 exp s α β   0 s s u
where α and β are empirical parameters.
In comparison, the CMR model exhibits a better fit for the ascending phase than the mBPE model. The fitting results of the improved intrinsic model match well with the experimental data, as shown in Figure 23. The specific empirical parameter values are given in Table 6.

5. Conclusions

In this study, 13 concrete mix proportions were devised, and 39 specimens of SFCB embedded in SSSC underwent eccentric pullout tests. The investigation focused on assessing the bond durability of SFCB and GF-EA-SSSC under freezing–thawing conditions. The study considered five sets of freezing–thawing cycles (T) and four varying thicknesses of the concrete protective layer (c) as the independent variables. The primary conclusions drawn from this research are as follows:
(1) The SSSC undergoes a loosening and brittleness transformation under freezing–thawing cycles. Incorporating glass fiber and expansion agents can enhance the ability of concrete to resist freezing–thawing damage. Initially, cracks emerge from the weakest point of the concrete. As the number of freezing–thawing cycles increases, damage accumulates from the exterior to the interior, leading to a gradual escalation in both crack size and quantity. Upon reaching 150–200 freezing–thawing cycles, significant spalling occurs on the surface of the specimen, with an expanding spalling area. The damage pattern shifts from tensile damage to diagonal cut damage as freezing–thawing cycles progress.
(2) As the number of freezing–thawing cycles increases, there is a concurrent decrease in compressive strength and an increase in mass loss. In the initial stages of the freezing–thawing cycle, the decrease in compressive strength is gradual, and mass loss is minimal. Microcracks have a negligible impact on compressive strength, and the specimen retains its structural integrity. After surpassing 100 freezing–thawing cycles, concrete damage accumulates significantly. The internal structure transitions from dense to loose, leading to extensive spalling from the exterior to the interior. Compressive strength exhibits a noticeable decline, accompanied by an increase in quality loss. By the time 200 freezing–thawing cycles are reached, the loss of compressive strength amounts to 55.05%, and the quality loss rate reaches 6.36%.
(3) Analyzing the stress–strain curve reveals that freezing–thawing action not only impacts the compressive strength of concrete but also influences the characteristics of the concrete damage stage. With an escalation in the number of freezing–thawing cycles, compressive strength diminishes, the peak strain initially rises and then decreases, and the stress–strain curve sharply descends after reaching the peak point. This phenomenon indicates an increase in brittleness and a decrease in ductility for SSSC. The freezing–thawing cycles induce heterogeneous damage within the concrete interior. Stress concentration during the damage stage results in the manifestation of brittle damage.
(4) The dynamic elastic modulus experiences a decline as the number of freezing–thawing cycles increases. In the initial phase of the freezing–thawing cycle, the decrease in dynamic elastic modulus is gradual. However, as the number of freezing–thawing cycles advances, the impact of freezing–thawing damage intensifies, progressing from the outer layer to the inner layers of concrete. Consequently, the development of cracks and pores within the concrete becomes increasingly profound, leading to an accelerated rate of decrease in dynamic elastic modulus.
(5) Following freezing–thawing cycles, the majority of specimens subjected to the eccentric pullout test exhibited rebar pullout damage. The bond performance at the bonded interface of the pulled specimens diminished, and there was a continuous decrease in the quantity of residual fibers on the concrete interface, along with wear on the SFCB interface. Maintaining a constant number of freezing–thawing cycles, an increase in the thickness of the concrete protective layer altered the damage mode of entangled fibers. The shift occurred from fracture to spalling and subsequently from spalling to abrasion. Notably, residual fibers remained at the interface, and the SSSC has a better restraining effect on the SFCB. With a fixed concrete protective layer thickness, an escalation in the number of freezing–thawing cycles resulted in a gradual reduction in bond interface damage. The damage at the concrete interface transitioned from bond–slip damage to freezing–thawing damage.
(6) The bond stress–slip curves for specimens exhibiting pullout damage vary with different thicknesses of the concrete protective layer and the number of freezing–thawing cycles. In the initial loading stage, the bond stress between SFCB and SSSC demonstrates elastic characteristics. Once the curve reaches its peak stress value, it transitions into the descending and residual sections. The bond stress–slip curve exhibits multiple peaks before and after freezing and thawing. As the thickness of the concrete protective layer increases, the peak value of the curve gradually rises, indicating enhanced bond stress between SFCB and SSSC. Conversely, with an increase in the number of freezing–thawing cycles, the peak of the curve decreases, signifying a reduction in the bond stress between SFCB and SSSC. The second peak is generally much smaller than the first peak, indicating that the pullout damage is ductile in nature.
(7) Under various thicknesses of the concrete protective layer and differing numbers of freezing–thawing cycles, the trends observed in bond strength, relative slip, and bond stiffness exhibited similarities. With a constant concrete protective layer thickness, an increase in the number of freezing–thawing cycles resulted in a decrease in both bond strength and bond stiffness, accompanied by an increase in relative slip. After 200 freezing–thawing cycles, the bond strength decreased by 42.31% relative to the unfrozen-thawed condition, and the loss of bond stiffness could reach 45.39%. The restraining effect on SFCB pullout was found to improve with a thicker concrete protective layer. Additionally, the rate of loss in bond strength and bond stiffness reduced as the protective layer thickness increased. Formulas for bond strength, relative slip, and bond stiffness were established, taking into account the effects of the concrete protective layer thickness and the number of freezing–thawing cycles in the eccentric pullout test. The relative error between theoretical and experimental values was within 5%.
(8) In this study, GF and EA were introduced to enhance the frost durability of SSSC, and the mBPE model and CMR model were refined to account for the influence of the number of freezing and thawing cycles as well as the thickness of the concrete protective layer. These modifications aimed to establish a bond stress–slip constitutive model for the interaction between SFCB and the composite material of GF-EA-SSSC. The fitting results of the improved constitutive model closely resembled the experimental values, demonstrating a high level of accuracy in the predictive capabilities of the model.
(9) This paper investigates the bonding properties between steel–FRP composite bar (SFCB) and glass fiber with expansion-agent-reinforced seawater sea-sand concrete (GF-EA-SSSC) interface using eccentric pullout experiments under different thicknesses of concrete protective cover and a number of freezing–thawing cycles. The eccentric pullout test in this study utilized a single SFCB, without considering the impact of spacing multiple SFCBs on the bond strength of GF-EA-SSSC after freezing–thawing cycles. This divergence from practical engineering standards suggests the potential for refining the test methodology. Following 200 freezing–thawing cycles, the specimens underwent nearly complete freezing, an occurrence rarely observed in practical engineering scenarios. Future research could delve into variations in dynamic elastic modulus and ultrasonic testing post freezing–thawing damage to specific cross-section areas, and the influence of the bonding performance of the interface between steel and concrete, so as to propose a more reliable evaluation method for reinforced concrete members after freezing–thawing damage in practical engineering.

Author Contributions

Conceptualization, Y.L. and W.W.; Methodology, Y.L. and G.L.; Software, J.J.; Validation, Y.S.; Formal analysis, Y.Z. and J.L.; Investigation, Y.Z., J.L. and H.Z.; Resources, G.L.; Data curation, J.L.; Writing—original draft, J.J. and Y.S.; Writing—review & editing, H.Z.; Supervision, W.W.; Project administration, Z.X.; Funding acquisition, W.W. and Z.X. All authors have read and agreed to the published version of the manuscript.

Funding

The authors gratefully acknowledge the financial support provided by the Department of Education Characteristic Innovation Project of Guangdong Province under No. 2021KTSCX211, Guangdong Construction Vocational and Technical College High-level Talent Research Project under No. GCC2021-02, Special Foundation for Scientific and Technological Innovation Strategy of Guangdong Province under Grant No. pdjh2024a137 (in China), Guangdong Yonghe Construction Group Limited–Guangdong University of Technology Industry–Research Cooperation Project under No. 23HK0171, National Innovation and Entrepreneurship Training Program for College Students under Grant No. 202311845030 (in China).

Data Availability Statement

The original data are available upon request. The data are not publicly available due to project privacy.

Conflicts of Interest

Author Gangliang Li was employed by the company Guangdong Yonghe Construction Group Co., Ltd. The remaining authors declare that the research was conducted in the absence of any commercial or financial relationships that could be construed as a potential conflict of interest.

References

  1. Huang, Y.; Chen, T.; Hu, D.; Lin, T.; Zhu, W.; Zhang, G.; Xue, X. Spatiotemporal patterns and influencing factors of urban ecological space availability in coastal cities of China during rapid urbanization. Ecol. Indic. 2023, 154, 110757. [Google Scholar] [CrossRef]
  2. Zhao, T.; Zhang, Y.; Li, K.; Wang, J.; Cai, E.; Lin, G.; Li, Z. A copula approach in the probabilistic evaluation of chloride ingress process for coastal concrete structures. Structures 2023, 56, 104918. [Google Scholar] [CrossRef]
  3. Ren, Q.; Tao, Y.; Jiang, Z.; De Schutter, G. Adhesive and rheological properties of fresh mortar with manufactured sand as replacement of river sand. Constr. Build. Mater. 2024, 411, 134303. [Google Scholar] [CrossRef]
  4. Xiang, J.; Qiu, J.; Wu, P.; Zhang, Q.; Song, Y.; Yang, L. Autolytic capsules incorporating alkali-activated slag system for self-healing cementitious composites. Cem. Concr. Compos. 2024, 147, 105439. [Google Scholar] [CrossRef]
  5. Xiang, J.; Qiu, J.; Zhao, Y.; Zheng, P.; Peng, H.; Fei, X. Rheology, mechanical properties, and hydration of synergistically activated coal gasification slag with three typical solid wastes. Cem. Concr. Compos. 2023, 147, 105418. [Google Scholar] [CrossRef]
  6. Wang, X.; Dong, C.; Xu, S.; Song, Q.; Ren, J.; Zhu, J. Influence of seawater and sea sand on early-age performance and cracking sensitivity of concrete. J. Build. Eng. 2023, 79, 107811. [Google Scholar] [CrossRef]
  7. Zhen, H.; Xiong, Z.; Song, Y.; Li, L.; Qiu, Y.; Zou, X.; Chen, B.; Chen, D.; Liu, F.; Ji, Y. Early mechanical performance of glass fibre-reinforced manufactured sand concrete. J. Build. Eng. 2024, 83, 108440. [Google Scholar] [CrossRef]
  8. Xiong, Z.; Su, Y.; Hu, Z.; Huang, Y.; Wang, Z.; Chen, J.; Lao, W.; Li, L.; Zhou, K.; Kuang, J. Dynamic compression study of seawater sea sand concrete incorporated with expansive agents and glass fibre. J. Build. Eng. 2023, 79, 107942. [Google Scholar] [CrossRef]
  9. Guan, H.; Hao, B.; Zhang, G. Mechanical properties of concrete prepared using seawater, sea sand and spontaneous combustion coal gangue. Structures 2023, 48, 172–181. [Google Scholar] [CrossRef]
  10. Wang, F.; Sun, Y.; Xue, X.; Wang, N.; Zhou, J.; Hua, J. Mechanical properties of modified coral aggregate seawater sea-sand concrete: Experimental study and constitutive model. Case Stud. Constr. Mater. 2023, 18, e02095. [Google Scholar] [CrossRef]
  11. Li, S.; Zhu, D.; Guo, S.; Yi, Y.; Feng, G. Experimental study on the effects of dynamic loading and seawater attack on bond behavior between basalt fiber reinforced polymer bars and seawater sea-sand concrete. J. Build. Eng. 2023, 72, 106505. [Google Scholar] [CrossRef]
  12. Xiong, Z.; Mai, G.; Qiao, S.; He, S.; Zhang, B.; Wang, H.; Zhou, K.; Li, L. Fatigue bond behaviour between basalt fibre-reinforced polymer bars and seawater sea-sand concrete. Ocean Coast. Manag. 2022, 218, 106038. [Google Scholar] [CrossRef]
  13. Peng, K.-D.; Zeng, J.-J.; Huang, B.-T.; Huang, J.-Q.; Zhuge, Y.; Dai, J.-G. Bond performance of FRP bars in plain and fiber-reinforced geopolymer under pull-out loading. J. Build. Eng. 2022, 57, 104893. [Google Scholar] [CrossRef]
  14. Hu, K.; Chen, Z.; Kang, H.; Tang, Y. 3D vision technologies for a self-developed structural external crack damage recognition robot. Autom. Constr. 2024, 159, 105262. [Google Scholar] [CrossRef]
  15. Chen, Z.; Yu, J.; Nong, Y.; Yang, Y.; Zhang, H.; Tang, Y. Beyond time: Enhancing corrosion resistance of geopolymer concrete and BFRP bars in seawater. Compos. Struct. 2023, 322, 117439. [Google Scholar] [CrossRef]
  16. Bujotzek, L.; Beck, D.; Apostolidi, E.; Waldmann, D. Experimental and statistical investigations of the material properties of FRP reinforcement in compression. Constr. Build. Mater. 2024, 414, 134782. [Google Scholar] [CrossRef]
  17. Zeng, J.-J.; Li, P.-L.; Yan, Z.-T.; Zhou, J.-K.; Quach, W.-M.; Zhuge, Y. Behavior of 3D-printed HPC plates with FRP grid reinforcement under bending. Eng. Struct. 2023, 294, 116578. [Google Scholar] [CrossRef]
  18. Hakeem, I.; Hosen, M.A.; Alyami, M.; Qaidi, S.; Özkılıc, Y. Influence of Heat–Cool Cyclic Exposure on the Performance of Fiber-Reinforced High-Strength Concrete. Sustainability 2023, 15, 1433. [Google Scholar] [CrossRef]
  19. Çelik, A.İ.; Özkılıç, Y.O.; Bahrami, A.; Hakeem, I.Y. Effects of glass fiber on recycled fly ash and basalt powder based geopolymer concrete. Case Stud. Constr. Mater. 2023, 19, e02659. [Google Scholar] [CrossRef]
  20. Gemi, L.; Madenci, E.; Özkılıç, Y.O. Experimental, analytical and numerical investigation of pultruded GFRP composite beams infilled with hybrid FRP reinforced concrete. Eng. Struct. 2021, 244, 112790. [Google Scholar] [CrossRef]
  21. Rafieizonooz, M.; Kim, J.-H.J.; Varaee, H.; Nam, Y.; Khankhaje, E. Testing methods and design specifications for FRP-prestressed concrete members: A review of current practices and case studies. J. Build. Eng. 2023, 73, 106723. [Google Scholar] [CrossRef]
  22. Zeng, J.-J.; Chen, S.-P.; Feng, P.; Zhuge, Y.; Peng, K.-D.; Dai, J.-G.; Fan, T.-H. FRP bar-reinforced ultra-high-performance concrete plates with a grouting sleeve connection: Development and flexural behavior. Eng. Struct. 2023, 287, 116164. [Google Scholar] [CrossRef]
  23. Zaki, M.A.; Rasheed, H.A. Behavior of reinforced concrete beams strengthened using CFRP sheets with innovative anchorage devices. Eng. Struct. 2020, 215, 110689. [Google Scholar] [CrossRef]
  24. Smith, S.T.; Rasheed, H.A.; Kim, S.J. Full-range load-deflection response of FRP-strengthened RC flexural members anchored with FRP anchors. Compos. Struct. 2017, 167, 207–218. [Google Scholar] [CrossRef]
  25. Xu, L.; Wang, X.; Pan, J.; Zhou, J.; Liu, W. Bond behavior between steel-FRP composite bars and engineered cementitious composites in pullout conditions. Eng. Struct. 2024, 299, 117086. [Google Scholar] [CrossRef]
  26. Han, S.; Zhou, A.; Fan, C.; Xiao, G.; Ou, J. Axial-flexural performance of columns reinforced by steel-FRP composite bars and FRP ties. Compos. Struct. 2023, 322, 117435. [Google Scholar] [CrossRef]
  27. Zhang, P.-F.; Iqbal, M.; Zhang, D.; Zhao, X.-L.; Zhao, Q. Bond strength prediction of FRP bars to seawater sea sand concrete based on ensemble learning models. Eng. Struct. 2024, 302, 117382. [Google Scholar] [CrossRef]
  28. Wang, Q.; Zhu, H.; Zhang, B.; Zhao, Y.; Li, F. Bond enhancement for BFRP bar in concrete by using a resin-filled FRP tube anchorage. Structures 2022, 39, 1107–1117. [Google Scholar] [CrossRef]
  29. Wang, J.; Xiao, F.; Yang, J. Experimental study on bond behavior between epoxy-coated reinforcement (ECR) and seawater sea-sand concrete (SSC) under FRP-steel confinement. Constr. Build. Mater. 2023, 385, 131426. [Google Scholar] [CrossRef]
  30. Xu, L.; Ma, X.; Pan, J.; Zhou, J.; Wang, X.; Liu, W. Investigation on bond behavior of steel-FRP composite bars in engineered cementitious composites by spliced beam tests. Constr. Build. Mater. 2023, 407, 133480. [Google Scholar] [CrossRef]
  31. Dong, Z.; Wu, G.; Xu, Y. Experimental study on the bond durability between steel-FRP composite bars (SFCBs) and sea sand concrete in ocean environment. Constr. Build. Mater. 2016, 115, 277–284. [Google Scholar] [CrossRef]
  32. Chang, Y.; Wang, Y.; Wang, M.; Zhou, Z.; Ou, J. Bond durability and degradation mechanism of GFRP bars in seawater sea-sand concrete under the coupling effect of seawater immersion and sustained load. Constr. Build. Mater. 2021, 307, 124878. [Google Scholar] [CrossRef]
  33. Li, J.; Gravina, R.J.; Smith, S.T.; Visintin, P. Bond strength and bond stress-slip analysis of FRP bar to concrete incorporating environmental durability. Constr. Build. Mater. 2020, 261, 119860. [Google Scholar] [CrossRef]
  34. Lu, Z.; Zhao, C.; Zhao, J.; Shi, C.; Xie, J. Bond durability of FRP bars and seawater–sea sand–geopolymer concrete: Coupled effects of seawater immersion and sustained load. Constr. Build. Mater. 2023, 400, 132667. [Google Scholar] [CrossRef]
  35. Shakiba, M.; Bazli, M.; Karamloo, M.; Mortazavi, S.M.R. Bond-slip performance of GFRP and steel reinforced beams under wet-dry and freeze-thaw cycles: The effect of concrete type. Constr. Build. Mater. 2022, 342, 127916. [Google Scholar] [CrossRef]
  36. Cao, Q.; Xu, J.; Wu, Z.; Zhang, L. Performance of damaged concrete stub columns strengthened with post-tensioned CFRP under freezing-thawing environment. Structures 2023, 47, 544–556. [Google Scholar] [CrossRef]
  37. Mai, G.; Li, L.; Lin, J.; Wei, W.; He, S.; Zhong, R.; Xiong, Z. Bond durability between BFRP bars and recycled aggregate seawater sea-sand concrete in freezing-thawing environment. J. Build. Eng. 2023, 70, 106422. [Google Scholar] [CrossRef]
  38. Jin, M.; Li, W.; Wang, X.; Tang, J.; Teng, L.; Ma, Y.; Zeng, H. Investigating the dual influence of freezing-thawing cycles and chloride ion penetration on GGBS-AEA concrete deterioration. J. Build. Eng. 2023, 78, 107759. [Google Scholar] [CrossRef]
  39. Qiu, J.; Li, L.; Li, L.; Luan, X.; Guan, X.; Niu, G. Study on the deterioration characteristics and mechanisms of recycled brick-concrete aggregate concrete under load-freeze-thaw coupling. Constr. Build. Mater. 2024, 413, 134817. [Google Scholar] [CrossRef]
  40. Xiang, J.; Qu, L.; Fei, X.; Qiu, J.; Kong, X. Depth-dependent self-healing capacity and mechanism of cracked fiber-reinforced concrete by bacterial community. J. Build. Eng. 2024, 84, 108485. [Google Scholar] [CrossRef]
  41. Xiong, Z.; He, S.H.; Kwan, A.K.H.; Li, L.G.; Zeng, Y. Compressive behaviour of seawater sea-sand concrete containing glass fibres and expansive agents. Constr. Build. Mater. 2021, 292, 123309. [Google Scholar] [CrossRef]
  42. Zhu, H.; Xiong, Z.; Song, Y.; Zhou, K.; Su, Y. Effect of expansion agent and glass fiber on the dynamic splitting tensile properties of seawater–sea-sand concrete. Buildings 2024, 14, 217. [Google Scholar] [CrossRef]
  43. Lin, M.; He, S.; Qiao, S.; Xiong, Z.; Qiu, Y.; Zhang, J.; Li, L. Combined effects of expansive agents and glass fibres on the fracture performance of seawater and sea-sand concrete. J. Mater. Res. Technol. 2022, 20, 1839–1859. [Google Scholar] [CrossRef]
  44. Busel, J.P.; Shield, C.K. 440.1R-15 Guide for the Design and Construction of Structural Concrete Reinforced with Fiber-Reinforced Polymer (FRP) Bars, Fiber Reinforced Polymers; ACI: Farmington Hills, MI, USA, 2015. [Google Scholar]
  45. ASTM D1141; Standard Specification for Substitute Ocean Water. American Society for Testing and Materials: West Conshohocken, PA, USA, 1975.
  46. ASTM D7705/D7705M-12; D/DM, Standard Test Method for Alkali Resistance of Fiber Reinforced Polymer (FRP) Matrix Composite Bars used in Concrete Construction. ASTM International: Washington, DC, USA, 2019.
  47. Lu, J.; Liu, J.; Yang, H.; Wan, X.; Gao, J.; Zhang, J.; Li, P. Experimental investigation on the mechanical properties and pore structure deterioration of fiber-reinforced concrete in different freeze-thaw media. Constr. Build. Mater. 2022, 350, 128887. [Google Scholar] [CrossRef]
  48. Wang, Y.; Xie, M.; Zhang, J. Mechanical properties and damage model of modified recycled concrete under freeze-thaw cycles. J. Build. Eng. 2023, 78, 107680. [Google Scholar] [CrossRef]
  49. Wu, J.; Jing, X.; Wang, Z. Uni-axial compressive stress-strain relation of recycled coarse aggregate concrete after freezing and thawing cycles. Constr. Build. Mater. 2017, 134, 210–219. [Google Scholar] [CrossRef]
  50. GB/T50082-2009; Introduction of Revised Standard for Test Methods of Long-Term Performance and Durability of Ordinary Concrete. Ministry of Housing and Urban-Rural Development of the People’s Republic of China: Beijing, China, 2010.
  51. Akbas, T.; Celik, O.; Yalcin, C.; Ilki, A. Monotonic and Cyclic Bond Behavior of Deformed CFRP Bars in High Strength Concrete. Polymers 2016, 8, 211. [Google Scholar] [CrossRef] [PubMed]
  52. Zhang, B.; Zhu, H.; Chen, J. Bond durability between BFRP bars and seawater coral aggregate concrete under seawater corrosion environments. Constr. Build. Mater. 2023, 379, 131274. [Google Scholar] [CrossRef]
  53. Yan, F.; Lin, Z.; Zhang, D.; Gao, Z.; Li, M. Experimental study on bond durability of glass fiber reinforced polymer bars in concrete exposed to harsh environmental agents: Freeze-thaw cycles and alkaline-saline solution. Compos. Part B Eng. 2017, 116, 406–421. [Google Scholar] [CrossRef]
  54. Majain, N.; Rahman, A.B.A.; Adnan, A.; Mohamed, R.N. Bond behaviour of deformed steel bars in steel fibre high-strength self-compacting concrete. Constr. Build. Mater. 2022, 318, 125906. [Google Scholar] [CrossRef]
  55. Khanfour, M.A.; El Refai, A. Effect of freeze-thaw cycles on concrete reinforced with basalt fiber-reinforced polymers (BFRP) bars. Constr. Build. Mater. 2017, 145, 135–146. [Google Scholar] [CrossRef]
  56. Wang, W.; Wang, Y.; Chen, Q.; Liu, Y.; Zhang, Y.; Ma, G.; Duan, P. Bond properties of basalt fiber reinforced polymer (BFRP) bars in recycled aggregate thermal insulation concrete under freeze–thaw cycles. Constr. Build. Mater. 2022, 329, 127197. [Google Scholar] [CrossRef]
  57. Alves, J.; El-Ragaby, A.; El-Salakawy, E. Effect of fatigue loads on the bond strength of glass FRP bars to concrete. In Advances in FRP Composites in Civil Engineering: Proceedings of the 5th International Conference on FRP Composites in Civil Engineering (CICE 2010), Beijing, China, 27–29 September 2010; Springer: Berlin/Heidelberg, Germany, 2010; pp. 368–371. [Google Scholar]
  58. Veljkovic, A.; Carvelli, V.; Haffke, M.M.; Pahn, M. Concrete cover effect on the bond of GFRP bar and concrete under static loading. Compos. Part B Eng. 2017, 124, 40–53. [Google Scholar] [CrossRef]
  59. Xiong, Z.; Wei, W.; He, S.; Liu, F.; Luo, H.; Li, L. Dynamic bond behaviour of fibre-wrapped basalt fibre-reinforced polymer bars embedded in sea sand and recycled aggregate concrete under high-strain rate pull-out tests. Constr. Build. Mater. 2021, 276, 122195. [Google Scholar] [CrossRef]
  60. Eligehausen, R.; Popov, E.P.; Bertero, V.V. Local Bond Stress-Slip Relationships of Deformed Bars under Generalized Excitations: Experimental Results and Analytical Model; University of California: Berkeley, CA, USA, 2016. [Google Scholar]
  61. Li, H.; Liu, F.; Pan, Z.; Li, H.; Wu, Z.; Li, L.; Xiong, Z. Use of supplementary cementitious materials in seawater–sea sand concrete: State-of-the-art review. Constr. Build. Mater. 2024, 425, 136009. [Google Scholar] [CrossRef]
  62. Cosenza, E.; Manfredi, G.; Realfonzo, R. Behavior and Modeling of Bond of FRP Rebars to Concrete. J. Compos. Constr. 1997, 1, 40–51. [Google Scholar] [CrossRef]
Figure 1. Raw materials of seawater sea-sand concrete: (a) cement, (b) sea sand, (c) crushed granites, (d) glass fiber, (e) expansion agent, and (f) superplasticizer.
Buildings 14 01121 g001
Figure 2. Particle size distribution diagram of aggregate.
Buildings 14 01121 g002
Figure 3. Steel–FRP composite bars.
Buildings 14 01121 g003
Figure 4. Eccentric pullout specimen preparation: (a) mold and (b) curing condition.
Buildings 14 01121 g004
Figure 5. TDRF-II type concrete rapid freezing–thawing test machine.
Buildings 14 01121 g005
Figure 6. Temperature−time curve of freezing–thawing cycles.
Buildings 14 01121 g006
Figure 7. SSSC compressive test setup.
Buildings 14 01121 g007
Figure 8. DT-20 dynamic elastic modulus tester.
Buildings 14 01121 g008
Figure 9. Eccentric pullout test setup.
Buildings 14 01121 g009
Figure 10. Surface appearances of specimens after 50–200 freezing–thawing cycles: (a) F0EA0-T50, (b) F0.3EA1-T50, (c) F0.3EA1-T100, (d) F0.3EA1-T150, and (e) F0.3EA1-T200.
Buildings 14 01121 g010
Figure 11. Failure modes of specimens after 50–200 freezing–thawing cycles: (a) F0EA0-T50, (b) F0.3EA1-T50, (c) F0.3EA1-T100, (d) F0.3EA1-T150, and (e) F0.3EA1-T200.
Buildings 14 01121 g011
Figure 12. The changing trend of compressive strength under freezing–thawing cycles.
Buildings 14 01121 g012
Figure 13. Stress–strain curve of F0.3EA1 under freezing–thawing cycles.
Buildings 14 01121 g013
Figure 14. Dynamic elastic modulus under a number of freezing–thawing cycles.
Buildings 14 01121 g014
Figure 15. Surface changes of freezing–thawing cycles: (a) F0.3EA1-T0, (b) F0.3EA1-T50, (c) F0.3EA1-T100, (d) F0.3EA1-T150, and (e) F0.3EA1-T200.
Buildings 14 01121 g015
Figure 16. Mass loss rate under a number of freezing–thawing cycles.
Buildings 14 01121 g016
Figure 17. The interaction force of reinforcement and concrete.
Buildings 14 01121 g017
Figure 18. Bonding interfaces of F0.3EA1 under different thicknesses of concrete cover.
Buildings 14 01121 g018
Figure 19. Bonding interfaces of F0EA0 and F0.3EA1 under thicknesses of 40 mm concrete cover: (a) F0EA0, (b) F0.3EA1.
Buildings 14 01121 g019
Figure 20. Bond stress–slip relationship of F0.3EA1: (a) different concrete cover (T = 0), (b) different concrete cover (T = 50), and (c) different freezing–thawing cyclic numbers (c = 40).
Buildings 14 01121 g020
Figure 21. Bond strength–freezing and thawing cyclic number relationships: (a) concrete cover (T = 40) of F0EA0 and F0.3EA1 and (b) different concrete cover of F0.3EA1.
Buildings 14 01121 g021
Figure 22. Bond stiffness–freezing and thawing cyclic number relationships: (a) concrete cover (T = 40) of F0EA0 and F0.3EA1 and (b) different concrete cover of F0.3EA1.
Buildings 14 01121 g022
Figure 23. Comparison between constitutive models and test data of F0.3EA1: (a) T0-c30, (b) T50-c30, (c) T0-c35, (d) T50-c35, (e) T0-c40, (f) T50-c40, (g) T100-c40, (h) T150-c40, (i) T200-c40, (j) T0-c45, and (k) T50-c45.
Buildings 14 01121 g023aBuildings 14 01121 g023b
Table 1. Chemical properties of cement.
Chemical ComponentNa2OMgOAl2O3SiO2SO3K2OCaOFe2O3LOI
Cement0.041.574.3420.011.331.0266.052.872.77
Table 2. Mechanical properties of SFCB.
Nominal Diameter (mm)Core Diameter (mm)Thickness of FRP (mm)Equivalent Diameter (mm)Average Tensile Strength (MPa)Average Elastic Modulus (GPa)
128411.6816.3972.7
Table 3. Mix proportion of SSSC.
NumberCement (kg/m3)Sea-Sand (kg/m3)Crushed Granites (kg/m3)Seawater (kg/m3)GF (kg/m3)EA (kg/m3)SP (kg/m3)
F0EA0540.46773.89787.89234.360.000.002.70
F0.3EA1537.36766.87780.74233.088.045.375.43
Table 4. Grouping and numbering of pullout specimens.
NumberConcrete Cover Thickness (mm)Freezing–Thawing Cyclic Number
F0EA0-T0-c40400
F0EA0-T50-c404050
F0.3EA1-T0-c30300
F0.3EA1-T0-c35350
F0.3EA1-T0-c40400
F0.3EA1-T0-c45450
F0.3EA1-T50-c303050
F0.3EA1-T50-c353550
F0.3EA1-T50-c404050
F0.3EA1-T50-c454550
F0.3EA1-T100-c4040100
F0.3EA1-T150-c4040150
F0.3EA1-T200-c4040200
Table 5. Analysis of the bond performance parameters of F0.3EA1.
Numberτu (MPa)su (mm)k (MPa/mm)
TestEq.RETestEq.RETestEq.RE
T0-c3011.4411.301.2%3.333.320.2%6.296.201.4%
T50-c308.828.830.2%2.612.610.1%5.595.691.8%
T0-c3512.4912.812.6%3.913.880.7%6.626.551.1%
T50-c3510.8110.850.4%3.303.341.4%6.016.030.4%
T0-c4014.1113.951.1%4.224.240.5%6.726.791.2%
T50-c4012.8312.482.7%3.833.881.5%6.216.281.2%
T100-c4010.7511.032.6%3.653.572.2%5.635.590.7%
T150-c409.849.592.5%3.343.291.5%4.954.724.7%
T200-c408.148.170.4%3.013.051.4%3.673.660.2%
T0-c4514.6714.700.2%4.464.411.0%6.966.960%
T50-c4513.6413.730.7%4.184.231.3%6.466.450.2%
Table 6. Empirical parameters of mBPE model and CMR model.
NumbermBPE ModelCMR Model
apαβ
T0-c300.505990.244590.794141.83709
T50-c300.682580.245110.693231.78494
T0-c350.530140.201890.95581.71732
T50-c350.409230.313011.081411.15897
T0-c400.455850.460780.952841.71102
T50-c400.571380.256341.005021.7262
T100-c400.573940.34140.957191.72866
T150-c400.559140.300711.093042.05805
T200-c400.783260.60890.952912.91302
T0-c450.584590.503291.128511.74061
T50-c450.508430.241751.213841.16974
Disclaimer/Publisher’s Note: The statements, opinions and data contained in all publications are solely those of the individual author(s) and contributor(s) and not of MDPI and/or the editor(s). MDPI and/or the editor(s) disclaim responsibility for any injury to people or property resulting from any ideas, methods, instructions or products referred to in the content.

