3.1. Analysis of the Spatial Development Direction
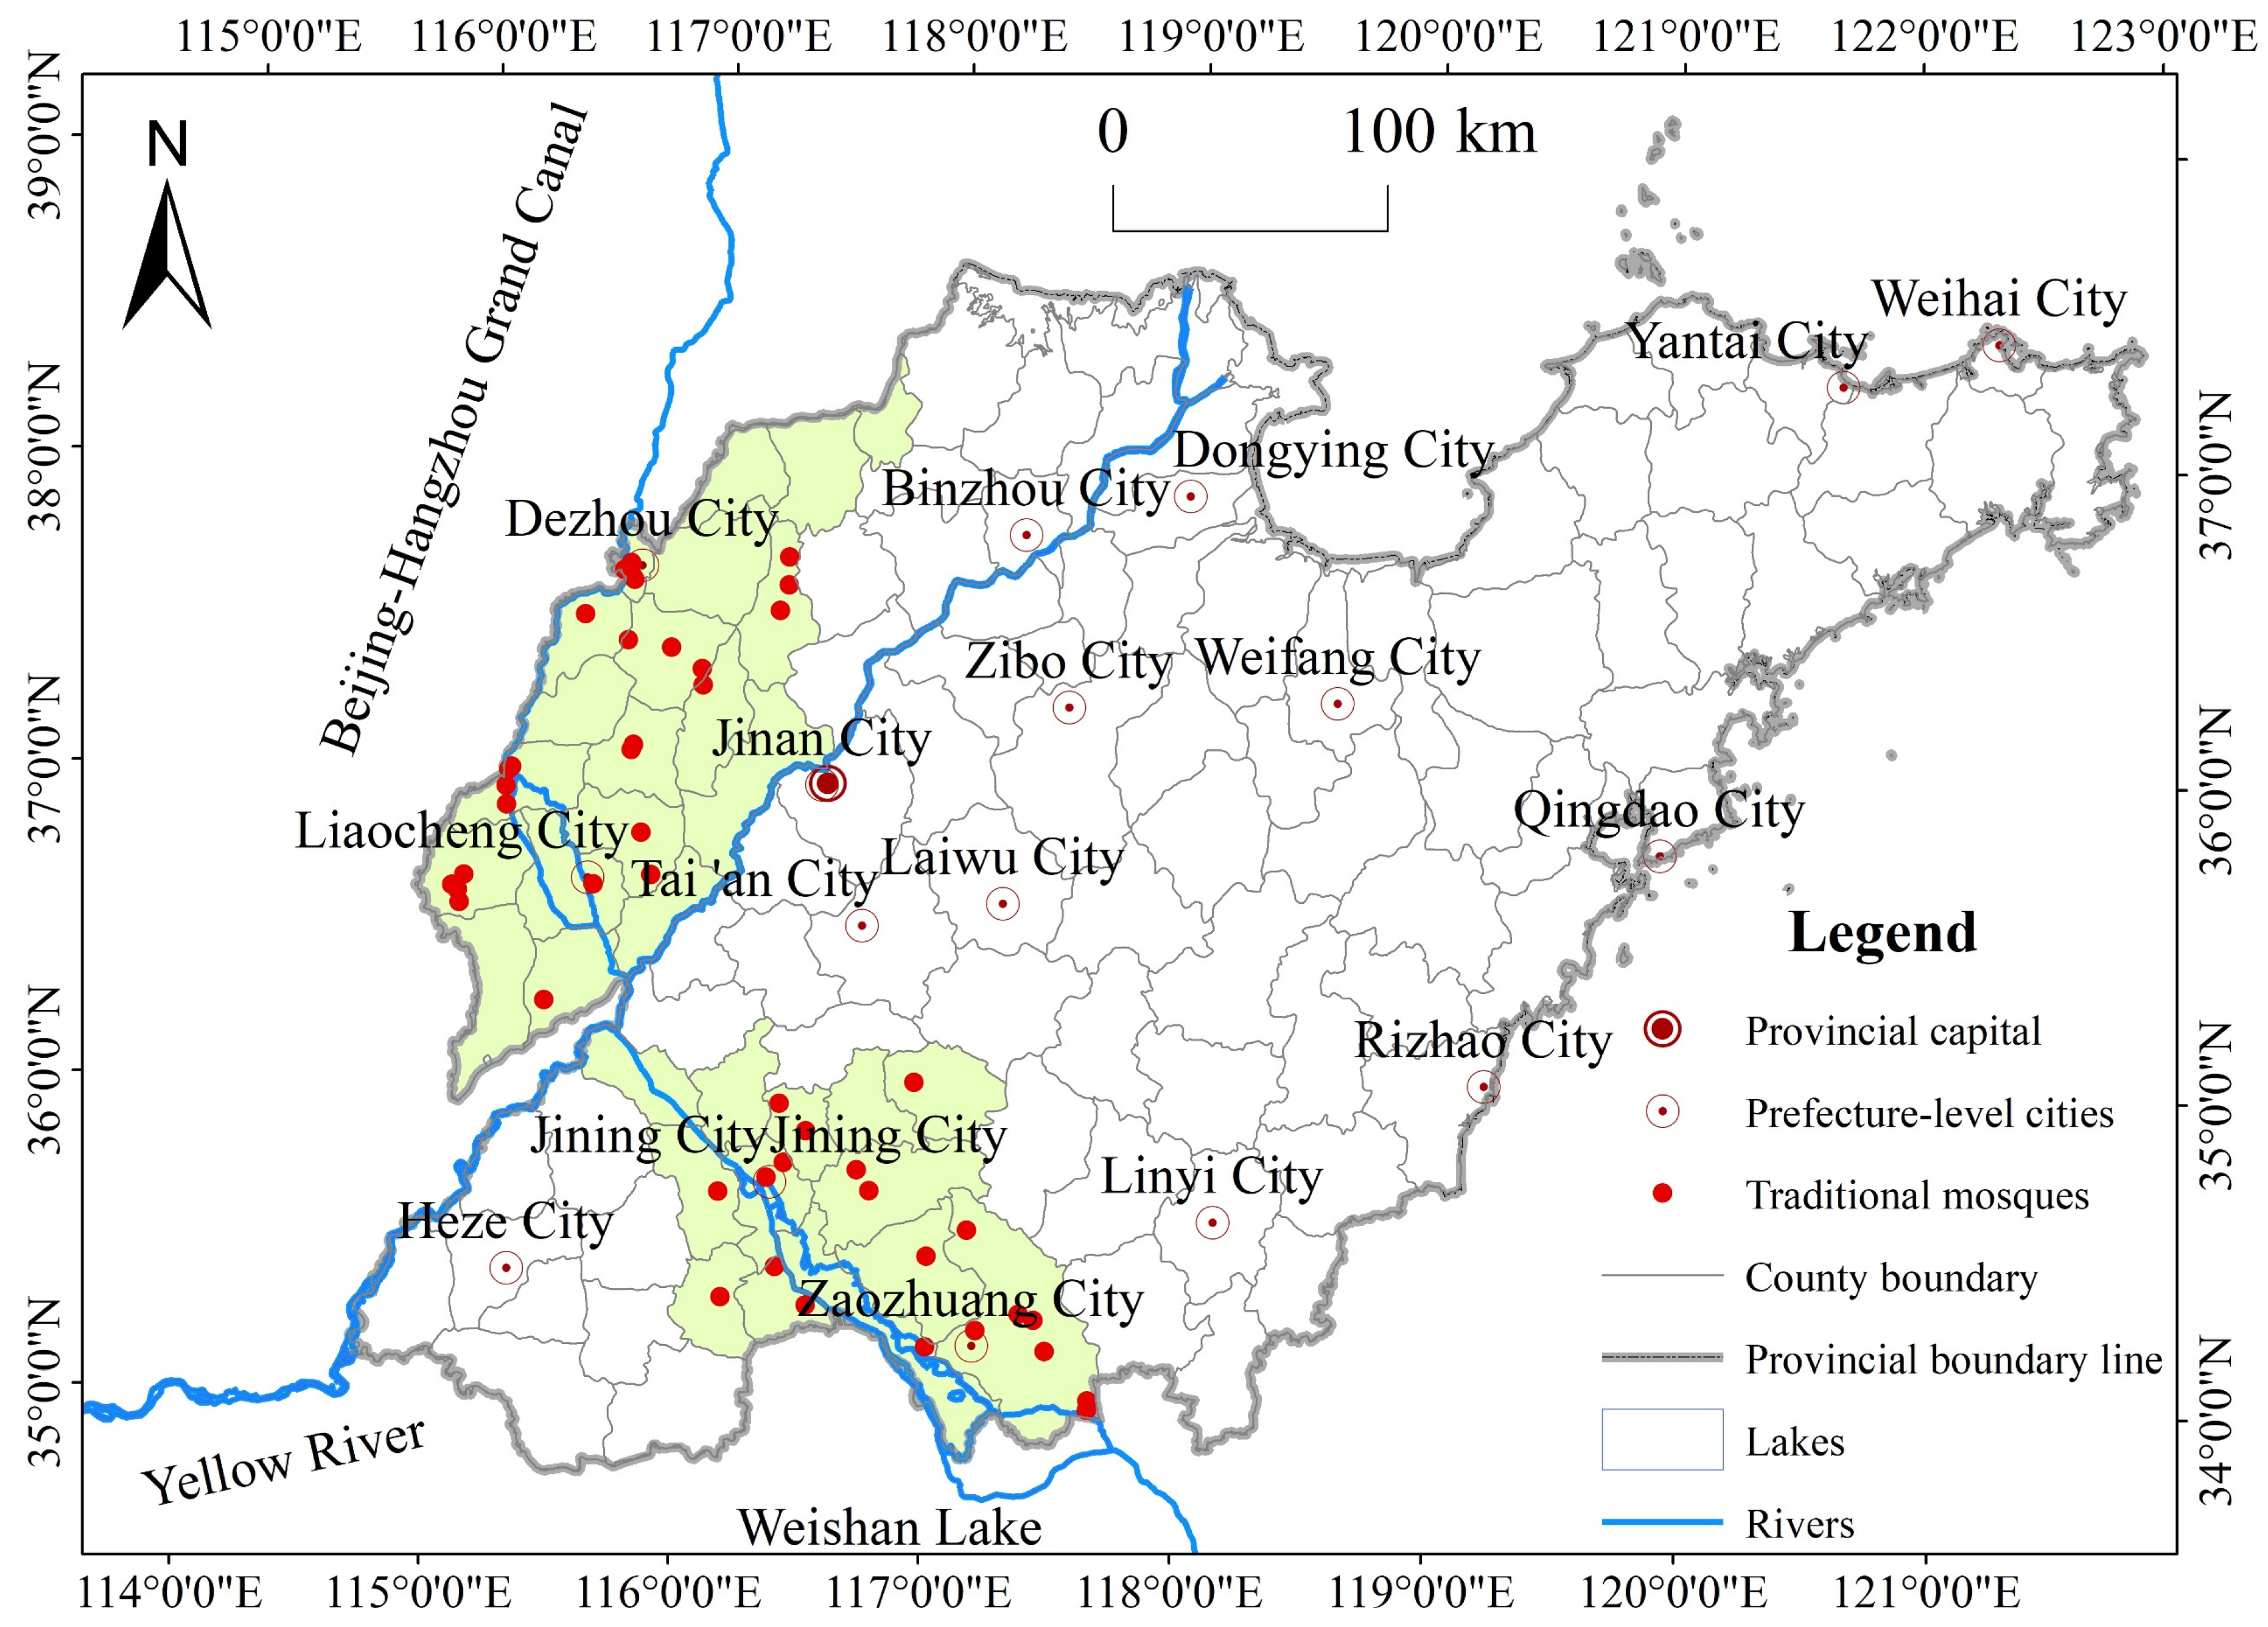
After the Grand Canal became unblocked in the Ming and Qing dynasties, a large number of Hui people (a Muslim people in China) moved into the Shandong section of the Grand Canal, and mosques were built one after another, gradually synchronizing the boom with their cities. At the end of the Qing dynasty, the canal in Shandong was blocked, and the mosques and their located cities also declined [
60]. The construction of early mosques relied to a certain extent on cities with prosperous commerce. Over time, the spatial distribution of mosques mainly showed three forms: “random”, “agglomeration”, and “balance”. This study analyzes the distribution of mosques in the four cities of Dezhou, Liaocheng, Jining, and Zaozhuang, which is an important approach and a means to understand the developing direction of mosques and urban space.
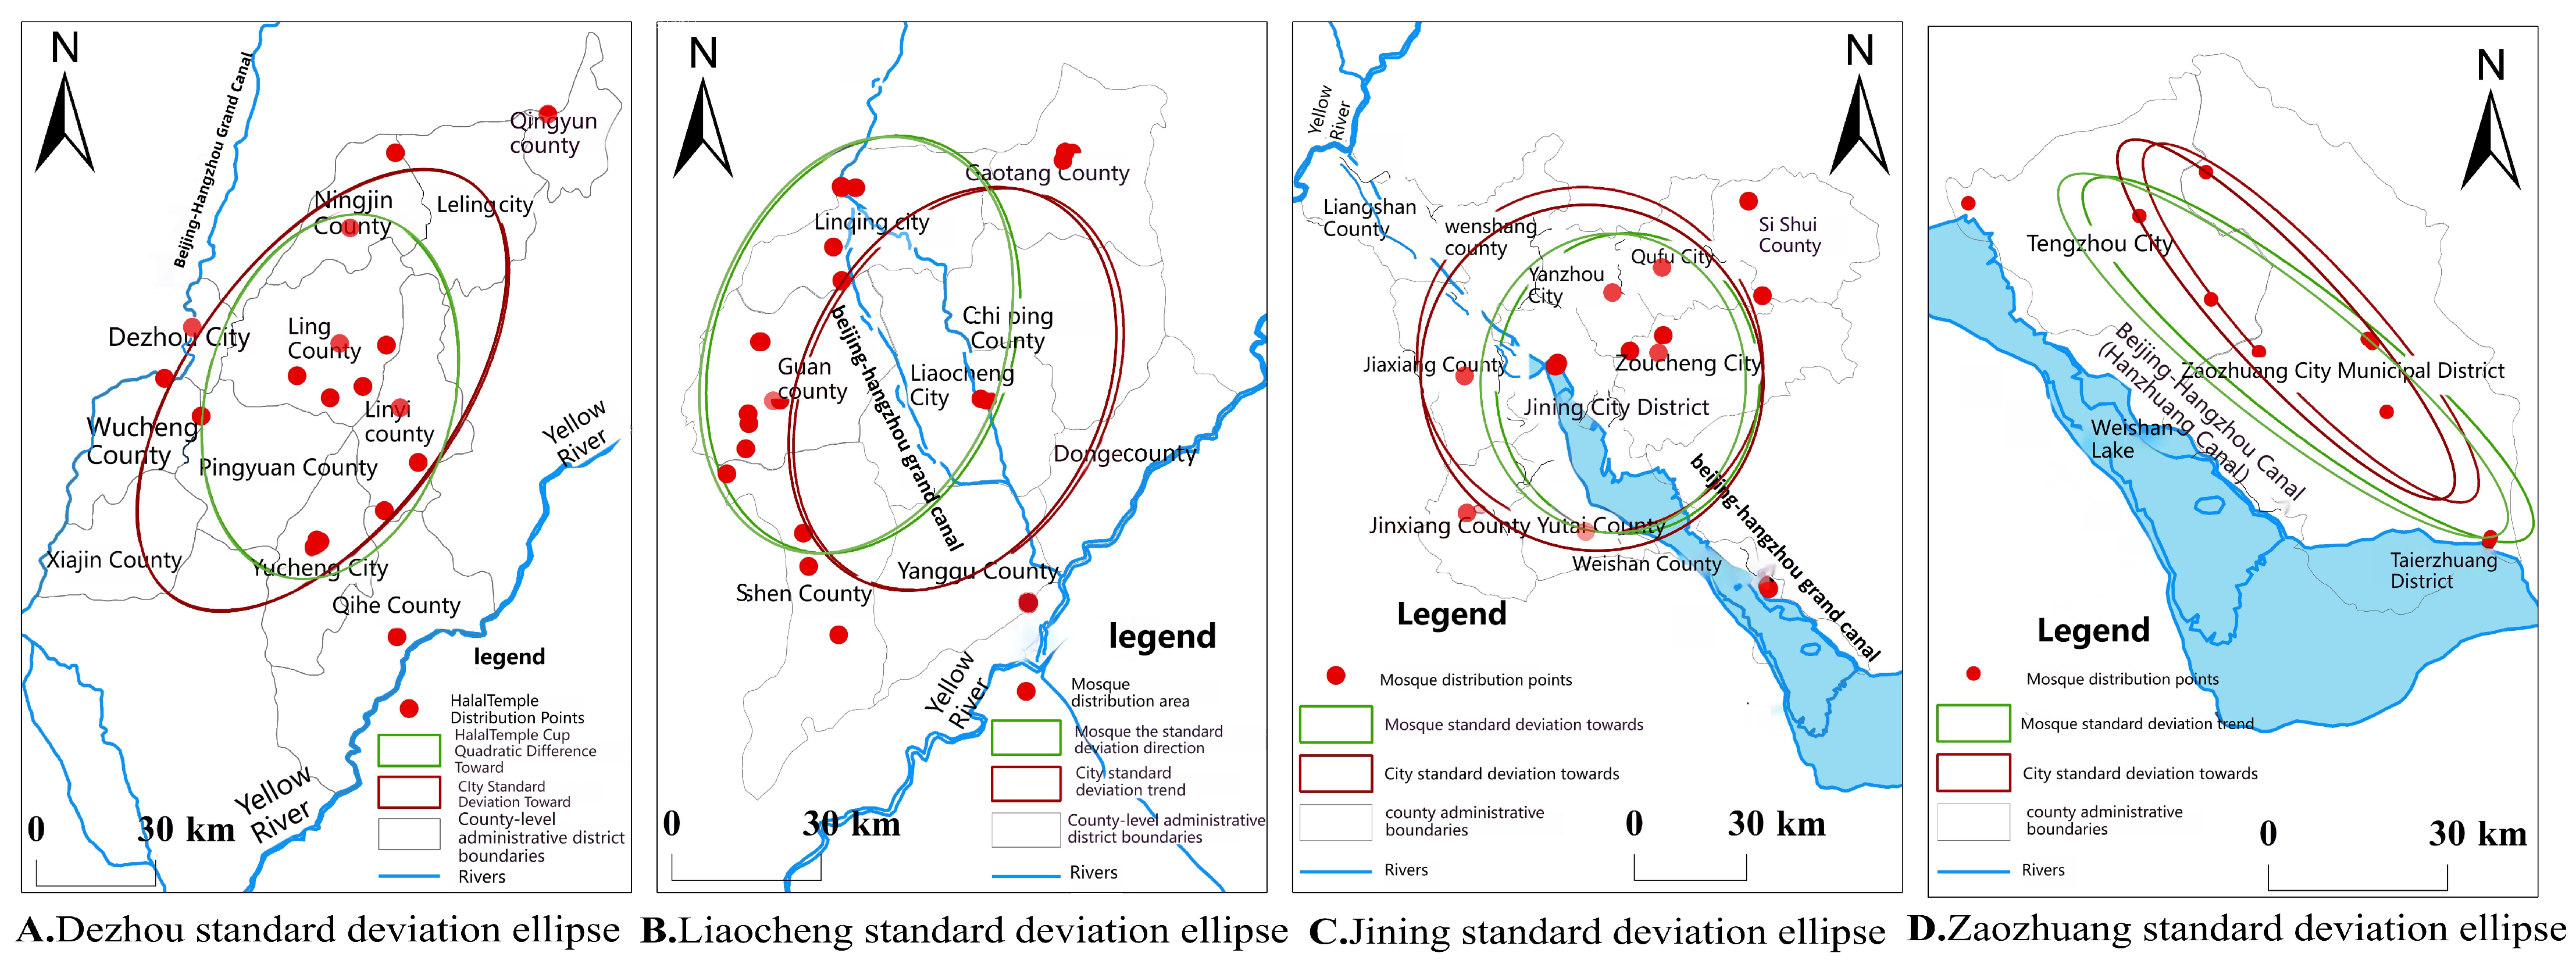
Using the “Direction Distribution (SDE)” in the ArcGIS spatial statistics tool, an SDE map of mosques and cities along the Line is created (
Figure 2). The distribution direction, azimuth angle
, ellipse area, and oblateness of the SDE are used to determine the visual expression and perform the data analysis of location number and distribution characteristics for TMs along the line. As seen in
Figure 2, the mosques in Dezhou are distributed in a “south–north” direction; the mosques in Liaocheng are distributed in a “northeast–southwest” direction; the mosques in Jining are distributed in a “south–north” direction; and the mosques in Zaozhuang are distributed in a “northwest–southeast” direction. In the direction of the urban SDE, Dezhou and Liaocheng are in the “northeast–southwest” direction; Jining and Zaozhuang are in the “northwest–southeast” direction. In terms of elliptical area and oblateness, the ellipse area and oblateness in Dezhou and Zaozhuang are relatively small; the ellipse area and oblateness in Jining and Liaocheng are relatively large.
Based on the above analysis, it can be seen from the distribution direction of mosques and the urban development direction that there are two patterns between mosques and urban development trends: (1) the Urban development direction includes the distribution direction of mosques (Dezhou, Jining); (2) the distribution direction of mosques is consistent with the direction of urban development (Liaocheng, Zaozhuang). It can be seen from the relationship between the two that when the distribution of TMs is basically coupled with the direction of urban development, adaptive coupling adjustments will be made between the distribution of mosques and urban development. When the SDE area and oblateness are low, the cities and mosques develop in a “strip-like” direction (Dezhou, Zaozhuang); on the contrary, when the ellipse covers a wider area, the cities and mosques develop in a “clump-like” direction (Liaocheng, Jining). This shows that the scale and shape of the city will also have a corresponding impact on the layout of the mosques.
3.2. Analysis of the Traction Effect
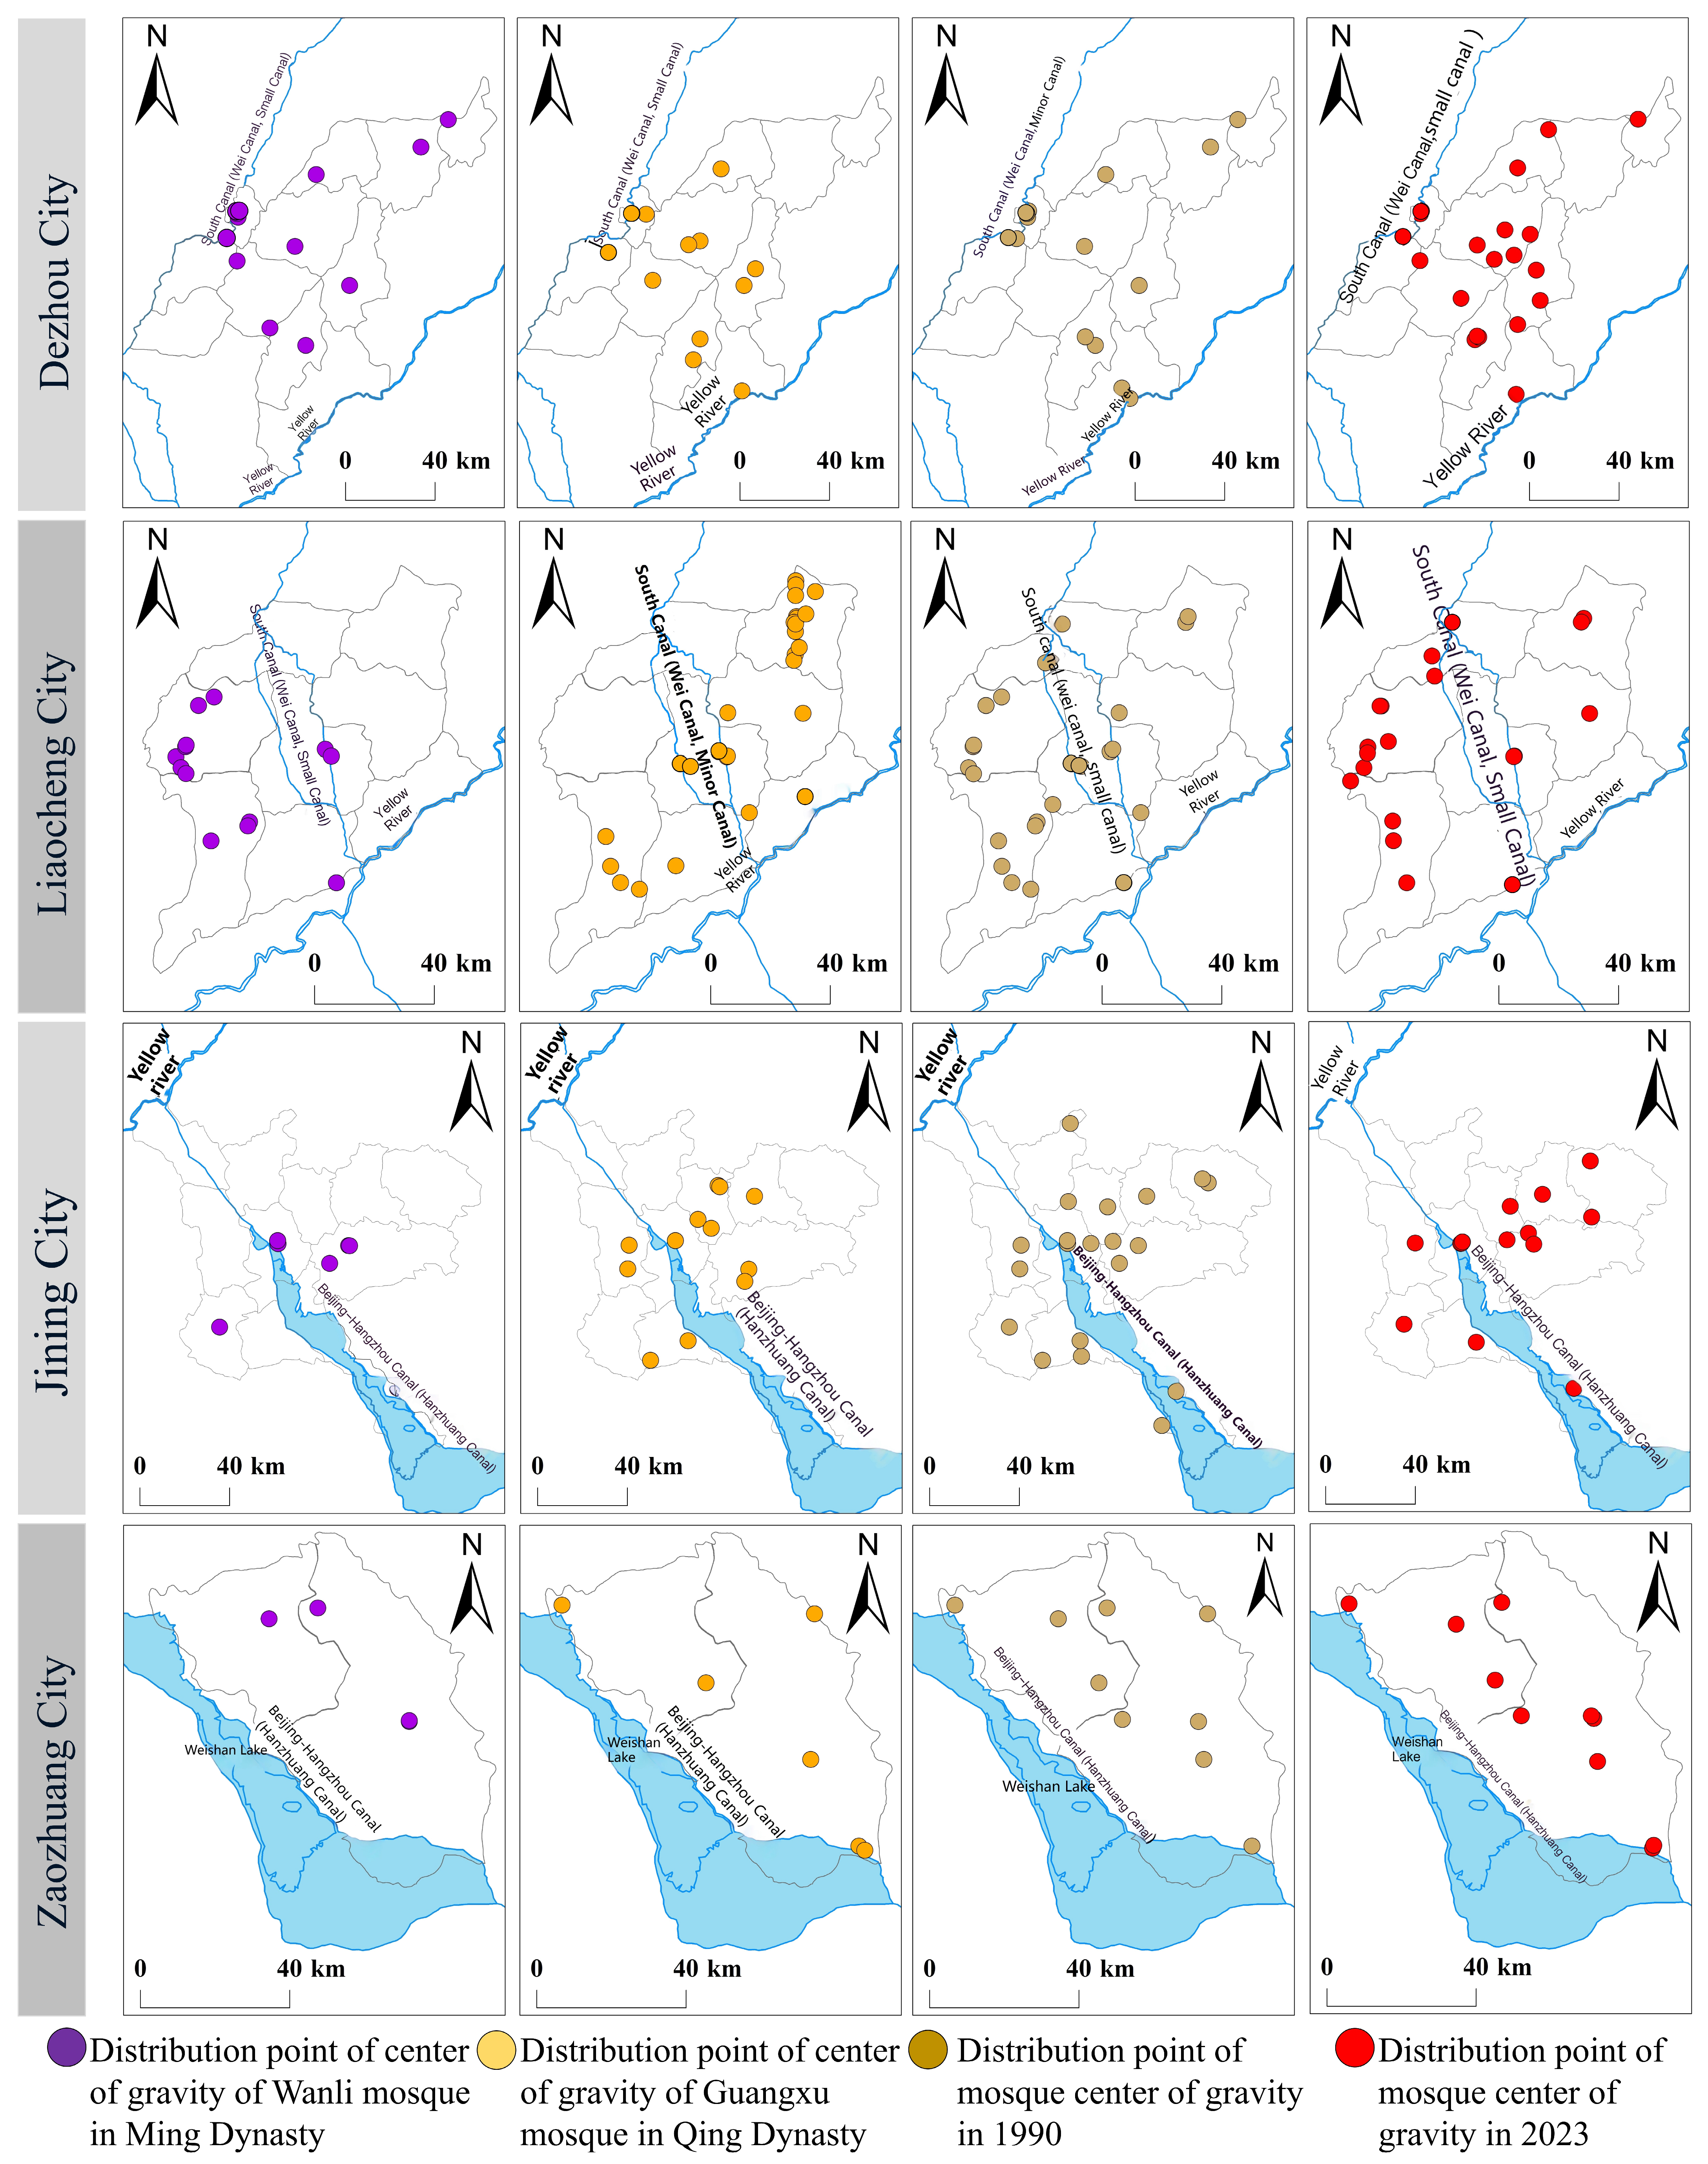
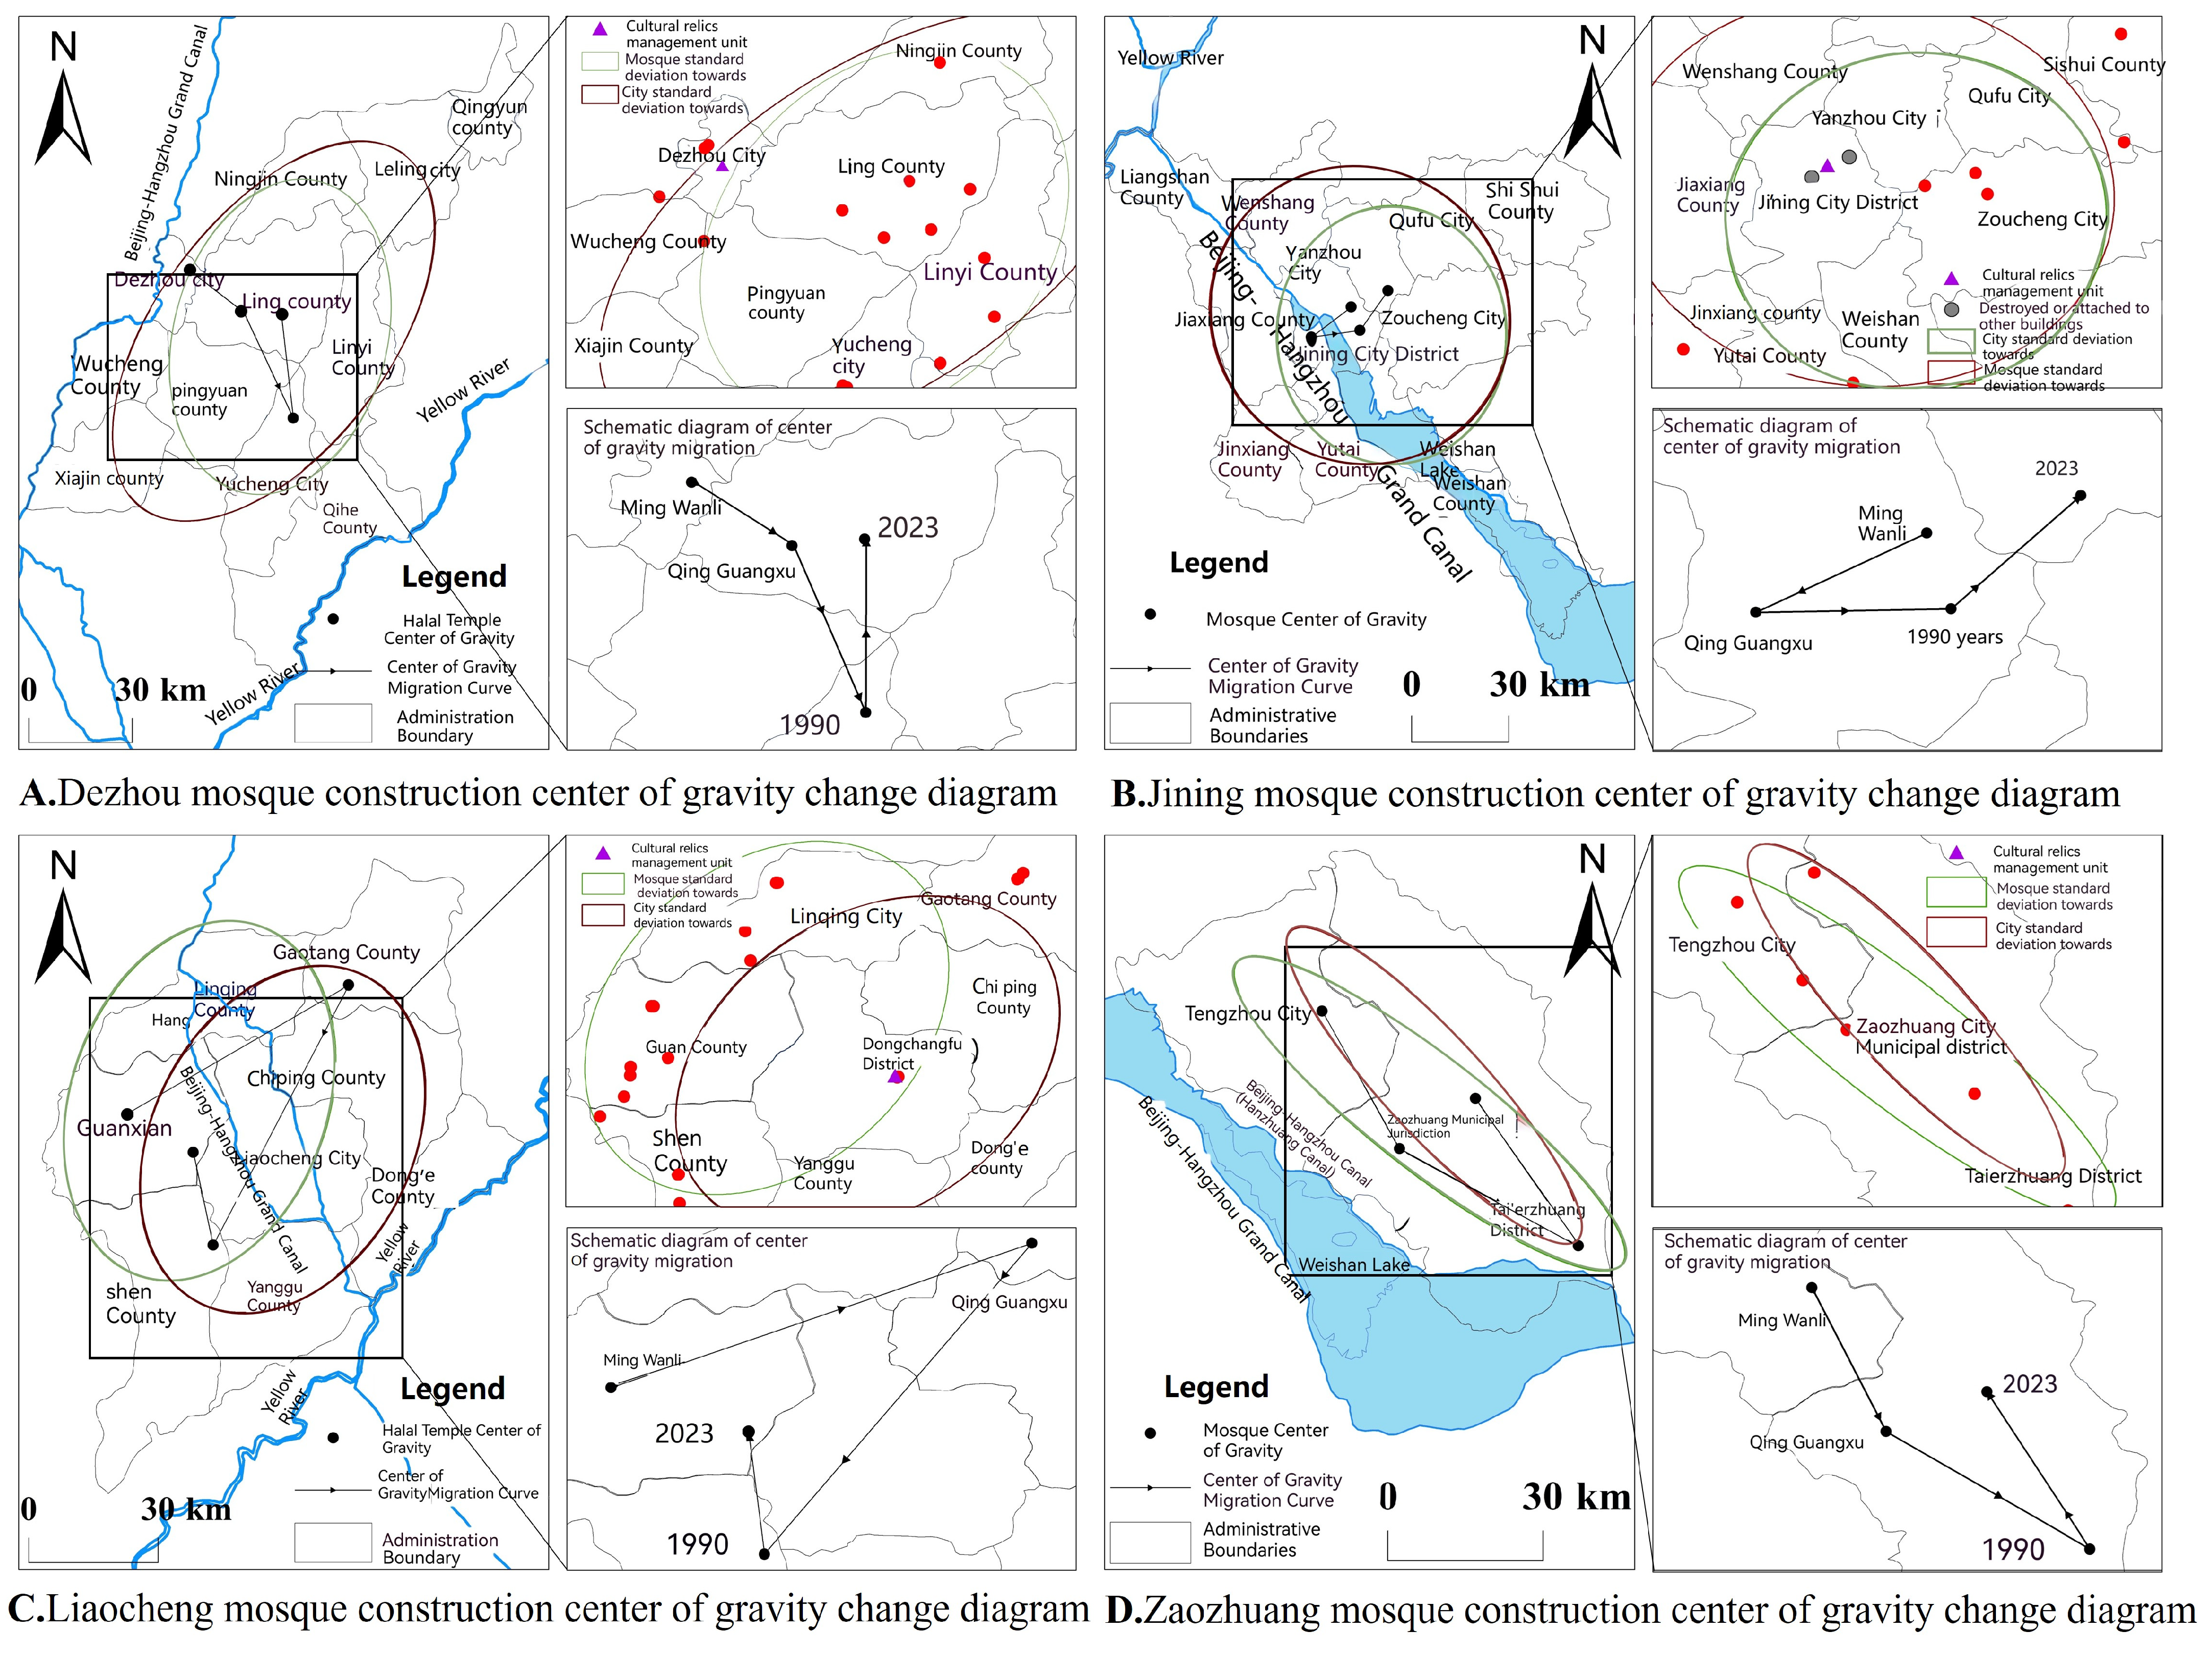
The distribution center of mosques refers to the moment balance point of the spatial distribution of mosques in the area, and its comparison with the geometric center of distribution could better reflect the balanced distribution of mosques. Analyzing the “traction” effect of mosques in certain sections on urban development through the distribution center movement in each historical stage can intuitively reflect the distribution differences of mosques in the section in different periods. The trajectory of the distribution center of mosque construction can be roughly divided into four stages: the Wanli period of the Ming dynasty, the Guangxu period of the Qing dynasty, and the data in 1990 and 2023 (
Figure 3). Using point set-to-line conversion under the ArcGIS data management tool element, the physical points of the mosques along the line were converted into line sets, thereby calculating the distribution center migration route for the mosques along the line (
Figure 4).
(1) The focus of mosque construction along Dezhou is generally more in the northwest and less in the southeast. In the Ming dynasty, Dezhou prospered rapidly, relying on water transportation, and became an important town along the canal. The city expanded accordingly, in which the mosques showed a “diffused” distribution. After the end of the Qing dynasty, the status of the canal gradually declined, and the distribution center of mosques gradually shifted to the central and southeastern parts of the country. The number of mosques near the Yellow River gradually increased. Before 1990, due to the influence of various factors, the Hui population was dispersed from this city in large numbers; thus, the number of mosques built was small and scattered. The mosque construction was mainly concentrated along the Yellow River and in the north of the city. From 1990 to 2023, the government paid attention to the protection and utilization of TMs, and the construction of mosques in the city gradually recovered and grew.
(2) The distribution of mosques along Liaocheng and the urban development trend generally evolve in the direction of θ = 45°. In the Ming dynasty, the cities along the canal, such as Linqing and Guanxian, had prosperous commerce and developed markets. The suitable business environment resulted in the cities along the canal becoming densely populated areas, forming new Muslim (mainly for Hui People) gathering areas, which led to the rapid construction of mosques. In the Ming and Qing dynasties, the focus on the overall eastward movement, especially concentrated in Gaotang, was due to the prosperity of water transportation and economic prosperity. The Muslim population increased and gradually spread eastward. In the Qing dynasty, the Gaotang prefecture was adjacent to Dezhou, and there were obvious geographical advantages, which attracted a large number of Hui people. Therefore, there are many mosques. At the end of the Qing dynasty, the canal was cut off for transportation and the social environment was turbulent, which directly affected the normal life of the Hui people along the canal. During that period, the spread of Islam in the areas along the canal was more focused on the rural areas. Therefore, from 1909 to 1990, the number of mosques was relatively scattered, and the main construction focus was concentrated in the rural areas to the north. In recent years, with the economic recovery, the cities along the canal have gradually opened up, and a large number of ancient buildings have been restored. From 1990 to 2023, the number of mosques increased, and the distribution was relatively even around Liaocheng.
(3) Jining is located in the middle section of the Grand Canal, which is a transportation crossover for water and land and a strategic point from north to south. In the Yuan, Ming, and Qing dynasties, the highest institution for governing transportation was located in the Rencheng district of Jining. During the Yongle period of the Ming dynasty, Hui merchants integrated into the multiethnic area of Jining and mostly lived around the Rencheng district. In the early Qing dynasty, a group of “Hui Confucians” appeared in the canal area. Therefore, based on the original construction of the Ming dynasty, the number of mosques increased, and distribution was focused on movement across the canal to the west. At the end of the Qing dynasty, the Yellow River changed its course, and social disputes around that area arose. The Qing dynasty was unable to maintain the smooth flow of the canal, and merchants fled one after another. Therefore, the number of mosques dropped sharply in the context of internal and external troubles in that period. Between 1909 and 1990, the focus of mosque construction began to move eastward, and the distribution scope was wider than before. After 1978, the increase in the number of mosques reached its peak, and the construction scope was wide. After 1990, the focus of mosques gradually shifted to the northeast.
(4) Most of the mosques in Zaozhuang were built in both the Ming and Qing dynasties. They are scattered and small in number. The reason for this is that the ruling class of the Ming and Qing dynasties forced ethnic minorities into military service and adopted the method of “divide and rule” to encourage the Hui people to migrate in large numbers. During the Guangxu period of the Qing dynasty, the focus gradually moved southward and dispersed to other areas. The old Zaozhuang is one of the relatively concentrated Hui settlements in southern Shandong. During the Ming and Qing dynasties, a spatial evolution pattern of “large dispersion and small settlements” was formed. In modern times, most of the mosques were destroyed by wars. After the reform and opening up, the Hui people returned and concentrated in villages and towns. The distribution center has continued to move southward since 1990, being concentrated in villages and towns and relatively scattered. From 1990 to 2023, the number of mosques increased, gradually moved northward, and became dispersed.
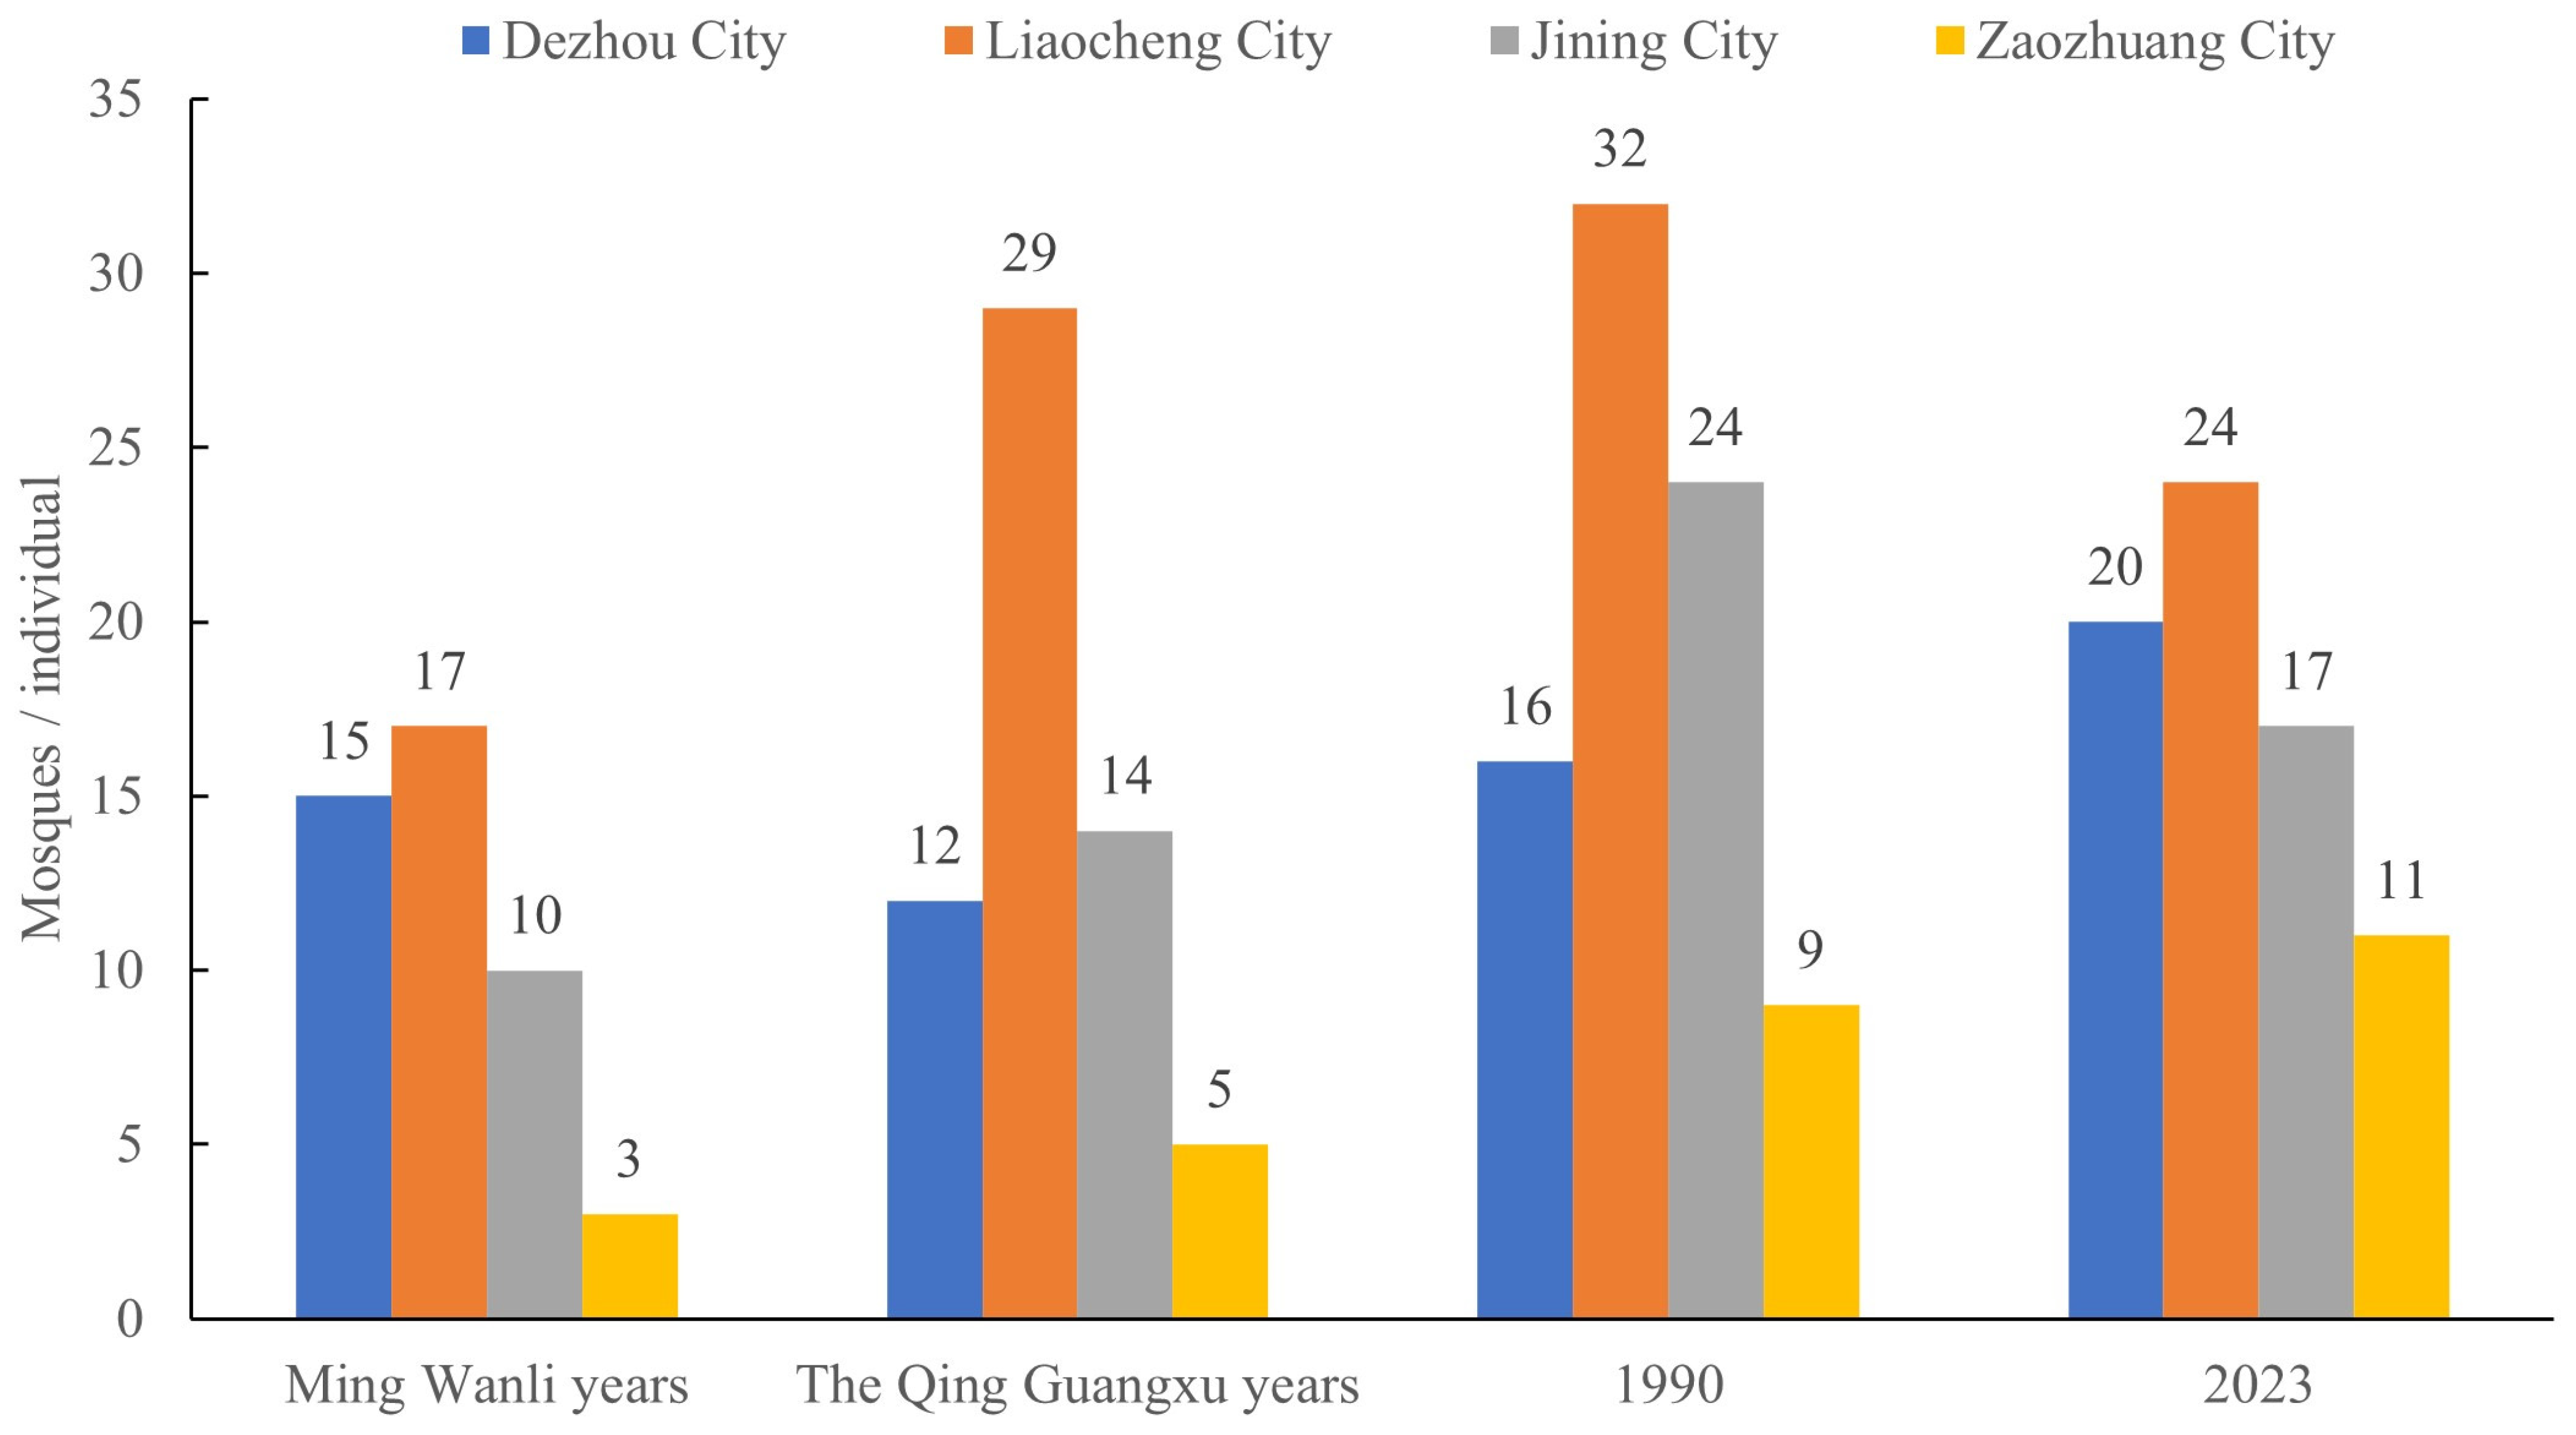
In short, the overall distribution trend of mosques along the Shandong section of the Grand Canal is “rising–decreasing” (
Figure 5), with the number reaching its peak in 1990. Mosques were built during both the Ming and Qing dynasties when the canal was open, affected by the canal economy and the migration of the Hui people. At the end of the Qing dynasty, a large number of mosques were destroyed because the canal was cut off and wars broke out frequently. In the years prior to 1990, the Hui people returned, traditional ancient buildings were protected, mosque construction began again, and building density increased. In
Figure 5, the direction of the curve is roughly the same as the standard deviation direction of the urban ellipse, which shows that the development of the cities and the construction of the mosques are coupled to a certain extent.
3.3. Analysis of Influencing Factors
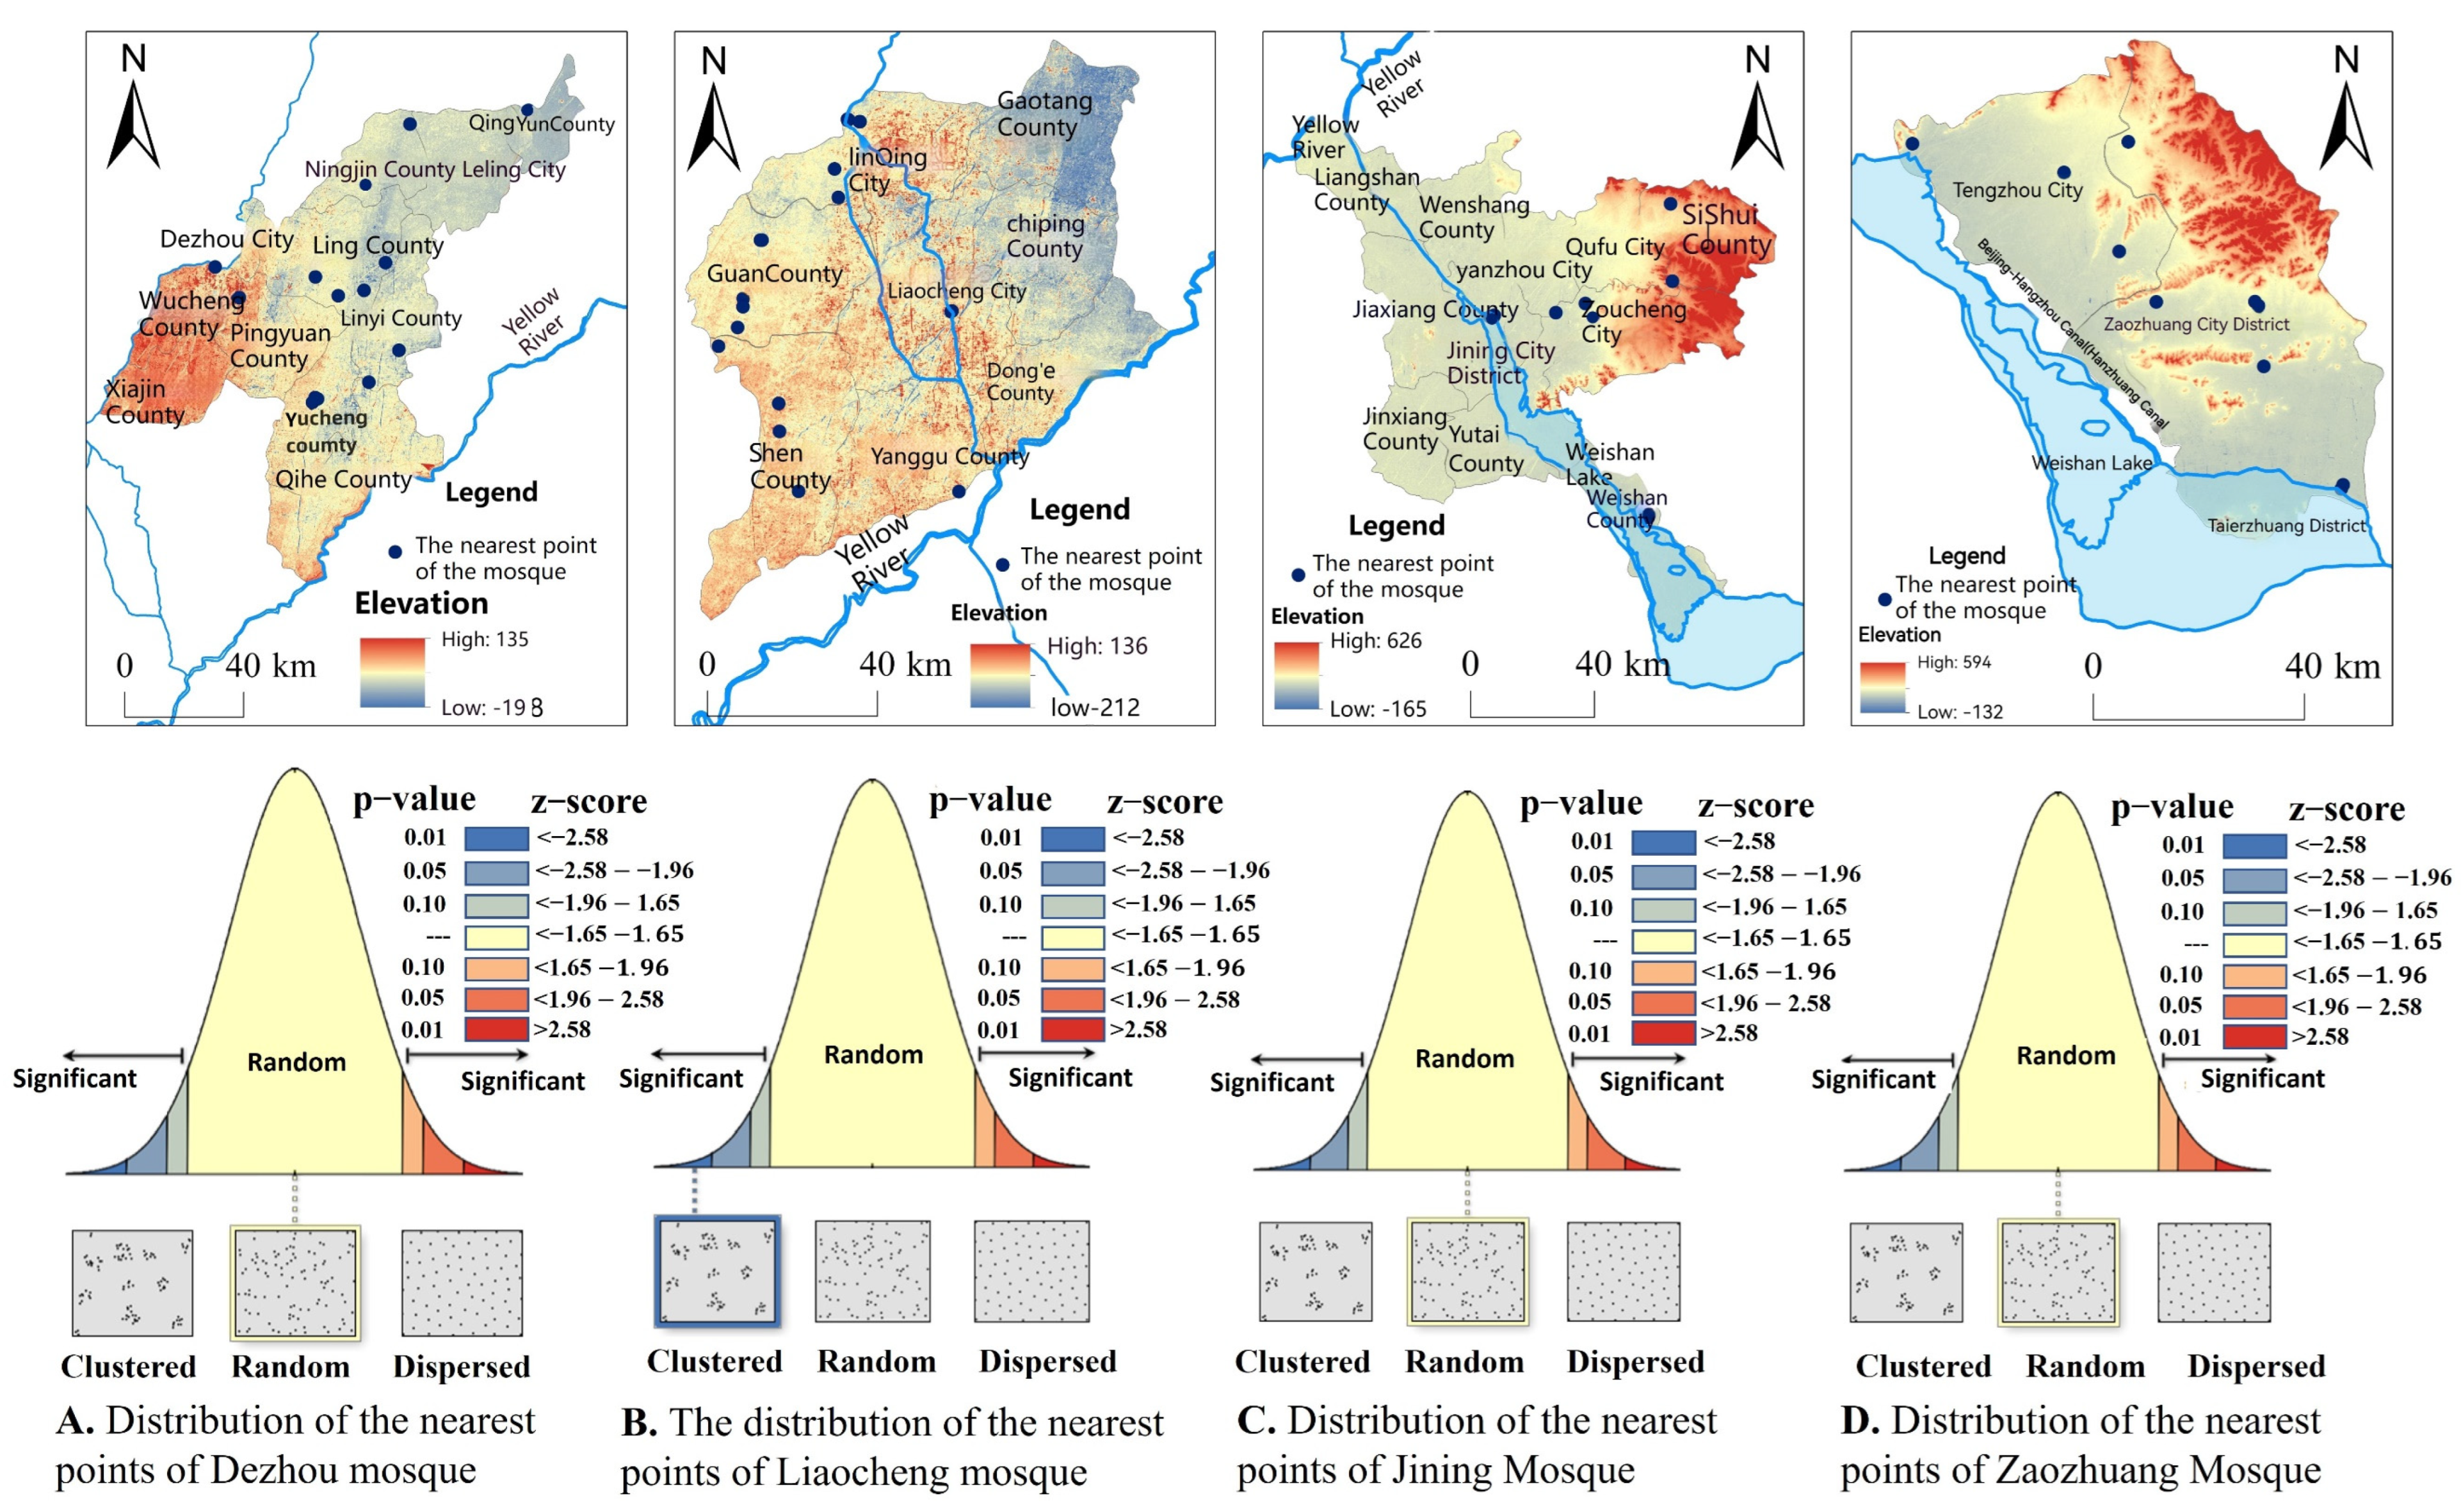
The influencing factors of TMs along the canal in the Shandong section on urban development are mainly analyzed by NNI and kernel density. Based on these two methods, the distribution characteristics of mosques along the canal in their cities are studied. From the analysis of the two factors, the primary and secondary gathering areas of mosques in this section are analyzed, and the coupling status of the development of mosques in the four cities of Dezhou, Liaocheng, Jining, and Zaozhuang is analyzed. Firstly, the overall distribution situation and regional agglomeration status of mosques are determined through NNI. Secondly, a kernel density analysis of mosques along the canal is conducted based on the distribution situation of mosques in each city.
The NNI is a measure of the proximity of mosques to each other in urban space. Taking the mosque as a “point element”, the three forms of “random”, “agglomeration”, and “uniform” as the main judgment criteria are adopted to determine the distribution type in urban space. Using the average nearest neighbor in the spatial statistical data analysis mode in the “ArcGIS 10.8” application, the nearest neighbor analysis was conducted on TMs in the four cities of Dezhou, Liaocheng, Jining, and Zaozhuang, and the distribution types of mosques (point elements) were obtained. The results are shown below (
Figure 6).
The results show that the distribution type of mosques is closely related to urban development. The distribution of mosques in their cities is either concentrated or even. There are two main distribution patterns of mosques along the canal in the Shandong section. One is random distribution, mainly in Dezhou, Jining, and Zaozhuang, and the other is clustered distribution, mainly in Liaocheng. On one side, it can be seen from the “Random” distribution of mosques that, although mosques are distributed freely in urban spaces and run through various regions, they also appear to be clustered in various cities (such as Guanxian, Linqing, etc.), indicating that the distribution of mosques is related to the differences of inter-cities and that coupling coordination gradually becomes stronger. On the other hand, it can be seen from the “Clustered” distribution of mosques that mosques are concentrated in cities with high agglomeration levels (such as Guanxian and Linqing), which shows that mosques are related to the local business economy, population migration, and other factors in their cities. Although the distribution situation of mosques in their cities shows two different results, in terms of this flowing linear culture, mosques are generally distributed in large numbers and concentrated in cities along the canal.
ArcGIS was utilized to conduct the nearest neighbor calculation of TMs, and the average observed distance and expected average distance of mosques in four cities were obtained (
Table 6). It can be seen from the table that mosques present two distribution patterns: the “Random” and the “Clustered”. Among the cities, the number of mosques in Dezhou and Liaocheng is larger, accounting for 61% of the total; the number of mosques in Jining and Zaozhuang is smaller, accounting for 39% of the total. Under the balance distribution situation, the nearest neighbor ratio (
R) is significantly greater than 1, and the mosques are far apart and scattered in the cities; under the clustered distribution situation, the nearest neighbor ratio (
R) is infinitely close to 1, and the mosques are close together, with the distribution relatively concentrated in the cities.
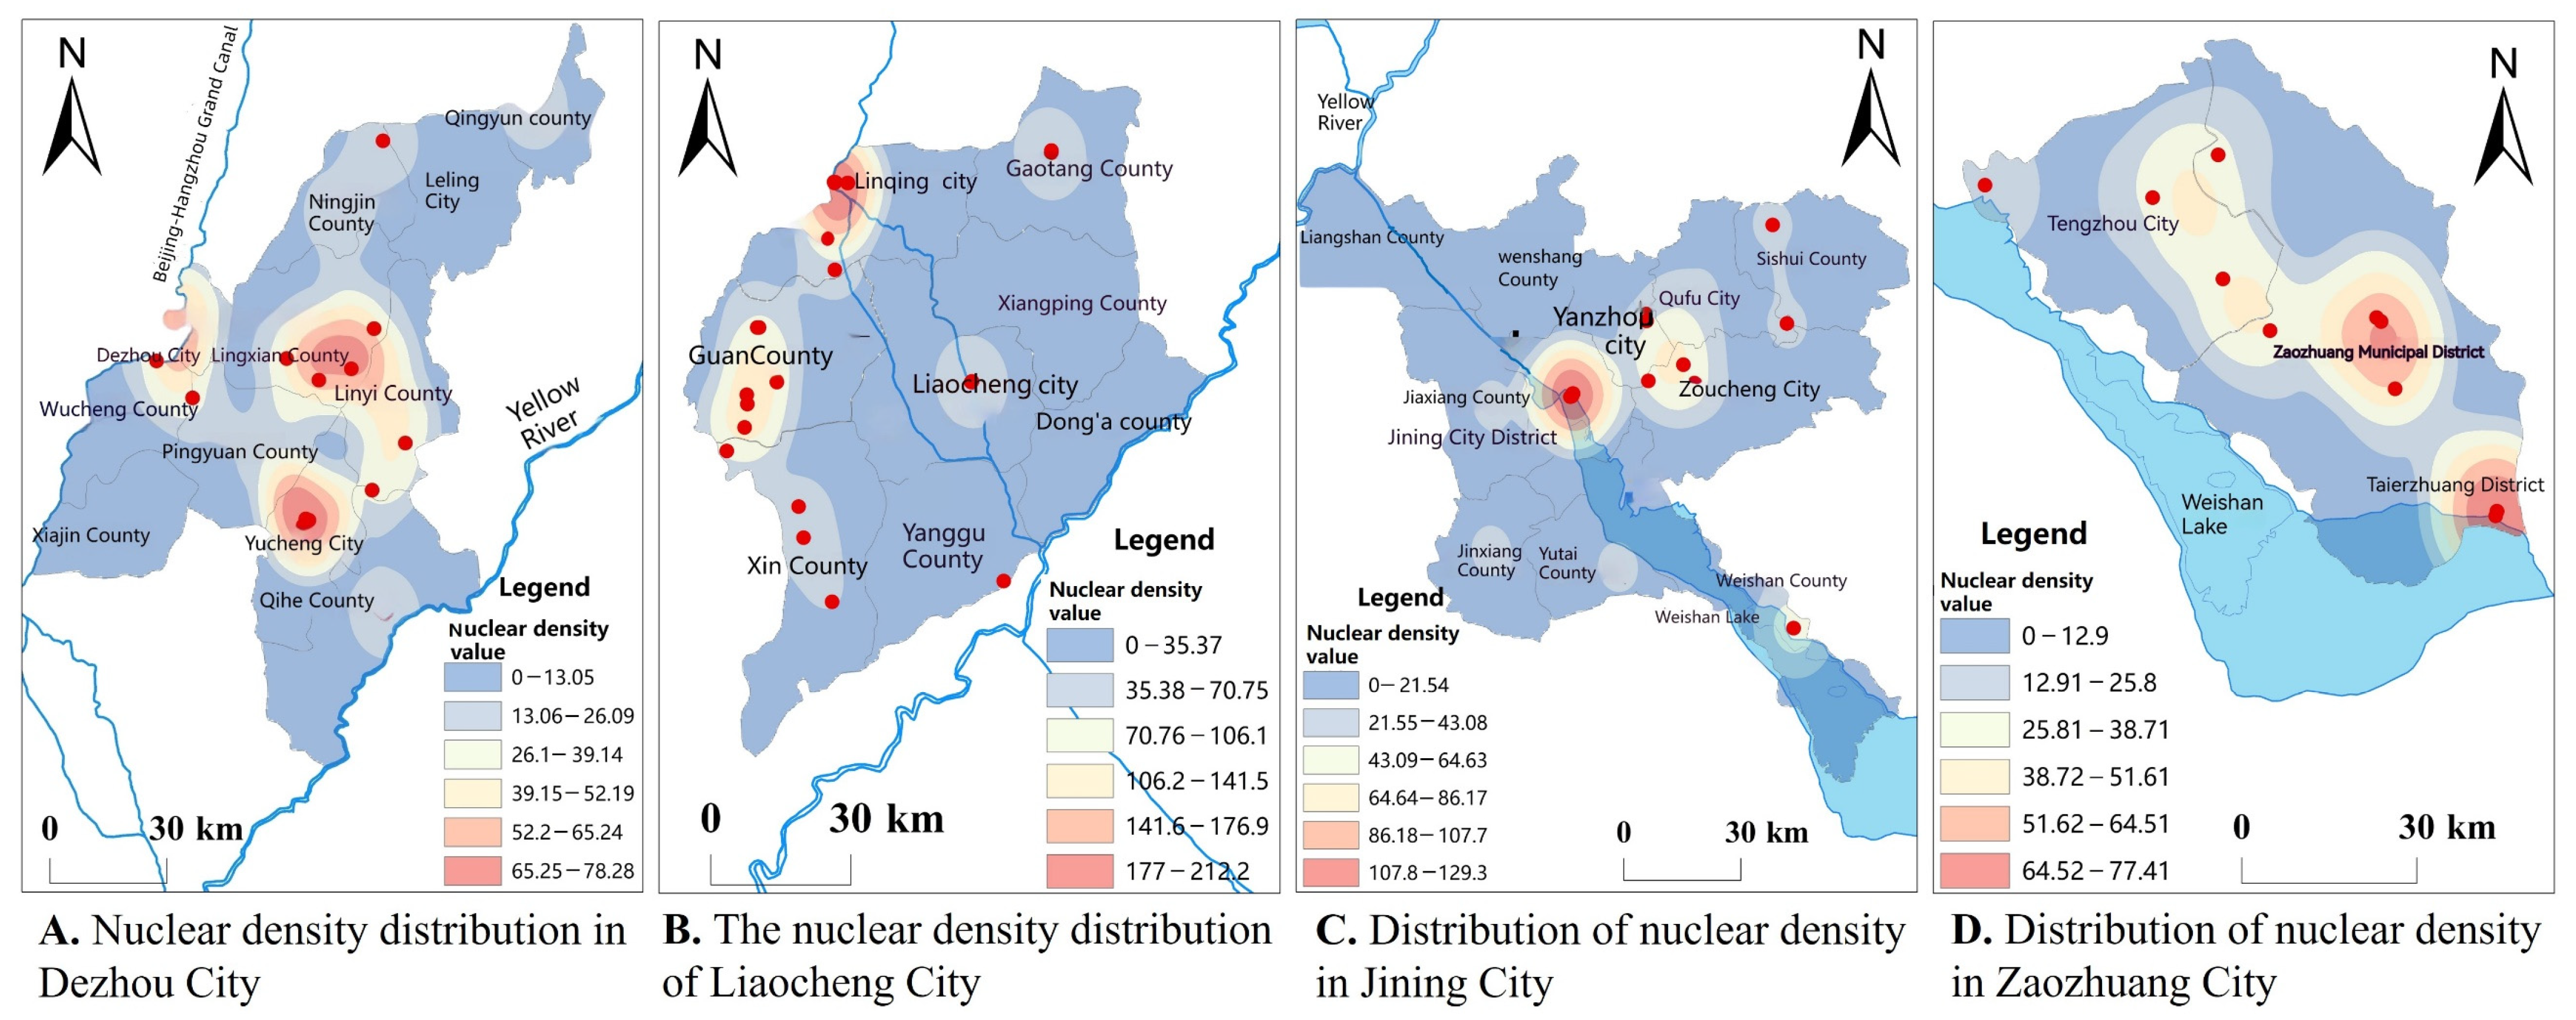
Based on the NNI analysis, this study analyzed the point features of mosques generated in ArcGIS. Using the kernel density estimation tool in Spatial Analyst, a kernel density analysis was conducted for four cities: Dezhou, Liaocheng, Jining, and Zaozhuang. This analysis ultimately resulted in a distribution pattern map of mosques (
Figure 7).
Figure 7 shows that Dezhou mosques are distributed in three highly dense areas (Decheng district, Yucheng city, and Ling county), and the sub-dense areas are distributed in a “point-and-belt” pattern; the mosques in Liaocheng are distributed in two highly dense areas (Guan county, Linqing city), and the sub-dense areas are mostly distributed in a “point-like” pattern; the mosques in Jining are distributed in two highly dense areas (Jining municipal district, Zoucheng city in Yanzhou), and the sub-dense areas are distributed in a “multi-core, point-and-belt” distribution pattern; the mosques in Zaozhuang are distributed in two highly dense areas (Zaozhuang municipal district and Taierzhuang district), and the sub-dense areas are mostly distributed in a “point-and-belt” pattern (Tengzhou city). Based on the reference value of the nearest neighbor ratio (
), the nearest neighbor ratio
in Liaocheng appears as “point-like” in the clustered distribution state; the nearest neighbor ratios
in Dezhou, Jining, and Zaozhuang appear as “multi-core and point-and-belt” in the balance distribution state. The statistical results are shown in
Table 7.
Judging from the overall kernel density distribution, the mosques along the Shandong section radiate from individual districts and counties to the surrounding areas, with a wider radiating area and more radiating areas, forming a “multi-center, multi-core” distribution pattern. The high core density value is for the four cities along the canal, which means that mosques are distributed more densely in those cities, with more highly clustered and stronger urban cohesion; the sub-core density value is , which means that the distribution density of mosques in the city is low and the degree of dispersion is high.
3.4. Analysis of the Coordination Degree
Formulas (5) and (6) respectively calculate the coupling degree
value and the coordination degree
value of the mosque distribution and urban development. By comparing the coupling coordination degree identification and evaluation grades in
Table 4, the coupling coordination level between mosques and their cities is obtained. When calculating
and
values, the fuzzy subsets of mosques and cities should be firstly determined. Combined with the
Section 2.4.1 research indicators, scores for the urban population, economy, culture, and space satisfaction are assigned respectively, to determine the score proportions of each element of the index items for the cities. Then, the variables for the distribution focus center of mosques, the degree of cultural integration, the degree of space satisfaction, and the traction scores are assigned respectively, to calculate the score proportion of each element of the indicator item for the mosque distribution; the range of the membership grade is
. The comprehensive score values
and
between the mosques and their located cities are calculated respectively through the fuzzy comprehensive evaluation method of SPSS application. The calculation results are shown in
Table 8 and
Table 9.
The comprehensive score values of the city
and the mosque
are obtained via the calculations in
Table 8 and
Table 9. According to Formulas (5) and (6), the coupling degree
value, coordination degree
value, and comprehensive coordination index
value, are calculated respectively. The coupling level and coordination stage between the city and the mosque are determined based on
Table 4. The calculation results are shown in
Table 10:
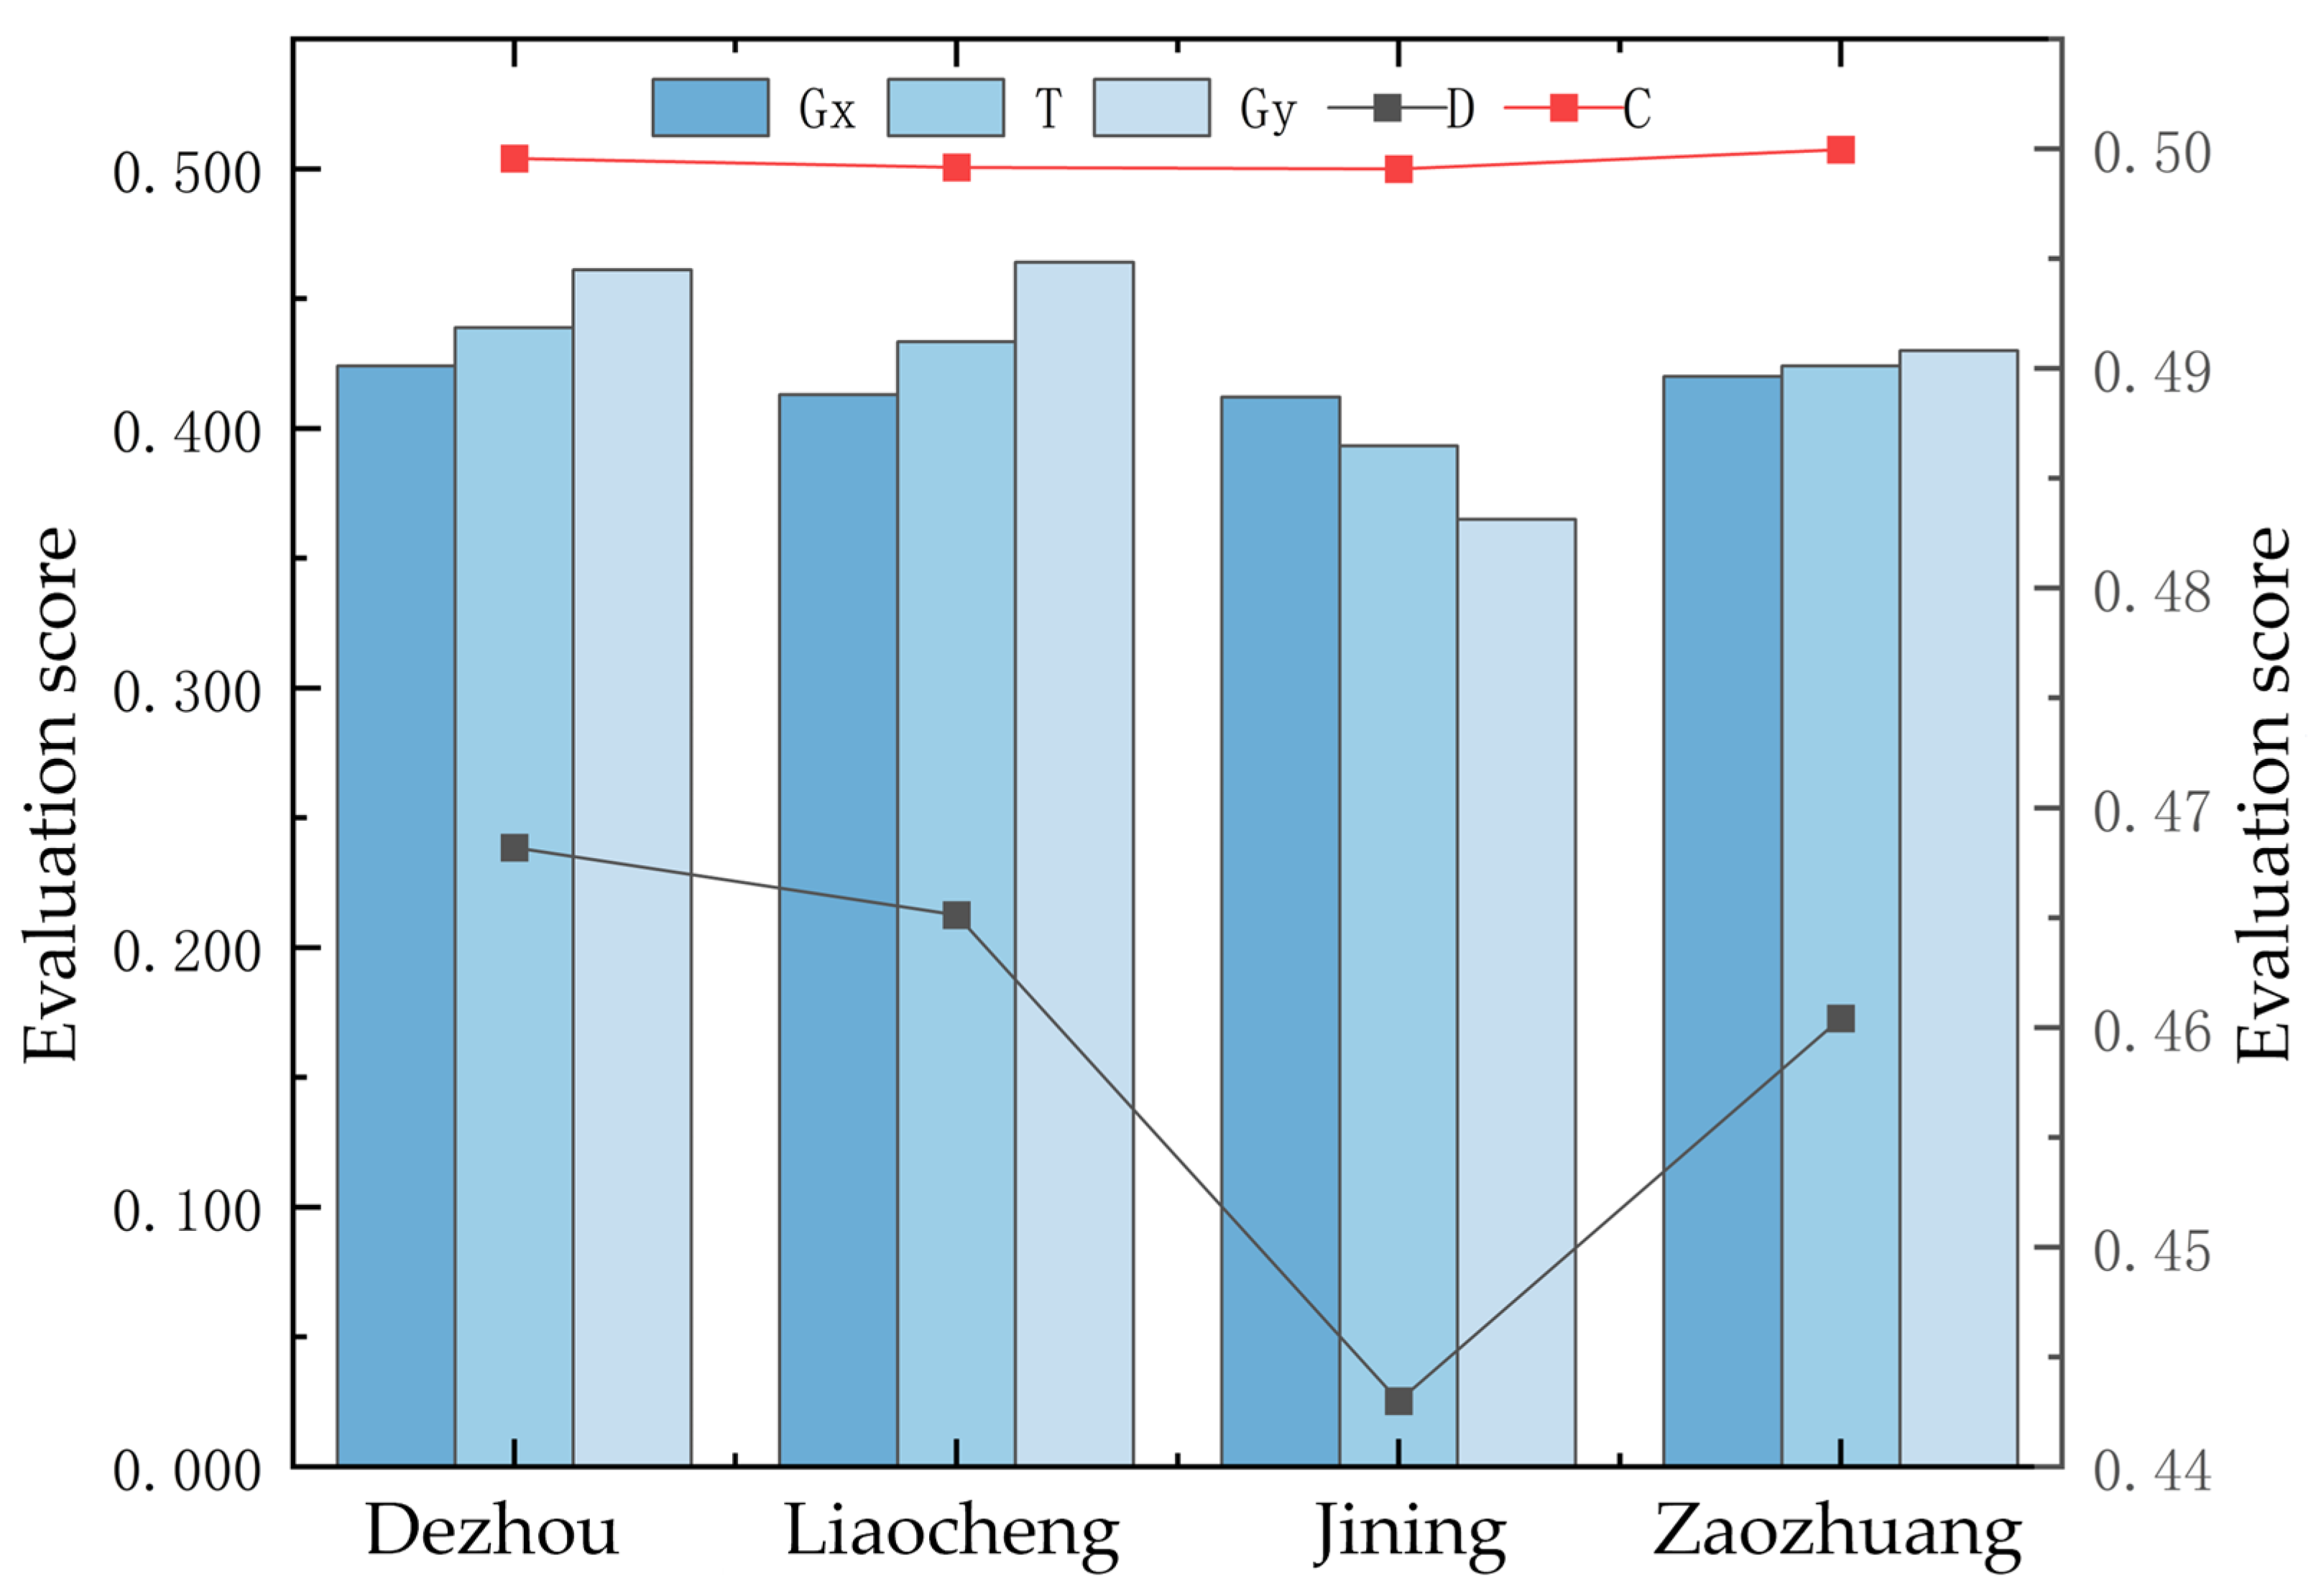
From the data in
Table 10, the values of the comprehensive coordination index
between the four cities (Dezhou, Liaocheng, Jining, and Zaozhuang) and TMs are all around 0.4, the coupling degree
values tend toward 0.5, and the coordination degree
values are in the range between 0.44 and 0.47. The coupling degree levels are medium, and the coordination stages are in the medium coordination coupling stage. To more intuitively point out the total score of urban development, the total score of the mosque distribution situation, and the coupling coordination status of the two systems, a corresponding line chart is drawn according to
Table 10. The result is shown in
Figure 8.
The results indicate, as shown in
Table 10 and
Figure 8, that there is a moderate level of coordination between the four cities and their mosques. The composite scores of urban development and mosque distribution trends are generally stable, suggesting that mosques are increasingly aligned with urban development trends. This moderate level of coupling indicates that TMs are harmoniously integrated within urban development, with diminishing conflicts and contradictions between the two.


