
The Impact of Ground-Floor Elevation of School Buildings on Courtyard Wind Environment


Abstract
1. Introduction
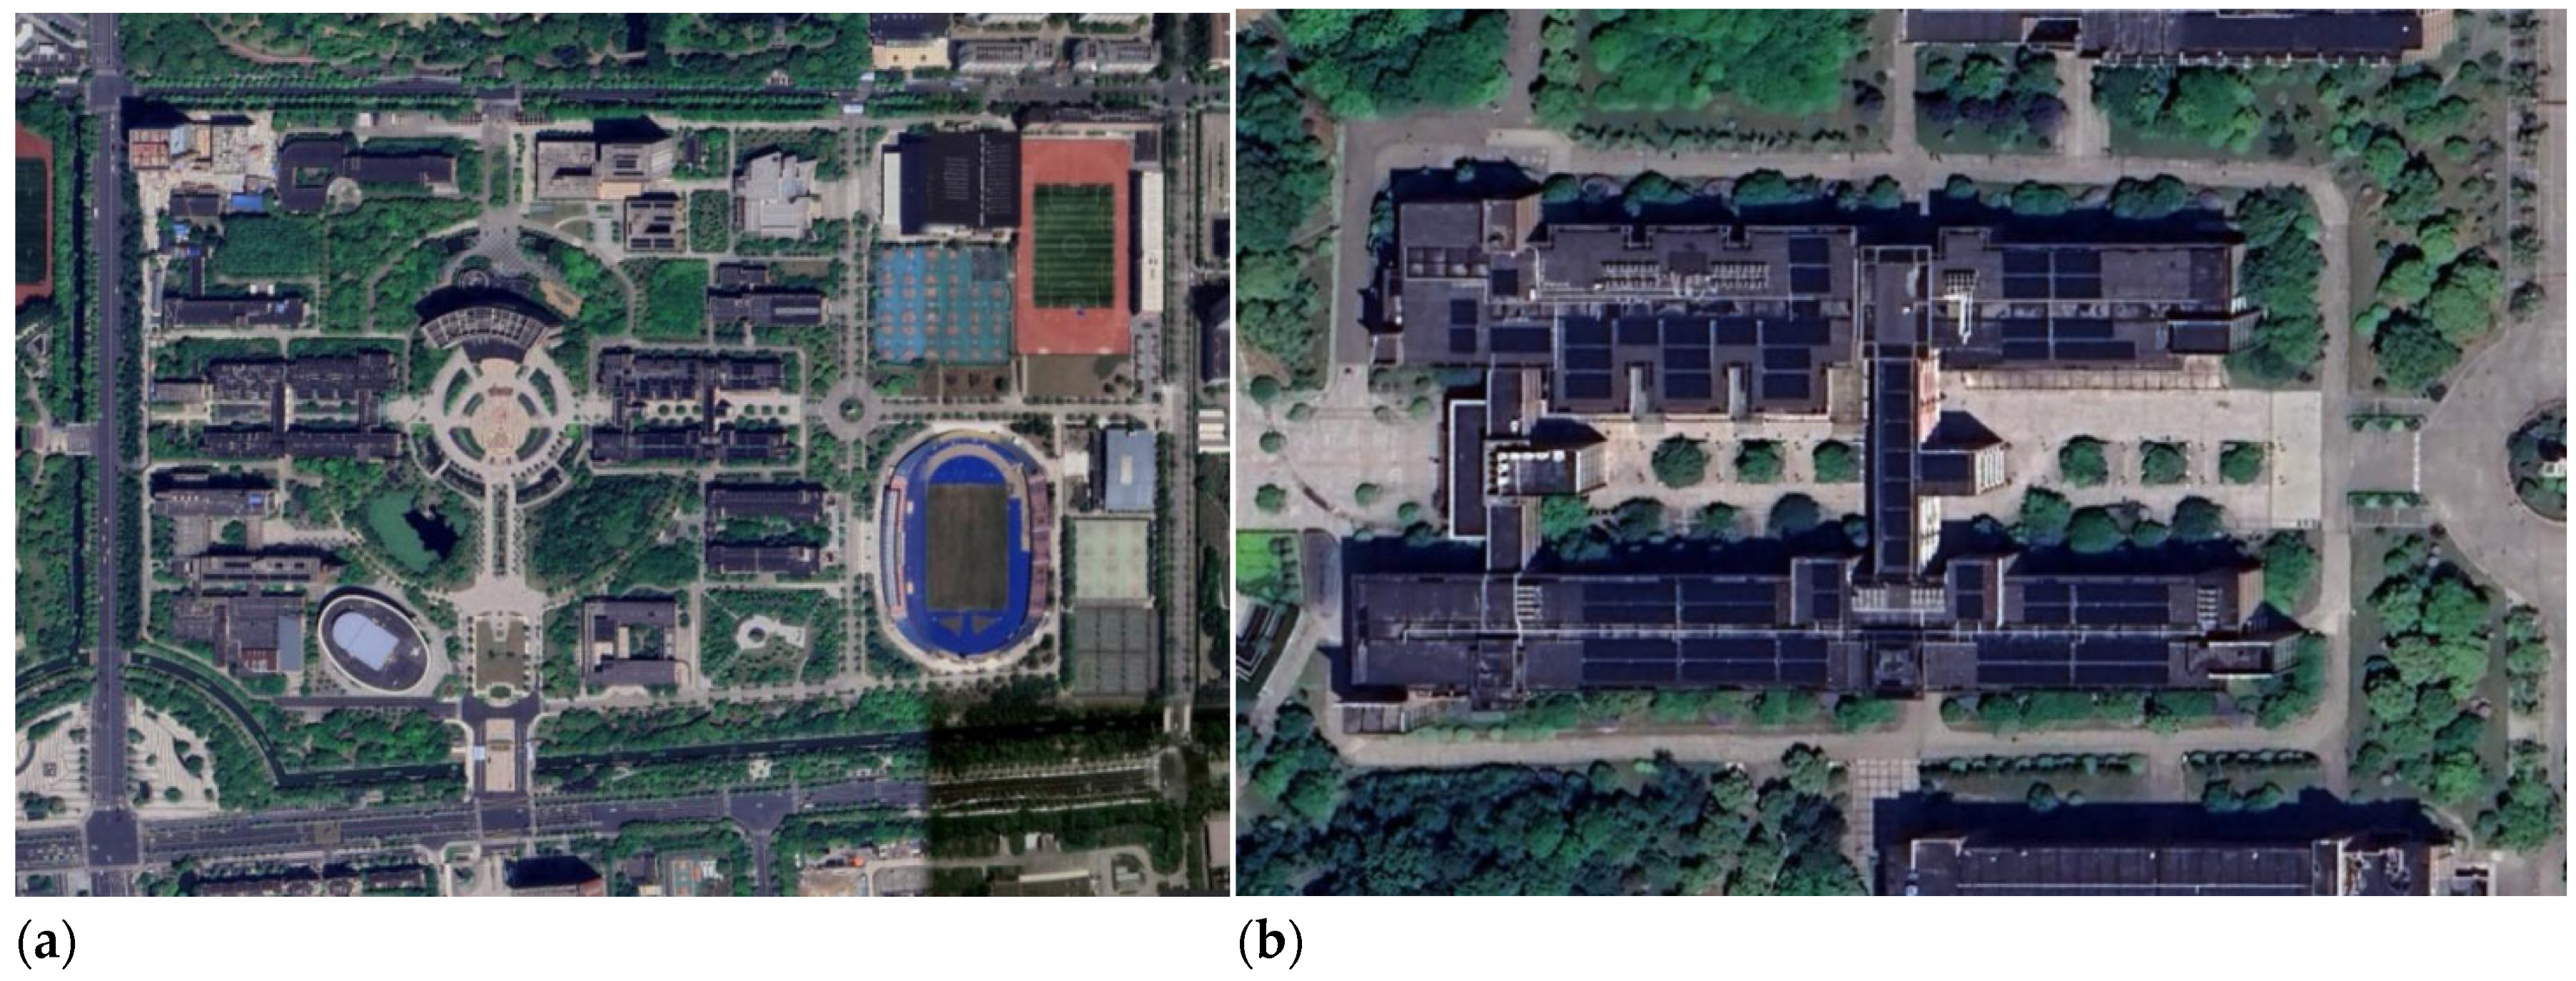
2. Methodology
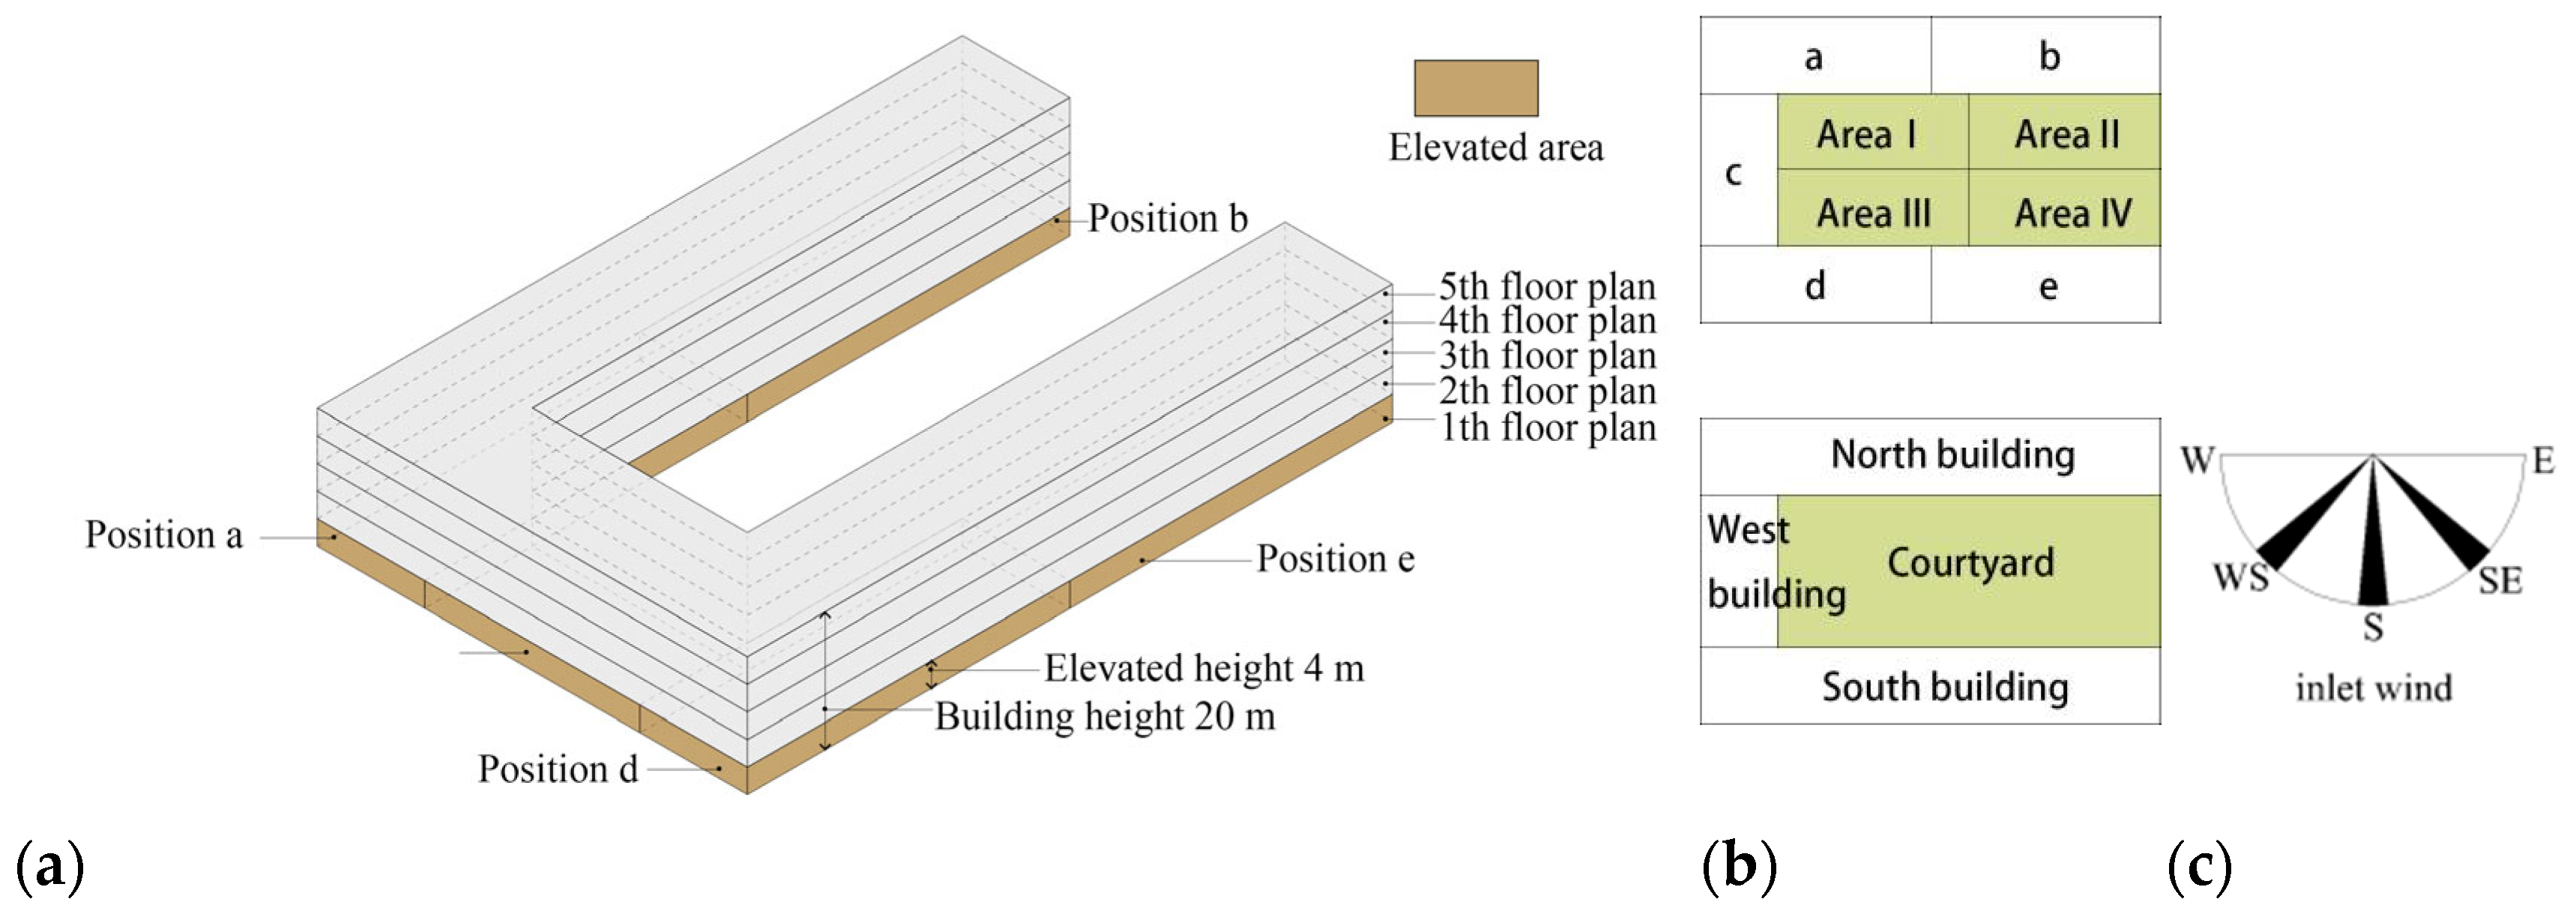
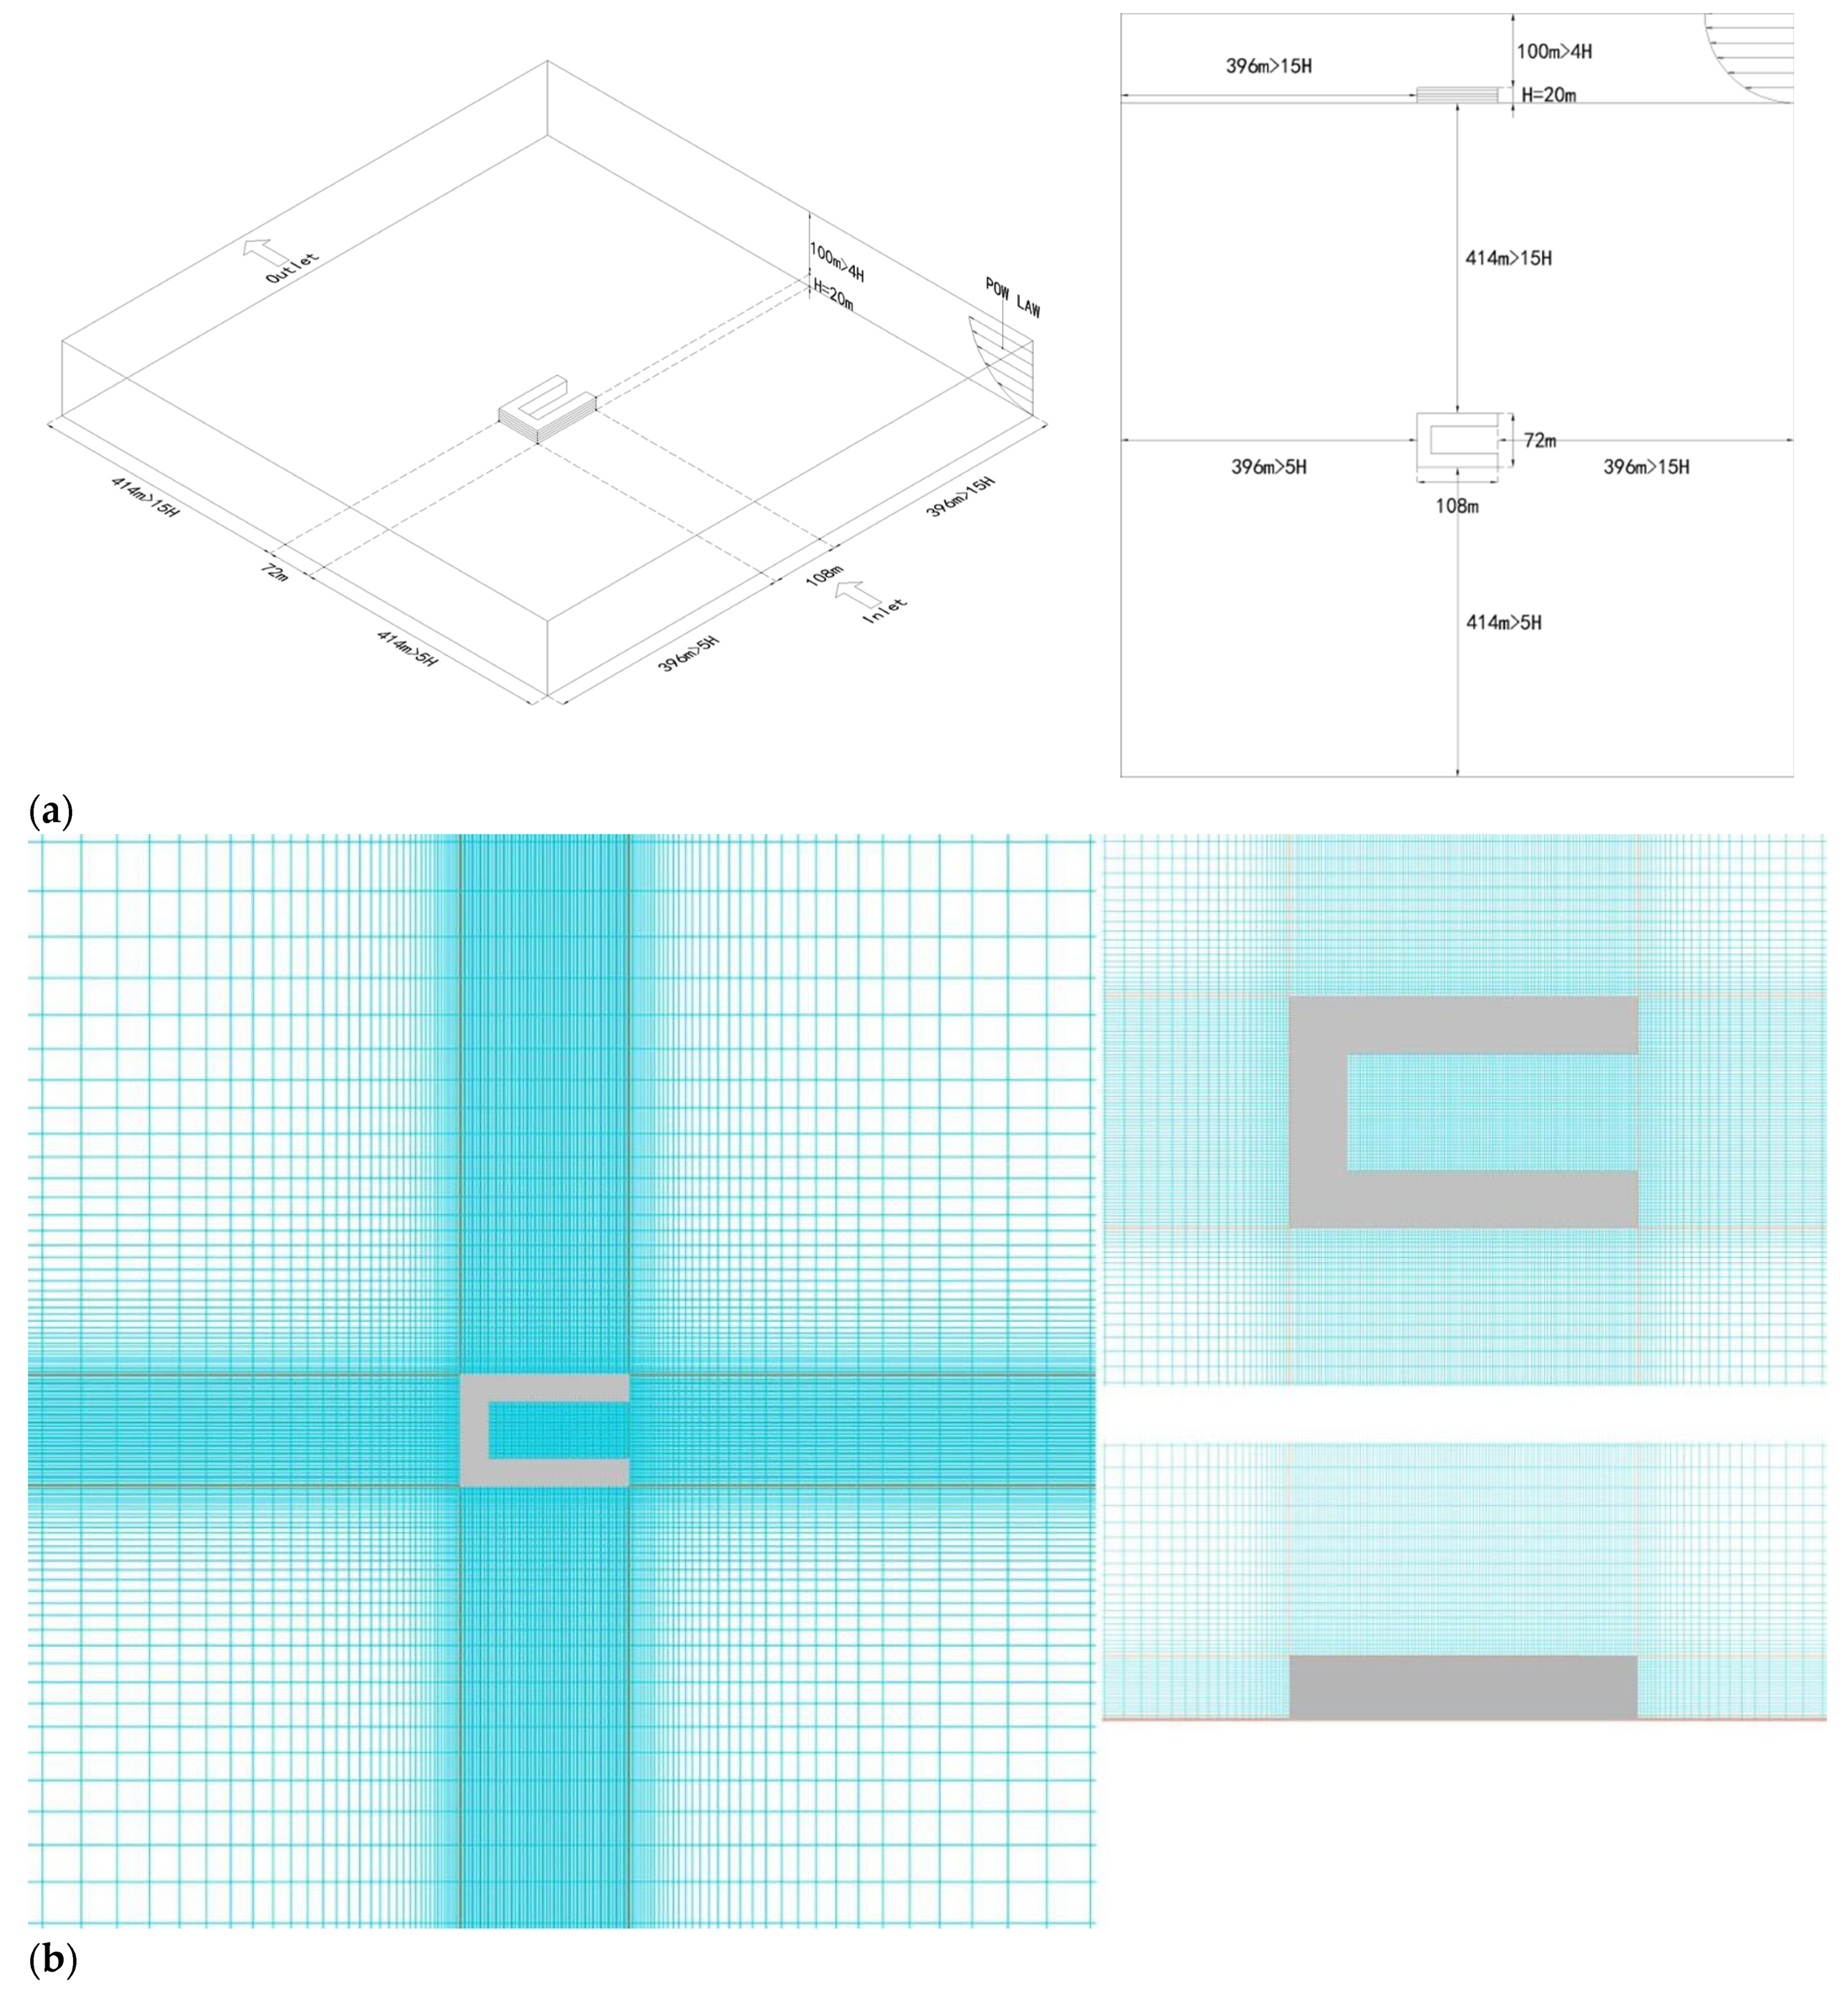
2.1. Courtyard Elevation Pattern
2.2. Research Indicators
2.3. Simulation Methodology
2.4. Grid-Independence Test
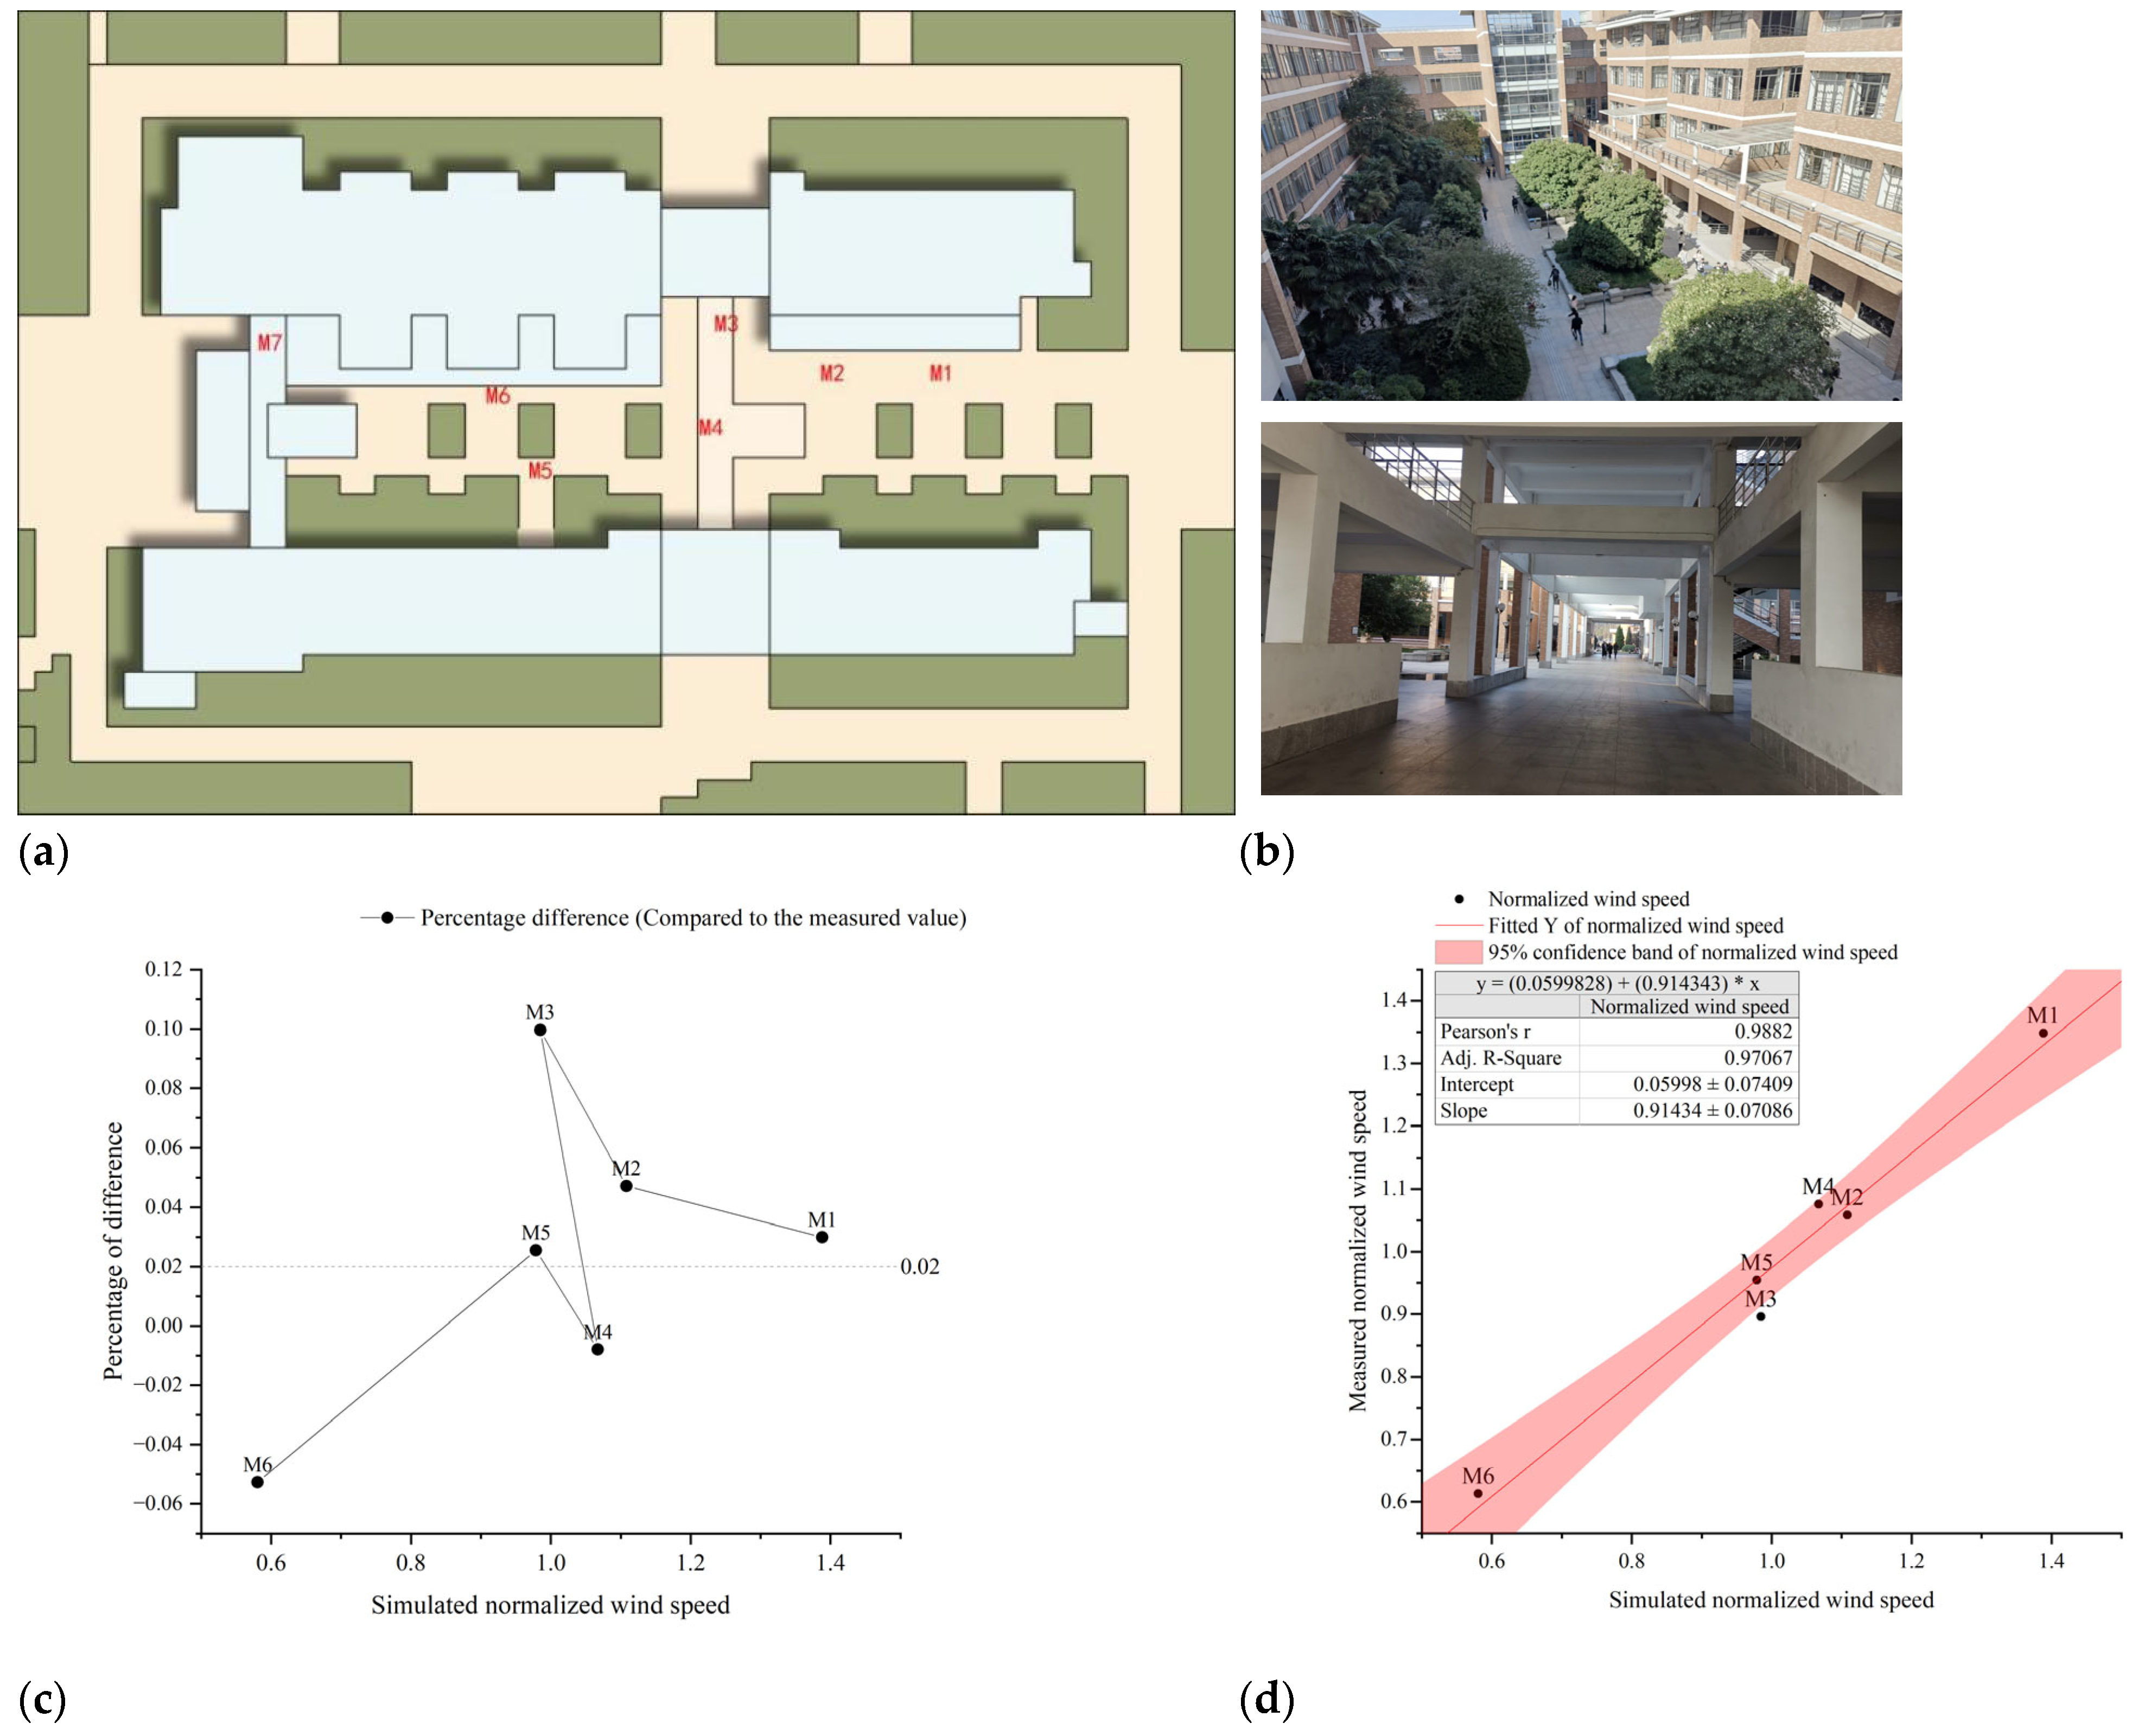
2.5. Simulation Validation
3. Statistical Results
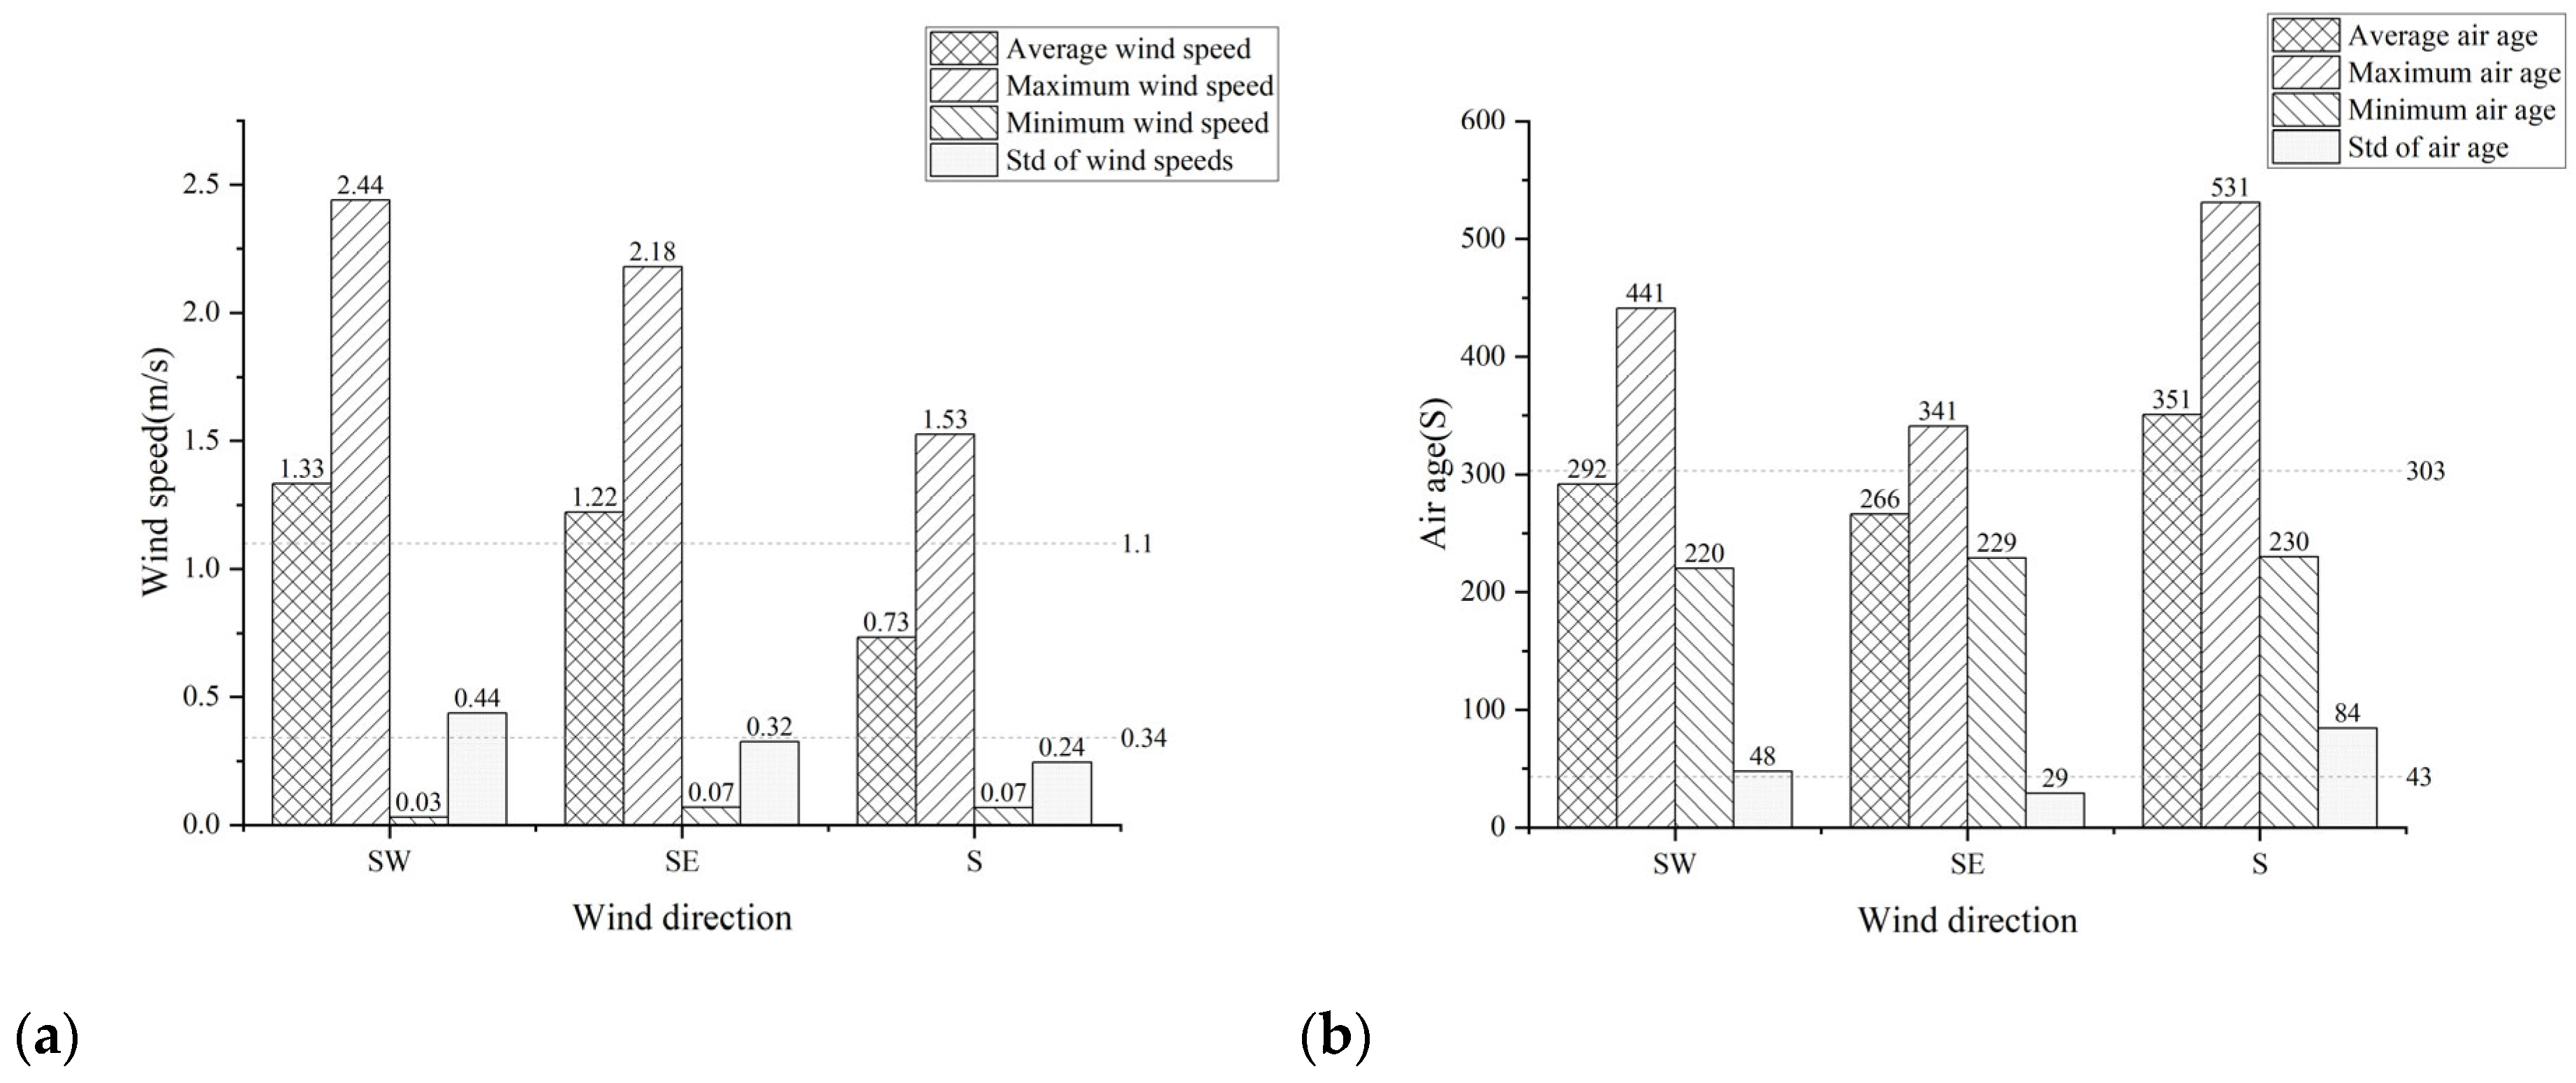
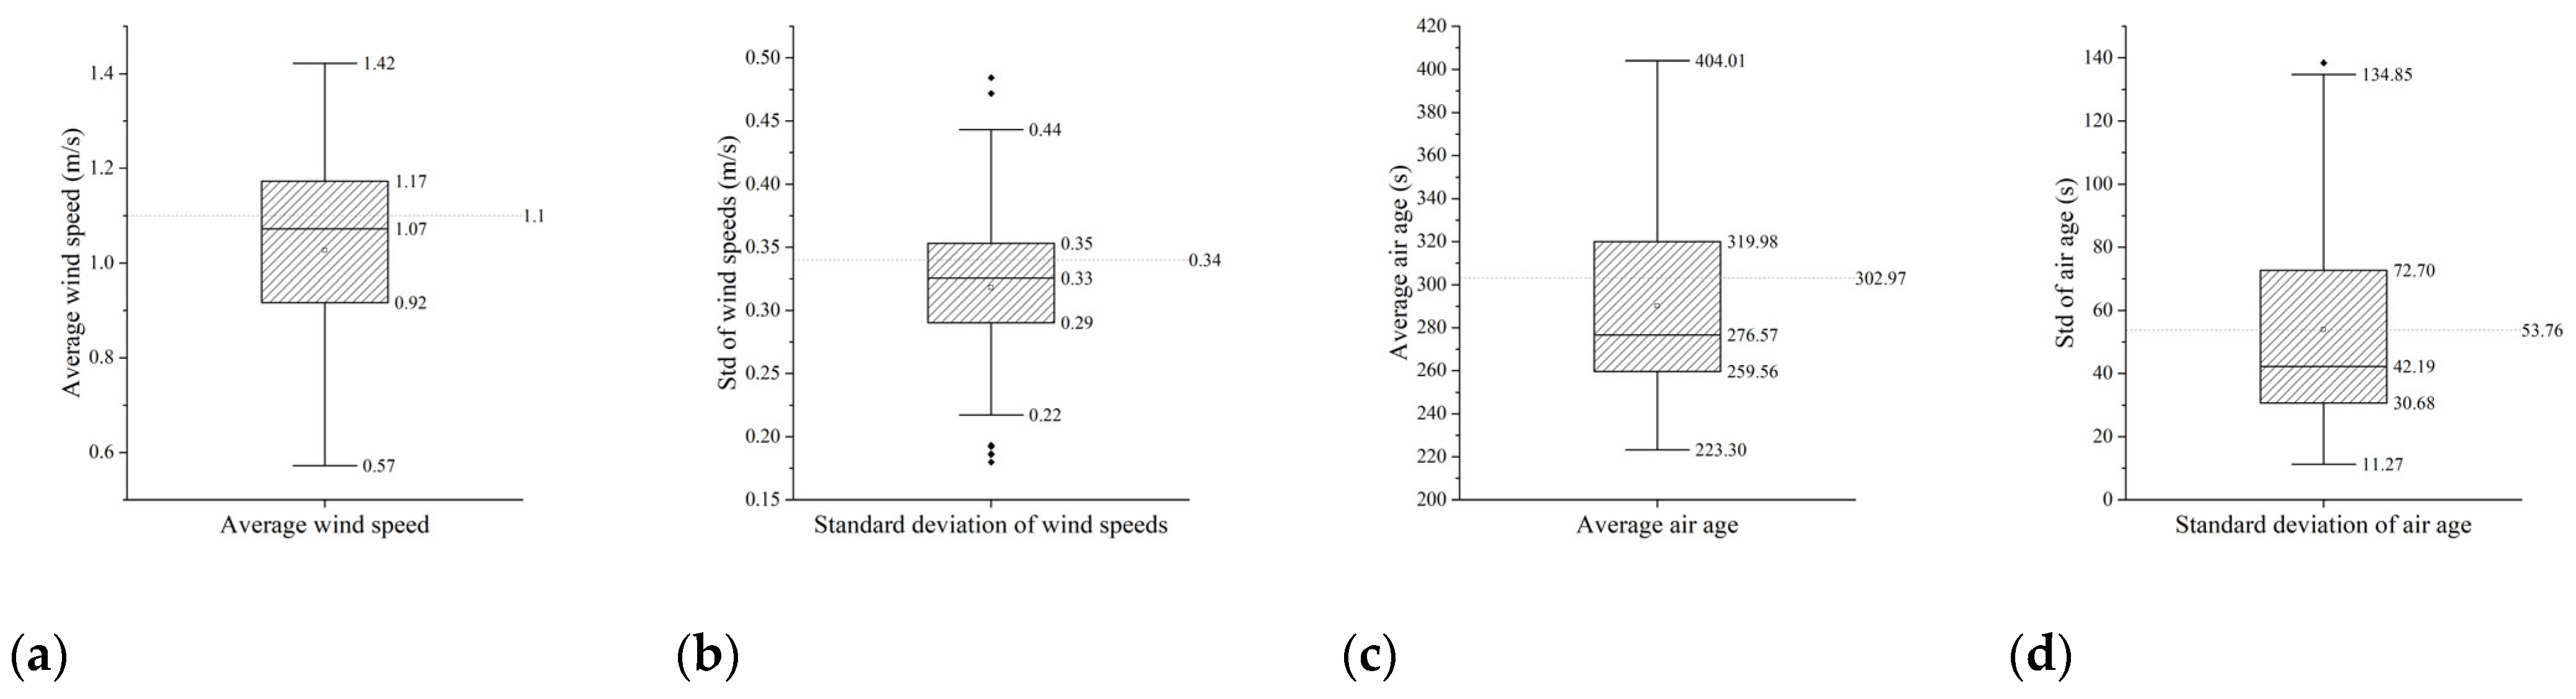
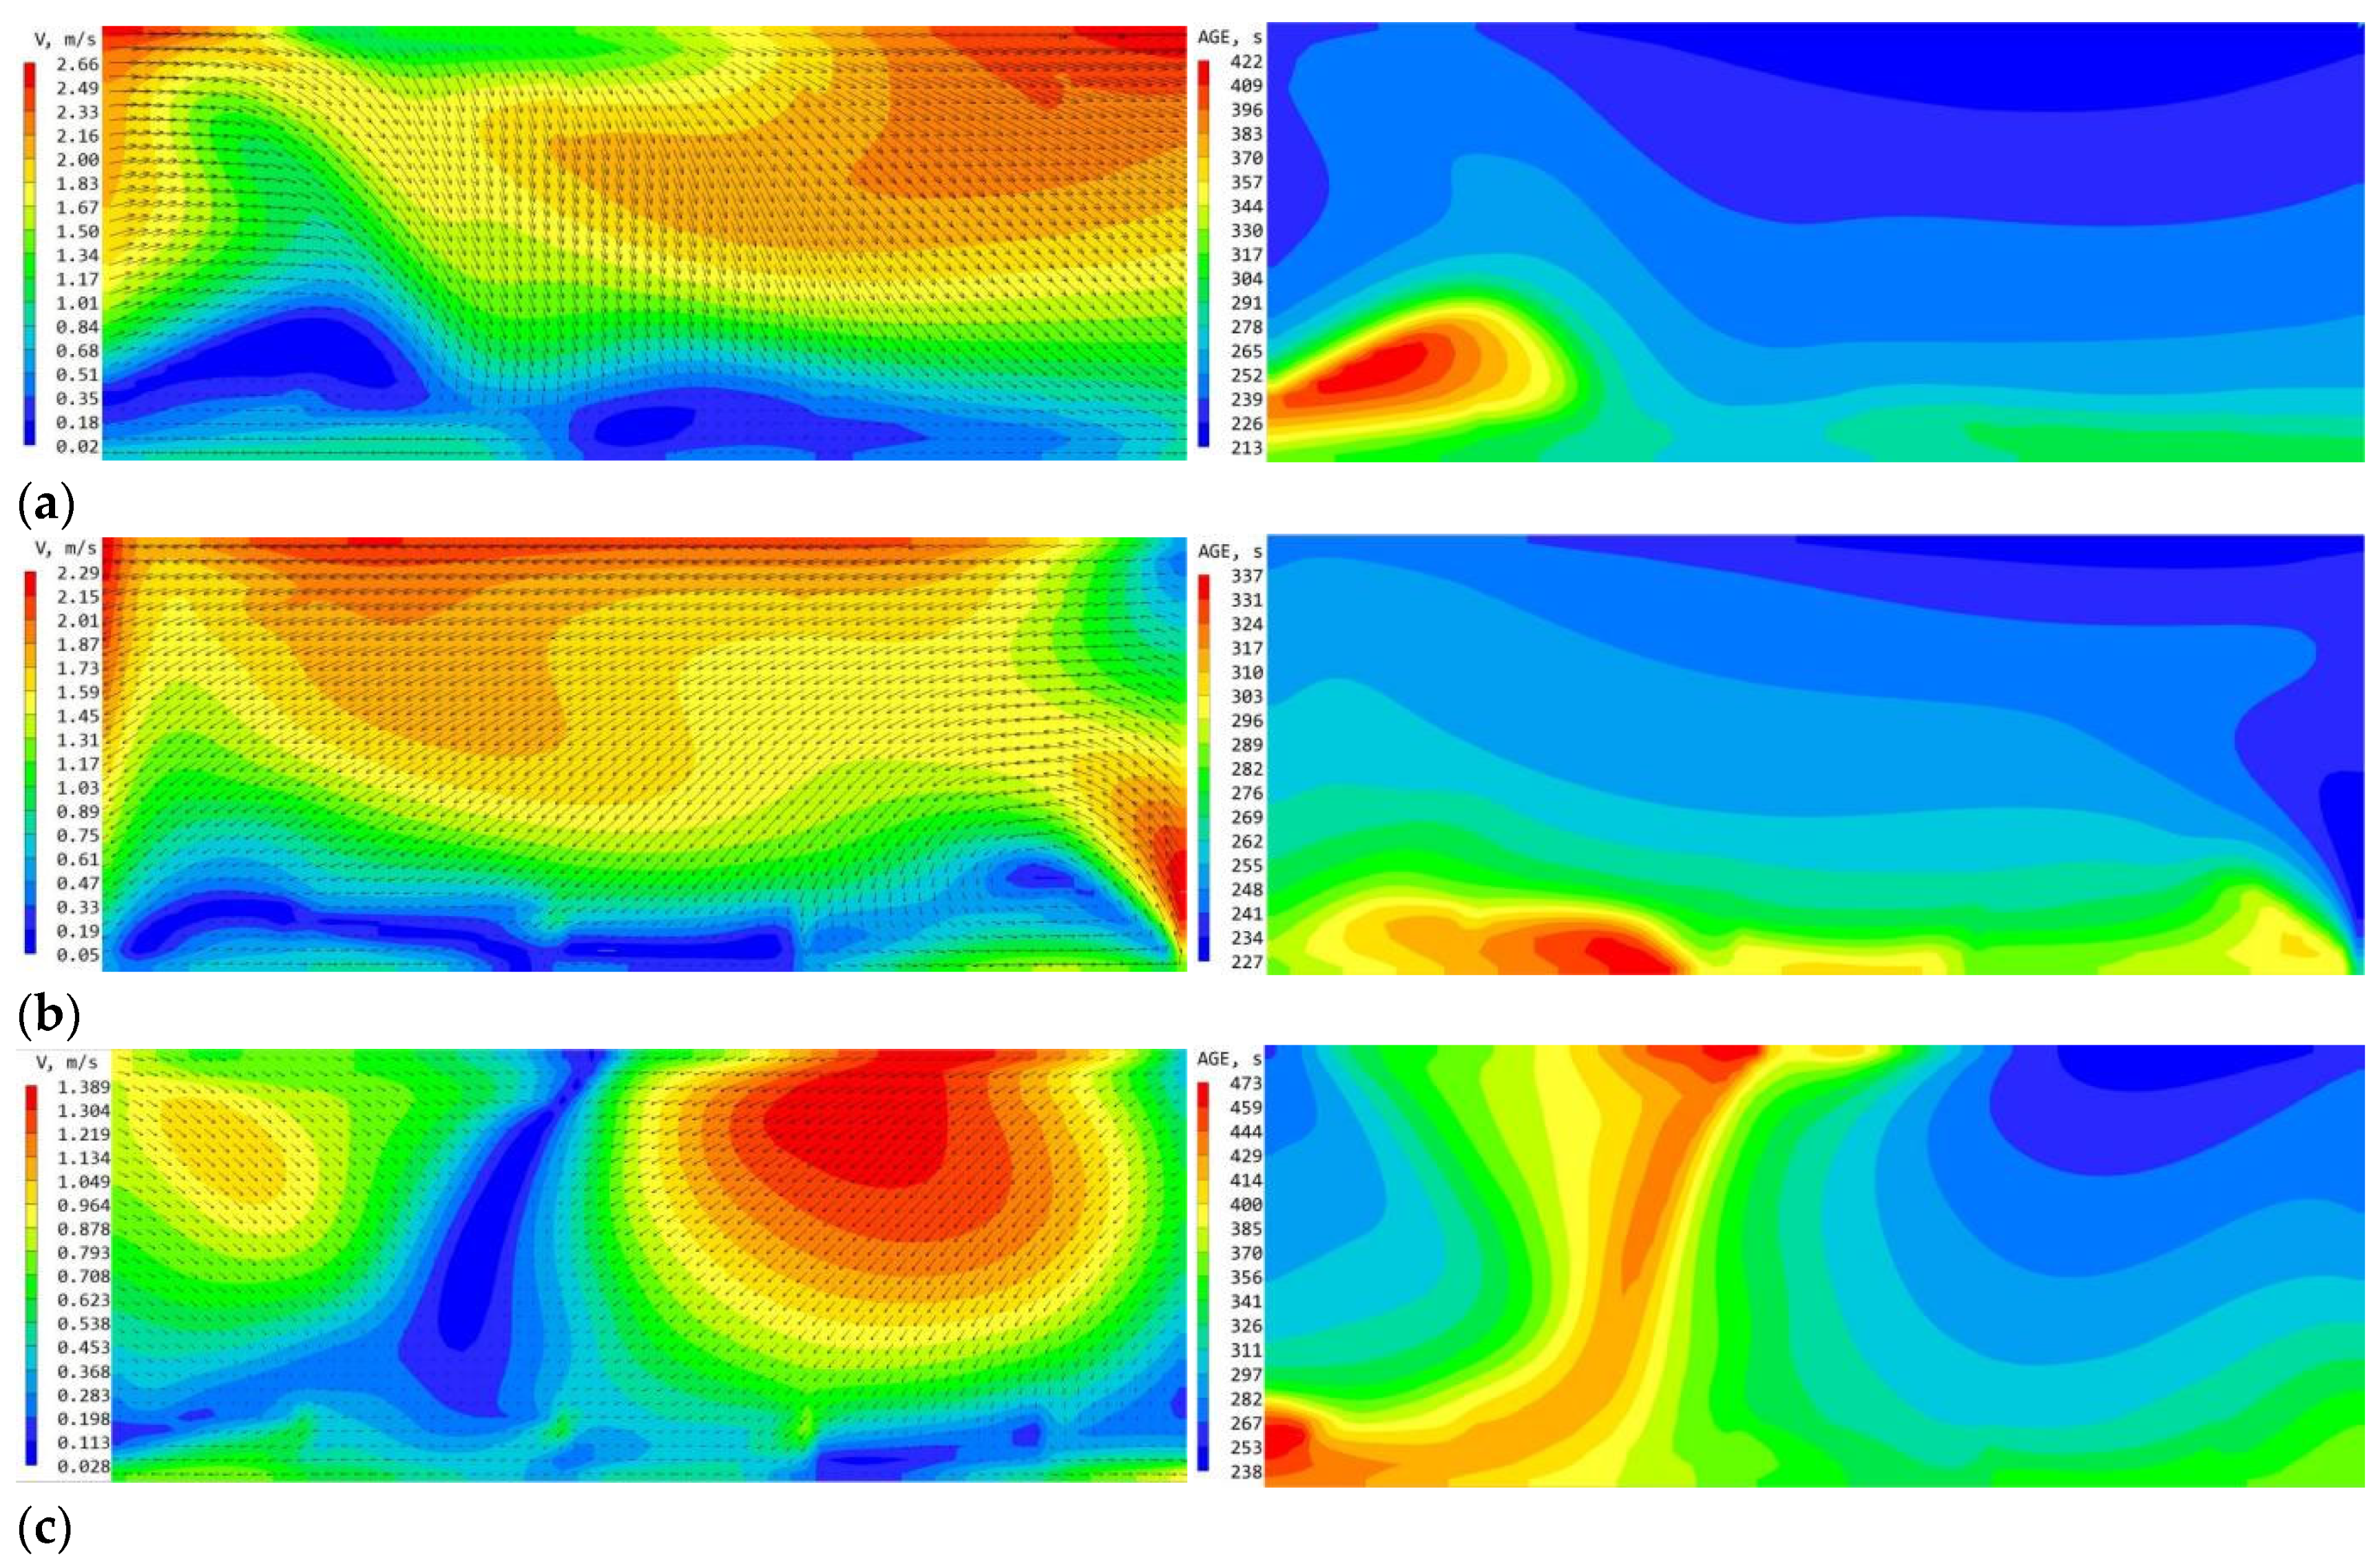
3.1. Wind Environment Indicators for the No-Elevation Program Courtyard
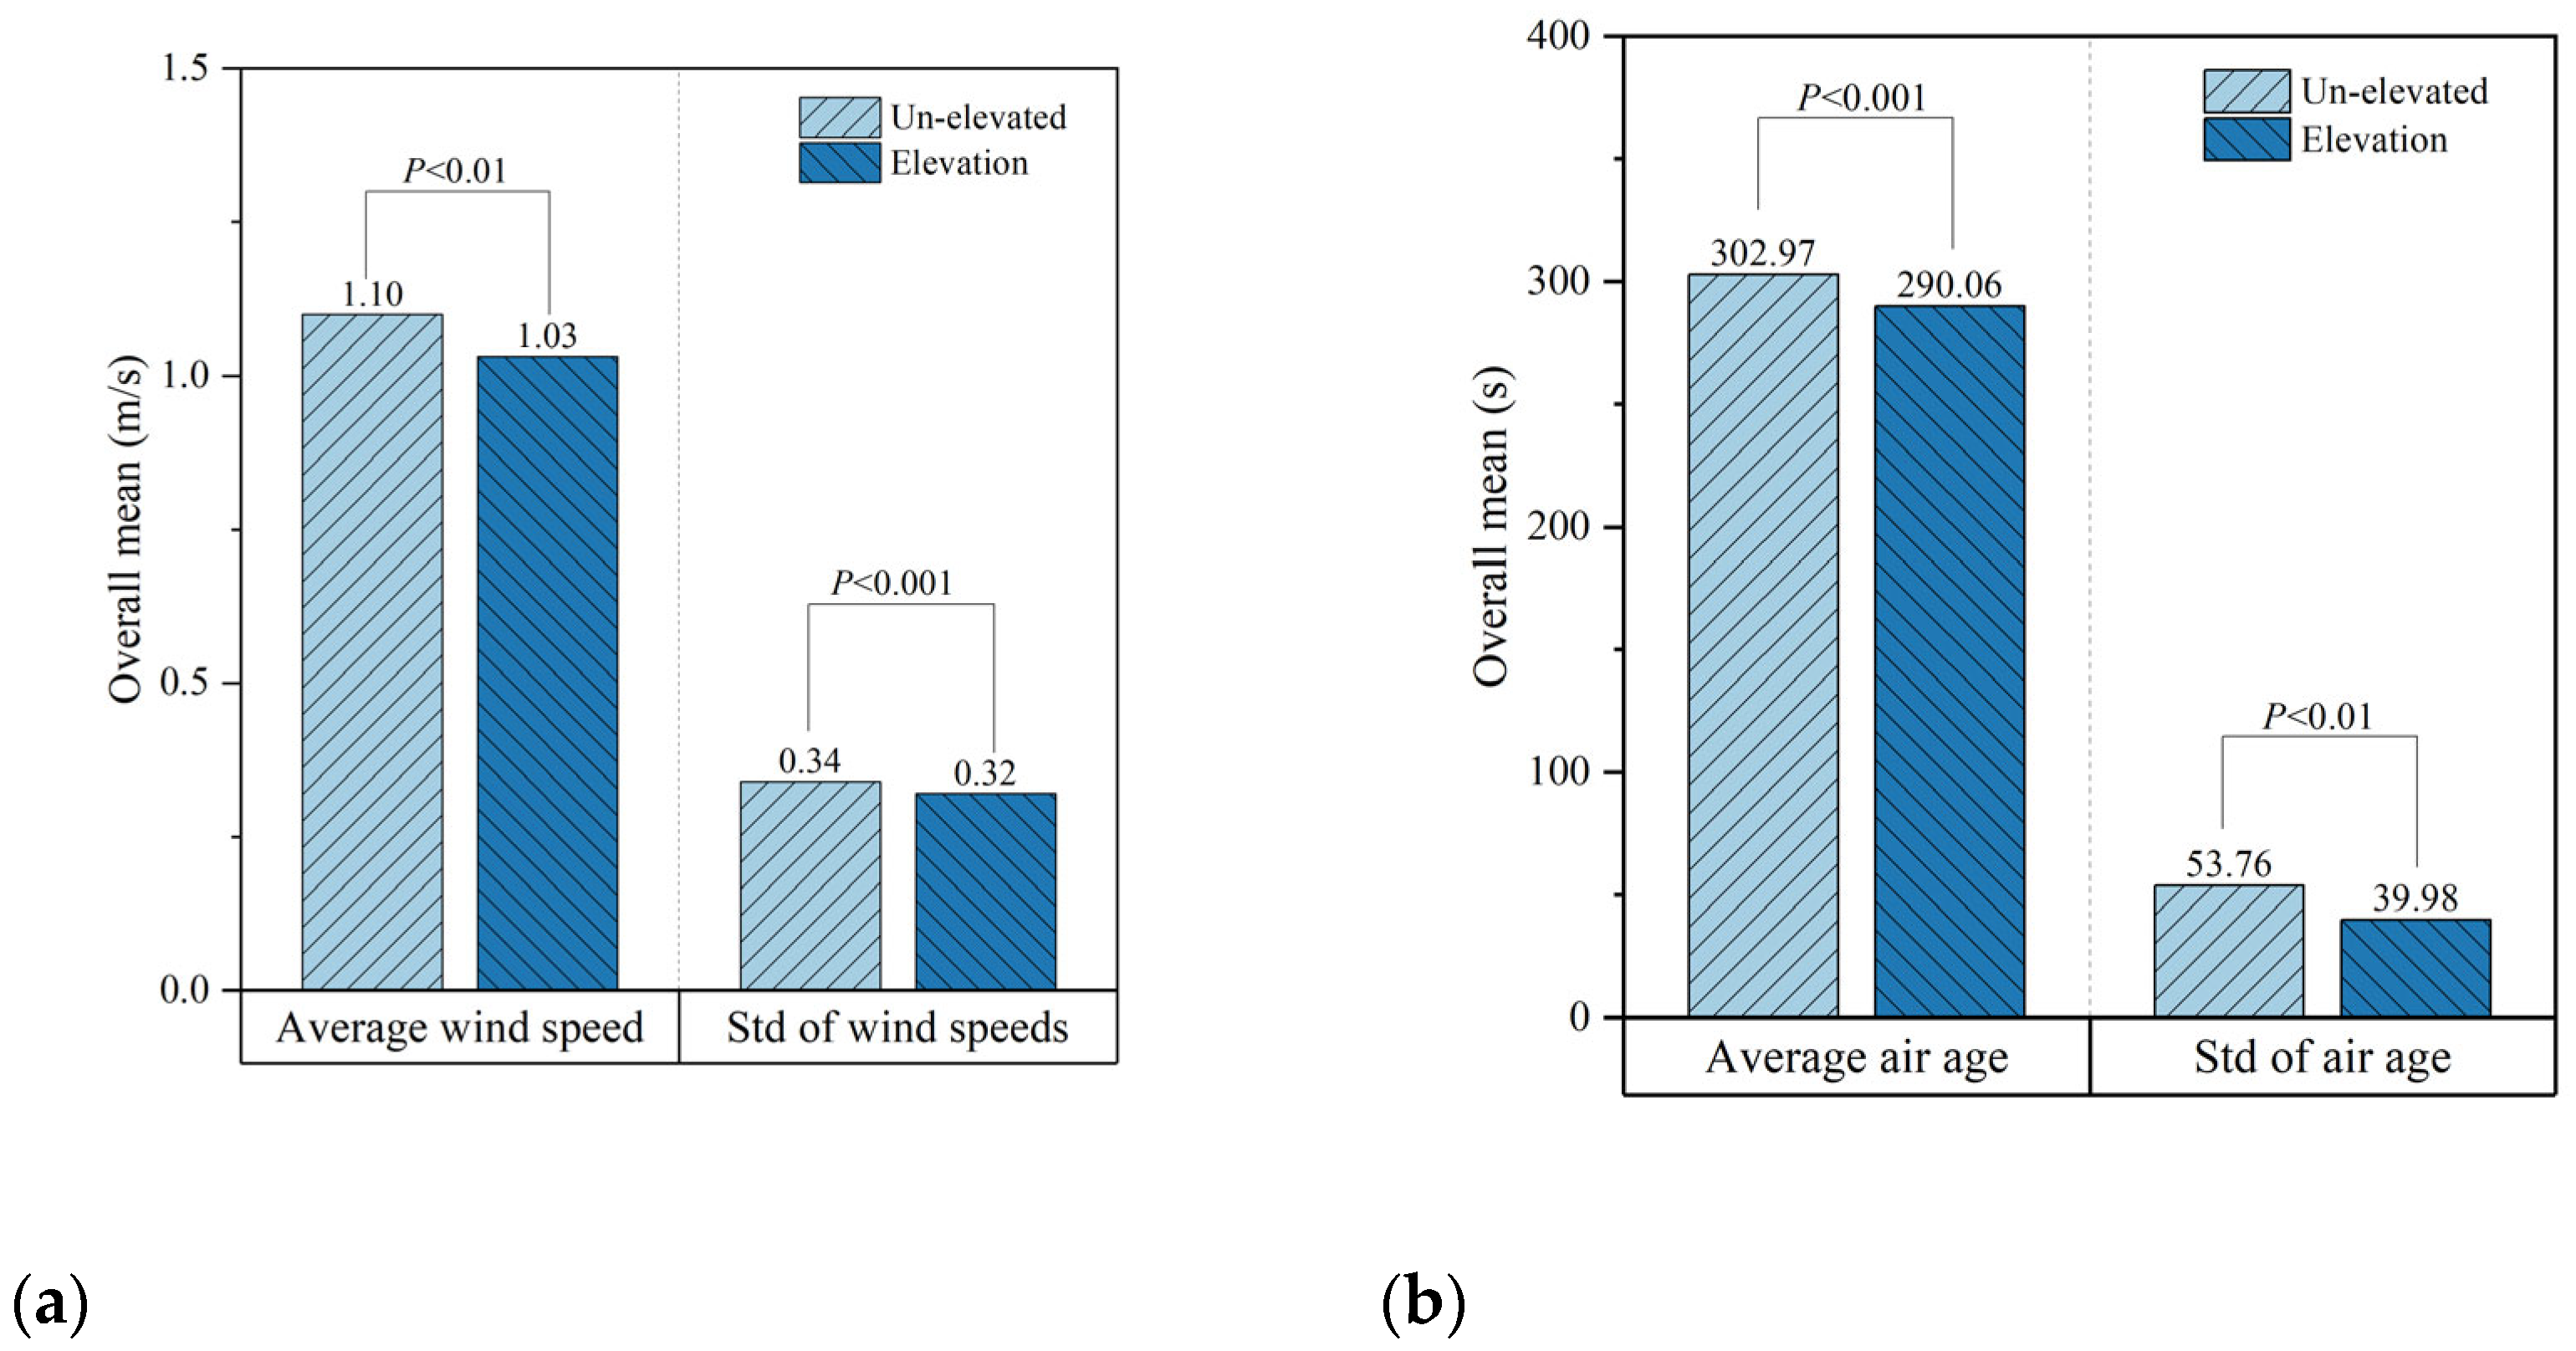
3.2. Overall Effect of Elevation on the MV
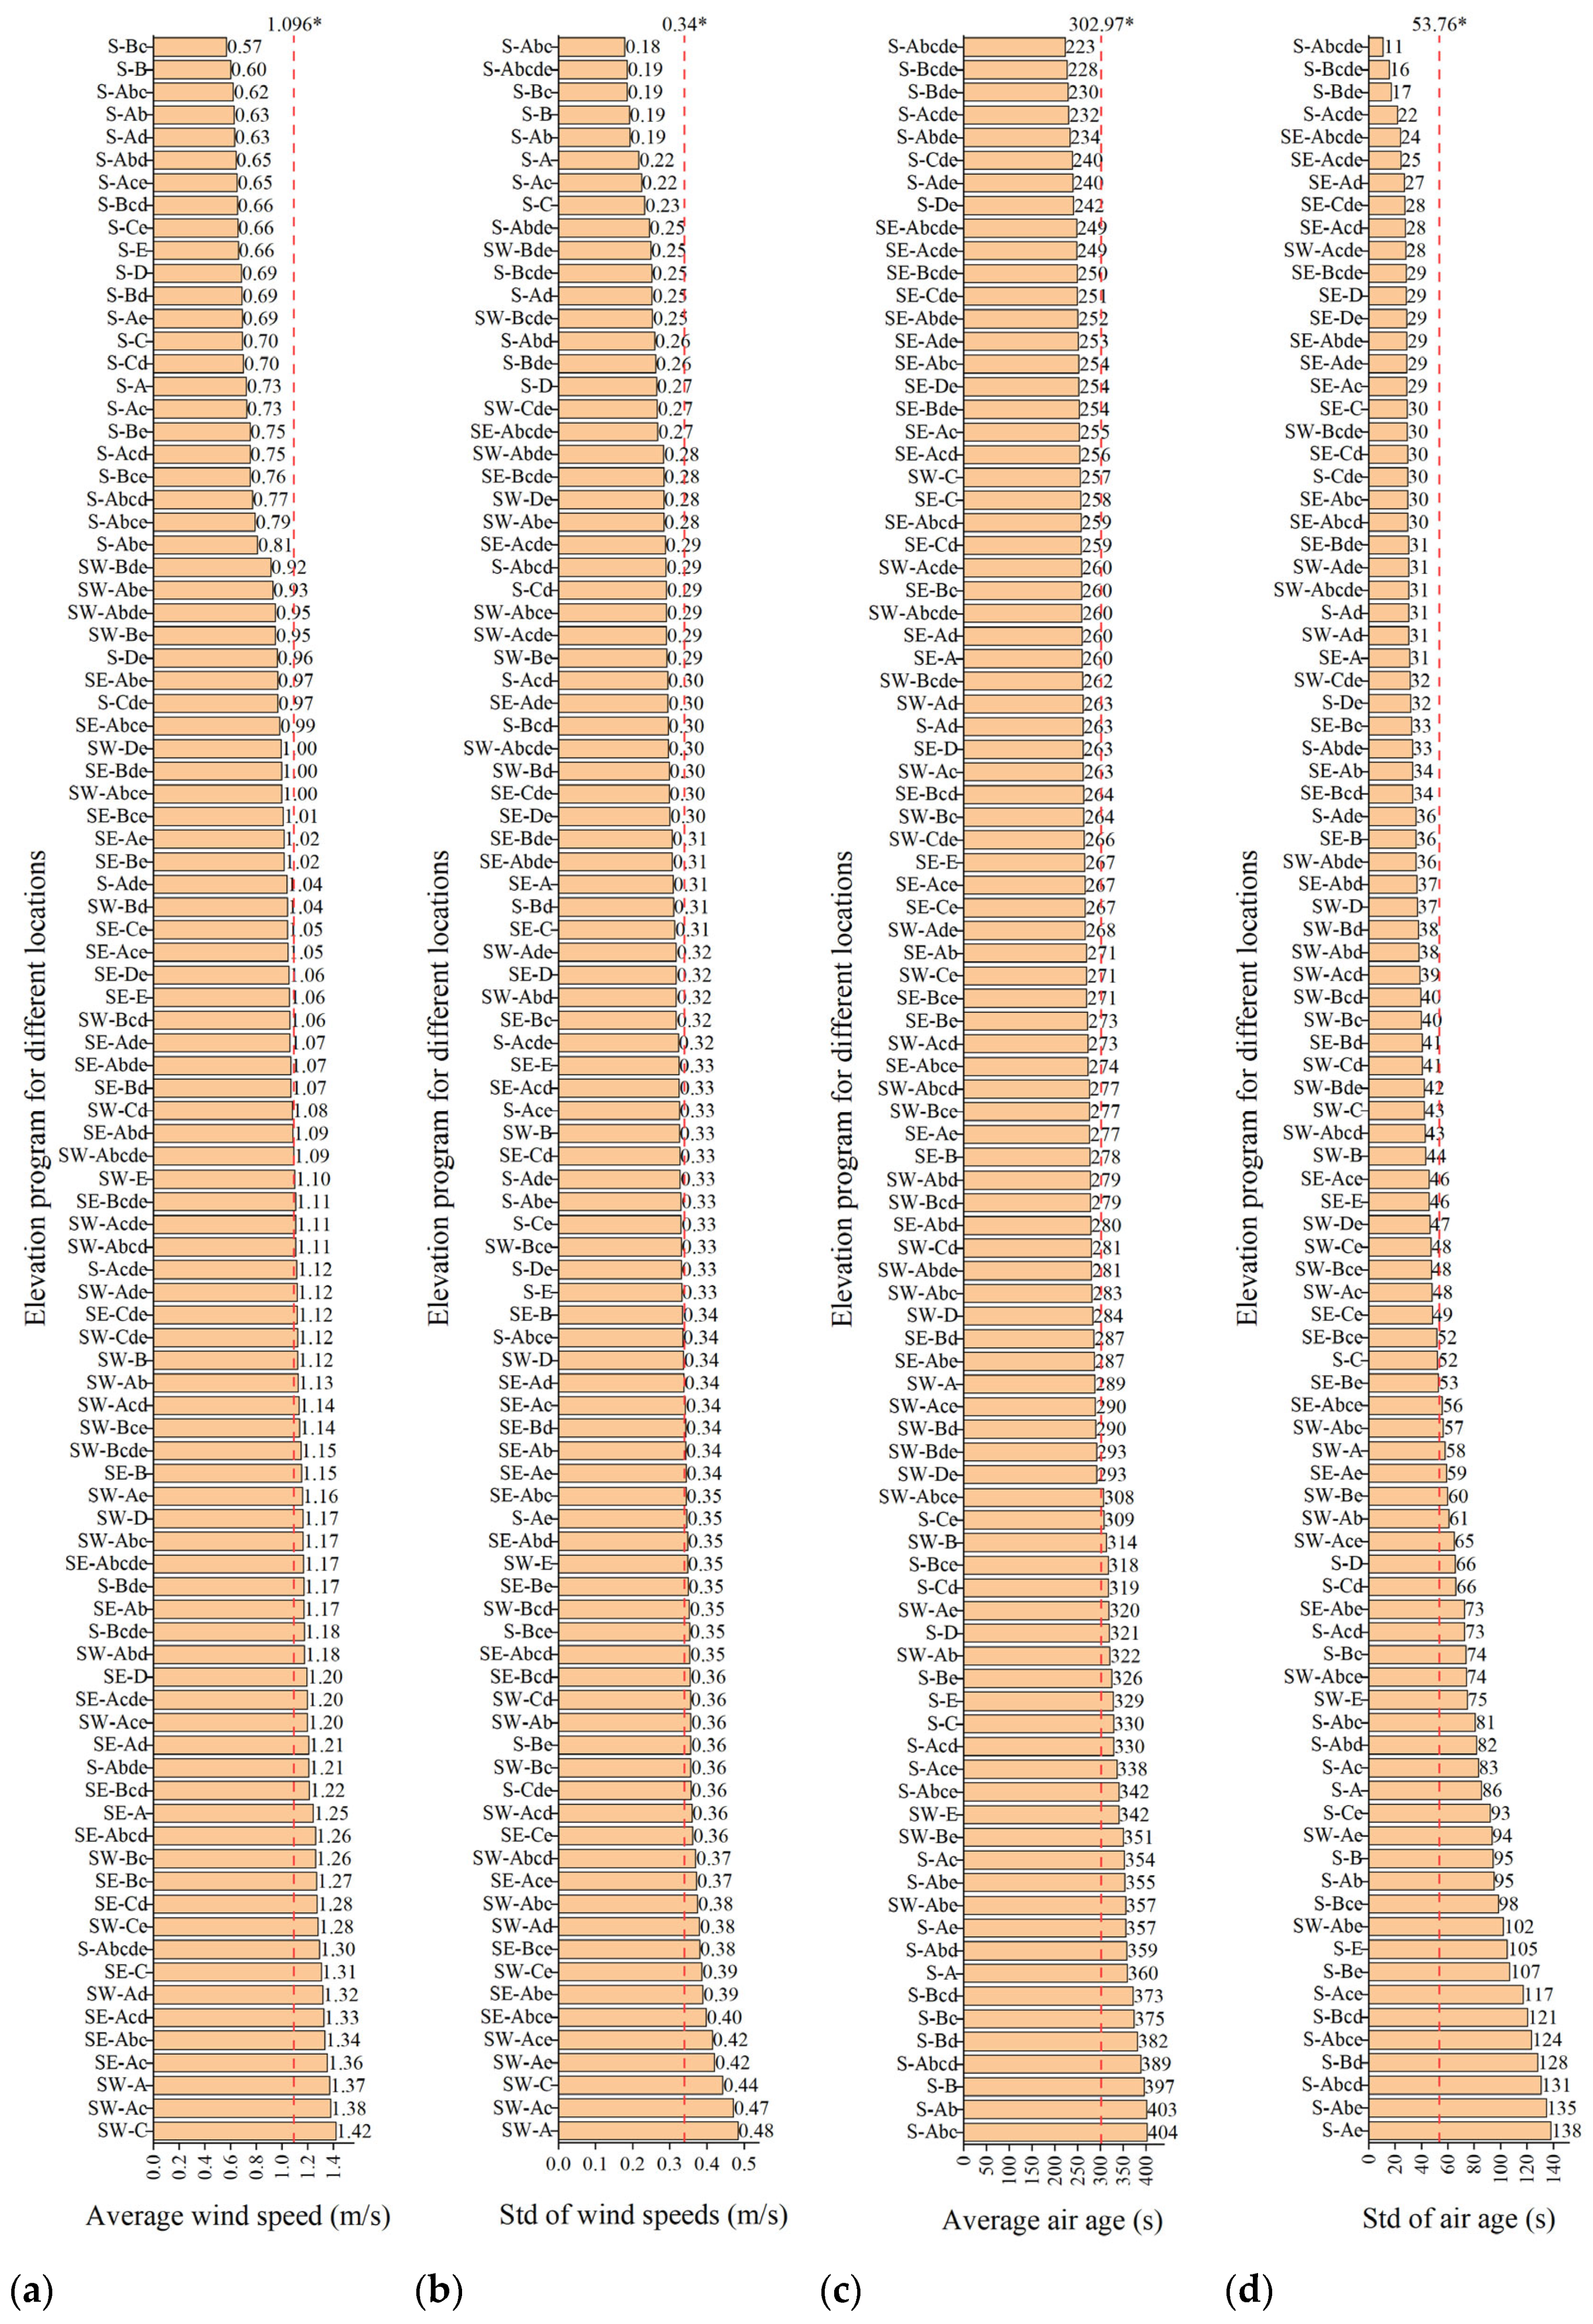
3.2.1. Comparison of the MV
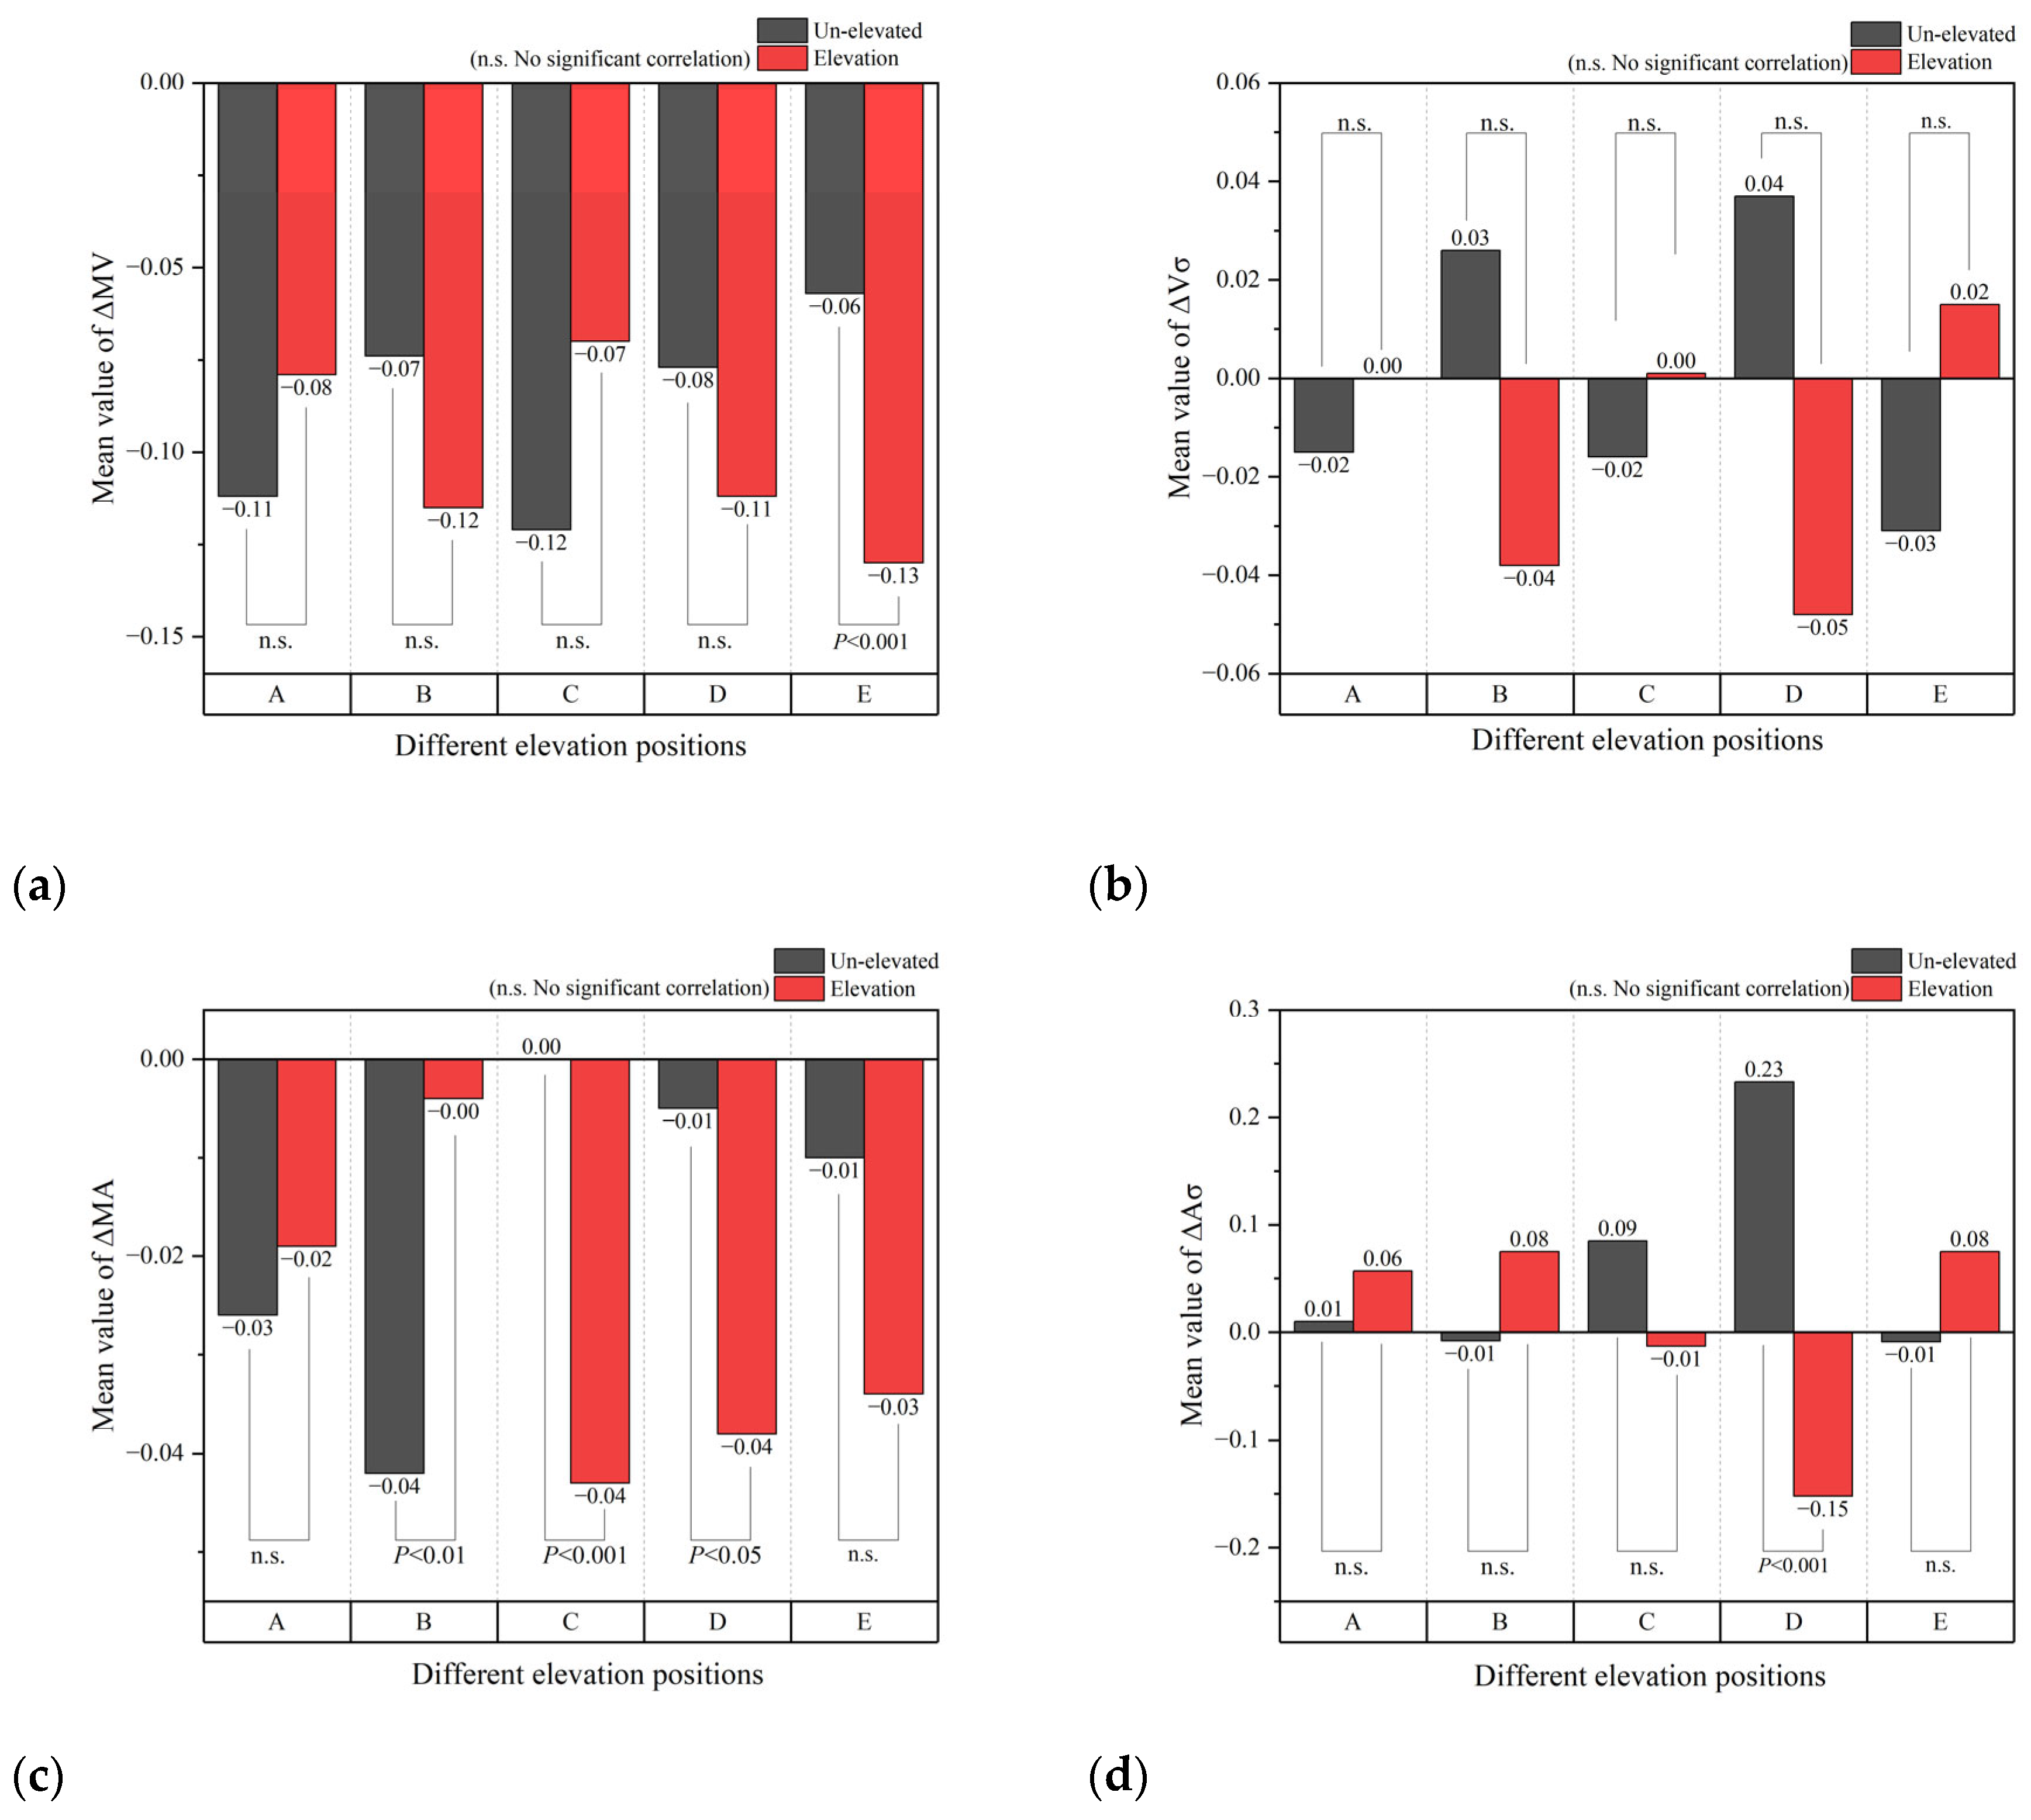
3.2.2. Effect of Elevation at Different Locations on the MV
3.3. Overall Effect of Elevation on the Vσ
3.3.1. Comparison of the Vσ
3.3.2. Effect of Elevation at Different Locations on the Vσ
3.4. Overall Effect of Elevation on the MA
3.4.1. Comparison of the MA
3.4.2. Effect of Elevation at Different Locations on the MA
3.5. Overall Effect of Elevation on the Aσ
3.5.1. Comparison of the Aσ
3.5.2. Effect of Elevation at Different Locations on the Aσ
3.6. Correlation of Wind Environmental Indicator Factors
4. Analysis and Discussion
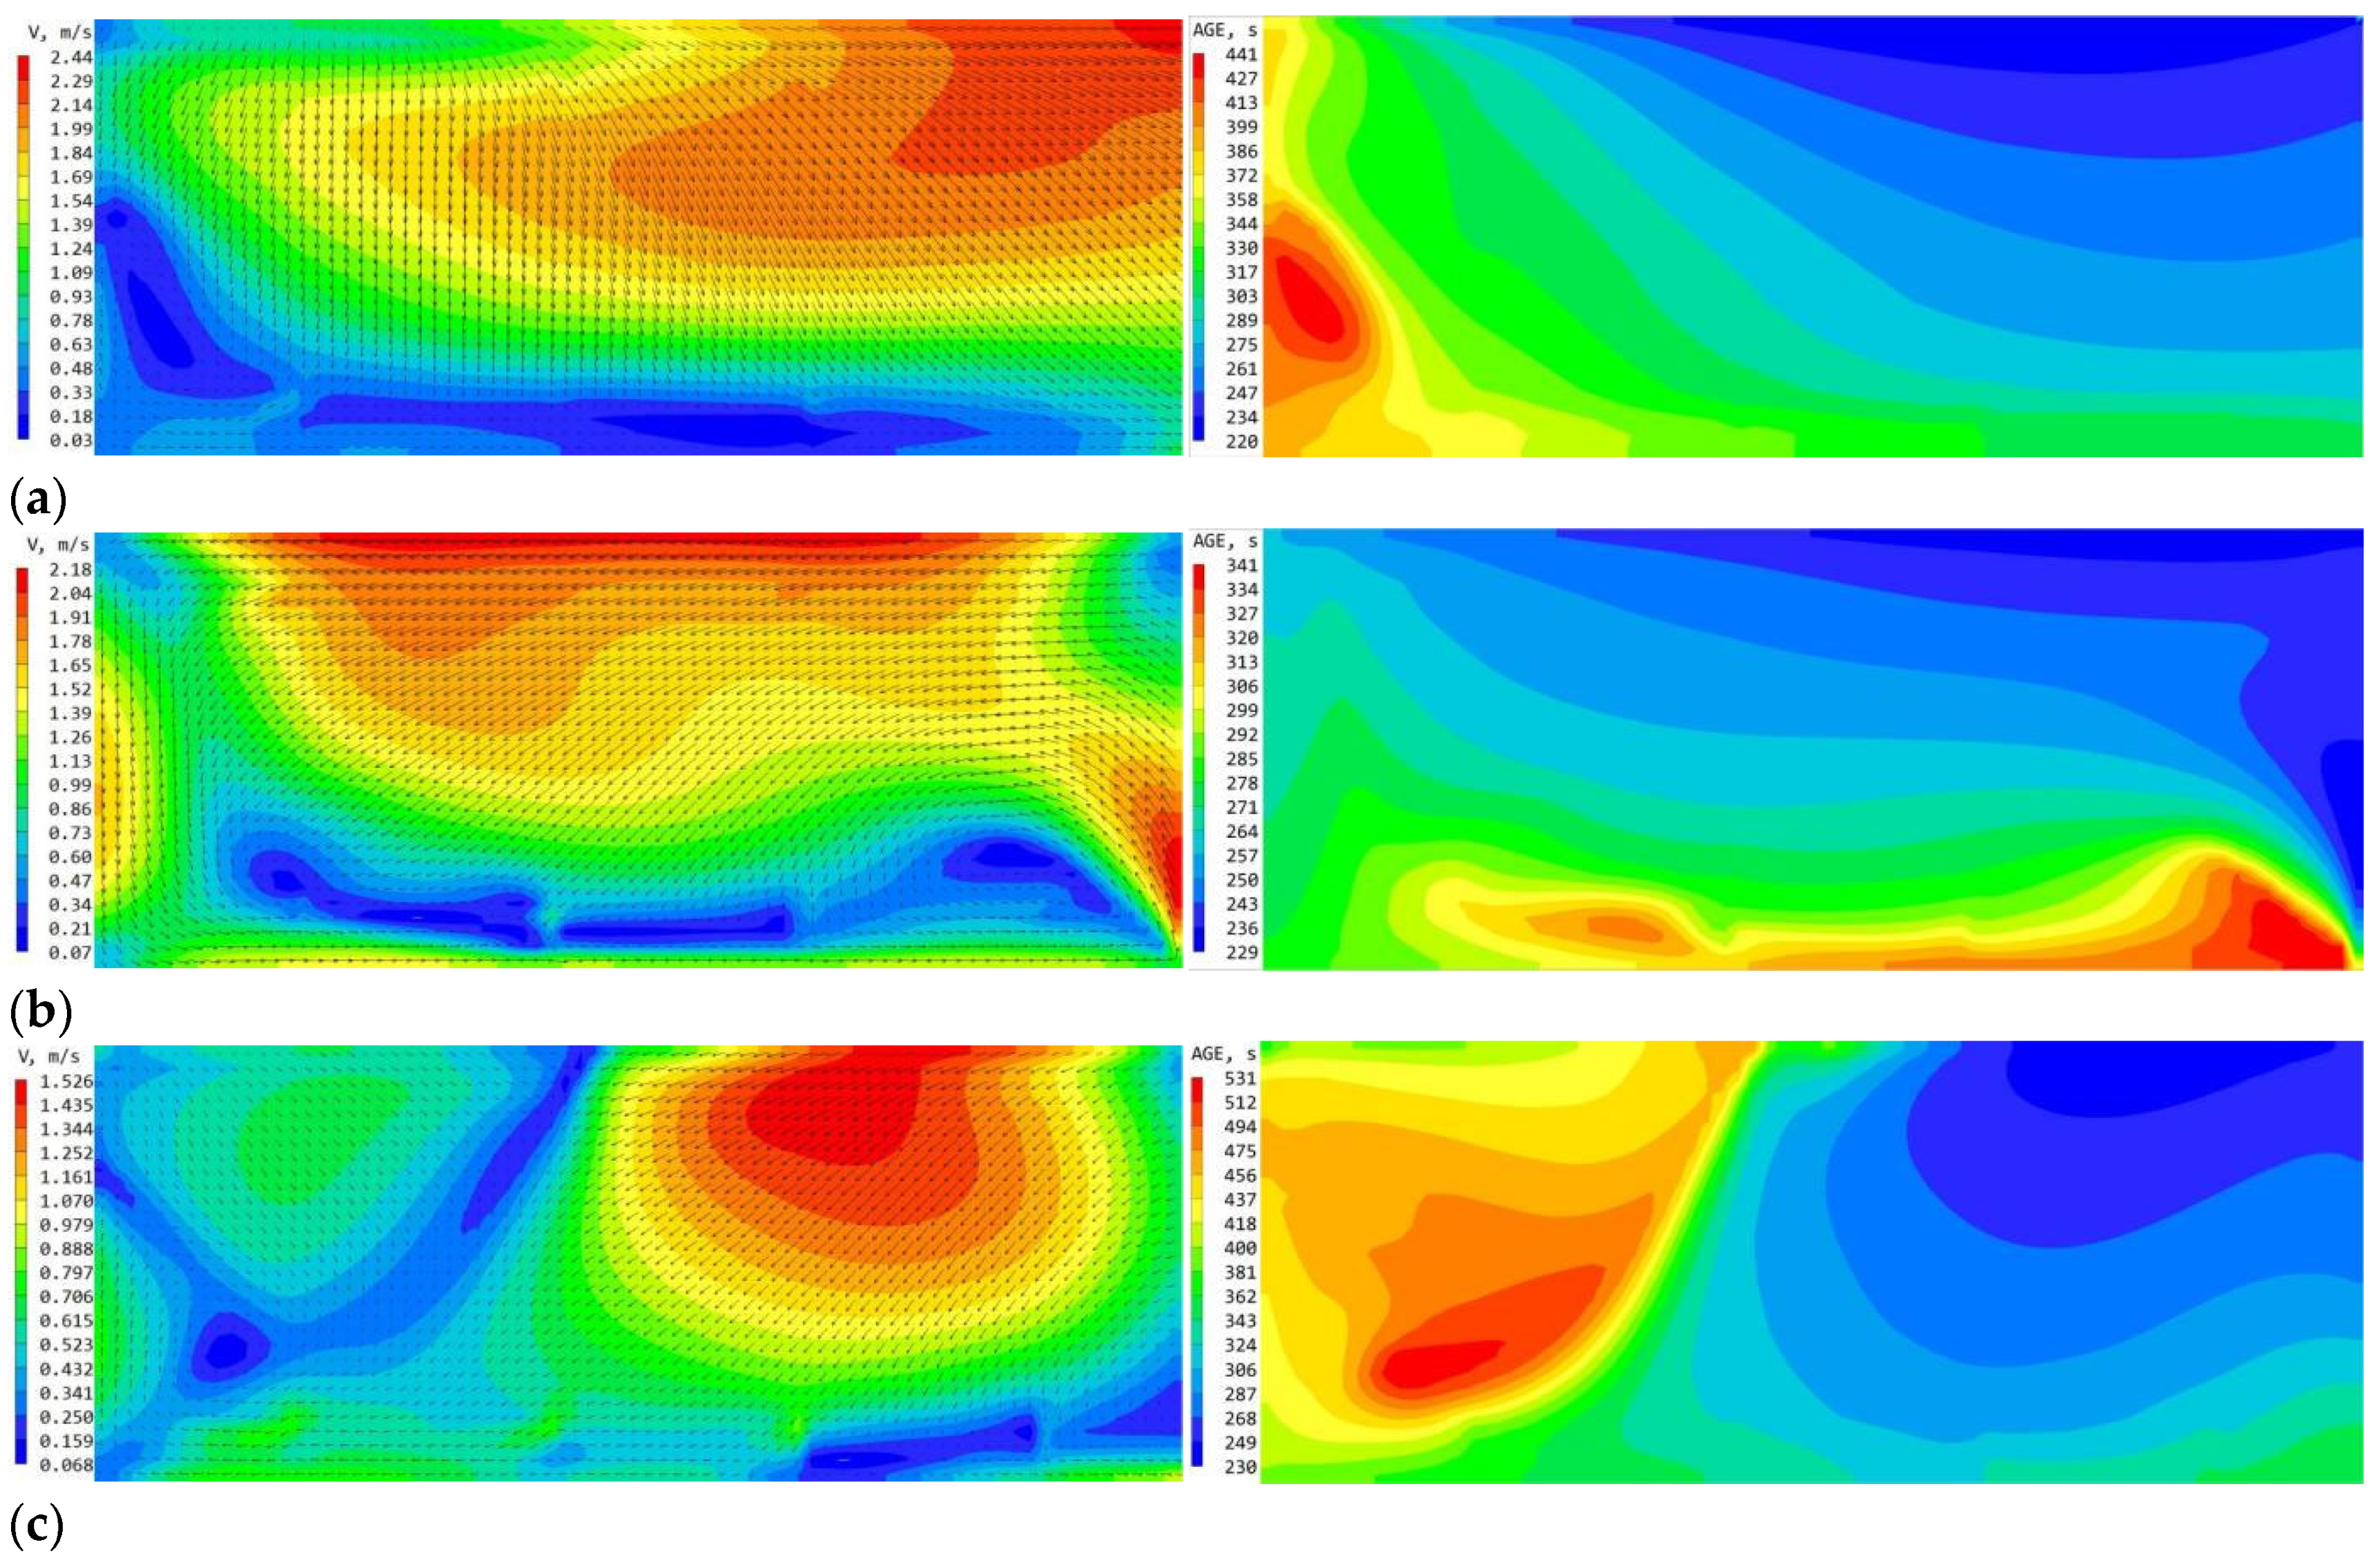
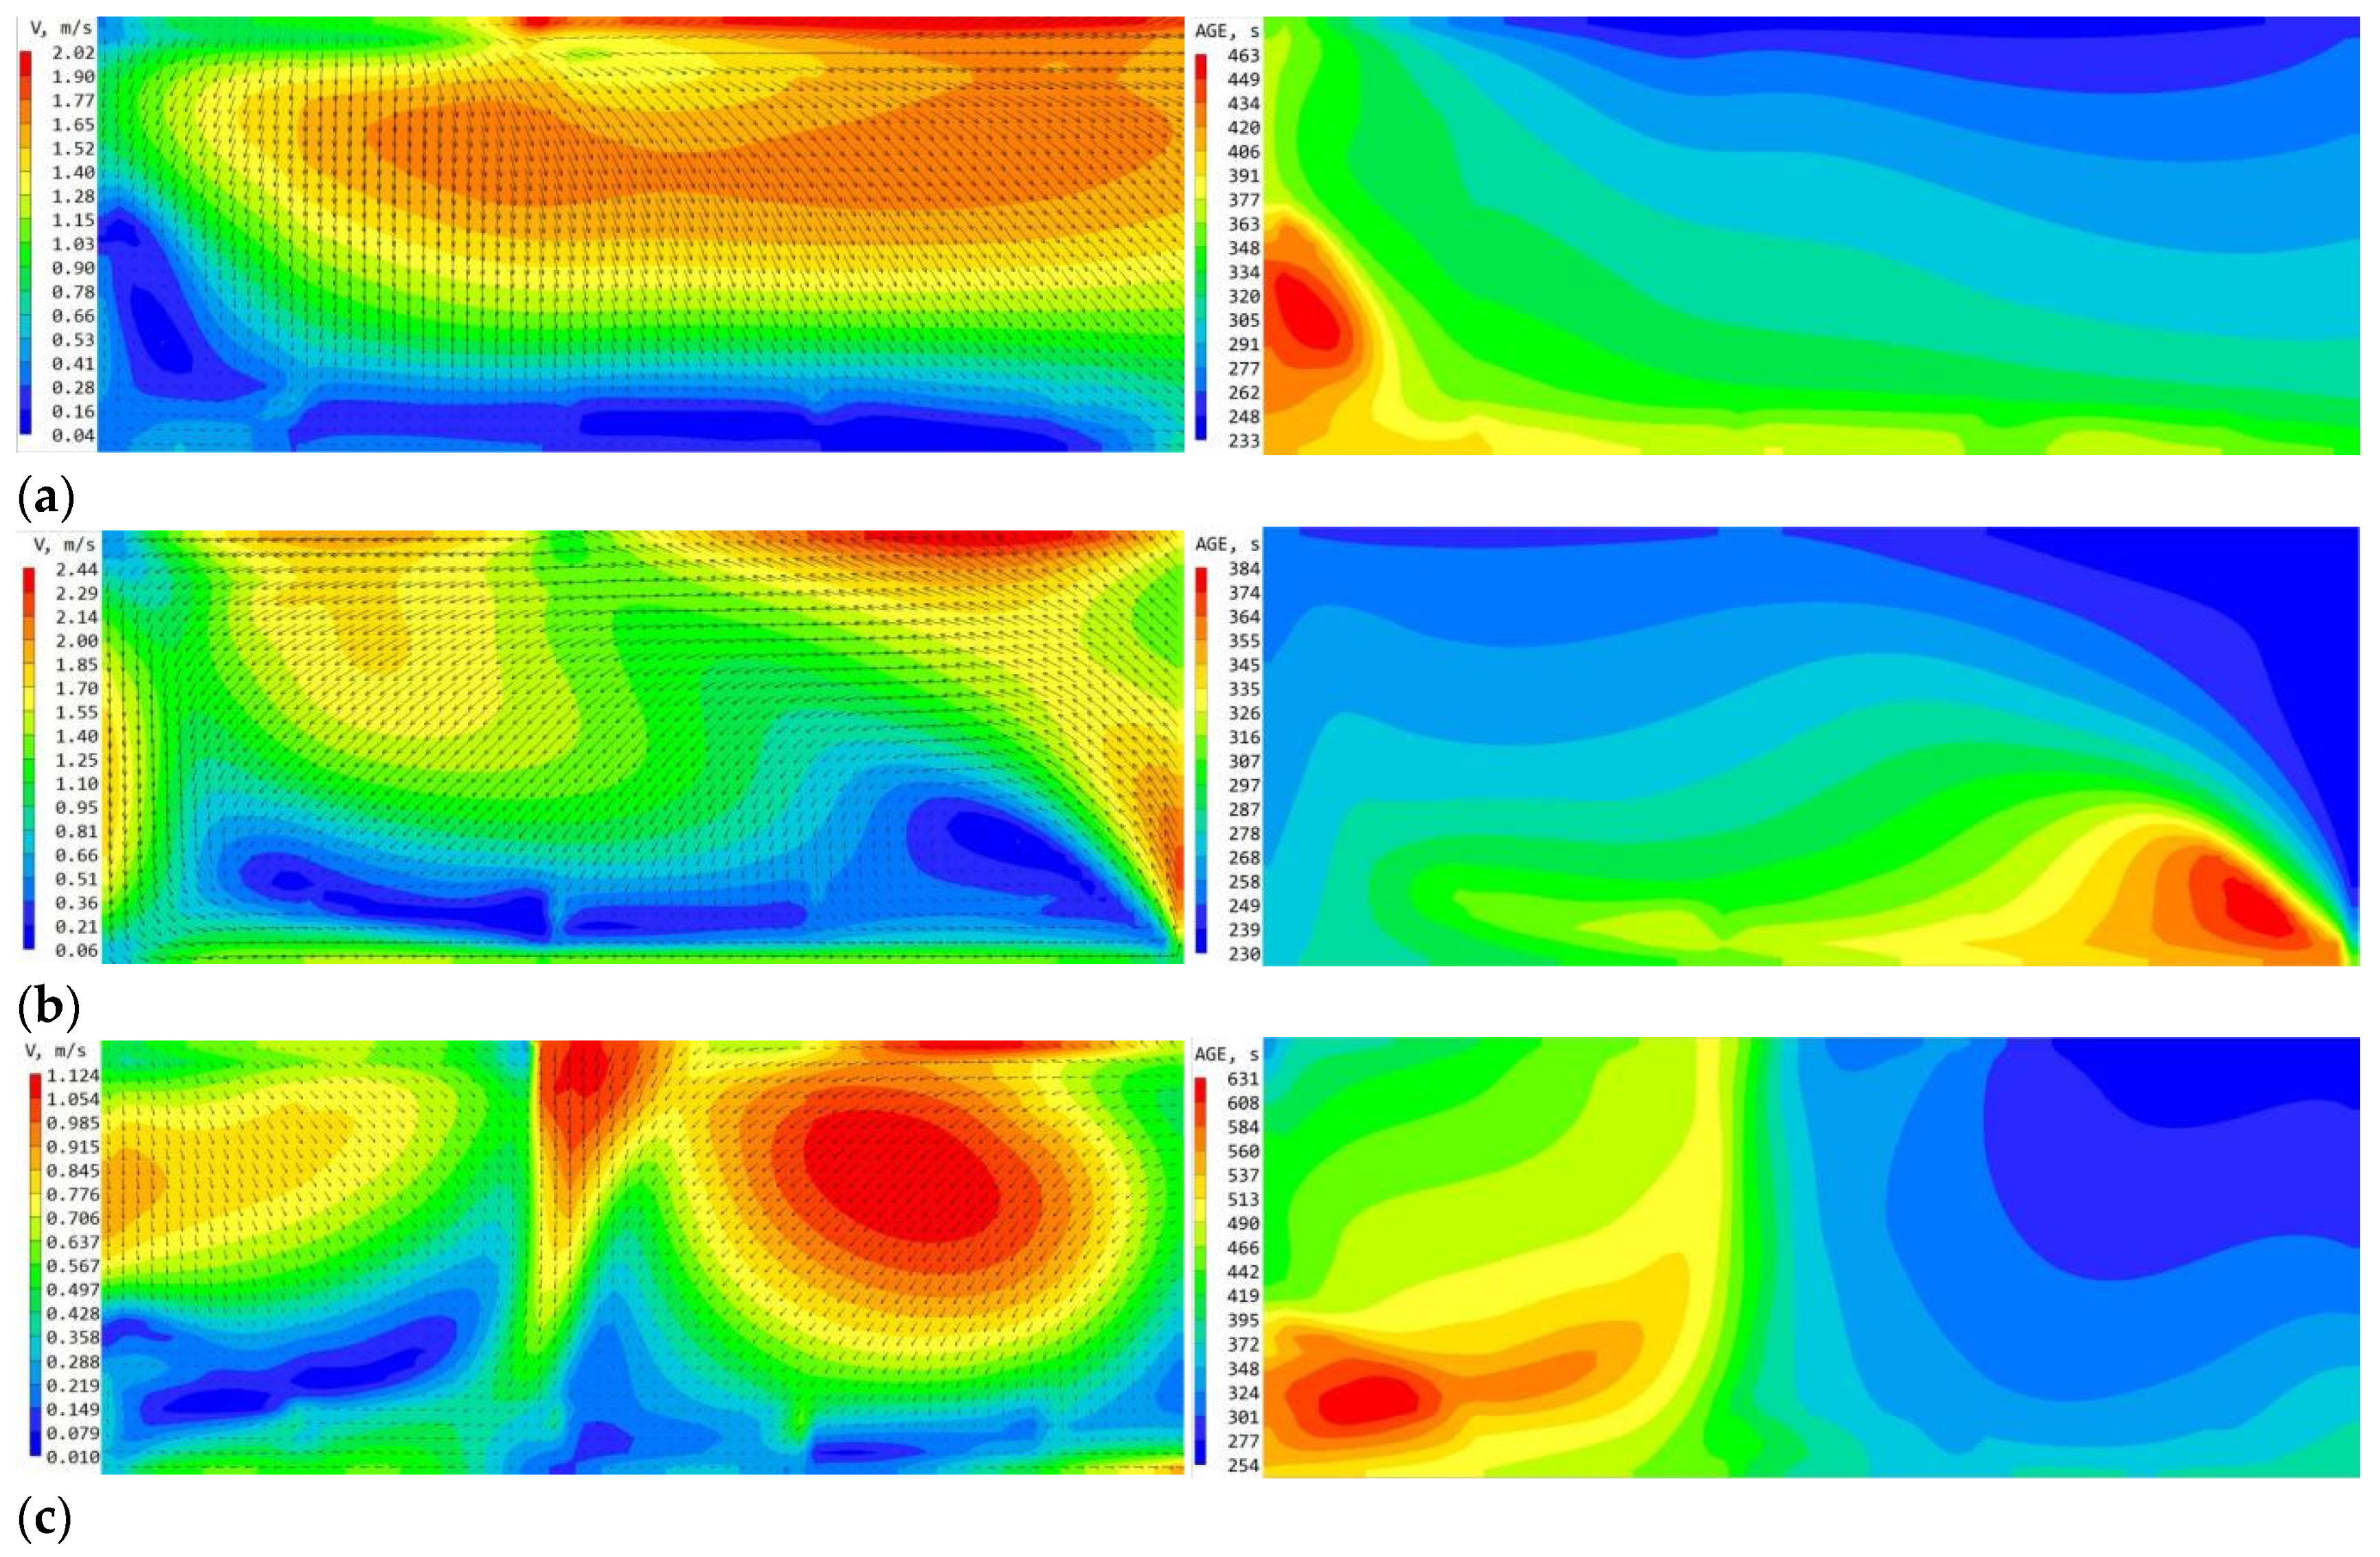
4.1. Wind Environment Analysis of the Courtyard for the Un-Elevated Scenario
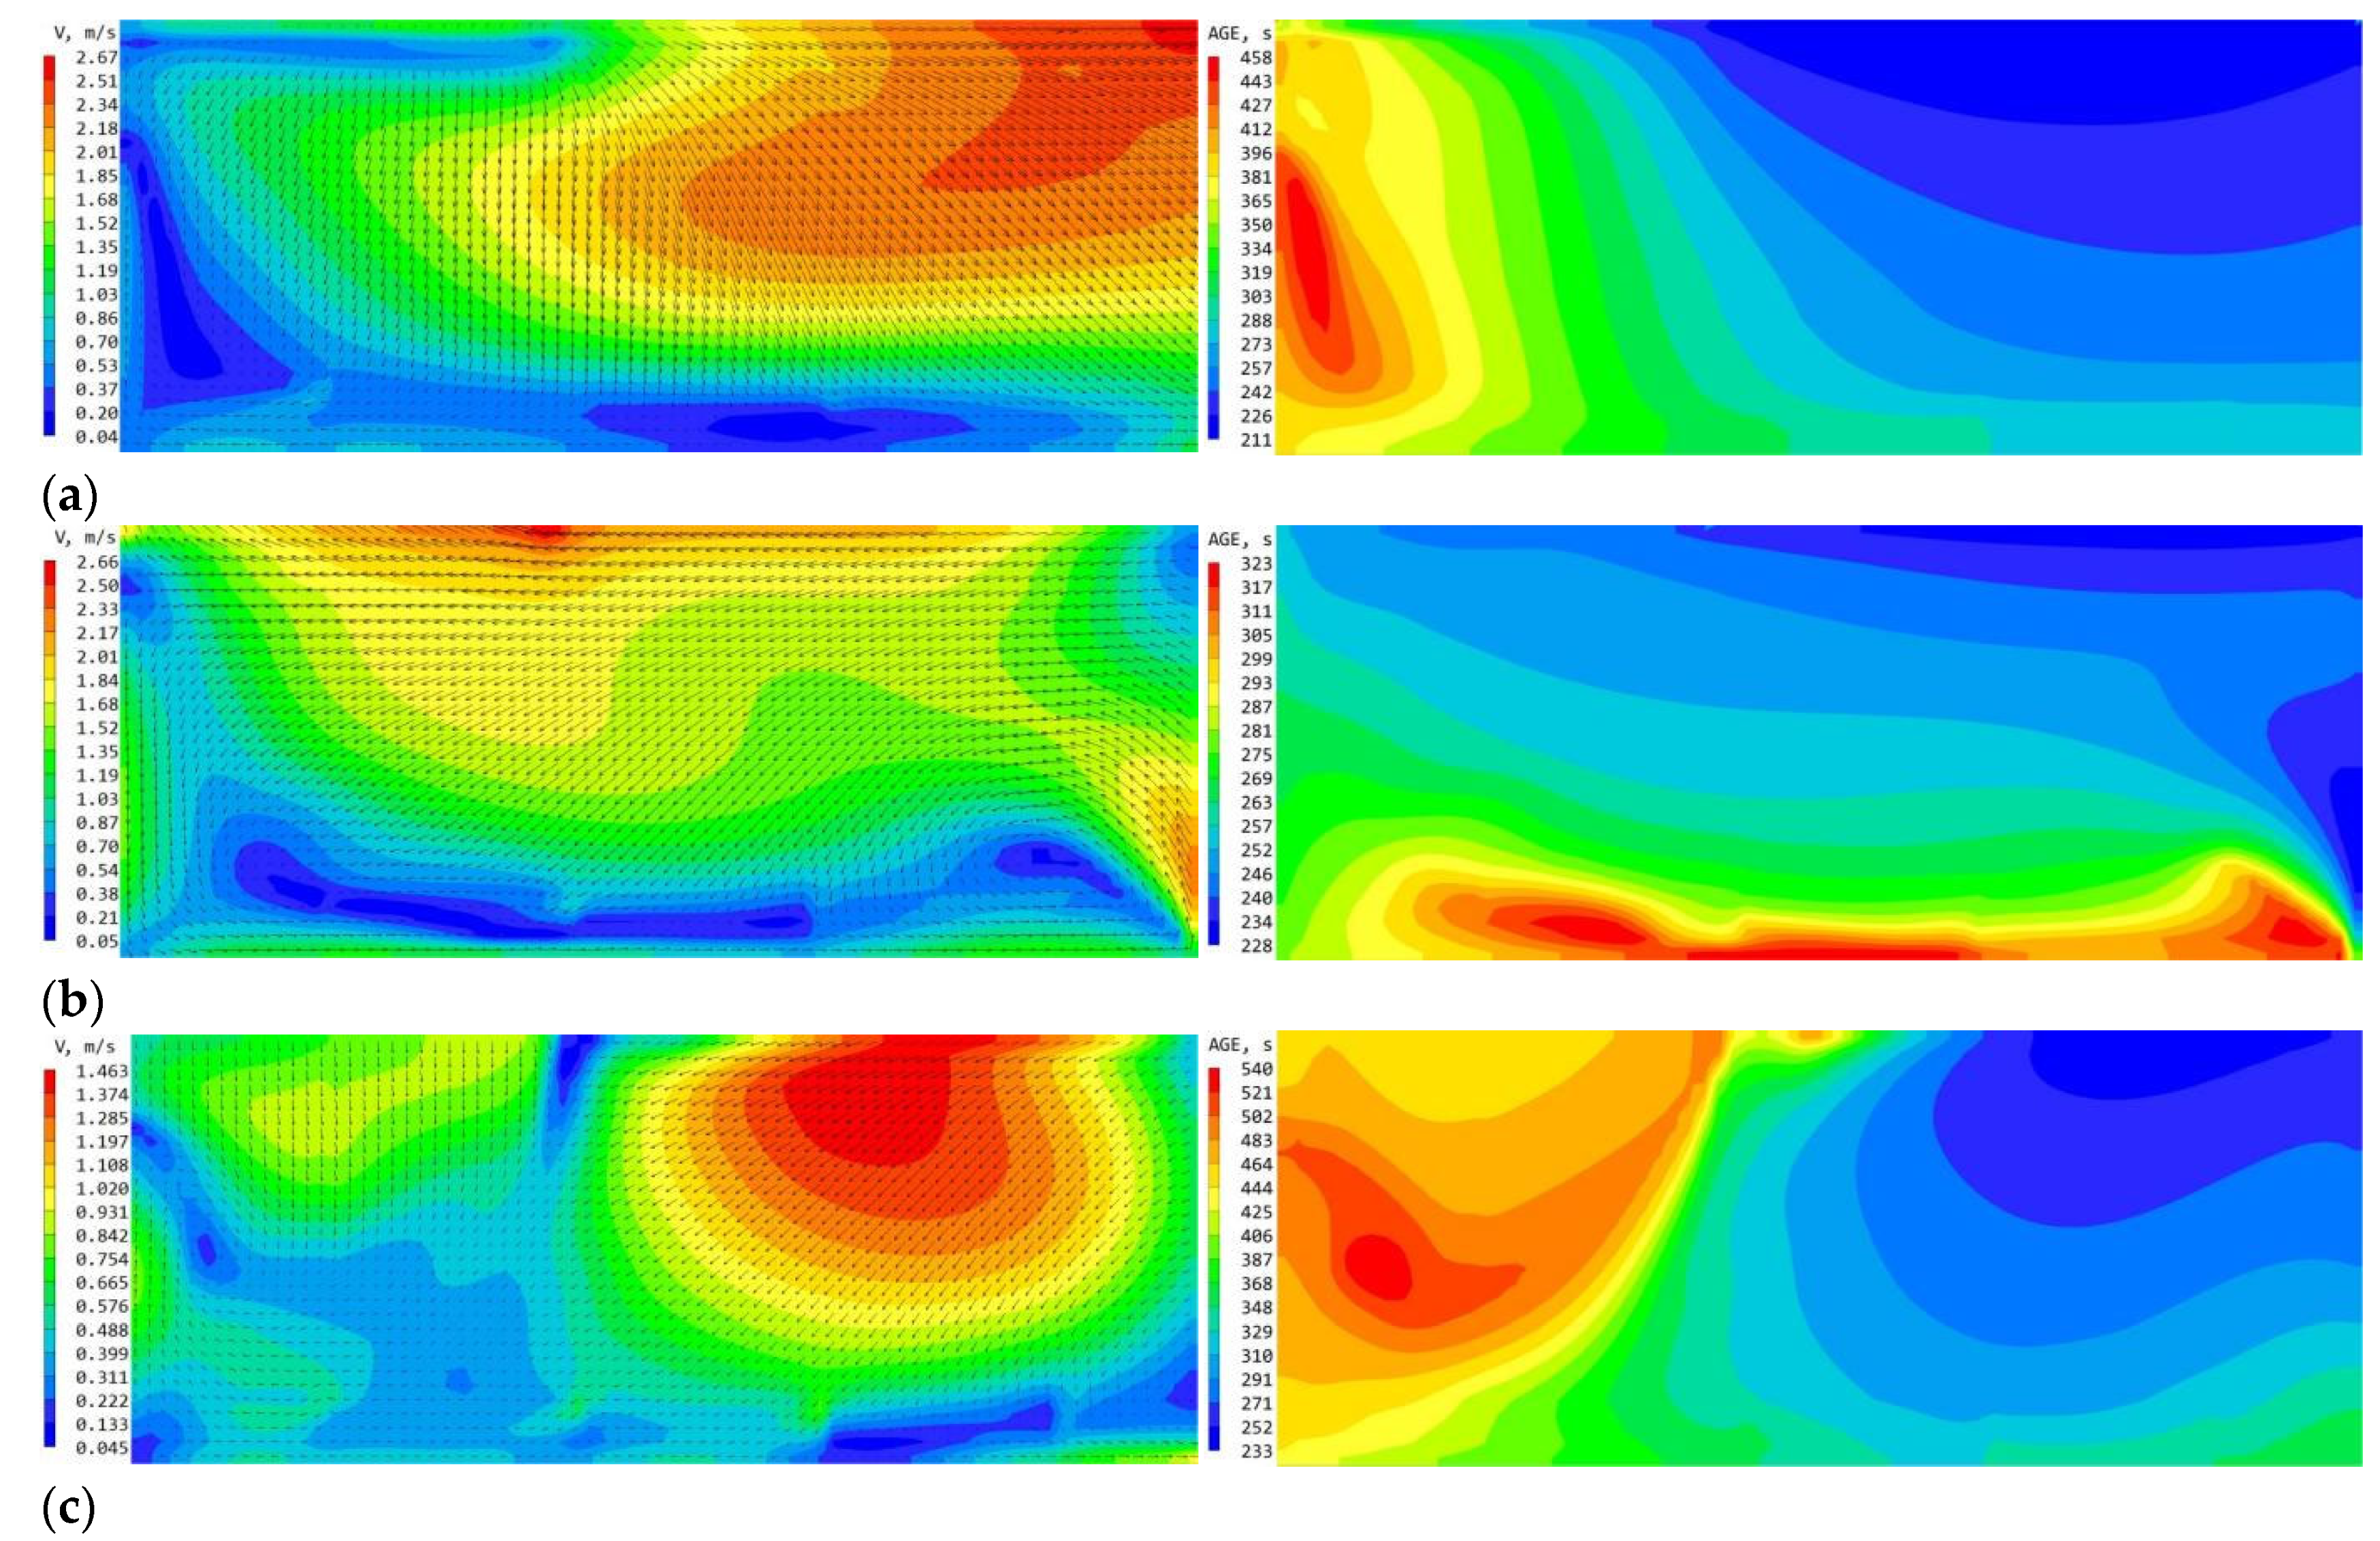
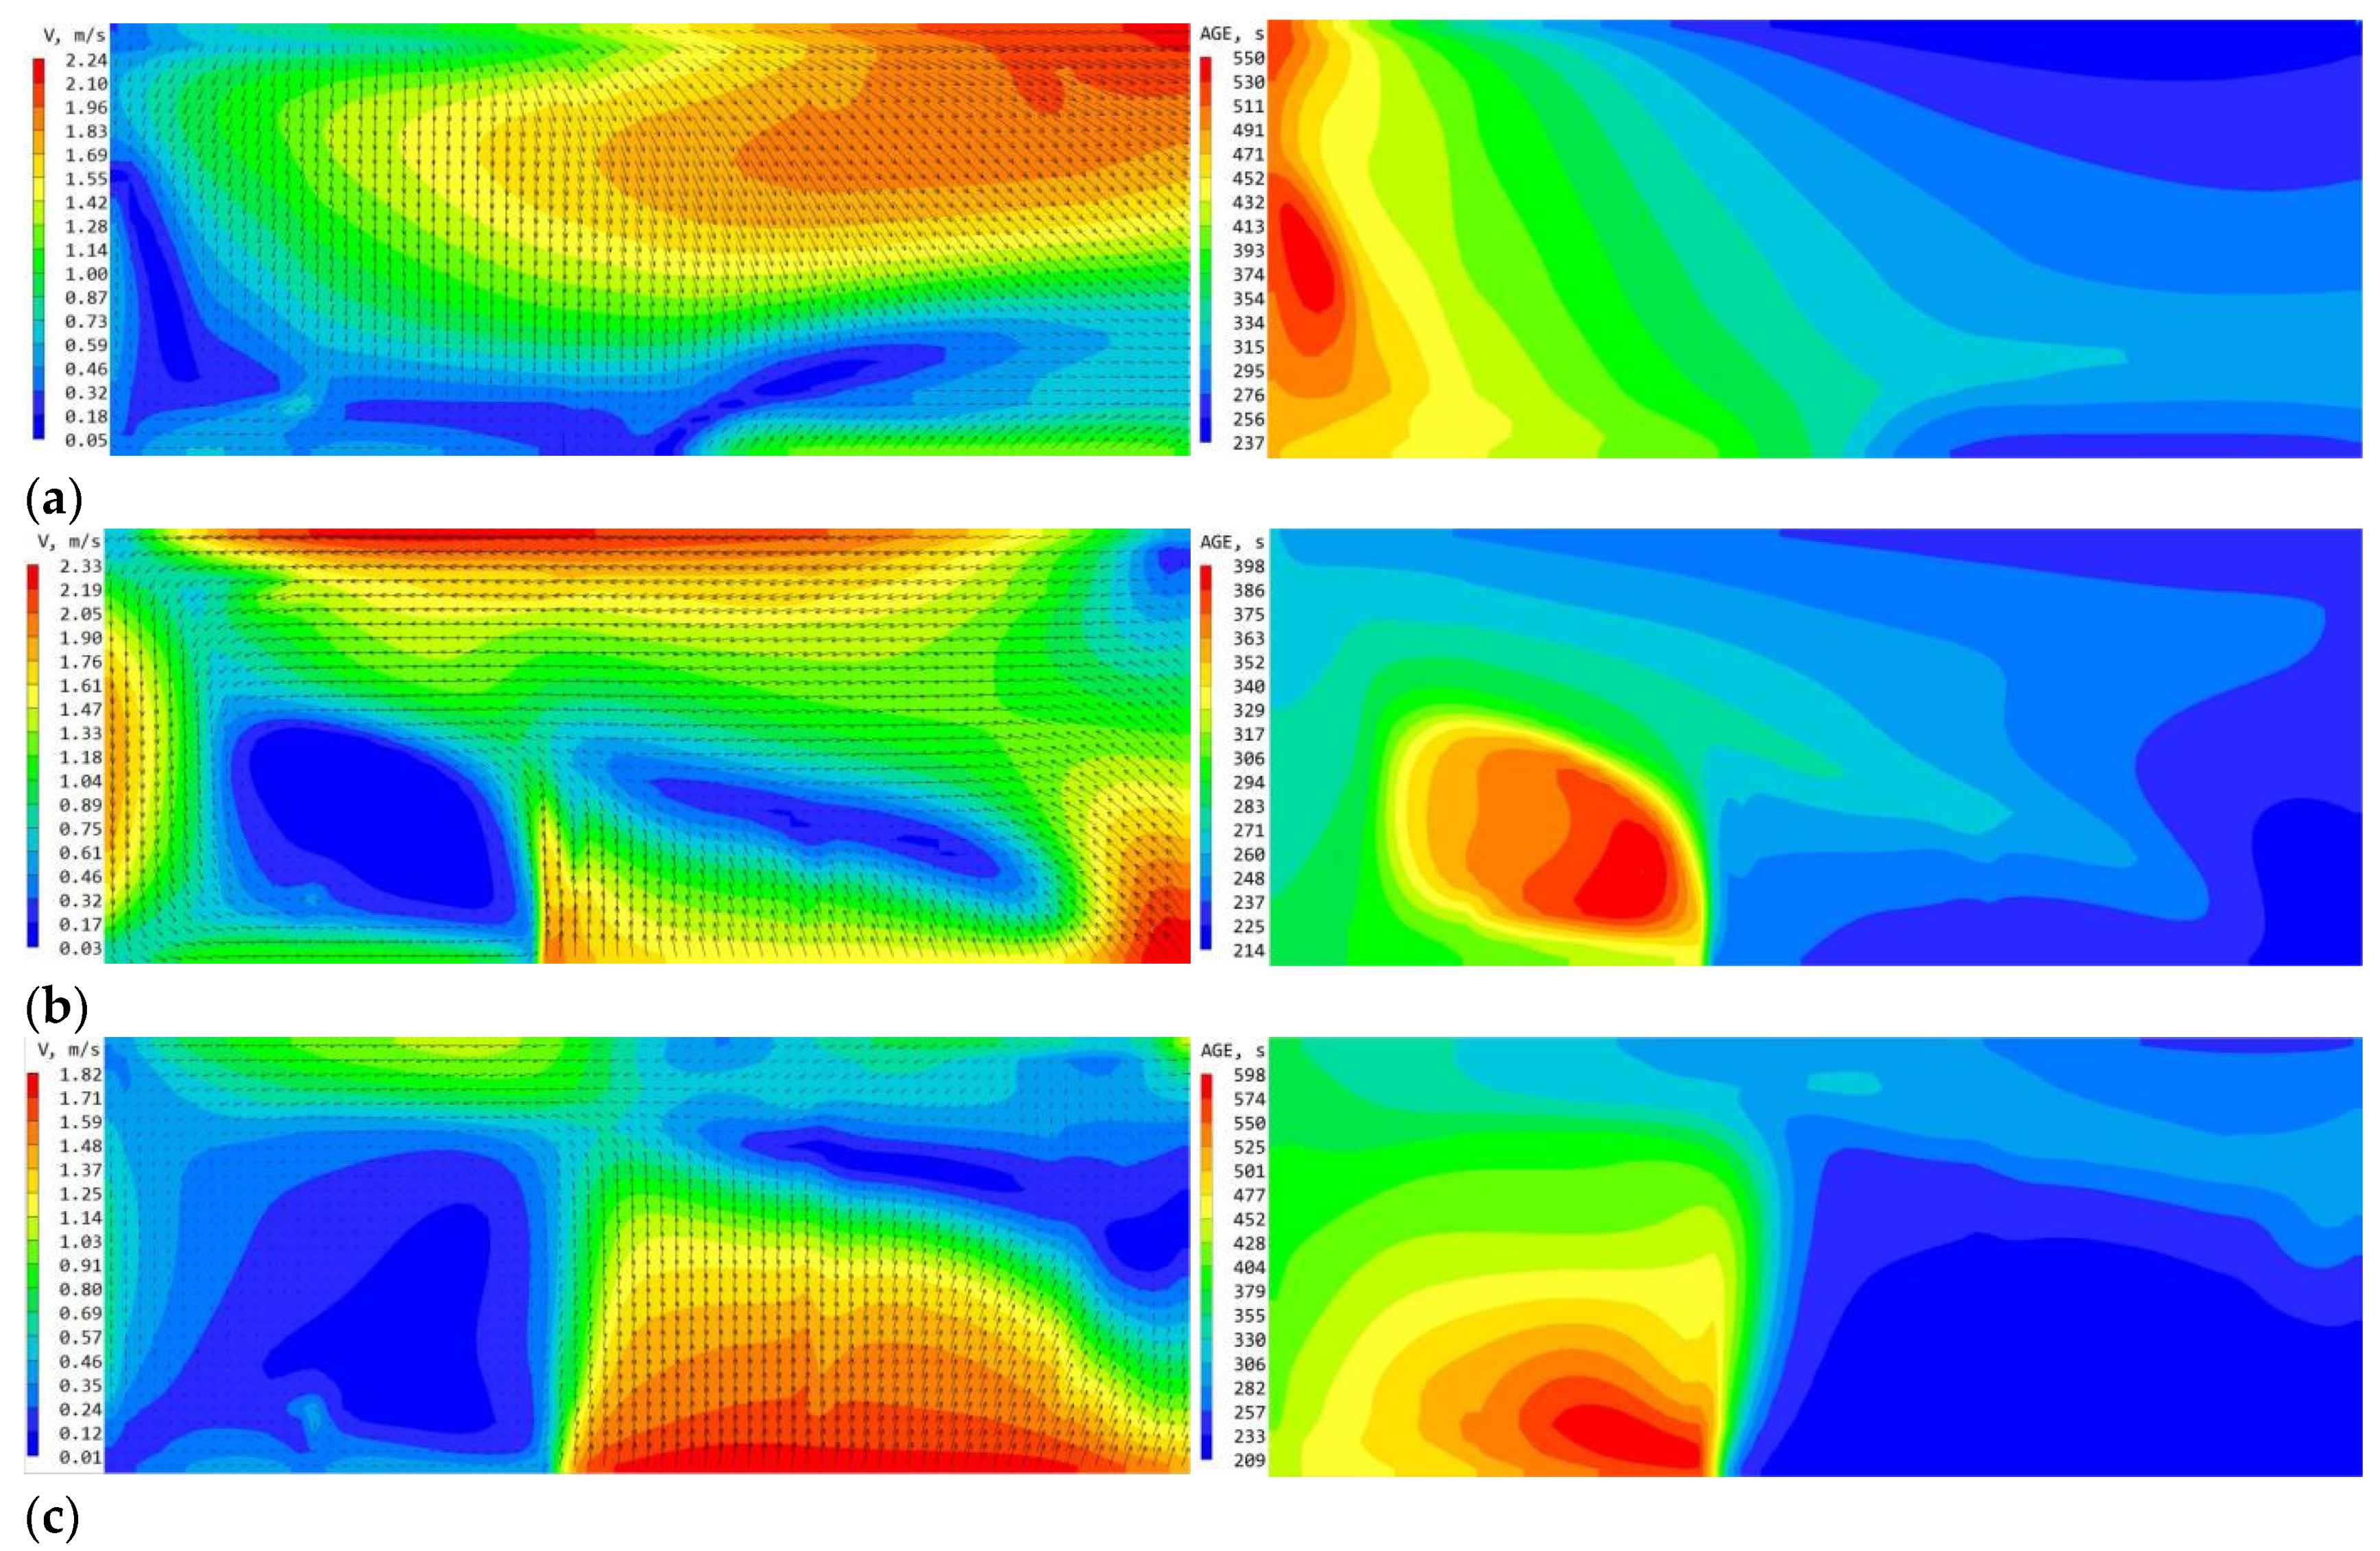
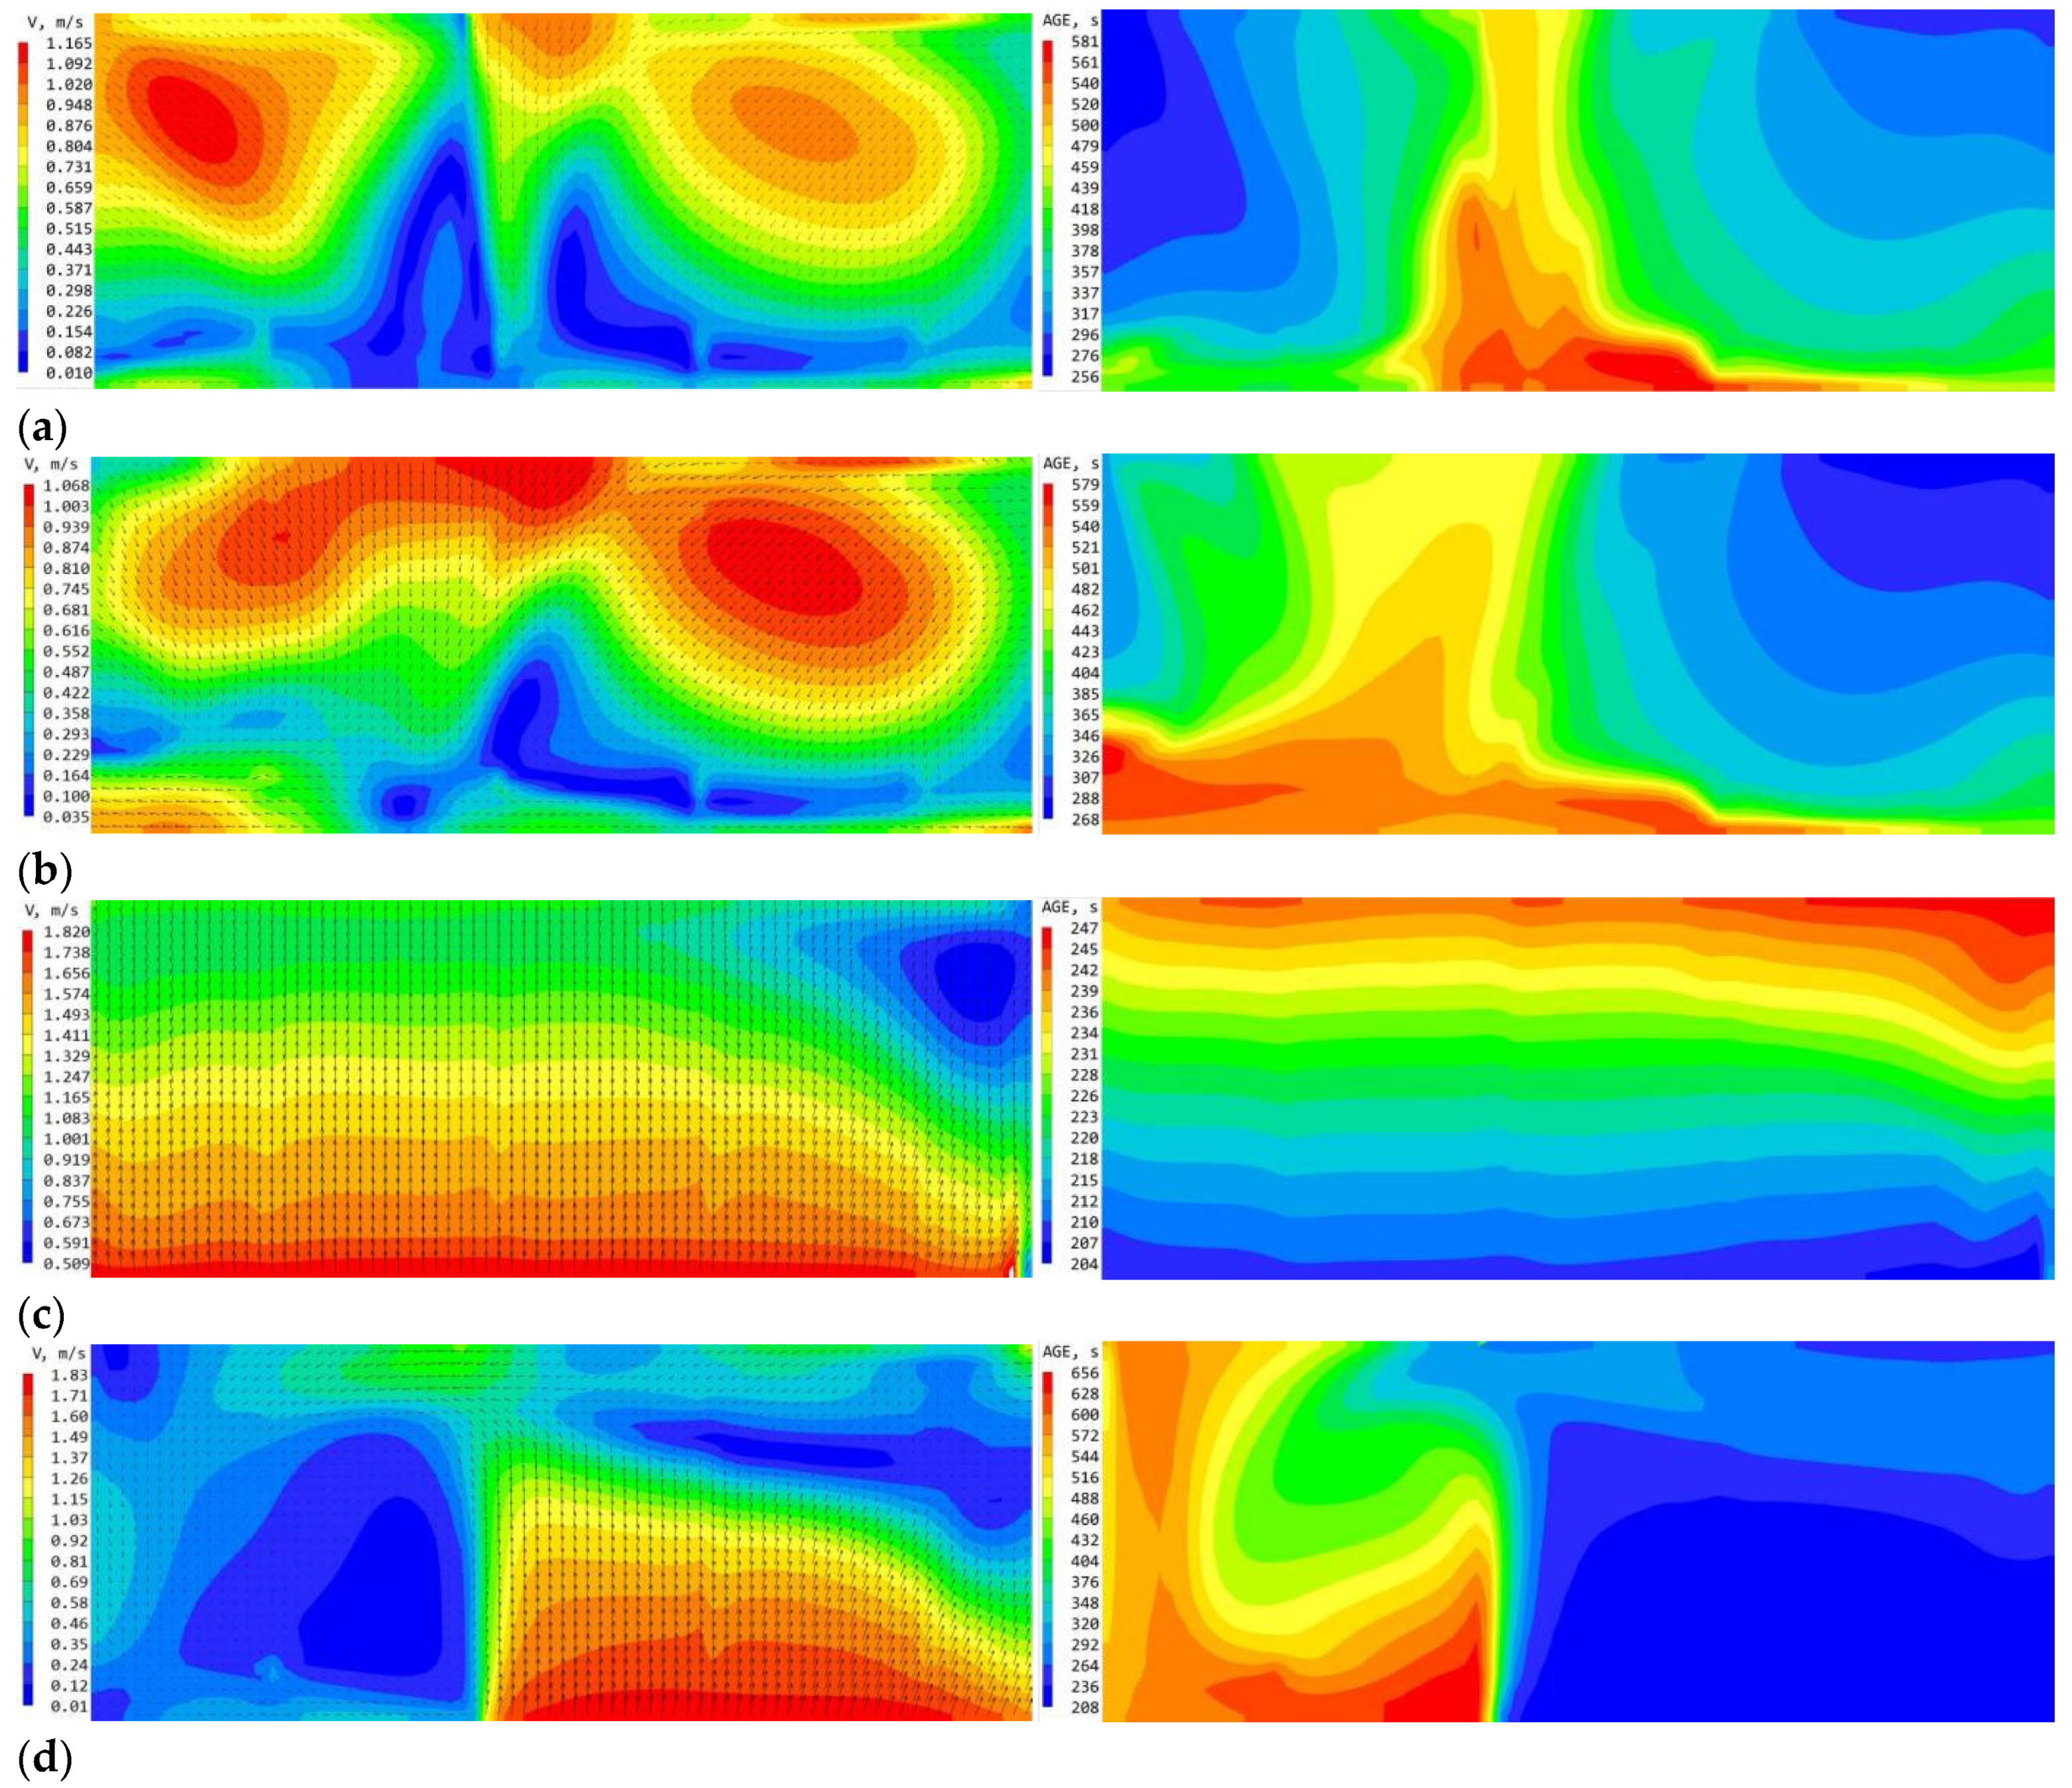
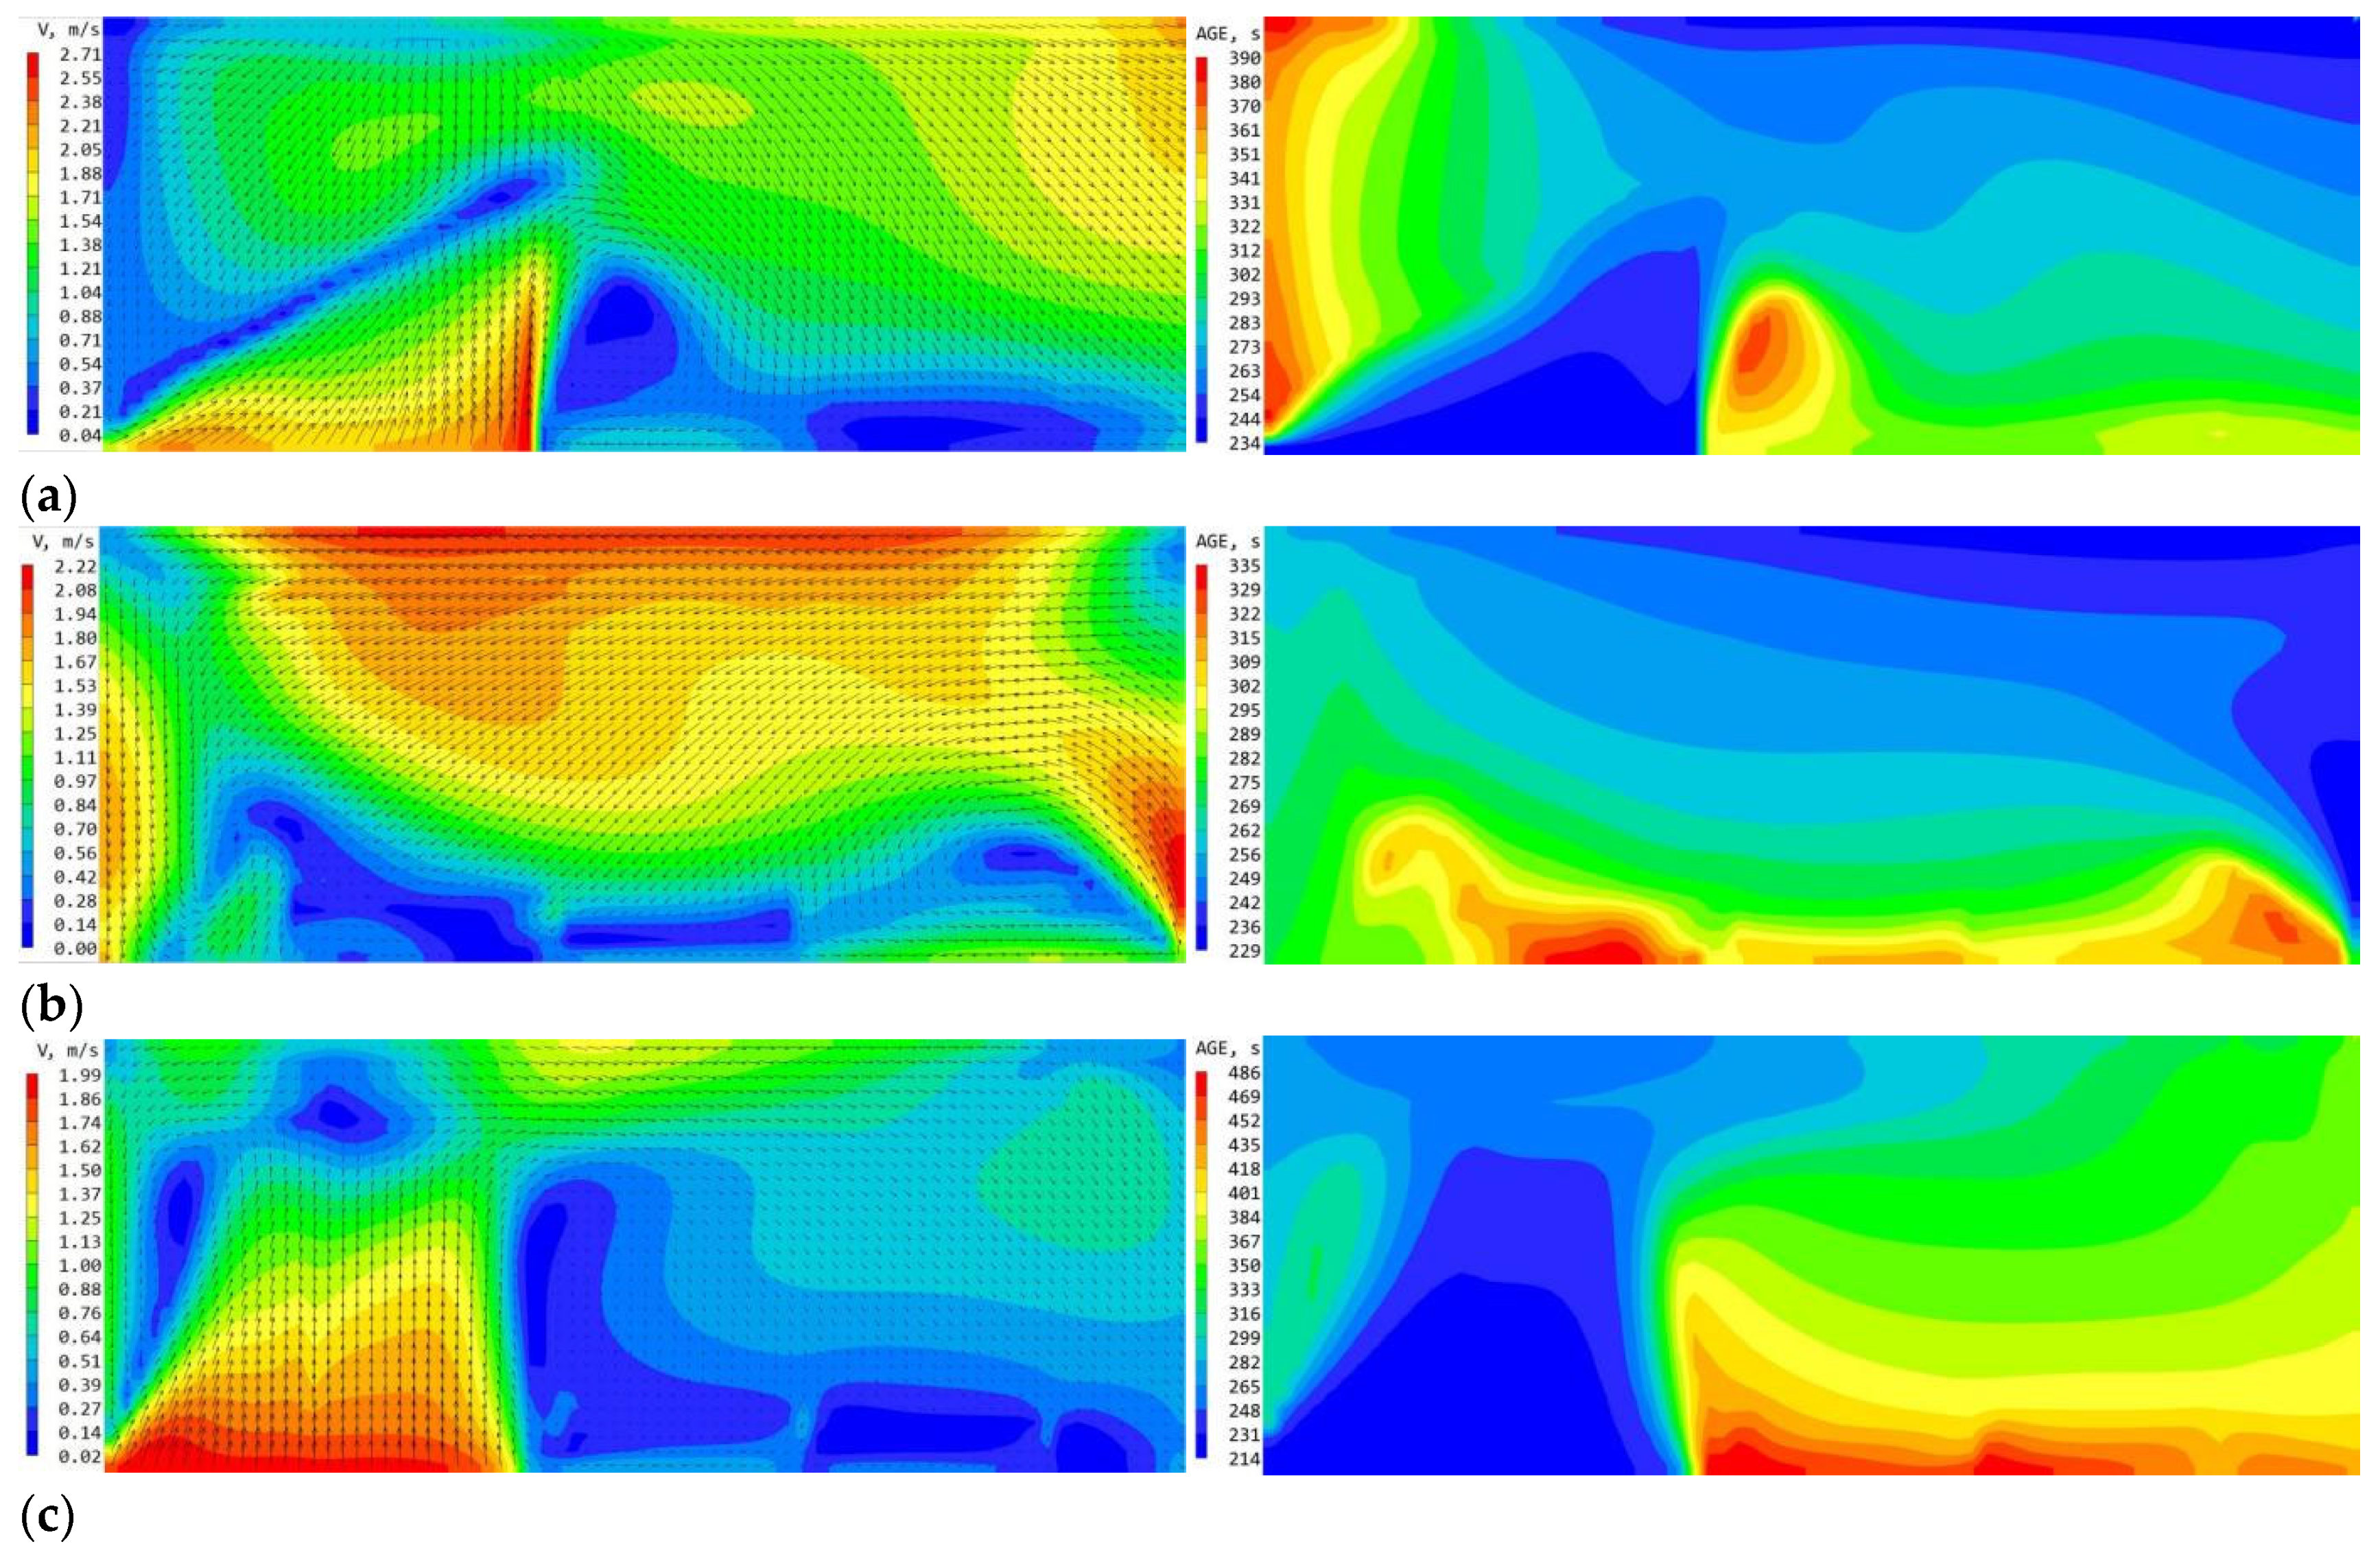
4.2. Impact of Different Locations of Elevation on Wind Environment Indicators of the Courtyard
4.2.1. Impact of the Position A Elevation on Wind Environment Indicators
4.2.2. Impact of the Position B Elevation on Wind Environment Indicators
4.2.3. Impact of the Position C Elevation on Wind Environment Indicators
4.2.4. Impact of the Position D elevation on Wind Environment Indicators
4.2.5. Impact of the Position E Elevation on Wind Environment Indicators
4.3. Overall Impact of Elevation on wind Environment Indicators
4.3.1. Impact of Elevation on the MV
4.3.2. Impact of Elevation on the MA
4.3.3. Impact of Elevation on the Aσ
4.4. Correlation between the Wind Environmental Factors
4.5. Limitations
5. Conclusions
Author Contributions
Funding
Data Availability Statement
Conflicts of Interest
References
- Li, J.; Niu, J.; Mak, C.M.; Huang, T.; Xie, Y. Assessment of outdoor thermal comfort in Hong Kong based on the individual desirability and acceptability of sun and wind conditions. Build. Environ. 2018, 145, 50–61. [Google Scholar] [CrossRef]
- Ng, E. Policies and technical guidelines for urban planning of high-density cities—Air ventilation assessment (AVA) of Hong Kong. Build. Environ. 2009, 44, 1478–1488. [Google Scholar] [CrossRef]
- Hang, J.; Li, Y.; Buccolieri, R.; Sandberg, M.; DI Sabatino, S. On the contribution of mean flow and turbulence to city breathability: The case of long streets with tall buildings. Sci. Total Environ. 2012, 416, 362–373. [Google Scholar] [CrossRef] [PubMed]
- Ng, E.; Cheng, V. Urban human thermal comfort in hot and humid Hong Kong. Energy Build. 2012, 55, 51–65. [Google Scholar] [CrossRef]
- Hang, J.; Luo, Z.; Wang, X.; He, L.; Wang, B.; Zhu, W. The influence of street layouts and viaduct settings on daily carbon monoxide exposure and intake fraction in idealized urban canyons. Environ. Pollut. 2017, 220, 72–86. [Google Scholar] [CrossRef]
- Du, Y.; Mak, C.M.; Liu, J.; Xia, Q.; Niu, J.; Kwok, K. Effects of lift-up design on pedestrian level wind comfort in different building configurations under three wind directions. Build. Environ. 2017, 117, 84–99. [Google Scholar] [CrossRef]
- Tse, K.; Zhang, X.; Weerasuriya, A.; Li, S.; Kwok, K.; Mak, C.M.; Niu, J. Adopting ‘lift-up’ building design to improve the surrounding pedestrian-level wind environment. Build. Environ. 2017, 117, 154–165. [Google Scholar] [CrossRef]
- Xia, Q.; Liu, X.; Niu, J.; Kwok, K.C.S. Effects of building lift-up design on the wind environment for pedestrians. Indoor Built Environ. 2017, 26, 1214–1231. [Google Scholar] [CrossRef]
- Chew, L.W.; Norford, L.K. Pedestrian-level wind speed enhancement with void decks in three-dimensional urban street canyons. Build. Environ. 2019, 155, 399–407. [Google Scholar] [CrossRef]
- Liu, J.; Zhang, X.; Niu, J.; Tse, K.T. Pedestrian-level wind and gust around buildings with a ‘lift-up’ design: Assessment of influence from surrounding buildings by adopting LES. Build. Simul. 2019, 12, 1107–1118. [Google Scholar] [CrossRef]
- Fan, M.; Chau, C.K.; Chan, E.H.W.; Jia, J. A decision support tool for evaluating the air quality and wind comfort induced by different opening configurations for buildings in canyons. Sci. Total Environ. 2017, 574, 569–582. [Google Scholar] [CrossRef] [PubMed]
- Du, Y.; Mak, C.M.; Tang, B.-S. Effects of building height and porosity on pedestrian level wind comfort in a high-density urban built environment. Build. Simul. 2018, 11, 1215–1228. [Google Scholar] [CrossRef]
- Du, Y.; Mak, C.M. Improving pedestrian level low wind velocity environment in high-density cities: A general framework and case study. Sustain. Cities Soc. 2018, 42, 314–324. [Google Scholar] [CrossRef] [PubMed]
- Muhsin, F.; Yusoff, W.F.M.; Mohamed, M.F.; Sapian, A.R. CFD modeling of natural ventilation in a void connected to the living units of multi-storey housing for thermal comfort. Energy Build. 2017, 144, 1–16. [Google Scholar] [CrossRef]
- Du, Y.; Mak, C.M.; Huang, T.; Niu, J. Towards an integrated method to assess effects of lift-up design on outdoor thermal comfort in Hong Kong. Build. Environ. 2017, 125, 261–272. [Google Scholar] [CrossRef]
- Sha, C.; Wang, X.; Lin, Y.; Fan, Y.; Chen, X.; Hang, J. The impact of urban open space and ‘lift-up’ building design on building intake fraction and daily pollutant exposure in idealized urban models. Sci. Total Environ. 2018, 633, 1314–1328. [Google Scholar] [CrossRef] [PubMed]
- Zhang, X.; Tse, K.T.; Weerasuriya, A.U.; Li, S.W.; Kwok, K.C.S.; Mak, C.M.; Niu, J.; Lin, Z. Evaluation of pedestrian wind comfort near ‘lift-up’ buildings with different aspect ratios and central core modifications. Build. Environ. 2017, 124, 245–257. [Google Scholar] [CrossRef] [PubMed]
- Du, Y.; Mak, C.M.; Li, Y. A multi-stage optimization of pedestrian level wind environment and thermal comfort with lift-up design in ideal urban canyons. Sustain. Cities Soc. 2019, 46, 101424. [Google Scholar] [CrossRef]
- Zhang, X.; Tse, K.T.; Weerasuriya, A.U.; Kwok, K.C.S.; Niu, J.; Lin, Z.; Mak, C.M. Pedestrian-level wind conditions in the space underneath lift-up buildings. J. Wind Eng. Ind. Aerodyn. 2018, 179, 58–69. [Google Scholar] [CrossRef]
- Chen, L.; Mak, C.M. Numerical evaluation of pedestrian-level wind comfort around “lift-up” buildings with various unconventional configurations. Build. Environ. 2021, 188, 107429. [Google Scholar] [CrossRef]
- Gao, H.; Liu, J.; Lin, P.; Li, C.; Xiao, Y.; Hu, G. Pedestrian level wind flow field of elevated tall buildings with dense tandem arrangement. Build. Environ. 2022, 226, 109745. [Google Scholar] [CrossRef]
- Chen, L.; Mak, C.M. Integrated impacts of building height and upstream building on pedestrian comfort around ideal lift-up buildings in a weak wind environment. Build. Environ. 2021, 200, 107963. [Google Scholar] [CrossRef]
- Huang, Y.-D.; Ren, S.-Q.; Xu, N.; Luo, Y.; Sin, C.H.; Cui, P.-Y. Impacts of specific street geometry on airflow and traffic pollutant dispersion inside a street canyon. Air Qual. Atmos. Health 2023, 15, 1133–1152. [Google Scholar] [CrossRef]
- Sin, C.H.; Luo, Y.; Jon, K.S.; Cui, P.-Y.; Huang, Y.-D. Effects of void deck on the airflow and pollutant dispersion in 3D street canyons. Environ. Sci. Pollut. Res. 2022, 29, 89358–89386. [Google Scholar] [CrossRef]
- Chew, L.W.; Norford, L.K. Pedestrian-level wind speed enhancement in urban street canyons with void decks. Build. Environ. 2018, 146, 64–76. [Google Scholar] [CrossRef]
- Sin, C.H.; Cui, P.-Y.; Jon, K.S.; Luo, Y.; Shen, J.-W.; Huang, Y.-D. Evaluation on ventilation and traffic pollutant dispersion in asymmetric street canyons with void decks. Air Qual. Atmos. Health 2023, 16, 817–839. [Google Scholar] [CrossRef]
- Jiang, Z.; Gao, W. Impact of Enclosure Boundary Patterns and Lift-Up Design on Optimization of Summer Pedestrian Wind Environment in High-Density Residential Districts. Energies 2021, 14, 3199. [Google Scholar] [CrossRef]
- Weng, J.; Luo, B.; Xiang, H.; Gao, B. Effects of Bottom-Overhead Design Variables on Pedestrian-Level Thermal Comfort during Summertime in Different High-Rise Residential Buildings: A Case Study in Chongqing, China. Buildings 2022, 12, 265. [Google Scholar] [CrossRef]
- Zhang, X.; Gao, Y.; Tao, Q.; Min, Y.; Fan, J. Improving the pedestrian-level wind comfort by lift-up factors of panel residence complex: Field-measurement and CFD simulation. Build. Environ. 2023, 229, 109947. [Google Scholar] [CrossRef]
- Aldawoud, A. Thermal performance of courtyard buildings. Energy Build. 2008, 40, 906–910. [Google Scholar] [CrossRef]
- Gao, Y.; Yao, R.; Li, B.; Turkbeyler, E.; Luo, Q.; Short, A. Field studies on the effect of built forms on urban wind environments. Renew. Energy 2012, 46, 148–154. [Google Scholar] [CrossRef]
- Moonen, P.; Dorer, V.; Carmeliet, J. Evaluation of the ventilation potential of courtyards and urban street canyons using RANS and LES. J. Wind Eng. Ind. Aerodyn. 2011, 99, 414–423. [Google Scholar] [CrossRef]
- Yang, L.; Liu, X.; Qian, F.; Niu, S. Research on the wind environment and air quality of parallel courtyards in a university campus. Sustain. Cities Soc. 2020, 56, 102019. [Google Scholar] [CrossRef]
- Al-Hemiddi, N.A.; Megren Al-Saud, K.A. The effect of a ventilated interior courtyard on the thermal performance of a house in a hot–arid region. Renew. Energy 2001, 24, 581–595. [Google Scholar] [CrossRef]
- Rojas, J.M.; Galán-Marín, C.; Fernández-Nieto, E.D. Parametric Study of Thermodynamics in the Mediterranean Courtyard as a Tool for the Design of Eco-Efficient Buildings. Energies 2012, 5, 2381–2403. [Google Scholar] [CrossRef]
- Micallef, D.; Buhagiar, V.; Borg, S.P. Cross-ventilation of a room in a courtyard building. Energy Build. 2016, 133, 658–669. [Google Scholar] [CrossRef]
- Wen, Q.; Liu, H.; Chen, J.; Ye, H.; Pan, Z. Evaluation of Satisfaction with the Built Environment of University Buildings under the Epidemic and Its Impact on Student Anxiety. Int. J. Environ. Res. Public Health 2023, 20, 4183. [Google Scholar] [CrossRef] [PubMed]
- Etheridge, D. A perspective on fifty years of natural ventilation research. Build. Environ. 2015, 91, 51–60. [Google Scholar] [CrossRef]
- Buccolieri, R.; Sandberg, M.; Di Sabatino, S. City breathability and its link to pollutant concentration distribution within urban-like geometries. Atmos. Environ. 2010, 44, 1894–1903. [Google Scholar] [CrossRef]
- Buccolieri, R.; Salizzoni, P.; Soulhac, L.; Garbero, V.; DI Sabatino, S. The breathability of compact cities. Urban Clim. 2015, 13, 73–93. [Google Scholar] [CrossRef]
- Hang, J.; Wang, Q.; Chen, X.; Sandberg, M.; Zhu, W.; Buccolieri, R.; Di Sabatino, S. City breathability in medium density urban-like geometries evaluated through the pollutant transport rate and the net escape velocity. Build. Environ. 2015, 94, 166–182. [Google Scholar] [CrossRef]
- Blocken, B.; Stathopoulos, T.; van Beeck, J. Pedestrian-level wind conditions around buildings: Review of wind-tunnel and CFD techniques and their accuracy for wind comfort assessment. Build. Environ. 2016, 100, 50–81. [Google Scholar] [CrossRef]
- Zheng, X.; Montazeri, H.; Blocken, B. CFD simulations of wind flow and mean surface pressure for buildings with balconies: Comparison of RANS and LES. Build. Environ. 2020, 173, 106747. [Google Scholar] [CrossRef]
- Lateb, M.; Masson, C.; Stathopoulos, T.; Bédard, C. Comparison of various types of k–ε models for pollutant emissions around a two-building configuration. J. Wind Eng. Ind. Aerodyn. 2013, 115, 9–21. [Google Scholar] [CrossRef]
- Ai, Z.; Mak, C. Determination of single-sided ventilation rates in multistory buildings: Evaluation of methods. Energy Build. 2014, 69, 292–300. [Google Scholar] [CrossRef]
- Tominaga, Y.; Mochida, A.; Yoshie, R.; Kataoka, H.; Nozu, T.; Yoshikawa, M.; Shirasawa, T. AIJ guidelines for practical applications of CFD to pedestrian wind environment around buildings. J. Wind Eng. Ind. Aerodyn. 2008, 96, 1749–1761. [Google Scholar] [CrossRef]
- GB 50178-93; Standard of Climatic Regionalization for Architecture. China Academy of Building Research. China Planning Press: Beijing, China, 1994.
- GB50009-2012; Load Code for the Design of Building Structures. China Construction Industry Press: Beijing, China, 2012.
- Vervoort, R.; Blocken, B.; van Hooff, T. Reduction of particulate matter concentrations by local removal in a building courtyard: Case study for the Delhi American Embassy School. Sci. Total Environ. 2019, 686, 657–680. [Google Scholar] [CrossRef] [PubMed]
- Qin, H.; Lin, P.; Lau, S.S.Y.; Song, D. Influence of site and tower types on urban natural ventilation performance in high-rise high-density urban environment. Build. Environ. 2020, 179, 106960. [Google Scholar] [CrossRef]
- Niu, J.; Liu, J.; Lee, T.-C.; Lin, Z.; Mak, C.; Tse, K.-T.; Tang, B.-S.; Kwok, K.C. A new method to assess spatial variations of outdoor thermal comfort: Onsite monitoring results and implications for precinct planning. Build. Environ. 2015, 91, 263–270. [Google Scholar] [CrossRef]
- Padilla-Marcos, M.; Meiss, A.; Feijó-Muñoz, J. Proposal for a Simplified CFD Procedure for Obtaining Patterns of the Age of Air in Outdoor Spaces for the Natural Ventilation of Buildings. Energies 2017, 10, 1252. [Google Scholar] [CrossRef]
- Da Silva, F.T.; Reis, N.C.; Santos, J.M.; Goulart, E.V.; de Alvarez, C.E. The impact of urban block typology on pollutant dispersion. J. Wind Eng. Ind. Aerodyn. 2021, 210, 104524. [Google Scholar] [CrossRef]


| One position elevated |  |  |  |  |  |
| A | B | C | D | E | |
| Two positions elevated |  |  |  |  |  |
| Ab | Ac | Ad | Ae | Bc | |
 |  |  |  |  | |
| Bd | Be | Cd | Ce | De | |
| Three positions elevated |  |  |  |  |  |
| Abc | Abd | Abe | Acd | Ace | |
 |  |  |  |  | |
| Ade | Bcd | Bce | Bde | Cde | |
| Four positions elevated |  |  |  |  |  |
| Abcd | Abce | Abde | Acde | Bcde | |
| All elevated |  | ||||
| Abcde |
| V | Air velocity | Ag | Air age |
| MV | Mean wind velocity of the courtyard | MA | Mean air age of the courtyard |
| ∆MV | Rate of change of mean wind velocity | ∆MA | Rate of change of mean air age |
| MVmean | Mean value of average wind speeds | MAmean | Mean value of average air age |
| ∆MVmean | Mean value of the rate of change of the average wind speed | ∆MAmean | Mean value of the rate of change in mean air age |
| Vσ | Standard deviation of wind speeds of the courtyard | Aσ | Standard deviation of air age of the courtyard |
| ∆Vσ | Rate of change of standard deviation of wind speeds | ∆Aσ | Rate of change of standard deviation of air age |
| Vσmean | Mean value of standard deviation of wind speeds | Aσmean | Mean value of standard deviation of air age |
| ∆Vσmean | Mean value of the rate of change of the standard deviation of wind speeds | ∆Aσmean | Mean value of the rate of change of the standard deviation of the air age |
| SW | Southwest wind direction | Aσmed | Median standard deviation of air age |
| SE | Southeast wind direction | U | Measured wind speed |
| S | South wind direction | Uref | Approaching wind speed |
| MVR | Mean wind velocity ratio | BGFE | Building ground floor elevation |
| ∆MV | ∆Vσ | ∆MA | |
|---|---|---|---|
| ∆Vσ | 0.637 ** | ||
| ∆MA | −0.364 ** | −0.128 | |
| ∆Aσ | −0.084 | 0.340 ** | 0.683 ** |
| MV | Vσ | MA | Aσ | |
|---|---|---|---|---|
| Effects | Significant decrease | Significant decrease | Significant decrease | Significant decrease |
| p-value | p < 0.01 | p < 0.001 | p < 0.001 | p < 0.01 |
| Rate of Change of Wind Environment Factor | Position A | Position B | Position C | Position D | Position E |
|---|---|---|---|---|---|
| ∆MV | N.S. | N.S. | N.S. | N.S. | S.D. (p < 0.001) |
| ∆Vσ | N.S. | N.S. | N.S. | N.S. | N.S. |
| ∆MA | N.S. | S.I. (p < 0.05) | S.D. (p < 0.001) | S.D. (p < 0.05) | N.S. |
| Aσ | N.S. | N.S. | N.S. | S.D. (p < 0.001) | N.S. |
Disclaimer/Publisher’s Note: The statements, opinions and data contained in all publications are solely those of the individual author(s) and contributor(s) and not of MDPI and/or the editor(s). MDPI and/or the editor(s) disclaim responsibility for any injury to people or property resulting from any ideas, methods, instructions or products referred to in the content. |
© 2024 by the authors. Licensee MDPI, Basel, Switzerland. This article is an open access article distributed under the terms and conditions of the Creative Commons Attribution (CC BY) license (https://creativecommons.org/licenses/by/4.0/).
Share and Cite
Wen, Q.; Liu, H.; Zhou, Q.; Guo, Q.; Wang, P.; Zhang, L. The Impact of Ground-Floor Elevation of School Buildings on Courtyard Wind Environment. Buildings 2024, 14, 1146. https://doi.org/10.3390/buildings14041146
Wen Q, Liu H, Zhou Q, Guo Q, Wang P, Zhang L. The Impact of Ground-Floor Elevation of School Buildings on Courtyard Wind Environment. Buildings. 2024; 14(4):1146. https://doi.org/10.3390/buildings14041146
Chicago/Turabian StyleWen, Qiang, Haiqiang Liu, Qiang Zhou, Qinghai Guo, Pinliang Wang, and Luyao Zhang. 2024. "The Impact of Ground-Floor Elevation of School Buildings on Courtyard Wind Environment" Buildings 14, no. 4: 1146. https://doi.org/10.3390/buildings14041146
APA StyleWen, Q., Liu, H., Zhou, Q., Guo, Q., Wang, P., & Zhang, L. (2024). The Impact of Ground-Floor Elevation of School Buildings on Courtyard Wind Environment. Buildings, 14(4), 1146. https://doi.org/10.3390/buildings14041146