Article

Finite Element Analysis on the Seismic Performance of Concrete-Filled Steel Tube Columns with a Multiple-Chamber Round-Ended Cross-Section

1
Key Laboratory of Green Building and Intelligent Construction in Higher Educational Institutions of Hunan Province, Hunan City University, Yiyang 413000, China
2
Hunan Engineering Research Center of Development and Application of Ceramsite Concrete Technology, Hunan City University, Yiyang 413000, China
3
College of Civil Engineering, Hunan University, Changsha 410082, China
4
Department of Civil and Environmental Engineering, Hong Kong Polytechnic University, Hong Kong, China
*
Author to whom correspondence should be addressed.
Buildings 2024, 14(4), 1154; https://doi.org/10.3390/buildings14041154
Submission received: 4 March 2024 / Revised: 7 April 2024 / Accepted: 15 April 2024 / Published: 19 April 2024

Abstract

:
This study proposes a form of concrete-filled steel tube column with a multiple-chamber round-ended cross-section (M-CFST). Longitudinal and transverse stiffening ribs divide the circular-ended section into different chambers, strengthening the steel tube’s confinement effect on the core concrete and improving the component’s seismic performance. A three-dimensional finite element (FE) solid model of the M-CFST is created by employing the FE software ABAQUS. Quasi-static analysis is conducted to investigate the influence of parameters, such as chamber arrangement, aspect ratio, and axial compression ratio, on flexural hysteresis performance. Moreover, the failure modes, hysteresis curves, skeleton curves, strain development, and energy dissipation of the components are analyzed. The results show the following: (1) The FE model presented in this study can simulate the quasi-static behavior of CFST columns accurately, and the calculated results are in good agreement with the measured values. (2) The seismic performance of the composite column is excellent, with a large number of chambers leading to a robust hysteresis curve for the composite columns, resulting in increased bearing capacity and energy dissipation capacity. However, the energy dissipation performance of the specimen with a two-chamber arrangement is slightly lower than that with a single-chamber arrangement. (3) The results of the finite element analysis suggest that the long and short sides of the CFST columns with a large length–width ratio should be arranged to be relatively close in length.

1. Introduction

Concrete-filled steel tube structures have been applied on a large scale to bridge construction and building structures in recent years because steel tubes can effectively restrain the core concrete and slow down its longitudinal cracking under pressure, while the internal concrete can delay the local buckling of the steel tube to maximize the advantages of the two materials, enhance the bearing capacity of the pier, and improve the ductility and seismic performance of the pier. Moreover, the construction is convenient and economical [1]. In view of the large section length–width ratio and size of circular end pier in engineering, a concrete-filled steel tube column with a multiple-chamber round-ended cross-section (M-CFST) is proposed in this study. Many bridges in earthquake-prone areas, such as the Houhu Bridge and the Xinglin Bridge, use concrete-filled steel tube piers [1,2]. Previous research [3] has demonstrated that when the section aspect ratio of the concrete-filled steel tubular (CFST) column is larger than five, the restraint of the single-cavity steel tube on the core concrete can be ignored.
In recent years, scholars from various countries have conducted research to investigate the seismic performance of composite columns under low-cycle reversed loading through tested studies and finite element analysis (FEA). For instance, Wei et al. [4] studied pseudo-static tests on ultra-high-performance CFST columns; with column axial spacing and plate thickness as experimental parameters, they performed parameter analyses using OpenSees 12 and established a calculation method for the load-carrying capacity of structures. Zhou et al. [5] analyzed the pseudo-static property of steel tube–concrete composite columns with irregular shapes and indicated that the structure exhibited excellent pseudo-static performance, energy dissipation capacity, and ductility. Zhao et al. [6] conducted pseudo-static tests on 12 high-performance recycled aggregate CFST columns with steel–polypropylene fiber hybrid reinforcement and one reference recycled aggregate CFST column. The results showed that the incorporation of steel–polypropylene fiber hybrid material enhanced the hysteretic behavior of composite columns. Xu et al. [7] completed low-cycle reversed experiments on thin-walled steel tube (CFST) columns to study their seismic property and designed a solid FE method for this structure in consideration of the influence of horizontal cracks. Chen et al. [8] analyzed the inertial force distribution in steel tube concrete (CFST) columns under impact using drop hammer tests and FE methods. The study investigated the effects of impact velocity, impact mass, boundary conditions, and sectional steel ratio on the inertial force distribution within CFST columns. Zhang et al. [9] conducted pseudo-static cyclic loading tests on five wide-flange L-shaped steel tube concrete column specimens. They analyzed the impact of different interface bonding measures and lateral single-column sections on the seismic performance of the columns. Liang et al. [10] designed and tested eight thin-walled elliptical steel tube concrete (CFEST) columns under pseudo-static load and performed seismic property index analyses of thin-walled CFEST columns, including destruction modes, ductility indices, energy dissipation, and strength and stiffness degradation.
The traditional constraints include local constraints on the CFST columns, such as stirrup-reinforced restraint, stud restraint, PBL-stiffened restraint, and bolted restraint. Research results indicate that local constraints can enhance the bond between the steel tube and the concrete, consequently increasing the buckling bearing capacity of the steel tube wall. However, the effect on large-size CFST columns is limited. Further investigation on connecting measures of structure, such as tie rod constraints and end reinforcement constraints, can improve the bearing capacity and seismic performance. However, the placement of long tie rods and reinforcement constraints will affect the pouring performance of the structure [11]. The multi-cavity confinement can effectively constrain the core concrete, and the construction is convenient.
Simultaneously, scholars have initiated partial research on multi-chambered steel tube concrete columns. Sun et al. [12] conducted pseudo-static tests and numerical analyses on five types of three-chambered rectangular CFST columns and indicated that the column width influences seismic performance, hysteresis curves, and damage characteristics. Wang et al. [13] conducted hysteresis load tests and FE studies on four large L-shaped multi-ribbed composite shear walls; the results showed that multi-ribbed composite shear walls exhibit high shear strength, ductility, and energy dissipation capacity. Liu et al. [14] completed two eccentric loading tests on T-shaped irregular steel tube concrete columns and established an FE model and conducted parameter analysis on the entire flexural stability of the structures under the combined action of axial compressive loads and in-plane bending moments. Guo et al. [15] conducted experimental research on the compressive performance of square double-chambered steel tube concrete short columns. The study elucidated the effects of concrete strength, eccentricity ratio, and cross-sectional hollow ratio on the column’s failure mode, ultimate strength, and ductility. Wu et al. [16] used research results based on the unified theory of CFST and some experiments to establish an FE model to study the composite strength calculation method of multi-chambered irregular steel tube concrete components. Cheng et al. [17] studied force performance under eccentric loading on 11 improved multi-chambered T-shaped steel tube concrete column specimens through experiments and theoretical analysis. Additionally, they conducted supplementary analyses using finite element simulation methods.
In summary, research on the seismic performance of multi-chambered restrained circular-end steel tube concrete columns is limited, thus restricting their application in earthquake-prone areas. To delve deeper into the seismic performance of such columns, the authors, building upon existing test research [18], undertook the following tasks: (1) conducted finite element studies on 12 multi-chambered restrained circular-end steel tube concrete columns under pseudo-static loading, analyzing experimental phenomena and failure modes; (2) analyzed the influence of factors, such as chamber arrangement and axial compression ratio on seismic property factors, including destruction mode, hysteresis curves, skeleton curves, stress development, and material damage and energy dissipation of these columns; and (3) on the basis of the FEA, suggested that the long and short sides of the CFST columns with a large length–width ratio should be arranged to be relatively close in length.

2. Experimental Program

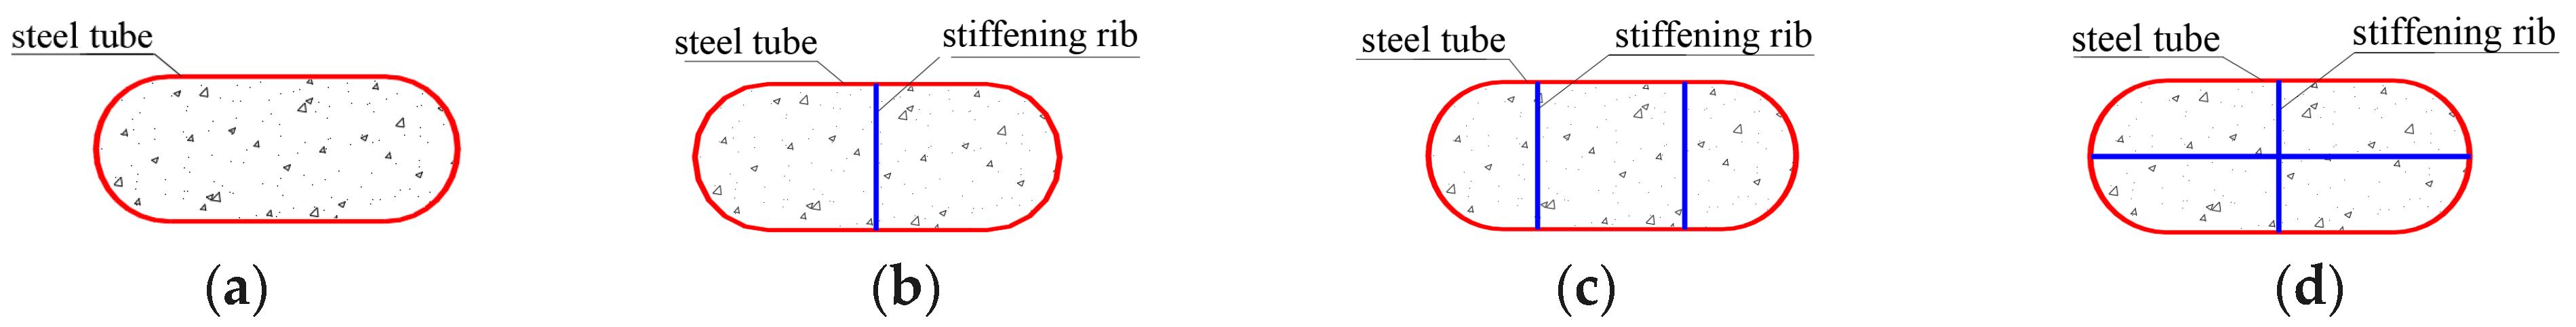
2.1. Specimen Information

In accordance with the specification for seismic testing of buildings (JGJ101-2015) [19], a total of 12 CFST columns with an M-CFST were designed for this experimental program [18]. Table 1 presents the test parameters for the composite columns, and the loading direction of all specimens was along the strong–weak axis. B is the width of the section, D is the height of the section, H is the height of the column, n is the axial compression ratio, fcu is the cubic compressive strength, fs is the yield strength of steel tube, and ρs is the steel content of the section. The concrete strength grade was C40. The test parameters include width-to-thickness ratios and axial compression ratios. The width-to-thickness ratios (B/D) were 2 and 3, and the axial pressure ratios were 0.1 and 0.3, respectively. Figure 1 shows the cross-section of the composite column. Figure 2 shows the test setup and measurement plan of the specimen.

2.2. Loading Scheme and Measuring Point Arrangement

The experiment was conducted on the pseudo-static test structural testing system, with the loading device consisting of vertical and horizontal loading components, as shown in Figure 2. This study employed a method involving pretensioned threaded steel bars using jacks, which applied a constant axial force to the components. Two jacks were positioned at the ends of the base to prevent any sliding during the loading process at the base of the specimens under horizontal reciprocating loads.
During the test, the load values of the actuator were automatically collected. High-precision displacement sensors were strategically placed at three different positions (i.e., the loading point, halfway up the specimen, and at the bottom of the specimen) to measure horizontal displacements. Additionally, eight strain gauges were installed 10 cm above the stiffening ribs at the bottom of the column. The local buckling deformations, failure modes, and failure locations of the specimen were watched and recorded throughout the testing process.

3. Finite Element Model Establishment

3.1. FE Modeling

3.1.1. Material Constitutive Relation

The FE software ABAQUS/Standard 6.14 was used in this study for detailed FE modeling. The material constitutive relationship of the concrete and steel was adopted from Ding et al. [20,21].
The following stress–strain relationship for concrete under uniaxial compression was presented by Ding et al. [20,21]. The specific parameters of concrete in Equation (1) are shown:
y = A x + ( B 1 ) x 2 1 + ( A 2 ) x + B x 2 x 1 x α ( x 1 ) 2 + x x > 1
The following stress–strain relationship for concrete under uniaxial tension was presented by Ding et al. [20,21]. The specific parameters of concrete in Equation (2) are shown:
y = A 2 x + ( B 2 1 ) x 2 1 + ( A 2 2 ) x + B 2 x 2 x 1 x α 2 ( x 1 ) 2 + x x > 1
Many experimental studies on the material properties of steel indicate that the constitutive behavior of steel can be described by an elasto-plastic model. This model is described below. The specific parameters of steel in Equation (3) are shown in reference [20,21].
σ i = E s ε i ε i ε y f y ε y < ε i ε s t f y + ζ E s ( ε i ε s t ) ε s t < ε i ε u f u ε i > ε u

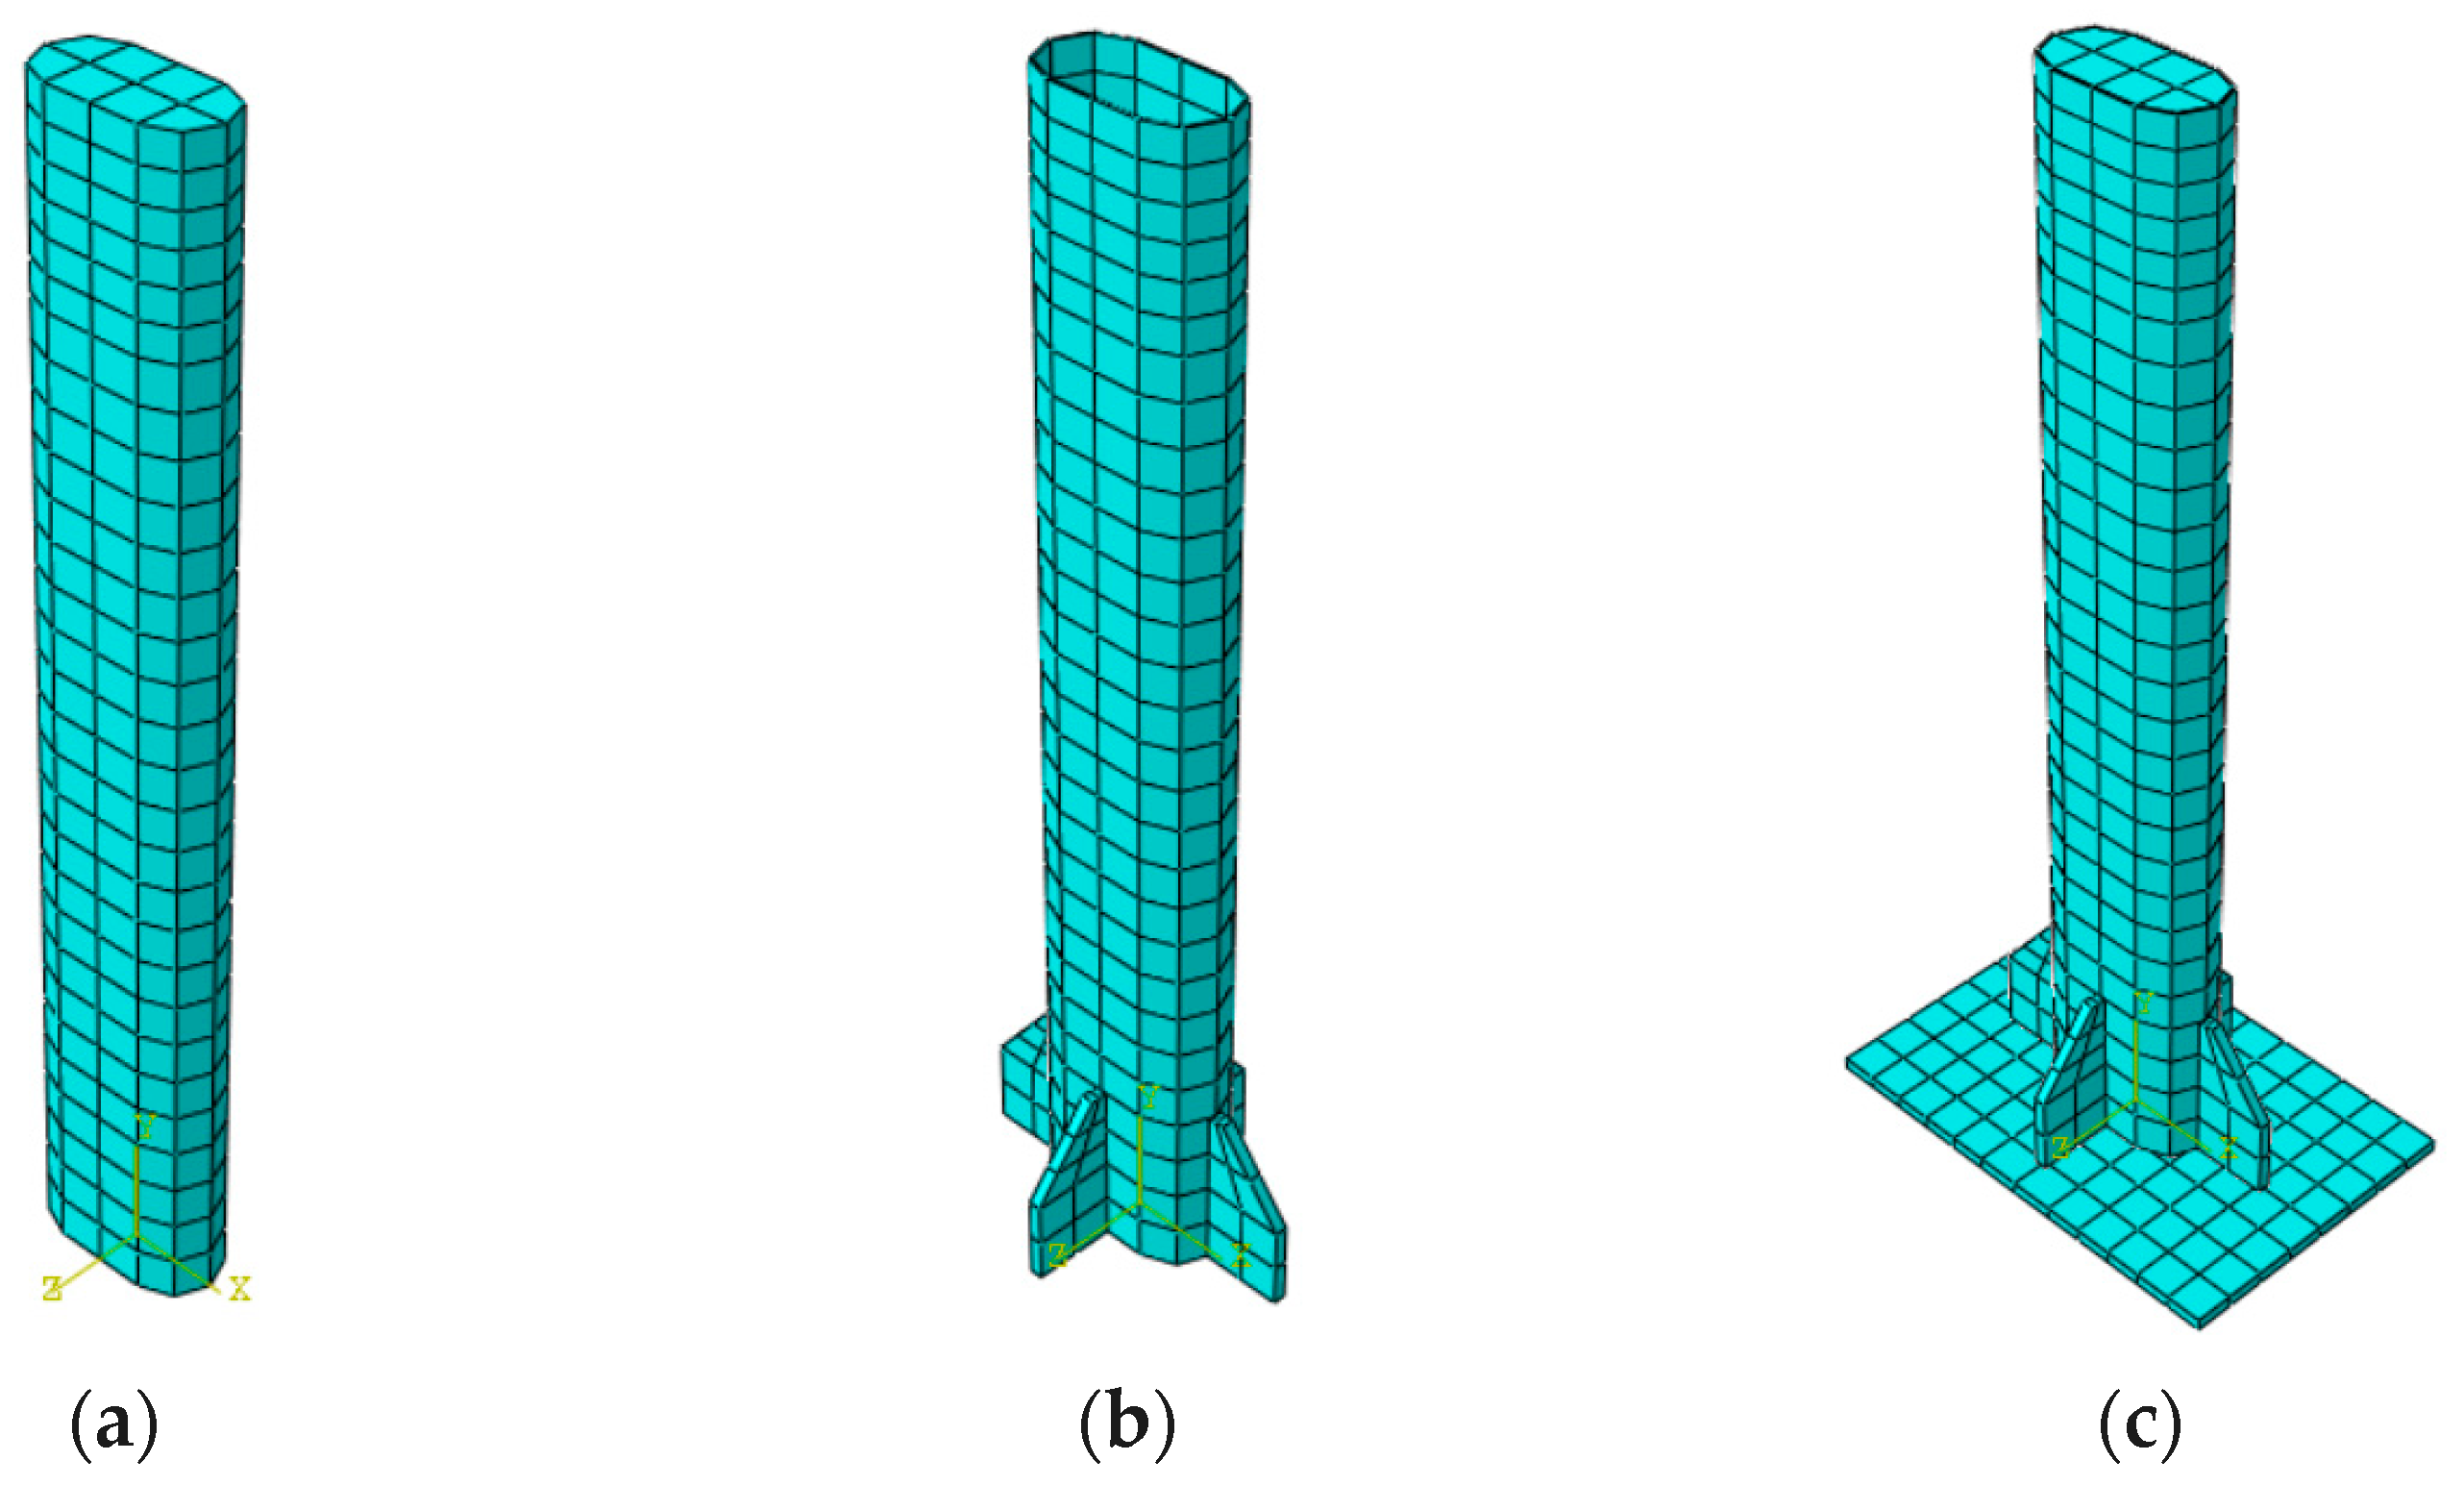
3.1.2. Mesh and Element

FE models were set up through the ABAQUS program. The steel tube, concrete, and stiffener were modeled using C3D8R (Figure 3a,b). The overall element is shown in Figure 3c. The interface interaction between different materials was derived from Ding et al. [3,21]. The boundary of the steel–concrete composite columns was bottom-fixed and top-lateral-loaded, similar to that in the test.
The interfacial behavior between the steel tube and core concrete, where the sliding formulation is finite sliding, was simulated using a surface-based interaction with hard contact in the normal direction and a Coulomb friction coefficient of 0.5 in the tangential direction to the interface. Two distinct surfaces may be coupled by a tie constraint so that no relative motion occurs between them. The interface interaction between different materials was derived from Ding et al. [3].

3.2. Model Validation

3.2.1. Failure Mode

Figure 4 illustrates the comparison between the failure mode obtained from FEA and the experimental failure mode. (1) The failure mode of CFST-9 showed bending failure, similar to the other 11 specimens. The bottom of the steel tube showed buckling, and some steel even showed the tensile crack phenomenon. After the test, the bottom of the steel tube was cut, and the concrete of the specimen was crushed; even some of the concrete was peeling off, and its failure position was consistent with that of the steel tube. (2) When the FEA showed the maximum horizontal loading displacement, the maximum stress of the steel tube appeared at the bottom in the arc region, which is consistent with the phenomenon of the steel tube bulging or even cracking. As shown in the compressive and tensile damage diagram of concrete, the concrete failure phenomenon at the bottom of the specimen and near the loading point is the most evident, which is consistent with the concrete failure after the test. Therefore, the stress of the steel tube reached its maximum value, approximately 10 cm above the stiffening ribs, which aligns with the observed failure in the experiment. (3) The FE exhibited greater damage to the simulated component after quasi-static loading.

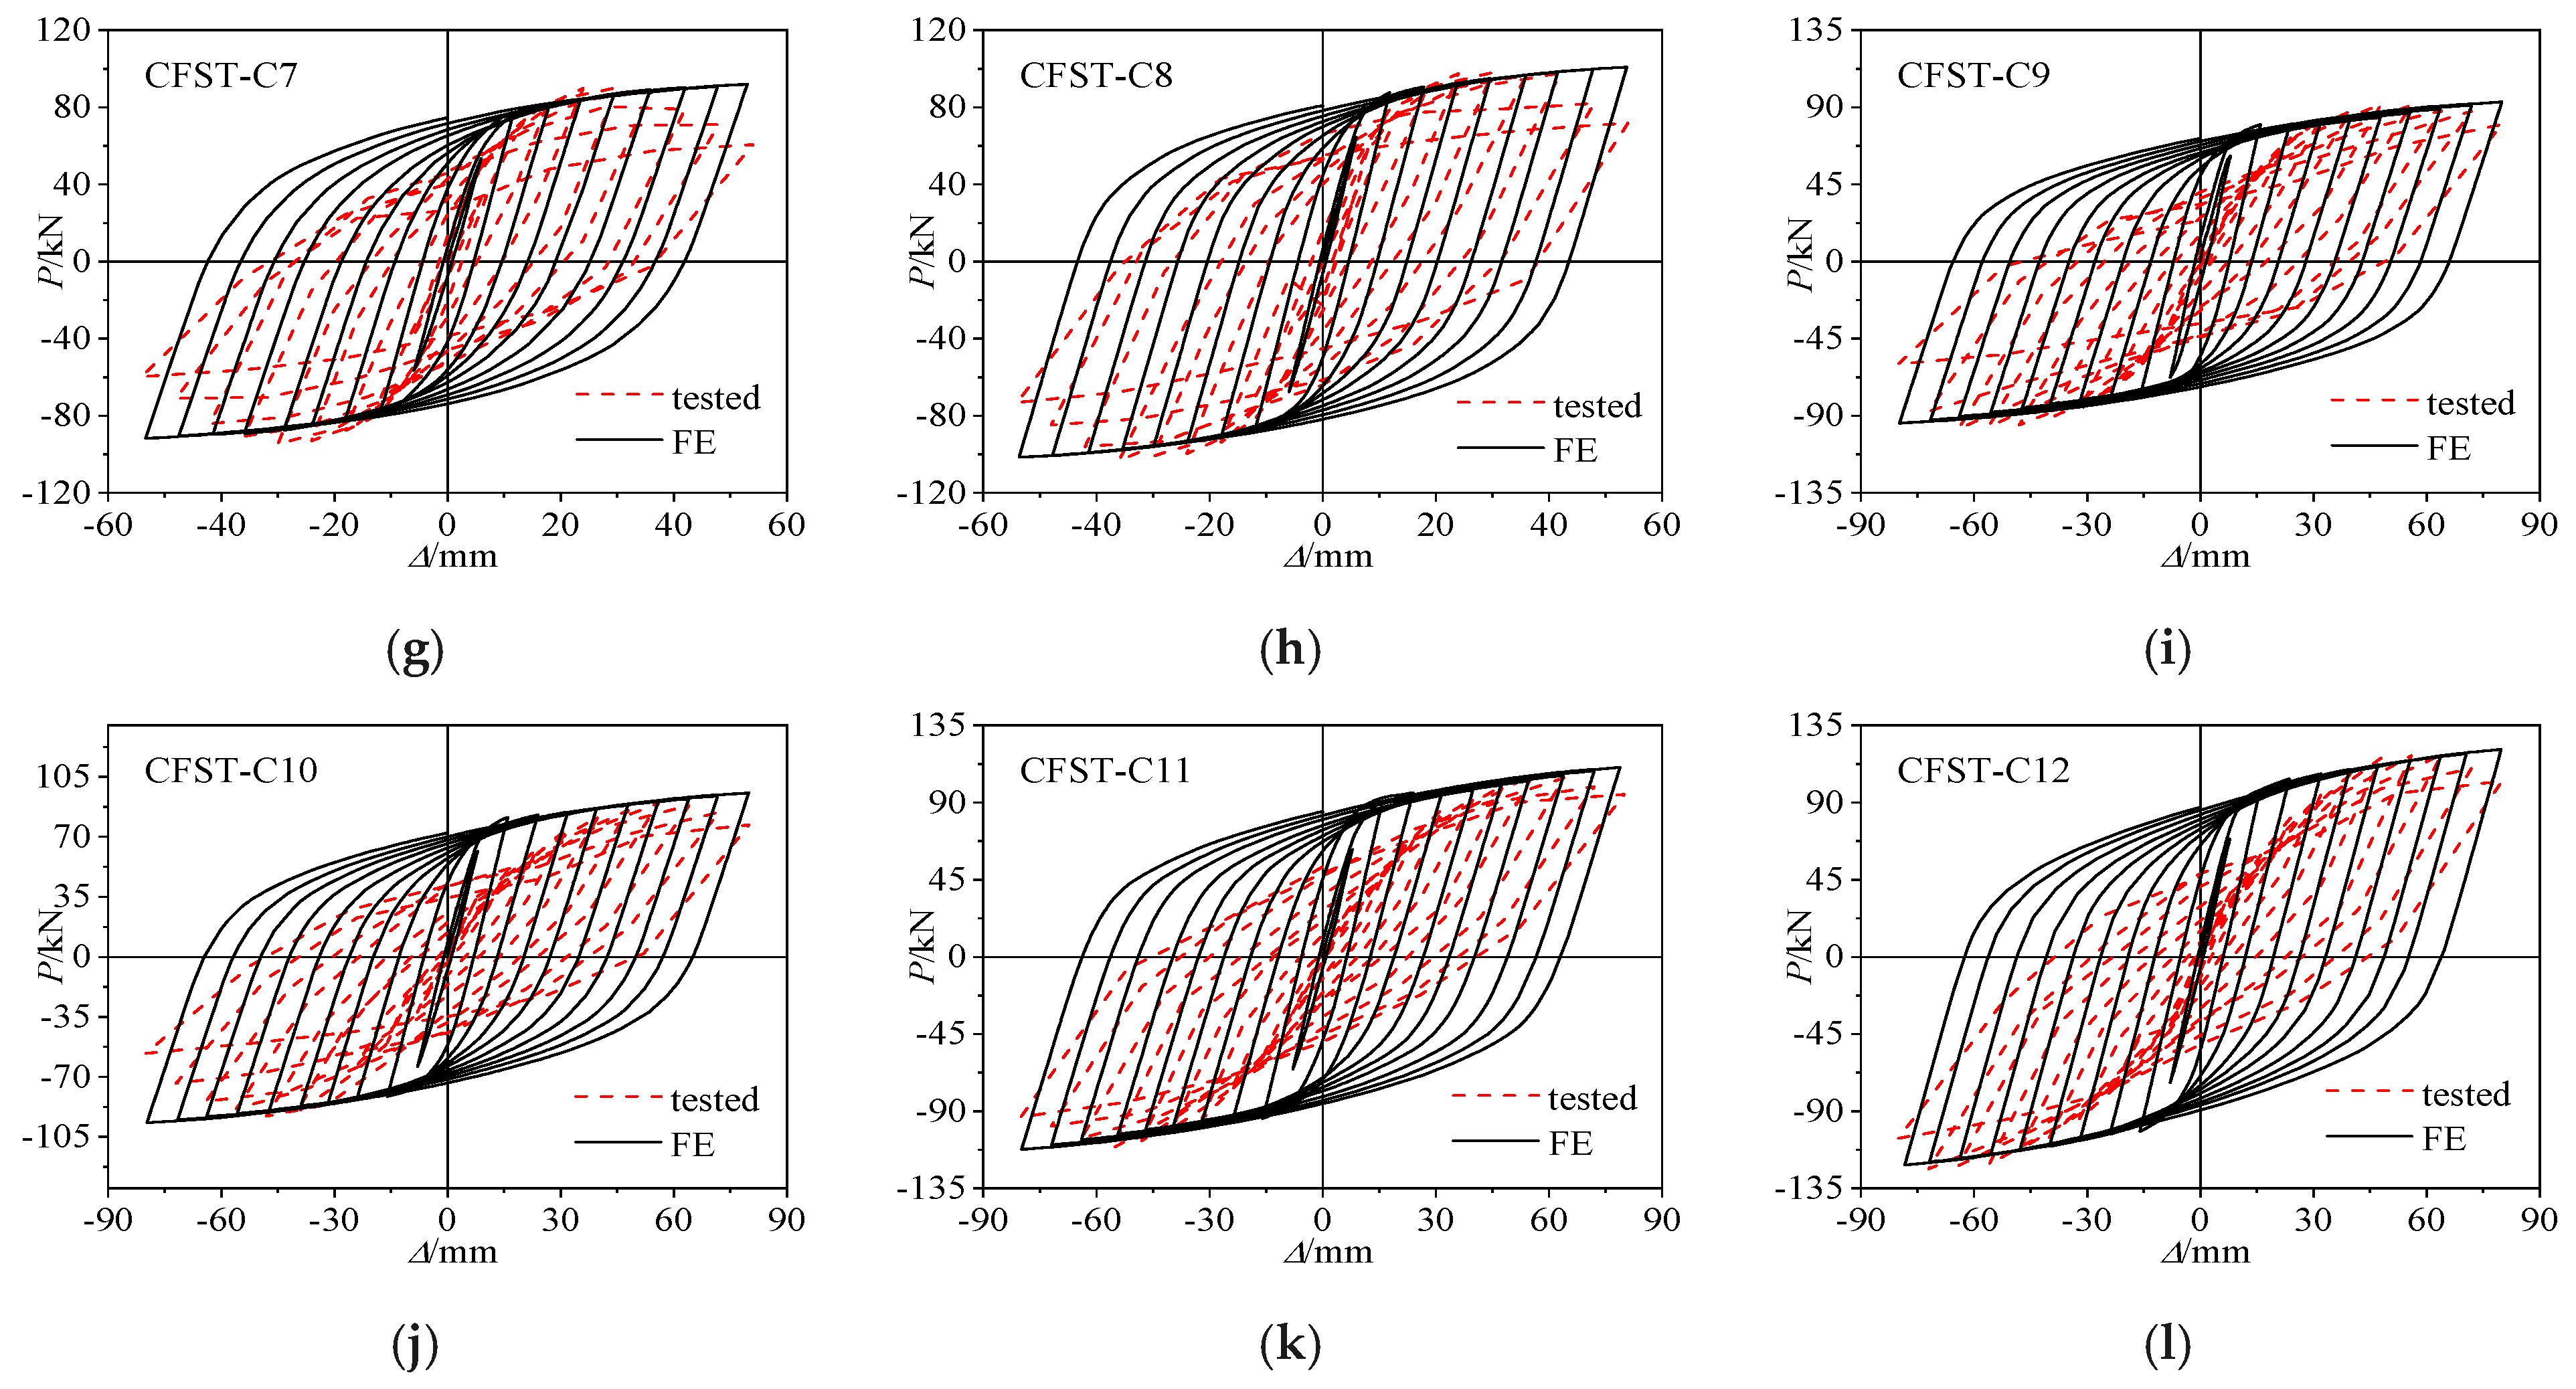
3.2.2. Hysteresis Curve

Figure 5 illustrates the load–deformation hysteresis curve comparison between calculated and tested M-CFST columns. Δ and P represent the horizontal displacement and horizontal load, respectively. The hysteresis curve obtained from FEA aligns well with the experimental curve. The specimen hysteretic curves of the tested and FE results are full, indicating that the seismic property of the concrete-filled steel tube column with an M-CFST is present. Furthermore, the FE results are fuller than the tested ones because the FEA hardly simulates the material defects and loading eccentricity of the test specimen during the test.

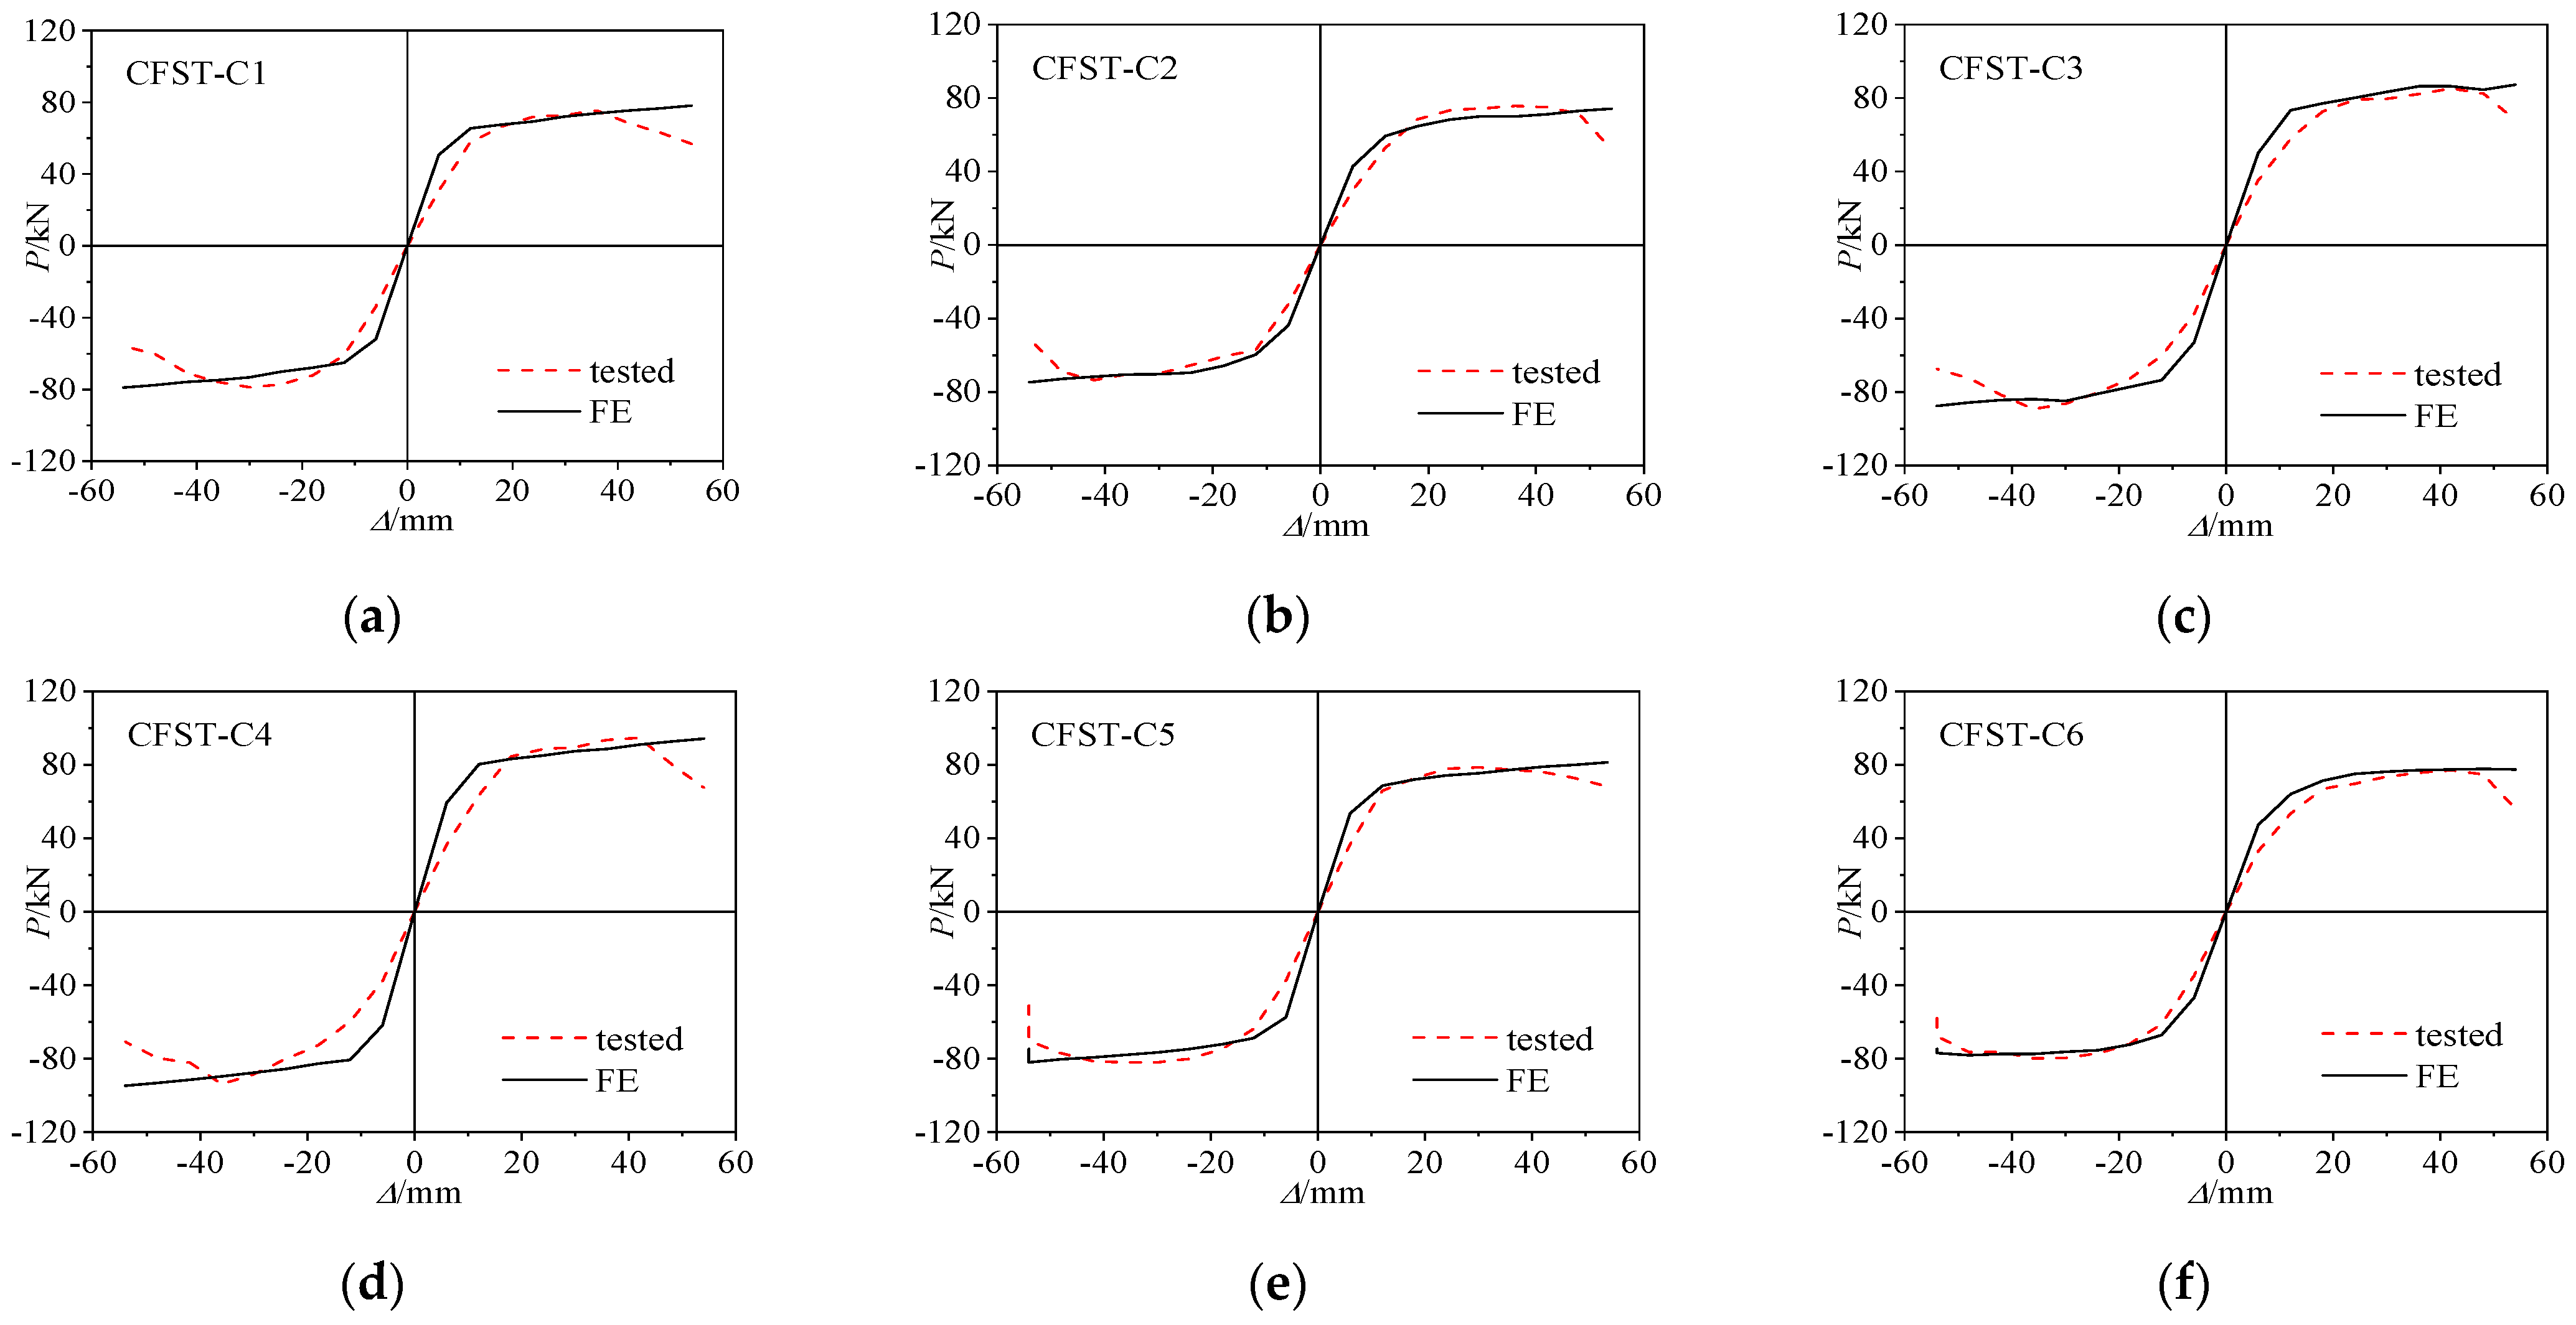
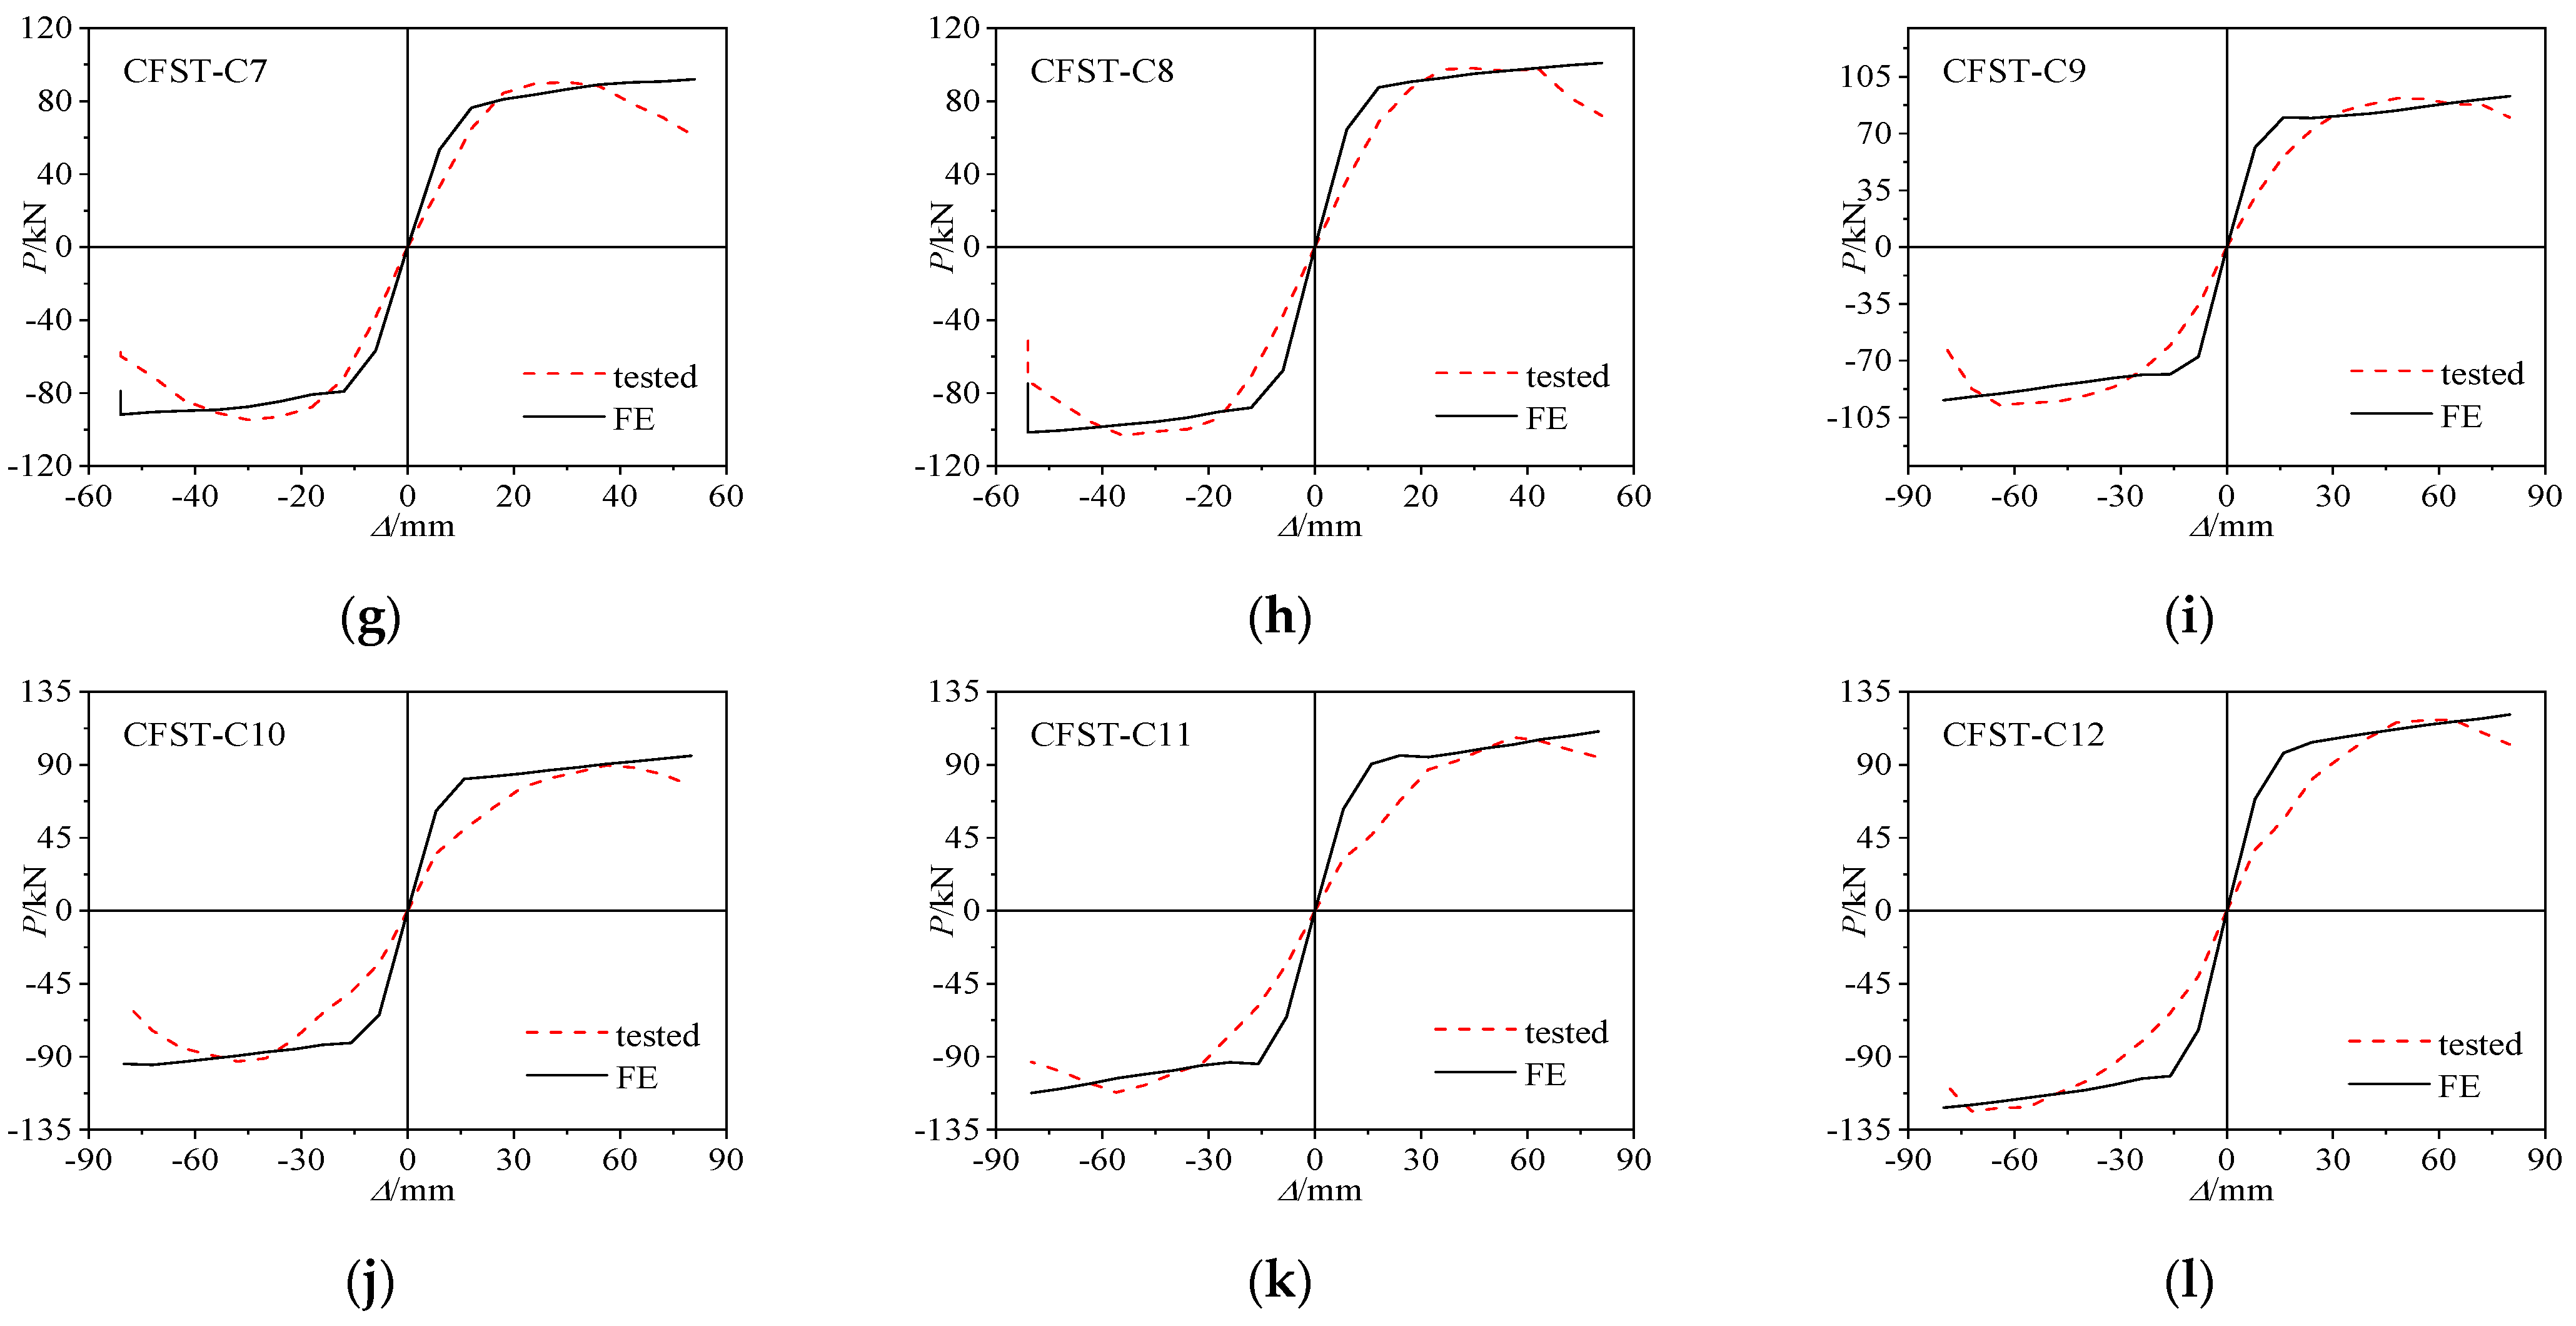
3.2.3. Skeleton Curve

Figure 6 illustrates the load–deformation skeleton curve comparison between calculated and tested M-CFST columns. The graph shows that the overall agreement between the skeleton curves obtained from FEA and the experiment is good. The experiment- and FEA-obtained skeleton curves show a less pronounced descent, indicating improved stiffness; both the curves are S-shaped. The results of the skeleton and hysteresis curves are generally consistent.

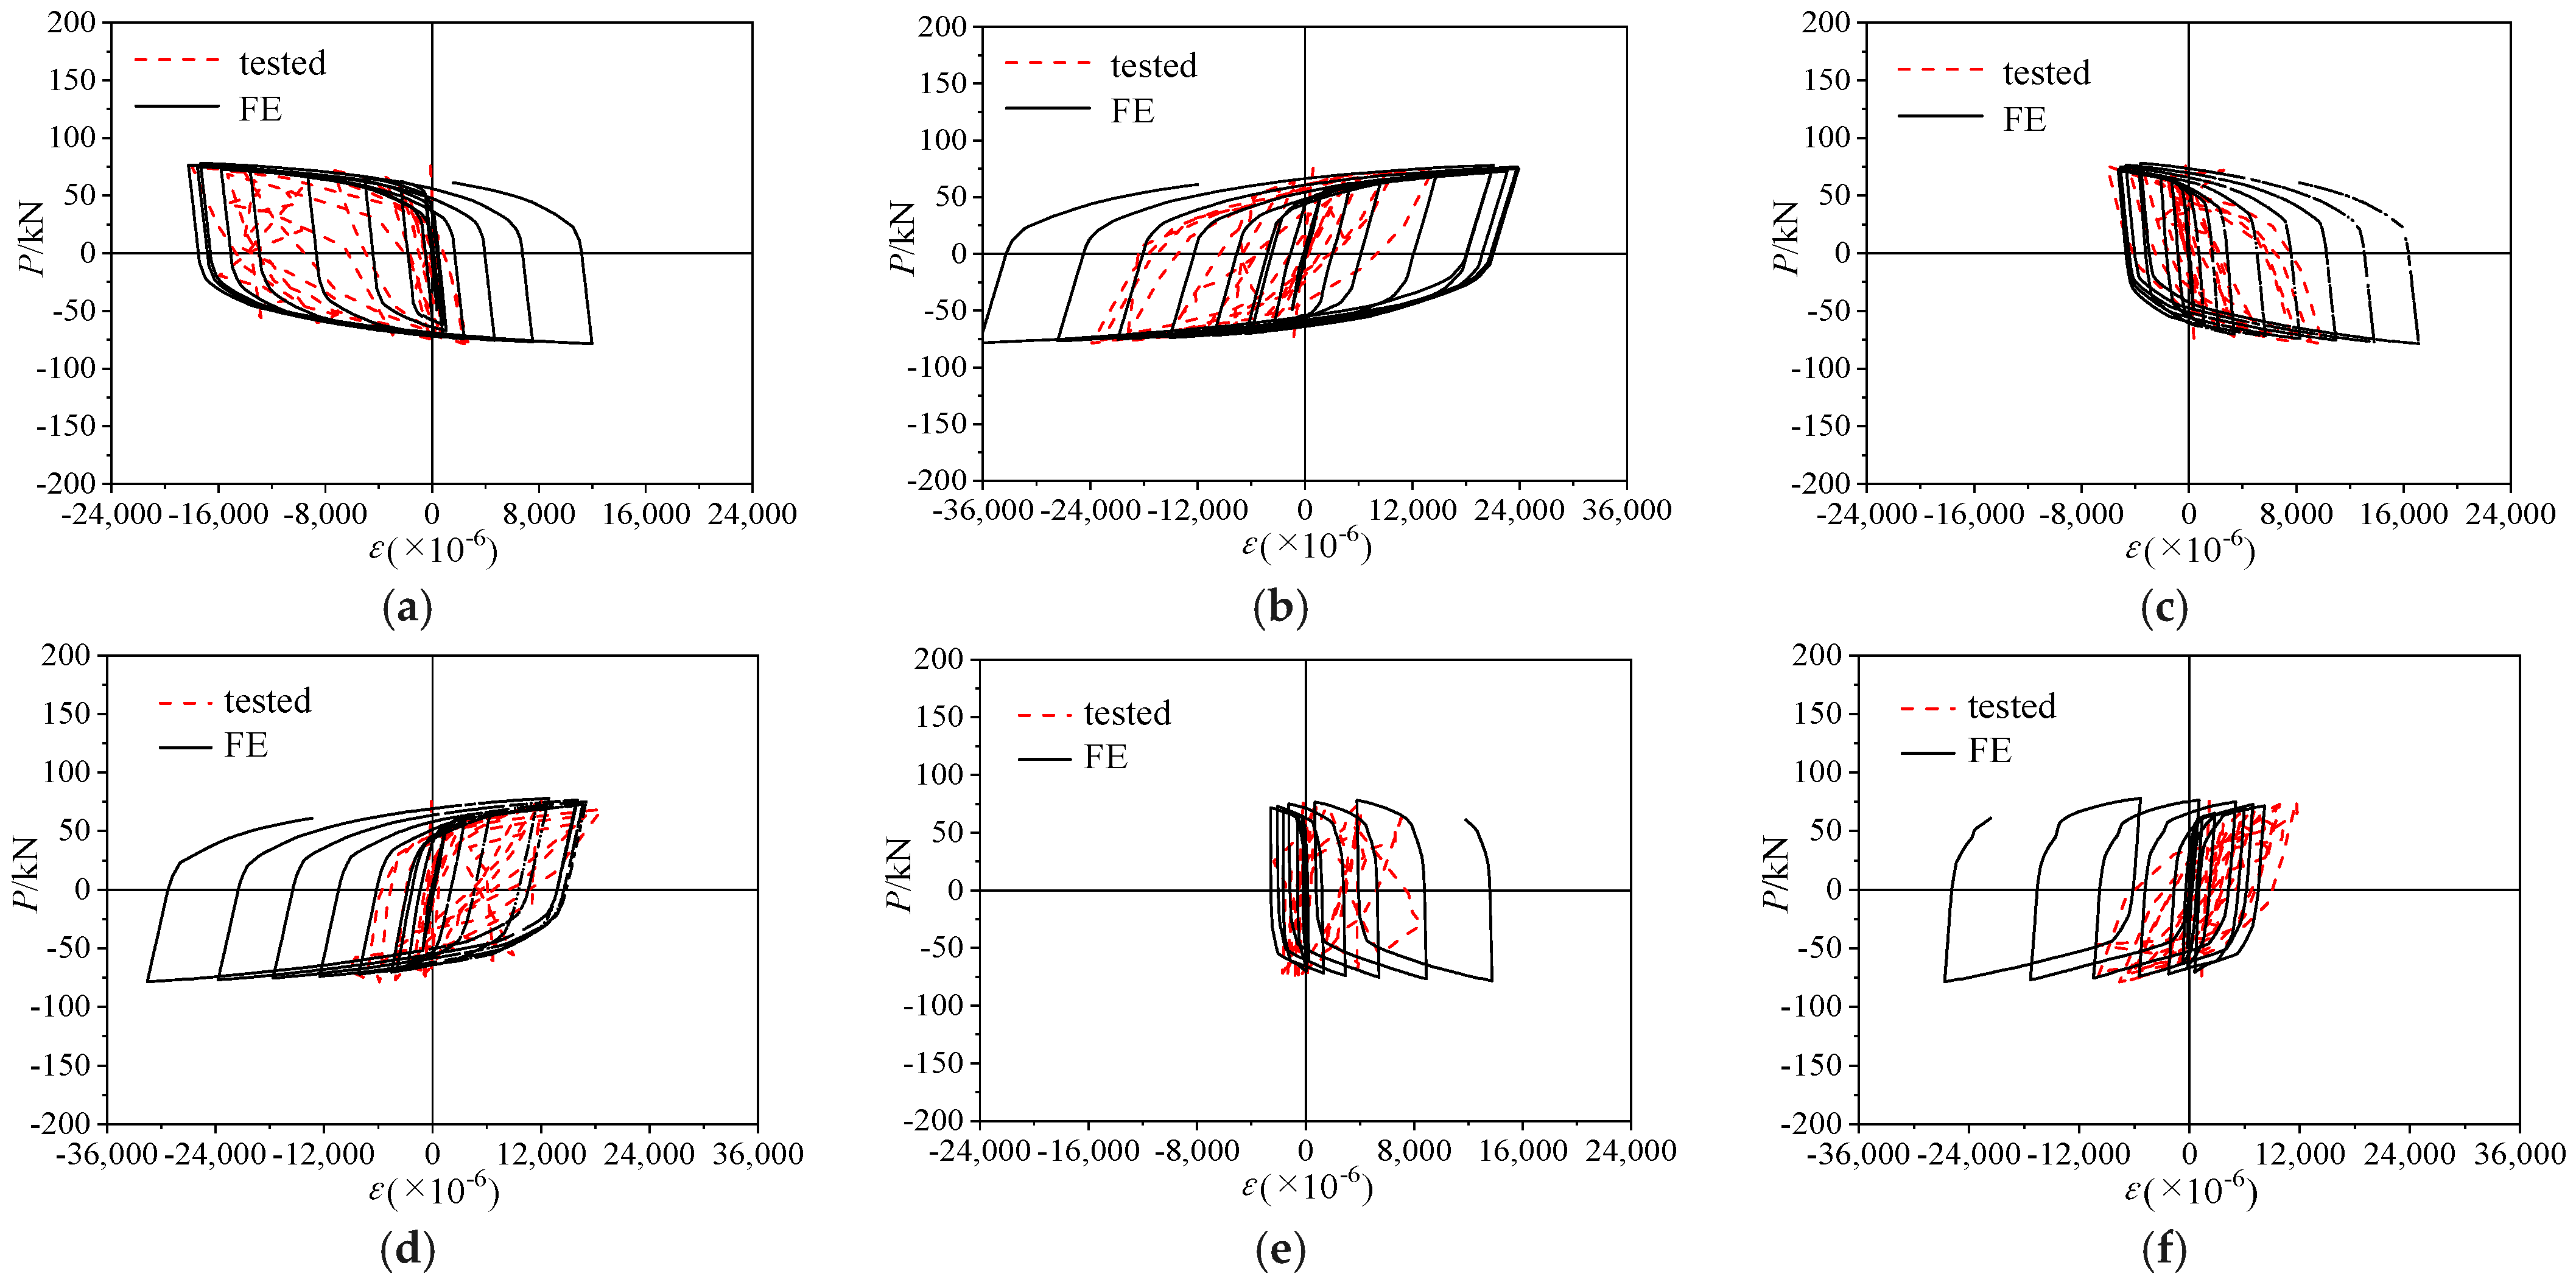
3.2.4. Load–Strain Curve

Figure 7 shows the comparison between the FEA and tested load–strain curve of CFST-C1. The following is observed:
(1)
Strain development during the loading procedure of the columns exhibits hysteretic characteristics. The surface of the steel tube experiences tensile strain (positive values) and compressive strain (negative values). The overall load–strain curve shows a relatively stable state, with considerable fluctuations in the later stages, which is related to the specimen’s failure, including the buckling damage in some measuring points of the steel tube during the experimental process.
(2)
Longitudinal and circumferential strains follow a roughly similar pattern. With the low-cycle reciprocating horizontal load, strains cyclically change in positive and negative directions; as the load continues to increase, the load–strain hysteresis curve becomes plumper. This result is due to the gradual increase in the steel tube’s constraint on the concrete during the later loading stages.
(3)
The steel tube undergoes small strain during the low-cycle reciprocating test at the straight-edge midpoint of the steel tube, which means that the steel tube’s constraint on the core concrete is relatively weak. The steel tube’s constraint on the core concrete is strong at the arc midpoint of the circular steel tube, and the steel tube undergoes large strain during the low-cycle reciprocating test.

3.2.5. Load–Steel Tube Surface Transverse Deformation Coefficient Curve

The lateral strain/vertical strain is defined as the lateral deformation coefficient, which reflects the characteristics of the material transverse deformation of the steel tube during loading. Figure 8 shows the comparison between the FEA and tested load–lateral deformation coefficient of CFST-C1. The following can be observed:
(1)
The measured data are relatively consistent with the FEA result. As the circumferential load increases, the circumferential stress of the steel tube also increases. The circumferential stress is greater than the axial stress, and the lateral deformation coefficient is greater than 0.5, revealing that the steel tube exerts a hoop restraint effect on the concrete.
(2)
In the early stages of cyclic loading, the rate of increase in circumferential strain is small, and the axial pressure is constant. Moreover, the longitudinal strain remains unchanged, leading to a relatively small lateral deformation coefficient in the early stages, maintaining a constant value. As the number of cyclic loading cycles increases, the localized deformation and circumferential strain of the steel tube increase, and the lateral deformation coefficient increases. When the cyclic loading reaches the last time, the transverse deformation coefficient increases sharply and reaches the maximum value.

4. Finite Element Analysis

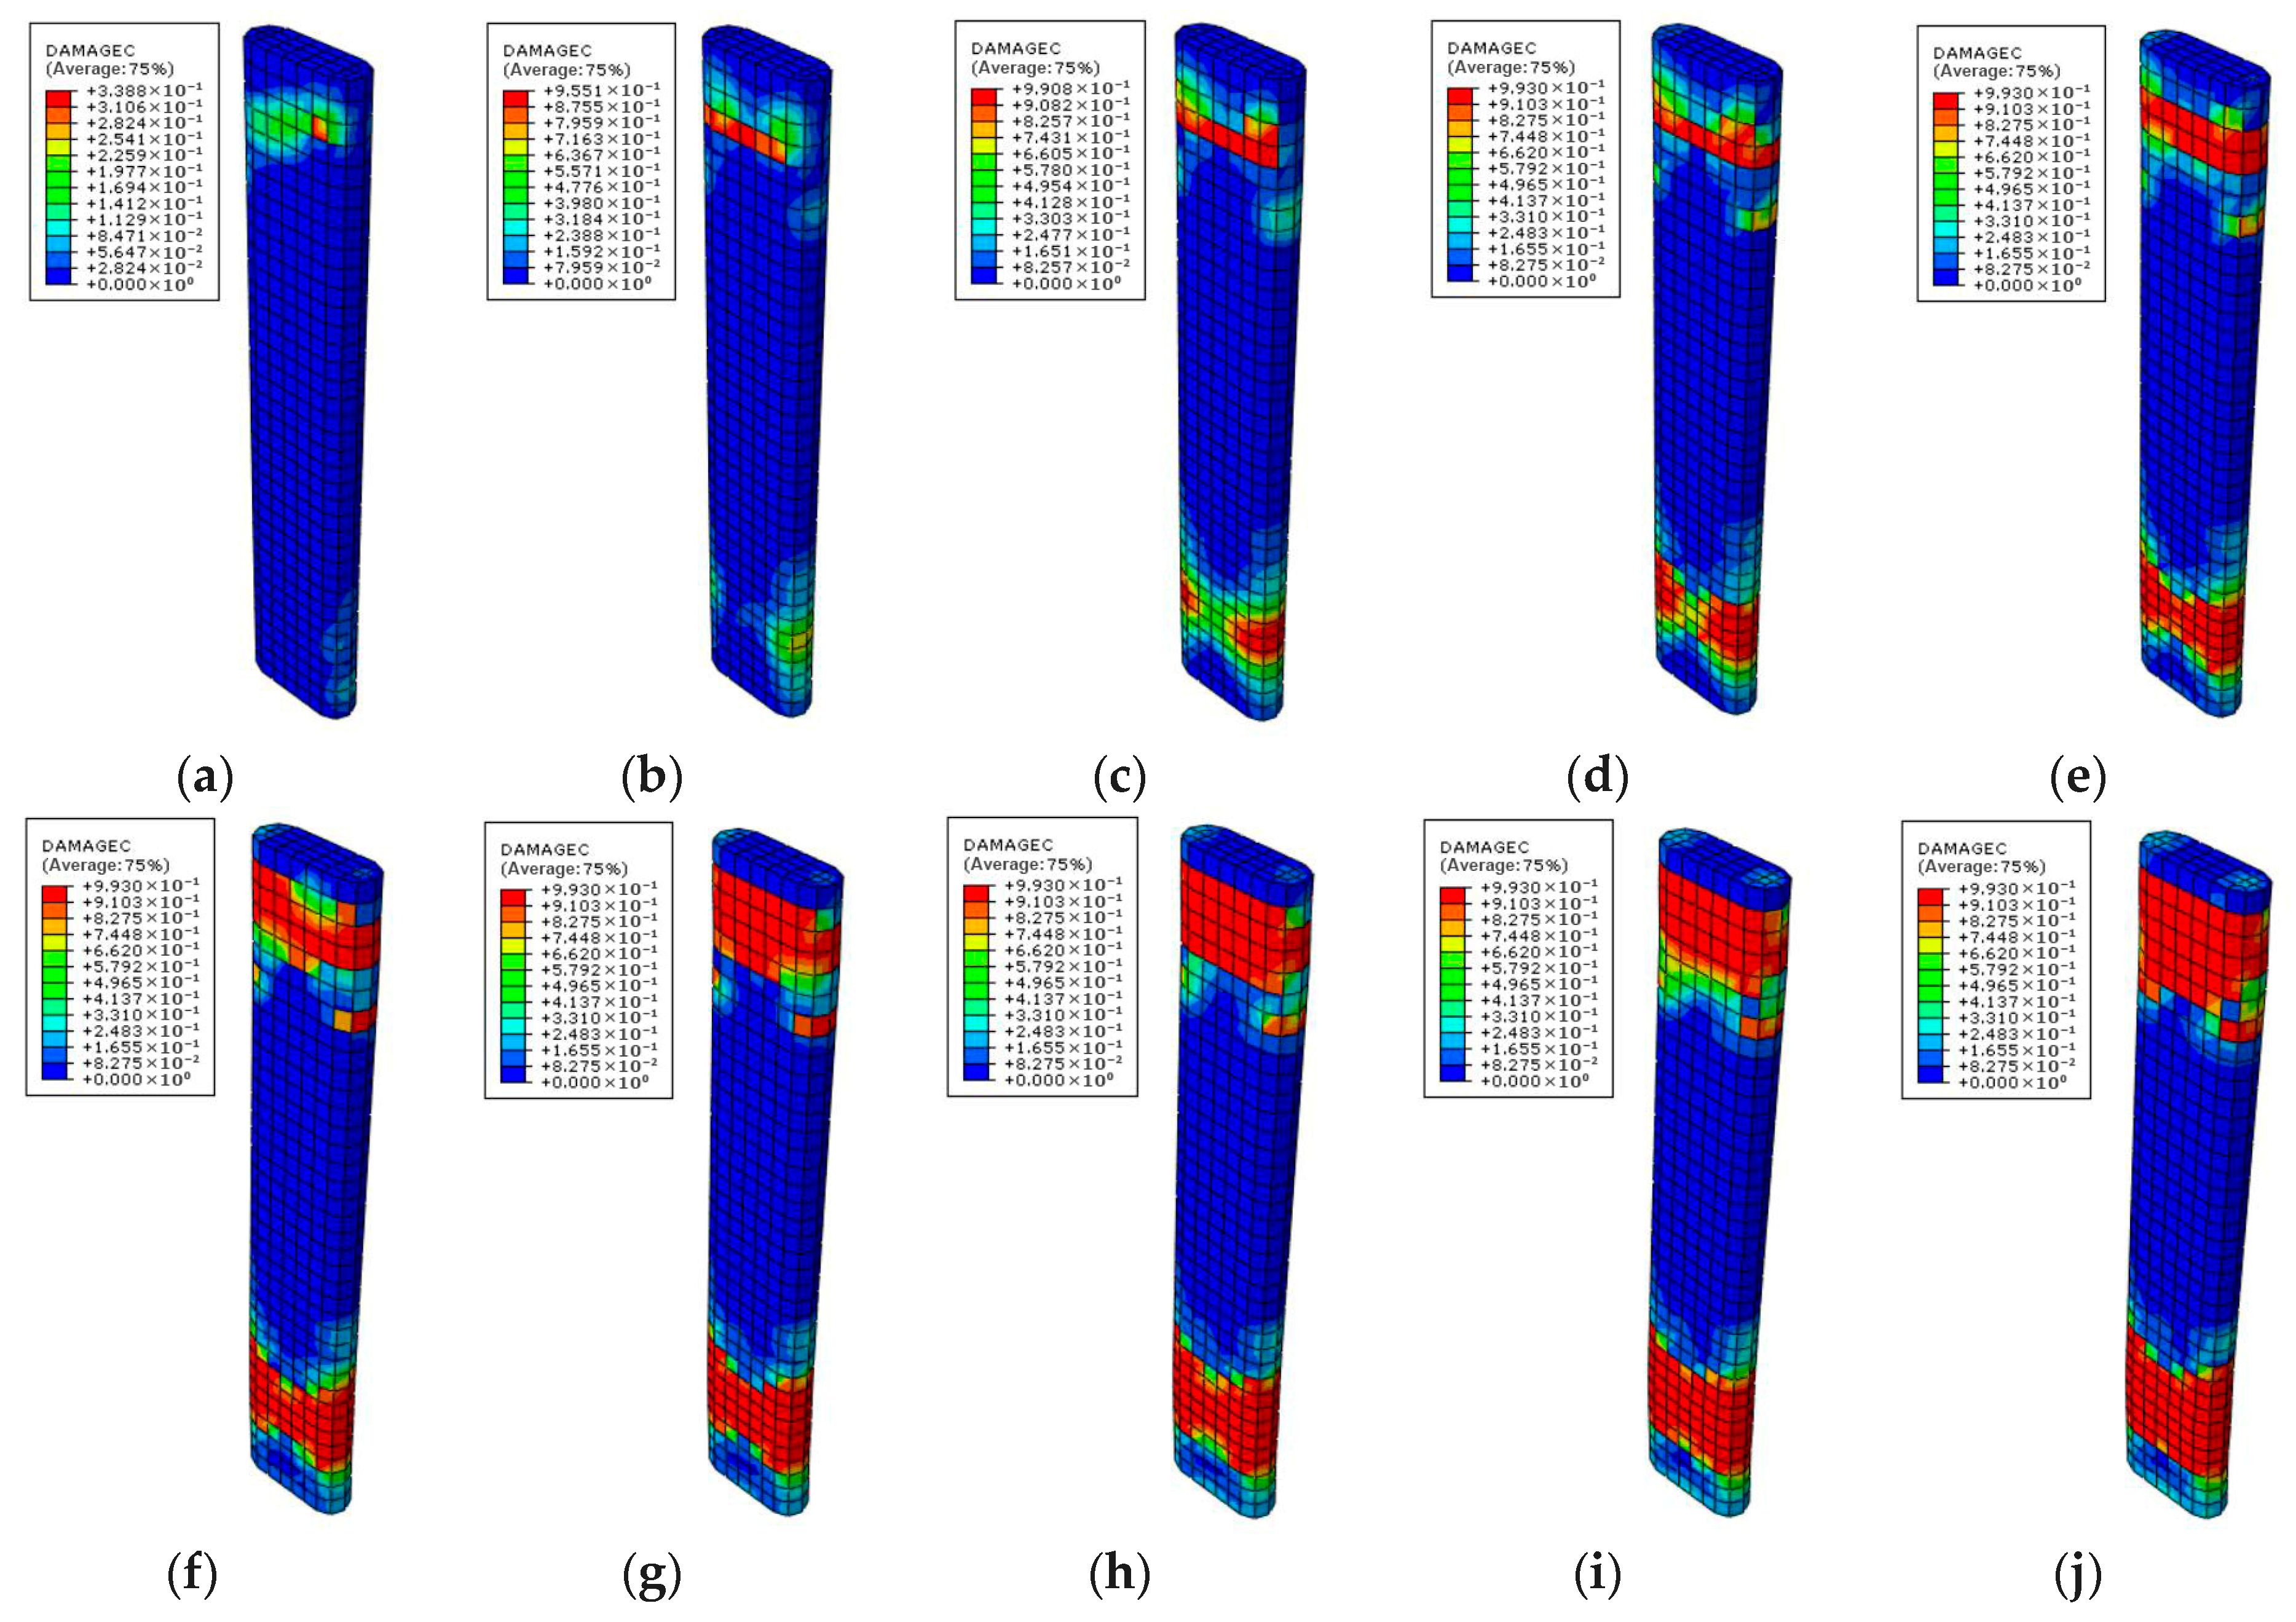
4.1. Analysis of Damage and Stress Development in Steel Tube Concrete Columns

By observing the damage nephogram of concrete column, the process of concrete undergoing force-induced damage during loading can be understood. Taking CFST-C5 as an example, Figure 9 shows the concrete compression damage (DAMAGEC) nephogram, Figure 10 shows the concrete strain damage (DAMAGET) nephogram, and Figure 11 shows the steel stress (Mises) nephogram. Table 2 shows the CFST column damage information.
The results indicate that with the continuous progress of loading, considerable damage occurred in the top and bottom regions of the concrete column. With the increase in the number of loading cycles, the compression and tension damage of concrete continue to increase, and the maximum stress of steel increases, which is consistent with the experimental phenomenon and strain test results. This finding suggests that the modeling approach can effectively simulate the damage of concrete columns during low-cycle reciprocating processes.

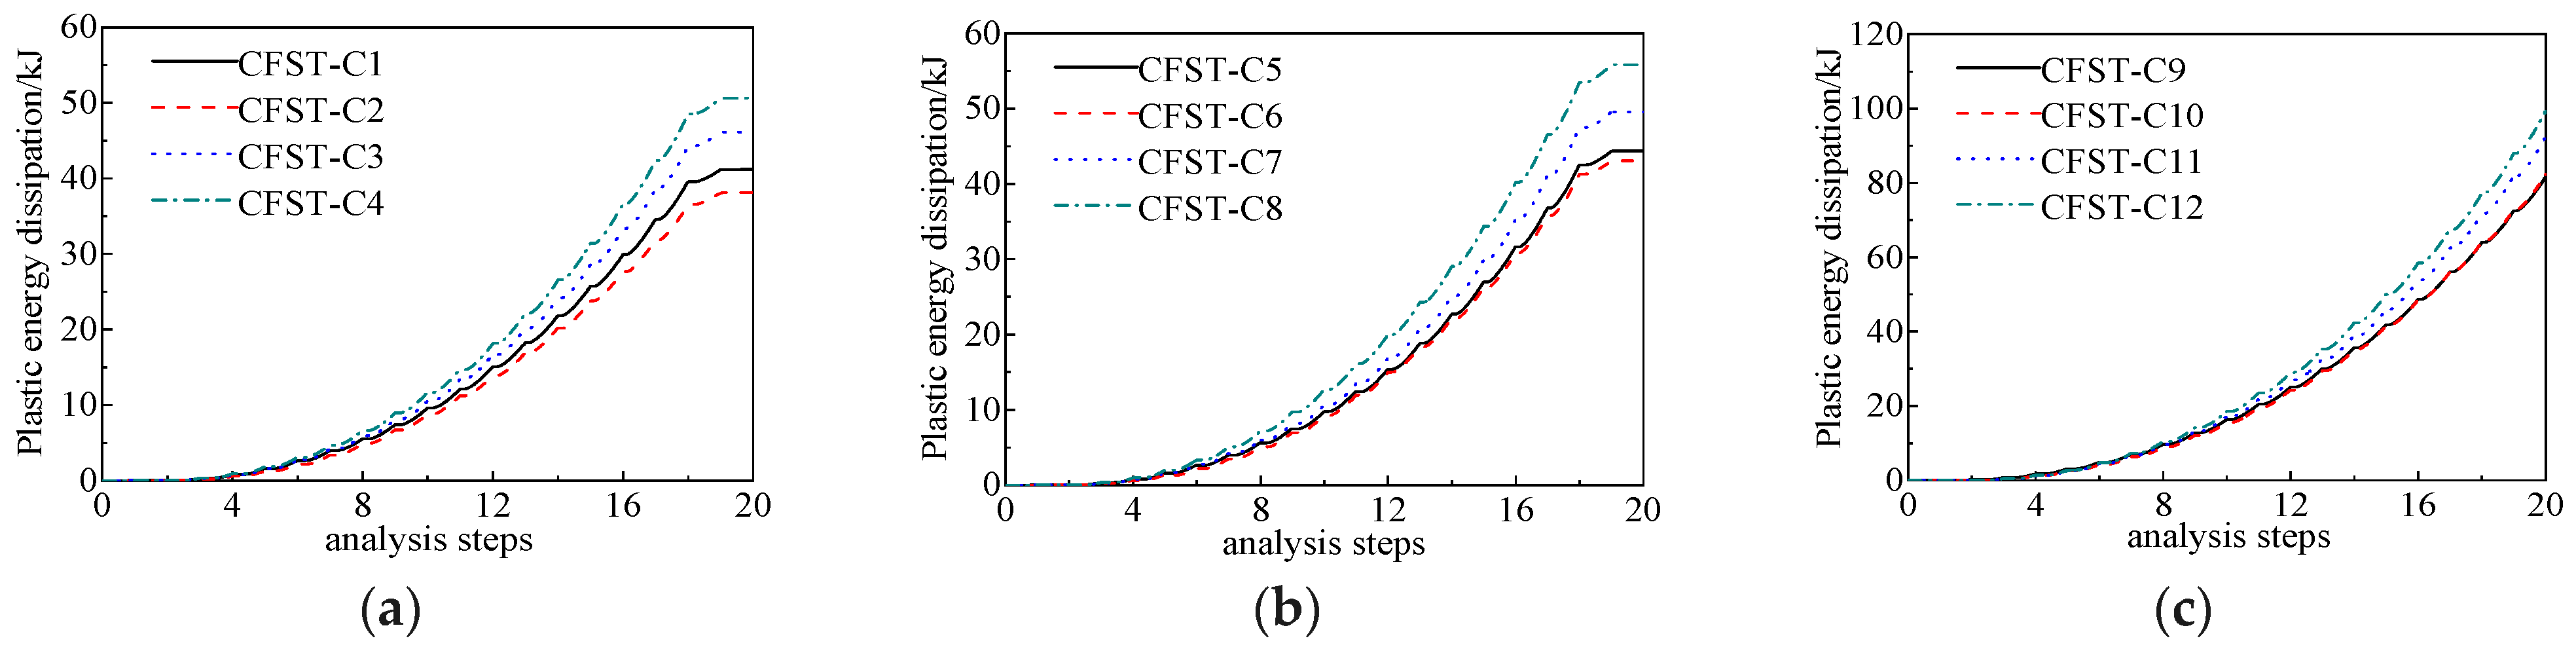
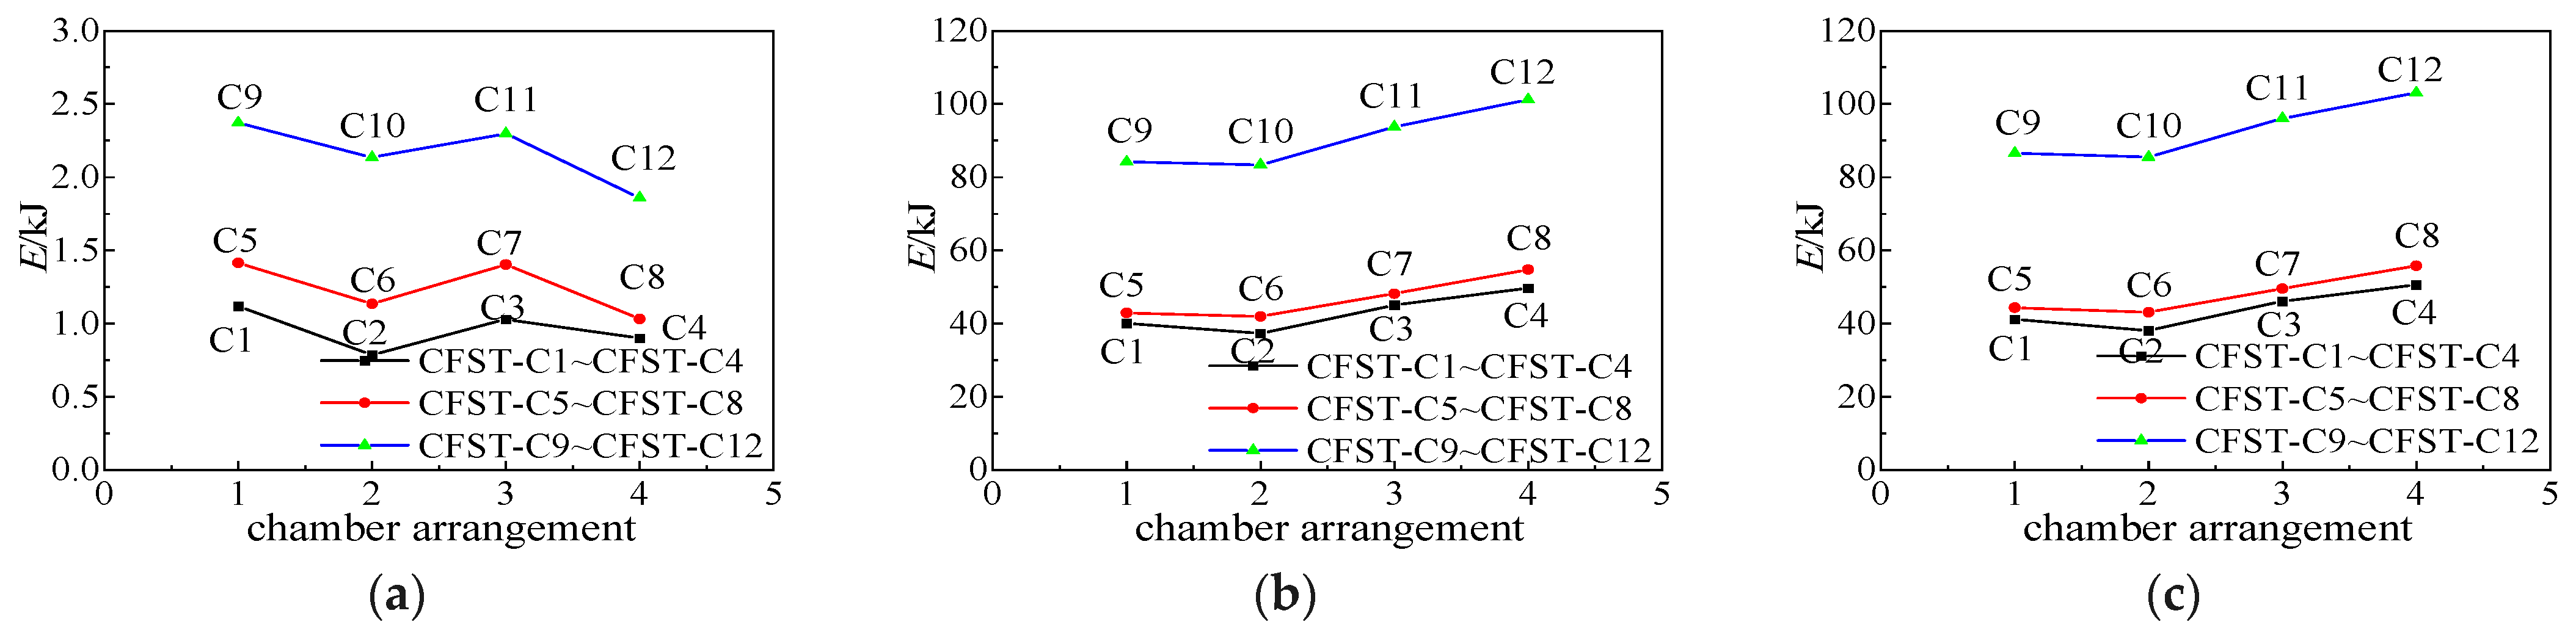
4.2. Plastic Energy Dissipation Analysis

(1)
Comparison of total plastic energy dissipation
This section analyzes the energy dissipation of steel and concrete through finite element software, extracting the results of plastic energy dissipation (ALLPD) to reveal the energy dissipation mechanism between them. Figure 12 shows the curve of the total plastic energy dissipation values with the change of analysis step. Comparing the results with CFST-C1–CFST-C12 reveals the following:
The plastic energy dissipation value of CFST-C1, which is 40.5 kJ, reveals that it aligns with the model values obtained in Figure 12, indicating the accuracy of the numerical extraction. The energy dissipation of each specimen increases with the growth of analysis steps. Under the two axial pressure ratios, specimens with an axial pressure ratio of 0.3 are larger than those with an axial pressure ratio of 0.1, consistent with the trend of load-bearing capacity changes mentioned in Section 3.2.2.
(2)
Contribution of multi-chamber confinement to plastic energy dissipation
Table 3 presents the energy consumption index of specimens, energy consumption index of concrete, steel and total from CFST-C1 to CFST-C12. Figure 13 shows the energy dissipation of specimens, revealing the following:
(1)
Concrete-filled steel columns with three chambers exhibit remarkably higher plastic energy dissipation values, with a relatively small difference between two-chamber and single-chamber configurations. The average increases for two chambers, three chambers, and four chambers compared with a single chamber are −3.9%, 11.6%, and 22.6%, respectively. Because the vertical partition of the two-chamber steel tube is near the neutral axis, it is difficult to exert a large plastic energy consumption, and the energy consumption increase is limited. However, the three-chamber specimen can give full play to the energy dissipation performance of the partition itself; thus, the overall energy consumption of the component increases greatly.
(2)
The increase or decrease in component plastic energy dissipation is primarily influenced by the steel material; from single-chamber to four-chamber configurations, the steel material energy consumption ratios are 0.97, 0.98, 0.98, and 0.98 on average, respectively. The energy dissipation performance of the component is enhanced by the increase in the steel content.
(3)
The proportion of concrete energy dissipation in the component is relatively small; from single-chamber to four-chamber configurations, the average steel material energy consumption ratios are 0.03, 0.02, 0.02, and 0.02, respectively. The multi-chamber confinement does not considerably alter the energy dissipation of concrete.
(4)
The axial pressure ratio has a considerable effect on the plastic energy dissipation of the component; under equivalent conditions, CFST-C5–CFST-C8 is 9.54% larger than CFST-C1–CFST-C4. This result is consistent with the experimental results, indicating that to a certain extent, increasing the axial pressure ratio of the specimen can enhance its seismic energy dissipation performance.
(5)
For M-CFST columns with a large length–width ratio, the chamber arrangement should bring the long and short sides closer together.

5. Conclusions

This study created a three-dimensional solid FE model of an M-CFST column by using ABAQUS. The effects of chamber arrangement, axial pressure ratio, aspect ratio, and other parameters on the hysteresis performance of the specimens were investigated, and the effect on various seismic performance indicators was analyzed. The conclusions are as follows:
(1)
The FE model presented in this study can simulate the quasi-static behavior of CFST columns accurately. The calculated results are in good agreement with the measured values, as confirmed by verifying the factors of failure mode, load–displacement curves, and load–strain curves.
(2)
The FEA results illustrate that the maximum stress of the steel tube appears at the bottom in the arc region, which is consistent with the phenomenon of the steel tube bulging or even cracking. As shown in the compressive and tensile damage diagram of concrete, the concrete failure phenomenon at the bottom of the specimen is the most evident, which is consistent with the concrete failure after the test.
(3)
The energy dissipation of each column increases with the growth of analysis steps. The FEA results show that the steel material has the most important effect on plastic energy dissipation, and the proportion of concrete energy dissipation in the component is relatively small. FEA results indicate that as the axial pressure ratio increases, the contribution of multi-chamber confinement to enhancing the ultimate load-carrying capacity, ductility, and total plastic energy dissipation of multi-chamber confined circular steel tube concrete becomes more remarkable.
(4)
This study suggests that multi-chamber confinement can coordinate the work of the core concrete and the steel tube well. For circular steel tube concrete specimens with a large aspect ratio, the chambers must be arranged in a manner where the lengths of the long and short sides are closer.
(5)
The whole failure process and damage mechanism of the CFST columns under seismic loading at the microscale level deserve further research via a refined FEA model.

Author Contributions

Methodology, J.L., W.Y., Y.F. and Z.P.; Software, J.L. and W.Y.; Validation, J.L. and W.Y.; Resources, Y.F.; Data curation, J.L., W.Y. and Z.P.; Writing—review & editing, Y.F. and G.C.; Visualization, Z.P.; Supervision, G.C.; Project administration, G.C.; Funding acquisition, J.L. All authors have read and agreed to the published version of the manuscript.

Funding

This research is financially supported by the National Natural Science Foundation of China (Grant No. 52008159, 52278174), Hunan Education Department Foundation Funded Project (Grant No. 21A0504), and the Natural Science Foundation of Hunan Province (Grant No. 2022JJ30112), an aid program for science and technology innovative research teams in higher educational institutions of Hunan Province.

Data Availability Statement

The original contributions presented in the study are included in the article, further inquiries can be directed to the corresponding author.

Conflicts of Interest

The authors declare no conflict of interest.

References

  1. Zhao, H.; Zhang, W.H.; Hou, C.C.; Lam, D. Axial compression behaviour of round-ended recycled aggregate concrete-filled steel tube stub columns (RE-RACFST): Experiment, numerical modeling and design. Eng. Struct. 2022, 276, 115376. [Google Scholar] [CrossRef]
  2. Wang, J.F.; Shen, Q.H. Numerical analysis and design of thin-walled RECFST stub columns under axial compression. Thin-Walled Struct. 2023, 129, 166–182. [Google Scholar] [CrossRef]
  3. Ding, F.X.; Fu, L.; Liu, X.M.; Liu, J. Mechanical performances of track-shaped rebar stiffened concrete-filled steel tubular (SCFRT) stub columns under axial compression. Thin-Walled Struct. 2016, 99, 168–181. [Google Scholar] [CrossRef]
  4. Wei, J.G.; Ying, H.D.; Yang, Y.; Zhang, W.; Bao, C.G. Experimental and numerical investigation of the seismic performance of concrete-filled steel tubular composite columns with UHPC plates. Structures 2023, 58, 105445. [Google Scholar] [CrossRef]
  5. Zhou, T.; Li, C.; Chen, Z.; Chen, H.; Guo, W.; Zhang, P. Quasi static behavior of specially shaped columns composed of concrete-filled steel tube frame-double steel concrete composite walls. J. Constr. Steel Res. 2021, 183, 106730. [Google Scholar] [CrossRef]
  6. Zhao, P.T.; Huang, Y.; Liu, Z.Z.; Liu, Y.Y.; Wang, H. Experimental study on seismic performance of hybrid steel-polypropylene fiber-reinforced recycled aggregate concrete-filled circular steel tube columns. Constr. Build. Mater. 2022, 359, 129413. [Google Scholar] [CrossRef]
  7. Xu, Q.Y.; Sun, H.; Ding, F.X.; Lyu, F. Analysis of ultimate seismic performance of thin-walled concrete-filled steel tube bridge piers under dynamic load. Eng. Struct. 2023, 292, 116544. [Google Scholar] [CrossRef]
  8. Chen, H.R.; Wang, L.; Chen, H.T.; Cui, W.B. Experimental study on the seismic behavior of prefabricated L-shaped concrete-filled steel tube with rectangular multi-cell columns under different lateral loading directions. J. Constr. Steel Res. 2021, 177, 106480. [Google Scholar] [CrossRef]
  9. Zhang, W.; Li, G.; Xiong, Q.Q.; Gui, H.W. Seismic behavior of wide-limb special-shaped columns composed of concrete-filled steel tubes. J. Constr. Steel Res. 2023, 205, 107887. [Google Scholar] [CrossRef]
  10. Liang, Y.M.; Shen, Q.H.; Wang, J.F.; Ma, X.F. Investigations on the seismic behaviour of concrete-filled thin-walled elliptical steel tubular column: Testing and novel FE modelling. Thin-Walled Struct. 2023, 191, 111029. [Google Scholar] [CrossRef]
  11. Han, L.-H. Concrete Filled Steel Tubular Structures-Theory and Practice; Sicence Press: Beijing, China, 2016. [Google Scholar]
  12. Sun, H.; Ci, M.; Zheng, B.; Yang, H.; Wang, W.; Wang, S. Seismic behavior and mechanism of rectangular steel-concrete composite column with three cavities. J. Constr. Steel Res. 2023, 212, 108299. [Google Scholar] [CrossRef]
  13. Wang, Y.H.; Guo, L.H.; Li, H.D.; Shafaei, S.; Yu, Y. Lateral load response of L-shaped steel–concrete composite shear walls using multi-partition steel tube. Eng. Struct. 2023, 293, 116671. [Google Scholar] [CrossRef]
  14. Liu, W.H.; Guo, Y.L.; Tian, Z.H.; Yang, X.; Li, J.Y. Experimental and numerical study of T-shaped irregularly concrete-filled steel tube columns under combined axial loads and moments. J. Build. Eng. 2023, 65, 105796. [Google Scholar] [CrossRef]
  15. Guo, Z.; Chen, Y.; Wang, Y.; Jiang, M.Y. Experimental study on square concrete-filled double skin steel tubular short columns. Thin-Walled Struct. 2020, 156, 107017. [Google Scholar] [CrossRef]
  16. Wu, H.P.; Han, X.D.; Meng, C.; Wang, X.M.; Gan, D.; Shen, Z.H. United composite strength calculation method for special-shaped CFST columns with multiple cavities. Structures 2023, 58, 105491. [Google Scholar] [CrossRef]
  17. Cheng, R.; Hu, C.; Gong, M.L.; Wang, Y.H. Behaviors of improved multi-cell T-shaped concrete-filled steel tubular columns under eccentric loads. J. Constr. Steel Res. 2022, 193, 107251. [Google Scholar] [CrossRef]
  18. Liu, J.; Yu, W.Z.; Fang, Y.W.; Pan, Z. Experimental study on the seismic performance of concrete-filled steel tube columns with a multiple-chamber round-ended cross-section. Front. Mater. 2024, 11, 1363206. [Google Scholar] [CrossRef]
  19. JGJ/T 101-2015; Specification for Seismic Test of Buildings. Architecture and Building Press: Beijing, China, 2015.
  20. Ding, F.X.; Yin, G.A.; Wang, L.P.; Hu, D.; Chen, G.Q. Seismic performance of a non-through-core concrete between concrete-filled steel tubular columns and reinforced concrete beams. Thin-Walled Struct. 2017, 110, 14–26. [Google Scholar] [CrossRef]
  21. Ding, F.X.; Ying, X.Y.; Zhou, L.C.; Yu, Z.W. Unified calculation method and its application in determining the uniaxial mechanical properties of concrete. Front. Archit. Civ. Eng. China 2011, 5, 381. [Google Scholar] [CrossRef]
Figure 1. Cross-sections of composite columns. (a) Single chamber, (b) 2 chambers, (c) 3 chambers, (d) 4 chambers.
Buildings 14 01154 g001
Figure 2. Loading diagram of the device. (a) Schematic diagram of the pseudo-static test loading device, (b) testing site of the pseudo-static test loading device.
Buildings 14 01154 g002
Figure 3. Model element. (a) Concrete, (b) steel tube and stiffener, (c) overall element.
Buildings 14 01154 g003
Figure 4. Comparison between test failure and FE simulation of CFST-C9 specimen [18]. (a) Experiment photograph, (b) specimen before cutting steel tube, (c) specimen after cutting steel tube, (d) stress nephogram, (e) concrete compression damage nephogram, (f) concrete tension damaged nephogram.
Buildings 14 01154 g004aBuildings 14 01154 g004b
Figure 5. Comparison between load–deformation hysteresis curves of calculated and tested M-CFST columns [18]. (a) CFST-C1, (b) CFST-C2, (c) CFST-C3, (d) CFST-C4, (e) CFST-C5, (f) CFST-C6, (g) CFST-C7, (h) CFST-C8, (i) CFST-C9, (j) CFST-C10, (k) CFST-C11, (l) CFST-C12.
Buildings 14 01154 g005aBuildings 14 01154 g005b
Figure 6. Comparison between load–deformation skeleton curves of calculated and tested M-CFST columns [18]. (a) CFST-C1, (b) CFST-C2, (c) CFST-C3, (d) CFST-C4, (e) CFST-C5, (f) CFST-C6, (g) CFST-C7, (h) CFST-C8, (i) CFST-C9, (j) CFST-C10, (k) CFST-C11, (l) CFST-C12.
Buildings 14 01154 g006aBuildings 14 01154 g006b
Figure 7. Comparison between FEA and tested load–strain curve of CFST-C1 [18]. (a) Hoop strain of arc midpoint, (b) vertical strain of arc midpoint, (c) hoop strain of corner, (d) vertical strain of corner, (e) hoop strain of straight-edge midpoint, (f) vertical strain of straight-edge midpoint.
Buildings 14 01154 g007
Figure 8. Comparison between FEA and tested load–lateral deformation coefficient of CFST-C1 [18]. (a) Arc midpoint, (b) corner, (c) straight-edge midpoint.
Buildings 14 01154 g008
Figure 9. Concrete compression damage (DAMAGEC) nephogram. (a) 8 mm, (b) 16 mm, (c) 24 mm, (d) 32 mm, (e) 40 mm, (f) 48 mm, (g) 56 mm, (h) 64 mm, (i) 72 mm, (j) 80 mm.
Buildings 14 01154 g009
Figure 10. Concrete strain damage (DAMAGET) nephogram. (a) 8 mm, (b) 16 mm, (c) 24 mm, (d) 32 mm, (e) 40 mm, (f) 48 mm, (g) 56 mm, (h) 64 mm, (i) 72 mm, (j) 80 mm.
Buildings 14 01154 g010
Figure 11. Steel stress (Mises) nephogram. (a) 8 mm, (b) 16 mm, (c) 24 mm, (d) 32 mm, (e) 40 mm, (f) 48 mm, (g) 56 mm, (h) 64 mm, (i) 72 mm, (j) 80 mm.
Buildings 14 01154 g011
Figure 12. Plastic energy dissipation values of specimens. (a) CFST-C1~C4, (b) CFST-C5~C8, (c) CFST-C9~C12.
Buildings 14 01154 g012
Figure 13. Energy dissipation of specimens. (a) Concrete energy dissipation, (b) steel energy dissipation, (c) total energy dissipation.
Buildings 14 01154 g013
Table 1. Test parameters of composite columns.
No.SpecimenB × D × t × H/mmChamber Arrangementnfsfcuρs
1CFST-C1228 × 114 × 3 × 1150Single chamber0.135945.27.58
2CFST-C2228 × 114 × 3 × 1150Two chambers0.135945.29.05
3CFST-C3228 × 114 × 3 × 1150Three chambers0.135945.210.53
0.3
0.1
0.3
4CFST-C4228 × 114 × 3 × 1150Four chambers0.135945.212.00
5CFST-C5228 × 114 × 3 × 1150Single chamber0.335945.27.58
6CFST-C6228 × 114 × 3 × 1150Two chambers0.335945.29.05
7CFST-C7228 × 114 × 3 × 1150Three chambers0.335945.210.53
8CFST-C8228 × 114 × 3 × 1150Four chambers0.335945.212.00
9CFST-C9342 × 114 × 3 × 1650Single chamber0.135945.26.75
10CFST-C10342 × 114 × 3 × 1650Two chambers0.135945.27.69
11CFST-C11342 × 114 × 3 × 1650Three chambers0.135945.28.64
12CFST-C12342 × 114 × 3 × 1650Four chambers0.135945.210.53
Table 2. CFST column damage information.
No.Cyclic Maximum DisplacementMaximum Value of Concrete Compression DamageMaximum Value of Concrete Tensile DamageMaximum Value of Steel Stress/MPa
18 mm0.3390.992364.0
216 mm0.9550.992389.8
324 mm0.9910.992423.9
432 mm0.9930.992422.6
540 mm0.9930.992455.2
648 mm0.9930.992467.0
756 mm0.9930.992485.7
864 mm0.9930.992491.6
972 mm0.9930.992495.6
1080 mm0.9930.992504.8
Table 3. Energy consumption index of specimens (kJ).
No.Specimen Chamber ArrangementAxial Compression RatioConcrete (kJ)Steel (kJ)ALL (kJ)
1CFST-C1Single chamber0.11.1240.0741.19
2CFST-C2Two chambers0.10.7937.3238.11
3CFST-C3Three chambers0.11.0345.1046.13
4CFST-C4Four chambers0.10.9049.7350.63
5CFST-C5Single chamber0.31.4242.9544.37
6CFST-C6Two chambers0.31.1441.9643.10
7CFST-C7Three chambers0.31.4048.1749.57
8CFST-C8Four chambers0.31.0354.7955.82
9CFST-C9Single chamber0.12.3784.1986.56
10CFST-C10Two chambers0.12.1483.3585.49
11CFST-C11Three chambers0.12.3093.7696.06
12CFST-C12Four chambers0.11.86101.20103.05
Disclaimer/Publisher’s Note: The statements, opinions and data contained in all publications are solely those of the individual author(s) and contributor(s) and not of MDPI and/or the editor(s). MDPI and/or the editor(s) disclaim responsibility for any injury to people or property resulting from any ideas, methods, instructions or products referred to in the content.

