Article

Energy Performance and Comfort Analysis of Three Glazing Materials with Distinct Thermochromic Responses as Roller Shade Alternative in Cooling- and Heating-Dominated Climates

1
Department of Building Environment and Energy Engineering, The Hong Kong Polytechnic University, Hong Kong, China
2
Department of Mechanical Engineering, The Hong Kong Polytechnic University, Hong Kong, China
*
Author to whom correspondence should be addressed.
Buildings 2024, 14(4), 1157; https://doi.org/10.3390/buildings14041157
Submission received: 27 March 2024 / Revised: 12 April 2024 / Accepted: 16 April 2024 / Published: 19 April 2024

Abstract

:
Thermochromic (TC) smart windows are a leading passive building design strategy. Vanadium dioxide (VO2), hydrogel and TC-Perovskite glazing, which constitute the main categories of TC materials, modulate different wavelength regions. Although numerous studies have reported on these TC glazings’ energy-saving potential individually, there is a lack of data comparing their energy efficiencies. Moreover, their suitability as an alternative to dynamic solar shading mechanisms remains unexplored. Using building energy simulation, this study found that a hydrogel glazing with broadband thermochromism can save more energy (22–24% savings on average) than opaque roller shades (19–20%) in a typical office in both New York and Hong Kong. VO2 glazing performed comparably to translucent roller shades (14–16% savings), except when used in poorly daylit conditions. TC-Perovskite was a poor replacement for roller shades (~2% savings). The window-to-wall ratio (WWR) that allowed both energy savings and optimal natural light penetration was also identified for each glazing. Hydrogel glazing demonstrated both energy and daylight efficiency in Hong Kong’s cooling-dominated climate when used in 40–50% WWR configurations. In New York’s colder conditions, VO2 glazing did so for higher WWRs (50–70%). Roller shades could also achieve simultaneous energy savings and visual comfort, but only for highly glazed facades (up to 80%).

1. Introduction

With climate change giving rise to existential threats like food insecurity, extreme weather events, disease outbreaks and rising sea levels, many countries have pledged to adopt greener energy practices in a bid to reduce their greenhouse gas emissions [1]. Since the building sector accounts for nearly 40% of global energy use (predicted to reach 50% by 2030) [2], for most, the roadmap to meeting these emissions targets and sustainability goals involves the introduction of zero-energy buildings. As such, now more than ever, energy efficiency has become a key feature of building design. This includes passive strategies that focus on elements of the building envelope: the exterior windows and walls, roof and foundation. Of these, windows have a significantly larger (up to five times [3]) overall heat transfer coefficient (U-value) and account for approximately 60% of the energy wasted in a building [4]. Therefore, energy conservation efforts in buildings have largely focused on the design of their fenestration systems, including but not limited to their placement and orientation [5], window-to-wall ratio (WWR) [6,7], shading mechanisms [8,9], daylighting control [10,11], and framing [12,13] and glazing materials [14,15,16].
In recent years, there has been a gradual shift away from conventional clear glass windows towards dynamic glazing materials. These smart windows modulate incident solar radiation by reversibly ‘switching’ between a clear and tinted state in response to external stimuli like light (photochromism), electricity (electrochromism), gas (gasochromism), or heat (thermochromism). Thermochromic (TC) smart windows, in particular, have garnered considerable attention, as their adaptive response to ambient temperature can be leveraged to passively reduce heating penalties and cooling demand in winter and summer, respectively. Ideally, windows should exhibit excellent solar modulation efficiency, ΔTsol (i.e., high contrast in solar transmittance, Tsol between its cold and hot states), while maintaining high (preferably > 70% [17]) visible light transmittance (Tlum) and minimal colour distortion. Additionally, a low critical transition temperature, Tc (the temperature at which the glazing ‘switches’), narrow hysteresis width and rapid transition kinetics are desirable.
The most widely studied TC material is Vanadium dioxide (VO2). It undergoes a metal-to-semiconductor transition at 68 °C. This is accompanied by changes in the material’s optical properties in the near-IR (NIR: 0.8–2.5 μm) region; the semi-metallic phase is relatively transparent to NIR radiation, while the semiconducting phase is more opaque. Its visible spectrum remains relatively unchanged. The high Tc of bulk-like VO2 precludes its use in building applications. However, the introduction of dopants like tungsten, aluminium and magnesium has been found to lower the Tc to a more practical range [18,19,20]. One limitation of VO2-based films as a smart window glazing material is its inherently low Tlum due to strong intra- and inter-band absorption in the visible region (0.38–0.7 μm) [21]. Moreover, these films exhibit negative thermal infrared (TIR: 3–14 μm) regulation when coated on glass, i.e., their thermal emittance is low at elevated temperatures, yet high at lower temperatures [22].
Thermochromic hydrogels, an emerging thermo-responsive material for smart windows, operate on the principle of sol–gel transition, i.e., hydrophilic-to-hydrophobic transition. They consist of crosslinked polymers in a solvent. Below their lower critical solution temperature (LCST), hydrogen bonds exist between the polymer chains and surrounding solvent molecules. As the temperature exceeds the LCST, these hydrogen bonds are overcome, and the polymer chains precipitate, forming clusters that scatter incident light. This reduces the hydrogel’s transparency. Typically, the spectrum modulation involves both the visible and NIR ranges, i.e., broadband thermochromism. Depending on the composition of the hydrogel, this modulating behaviour can be extended to TIR radiation too [22]. Positive thermal infrared regulation is a feature exclusive to hydrogel TC glazing. Poly(N-isopropylacrylamide) (PNIPAm) stands out as the most promising hydrogel smart glazing material, primarily due to its high ΔTsol and narrow hysteresis [23]. However, there are concerns about the long-term stability of hydrogels, especially given the susceptibility of the liquid phase to leaking, drying out and/or freezing in certain weather conditions [24].
Thermochromic Perovskites (TC-Perovskites), another class of smart material, have also been extensively studied as a window glazing. Their solar modulation is concentrated in the visible and ultraviolet (UV) regions [25]. In both the clear and tinted states, the glazing material is highly transparent to NIR, which accounts for 43% of solar radiation. This hampers its thermoregulatory performance. While many TC-Perovskites have been discussed in the literature, there has been a particular focus on humidity-stimulated halide Perovskites [26,27,28,29,30]. The thermochromic behaviour of this type of TC-Perovskite has been attributed to a reversible hydration/dehydration process in the presence of moisture. Therefore, the glazing material’s Tc can be controlled by tuning the relative humidity. Other less popular thermo-responsive materials for smart windows include liquid crystals and ionic liquids [31].
TC glazings are typically characterised by their Tc, ΔTsol and Tlum values. However, these optical indices alone are not enough to conclusively evaluate their energy-saving potential. Saeli et al. reported the first building simulation study that applied energy modelling to assess TC smart windows, using the spectra of existing commercial TC products and an ideal TC film [32]. Many such energy-saving analyses of TC smart windows have since been conducted, looking at variable parameters like transition temperature [33], WWR [34], climate and orientation [35]. Additionally, different performance indicators like thermal and visual comfort (daylighting, illuminance and glare) have been investigated [34,36,37]. However, some gaps in the research still remain. Firstly, most studies are standalone assessments that focus on an individual glazing [25,34,38]. The lack of consistency in the building models, HVAC (heating, ventilation and air conditioning) settings, TC window layering type and configurations used across studies makes it challenging to draw meaningful comparisons between different TC technologies. Secondly, in some studies, the TC smart window is benchmarked against a static glazing material without an active solar shading mechanism (blinds, roller shades, etc.) [39,40,41]. Not only does this baseline exaggerate the energy-saving performance, but it is also not representative of real applications where it is necessary to adopt some sort of shading system to counter glare discomfort during peak insolation. To this end, this study examined (1) the relative energy savings from three different TC glazing technologies from the literature, each targeting a different wavelength region, namely VO2 (NIR), hydrogel (visible, NIR and TIR) and TC-Perovskite (UV and visible); and (2) their potential as a substitute for conventional solar shades in cooling- and heating-dominated climates: Hong Kong and New York. The optimal Tc of a smart glazing is unique to the region of the spectrum it modulates [42], the building type and the local climate [43]. To allow for a fair comparison, all TC glazing films in the study have a shared Tc of 30 °C. This means that any differences in energy-saving performance can be solely attributed to the spectral properties of the TC glazing.
Energy code requirements for buildings have become stricter in recent code cycles with the introduction of ‘envelope backstops’ that define a mandatory minimum performance for the building envelope independent of other building design considerations. As a result, the practice of relying on advanced HVAC systems and LED lighting to compensate for building envelopes that fail to meet code standards, especially those with high WWRs, is no longer feasible. Therefore, this study also assessed the energy-saving efficiency of the high-performance TC glazing materials for larger-than-average window areas (WWRs), including the impact of orientation (the four cardinal directions) and implications for daylighting and visual comfort. The optimal WWR for which both daylighting and energy efficiency were achieved simultaneously was also identified.

2. Materials and Methods
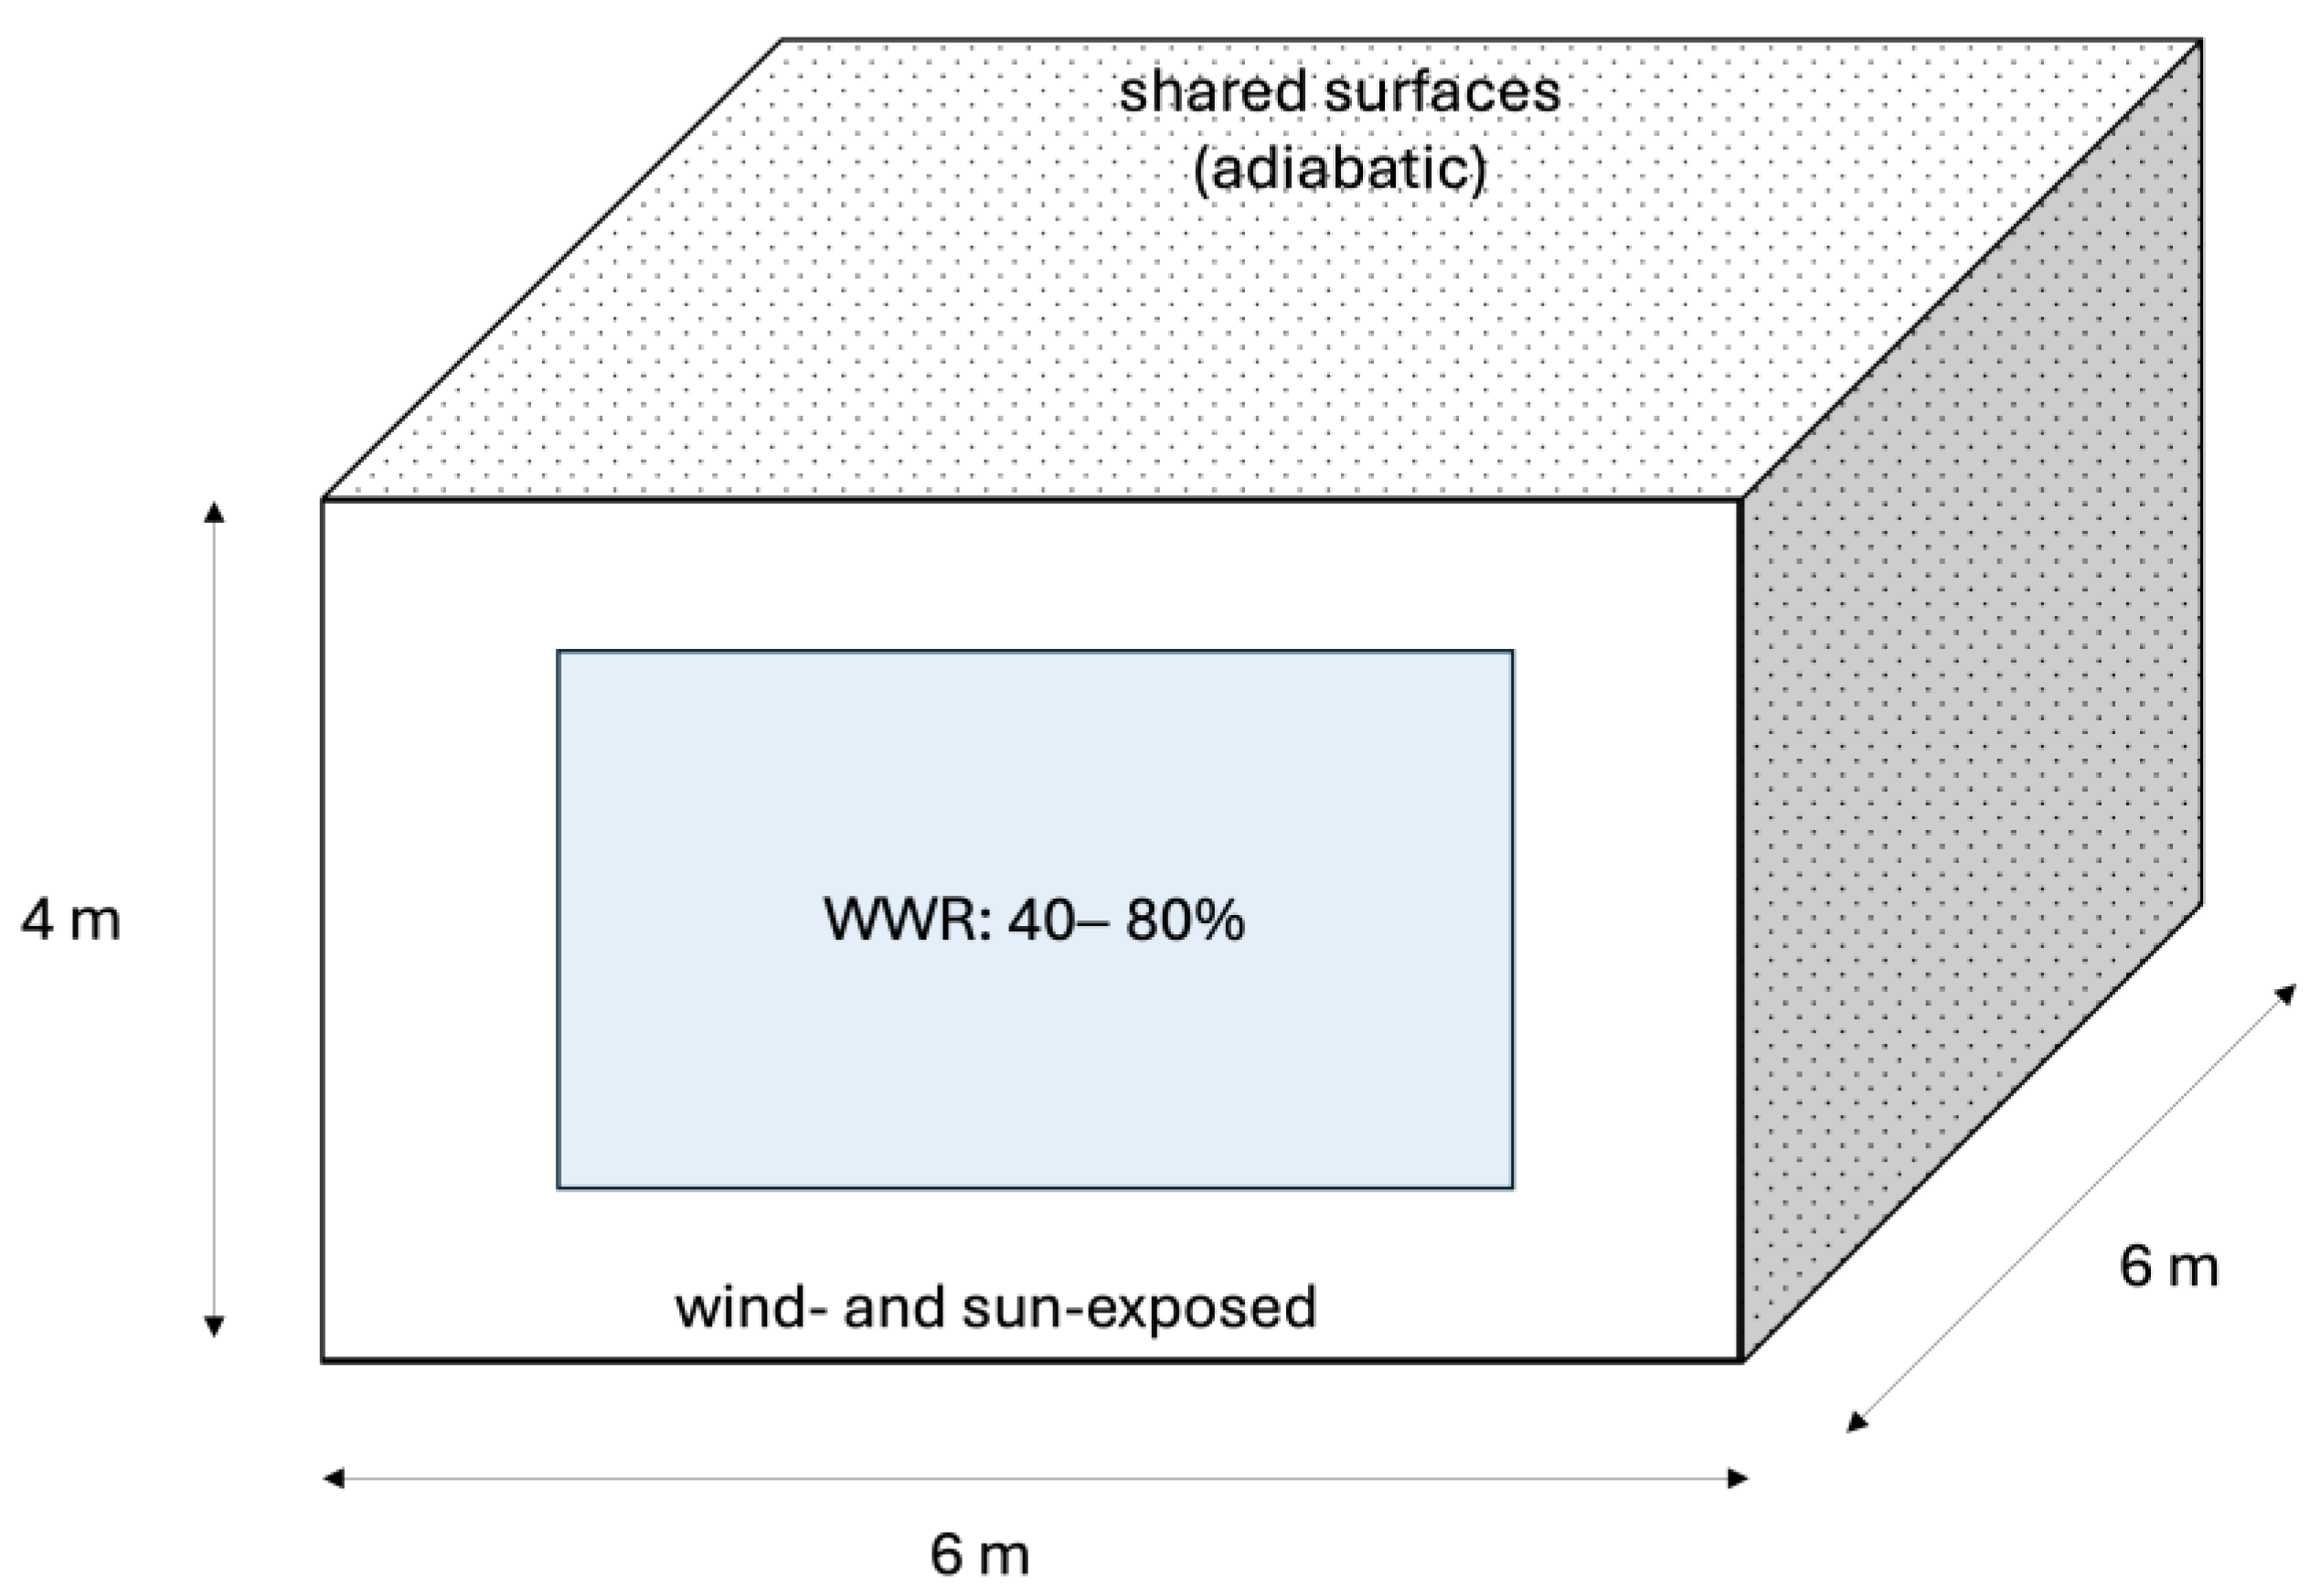
EnergyPlus [44], the opensource building energy simulation engine developed by the US Department of Energy and Lawrence Berkely National Laboratory (LBNL), was used to conduct a series of simulations to assess the energy-saving performance of different TC glazing films and solar shading mechanisms (namely, roller shades). Previous studies have found that the climate plays a major role in the energy-saving performance of TC glazing [32]. The number of hours the glazing spends in its tinted (hot) state depends on ambient conditions, among other factors. As such, a heating-dominated (New York) and cooling-dominated climate (Hong Kong) were both considered in this work (see Table 1). Additionally, window parameters like WWR and orientation were studied.

2.1. Model

A room measuring 6 m (width) × 6 m (length) × 4 m (height) was built using SketchUp (Figure 1). It was designed to represent a typical office with an exterior window. The room was located on an intermediate floor of a multistorey building in the northern hemisphere. The fenestrated wall was set to be sun-/wind-exposed. The other room surfaces were considered adiabatic, i.e., no heat exchange through the shared surfaces because the adjacent spaces would be maintained at the same indoor conditions. A range of window configurations including placement (north-, east-, south- and west-facing) and WWRs (40–80%, corresponding to window areas of 9.6–19.2 m2) were modelled.
The space is conditioned by a 2-speed DX cooling unit and a gas furnace (80% efficiency) operating at cooling and heating setpoints of 24 °C and 21 °C, respectively, during office hours. Schedules for occupancy and lighting were set according to the ASHRAE 90.1-2022 standard [45]. Daylight sensors, placed at incremental distances from the window, were used to dim/turn off the artificial lighting throughout the day depending on the natural light availability, to meet the setpoint illuminance level of 500 lux on the work plane.
The thermal properties of the building envelope were customised to comply with the distinct prescriptive criteria for different climate zones. Excluding the window units, materials were chosen from the Building Component Library of OpenStudio to construct a building envelope with overall U-values in line with ASHRAE 90.1-2022 for the corresponding climate zone. The materials and construction assembly of the opaque envelope of the models are listed in Table 2. Extruded polystyrene (XPS) was used for wall insulation in the New York office model [46].
In EnergyPlus, the window heat and light flow calculations use a layer-wise approach that relies on ISO 15099 algorithms [44]. Its thermochromic glazing module was used to model the switching behaviour of the smart windows. During simulation, the spectral properties of the glazing are assigned based on the surface temperature calculated for the previous timestep (to account for delayed tinting). For simplicity, the model assumes two discrete states (tinted/bleached), although, in reality, the transition between the two is continuous.

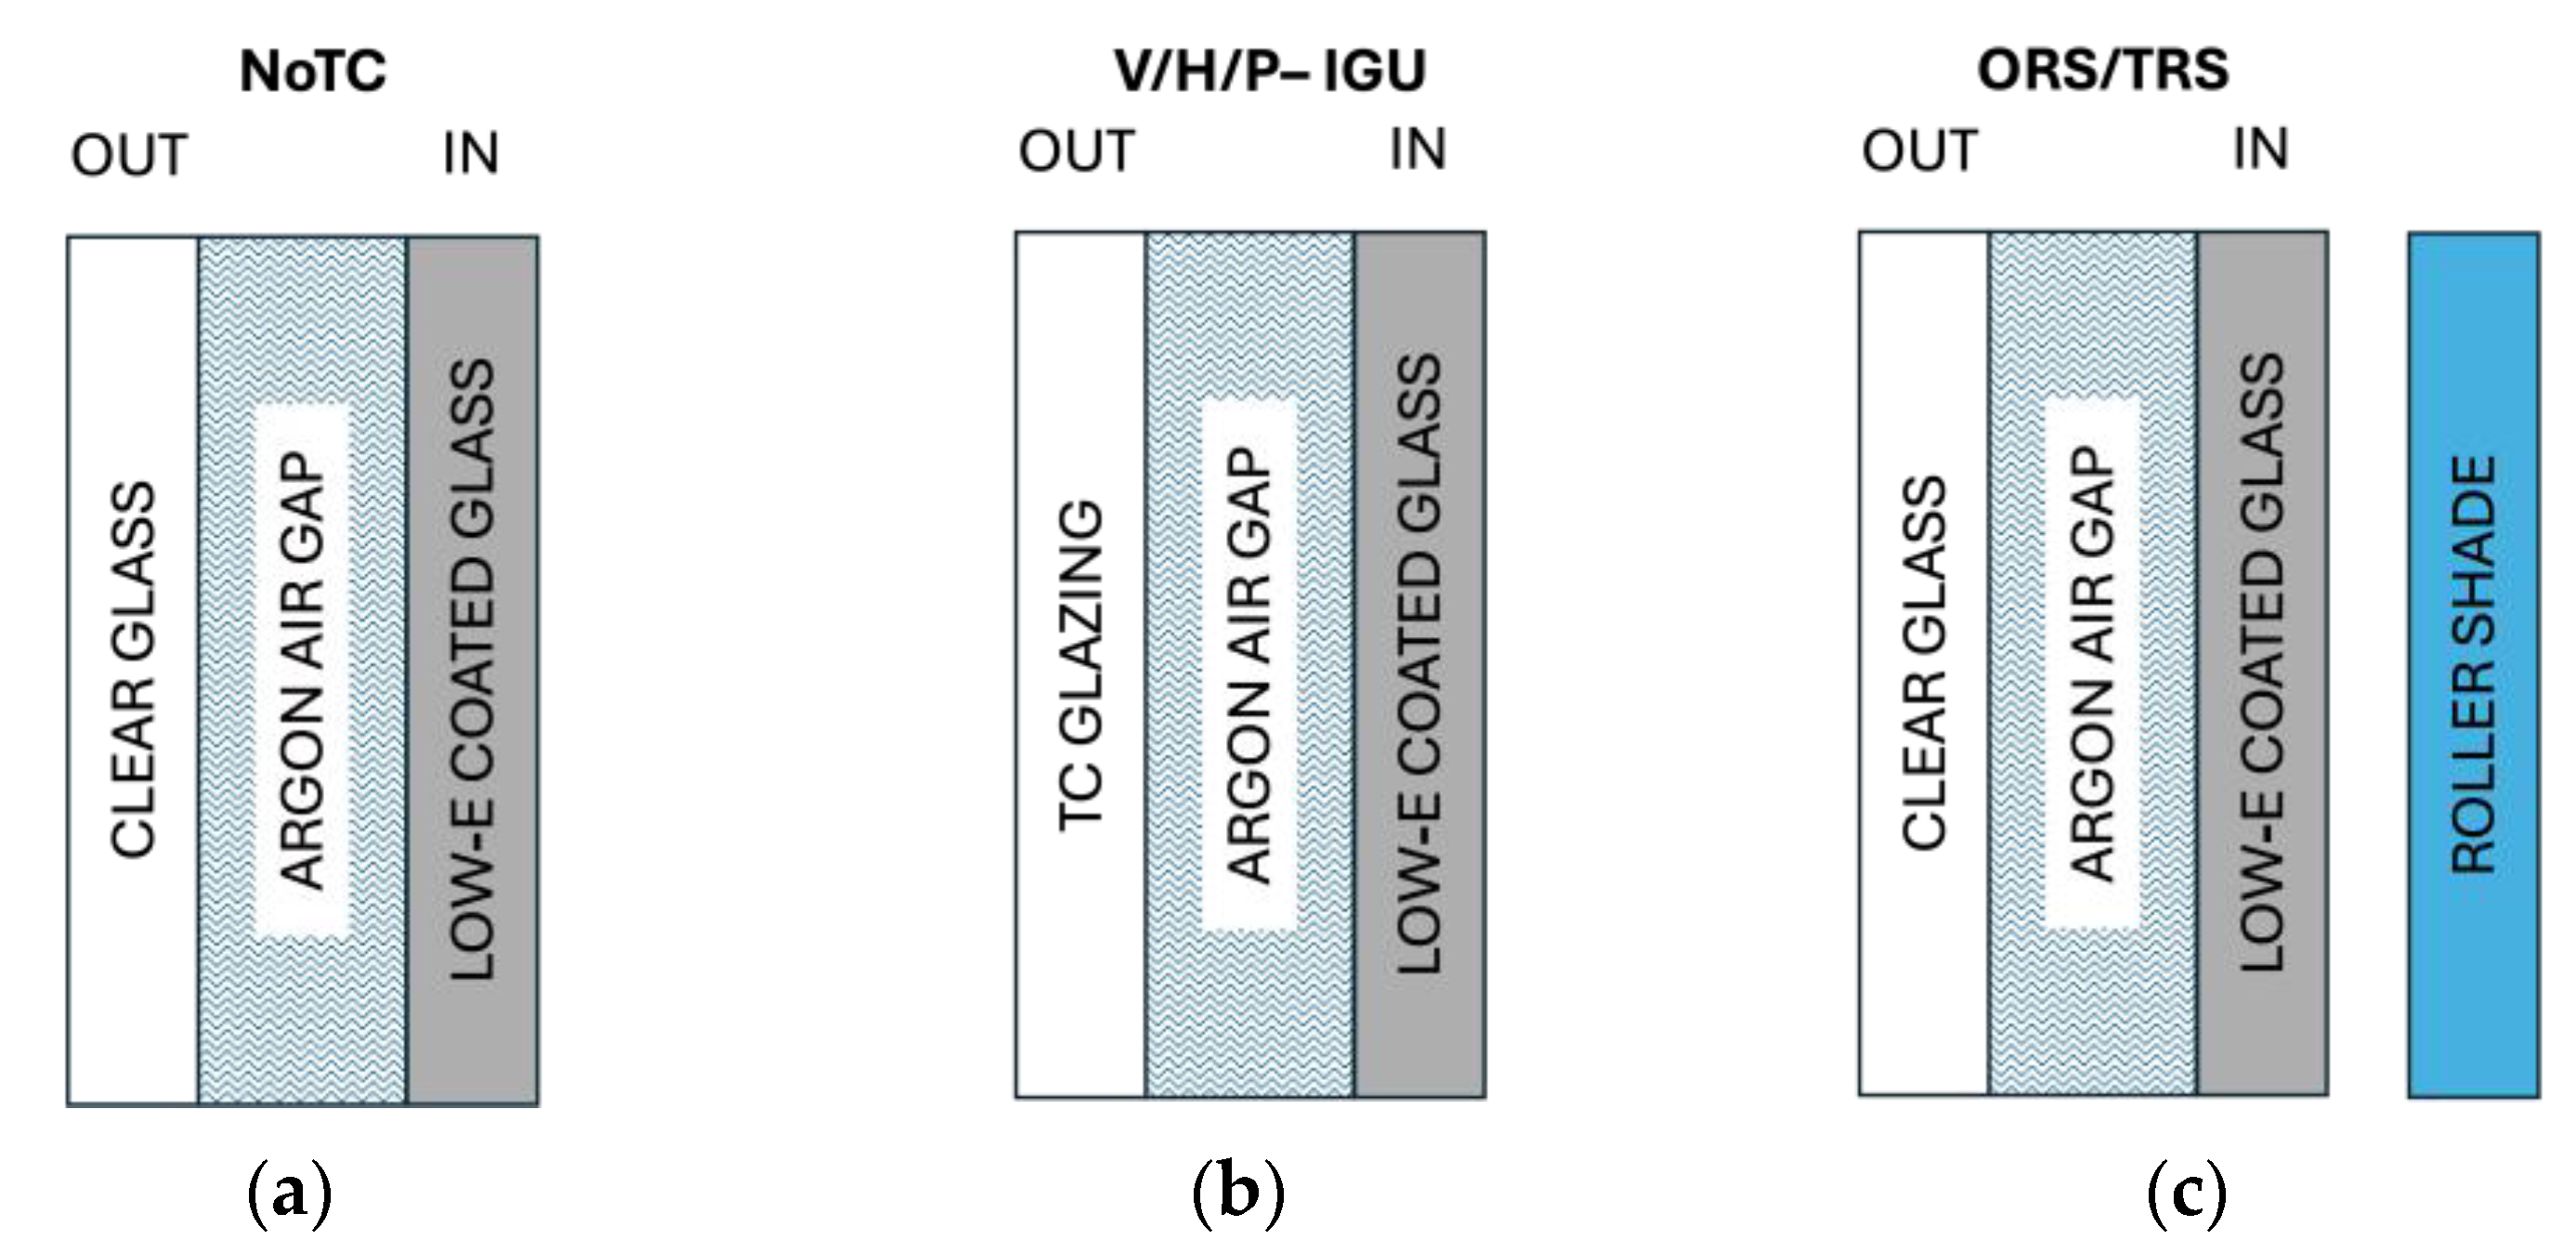
2.2. Window Configuration

Conventionally, window constructions utilise insulated glass units (IGUs). The building model in this study used such IGUs with a glass inboard layer with low-emittance coating to maximise thermal efficiency. The TC glazing formed the outboard layer of the IGU (Figure 2). A tungsten-doped VO2 thin film [47], polymerised PNIPAm with an Ag nanowire mesh that facilitates thermal tuning [22], and an organic hybrid halide TC-Perovskite (HMAPbI3-xClx, HMA: hydrated methylammonium) [26] were chosen to represent the three main TC glazing technologies. The transmittance spectra of the glazing are shown in Figure 3. The VO2, hydrogel and TC-Perovskite-incorporated IGUs will henceforth be referred to as VIGU, HIGU and PIGU, respectively. All abbreviations in the text are defined alphabetically in the Abbreviations Section. An IGU with a clear glass inoutboard layer (NoTC) will serve as the reference against which the savings of the smart windows are calculated. The properties of the glazing materials are summarised in Table 3. The low-emittance and clear glass panels’ properties were obtained from the International Glazing Database maintained by LBNL. The TC glazings’ properties were calculated using the reported transmittance/reflectance spectra according to Equations (1)–(3) [31].
X l u m = 0.38 μ m 0.7 μ m y ¯ λ X λ d λ 0.38 μ m 0.7 μ m y ¯ λ d λ
X s o l = 0.3   μ m     2.5 μ m A M 1.5 λ X λ d λ 0.3 μ m   2.5 μ m A M 1.5 λ d λ
T + R + A = 1
where λ is the wavelength and X is the transmittance (T), reflectance (R) or absorptance (A). The CIE photopic luminous efficiency function for the human eye y ¯ and AM1.5, the solar energy spectrum corresponding to 1.5 atmosphere thickness, were used as weighting functions.
A shading strategy that alleviates the cooling load and improves daylight exploitation is also a feature of typical fenestration systems. Interior roller shades are commonly used for this purpose. In this study, two interior roller shades (RSs) with different degrees of transparency (translucent, RSt, and opaque, RSo) were considered to accommodate building designers’ aesthetic preferences and the occupants’ desired level of privacy and natural light. Their properties are summarised in Table 3. Roller shades require regular maintenance, can be cumbersome (especially for large windows), and completely obstruct the view when deployed. TC windows, however, maintain some visibility in the tinted state, and standard window-cleaning procedures are sufficient for maintenance. Moreover, roller shades are operated manually/actively, while TC smart windows function passively, i.e., do not require additional energy. It is expected that roller shades would interfere with the operation of TC smart windows (their transition is temperature dependent) and negate their visibility benefit if used together. Therefore, their combined effect was not investigated. Instead, the focus was on the feasibility of TC glazing as an alternative to roller shades. A manual glare control strategy was implemented for the roller shades, where it was deployed (pulled down) at the instant the glare discomfort exceeded the setpoint value. This threshold value for avoiding glare was defined as the maximum luminance value of the scene: 2500 cd/m2 [48,49]. The shades were assumed to remain lowered until 5 am the next morning, similar to the approach reported by Hoffman et al. [33].

2.3. Thermal and Lighting Simulations

The TC IGUs are expected to affect solar heat gain/loss and thereby the thermal energy efficiency of the building, i.e., energy used for heating and cooling. They also influence the quality and availability of indoor daylighting. EnergyPlus reports the energy used for heating, cooling and ventilation by numerical simulation. In addition to simulating thermal loads and energy use, EnergyPlus uses simple daylight factor interpolation (split-flux method) for daylighting calculation, allowing lighting energy use to be evaluated as well. The UDI (useful daylight illuminance) was used as the metric for daylighting performance. This index was first introduced by Nabil and Mardaljevic [50] and uses the horizontal daylight illuminance at a reference point to gauge the percentage of occupied time that the illuminance meets a specified range, the boundaries of which depend on the occupants’ behaviour and preferences. Both too much and too little light can cause visual discomfort. Therefore, following the approach of Liang et al. [34], three illuminance ranges were defined, and the UDI during working hours (08:00–17:00) on weekdays was classified into the respective bins during simulation runtime:
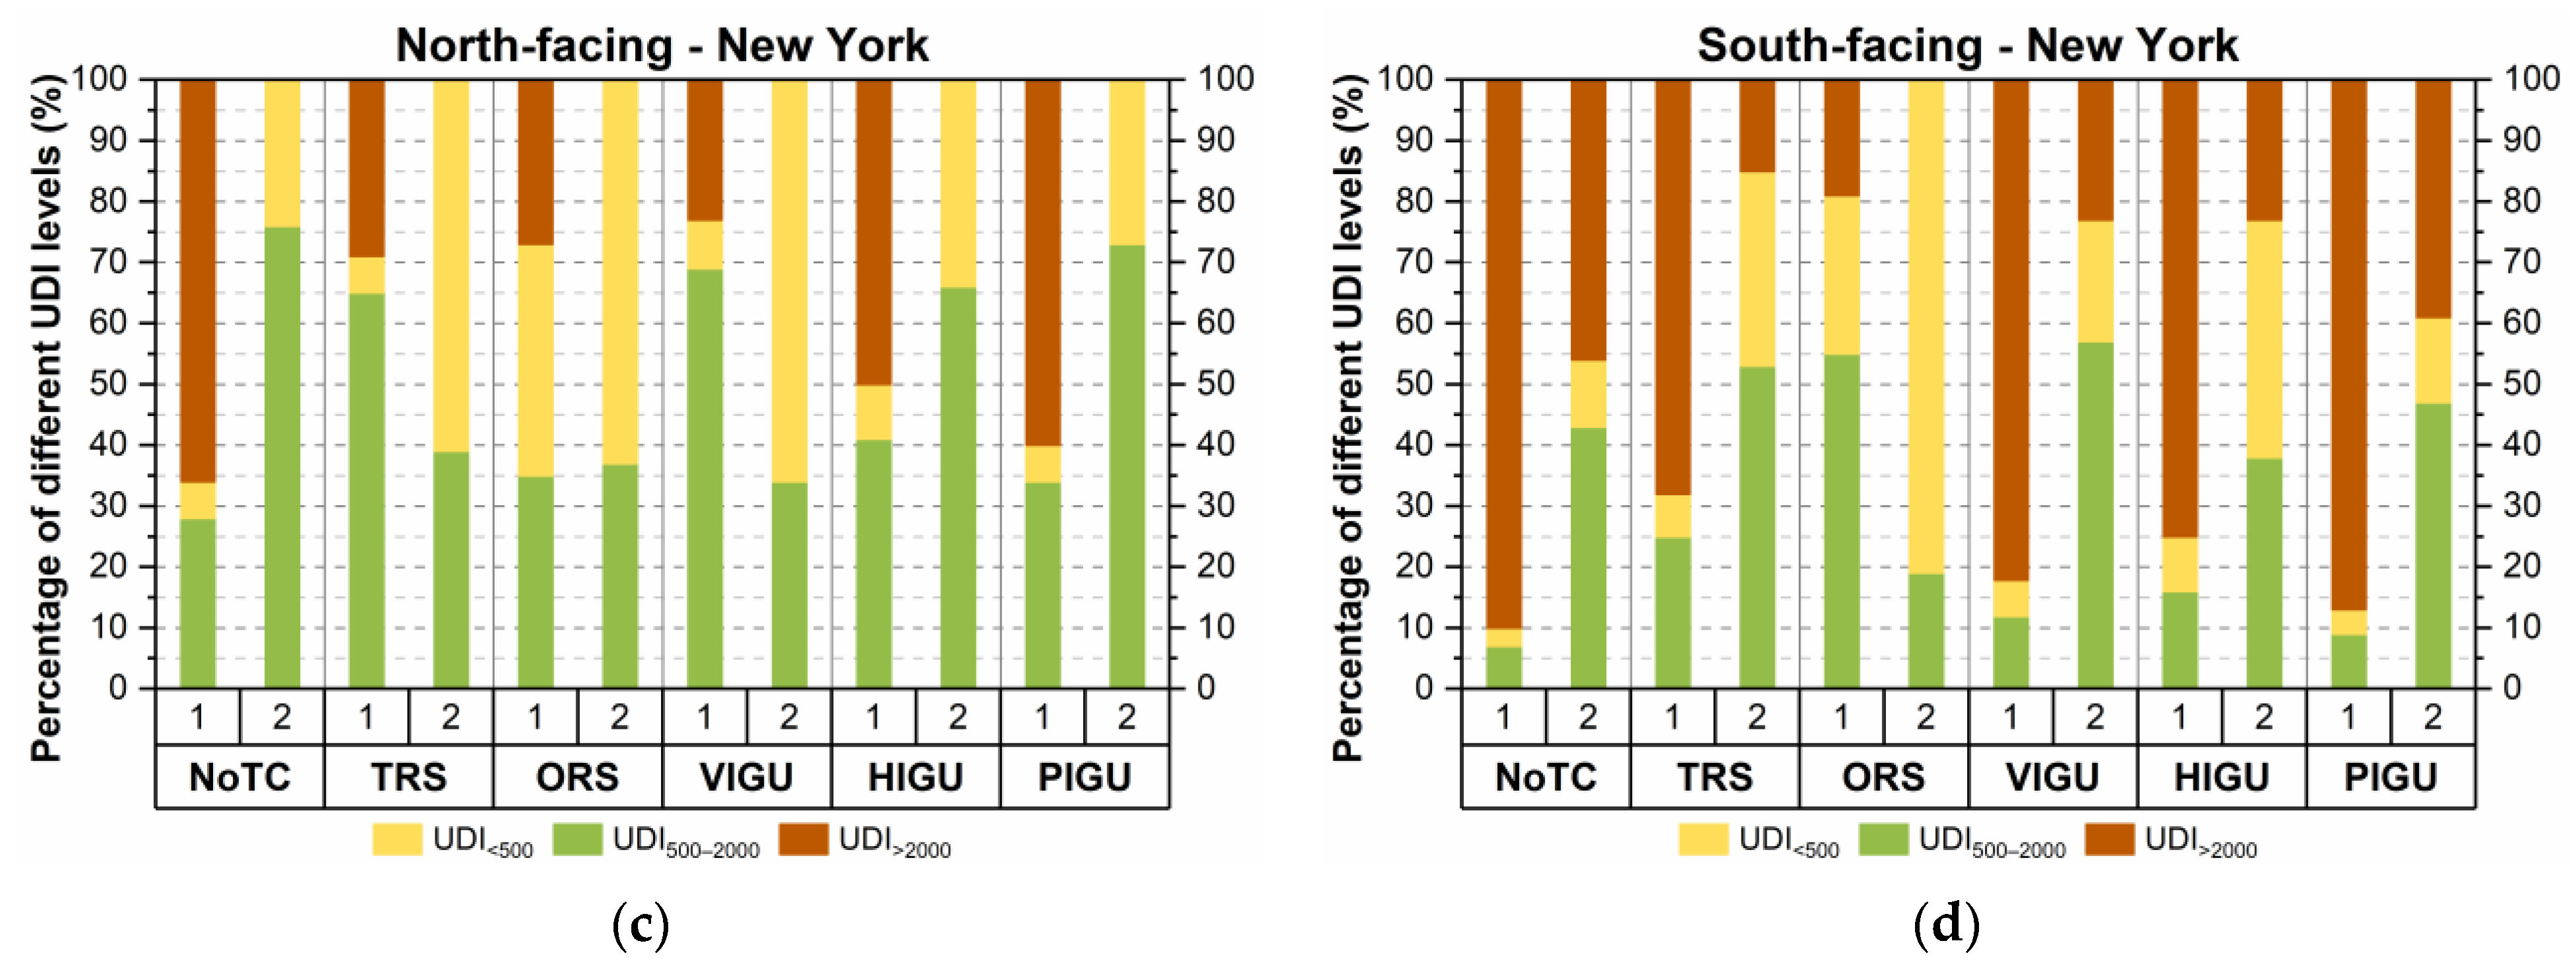
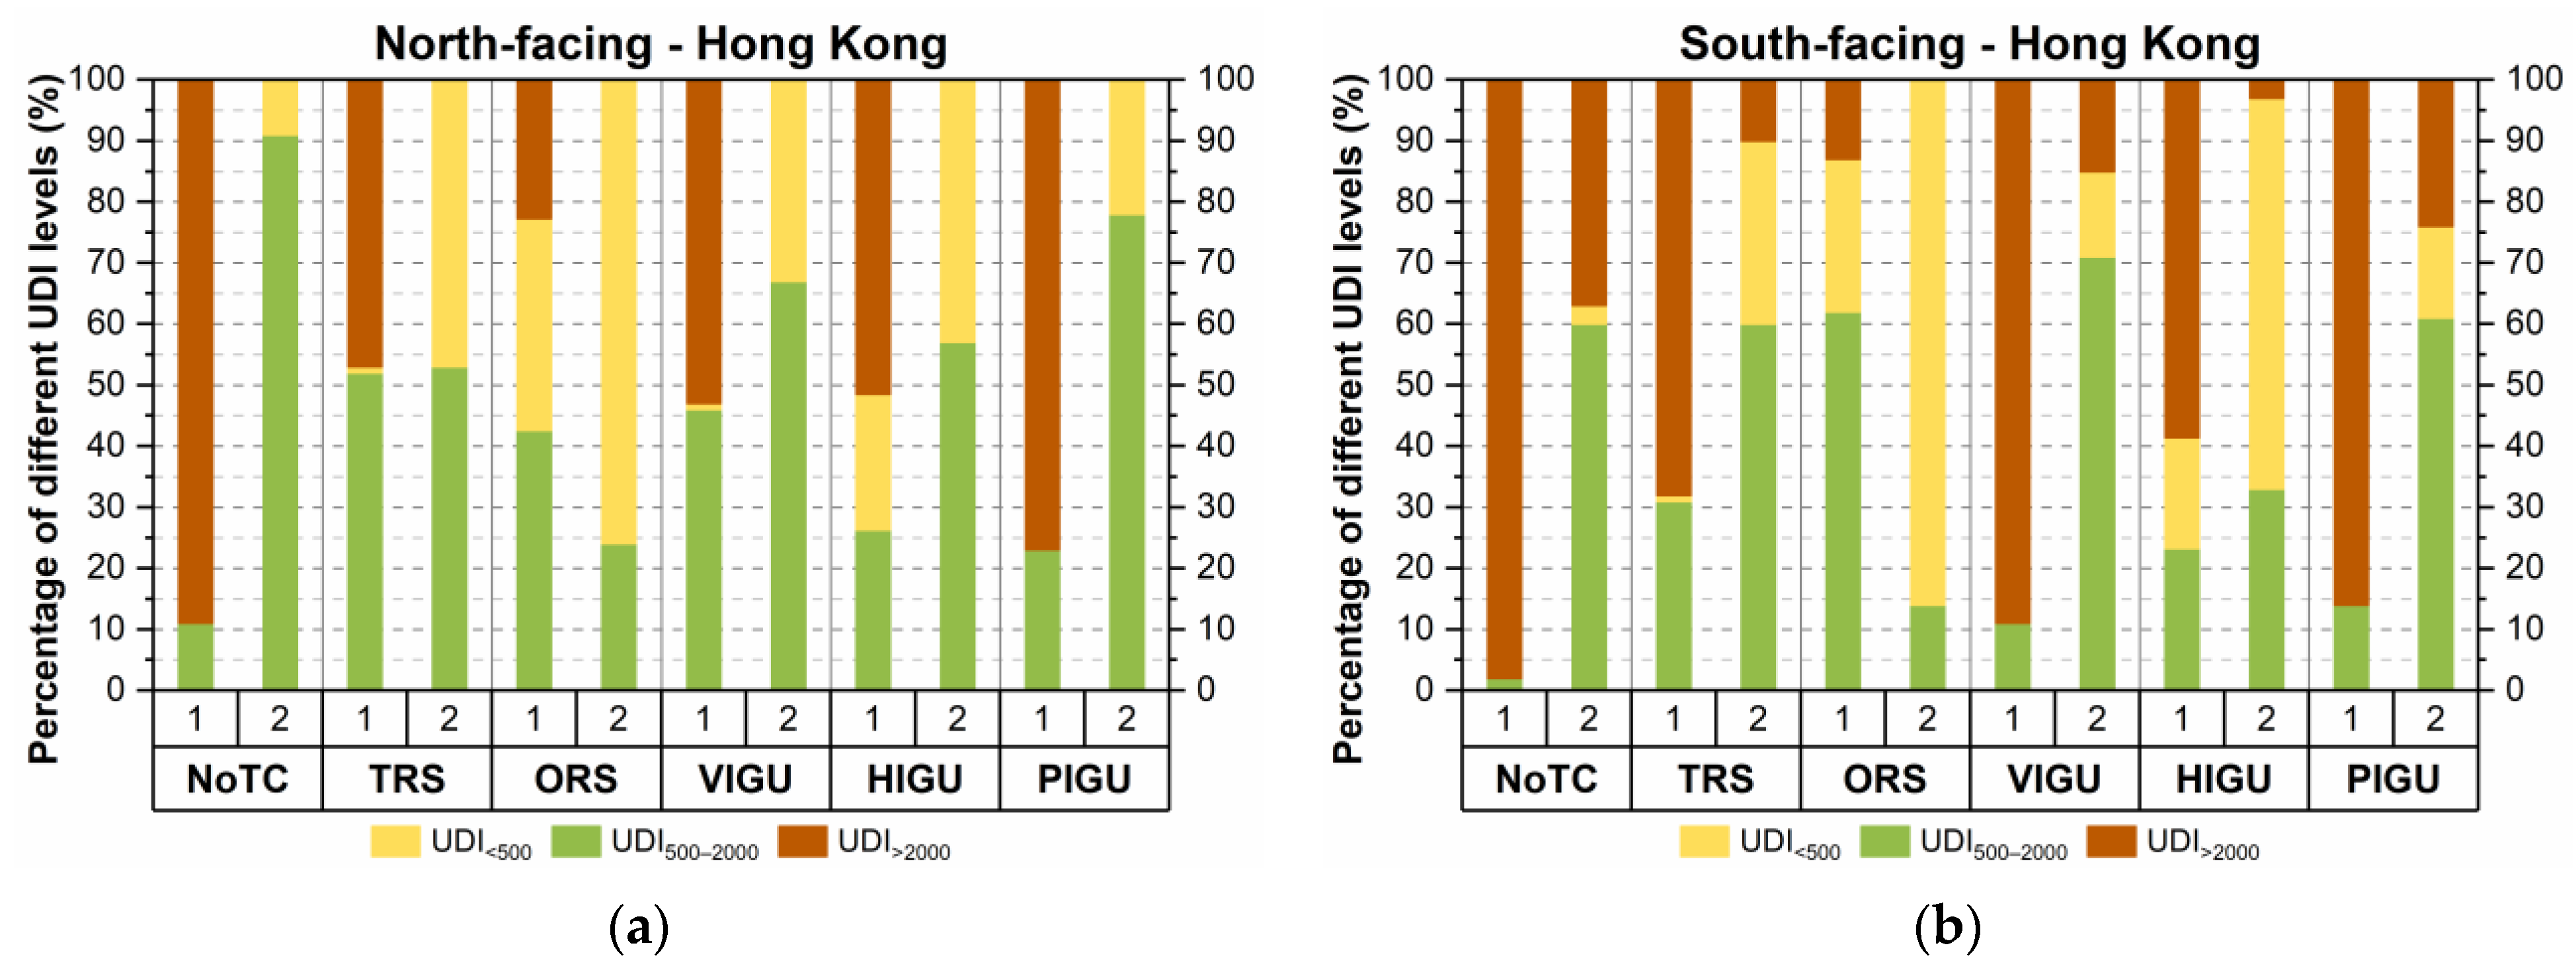
  • From 0 to 500 lux (UDI<500): under-lit; insufficient illuminance, reliant on artificial lighting to eliminate visual discomfort.
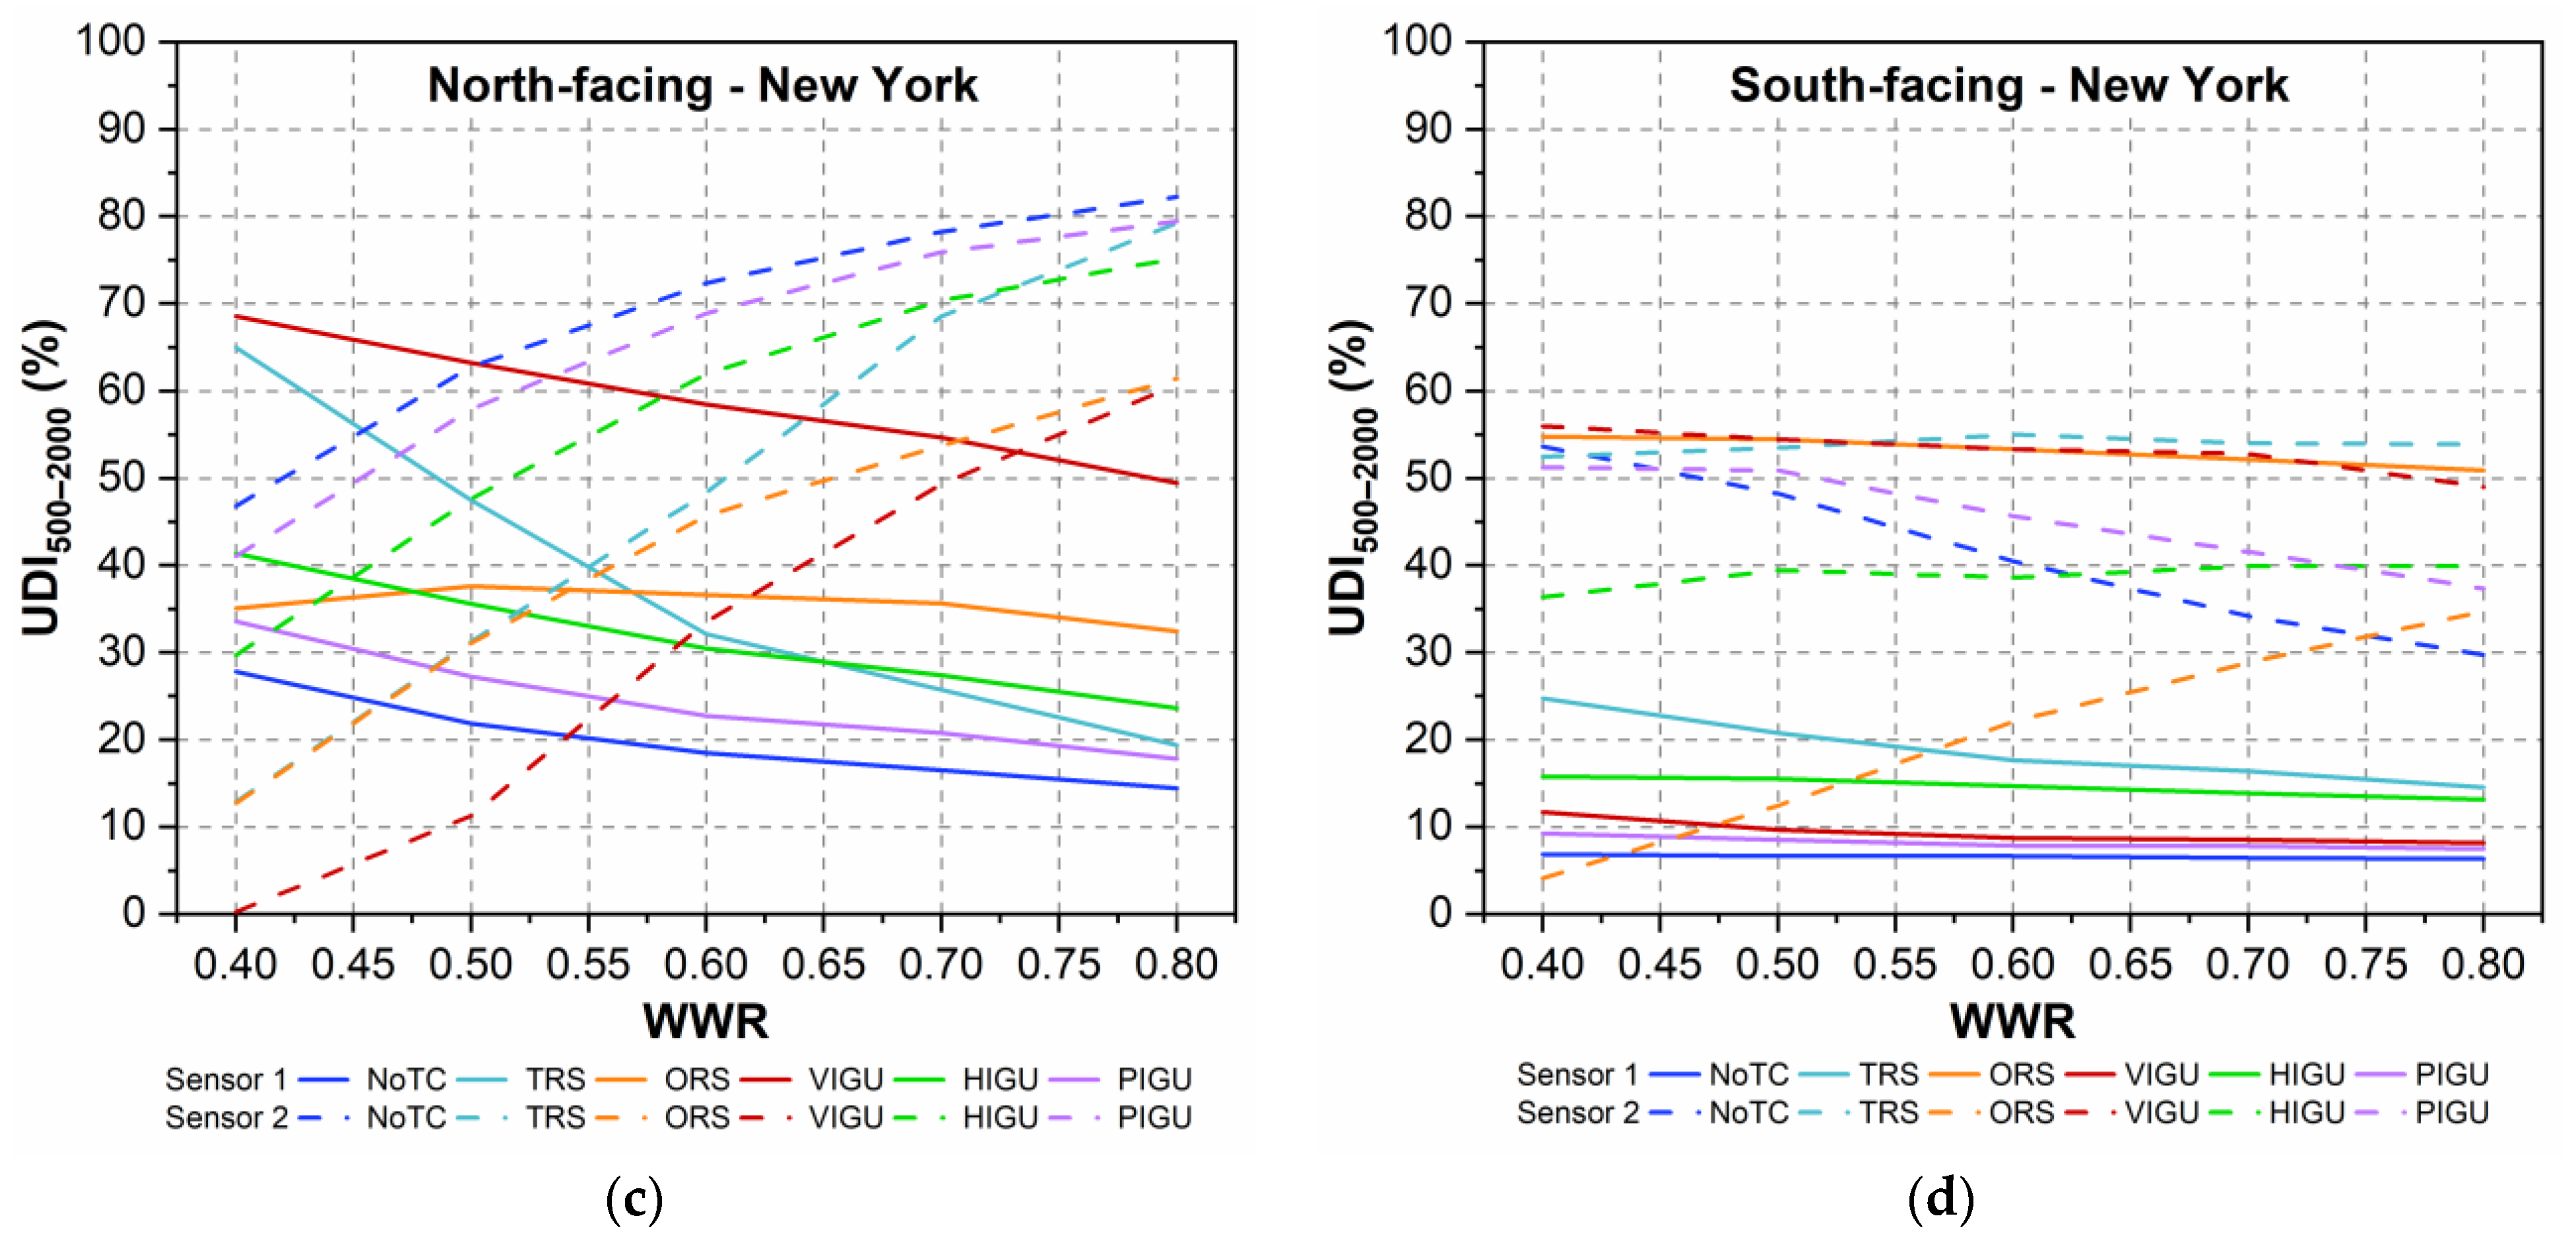
  • From 500 to 2000 lux (UDI500–2000): well lit; adequate illuminance.
  • Above 2000 lux (UDI>2000): over-lit; excessive illuminance, causes visual discomfort.
The daylighting performance was evaluated at two locations in the room, using two daylighting sensors: Sensor 1 (closest to the window) and 2 (further away, by the wall).

3. Results and Discussion

The results of the simulations are presented in the following sections. Section 3.1, Section 3.2, Section 3.3 and Section 3.4 discuss the results obtained for a typical office model (40% WWR). Section 3.5 focuses on models with larger-than-average glazed areas (up to 80%).

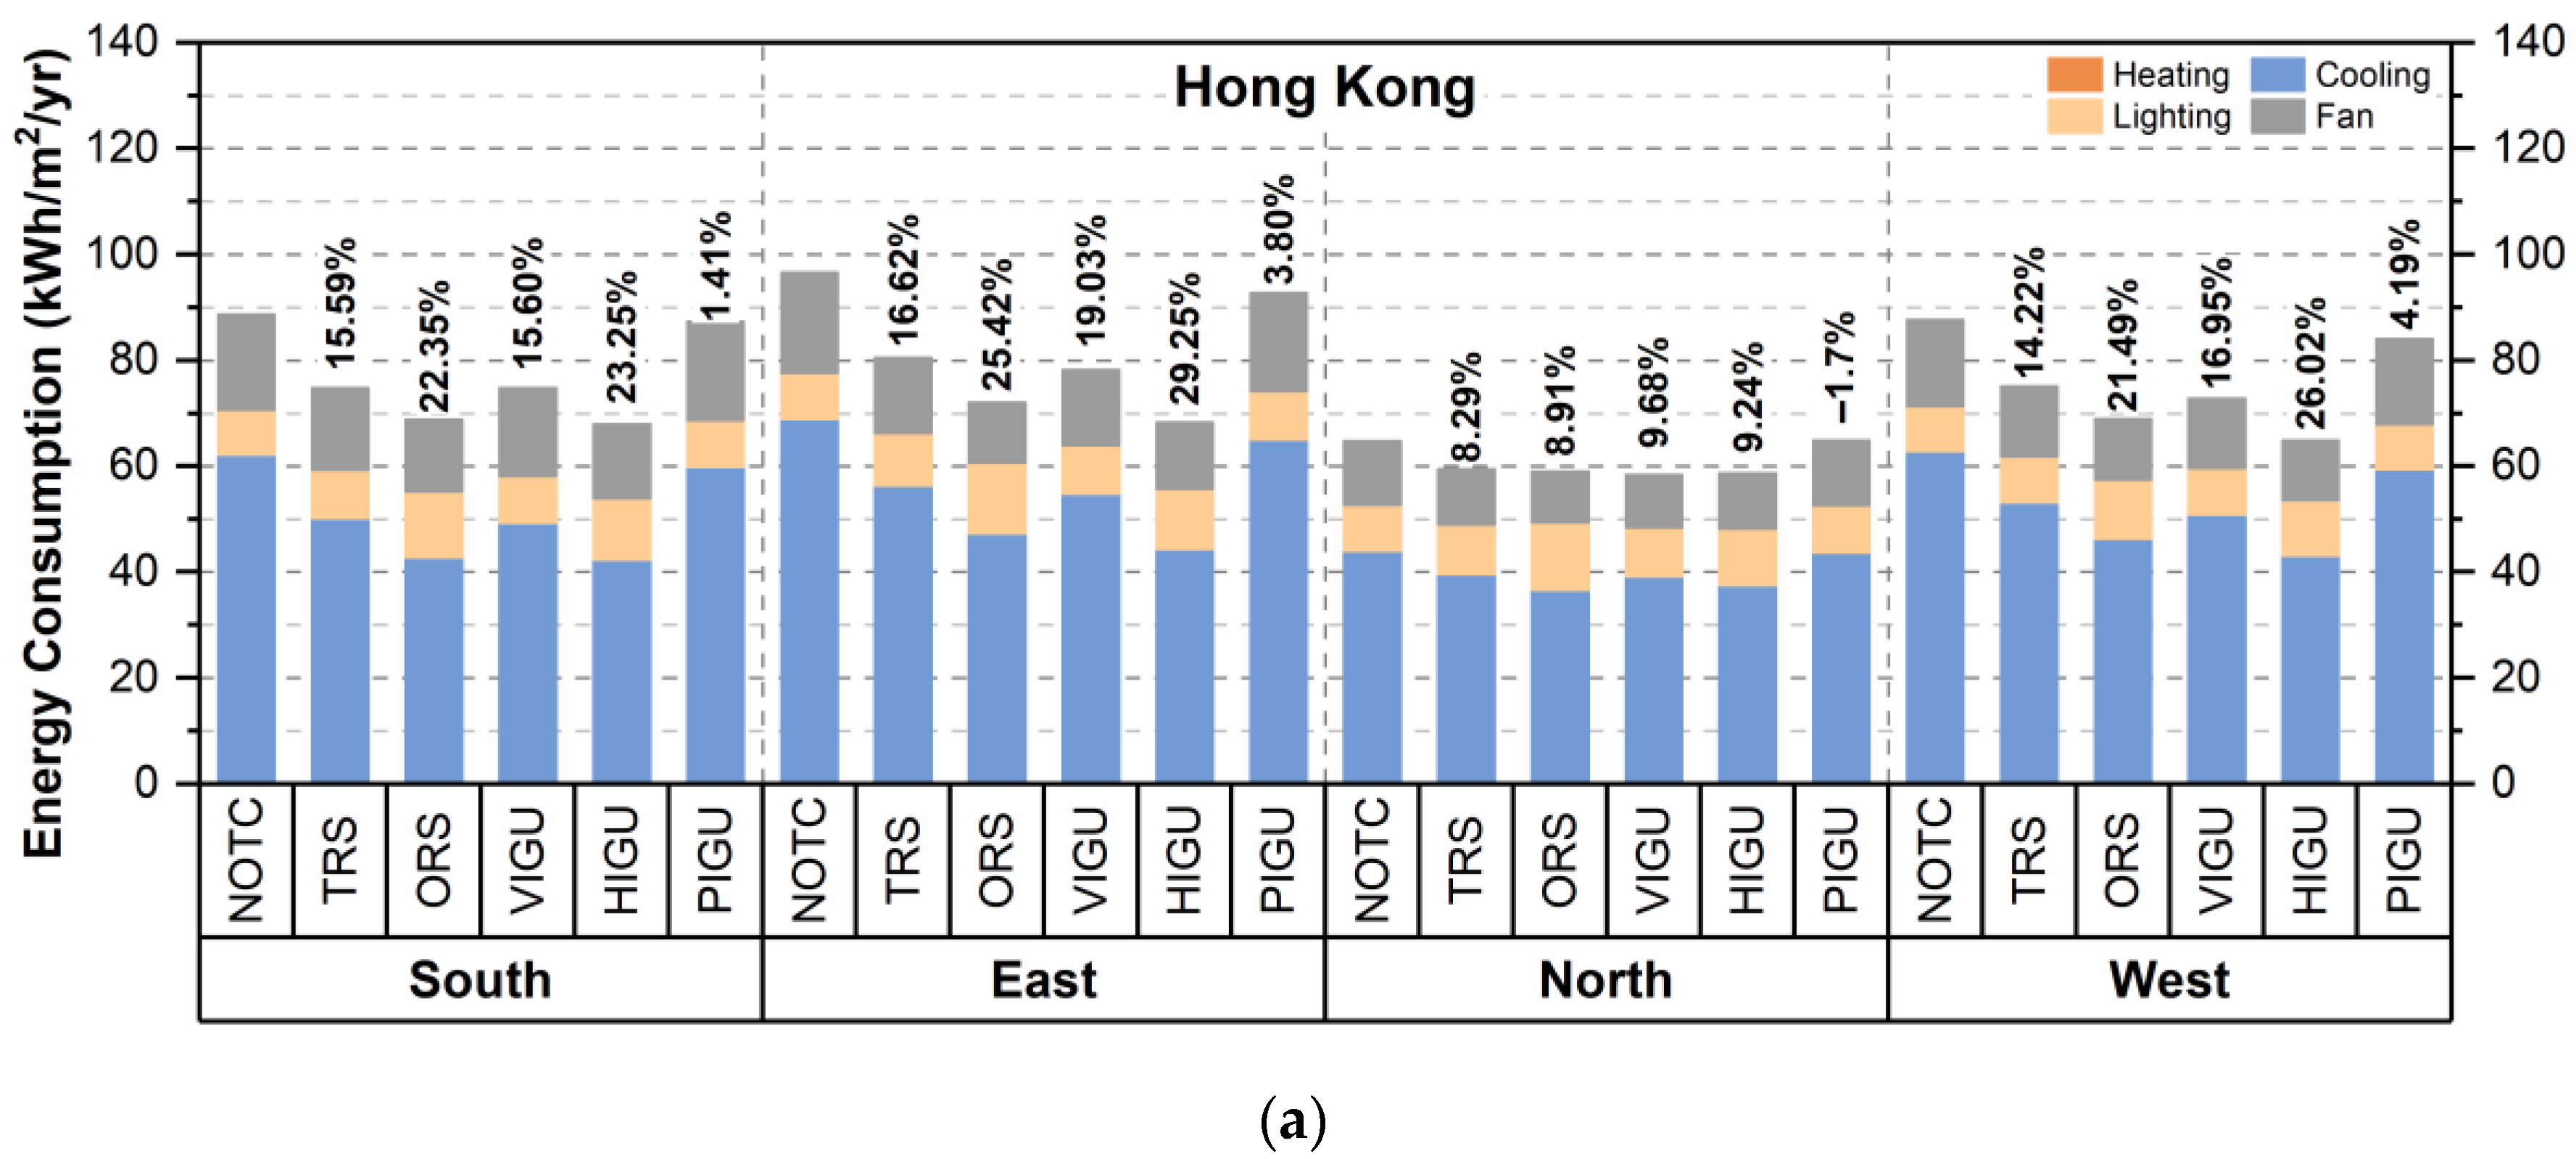
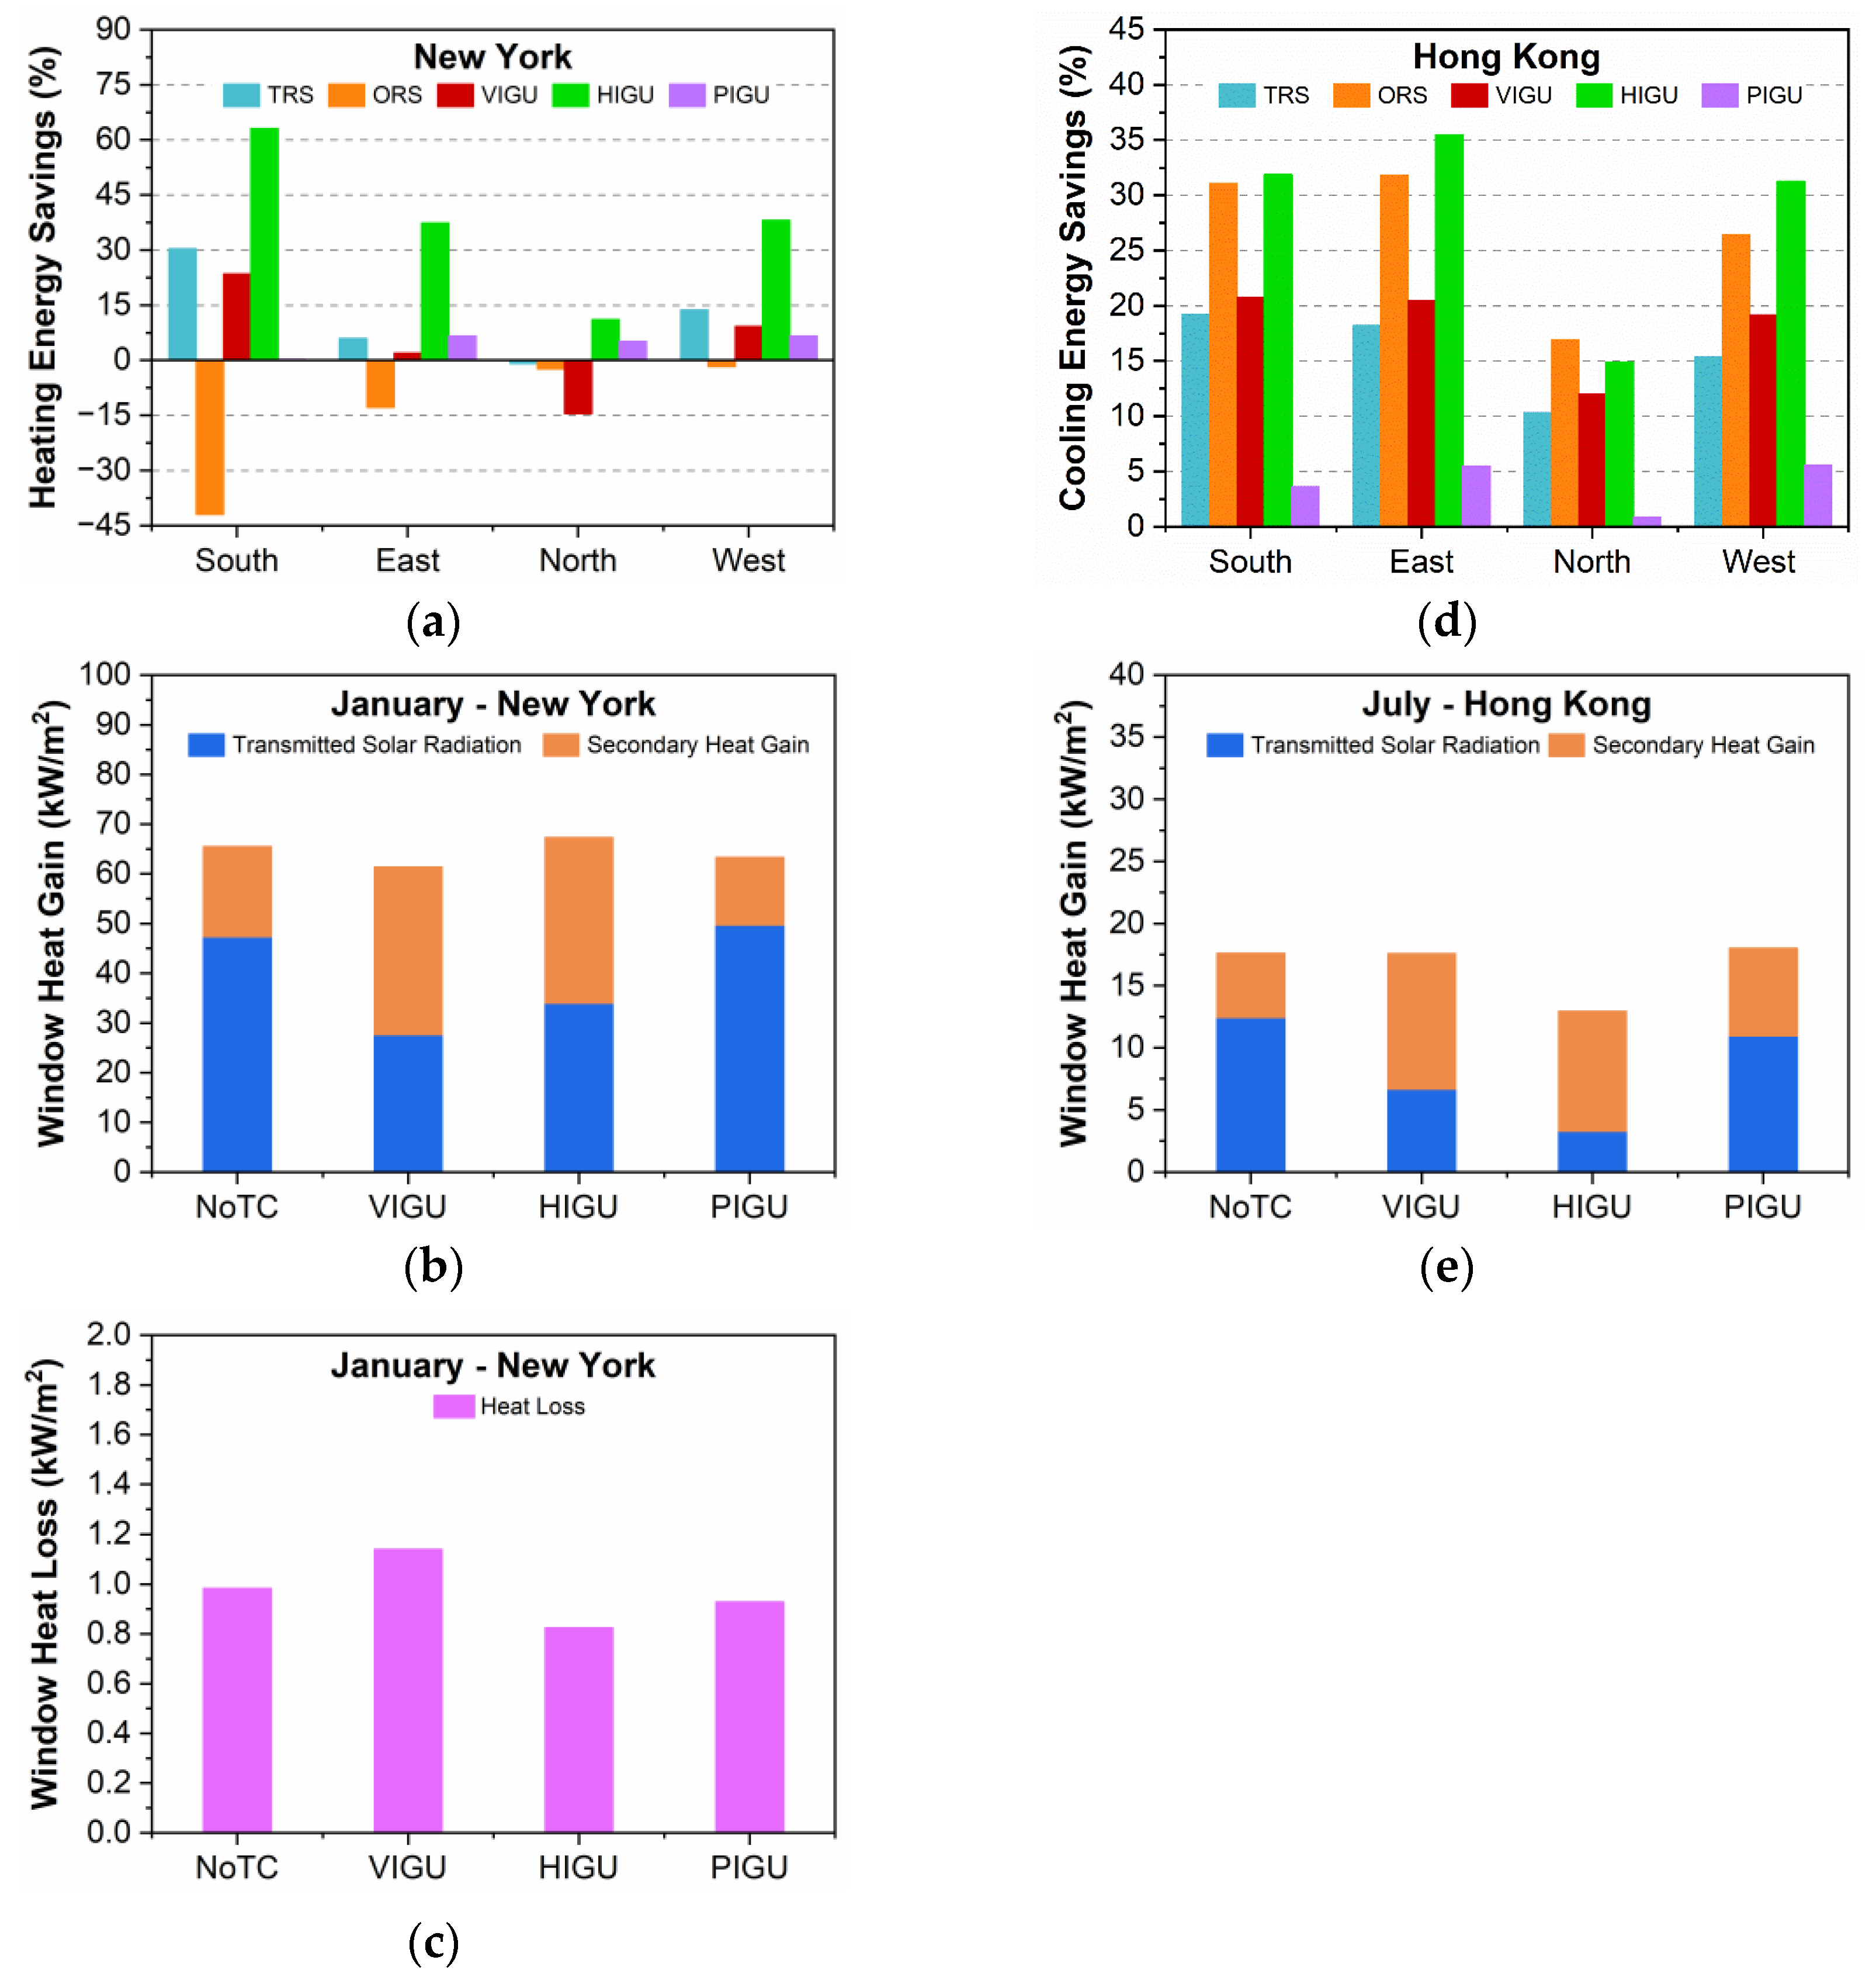
3.1. Energy Savings by Orientation (40% WWR)

The annual site energy use intensity in Hong Kong and New York (measured per unit of floor area, kWh/m2-year) in a typical meteorological year is presented in Figure 4, broken down by end-use category (heating, cooling, lighting and ventilation). The energy use is reported for each window orientation: the differences are primarily attributable to solar heat gain and the availability of daylight, which directly influence heating, cooling and lighting demands. Therefore, it is important to factor in the effect of the sun’s path in the analysis. Both cities considered in the study (Hong Kong and New York) are located in the northern hemisphere, where the day arc follows the southern sky. As a result, south-facing windows receive the most sunlight. While this can reduce heating costs in the winter (as evident in New York, where office spaces with south-facing windows consume the least energy for heating), it can also drive up cooling demand in the summer. Because the sun rises in the east and sets in the west, east- and west-facing windows receive the most morning and afternoon sun, respectively. North-facing windows have the least exposure to sunlight and consequently have the lowest cooling demand in summer and the highest heating demand in winter. This is reflected in the energy use trends.
The roller shades and the TC glazing reduced the energy use in all but two simulated cases (VIGU and PIGU when used as north-facing windows in New York and Hong Kong, respectively). In Hong Kong, HIGU saved the most energy (21.9% on average), followed by the opaque roller shades (19.5%), VIGU (15.3%), translucent roller shades (13.7%) and PIGU (2.3%) in all orientations but north, where the modified window constructions (except PIGU) had comparable savings (8–9%). In New York too, PIGU was the worst-performing window (averaging 1.8% in savings), except when used for north-facing facades. In this orientation, VIGU used more energy than all simulated cases, including the base case (0.42% more). In other orientations, VIGU averaged 22.3% savings. Similar to Hong Kong, HIGU was the most energy-efficient on average (23.9%), followed by opaque roller shades (19.4%), VIGU (16.6%) and translucent shades (16.1%).

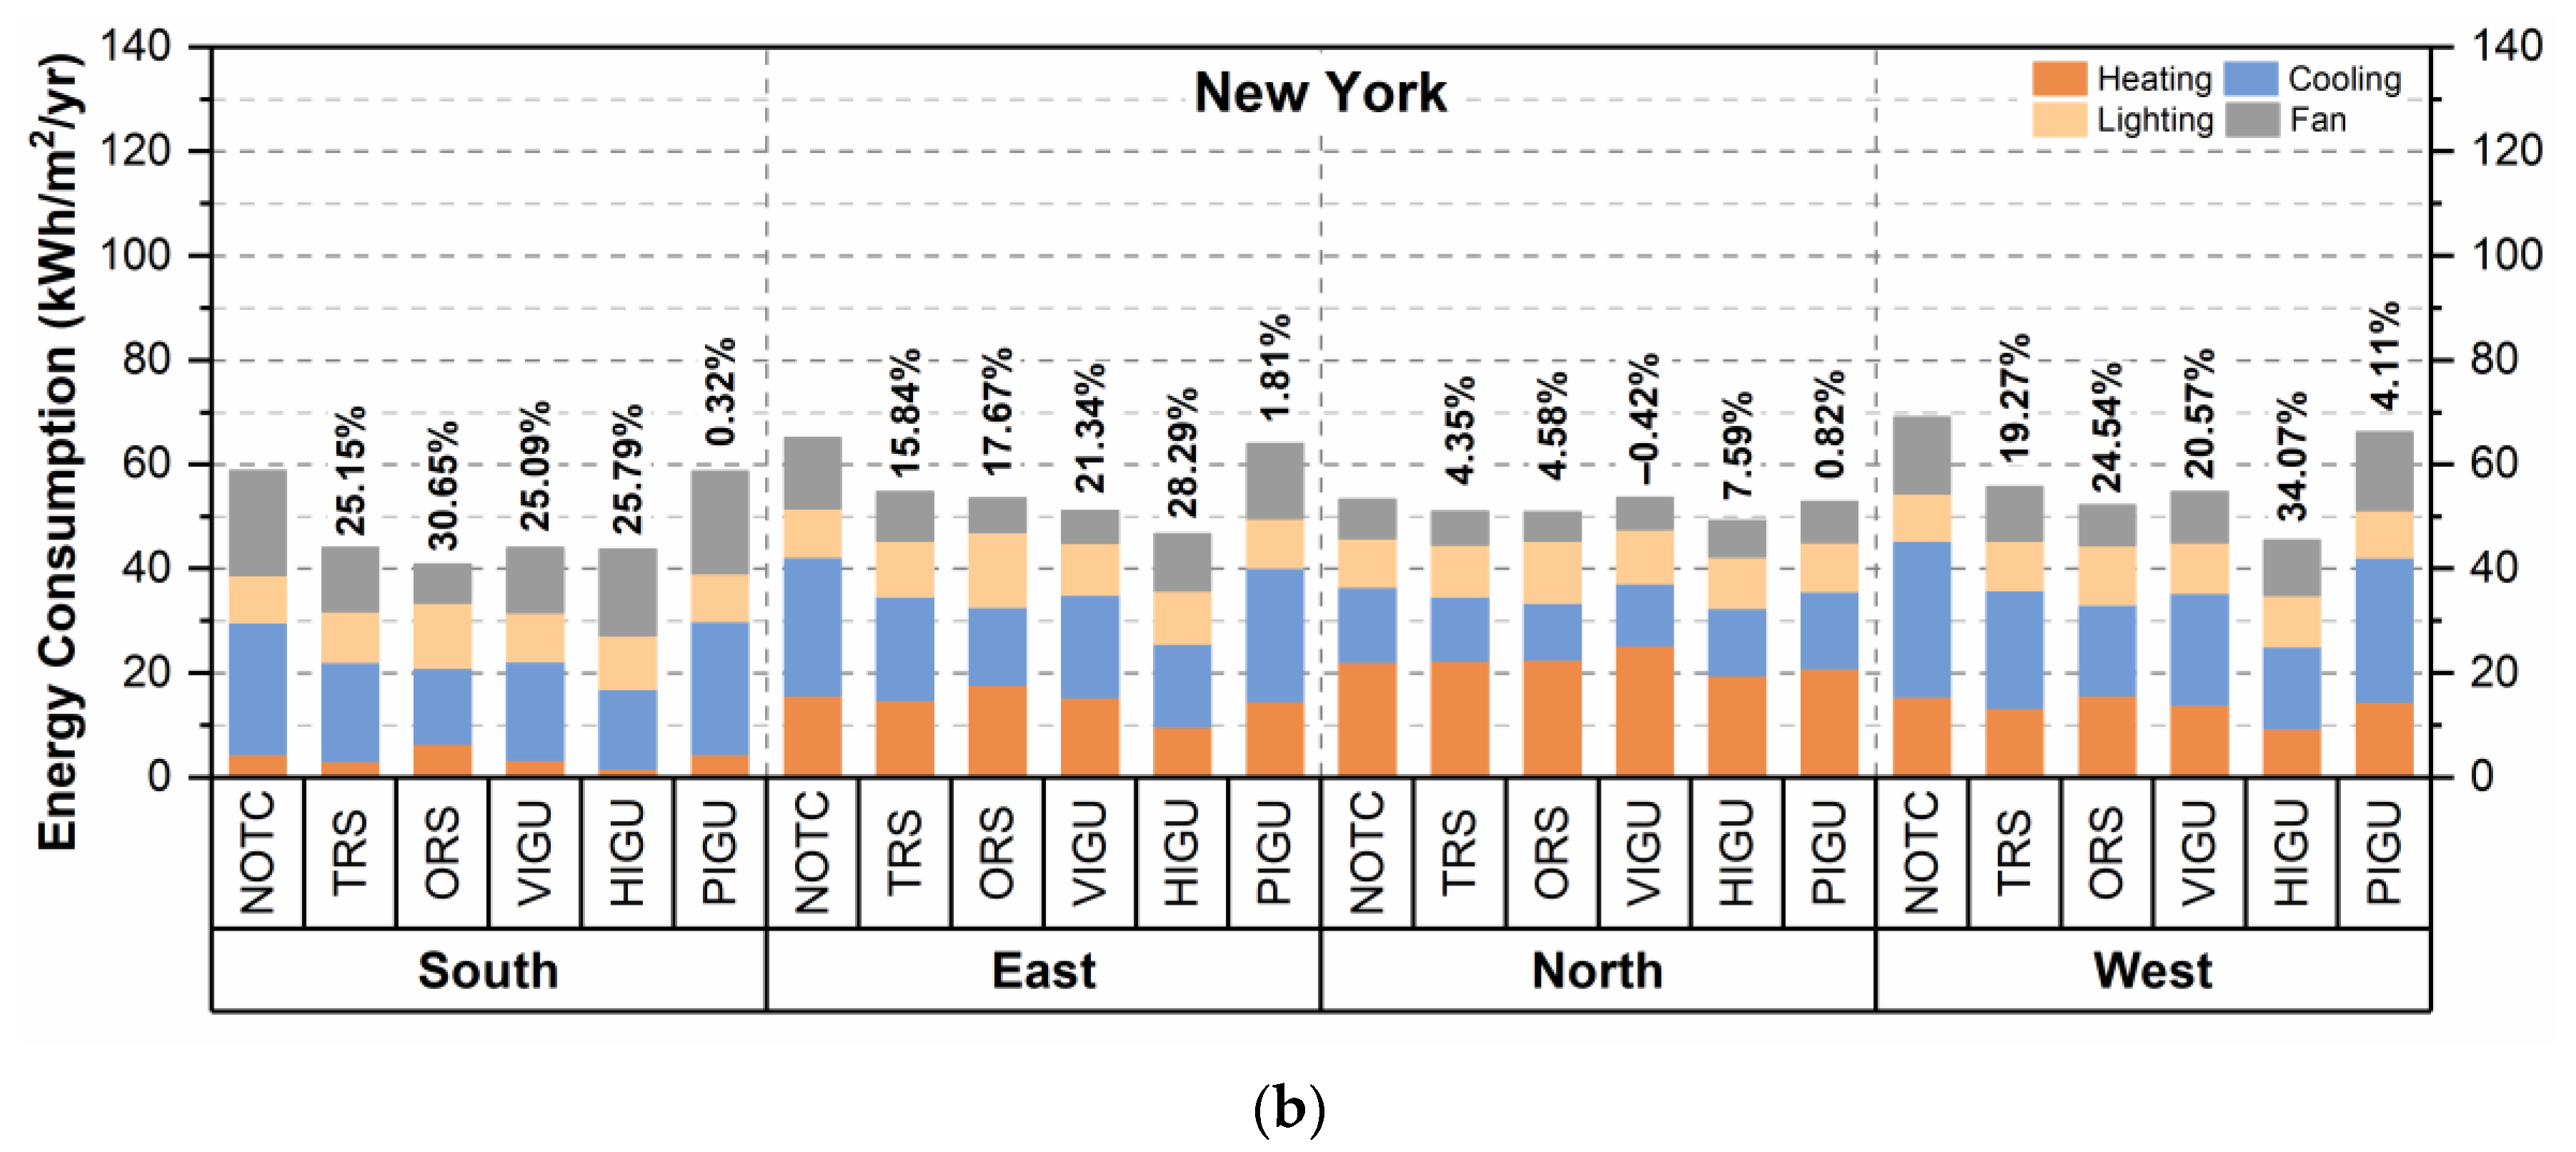
3.2. Energy Savings by End-Use (40% WWR)

The low Tsol of both the roller shades and TC glazing-incorporated IGU saves cooling energy in summer by reducing solar heat gain. Inevitably, the adaptive lighting system increases artificial lighting to compensate for the accompanying loss of daylight. In cold conditions that warrant heating (winter in New York), roller shades limit passive heating due to transmitted solar radiation when deployed to avoid glare, thereby increasing heating demand, but can also reduce the heat lost from the space by creating an additional insulating layer to the glazed area [51]. The higher than base case solar absorptance, Asol, of the TC glazing can contribute to passive heating via secondary gains (solar radiation absorbed and emitted inward to warm the space) in winter. The overall savings are a product of these factors.
Figure 5a presents the savings in heating energy consumption in New York. The results for Hong Kong are not analysed in detail, as the heating demand is insignificant. With the exception of the opaque roller shades, all simulated windows showed heating energy savings, with HIGU outperforming all others (averaging 37.5%). The TC hydrogel glazing used in HIGU has low thermal emittance ( ε t h e r m a l ) in its cold state and high thermal emittance in its hot state. This thermoregulatory behaviour explains the significant heating savings for HIGU in all orientations: when the glazing exists in its cold state, its low ε t h e r m a l facilitates internal heat insulation (Figure 5c), which reduces the heating load. PIGU, which is more transparent to solar radiation in its cold state (Figure 5b) than the clear glass of the reference IGU, also saved heating energy. VIGU saved heating energy despite the VO2 glazing’s characteristically low Tsol. Its high Asol yields higher secondary heat gain than the baseline, as evident in Figure 5b. In north-facing zones with low solar availability, VIGU failed to save energy. The opaque roller shades resulted in a heating penalty in all cases (−14.7% on average). This can be attributed to their low Tsol. The translucent roller shades, which also restricted transmitted solar radiation (albeit to a lesser degree), however, did reduce the heating energy consumption. In this case, the added insulation from the shading is sufficient to offset the increased heating load. The results show that TC windows are a viable alternative to traditional roller shades in terms of heating, especially highly opaque ones. In winter, high Asol in the cold/clear state can compensate for the TC glazing’s low Tsol, and vice versa (i.e., high Tsol offsets low Asol). Alternatively, lower long-wave emissivity can save heating energy in the absence of high Tsol/high Asol.
Figure 5d summarises the savings in cooling energy in Hong Kong for all facades and window constructions. HIGU consistently outperformed all other TC windows due to its large solar and thermal modulation (ΔTsol = 58.8%, Δ ε t h e r m a l = 57%). On average, HIGU saved 28.4%, comparable to opaque roller shades’ 26.6%. VIGU (18.1%) and the translucent roller shades (15.8%) followed, with similar savings. Although the VO2-based glazing has the lowest hot/tinted state Tsol (43%), its saving effect is muted by the film’s high Asol, which contributes to passive heating during the cooling period (Figure 5e). Despite having a larger ΔTsol (26%), PIGU saved significantly less (averaging 3.88%). This can be explained by the glazing’s high transparency to NIR in both its hot and cold states. Similar trends in cooling energy use were observed for all orientations including in New York, except in the north-facing zones, where the low solar availability rendered the TC windows not as effective (infrequent switching).
The cooling load is influenced not only by window heat gains and losses but also by the internal loads from occupancy, electronic equipment and lighting, among others. As the occupancy and equipment schedules remain unchanged for all simulations, lighting is the biggest contributor to the differences observed in the internal gains between them. Changes to lighting use are presented in Figure 6. Predictably, the opaque roller shades, which fully obstruct natural daylight when deployed, account for the largest increase from the baseline (up to 48.6%) and PIGU, which is the most transparent, the smallest (3.88%). These changes are also closely linked to the switching frequency, i.e., the thermochromic behaviour of the TC windows, and the engagement of the shades, which are discussed in the next section.

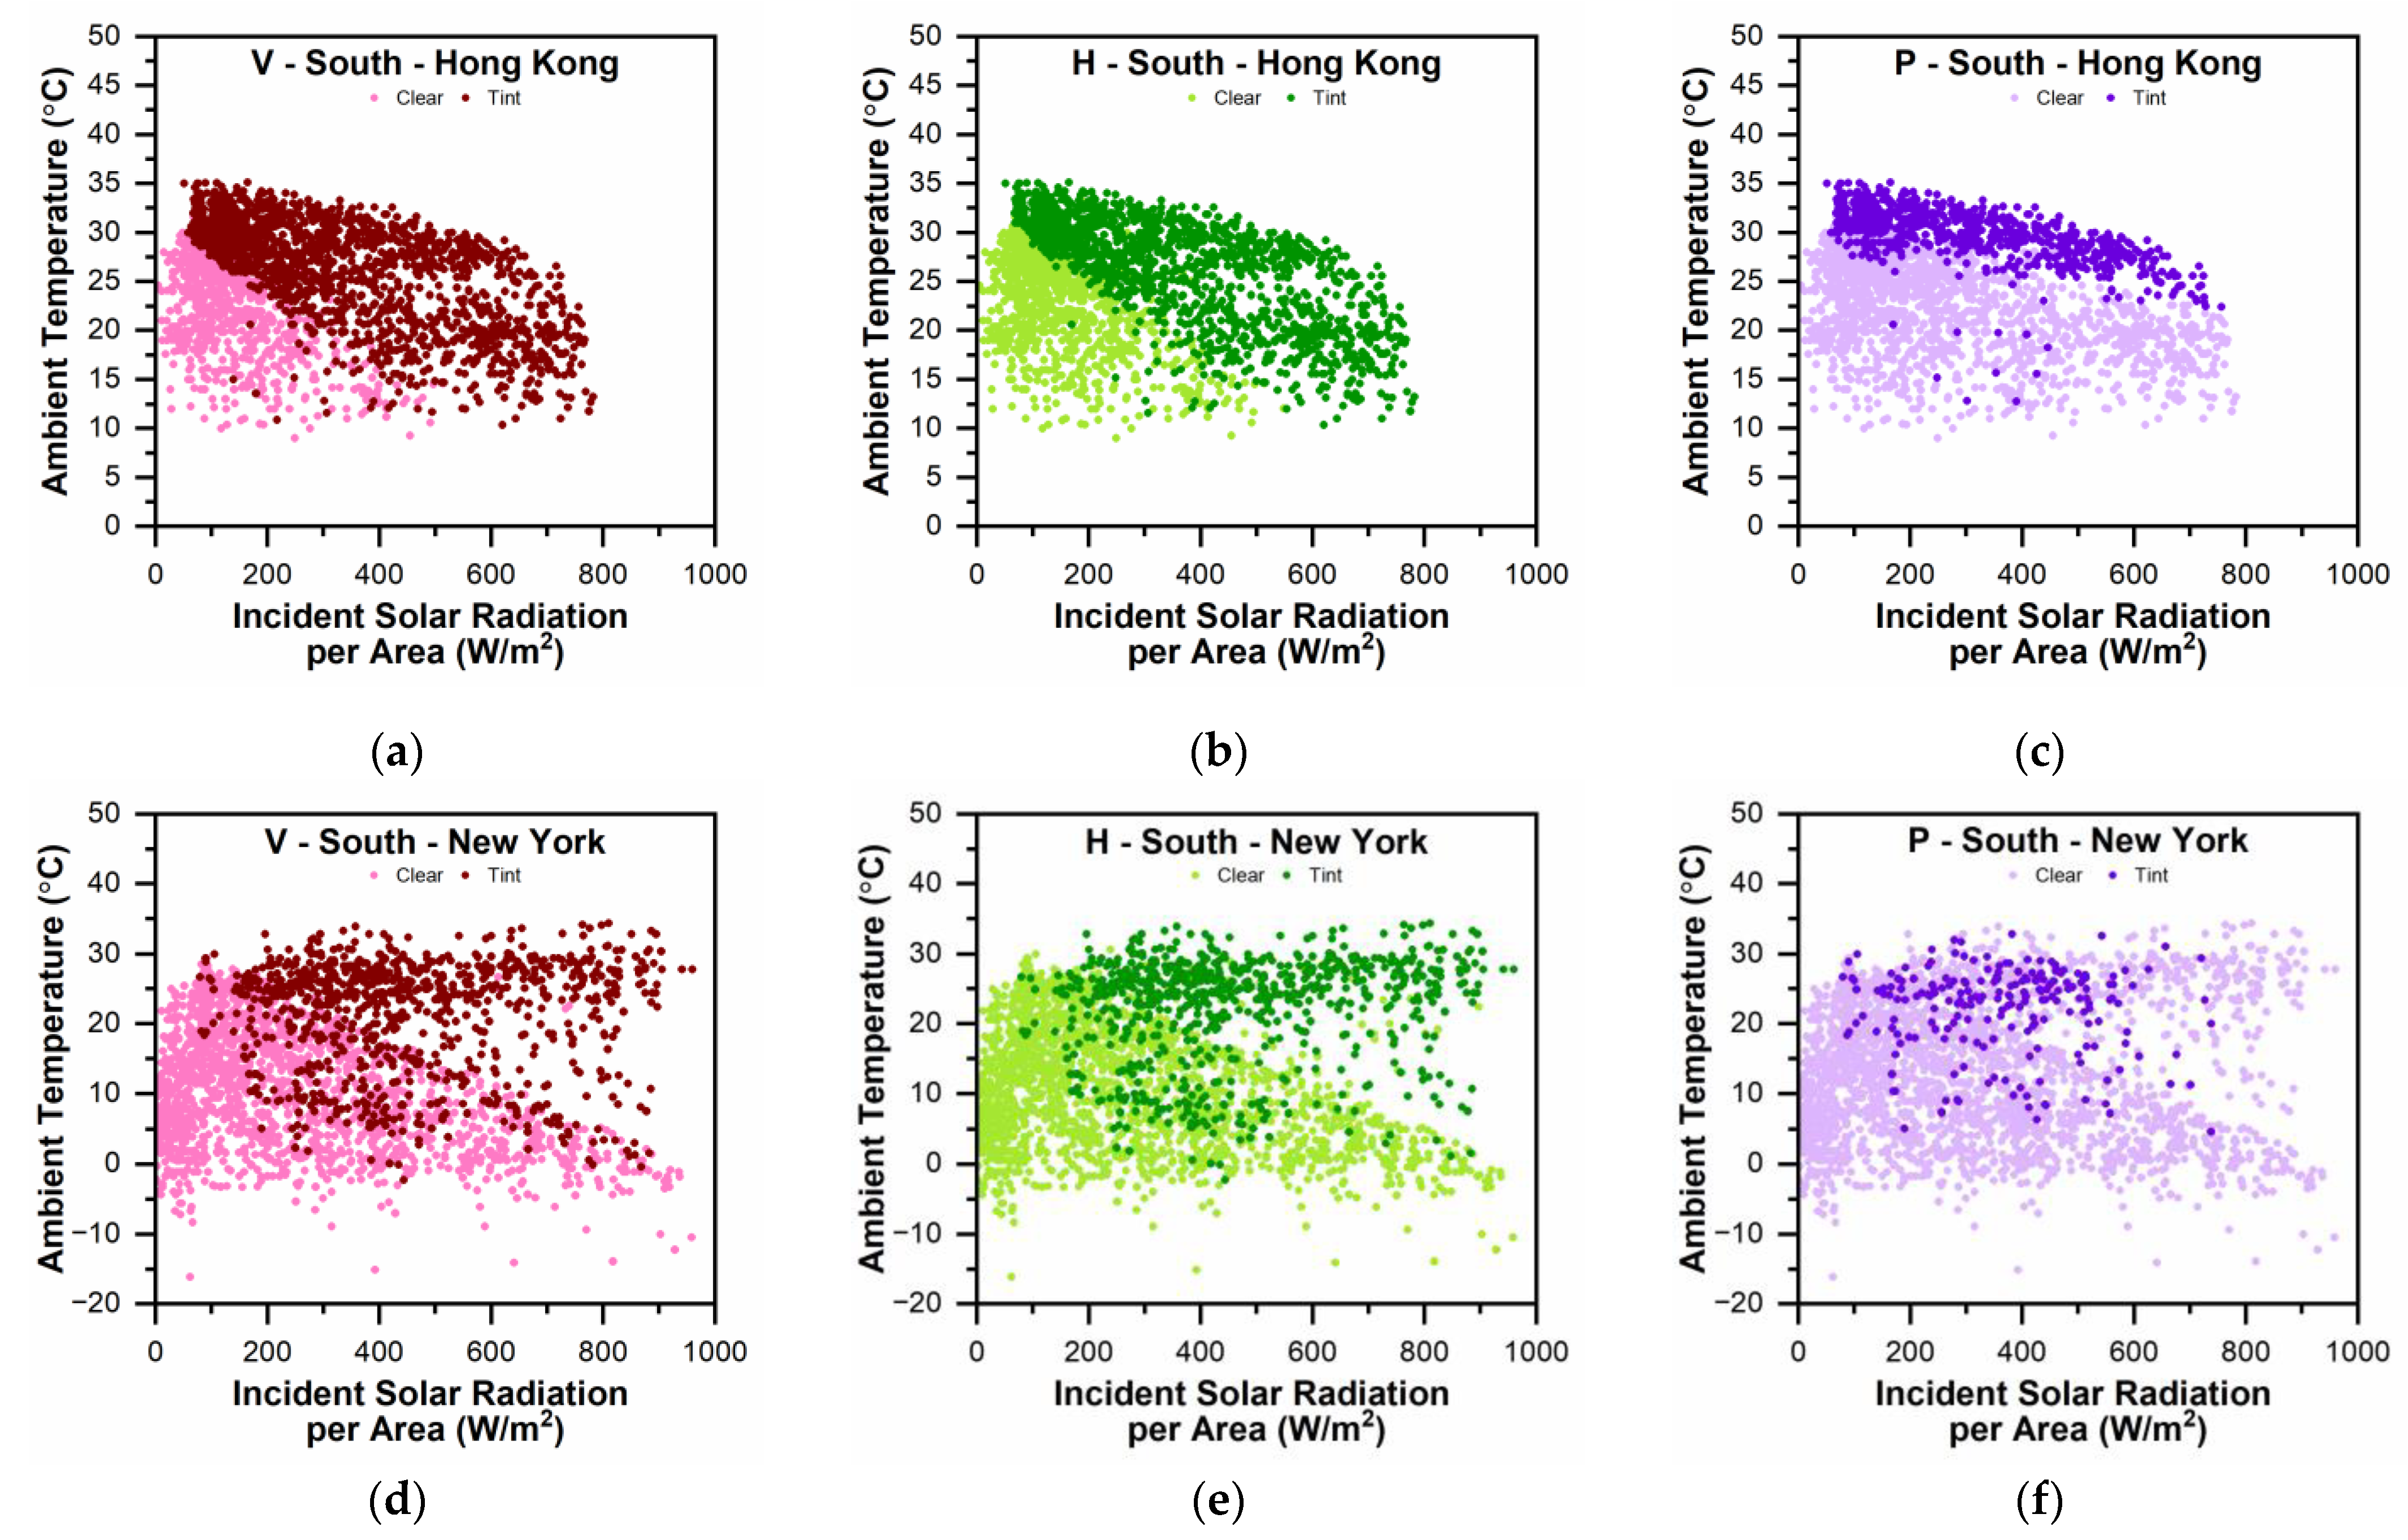
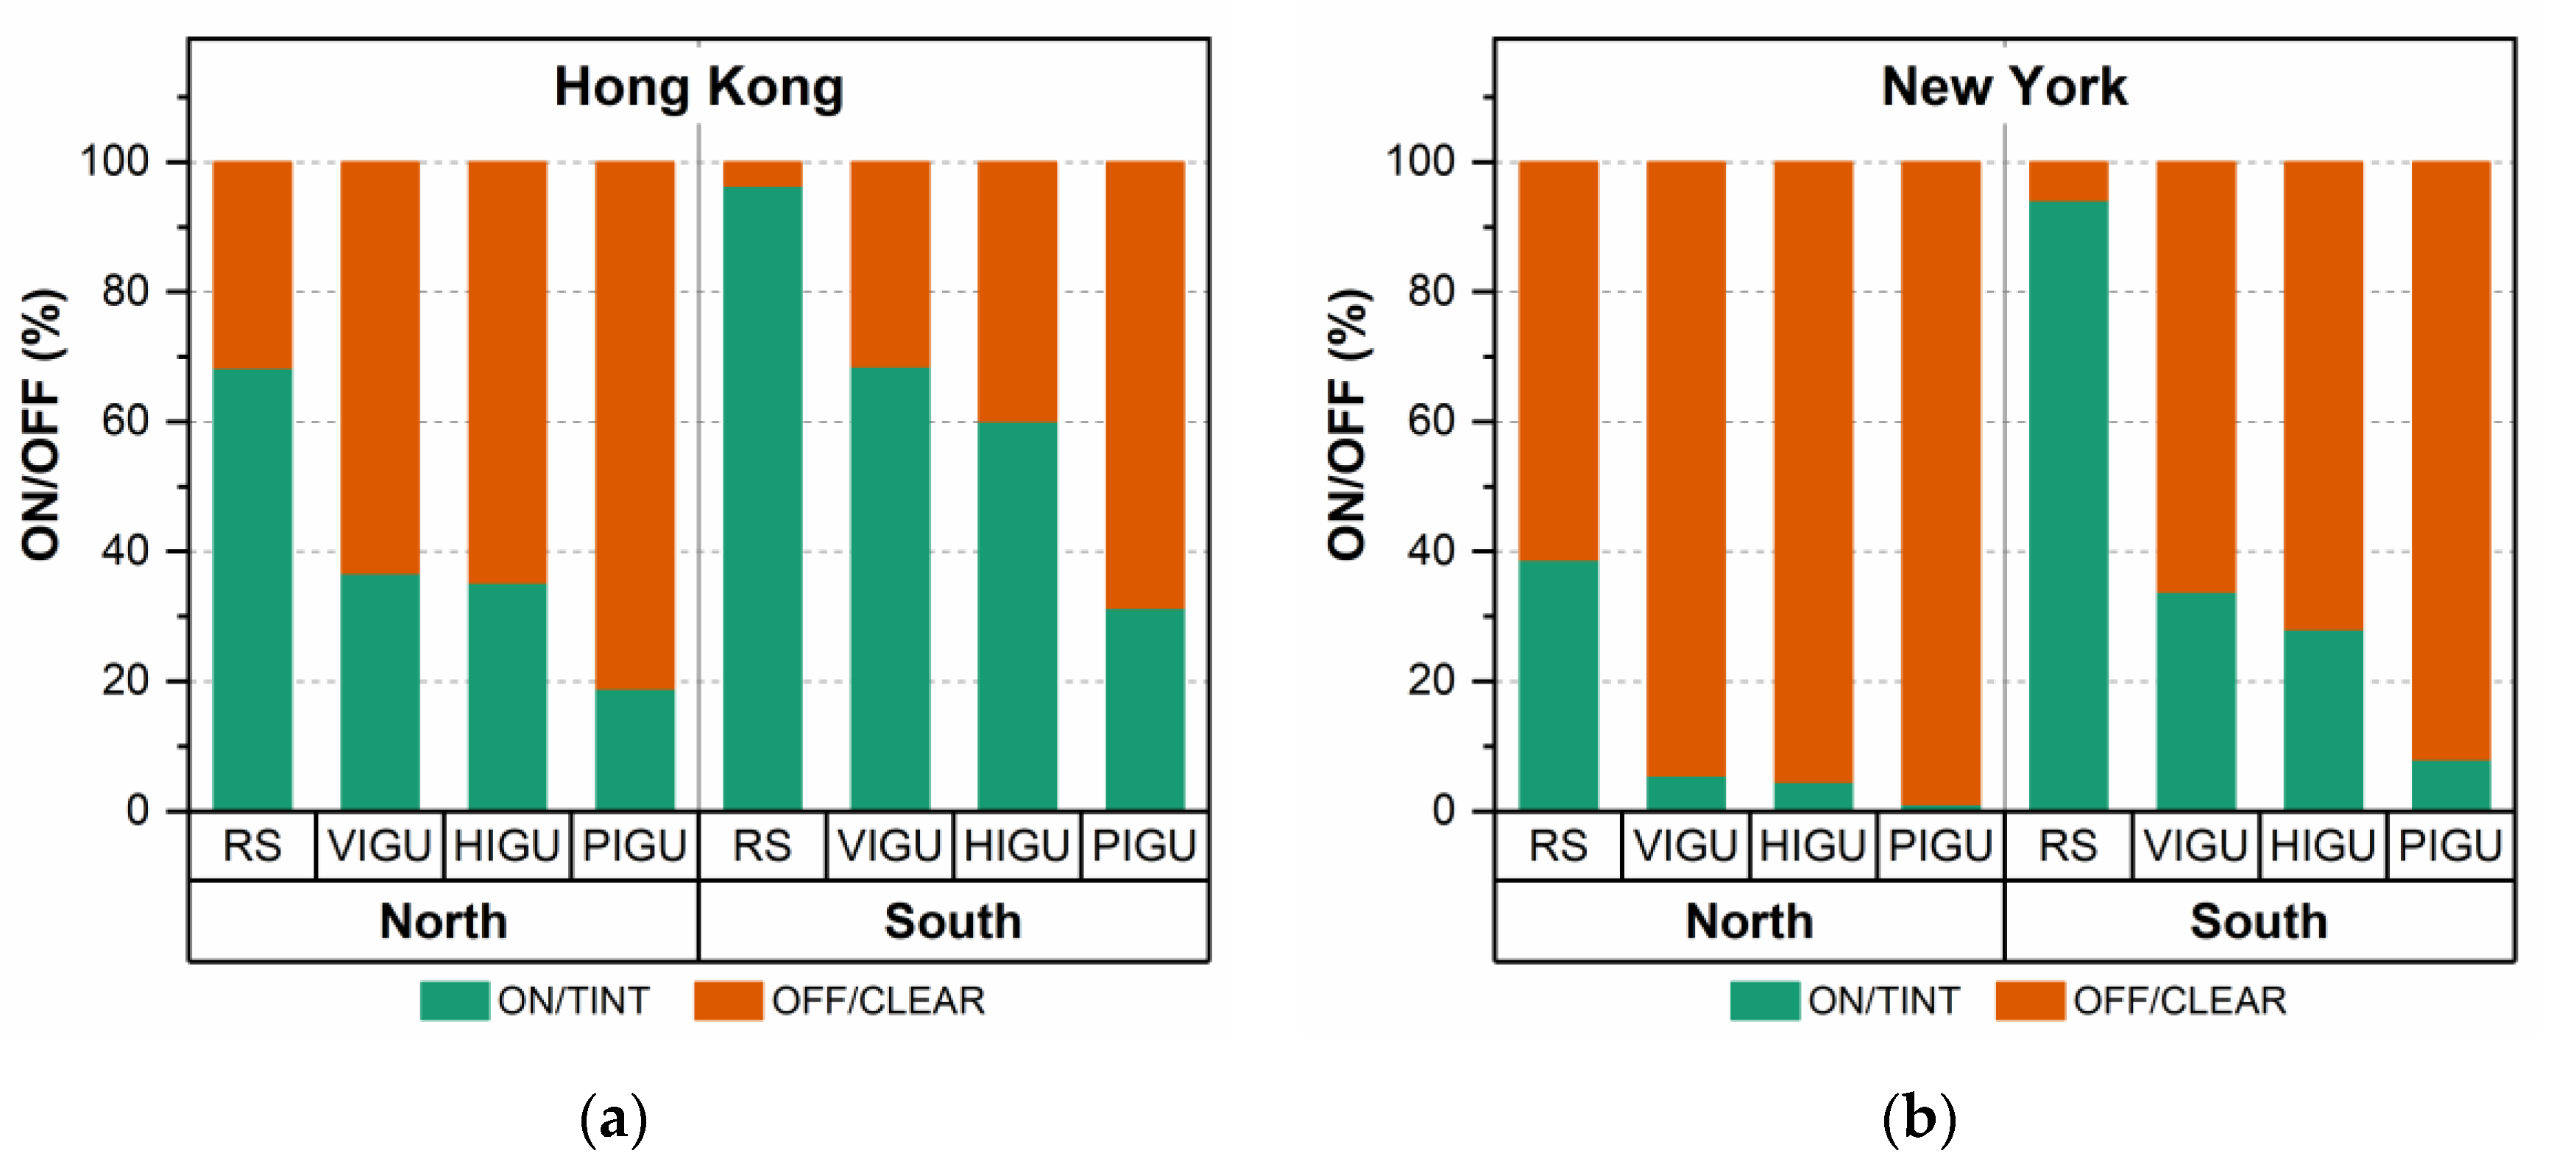
3.3. Thermochromic Behaviour of Glazing and Shade Deployment (40% WWR)

All TC glazings in this study transition from clear to tinted state at 30 °C. The glazing temperature and, consequently, the tinted hours of the TC window are affected by the ambient conditions including the outdoor dry bulb temperature and the incident solar radiation. Figure 7a–f show the switching behaviour of the TC windows as a function of these factors. For simplicity, only the data for the south-facing windows, which receive the most sunlight throughout the year, are presented. Switching can be triggered when sufficient radiation is absorbed by the glazing to reach temperatures above Tc, 30 °C. In New York, where the temperatures exceed 30 °C for less than 1% of the year, the VO2, hydrogel and TC-Perovskite glazing remained tinted for (on average across the four orientations) 20.5%, 17.1% and 6.84% of the annual working hours, respectively. In Hong Kong, where temperatures regularly surpass 30 °C, higher figures of 53.7%, 47.2% and 29.5% were reported. As expected, north-facing facades reported much fewer tinted hours for the TC windows than those facing south. The TC-Perovskite’s low Asol (4%) means it tints less frequently than its counterparts. In fact, the combination of high ambient temperatures and incident solar radiation could not induce switching in some instances. When it does switch, its Tsol is too high to effect any significant savings. In contrast, the VO2- and hydrogel-based glazings exhibit tinting at sub-10 °C temperatures in New York when the incident radiation is in excess of 600 W/m2. In Hong Kong, the switching temperature for the VO2-glazing can be as low as 15 °C, when incident radiation exceeds 350 W/m2. The hydrogel glazing, whose solar absorptance is lower, has a higher incident radiation requirement of 500 W/m2.
While lowering tinting temperatures by favouring glazing with higher solar absorptances may be a reliable strategy in warmer climates with virtually non-existent heating demands, it can be undesirable in climates with heating periods, as unnecessary window tinting during ‘winters’ can negate the benefits of clear-state TC glazing for passive solar heating and drive up lighting energy use. Notwithstanding, excessively high Asol can be unfavourable in ‘summer’ too as it can contribute to elevated window temperatures and thermal loads.
The roller shades were engaged for much of the year in the south-facing zones in both cities (up to 95%) on account of high glare, and they remained ‘ON’ significantly longer than any of the TC windows in the study were tinted, including in the north-facing zones with the least daylight (Figure 8). While effective in reducing cooling loads when deployed, roller shades can also lead to increased energy consumption for heating and lighting (see discussion above). The substantial energy savings outweigh this increase even in heating-dominated climates like New York, making roller shades a favoured choice for energy efficiency. However, their use in office buildings limits access to natural views and daylight, the lack of which has been linked to physiological symptoms in employees [52]. TC windows can match the energy-saving performance of these traditional shading mechanisms without compromising the view. Despite this, excessive/inadequate daylighting can potentially cause visual discomfort (glare). As such, the next section assesses the daylighting performance of the simulated window constructions.

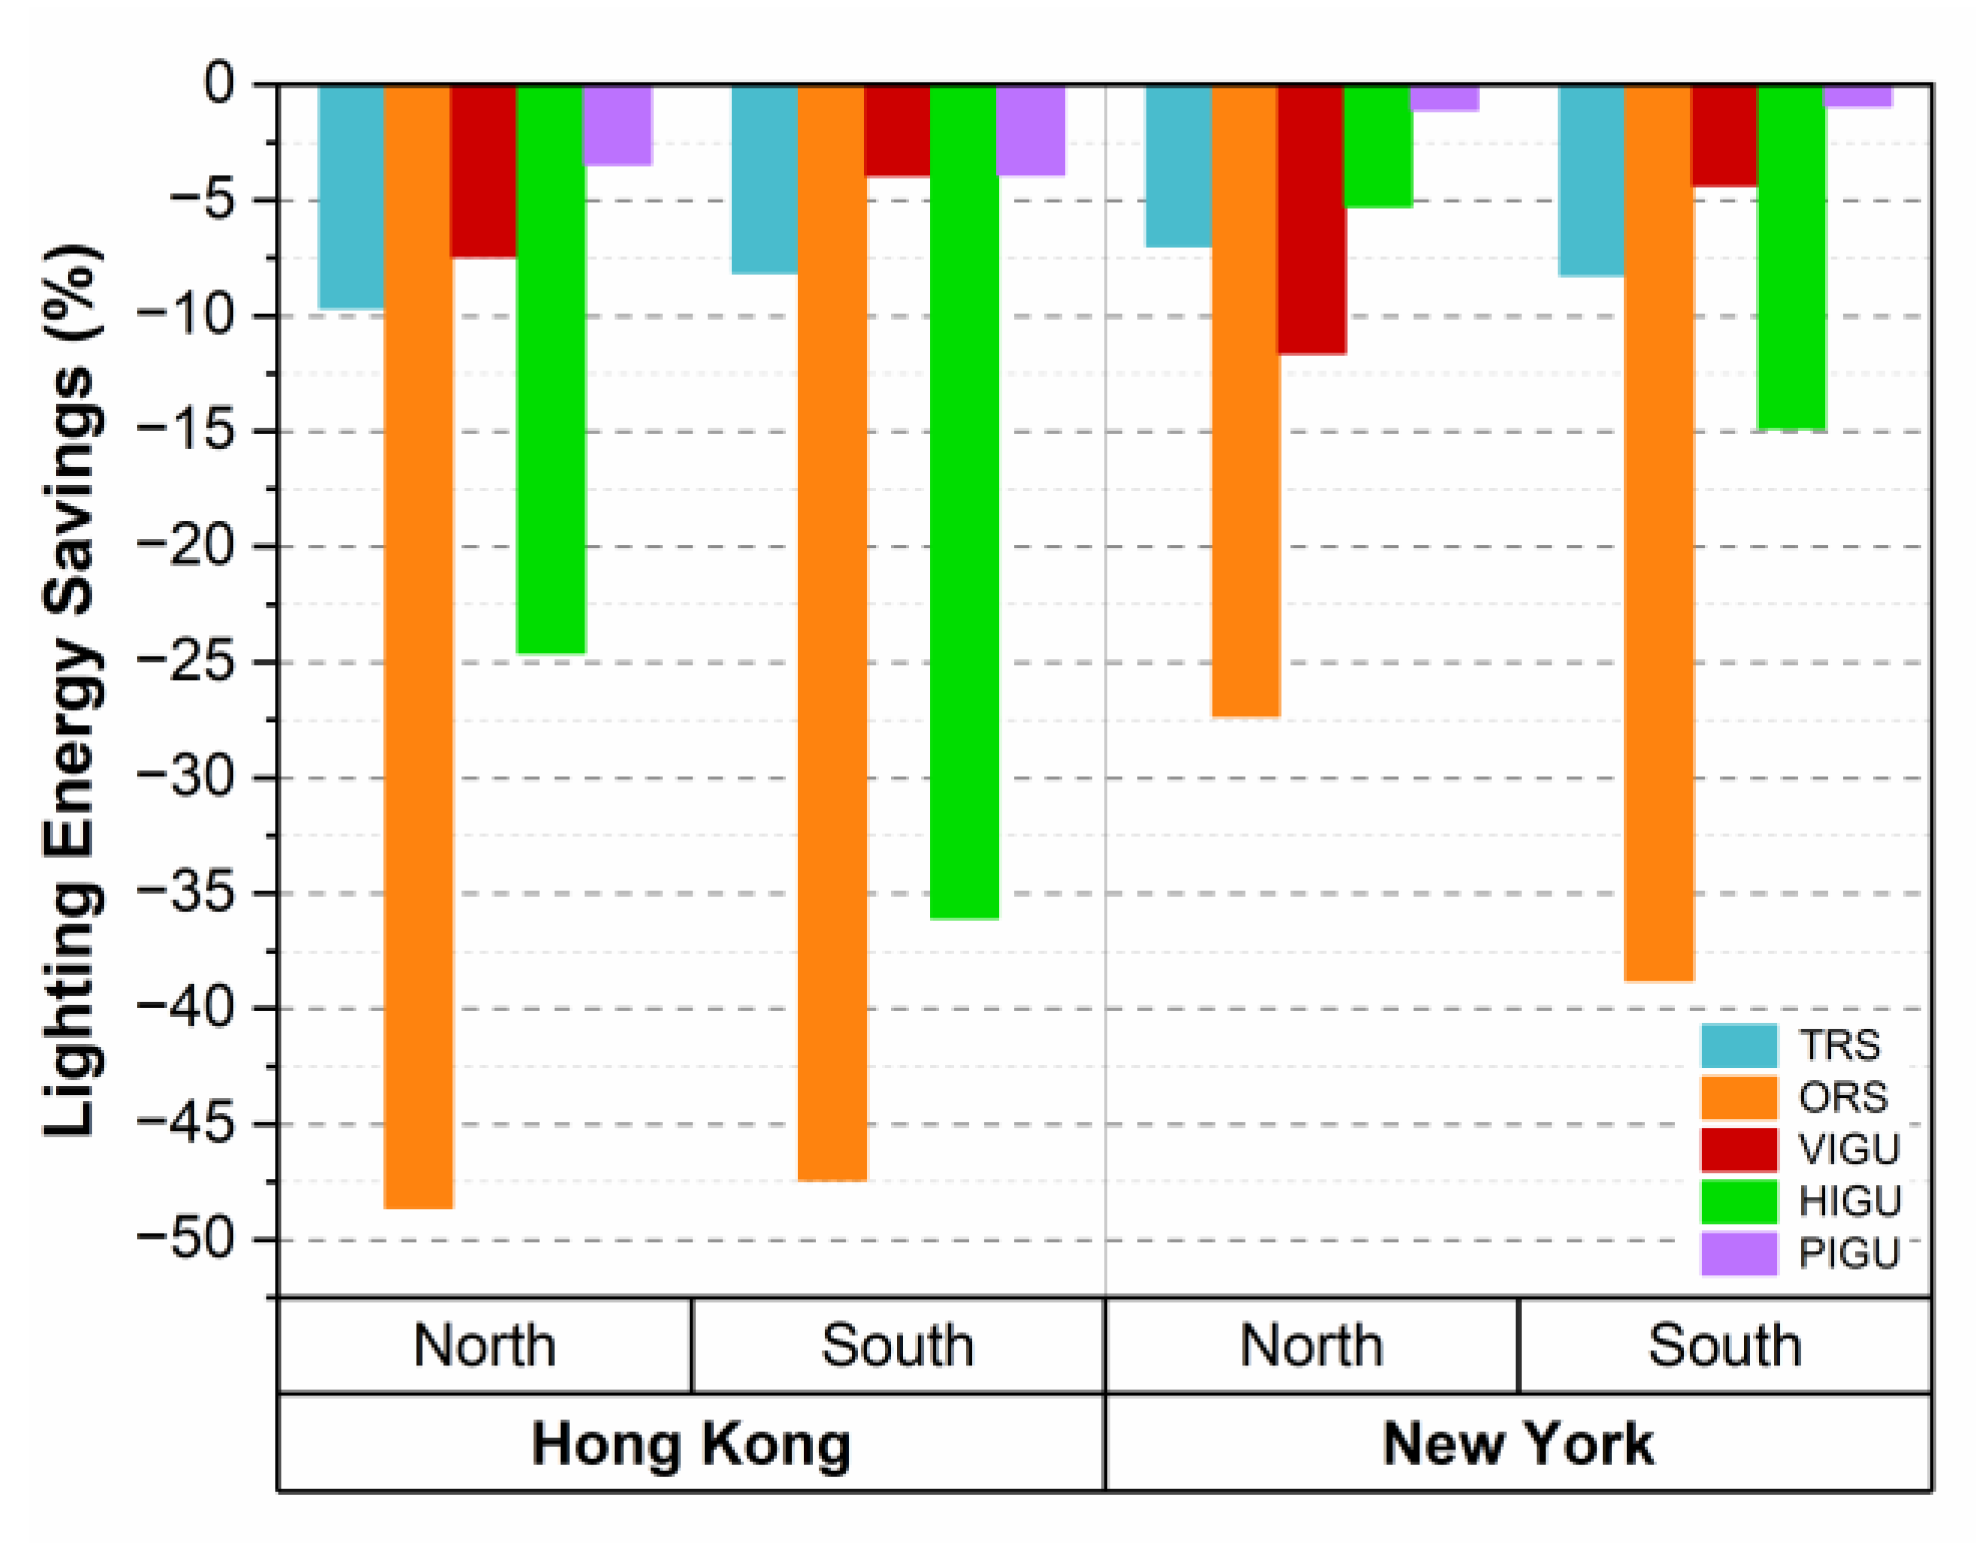
3.4. Daylighting Performance (40% WWR)

In all cities and orientations, the roller shades were effective in reducing excessive daylight (relative to the baseline) but increased the under-lit hours close to the window. Conversely, all TC windows reduced the under-lit hours compared to the opaque roller shades but increased the over-lit hours.
The UDI calculated at two sensors placed in north- and south-facing offices is reported in Figure 9a–d. Sensor 1, located closest to the window, showed approximately 90% over-lit office hours (UDI > 2000 lux) in the base case in both cities. While excess daylighting can reduce the reliance on supplementary lighting to meet the setpoint illuminance level, it can also lead to elevated heat loads and/or visual discomfort (glare). PIGU was marginally better than the baseline, averaging 86.5% oversupplied working hours annually in south-facing offices. The highly opaque roller shades showed the biggest improvement in well-lit hours near south-facing windows (58.2% on average) with only 16.4% over-lit hours on average. In north-facing offices, which receive the least sunlight, the translucent roller shades and VIGU had the most well-lit hours (66.8% in New York and 49.1% in Hong Kong). When used with north-facing windows, the opaque roller shades accumulated significantly more under-lit hours, which reduced the overall well-lit hours.
Further away from the window (Sensor 2), the poorest daylight availability was measured for opaque roller shades: only 25.5% well-lit (74.5% under-lit) office hours on average in New York and 21.7% well-lit (78.3% under-lit) in Hong Kong. South-facing windows with translucent roller shades, VIGU and PIGU had comparable daylight availabilities in both cities and the most well-lit hours away from the window, averaging 52.3% in New York and 64.0% in Hong Kong. For north-facing facades, the baseline and PIGU reported the most well-lit office hours (74% in New York and 84% in Hong Kong). Despite its ultra-low hot-state luminous transmittance (Tlum), the daylighting performance of HIGU was moderate, likely a result of its comparatively high cold-state Tlum. At the studied WWR of 40%, the daylight distribution was highly irregular, i.e., there was a large disparity between the well-lit hours reported by Sensor 1 and Sensor 2. This could be an additional source of visual discomfort (glare).

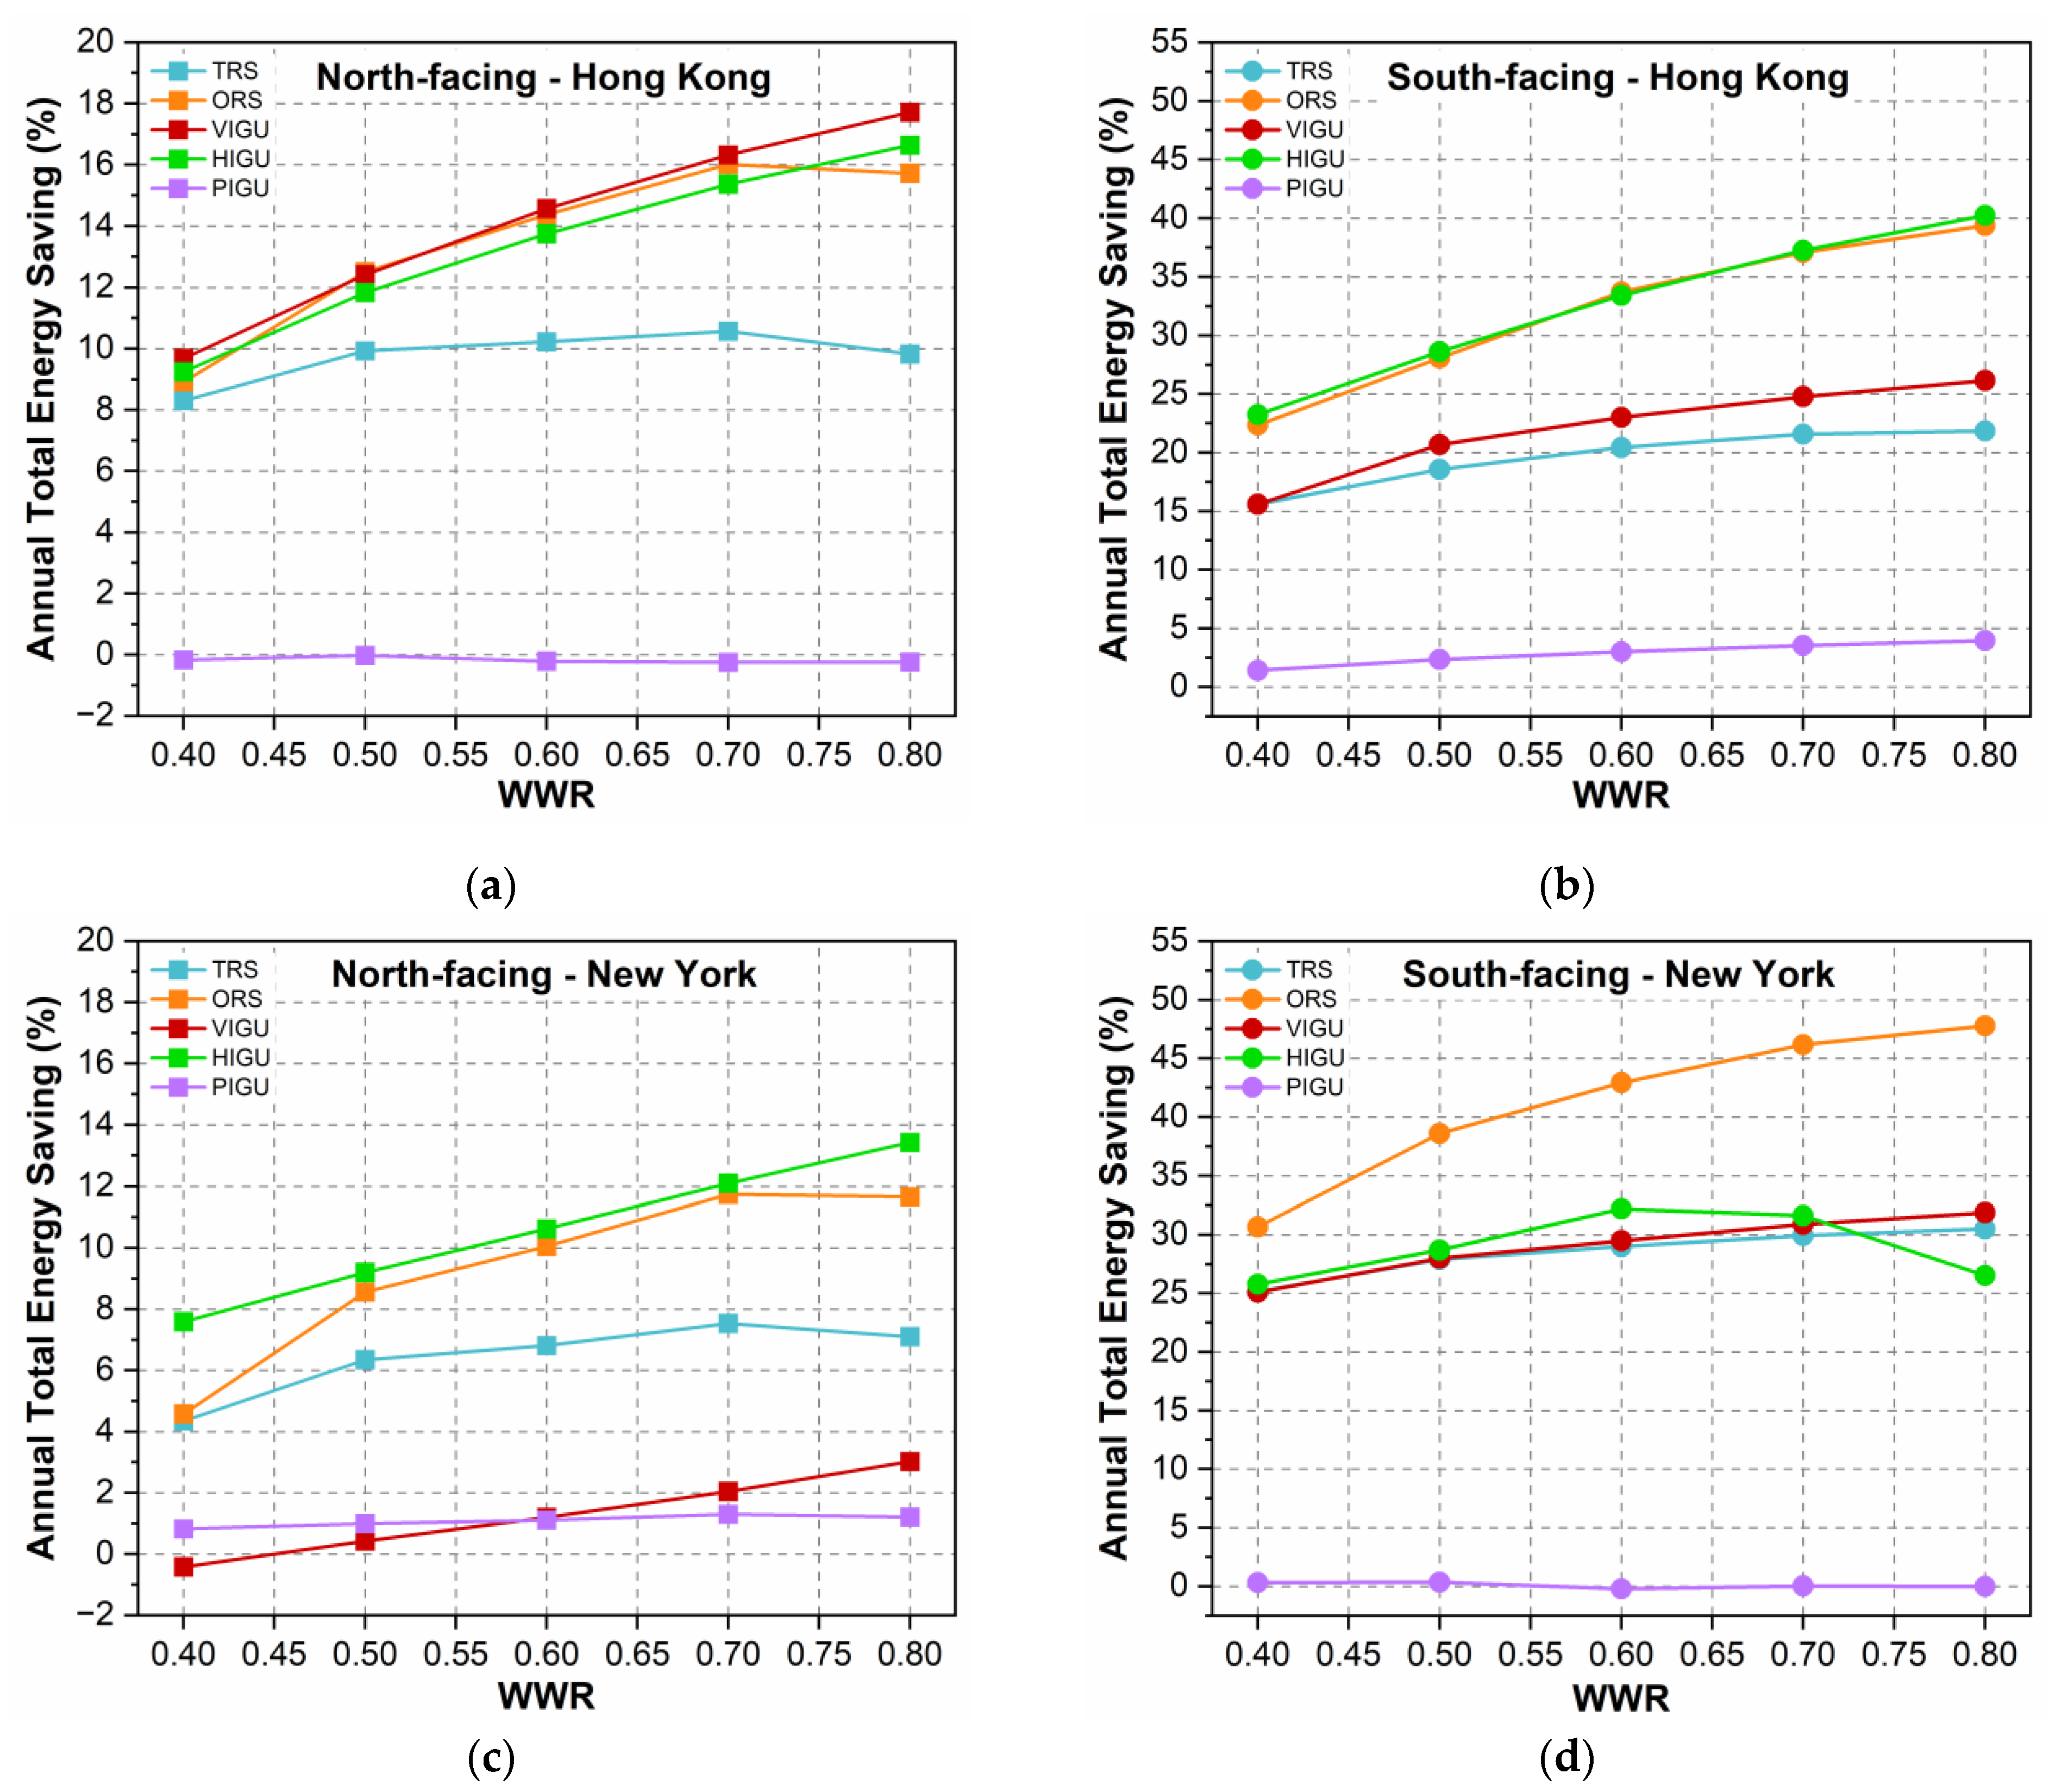
3.5. Energy Savings and Daylighting Performance by WWR (40–80%)

Five window-to-wall ratios (40%, 50%, 60%, 70%, 80%) were simulated for each of the window constructions and orientations. The results for the north- and south-facing windows are presented in Figure 10. The energy-saving potential was found to increase with the glazed area. At the same time, the well-lit office hours closest to and furthest from the window decreased and increased, respectively (Figure 11). Data for the east and west orientations can be found in the Supplementary Materials. In Hong Kong, HIGU and the opaque roller shades were the preferred solar control, with savings averaging 35.8% and 31.7%, respectively, for 80% WWR. VIGU, which did not perform as well, offered comparable savings only when used for north-facing windows. In New York, HIGU was more energy-efficient than all other windows, except in the south where opaque roller shades saved more energy. This is due to the roller shades remaining engaged throughout much of the year in response to the intense solar radiation incident on south-facing facades. Additionally, the heating energy use penalty for roller shades becomes less negative with WWR, so the cumulative savings are much more significant for larger glazed areas. In all simulated cases, VIGU was more energy-efficient than the translucent roller shades, except when it was used for north-facing windows in heating-dominant conditions: the poor solar availability in this orientation muted the glazing’s heating savings.
Adopting Liang et al.’s concept of balanced illumination (BI) [34], the optimal WWR that saves energy while ensuring visual comfort was identified for each window and orientation. BI uses the ratio of well-lit hours between the two sensors as a metric of daylight distribution inside the office space. When they are equal, i.e., at the intersection point on the graph (Figure 11), it indicates that the environment is relatively evenly lit, minimising the risk of glare. The corresponding WWR is the BI.
Table 4 below summarises the optimal WWR determined using this approach. Here, optimal refers to simultaneous energy savings and visual comfort, not maximum savings. All simulated windows were more energy-efficient than the baseline (except VIGU and PIGU in some configurations in New York). Therefore, the optimal WWR was dependent only on the respective daylighting distribution (BI). PIGU did not achieve simultaneous visual comfort and energy savings in any of the studied configurations. For most window configurations that did, the percentage of occupied hours that met the well-lit conditions at both daylighting reference points exceeded 40%. VIGU saw more success in New York, while HIGU appeared more suited to the hot and sunny conditions of Hong Kong, where its ‘switching’ was more likely to coincide with instances of high daylight illuminance. Roller shades were more suited for larger WWRs. Larger fenestrated surfaces admit more daylight into the space, enough to sufficiently reduce the shades’ under-lit hours and thereby achieve visual comfort. None of the shading mechanisms or solar control glazings in this study could ensure both energy efficiency and visual comfort for south-facing windows in New York. In Hong Kong, only HIGU could do so, but only when used for smaller WWRs (40%). The abundance of solar radiation in this orientation makes it difficult to avoid glare: roller shades triggered by high luminance remain engaged for most of the year, so the space is under-lit, and the diminished Tsol of tinted TC windows still accumulates a large number of over-lit hours. However, if the window area is sufficiently small, visual comfort may be achieved (see Hong Kong, 40% WWR).

4. Conclusions

This study investigated the potential of three types of smart glazing with distinct thermochromic responses to replace roller shades of different degrees of transparency, as a solar control mechanism in a typical office building in Hong Kong and New York. The broadband thermochromism of the hydrogel glazing allows significant savings in both heating- and cooling-dominated climates. NIR-modulating VO2 glazing is also energy-efficient, but its saving potential is comparatively lower. It can lead to energy penalties when used in sunlight-deficient orientations in heating-dominated climates. The TC-Perovskite glazing, whose thermochromism coincides with the visible wavelength range, offered significantly lower savings. The TC windows were found to match (and exceed) the energy-saving performance of manually controlled roller shades. In terms of energy efficiency, the broadband thermochromic HIGU was found to outperform opaque roller shades in all simulated orientations, cities and WWRs, except when used as south-facing windows in heating-dominated New York. The NIR-modulating VO2 film was a suitable replacement for translucent roller shades, in all cases but north-facing windows in New York. However, the TC-Perovskite-based glazing from this study was unable to yield savings comparable to the roller shades. These glazings would likely benefit from the incorporation of a solar absorptive layer to (1) mute Tsol and thereby reduce solar heat gain and (2) lower the temperature and radiation requirements to trigger their thermochromism.
In all simulated cases, the smart glazing remains ‘active’ for far less time than the roller shades are deployed. This allows unrestricted access to the view and reduced hours of undersupplied daylighting, which benefit not only occupant well-being but also artificial lighting energy use. However, increased instances of over-lit hours are a source of concern, as they can cause glare discomfort and increased heating loads. Therefore, this study also examined the daylight distribution and thereafter identified the optimal WWR that allows both energy savings and visual comfort to be achieved. Hydrogel-based insulated glass units are both energy- and daylight-efficient in Hong Kong when the WWR is ~40%. VO2 glazing is favoured in New York. Roller shades can also achieve simultaneous energy savings and visual comfort but require much larger glazing areas. TC-Perovskite films fail to do so.
It is important to consider that the adoption of thermochromic glazings as a shading mechanism not only depends on their utility over roller shades. The overall aesthetic quality of the glazing, too, is a significant consideration in architectural decision-making. Therefore, the appearance of the glazing must also be factored in when making comparisons: the tungsten-doped VO2 from this study is grey–blue and the TC-Perovskite reddish-brown; the hydrogel glazing is specular in its tinted state. Modern architectural practices are embracing the use of bold and diverse colours for building facades. This can contribute to TC glazing’s popularity over conventional window materials. Hydrogels, in particular, can be adapted with organic dyes. However, while the glazing materials in this study have been demonstrated to maintain their solar modulation performance after rigorous thermal cycling, the influence of ageing and weatherability on their performance warrants additional research. Moreover, little has been written about the cost of scaling up and their potential for commercialisation.
This work focused on only two climates with different energy demands. For a more thorough analysis of daylighting performance, multiple cities with different solar latitudes should be considered to account for diverse solar availabilities. The influence of different shade control strategies (e.g., automatic glare control) and the glazing’s critical transition temperatures also warrants investigation. Moreover, the simulation model utilises a simplified daylighting expression and discounts the glazing’s hysteresis behaviour, which can introduce some error into the daylight autonomy and savings calculations. For this reason, it may be necessary to follow up with a field study to verify these findings.

Supplementary Materials

The following supporting information can be downloaded at: https://www.mdpi.com/article/10.3390/buildings14041157/s1, Figure S1: Annual site energy savings for east- and west-facing windows as a function of WWR and window construction in (a,b) Hong Kong and (c,d) New York; Figure S2: Percentage of under-lit (UDI<500), well-lit (UDI500–2000) and over-lit (UDI>2000) office hours for east- and west-facing windows in (a,b) Hong Kong and (c,d) New York; Figure S3: Daylighting performance for east- and west-facing windows in (a,b) Hong Kong and (c,d) New York measured by Sensor 1 (solid line) and Sensor 2 (dashed line).

Author Contributions

Conceptualiation, C.Y.-H.C.; methodology, Y.-H.C.; writing—original draft preparation, T.T.; writing—review and editing, T.T., Y.-H.C. and K.-C.C.; supervision, C.Y.-H.C., C.W., K.-C.C. and S.-C.F. All authors have read and agreed to the published version of the manuscript.

Funding

This work was supported by a grant from the Research Impact Fund (no. R1018-22), the Research Grants Council of the Hong Kong Special Administrative Region, China, and funded by the Policy Research Centre for Innovation and Technology (PReCIT), The Hong Kong Polytechnic University, Financial Support for Non-PAIR Research Centres (Projects no. PolyU P0043833), and Start-up Fund for RAPs under the Strategic Hiring Scheme from PolyU (UGC) (Projects no. PolyU P0046277).

Data Availability Statement

The original contributions presented in the study are included in the article/Supplementary Materials; further inquiries can be directed to the corresponding author/s.

Conflicts of Interest

The authors declare no conflicts of interest.

Abbreviations

AbbreviationMeaning
AsolSolar absorptance
BIBalanced illuminance
CDD65Cooling degree days (65 F)
ε t h e r m a l Thermal emittance
Δ ε t h e r m a l Thermal modulation efficiency
HDD65Heating degree days (65 F)
HIGUHydrogel incorporated IGU
HVACHeating, ventilation, and air conditioning
IGUInsulated glass unit
NIRNear-infrared
NoTCReference IGU with clear glass
ORSRSo incorporated IGU
PIGUTC-Perovskite-incorporated IGU
PNIPAmPoly(N-isopropylacrylamide)
RSRoller shades
RSoOpaque roller shades
RStTransparent roller shades
TCThermochromic
TcCritical transition temperature
TIRThermal infrared
TlumVisible light transmittance
TRSRSt incorporated IGU
TsolSolar transmittance
ΔTsolSolar modulation efficiency
UDIUseful daylight illuminance
UVUltraviolet
VIGUVO2-incorporated IGU
VO2Vanadium dioxide
WWRWindow-to-wall ratio

References

  1. Kerry, J.; McCarthy, G. The Long-Term Strategy of the United States, Pathways to Net-Zero Greenhouse Gas Emissions by 2050; The United States Department of State and the United States Executive Office of the President: Washington, DC, USA, 2021.
  2. Aldhshan, S.R.; Abdul Maulud, K.N.; Wan Mohd Jaafar, W.S.; Karim, O.A.; Pradhan, B. Energy consumption and spatial assessment of renewable energy penetration and building energy efficiency in Malaysia: A review. Sustainability 2021, 13, 9244. [Google Scholar] [CrossRef]
  3. Lee, J.-W.; Jung, H.-J.; Park, J.-Y.; Lee, J.; Yoon, Y. Optimization of building window system in Asian regions by analyzing solar heat gain and daylighting elements. Renew. Energy 2013, 50, 522–531. [Google Scholar] [CrossRef]
  4. Jelle, B.P.; Hynd, A.; Gustavsen, A.; Arasteh, D.; Goudey, H.; Hart, R. Fenestration of today and tomorrow: A state-of-the-art review and future research opportunities. Sol. Energy Mater. Sol. Cells 2012, 96, 1–28. [Google Scholar] [CrossRef]
  5. Elghamry, R.; Hassan, H. Impact of window parameters on the building envelope on the thermal comfort, energy consumption and cost and environment. Int. J. Vent. 2020, 19, 233–259. [Google Scholar] [CrossRef]
  6. Goia, F. Search for the optimal window-to-wall ratio in office buildings in different European climates and the implications on total energy saving potential. Sol. Energy 2016, 132, 467–492. [Google Scholar] [CrossRef]
  7. Troup, L.; Phillips, R.; Eckelman, M.J.; Fannon, D. Effect of window-to-wall ratio on measured energy consumption in US office buildings. Energy Build. 2019, 203, 109434. [Google Scholar] [CrossRef]
  8. Evola, G.; Gullo, F.; Marletta, L. The role of shading devices to improve thermal and visual comfort in existing glazed buildings. Energy Procedia 2017, 134, 346–355. [Google Scholar] [CrossRef]
  9. Wankanapon, P.; Mistrick, R.G. Roller shades and automatic lighting control with solar radiation control strategies. Int. J. Build. Urban Inter. Landsc. Technol. 2011, 1, 37–46. [Google Scholar]
  10. Kamaruzzaman, S.N.; Edwards, R.; Zawawi, E.M.A.; Che-Ani, A.I. Achieving energy and cost savings through simple daylighting control in tropical historic buildings. Energy Build. 2015, 90, 85–93. [Google Scholar] [CrossRef]
  11. Chen, Y.; Liu, J.; Pei, J.; Cao, X.; Chen, Q.; Jiang, Y. Experimental and simulation study on the performance of daylighting in an industrial building and its energy saving potential. Energy Build. 2014, 73, 184–191. [Google Scholar] [CrossRef]
  12. Choi, Y.; Ozaki, A.; Lee, H. Impact of window frames on annual energy consumption of residential buildings and its contribution to CO2 emission reductions at the city scale. Energies 2022, 15, 3692. [Google Scholar] [CrossRef]
  13. Jiang, W.; Liu, B.; Zhang, X.; Zhang, T.; Li, D.; Ma, L. Energy performance of window with PCM frame. Sustain. Energy Technol. Assess. 2021, 45, 101109. [Google Scholar] [CrossRef]
  14. Hee, W.; Alghoul, M.; Bakhtyar, B.; Elayeb, O.; Shameri, M.; Alrubaih, M.; Sopian, K. The role of window glazing on daylighting and energy saving in buildings. Renew. Sustain. Energy Rev. 2015, 42, 323–343. [Google Scholar] [CrossRef]
  15. Buratti, C.; Moretti, E. Glazing systems with silica aerogel for energy savings in buildings. Appl. Energy 2012, 98, 396–403. [Google Scholar] [CrossRef]
  16. Yin, R.; Xu, P.; Shen, P. Case study: Energy savings from solar window film in two commercial buildings in Shanghai. Energy Build. 2012, 45, 132–140. [Google Scholar] [CrossRef]
  17. Li, S.-Y.; Niklasson, G.A.; Granqvist, C.-G. Nanothermochromics: Calculations for VO2 nanoparticles in dielectric hosts show much improved luminous transmittance and solar energy transmittance modulation. J. Appl. Phys. 2010, 108, 063525. [Google Scholar] [CrossRef]
  18. Shen, N.; Chen, S.; Shi, R.; Niu, S.; Amini, A.; Cheng, C. Phase transition hysteresis of tungsten doped VO2 synergistically boosts the function of smart windows in ambient conditions. ACS Appl. Electron. Mater. 2021, 3, 3648–3656. [Google Scholar] [CrossRef]
  19. Ji, C.; Wu, Z.; Wu, X.; Wang, J.; Gou, J.; Huang, Z.; Zhou, H.; Yao, W.; Jiang, Y. Al-doped VO2 films as smart window coatings: Reduced phase transition temperature and improved thermochromic performance. Sol. Energy Mater. Sol. Cells 2018, 176, 174–180. [Google Scholar] [CrossRef]
  20. Dietrich, M.K.; Kramm, B.G.; Becker, M.; Meyer, B.K.; Polity, A.; Klar, P.J. Influence of doping with alkaline earth metals on the optical properties of thermochromic VO2. J. Appl. Phys. 2015, 117, 185301. [Google Scholar] [CrossRef]
  21. Li, X.-H.; Liu, C.; Feng, S.-P.; Fang, N.X. Broadband light management with thermochromic hydrogel microparticles for smart windows. Joule 2019, 3, 290–302. [Google Scholar] [CrossRef]
  22. Lin, C.; Hur, J.; Chao, C.Y.; Liu, G.; Yao, S.; Li, W.; Huang, B. All-weather thermochromic windows for synchronous solar and thermal radiation regulation. Sci. Adv. 2022, 8, eabn7359. [Google Scholar] [CrossRef] [PubMed]
  23. Zhou, Y.; Cai, Y.; Hu, X.; Long, Y. Temperature-responsive hydrogel with ultra-large solar modulation and high luminous transmission for “smart window” applications. J. Mater. Chem. A 2014, 2, 13550–13555. [Google Scholar] [CrossRef]
  24. Ke, Y.; Zhou, C.; Zhou, Y.; Wang, S.; Chan, S.H.; Long, Y. Emerging thermal-responsive materials and integrated techniques targeting the energy-efficient smart window application. Adv. Funct. Mater. 2018, 28, 1800113. [Google Scholar] [CrossRef]
  25. Liu, S.; Li, Y.; Wang, Y.; Yu, K.M.; Huang, B.; Tso, C.Y. Near-infrared-activated thermochromic Perovskite smart windows. Adv. Sci. 2022, 9, 2106090. [Google Scholar] [CrossRef] [PubMed]
  26. Liu, S.; Du, Y.W.; Tso, C.Y.; Lee, H.H.; Cheng, R.; Feng, S.P.; Yu, K.M. Organic hybrid perovskite (MAPbI3−xClx) for thermochromic smart window with strong optical regulation ability, low transition temperature, and narrow hysteresis width. Adv. Funct. Mater. 2021, 31, 2010426. [Google Scholar] [CrossRef]
  27. Rosales, B.A.; Mundt, L.E.; Allen, T.G.; Moore, D.T.; Prince, K.J.; Wolden, C.A.; Rumbles, G.; Schelhas, L.T.; Wheeler, L.M. Reversible multicolor chromism in layered formamidinium metal halide perovskites. Nat. Commun. 2020, 11, 5234. [Google Scholar] [CrossRef]
  28. Sharma, S.K.; Phadnis, C.; Das, T.K.; Kumar, A.; Kavaipatti, B.; Chowdhury, A.; Yella, A. Reversible dimensionality tuning of hybrid perovskites with humidity: Visualization and application to stable solar cells. Chem. Mater. 2019, 31, 3111–3117. [Google Scholar] [CrossRef]
  29. Halder, A.; Choudhury, D.; Ghosh, S.; Subbiah, A.S.; Sarkar, S.K. Exploring thermochromic behavior of hydrated hybrid perovskites in solar cells. J. Phys. Chem. Lett. 2015, 6, 3180–3184. [Google Scholar] [CrossRef]
  30. Zhang, Y.; Tso, C.; Iñigo, J.S.; Liu, S.; Miyazaki, H.; Chao, C.Y.; Yu, K.M. Perovskite thermochromic smart window: Advanced optical properties and low transition temperature. Appl. Energy 2019, 254, 113690. [Google Scholar]
  31. Chan, Y.H.; Zhang, Y.; Tennakoon, T.; Fu, S.C.; Chan, K.C.; Tso, C.Y.; Yu, K.M.; Wan, M.P.; Huang, B.L.; Yao, S. Potential passive cooling methods based on radiation controls in buildings. Energy Convers. Manag. 2022, 272, 116342. [Google Scholar]
  32. Saeli, M.; Piccirillo, C.; Parkin, I.P.; Binions, R.; Ridley, I. Energy modelling studies of thermochromic glazing. Energy Build. 2010, 42, 1666–1673. [Google Scholar] [CrossRef]
  33. Hoffmann, S.; Lee, E.S.; Clavero, C. Examination of the technical potential of near-infrared switching thermochromic windows for commercial building applications. Sol. Energy Mater. Sol. Cells 2014, 123, 65–80. [Google Scholar] [CrossRef]
  34. Liang, R.; Sun, Y.; Aburas, M.; Wilson, R.; Wu, Y. Evaluation of the thermal and optical performance of thermochromic windows for office buildings in China. Energy Build. 2018, 176, 216–231. [Google Scholar] [CrossRef]
  35. Zhang, Y.; Tennakoon, T.; Chan, Y.H.; Chan, K.C.; Fu, S.C.; Tso, C.Y.; Yu, K.M.; Huang, B.L.; Yao, S.H.; Qiu, H.H. Energy consumption modelling of a passive hybrid system for office buildings in different climates. Energy 2022, 239, 121914. [Google Scholar] [CrossRef]
  36. Detsi, M.; Manolitsis, A.; Atsonios, I.; Mandilaras, I.; Founti, M. Energy savings in an office building with high WWR using glazing systems combining thermochromic and electrochromic layers. Energies 2020, 13, 3020. [Google Scholar] [CrossRef]
  37. Costanzo, V.; Evola, G.; Marletta, L. Thermal and visual performance of real and theoretical thermochromic glazing solutions for office buildings. Sol. Energy Mater. Sol. Cells 2016, 149, 110–120. [Google Scholar] [CrossRef]
  38. Ding, Y.; Zhong, C.; Yang, F.; Kang, Z.; Li, B.; Duan, Y.; Zhao, Z.; Song, X.; Xiong, Y.; Guo, S. Low energy consumption thermochromic smart windows with flexibly regulated photothermal gain and radiation cooling. Appl. Energy 2023, 348, 121598. [Google Scholar] [CrossRef]
  39. Aburas, M.; Soebarto, V.; Williamson, T.; Liang, R.; Ebendorff-Heidepriem, H.; Wu, Y. Thermochromic smart window technologies for building application: A review. Appl. Energy 2019, 255, 113522. [Google Scholar] [CrossRef]
  40. Wu, S.; Sun, H.; Duan, M.; Mao, H.; Wu, Y.; Zhao, H.; Lin, B. Applications of thermochromic and electrochromic smart windows: Materials to buildings. Cell Rep. Phys. Sci. 2023, 4, 101370. [Google Scholar] [CrossRef]
  41. Teixeira, H.; Gomes, M.G.; Rodrigues, A.M.; Aelenei, D. Assessment of the visual, thermal and energy performance of static vs thermochromic double-glazing under different European climates. Build. Environ. 2022, 217, 109115. [Google Scholar] [CrossRef]
  42. Ye, H.; Meng, X.; Xu, B. Theoretical discussions of perfect window, ideal near infrared solar spectrum regulating window and current thermochromic window. Energy Build. 2012, 49, 164–172. [Google Scholar] [CrossRef]
  43. Butt, A.A.; de Vries, S.B.; Loonen, R.C.; Hensen, J.L.; Stuiver, A.; van den Ham, J.E.; Erich, B.S. Investigating the energy saving potential of thermochromic coatings on building envelopes. Appl. Energy 2021, 291, 116788. [Google Scholar] [CrossRef]
  44. Crawley, D.B.; Lawrie, L.K.; Winkelmann, F.C.; Buhl, W.F.; Huang, Y.J.; Pedersen, C.O.; Strand, R.K.; Liesen, R.J.; Fisher, D.E.; Witte, M.J. EnergyPlus: Creating a new-generation building energy simulation program. Energy Build. 2001, 33, 319–331. [Google Scholar] [CrossRef]
  45. Standard 90.1-2022; Energy Standard for Buildings Except Low-Rise Residential Buildings. American Society of Heating, Refrigerating and Air-Conditioning Engineers, Inc: Atlanta, GA, USA, 2022.
  46. Kumar, D.; Alam, M.; Zou, P.X.; Sanjayan, J.G.; Memon, R.A. Comparative analysis of building insulation material properties and performance. Renew. Sustain. Energy Rev. 2020, 131, 110038. [Google Scholar] [CrossRef]
  47. Blackman, C.S.; Piccirillo, C.; Binions, R.; Parkin, I.P. Atmospheric pressure chemical vapour deposition of thermochromic tungsten doped vanadium dioxide thin films for use in architectural glazing. Thin Solid Film. 2009, 517, 4565–4570. [Google Scholar] [CrossRef]
  48. Garretón, J.A.Y.; Colombo, E.M.; Pattini, A.E. A global evaluation of discomfort glare metrics in real office spaces with presence of direct sunlight. Energy Build. 2018, 166, 145–153. [Google Scholar] [CrossRef]
  49. Teichmann, E.W.; Kelbassa, J.; Gasser, A.; Tarner, S.; Schleifenbaum, J.H. Effect of wire feeder force control on laser metal deposition process using coaxial laser head. J. Laser Appl. 2021, 33, 012041. [Google Scholar] [CrossRef]
  50. Nabil, A.; Mardaljevic, J. Useful daylight illuminances: A replacement for daylight factors. Energy Build. 2006, 38, 905–913. [Google Scholar] [CrossRef]
  51. Singh, R.; Lazarus, I.J.; Kishore, V. Effect of internal woven roller shade and glazing on the energy and daylighting performances of an office building in the cold climate of Shillong. Appl. Energy 2015, 159, 317–333. [Google Scholar] [CrossRef]
  52. Harb, F.; Hidalgo, M.P.; Martau, B. Lack of exposure to natural light in the workspace is associated with physiological, sleep and depressive symptoms. Chronobiol. Int. 2015, 32, 368–375. [Google Scholar] [CrossRef]
Figure 1. Modelled office room measuring 6 m × 6 m × 4 m.
Buildings 14 01157 g001
Figure 2. (a) NoTC reference, (b) thermochromic (VO2-based VIGU, hydrogel-based HIGU and TC-Perovskite-based PIGU), and (c) shaded (with opaque/translucent roller shades) window configurations.
Buildings 14 01157 g002
Figure 3. (a) Transmittance spectra of VO2 (V), hydrogel (H) and TC-Perovskite (P) glazing, and (b) thermal reflectance spectra of H in clear/cold (solid line) and tinted/hot states (dashed line). The long-wave properties of V and P are not included as their silicon dioxide substrate is near-opaque to TIR, i.e., thermal tuning is not a feature.
Buildings 14 01157 g003aBuildings 14 01157 g003b
Figure 4. Annual site energy use intensity and savings (calculated against NoTC baseline) reported by orientation for (a) Hong Kong and (b) New York.
Buildings 14 01157 g004aBuildings 14 01157 g004b
Figure 5. (a) Annual heating energy savings in New York; (b) window heat gain and (c) loss during the coldest month in New York (January, occupied hours only); (d) annual cooling energy savings in Hong Kong; (e) window heat gain during the hottest month in Hong Kong (July, occupied hours only). All data reported for south-facing windows.
Buildings 14 01157 g005
Figure 6. Annual lighting energy savings in Hong Kong and New York for offices with north- and south-facing windows.
Buildings 14 01157 g006
Figure 7. The switching behaviour of the VO2 (V), hydrogel (H) and TC-Perovskite (P) glazings during working hours in (ac) Hong Kong and (df) New York, as a function of ambient temperature and incident solar radiation.
Buildings 14 01157 g007
Figure 8. Tinted hours for TC glazings and roller shade engagement reported as annual percentages (of working hours) for north- and south-facing windows in (a) Hong Kong and (b) New York.
Buildings 14 01157 g008
Figure 9. Percentage of under-lit (UDI<500), well-lit (UDI500–2000) and over-lit (UDI>2000) office hours for north- and south-facing windows in (a,b) Hong Kong and (c,d) New York.
Buildings 14 01157 g009aBuildings 14 01157 g009b
Figure 10. Annual site energy savings for north- and south-facing windows as a function of WWR and window construction in (a,b) Hong Kong and (c,d) New York.
Buildings 14 01157 g010
Figure 11. Daylighting performance for north- and south-facing windows in (a,b) Hong Kong and (c,d) New York measured by Sensor 1 (solid line) and Sensor 2 (dashed line).
Buildings 14 01157 g011aBuildings 14 01157 g011b
Table 1. Climate data for test cases.
RegionHDD65CDD65Heating
Design Temperature
Cooling
Design Temperature
Cloudiness (Hours Annually)
99.6%DryBulbWetBulbClearPartly CloudyCloudy
Hong Kong30547469.6 °C32.2 °C26.5 °C385937471154
New York614763710.7 °C 32.1 °C23.1 °C150421185138
Table 2. Construction assembly of office simulation model.
Hong KongNew York
Exterior WallInterior WallInterior Ceiling/FloorExterior WallInterior WallInterior Ceiling/Floor
Layer 1 (outermost)TileGypsumGypsumStuccoGypsumC/F Concrete
Cement/sandInterior ConcreteC/F ConcreteExterior ConcreteWall AirCeiling Air
Exterior Concrete Insulation 1
Layer N 2 (innermost)GypsumGypsumC/F TileGypsumGypsumAcoustic Tile
U-value 32.135--0.449--
1 XPS is used as insulation in New York models only; 2 N denotes the serial number of layers for the respective wall; 3 U-values of exterior wall calculated by EnergyPlus.
Table 3. Spectral properties of glazing layer and roller shades.
Low-EClearH_coldH_hotP_coldP_hotV_coldV_hotRStRSo
Solar transmittance0.7100.8340.6570.0690.8690.6120.4800.4250.40.1
Solar reflectance0.1900.0750.0760.5540.0870.0880.2250.1910.50.8
Visible transmittance0.8760.8990.7840.0670.8530.3030.4910.4890.40.1
Visible reflectance0.0920.0830.0700.7500.0950.0790.2750.2320.50.8
IR emissivity (inner)0.0680.8400.3500.9200.7740.7850.8400.8400.90.9
Shade to glass distance (m)--------0.050.05
Table 4. Optimal WWR identified for all simulated cases, for which energy and daylighting efficiency are achieved simultaneously.
New YorkHong Kong
TRSORSVHPTRSORSVHP
North60%60%70%40%X 150%80%50%XX
East80%X50%XX40%XX50%X
SouthXXXXXXXX40%X
WestX70%50%XXX60%X40%X
1 X indicates that balanced illumination (BI) was not observed for any of the simulated WWRs.
Disclaimer/Publisher’s Note: The statements, opinions and data contained in all publications are solely those of the individual author(s) and contributor(s) and not of MDPI and/or the editor(s). MDPI and/or the editor(s) disclaim responsibility for any injury to people or property resulting from any ideas, methods, instructions or products referred to in the content.

