Article

Impacts of Low-Carbon Pilot Policies on the Land Green Use Efficiency in Adjacent Non-Pilot Cities: An Empirical Study Based on 257 Prefecture-Level and above Cities in China

1
School of Foreign Languages and Literature, Wuhan University, Wuhan 430072, China
2
College of Public Administration, Central China Normal University, Wuhan 430079, China
*
Author to whom correspondence should be addressed.
Buildings 2024, 14(4), 1163; https://doi.org/10.3390/buildings14041163
Submission received: 22 March 2024 / Revised: 12 April 2024 / Accepted: 16 April 2024 / Published: 19 April 2024
(This article belongs to the Special Issue Sustainable City Development: Urban Planning and Housing Management)

Abstract

:
In the context of global climate change, the low-carbon city pilot policy has become an important strategy to promote green development. Based on the panel data from 257 prefecture-level and above cities in China, this study utilized the Super-Efficiency SBM (Slacks-Based Measure) to measure the land green use efficiency and analyzes the impact of the policy on adjacent non-pilot cities using a difference-in-differences model. The findings indicate that the implementation of low-carbon pilot policies can significantly improve the land green use efficiency in adjacent non-pilot cities, which can be primarily ascribed to the spillover effect and catfish effect. A heterogeneity analysis further revealed the positive effects of the policies in the eastern region and non-resource-based cities. This study provides valuable references for relevant legal provisions on environmental regulation and for continuously monitoring and evaluating the policy effects to achieve sustainable development goals.

1. Introduction

In the context of global climate change and increasing environmental pressures, low-carbon development has become a global consensus and national strategy [1]. As the world’s largest developing country and carbon dioxide emitters [2], the Chinese government proposed the goals of achieving “carbon peak” by 2030 and “carbon neutrality” by 2060. Against this background, low-carbon pilot projects have been initiated in multiple cities and regions. Low-carbon pilot policies are a decentralized environmental governance model that adopts differentiated measures based on the environmental issues of different regions. In 2010, the “Notice on Carrying out Pilot Work in Low-carbon Provinces and Low-Carbon Cities” (hereinafter referred to as the “Notice”) identified five provinces (Guangdong, Liaoning, Hubei, Shaanxi, and Yunnan) and eight cities (Tianjin, Chongqing, Shenzhen, Xiamen, Hangzhou, Nanchang, Guiyang, and Baoding) as pilot low-carbon cities. Subsequently, in April 2012, the second batch of low-carbon city pilot projects was identified, and in November of the same year, the “Notice on Carrying out the Second Batch of National Low-carbon Provinces and Low-carbon Cities Pilot Projects” was issued, including 28 more cities or provinces such as Hainan Province as low-carbon pilot cities or provinces. In 2017, the National Development and Reform Commission (NDRC) launched the third batch of low-carbon city pilot projects in 45 cities (districts, counties), including Wuhai City in the Inner Mongolia Autonomous Region (Figure 1). The low-carbon pilot policy, as a comprehensive environmental regulation, is an exploratory attempt of the central government to address resource constraints and improve environmental capacities. The government of each pilot project has transformed “ecological resistance” into “development impetus”, which has contributed to strong green growth in large-scale cities [3,4]. These policies not only affect the pilot cities, but also have potential effects on adjacent non-pilot cities. Neighboring non-pilot cities refer to cities that are spatially adjacent to those implementing low-carbon pilot policies but have not implemented low-carbon policies themselves. In particular, the adjacent non-pilot cities are more susceptible to the impact of pilot policies and exhibit strong spatial dependence due to their geographical proximity [5]. Non-pilot cities are not only important battlegrounds for further reforms, but also the main force for testing pilot achievements and achieving comprehensive reforms. Based on the “neighborhood effect” of policy diffusion in the spatial dimension [6], adjacent non-pilot cities demonstrate significant advantages for comparison.
As the basic resource of urban development, land green use efficiency is directly related to the ecological environment quality and sustainable development ability of the city. As a hot topic in academia, land use efficiency has been mainly concerned about the ratio between land output and input, which is an important indicator used to measure the optimal allocation and sustainable development of land resources. However, environmental pollution and the degradation of natural ecosystems have significantly reduced the efficiency of urban land use, further constraining urban sustainable development [7]. As a global concern of sustainable development, the evaluation of land use efficiency now encompasses more than just economic benefits, and also considers environmental and social impacts into consideration. In response to these considerations, researchers have introduced the concept of land green use efficiency [8]. Land green use efficiency refers to the ratio of input factors (land and other elements) and output of land use (including economic, social, and ecological environmental dimensions) under certain production technology conditions within the land use system. This concept not only values economic output, but also considers the environmental benefits, ecological protection, and social well-being of land use from a holistic perspective, providing strong support for the formulation of more scientific and sustainable land use policies. Additionally, the measurement of urban land green use efficiency has evolved from an initial model that only needs single-factor input and single-output to a model that requires multi-factor input and multi-output [9]. These indicators focus on both the quantity and the quality aspects of the output. A case in point is the consideration of “undesirable outputs” such as carbon emissions from land use in urban construction, urban wastewater, and exhaust emissions [10]. In terms of efficiency evaluation models for input–output systems, data envelopment analysis (DEA) [11] and directional distance functions [12] have demonstrated considerable effectiveness. However, the DEA may overestimate efficiency scores when accounting for “undesirable outputs” and the slack in input–output variables, which can arise from the use of directional distance functions in production systems. To address these limitations, TONE proposed the SBM model (slacks-based measure) [13]. Different from traditional efficiency evaluation models, the SBM model incorporates slack variables into the objective function, thereby providing a more precise representation of efficiency losses during actual production. Therefore, this study employed the SBM method to measure the land green use efficiency in cities.
Diffusion theory, a significant branch within public policy research, examines the process through which policies and policy innovations spread and are implemented across various governmental entities [14]. However, the diffusion of low-carbon pilot policies may follow specific paths and patterns, such as top-down hierarchical diffusion, bottom-up absorptive diffusion, interregional and interdepartmental diffusion, and diffusion from regions with advanced policies to follow-up regions. These modes differentially influence the dissemination and implementation of low-carbon pilot policies in adjacent non-pilot cities, yielding positive outcomes for low-carbon development in non-pilot cities; nonetheless, their mechanisms of action and the patterns observed can vary significantly across distinct research contexts [15]. In studies that compared pilot and non-pilot cities to evaluate the effects of low-carbon pilot policies, some policy evaluation methods have been universally adopted, such as the difference-in-differences (DID) [16] and synthetic control methods [17]. These studies typically concentrate on changes before and after the implementation of a policy, as well as differences in effects of a policy between different cities. Low-carbon pilot policies promote the transformation of land use patterns through technological innovation, the adjustment of industrial structure, and some other means so as to improve the land green use efficiency [18]. Accordingly, this study also focused on the regional effects of policy implementation: how policy shifts in pilot cities influence land use efficiency in neighboring non-pilot cities, which may occur through various channels such as market mechanisms, diffusion by technology, and exemplary policies [19].
The subsequent sections of this paper are organized as follows. Section 2 presents a theoretical analysis on the effects of low-carbon policies in pilot cities. Section 3 presents the construction of an econometric regression model and the description of variable measurements and data. Section 4 presents empirical findings and corresponding analyses. Section 5 analyzes the heterogeneity. Conclusions and recommendations of related policies are summarized in the last section.

2. Theoretical Logic and Research Hypothesis

The initiative to develop low-carbon pilot cities represents a visionary approach for China to establish and improve an economic structure conducive to green, low-carbon, and circular development. This is expected to have a profound influence on the realization of carbon emission decoupling and improvement of the ecological environment. The spillover effect of innovative technologies generated by the low-carbon pilot cities and signals transmitted from the incentive policies can narrow the development gap of adjacent non-pilot cities in environmental protection and alleviate the imbalance of the ecological economy. However, the industry transformation and the flow of resources resulting from environmental regulations may also limit the growth potentials of adjacent non-pilot cities and impede the enhancement of land green use efficiency. In order to fully reveal the mechanism for the impact of pilot low-carbon cities on the land green use efficiency in adjacent non-pilot cities, the following analysis will be focused on in two aspects.

2.1. Theoretical Framework for Assessing the Effects of Low-Carbon Pilot Policies on Land Green Use Efficiency in Adjacent Non-Pilot Cities

The low-carbon pilot policies have a significant impact on the land green use efficiency of adjacent non-pilot cities. These policies are essential not only for transforming the conventional development paradigm, but also for reshaping the behavioral patterns of local governance. The low-carbon pilot policies can promote land green use efficiency in adjacent non-pilot cities through a variety of mechanisms, such as demonstrations of best practices, competitive policy formulation, the advancement of environmental stewardship standards, streamlined resource allocation, and heightened environmental consciousness.
First and foremost, low-carbon pilot cities provide successful experiences for adjacent non-pilot cities and stimulate the motivation of non-pilot cities to imitate and learn these experiences. Leveraging the demonstration effect, non-pilot cities can adopt the successful strategies implemented by pilot cities to enhance their own land green use efficiency. In the second place, pressure from competition in policies promotes the governments in non-pilot cities to take proactive measures to improve their performance in environmental governance and opportunities for the promotion of officials; these include implementing policies such as tax incentives and subsidies, which lower costs and attract investors and developers, thereby enhancing land green use efficiency. In addition, the demonstration effect of pilot cities can promote the public and enterprises’ awareness of environmental protection and prompt the residents and enterprises in adjacent non-pilot cities to learn how to utilize the land in a green manner. Last but not least, low-carbon pilot policies can guide the flow of capital and technologies to green industries, optimize the allocation of resources, and attract investment into green industries, thereby improving the land green use efficiency.

2.2. Hypothesis on the Impact of Pilot Policies on the Land Green Use Efficiency in Adjacent Non-Pilot Cities

The implementation of low-carbon pilot policies not only serves as a model for policy innovation, but also catalyzes extensive economic and social interactions. These interactions are manifested as a “spillover effect”; that is, with the promotion of low-carbon city construction, relevant technologies and knowledge will be spread to the surrounding areas through various channels such as trade and personnel exchanges, which will bring about positive impacts on non-pilot cities. This spillover effect not only enhances the dissemination and upgrading of technologies, but also promotes the concept of green development in the surrounding areas at the knowledge level and significantly improves the land green use efficiency. In the spatial dimension, the impacts of geographical distance and geographical proximity on spillover effects cannot be ignored. Moreno [20] and some other scholars used geographical distance as an indicator to measure the strength of the spatial spillover effect. Their empirical research results showed that geographical distance has a significant impact on the economic and technological links between cities. When the geographical distance between two places exceeds a certain threshold, the connection between them will be significantly weakened. Moreover, Jaffe et al. [21] and Greenstone et al. [22] also found that this spillover effect has the characteristics of distance attenuation. Therefore, it is important to consider the relationship between geographical proximity and spillover effect. On the one hand, a closer geographical proximity helps enterprises to more conveniently share resources, knowledge and technologies, thereby promoting knowledge spillover and technological innovation. However, on the other hand, because some tacit knowledge usually relies on “face-to-face” direct communication for dissemination, geographical distance may become a constraint on policy spillover effects. In addition, an excessively close geographical proximity may also lead to excessive concentration and the homogenization of resources, knowledge, and technologies, thereby limiting the generation of spillover effects. Nevertheless, irrespective of the effects’ nature, the spatial spillover from low-carbon city development exerts a more pronounced influence on enhancing land green use efficiency in adjacent non-pilot cities compared to those that are non-adjacent.
Hypothesis 1: 
Low-carbon pilot policies generate a positive “spillover effect” that enhances land green use efficiency in neighboring non-pilot cities.
The “catfish effect” refers to the “advanced” label of low-carbon pilot cities that brings “green” pressure to the adjacent non-pilot cities. Faced with this pressure, the governing officials of the adjacent non-pilot cities pay more attention to improving environmental quality, striving to achieve harmonious coexistence between economic development and environmental protection, which subsequently leads to an enhancement in the efficiency of land green use in the adjacent non-pilot cities [23]. In the context of low-carbon pilot policies, this effect is perfectly realized at the local government level. Due to its pioneering step in green development, the “advanced aura” and potential advantages of the pilot cities not only enhance their own green power, but also have a significant impact on the adjacent non-pilot cities, forming a special geographical proximity “catfish effect”. This phenomenon exerts heightened green pressure on adjacent non-pilot cities. It is easier to observe the green development achievements and policy measures of pilot cities in adjacent non-pilot cities. Because these practices are observable and replicable, neighboring non-pilot cities are likely to pursue green development frameworks with greater vigor, aiming to bridge the sustainability gap with their pilot counterparts. In addition, there will be more intense policy innovation competition between the adjacent non-pilot cities and pilot cities. Due to geographical proximity, there will be more frequent policy exchanges and interactions between the two places, thus promoting the emergence and implementation of more effective environmental governance measures. This competition not only promotes cooperation and communication between local governments, but also stimulates the innovation and enthusiasm of local governments in environmental governance. With the increasing weight of environmental indicators in the official assessment and evaluation system, government officials in adjacent non-pilot cities are faced with greater promotion pressure. They need to re-examine the relationship between economic development and environmental protection, incorporate environmental performance into the comprehensive assessment of cadre promotion, which will prompt officials in adjacent non-pilot cities to pay more attention to the improvement of environmental quality while pursuing economic growth, and strive to achieve a balance between economic development and environmental protection [24,25]. Therefore, compared with non-adjacent non-pilot cities, adjacent non-pilot cities are more significantly affected by the “catfish effect” in the context of low-carbon pilot policies.
Hypothesis 2: 
The low-carbon city pilot policy induces a “catfish effect,” creating “green pressure” that enhances land green use efficiency in neighboring non-pilot cities.
The “pollution haven effect” refers to enhanced environmental regulations resulting from the construction of low-carbon pilot cities, which may drive away high-polluting enterprises, and its effect has a significant proximity characteristic in geographical space, thus potentially leading to a decrease in the land green use efficiency of adjacent non-pilot cities [26]. According to the “pollution haven” hypothesis, environmental regulations will have an impact on dispelling high-polluting enterprises, and this impact has a significant proximity characteristic geographically. This means that regions with lower environmental regulation standards, especially those regions geographically adjacent to high-standard regions, are more likely to suffer from the risk of backward production capacity agglomeration [27], and the economic industrial gap will accelerate this process. The low-carbon city pilot policy may lead to a localized transfer of pollution [28]. Under the pressure of strengthened environmental constraints, high-polluting and high-energy-consuming enterprises will seek migration to neighboring regions with lower environmental regulation standards to reduce the environmental governance and regulatory costs. However, this migration will put the industrial structure of the destination into a new dilemma, exacerbating environmental pollution and carbon emissions. On the one hand, the pilot cities set up financial and technical barriers for industries and enterprises, and even directly shut out some high-energy-consuming and high-polluting ones. On the other hand, local governments usually impose restrictions on the main responsible parties (enterprises) of environmental pollution with carbon taxes and environmental governance fees, thereby reducing the proportion of carbon-intensive enterprises [29]. Compared with non-adjacent non-pilot cities, adjacent non-pilot cities are more similar to pilot cities in terms of industrial structure and resource basis and are therefore more likely to become the destination of the migration of polluting enterprises. This kind of nearby migration will lead to increases in carbon emissions, energy consumption, and pollution in neighboring non-pilot cities, which will have a negative impact on the green utilization efficiency of local land.
Hypothesis 3: 
The implementation of low-carbon city pilot policies may result in a pollution haven effect, potentially diminishing land green use efficiency in neighboring non-pilot cities.

3. Study Design

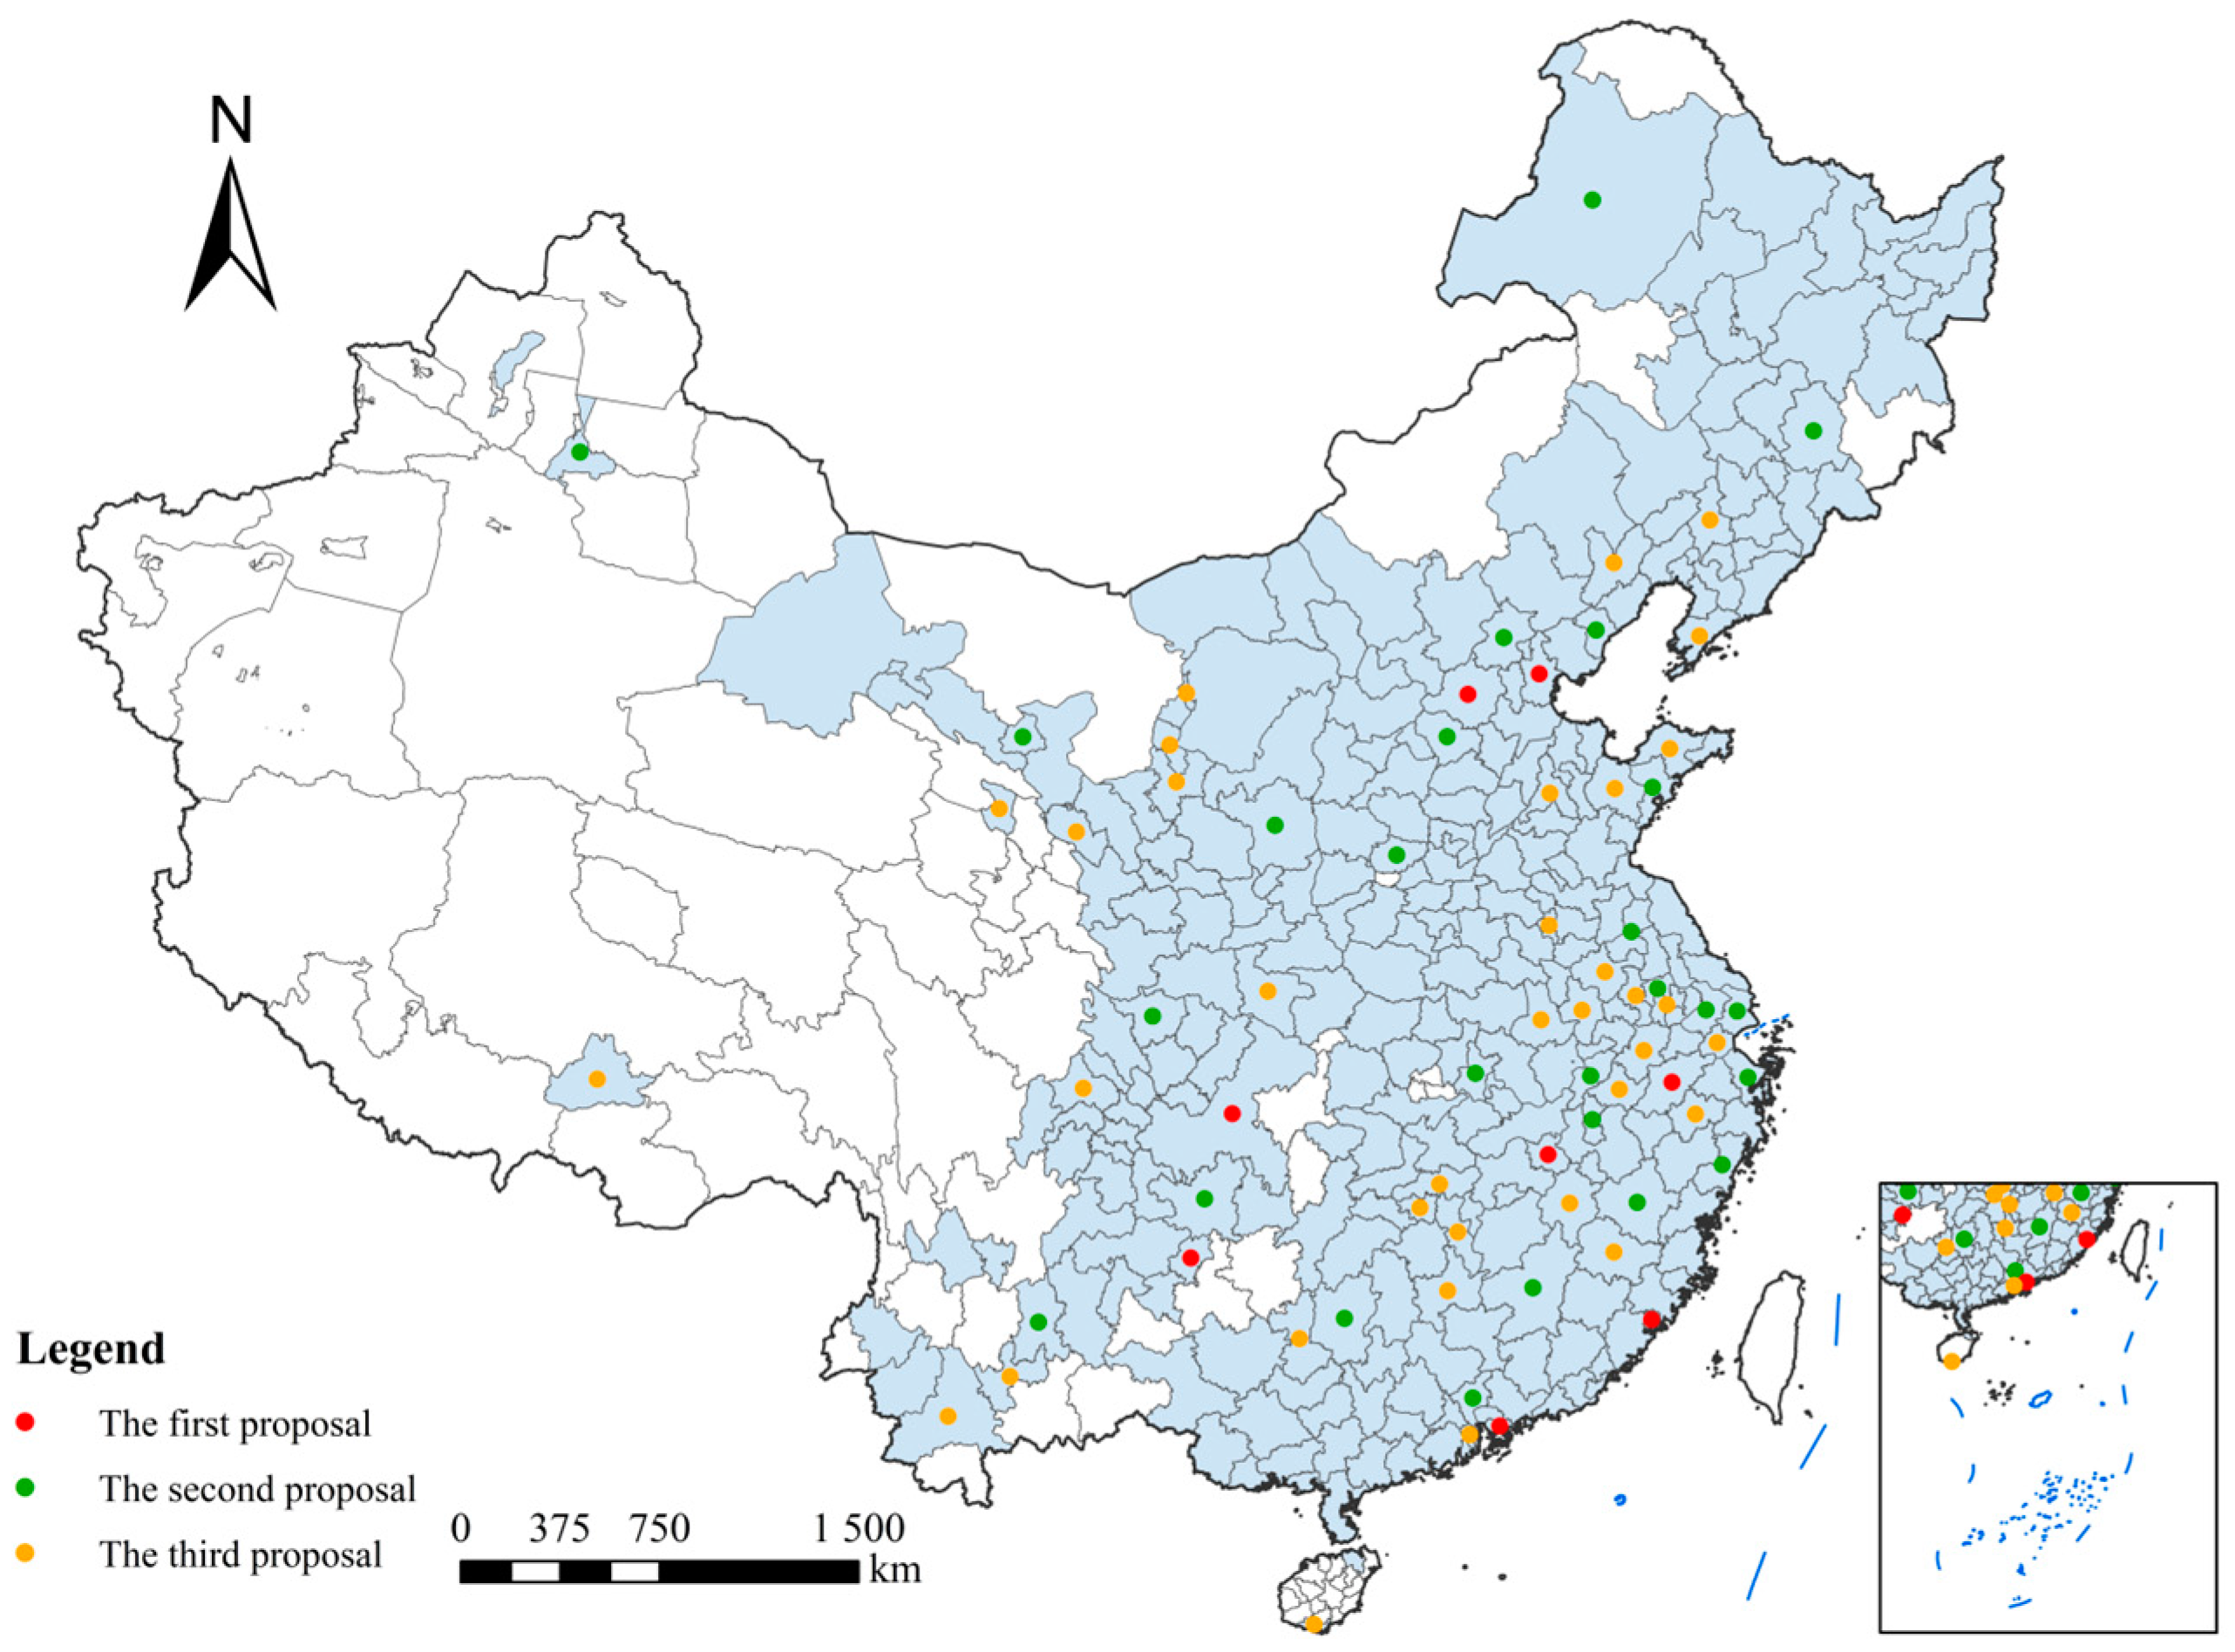
3.1. Sample Selection and Source of Data

Within 287 prefecture-level and above cities in China and based on the list of three batches of low-carbon pilot cities announced by the National Development and Reform Commission (NDRC) [30,31,32], this study selected research samples between 2006 and 2021 from 257 prefecture-level and above cities and eliminated cities (excluding Hong Kong, Macao, and Taiwan) that were withdrawn during the study period or had serious amounts of missing of data to investigate the effects of low-carbon city pilot policies. The samples included 65 low-carbon pilot cities, 126 adjacent non-pilot cities, and 66 non-adjacent non-pilot cities. The spatial distribution is shown in Figure 2.

3.2. Research Models

3.2.1. Super-Efficiency SBM Model

In assessing land green use efficiency, traditional research typically employs the SBM model for efficiency comparisons among various decision-making units (DMUs). However, this approach is limited by an efficiency threshold that cannot exceed a value of 1. In order to address this constraint, a super-efficiency SBM model was proposed, which can effectively combine the super-efficiency model and the SBM model and at the same time overcome the relaxation of variables and the movement in the radial direction. Consequently, the present research employed the Super-SBM model for assessing land green use efficiency and constructed an input–output indicator system (Table 1) based on the frameworks proposed by Wang et al. [33] and Zeng et al. [34].
ρ * = min 1 m i = 1 m x ¯ i x i k 1 q r = 1 q 1 y ¯ r g y r k g + j = 1 q 2 y ¯ j b y j k b s . t . x k = φ X + S , y k g = φ Y g S g , y k b = φ Y b + S b x ¯ j = 1 n φ j x j , x ¯ x k y ¯ g j = 1 n φ j y j g , y ¯ g y k g y ¯ b j = 1 n φ j y j b , y ¯ b y k b j = 1 n φ j = 1 φ , S , S g , S b 0
In this formula, ρ * represents the green utilization efficiency of urban land; x is the input; y g is the expected output; y b is the unexpected output; S , S g , and S b are the corresponding slack variables; k ( k = 1 , 2 , 3 , , n ) , i ( i = 1 , 2 , 3 , m ) , r ( r = 1 , 2 , 3 , , q 1 ) , and j ( j = 1 , 2 , 3 , q 2 ) are decision-making units, the number of input indicators, the number of expected outputs, and the number of unexpected outputs, respectively, indicating that there are m types of inputs and q types of outputs in each decision-making unit, including q1 types of expected outputs and q2 types of unexpected outputs; and φ is the projection variable. ρ * > 1 represents a strongly efficient state of the green utilization efficiency of urban land, ρ * = 1 represents a weakly efficient state of the green utilization efficiency of urban land, and ρ * < 1 represents an inefficient state of the green utilization efficiency of land.

3.2.2. Time-Varying DID Model

Accounting for the ongoing effects of low-carbon city initiatives, this research utilized a time-varying difference-in-differences (DID) approach to establish a benchmark model, following the methodology in [35], as outlined below:
E E i t = α 0 + α 1 d i d i t + γ X i t + μ i + v t + ε i t
In Formula (2), i represents the city, and t represents the year; the explained variable represents the land green use efficiency in city i in the t year; the core explaining variable E E i t is d i d i t = t r e a t i × t i m e t ; the adjacent non-pilot city was set to 1; and the non-adjacent non-pilot city was set to 0. If city i becomes an adjacent non-pilot city in year t , t i m e after t is set to 1; otherwise it is set to 0. X i t represents a series of control variables that affect the land green use efficiency, μ i represents the entity fixed effect, v t represents the time fixed effect, and ε i t is a random error term.

3.3. Variable Settings

The explained variable is urban land green use efficiency (ULUE). The core explaining variable is d i d i t , namely, the interaction term of t r e a t i × t i m e t , and the adjacent non-pilot cities in the group of dummy variables are the experimental group, while the non-adjacent non-pilot cities are the control group.
To account for additional determinants of land green use efficiency, the present study incorporated the following control variables. (1) Industrial structure upgrading (isu) is measured using the ratio of the added value of the tertiary industry to that of the secondary industry. The industrial structure affects the resource allocation in economic production and is closely linked to the efficiency of regional resource utilization. (2) The degree of urbanization (urb) is measured using the area of urban built-up areas. (3) The degree of transport facilitation (tra) is represented by highway passenger capacity. (4) The level of industrial development (idl) is assessed using the gross industrial output value of domestic enterprises. (5) Urban real estate investment (urei) and is measured using the entire volume of investments in real estate development. The real estate industry is a significant factor that affects the sustainable development of the region [36] and coexists with negative feedback and environmental risks. (6) The level of information technology development (itd) is expressed as the number of people employed in the information transmission, computer services, and software industries.

4. Empirical Analysis

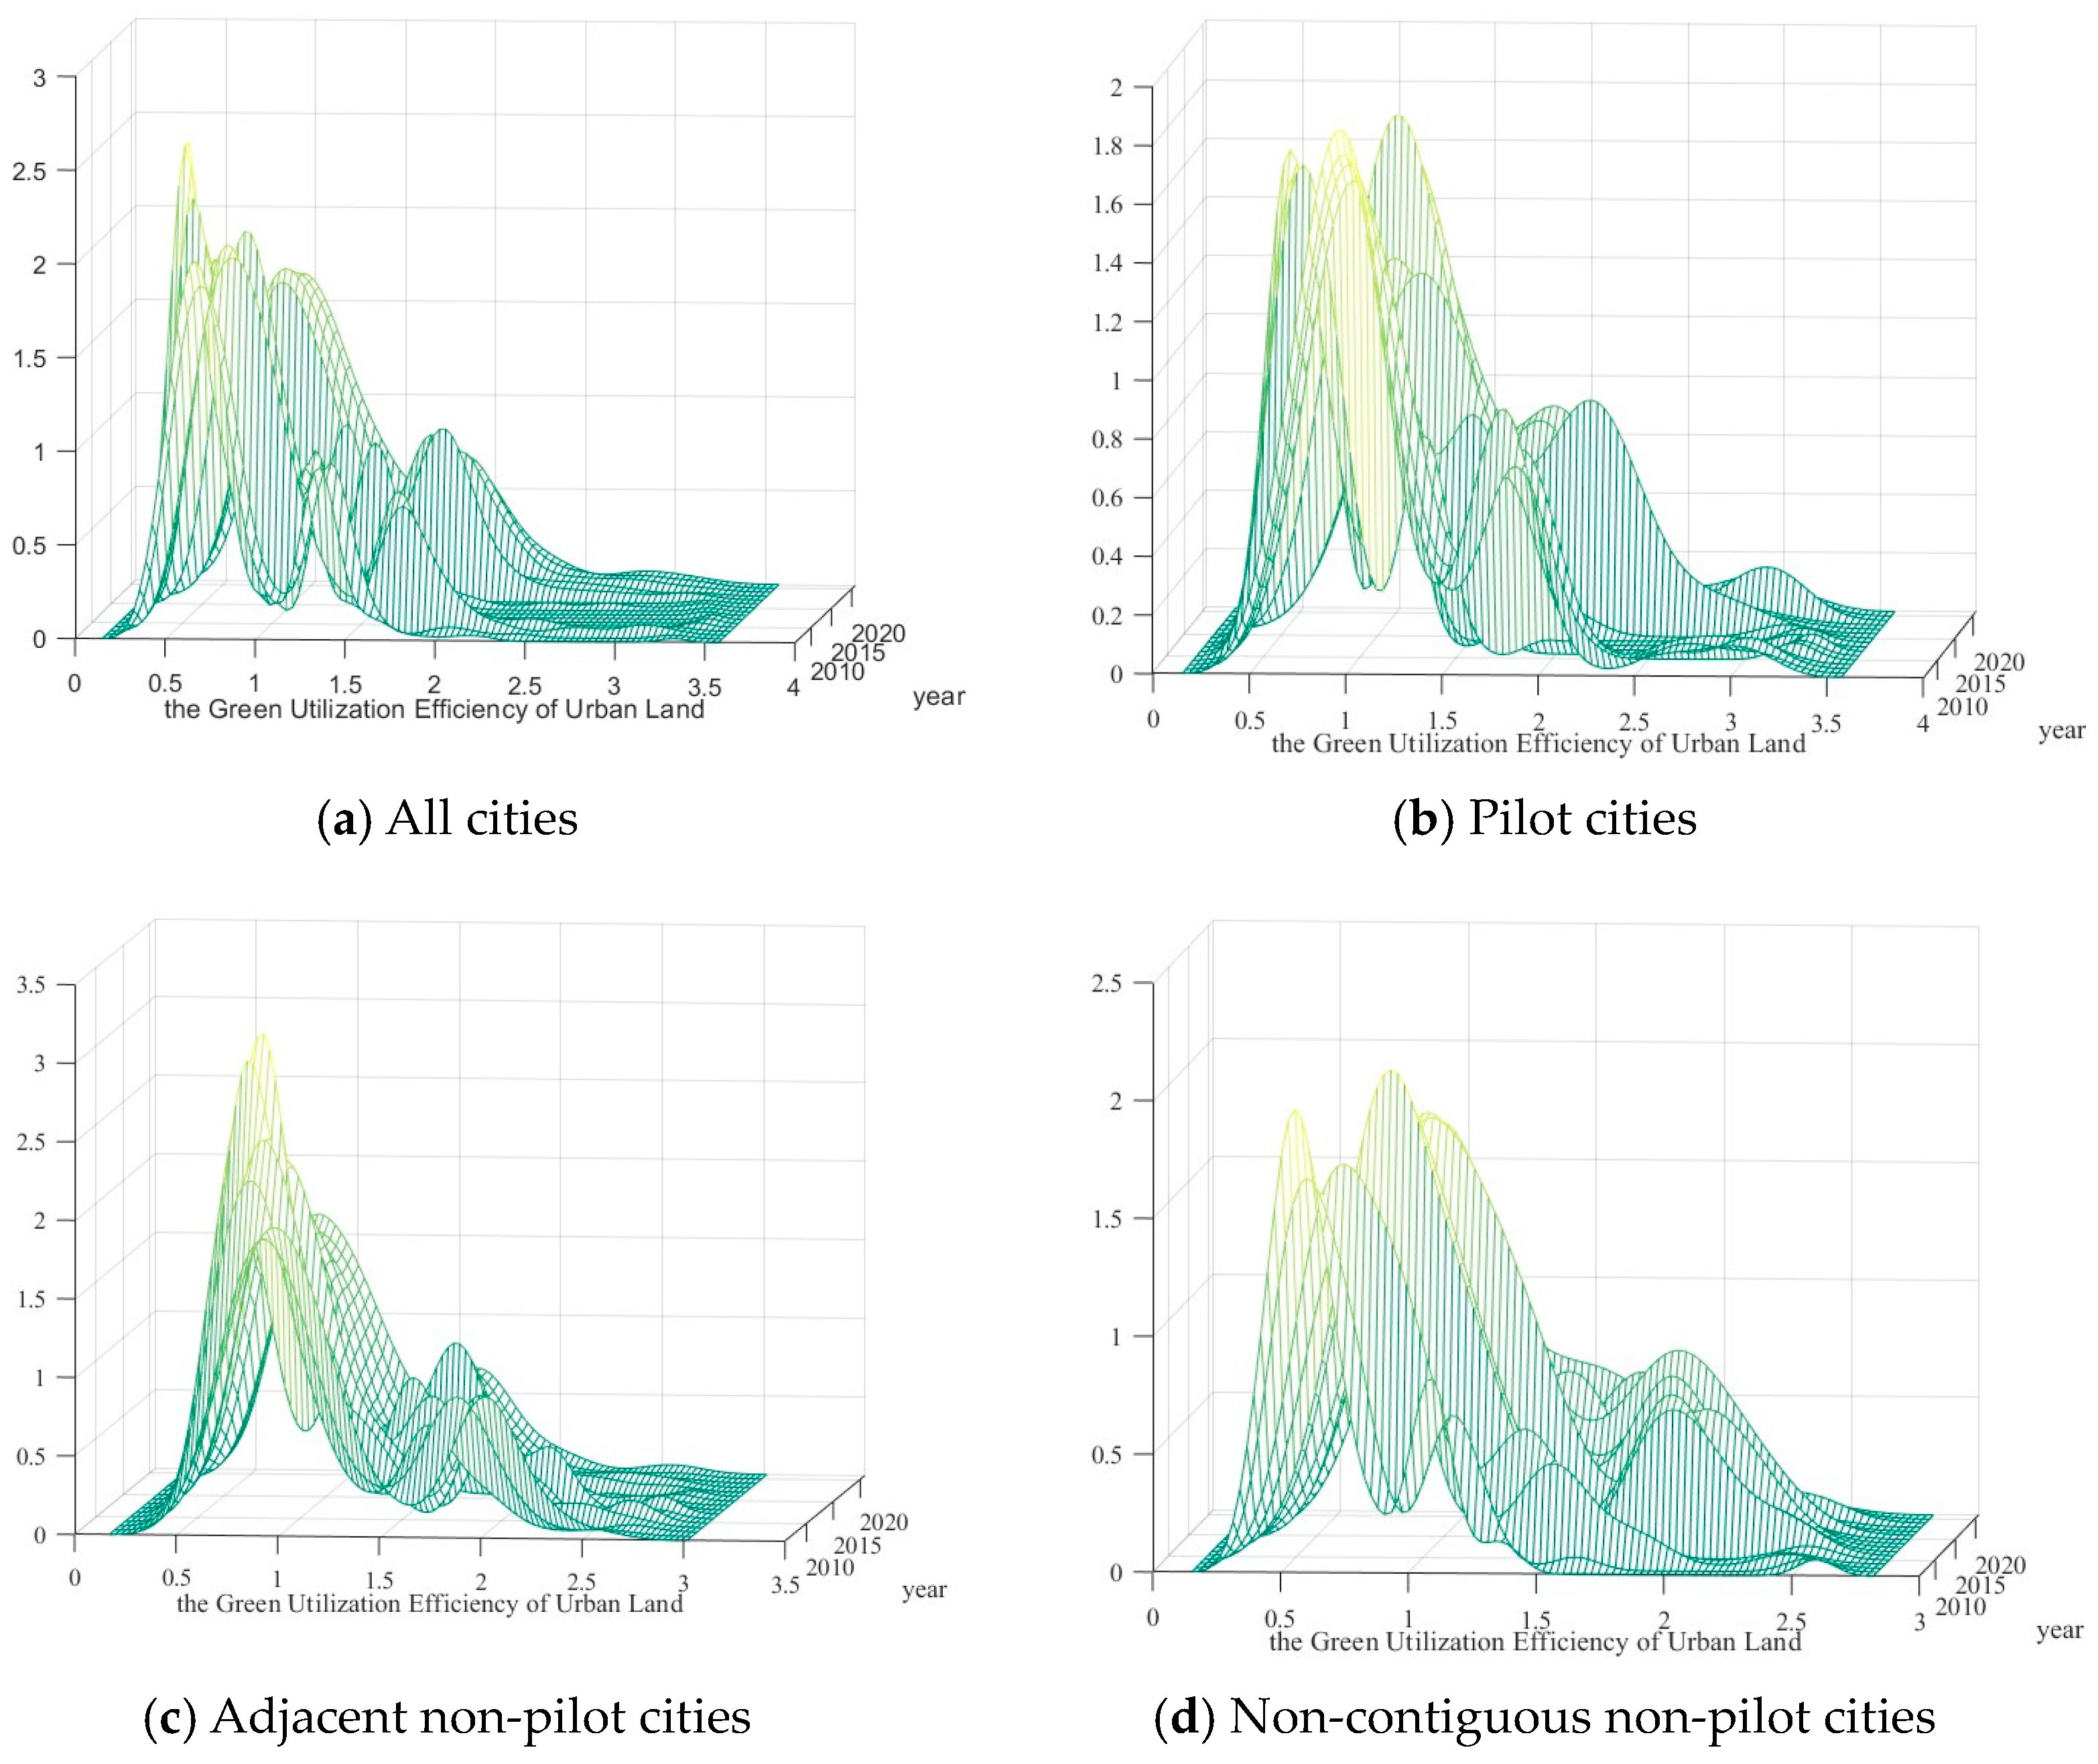
4.1. Temporal Trend of Urban Land Green Use Efficiency

This study employed kernel density estimation to examine the temporal dynamics of land green use efficiency in China over the period from 2006 to 2021 (Figure 3). Based on the needs of the study, we have, respectively, mapped the kernel density distributions of land green use efficiency for 257 prefecture-level cities, categorizing them into pilot cities, adjacent non-pilot cities, and non-adjacent non-pilot cities. As shown in Figure 3, the distribution pattern of the green utilization efficiency of various types of land exhibits the following characteristics. (1) In terms of the peak value of the kernel density curve, the urban land green use efficiency is concentrated at the middle and lower levels. This means that the urban land green use efficiency in most cities is at middle or lower levels, and the peak value shows a swaying pattern, presenting a general trend of moving to the right. The average urban land green use efficiency has increased to some extent. (2) The peak height exhibits noticeable variations, and a comparison of the four graphs shows that the kernel density curve of adjacent non-pilot cities first increases and then decreases. To some extent, this phenomenon may be related to the phased outcomes of policy implementation, changes in market conditions or the adjustment of resource allocation. (3) There is a noticeable multimodal pattern, showing a trend of multistage differentiation, but there is no sign of a transition from a multimodal to unimodal state, indicating that the polarization of the urban land green use efficiency is not significantly weakened.

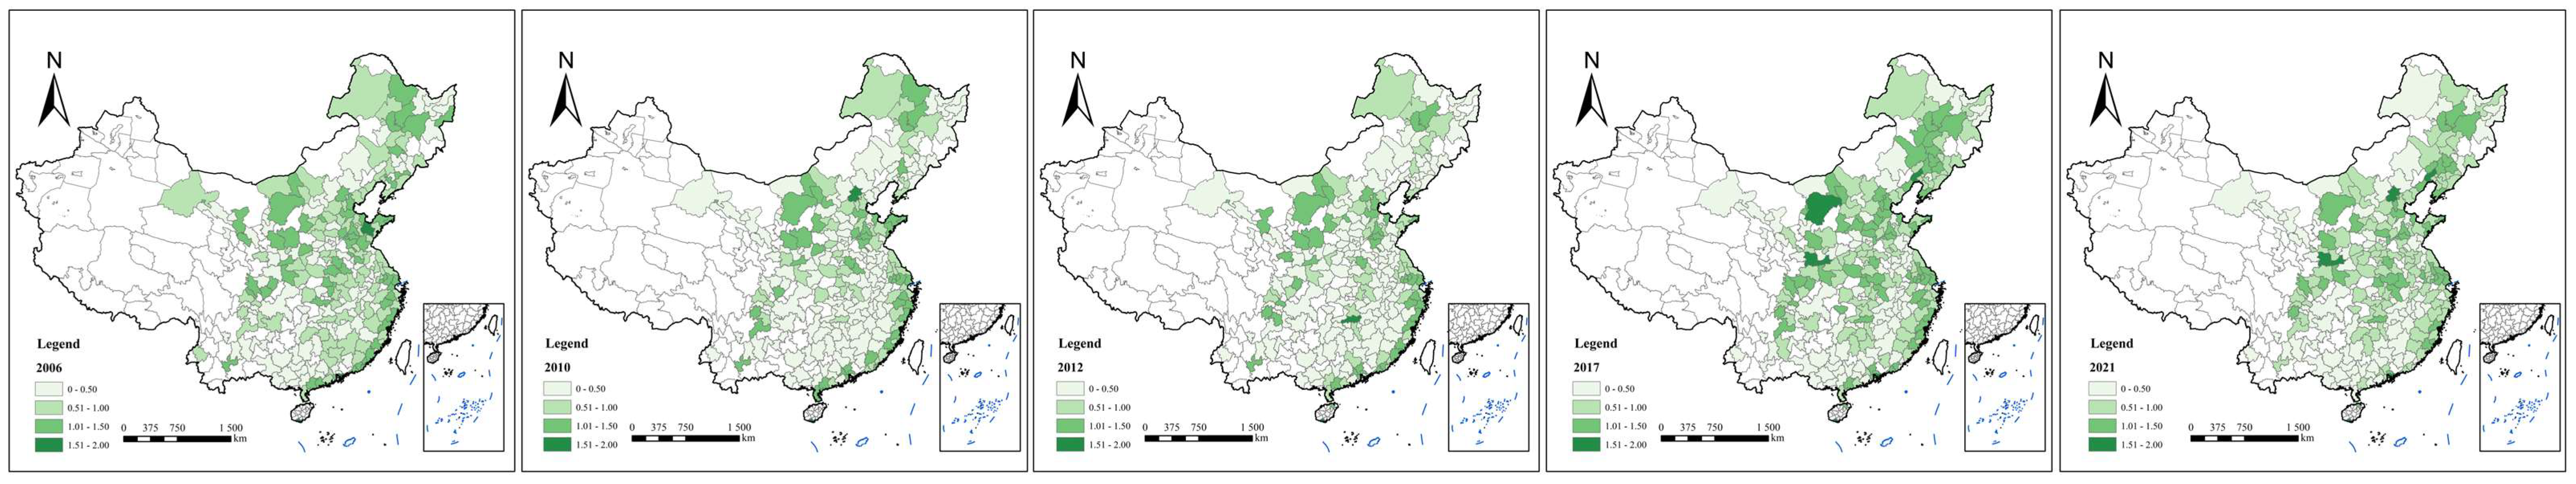
4.2. Spatial Distribution Characteristics of Urban Land Green Use Efficiency

To further study the spatial distribution characteristics of urban land green use efficiency in China under the spatial constraints, this study chose the spatial distributions of urban land green use efficiency from five years (2006, 2010, 2012, 2017 and 2021) to construct a spatial distribution map (Figure 4).
As a whole, the areas with higher levels of land green use efficiency are mostly clustered in the southeast coastal areas and the northeast areas. The southeast coastal areas usually have higher levels of economic development, more advanced urban planning and construction, and, therefore, more financial and technical support to implement green use strategies of land. Furthermore, cities within these regions are likely to prioritize ecological conservation and sustainable development, resulting in enhanced land green utilization efficiencies. Northeast China’s regions, characterized by their distinctive geographical settings and rich natural resources like extensive forests, often exhibit greater land green utilization efficiency. Cities within Central China, North China, and Southwest China show minor differences in land green use efficiency. An analysis comparing land green use efficiency before and after the low-carbon pilot policy announcements demonstrates that all three policy batches have led to improvements, albeit to different extents. This suggests a positive policy impact on fostering green land use. Specifically, Figure 3 illustrates that the second batch of policies yielded the most notable enhancement in efficiency.

4.3. Benchmark Regression

The effectiveness of low-carbon pilot policies has long been questioned. Therefore, this study used the difference-in-differences analysis to evaluate the impact of low-carbon city policies on the urban land green use efficiency. Due to the correlations in the explaining variables, it was essential to perform a multicollinearity analysis for all explanatory variables. Table 2 shows that the variance inflation factor VIF is less than 5, indicating that there is no multicollinearity among the explaining variables, which improves the interpretability of the model.
The premise for low-carbon pilot cities to produce a “spillover effect” is that their own land green use efficiency has improved under the influence of the policies, and they will spill their own experiences and greenness to adjacent non-pilot cities, thereby driving an improvement of land green use efficiency in those cities [37]. According to the empirical results of the DID model, sixty-five low-carbon city pilot cities were included in the benchmark regression model, and an overall regression analysis was conducted on 257 sample cities. According to the results in Column (4), the improvement in land green use efficiency in adjacent non-pilot cities due to low-carbon pilot policies reached 4.8%, which was slightly higher than the result of 4.6% in Column (2) without including the 65 low-carbon city pilot cities. This finding confirms that the implementation of low-carbon pilot cities has a more significant promotional effect on the improvement of land green use efficiency in adjacent non-pilot cities. Hypothesis One is assumed to be valid.
According to the previous analysis, low-carbon city pilot policies may also have a negative “pollution haven effect” and a positive “catfish effect” on the carbon emissions of adjacent non-pilot cities. Therefore, 65 pilot low-carbon cities were included in the benchmark regression model, and an overall regression analysis of 257 sample cities was carried out. According to the results of Column (4) in Table 3, the green effect of low-carbon pilot policies on land use in adjacent non-pilot cities is increased by 4.8%, which is slightly higher than the previous 4.6%. This further confirms that low-carbon pilot cities play a significant role in promoting the improvement of land green use efficiency in adjacent non-pilot cities. This is because for adjacent non-pilot cities, the existence of pilot cities is like a “catfish”, which stimulates the development vitality and innovation potential of these cities. The pressure and challenges brought by the pilot cities are transformed into a positive “catfish effect”. When adjacent non-pilot cities are faced with the competition and pressure from pilot cities, they will be prompted to actively carry out reforms and innovations to improve their competitiveness. However, it should also be noted that the enhancement of environmental regulations brought about by the construction of low-carbon cities [35,36,37] may trigger a “pollution haven effect”. Due to differences in environmental regulation standards, high-polluting industries will seek less strictly regulated areas, and some traditional industries are faced with difficulties in transformation and choose to migrate to reduce costs. However, due to the great attention of the central government to environmental governance, the “catfish effect” from the “green” pressure brought by the construction of low-carbon cities has improved the land green use efficiency in adjacent non-pilot cities, which exceeds the “pollution haven effect” in adjacent non-pilot cities. Thus, this verifies the validity of Hypothesis Two and Hypothesis Three.

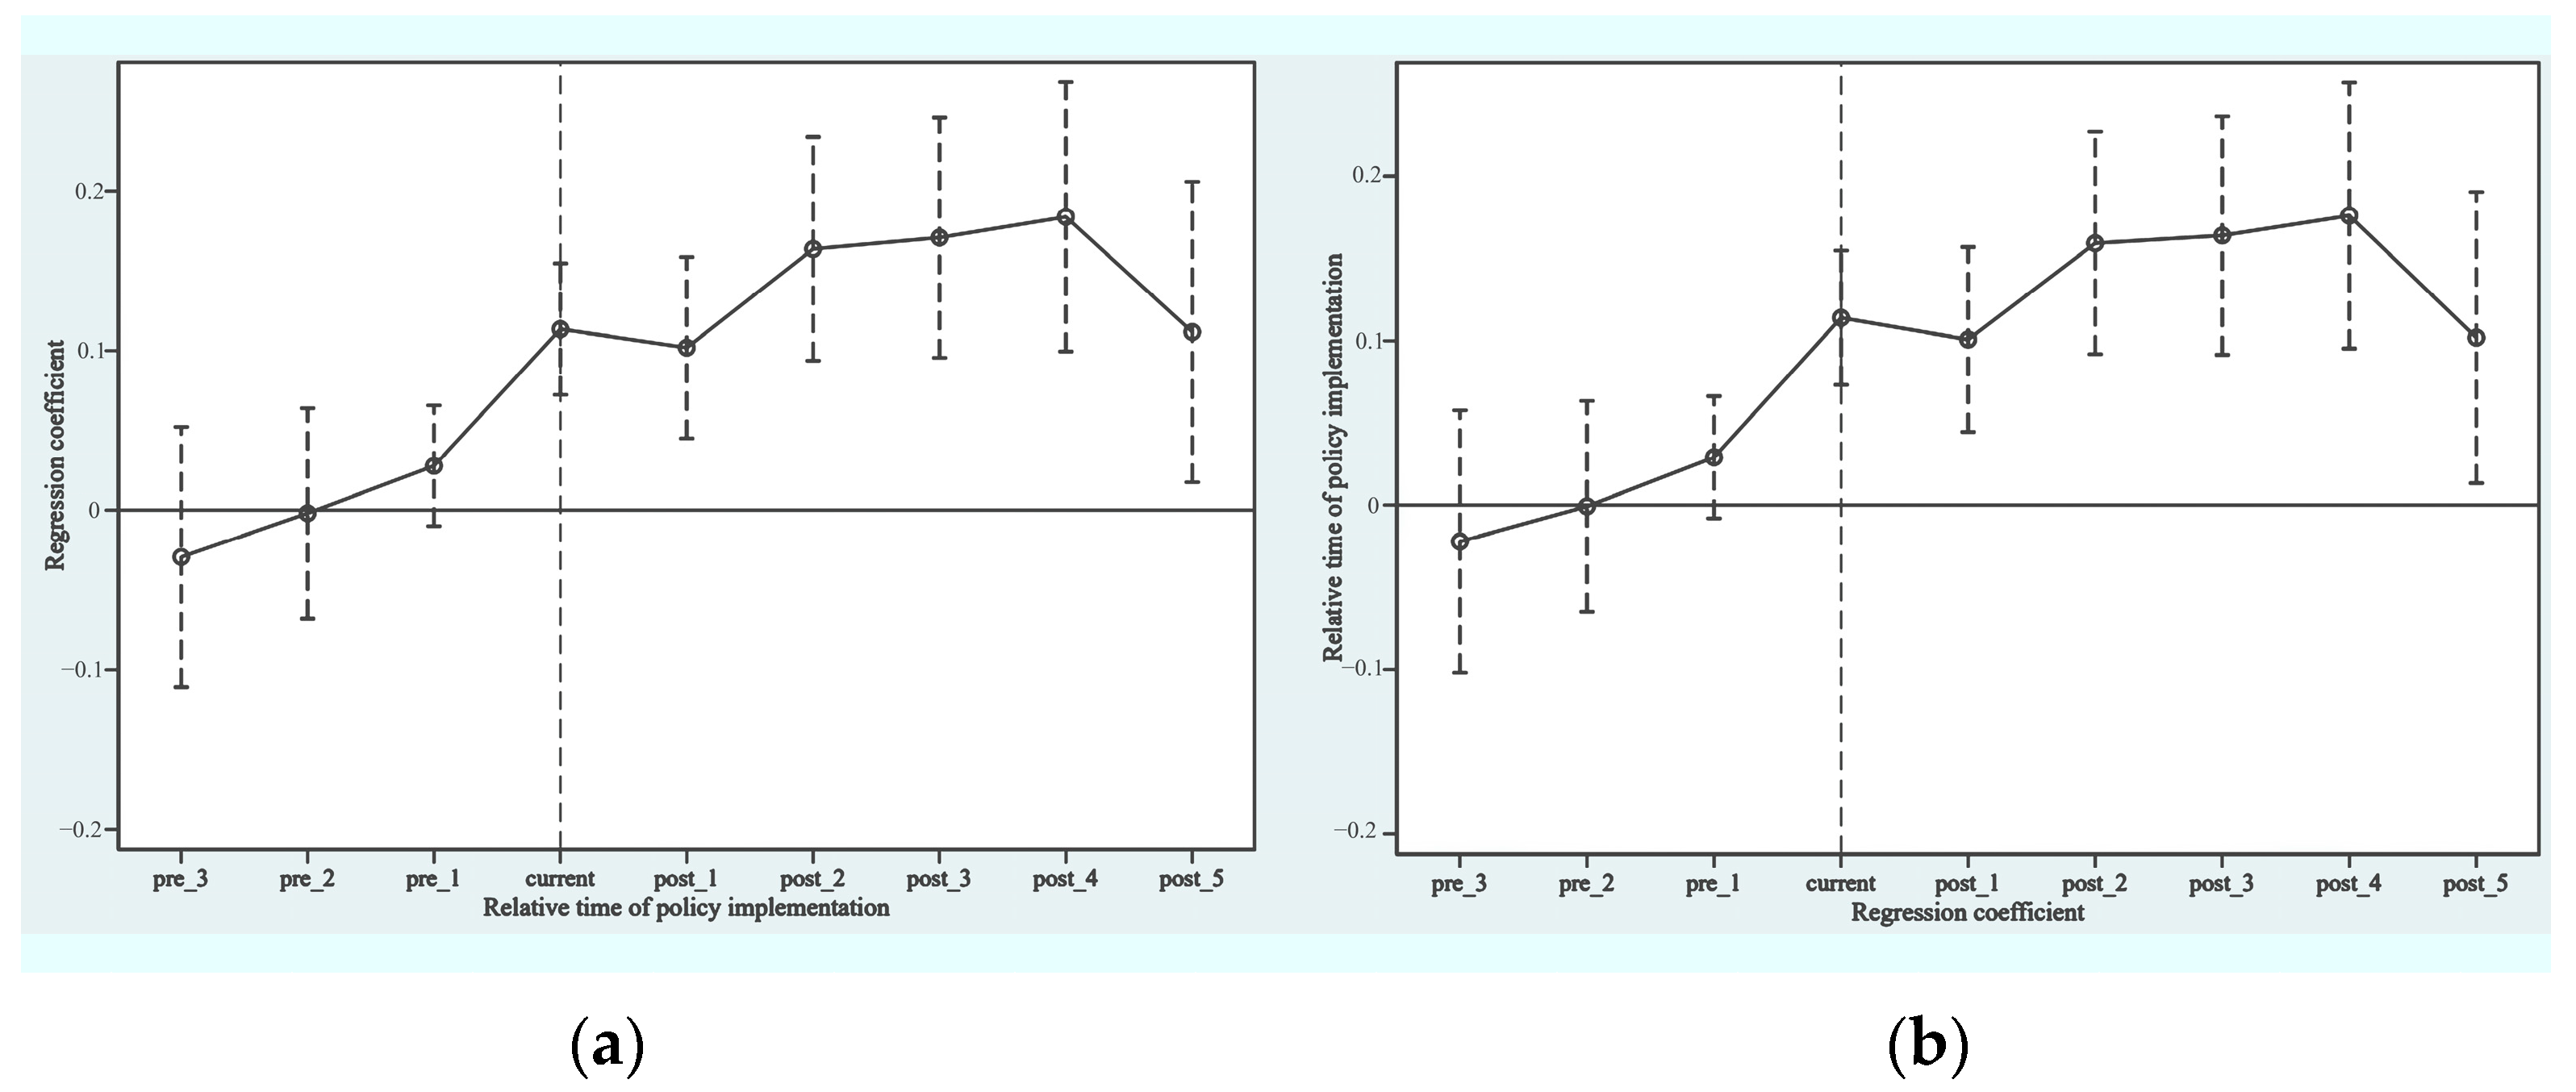
4.4. Parallel Trend Test

The parallel trend assumption is a necessary precondition for the establishment of the difference-in-differences model. Specifically, before the implementation of the policy, the policy effects on land green use efficiency between the experimental and control groups exhibit parallel trends and display no significant divergence prior to policy implementation, while after the implementation of the policy, there is a significant difference between the two groups. As depicted in Figure 5, the event study analysis indicated that prior to the pilot policy’s implementation, there was no significant difference in the regression coefficient, which is generally close to 0 and increases slightly, and after 5 years of the implementation of the policy, the regression coefficient is significantly ≥0.1. This means that the land green use efficiency has been improved, and a significant divergence between the experimental and control groups is observed, indicating successful adherence to the parallel trend assumption.
Given that the underlying policy mechanisms affecting both samples are identical, further details are deemed redundant.

4.5. Robustness Test

In order to eliminate the interference of confounding factors on the results of benchmark regression and improve the credibility and stability of the research, we conducted robustness tests from four dimensions, including screening extreme values, controlling temporal trend, and excluding central cities and endogeneity.

4.5.1. Trimmed Mean Test

Some extreme values in the sample data may interfere with the calculation results. In order to reduce this influence, the sample data were trimmed by 1%, 5%, and 10%, respectively, and the results correspond to (1), (2), and (3) in Table 4, respectively. It can be seen that the coefficients of the core explaining variable d i d are all significantly positive, indicating that the measurement outcomes pass the robustness test.

4.5.2. Temporal Trend Test

Economic data have a temporal trend, which may present a covariant trend with the explained variable over the observation period. Hence, in order to avoid spurious regression, we added the temporal trend to the benchmark regression. The time dummy variable, capturing both high-frequency and low-frequency temporal influences on economic variables, is typically coded as either “0” or “1”. Therefore, in order to explore the above effects, we fixed both time and entity in Column (4) of Table 4, and at the same time included the temporal trend, while for Column (5), time fixation was not carried out, and only the entity was fixed, and the temporal trend was controlled. The results are consistently positive at the 5% significance level and still pass the robustness test.

4.5.3. De-Centering Test

As central cities such as provincial capitals and centrally administered municipalities generally serve as hubs of socioeconomic activities, they exhibit stricter environmental regulations and more effective pollution control measures compared to other regions. In order to eliminate the influence of city character, we adopted a de-centering test to assess the regression model, and the results are shown in Column (6) of Table 4. Evidently, the coefficient of the core explaining variable DID is significantly positive, indicating that the benchmark regression results are still robust.

4.5.4. Endogeneity Test

In order to reduce the endogeneity caused by sample selection bias, we adopted PSM-DID to process the sample data and re-estimate the benchmark regression. We took the control variables (degree of urbanization, degree of transport facilitation, level of industrial development, level of information technology development, urban real estate investment, and industrial structure upgrading) as covariates and utilized the policy dummy variable Treat to perform logit regression on the covariates to obtain the propensity matching score, and we then set the control group based the ratio of 1:2. On this basis, the difference-in-differences regression was re-conducted. The results show that regardless of the addition of a control variable, the DID coefficient in the total two samples is significantly positive, indicating that the benchmark regression results are relatively robust (Table 5).

5. Heterogeneity Analysis

5.1. Regional Heterogeneity

Under the implementation of low-carbon city pilot policies nationwide, the policy effect shows significant differences in different regions. In order to further explore these differences and the mechanism behind them, we divided the sample cities into two regions: the eastern and western regions, to more specifically examine the impact of policy effects in different geographical regions. Table 6 shows the regression results of 192 and 257 sample cities, respectively. It can be seen that in the total amount of these two types of samples, the eastern region has better regression coefficients, and the non-eastern region does not have significant results. However, as a key node of disequilibrium, the pilot policy of low-carbon cities may aggravate the disorder of the system after being included in the pilot cities in the eastern region, which further widens the trend gap between adjacent non-pilot cities and non-adjacent non-pilot cities and increases the regression coefficients of core explanatory variables. This can be ascribed to the high level of economic development, perfect infrastructure, optimized industrial structure, and strong policy implementation in the eastern region. These factors have jointly promoted the significant improvement of land green use efficiency in the eastern region, bringing it closer to the goal of low-carbon pilot policies. Conversely, the western region encounters greater difficulties in executing policies, due to its lower levels of economic development, infrastructure, and policy enforcement capabilities. These factors significantly constrain the policy’s efficacy, resulting in a lack of substantial positive outcomes from the low-carbon pilot policy in the western region. Furthermore, variations in industrial composition, resource distribution, and environmental consciousness could significantly contribute to the less pronounced policy impacts observed in the western region. This finding highlights the need to consider regional differences and adopt differentiated strategies to optimize policy effectiveness when formulating and implementing low-carbon city pilot policies.

5.2. Heterogeneity of Urban Resource Endowment

Cities with resource-based economies contribute to China’s energy supply and reserves through their natural resource wealth. However, with the advancement of sustainable economic and social development, the disadvantages of resource-based cities have gradually emerged, such as the overexploitation of natural resources, redundant construction of low-level primary industries, overweight of secondary industries in resource-dependent industries, and insufficient support and security of substituting alternative industries. Therefore, based on related planning standards, the sample cities were grouped into resource-based and non-resource-based cities. By reconstructing dummy variable d i d i t = t r e a t i × t i m e t , regression estimates were conducted, and the results are shown in Table 7. The findings indicate that non-resource-based cities exhibit significantly positive regression coefficients, whereas the coefficients for resource-based cities fail to reach statistical significance. It can be observed that the pilot policy of low-carbon cities significantly improved the land green use efficiency of non-resource-based adjacent non-pilot cities, while this effect is not observed in resource-based adjacent non-pilot cities. This is because non-resource-based cities have relatively perfect industrial structures and low dependence on resources, showing a better ecological foundation and lower environmental governance costs. From the phenomenon of “resource curse”, it can be inferred that when resource-based cities are faced with unsustainable development, the implementation of pilot policies may not bring expected positive effects but may aggravate the problems of regional fiscal austerity and corporate bankruptcy, leading to the decline of development. Further, a comparison of the regression results after the inclusion of pilot cities reveals that in non-resource-based cities, the trend gap between adjacent non-pilot cities and non-adjacent non-pilot cities decreases, which reduces the regression coefficient value of core explanatory variables. This also indicates that the construction of pilot cities has an impact on the land green use efficiency in non-resource-based cities. Although it is affected by distance, it still shows a strong scale effect as a whole. The existence of this scale effect means that the practice and exploration of pilot cities in low-carbon development and green transformation have important reference value and leading role for non-resource-based cities.

5.3. Heterogeneity of Urban Environmental Protection Strength

In the face of the time-lag effect of environmental protection and the increasingly serious constraints on resources and the environment, China began to issue environmental protection plans in 2007, among which the “Eleventh Five-Year Plan for National Environmental Protection” paid more attention to the prevention and control of air pollution and selected 113 cities as the target of environmental protection. In this study, the sample cities were categorized into key environmental protection cities and non-key environmental protection cities. A comparative study was conducted to explore the effects of the policy under different levels of environmental protection (Table 8). The results of Column (1) in Table 8 show that the impact of the low-carbon pilot policy on environmental protection key cities in adjacent non-pilot cities is significantly positive and better than that of non-adjacent non-pilot cities. When cities are appointed as key environmental protection cities, they often carry higher environmental protection responsibilities and expectations. Faced with the shortcomings in environmental protection and the increasing pressures of resource and environmental limitations, these cities are more inclined to take active measures to deal with environmental problems, improve land use efficiency, and promote green transformation. In adjacent non-pilot cities, the key environmental protection cities benefit from the demonstration effect and spillover effect of the pilot policy and can achieve green transformation and high land green use efficiency more quickly. To further verify this finding, we added 65 low-carbon pilot cities for regression analysis. By comparing the results of Column (3) with those of Column (1), it can be found that the regression coefficient decreases. This observation could be attributed to the elevation of the overall sample’s average performance due to the inclusion of low-carbon pilot cities, resulting in a corresponding reduction in the regression coefficient. The advanced experience and practices of these pilot cities in low-carbon development and green transformation provide valuable reference for other cities, and therefore, the key environmental protection cities can formulate and implement strategies more pertinently in the face of environmental problems.

6. Conclusions and Policy Recommendations

6.1. Conclusions

In order to promote the green and low-carbon transformation and better plan and coordinate ecological and economic benefits, pilot polices for low-carbon cities are being implemented in all cities of China by drawing upon the experience gained in pilot cities. These policies have indeed achieved remarkable effects in pilot cities, but the accurate assessment and in-depth exploration of the effects of these policies on adjacent non-pilot cities are essential for offering critical insights for promoting low-carbon initiatives and relevant legal provisions on environmental regulation nationwide. The conclusions of this research can be summarized as follows:
(1)
It is evident that the enhancement of land green use efficiency in adjacent non-pilot cities is a direct outcome of the low-carbon pilot policies, owing largely to spillover and catfish effects. The spillover effect facilitates the dissemination of advanced technologies and experiences from pilot cities to adjacent non-pilot cities, while the catfish effect changes the traditional land use practices and enhances the land green use efficiency in non-pilot cities through incentivization.
(2)
An analysis of policy heterogeneity shows that the land green use efficiency benefits from low-carbon pilot policies are more pronounced in the economically robust eastern region, suggesting a correlation between regional economic strength and policy outcomes. In addition, compared with the effects on resource-based cities, the pilot policies have a much more significantly positive impact on the land green use efficiency in non-resource-based cities, indicating greater ecological benefits of non-resource-based cities in this respect. However, the heterogeneity in the strength of urban environmental protection is not significant, and in the total 257 cities, the land green use efficiency has been improved only in cities that attach great importance to environmental protection.

6.2. Policy Recommendations

Based on the above empirical findings and conclusions, the corresponding policy recommendations can be proposed as follows:
(1)
Maximizing the spillover effect and the catfish effect. Policymakers and urban planners need to consider how to maximize the spillover effect and at the same time ensure that the catfish effect can promote healthy competition rather than lead to an imbalanced allocation of resources or overexploitation of the environment. Through reasonable policy design and regional coordination, it is possible to ensure that these two effects jointly drive the achievement of sustainable development goals.
(2)
Context-dependent strategies. When implementing low-carbon city pilot policies nationwide, it is essential to fully consider the heterogeneity of regions and cities. For the eastern regions, there should be a continued strengthening of policy enforcement and innovation; for non-eastern regions, there should be an emphasis on infrastructure development and the optimization of industrial structures; for resource-dependent cities, addressing issues such as the overexploitation of resources and low-level repetitive construction in primary industries is crucial; and for cities with a focus on environmental protection, increasing financial investment and exploring specific green measures should be prioritized.
(3)
Constant monitoring and evaluation. The implementation effects of low-carbon city pilot policies should be subject to ongoing monitoring and evaluation. Issues should be identified in a timely manner, and effective measures should be taken to make improvements, ensuring the effectiveness and sustainability of the policies.

6.3. Discussion

This study indeed has limitations such as sample selection bias, the time lag of the policy effects, and the complexity of policy implementation, all of which, to varying degrees, affected the interpretation of the research findings in the following manners:
(1)
Limitations in sample selection. Based on the availability of data, the study selected 257 prefecture-level and above cities as samples. Although the coverage is relatively wide, there may still be some cities or regions that were not included in the analysis, which may have caused the research results to be unable to fully represent the situation of all cities in China to some extent.
(2)
Time lag of policy effects. This study may not have fully considered the time lag between the implementation of policies and the generation of effects, which may lead to inaccurate immediate assessments of policy effects.
(3)
Complexity of policy implementation. The implementation of low-carbon pilot policies may be affected by various factors, such as the execution strength of local governments, participation of enterprises, the public, etc. The complexity of these factors exceeds the scope of model analysis, which may lead to inaccurate estimates of policy effects. These factors may have a significant impact on the actual effectiveness of policies, and if the model does not include these variables, it may underestimate or overestimate the actual effects of the policies.
We acknowledge that against the backdrop of global climate change, low-carbon development and green economy have become common pursuits for nations worldwide, making this a topic of broad relevance on a global scale. Although this study is centered on the impact of China’s low-carbon pilot policies on the efficiency of land green use, its profound value and insights extend far beyond the confines of China. On one hand, as the world’s largest developing country, China’s successful implementation of low-carbon pilot policies demonstrates that even during rapid economic growth, it is possible to synchronize economic transformation with environmental protection through effective policy design and execution. This achievement holds significant implications for guiding other developing economies on how to achieve green, low-carbon development amidst industrialization and urbanization. On the other hand, given China’s vast territory, uniform and continuous macroeconomic policies must be adapted to account for regional disparities and unique external conditions in their implementation. This aspect provides important insights for other countries and regions in formulating and executing environmental policies, particularly in developing strategies that align with national development goals while also considering local characteristics and global responsibilities. Therefore, this study not only offers strategic support for enhancing the efficiency of urban land green use in China, but also serves as a valuable reference and inspiration for other countries and regions facing similar challenges. We believe that through international cooperation and the exchange of experiences, we can collectively advance the global process of sustainable development.

Author Contributions

Conceptualization, X.L. (Xiang Luo); Methodology, Y.S.; Software, X.L. (Xinle Li); Validation, X.L. (Xinle Li); Formal analysis, X.L. (Xinle Li); Investigation, X.L. (Xin Li); Resources, X.L. (Xin Li); Data curation, X.L. (Xinle Li); Writing—original draft, X.L. (Xin Li); Writing—review & editing, Y.S.; Visualization, X.L. (Xinle Li); Supervision, X.L. (Xiang Luo); Project administration, Y.S.; Funding acquisition, X.L. (Xiang Luo). All authors have read and agreed to the published version of the manuscript.

Funding

This research was funded by [National Natural Science Foundation of China] grant number [71974071]; [National Natural Science Foundation of China] grant number [42171286]. And The APC was funded by [National Natural Science Foundation of China] grant number [42171286].

Data Availability Statement

The original contributions presented in the study are included in the article, further inquiries can be directed to the corresponding author.

Conflicts of Interest

The authors declare no conflict of interest.

References

  1. Khan, A.A.; Luo, J.; Safi, A.; Khan, S.U.; Ali, M.A.S. What determines volatility in natural resources? Evaluating the role of political risk index. Resour. Policy 2022, 75, 102540. [Google Scholar] [CrossRef]
  2. Luo, B.; Khan, A.A.; Safi, A.; Yu, J. Research methods in economics to evaluate the role of energy efficiency and financial inclusion in achieving China’s carbon neutrality target. Econ. Res.-Ekon. Istraživanja 2022, 36, 1774–1802. [Google Scholar] [CrossRef]
  3. Wang, Z.; Liang, F.; Li, C.; Xiong, W.; Chen, Y.; Xie, F. Does China’s low-carbon city pilot policy promote green development? Evidence from the digital industry. J. Innov. Knowl. 2023, 8, 100339. [Google Scholar] [CrossRef]
  4. Song, M.; Zhao, X.; Shang, Y. The impact of low-carbon city construction on ecological efficiency: Empirical evidence from quasi-natural experiments. Resour. Conserv. Recycl. 2020, 157, 104777. [Google Scholar] [CrossRef]
  5. Xu, J.; Cui, J. Low carbon cities and green technology innovation for enterprises. J. Innov. Knowl. 2020, 40, 178–196. [Google Scholar]
  6. Bobba, M.; Gignoux, J. Neighborhood Effects in Integrated Social Policies. World Bank Econ. Rev. 2016, 33, 116–139. [Google Scholar] [CrossRef]
  7. Chen, C.; LeGates, R.; Zhao, M.; Fang, C. The changing rural-urban divide in China’s megacities. Cities 2018, 81, 81–90. [Google Scholar] [CrossRef]
  8. Hu, B.X.; Li, J.; Kuang, B. Evolution Characteristics and Influencing Factors of Urban Land Use Efficiency Difference Under the Concept of Green Development. Econ. Geogr. 2018, 38, 183–189. [Google Scholar] [CrossRef]
  9. Yu, J.; Zhou, K.; Yang, S. Land use efficiency and influencing factors of urban agglomerations in China. Land Use Policy 2019, 88, 104143. [Google Scholar] [CrossRef]
  10. Tan, S.; Hu, B.; Kuang, B.; Zhou, M. Regional differences and dynamic evolution of urban land green use efficiency within the Yangtze River Delta, China. Land Use Policy 2021, 106, 1098924. [Google Scholar] [CrossRef]
  11. Liang, L.T.; Zhao, Q.L.; Chen, C. Analysis on the Characters of Spatial Disparity of Urban Land Use Efficiency and its Optimization in China. China Land Sci. 2013, 27, 48–54. [Google Scholar]
  12. Chung, Y.H.; Färe, R.; Grosskopf, S. Productivity and Undesirable Outputs: A Directional Distance Function Approach. J. Environ. Manag. 1997, 51, 229–240. [Google Scholar] [CrossRef]
  13. Tone, K. A slacks-based measure of efficiency in data envelopment analysis. Eur. J. Oper. Res. 2001, 130, 498–509. [Google Scholar] [CrossRef]
  14. Wang, P.Y.; Lai, X.J. A Study on the Model and Mechanism of Public Policy Diffusion in China. J. Peking Univ. (Philos. Soc. Sci.) 2013, 50, 14–23. [Google Scholar]
  15. Chen, L.; Wang, K. The spatial spillover effect of low-carbon city pilot scheme on green efficiency in China’s cities: Evidence from a quasi-natural experiment. Energy Econ. 2022, 110, 106018. [Google Scholar] [CrossRef]
  16. Deng, R.R.; Zhan, J. Does two low carbon pilot policy promote the performance of carbon emissions reduction in pilot cities-Based on difference in difference method. Syst. Eng. 2017, 35, 68–73. [Google Scholar]
  17. Lu, X.W. Study on the Effectiveness of the Low Carbon Policy-Evidence from the Synthetic Control Methods. Soft Sci. 2017, 31, 98–101+109. [Google Scholar] [CrossRef]
  18. Jiang, X.; Hou, J.; Lu, X.H. Research on the Effects of Low-carbon Pilot Policies on Green Urban Land Use: An Empirical Study Based on the DID Model. China Land Sci. 2023, 37, 80–89. [Google Scholar]
  19. Bian, Z.Q.; Zhong, S.C. Impact of Carbon Emission Trading Pilot Policy on Urban Land Green Use Efficiency. China Land Sci. 2023, 37, 52–62. [Google Scholar] [CrossRef]
  20. Moreno, R.; Paci, R.; Usai, S. Spatial spillovers and innovation activity in European regions. Environ. Plan. 2005, 37, 1793–1812. [Google Scholar] [CrossRef]
  21. Jaffe, A.B.; Trajtenberg, M.; Henderson, R. Geographic localization of knowledge spillovers as evidenced by patent citations. Q. J. Econ. 1993, 108, 577–598. [Google Scholar] [CrossRef]
  22. Greenstone, M.; Hornbeck, R.; Moretti, E. Identifying agglomeration spillovers:evidence from winners and losers of large plant openings. J. Political Econ. 2010, 118, 536–598. [Google Scholar] [CrossRef]
  23. Zheng, H.; Guo, L.H. The External Effects of Low-Carbon City Pilots on Adjacent Non-Pilot Cities’ Carbon Emissions. China Popul. Resour. Environ. 2022, 32, 71–80. [Google Scholar]
  24. Da Cruz, N.F.; Marques, R.C. Revisiting the determinants of local government performance. Omega 2014, 44, 91–103. [Google Scholar] [CrossRef]
  25. Abane, J.A.; Brenya, E. The relationship between organizational environment antecedents and performance management in local government: Evidence from Ghana. Future Bus. J. 2021, 7, 3. [Google Scholar] [CrossRef]
  26. Dai, R.; Cao, J.H. Carbon Emission Regulation, International Industry Transfer, and Pollution Haven Effect: An Empirical Study Based on Panel Data of 45 Developed and Developing Countries. Explor. Econ. Issues 2015, 11, 145–151. [Google Scholar]
  27. Chen, Z.; Kahn, M.E.; Liu, Y.; Wang, Z. The consequences of spatially differentiated water pollution regulation in China. J. Environ. Econ. Manag. 2018, 88, 468–485. [Google Scholar] [CrossRef]
  28. Shen, K.R.; Jin, G.; Fang, X. Does Environmental Regulation Cause Pollution to Transfer Nearby? Econ. Res. J. 2017, 52, 44–59. [Google Scholar]
  29. Xie, R.; Teo, T.S. Green technology innovation, environmental externality, and the cleaner upgrading of industrial structure in China—Considering the moderating effect of environmental regulation. Technol. Forecast. Soc. Chang. 2022, 184, 122020. [Google Scholar] [CrossRef]
  30. National Development and Reform Commission. Notice on Carrying Out the Pilot Work of Low-Carbon Provinces and Cities” (Development and Reform Commission Climate [2010] No. 1587). Available online: https://www.ndrc.gov.cn/xxgk/zcfb/tz/201008/t20100810_964674.html (accessed on 15 April 2024).
  31. “Notice on Carrying Out the Second Batch of Pilot Work for Low-Carbon Provinces and Cities” (Development and Reform Commission Climate [2012] No. 3760). Available online: https://www.ccchina.org.cn/Detail.aspx?newsId=73289&TId=285 (accessed on 15 April 2024).
  32. “Notice on Carrying Out the Third Batch of National Low-Carbon City Pilot Work” (Development and Reform Commission Climate [2017] No. 66). Available online: https://www.gov.cn/xinwen/2017-01/24/content_5162933.htm (accessed on 15 April 2024).
  33. Wang, X.; Ma, Z.; Chen, J.; Dong, J. Can Regional Eco-Efficiency Forecast the Changes in Local Public Health: Evidence Based on Statistical Learning in China. Int. J. Environ. Res. Public Health 2023, 20, 1381. [Google Scholar] [CrossRef]
  34. Zeng, X.; Ma, Y.; Ren, J.; He, B. Analysis of the Green Development Effects of High-Speed Railways Based on Eco-Efficiency: Evidence from Multisource Remote Sensing and Statistical Data of Urban Agglomerations in the Middle Reaches of the Yangtze River, China. Int. J. Environ. Res. Public Health 2022, 19, 16431. [Google Scholar] [CrossRef] [PubMed]
  35. Darrin, W.; Rosalia, P. Sustainable local economic development indicator framework: A tool for property building redevelopment projects. Community Dev. 2020, 51, 609–627. [Google Scholar] [CrossRef]
  36. Song, H.; Sun, Y.J.; Chen, D.K. Assessment for the Effect of Government Air Pollution Control Policy: Empirical Evidence from “Low-carbon City” Construction in China. J. Manag. World 2019, 35, 95–108+195. [Google Scholar]
  37. Xu, J.; Cu, J.B. Low-Carbon Cities and Firms’ Green Technological Innovation. China Ind. Econ. 2020, 12, 178–196. [Google Scholar]
Figure 1. Spatial distribution of three batches of low-carbon pilot areas in China.
Buildings 14 01163 g001
Figure 2. Distribution map of the study area.
Buildings 14 01163 g002
Figure 3. Temporal evolution of land green use efficiency: a kernel density estimation approach.
Buildings 14 01163 g003
Figure 4. Spatial distribution of urban land green use efficiency.
Buildings 14 01163 g004
Figure 5. (a) Parallel trend test (192); (b) Parallel trend test (192).
Buildings 14 01163 g005
Table 1. Input–output indicator system.
Indicator CategoryIndexUnit
InputTotal investment in fixed assets per capitaUSD 1538.46
Number of employees in the secondary and tertiary industries per capita10,000 people
Area of construction landKm2
OutputGDP of secondary and tertiary industries in the regionUSD 1538.46
Green coverage rate of built-up areas%
Undesired outputsIndustrial sulfur dioxide emissionston
Industrial sewage dischargeton
Industrial dust emissionston
Table 2. Variance inflation factor.
VariableVIF1/VIF
did1.100.905426
urei4.780.209336
urb3.550.282057
itd3.080.324482
idl2.830.353695
isu1.480.677100
tra1.330.749996
MeanVIF2.59
Table 3. Benchmark regression results.
Variable(1)(2)(3)(4)
did0.051 ***0.046 ***0.049 **0.048 ***
(2.94)(2.71)(3.20)(3.22)
urb −0.053 −0.079 **
(−1.46) (−2.50)
tra 0.054 *** 0.040 ***
(4.99) (4.43)
idl −0.050 *** −0.025 **
(−3.93) (−2.27)
itd 0.067 *** 0.034 ***
(4.18) (2.74)
urei −0.121 *** −0.128 ***
(−9.36) (−11.07)
isu 0.158 *** 0.161 ***
(2.59) (3.04)
Constant−0.545 ***0.507−0.534 ***0.429
(−28.75)(1.09)(−33.32)(1.04)
Control variablesNoYesNoYes
Time fixedYesYesYesYes
Individual fixedYesYesYesYes
Observations 3072307241124112
Number of cities192192257257
Standard errors in brackets, *** p < 0.01, ** p < 0.05 and the same below.
Table 4. Robustness test results.
Variable(1)(2)(3)(4)(5)(6)
did0.0446 ***0.0397 **0.0374 **0.0446 ***0.0604 ***0.032 *
(0.0166)(0.0160)(0.0155)(0.0166)(0.0168)(0.018)
Constant0.447−0.288−0.5720.447−47.31 ***0.773 *
(0.461)(0.458)(0.463)(0.461)(5.181)(0.469)
Control variablesYesYesYesYesYesYes
Time fixedYesYesYesYesNoYes
Individual fixedYesYesYesYesYesYes
Time trendNoNoNoYesYesNo
Observations 307230723072307230723072
Number of cities192192192192192183
*** p < 0.01, ** p < 0.05, * p < 0.1.
Table 5. Endogeneity test results.
VariableSample Size 1 (192)Sample Size 2 (257)
(1)(2)(3)(4)
did0.0565 ***0.106 ***0.0449 ***0.0982 ***
(0.0174)(0.0156)(0.0153)(0.0142)
Constant−0.544 ***−1.008 ***−0.543 ***−1.294 ***
(0.0191)(0.333)(0.0161)(0.289)
Time fixedYesYesYesYes
Individual fixedYesYesYesYes
Control variablesNOYesNOYes
Observations 3036303640484048
Number of cities191191256256
*** p < 0.01.
Table 6. Regional heterogeneity.
VariableSample Size 1 (192)Sample Size 2 (257)
Eastern Region
(1)
Non-Eastern Region
(2)
Eastern Region
(3)
Non-Eastern Region
(4)
did0.0439 *−0.0220.0516 **−0.00764
(0.0266)(0.023)(0.0225)(0.0193)
Constant3.351 ***−1.130 *3.861 ***−1.831 ***
(0.708)(0.620)(0.602)(0.557)
Control variablesYesYesYesYes
Time fixedYesYesYesYes
Individual fixedYesYesYesYes
Observations1248182417442368
Number of cities78114109148
*** p < 0.01, ** p < 0.05, * p < 0.1.
Table 7. Heterogeneity of urban resource endowment.
VariableSample Size 1 (192)Sample Size 2 (257)
Resource-Based Cities
(1)
Non-Resource-Based Cities
(2)
Resource-Based Cities
(3)
Non-Resource-Based Cities
(4)
did−0.02710.0993 ***−0.02480.0833 ***
(0.0245)(0.0235)(0.0234)(0.0197)
Constant−0.622 ***−0.487 ***−0.639 ***−0.470 ***
(0.0269)(0.0257)(0.0254)(0.0201)
Control variablesYesYesYesYes
Time fixedYesYesYesYes
Individual fixedYesYesYesYes
Observations1312176015522560
Number of cities8211097160
*** p < 0.01.
Table 8. Heterogeneity of urban environmental protection strength.
VariableSample Size 1 (192)Sample Size 2 (257)
Key Environmental Protection CitiesNon-Key Cities on Environmental ProtectionKey Environmental Protection CitiesNon-Key Cities on Environmental Protection
(1)(2)(3)(4)
did0.120 ***0.01820.113 ***0.00637
(0.0330)(0.0202)(0.0257)(0.0190)
Constant−0.476 ***−0.578 ***−0.444 ***−0.595 ***
(0.0360)(0.0221)(0.0255)(0.0205)
Control variablesYesYesYesYes
Time fixedYesYesYesYes
Individual fixedYesYesYesYes
Observations992208016642448
Number of cities62130104153
*** p < 0.01.
Disclaimer/Publisher’s Note: The statements, opinions and data contained in all publications are solely those of the individual author(s) and contributor(s) and not of MDPI and/or the editor(s). MDPI and/or the editor(s) disclaim responsibility for any injury to people or property resulting from any ideas, methods, instructions or products referred to in the content.

